a method to compare and quantify threat to - ircobi · ncap rated car, and named profile 1), and...
TRANSCRIPT

Abstract Crash report‐based studies indicate Vulnerable Road Users (VRUs) to still be at risk of severe injury
/fatality on our roads. These studies also indicate frontal crashes to be the most frequently occurring crashes.
This work proposes a method to quantify the “threat” from a vehicle front shape to a pedestrian. Injury indices
were computed using impact simulations of finite element models of car profiles against multi‐body pedestrian
models at a speed of 40km per hour. 3 adult pedestrian models (95th %le and 50th %le Male, 5th %le Female) and
one 6 year old child model were considered in crash scenario simulations. Five injury indices, namely, HIC
(15ms) for head injury, Viscous Criterion (VC) and resultant peak linear accelerations for chest, peak forces in
femur and tibia for lower extremity were recorded from these simulations. An “Injury Cost” (IC) measure was
then calculated by mapping injury indices to Abbreviated Injury Scale‐based scores and then mapping them to
cost implications. MAIS and ISS have also been discussed for comparison of threat. Ford Taurus (a pre‐ Euro‐
NCAP rated car, and named Profile 1), and Toyota Yaris (a post‐ Euro‐NCAP rated car with 21 points, and named
Profile 2) profiles were evaluated using the proposed IC measure. Equi‐weighted IC showed Profile 2 to be safer
than Profile 1 but specific population‐based weighted IC indicated Profile 1 to be relatively safer.
Keywords Injury Cost Scale, injury threat to pedestrian population, vehicle front‐end design
I. INTRODUCTION
Since pedestrians have the lowest level of protection amongst Vulnerable Road Users (VRUs), they are
known to have a higher injury and fatality risk from automobiles than motorcyclists and cyclists [1]. Vehicle
crash trends in India show pedestrian fatalities to be substantially more than that in higher income countries
[2]. Globally approximately 22% of the road crashes involve pedestrians [3]. With these crash trends, it becomes
important to design a vehicle for protection of pedestrians.
Studies on the regions of a passenger car interacting with a pedestrian during a pedestrian‐automobile crash
have shown the bumper, bonnet, windscreen and the cowl region to be prominent contact points affecting the
kinematics of the struck pedestrian. The kinematics can be correlated to the different injuries sustained [4].
Through input of contact stiffness data, phenomenon like enhanced injury risk to the head from contact with
“A” pillars and the windscreen lower region can be captured. Analysis of threat from car profiles has shown that
passenger cars (sedan) pose a lesser threat than a SUV or light truck profile [5‐6].
Consumer ratings such as Euro‐NCAP [7] perform impacts with separate body forms against the vehicle front
at different locations to assess potential passive pedestrian safety and provide a discrete ”star” rating. A
reduction in severity of pedestrian crashes and reduction in fatality was reported to show a correlation between
Euro‐NCAP pedestrian compliance and increased pedestrian safety [8]. The body forms used in these tests
represent a statistically significant measure in properties of individual body components. The head form impact
tests are designed to consider impact points based on wrap‐around distance (WAD) corresponding to adult and
child populations.
Crash reconstruction studies use multi‐body pedestrian models to estimate the pre‐impact configuration and
kinematics that best correlate with the known impact locations. Rigid body modelling technique is seen to be
sufficient for replicating the kinematics in a crash and can be used for estimating some of the injury indices.
A vehicle‐front designer can predict the kinematics of a pedestrian in a vehicle crash, given the vehicle
H. Subramanian is a PhD student in Mechanical Engineering at Indian Institute of Technology in Delhi, India (phone: 011‐26596215, e‐mail: [email protected]). S. Mukherjee and A. Chawla are Professors in the Department of Mechanical Engineering at Indian Institute of Technology in Delhi, India, D. Göhlich is professor in Department of Product Development Methods and Mechatronics, Technische Universität, Berlin
A Method to Compare and Quantify Threat to Pedestrian Using Injury Cost Measure
Hariharan Sankarasubramanian, Sudipto Mukherjee, Anoop Chawla, Dietmar Göhlich
IRC-13-106 IRCOBI Conference 2013
- 896 -

profile. It would be ideal if one could define a criterion to evaluate the vehicle profile for a particular pedestrian
and then use it to assess the suitability of a profile to a known statistical pedestrian population. In this work, an
attempt is made to develop a methodology to provide such a measure.
The objective of this study is to develop a way to quantify the suitability of a vehicle profile to a known
pedestrian population through evaluations using single pedestrian impacts. Demonstration through comparison
of potential threat from two different vehicle profiles is targeted.
II. METHODS
Measurement of threat to pedestrian
Threat to a pedestrian is computed from correlations of potential injury or fatality risk obtained from the
injury criteria of the different body parts. These injury criteria are typically based on linear accelerations,
velocities, penetrations or peak resultant forces. For instance, fracture risk for bones is measured using bending
and compressive forces, moments or a combination of both; injuries to soft tissues and ligaments under blunt
impact can be measured by the strain produced.
The specific injury indices used for measurement of threat for a particular body region/organ are constantly
updated. The Abbreviated Injury Scale (AIS), developed by the Association for the Advancement of Automotive
Medicine (AAAM), is a scale formulated for standardization of injury severity measurement [9]. Injury risk
curves for different injury indices have been developed to predict the likelihood of specific AIS level injuries for
the respective index. Payne and Patel [10] give a detailed coverage of the indices and the injury risk curves for
the same. The injury risk curve is discussed further in subsequent sections.
For scenarios involving multiple injuries to a particular body region, the Maximum AIS (MAIS), identifying the
highest AIS value amongst multiple injuries in a particular body region, was proposed. The Injury Severity Score
(ISS) measure for poly‐trauma represents a squared addition of the highest MAIS values in three ISS body
regions. ISS remains the only scale used in medical emergency management in hospitals which has a linear
correlation with morbidity, mortality and expected hospital stay after trauma of a patient [11] . As a limit, ISS >
17 was proposed in [12] to classify injury as poly‐trauma or syndrome of combined injuries. Since both these
measures are derived from the AIS, using the same processing methodology, MAIS and ISS from potential AIS
would be obtained to present a similar scale of injury severity estimation as a result of a vehicle crash
simulation.
Previous studies on Injury Cost
The cost implication of injuries to humans has been estimated [13] in four categories; namely, hospital cost
as direct restorative cost, nonmedical cost as indirect restorative cost, loss of resources as morbidity cost and a
cost for fatality as Mortality Cost. The Injury Cost Scale (ICS) and ICS Lethal (ICSL) were proposed to provide a
direct implication of severity of injury to a human from automotive crashes. A potential problem with ICS using
an example of facial laceration and plastic surgery was explained and it was recommended that ICS/ICSL be
used as a supplementary tool with AIS.
A study by [14] estimated costs based on medical, police and fire services, household work, wage work,
insurance administration, legal/court, property damage and quality of life. The cost estimations were based on
AIS 90 coding or MAIS values of injuries. The compiled cost validations were not complete for considering data
as direct cost implications.
(Potential) Injury Cost (PIC)
For the purpose of assessing threat to pedestrians from a particular car profile, a methodology for
calculating potential injury cost from simulations was proposed by the authors [15]. This potential Injury Cost
(IC) was used as a representative unitary measure of threat to a pedestrian. The process for IC calculation is
summarized in Figure 1. This measure was used to optimize vehicle profiles using computer simulations.
IRC-13-106 IRCOBI Conference 2013
- 897 -

In estimating the injury cost, potential risk to the well‐being of a pedestrian in terms of health and threat to
life are estimated using injury indices mapped to their estimated Abbreviated Injury Scale (AIS) values. The
injury indicator to head is estimated using the Head Injury Criterion (HIC), neck using Nij, Thorax using the
viscous criterion (VC) measure and chest acceleration (3ms) at sternum, lower extremities using Femur Force
Criterion (FFC) and tibia index (TI). The injury indices were correlated to the AIS using limits of Table 13 in [10]
for HIC, VC limits from [16], chest acceleration limits from [17], Nij limits from [18] and lower extremities limits
from Table 38 in [10].
The potential AIS values were mapped to the potential injury cost based on hospital and ancillary costs data
reported in part 5 of ISO:13232 [19]. The cost increases with severity of AIS and a very high cost is assigned for
AIS 6 (Non‐survivable). There are higher cost implications for a potential impairment. The costs were used as a
“representative” measure and do not imply a potential absolute cost figure for the threat to a particular
pedestrian model during a simulated crash scenario.
Comparison of IC and Euro‐NCAP measures
The Euro‐NCAP pedestrian safety rating is based on assessing threat from impacts on different points of the
vehicle front based on the wrap‐around distance (WAD). A variation of WAD is used to address the safety to the
pedestrian population as well as variations in crash scenarios. In Euro‐NCAP, injury indices are compared to a
target specification for “pass” or “not pass”. A weighted sum of the “pass”es determines the star ratings of the
vehicle profile. The transition from pass to not‐passed, being discreet, makes it difficult to operate through
gradient‐based optimizers, though it is well suited as a legislative and social tool. The proposed Chinese NCAP
[20] assigns points based on a linear interpolation between the injury index limits and so is continuous. The
limits used in both NCAP measures are based on injury risk curves.
For computing the IC, the injury measures are converted to potential AIS measures using the injury risk
curves. The potential AIS obtained is then compared with the likely treatment/rehabilitation costs obtained
from [19]. An assumption in the IC‐based measure is that a “severe injury” to a pedestrian implies a higher
financial liability. The IC‐based measure is hence a direct method to assess the financial implication of a specific
pedestrian crash scenario.
Euro‐NCAP pedestrian head tests over a range of WAD potentially cover the range of head impacts with a
targeted range of population height and other factors. Simulations provide an advantage over experiments in
that multiple scaled models of pedestrians can be simulated so as to enable understanding about a population
of pedestrians. It is expected that in the future virtual human models will be available and more specific
population crash scenarios can be simulated to measure threat to a population.
Vehicle Model
Two detailed Finite Element (FE) models of passenger cars, Ford TAURUS‐v3 (Profile 1) for representing a
typical sedan and Toyota YARIS ‐v1 (Profile 2) for representing a subcompact car, were used for the study. As
shown in Table I these models have similar levels of complexity in terms of number of parts and elements. Both
these models have been validated against experimental results for US regulatory frontal crash tests [21‐22].
The accurate geometrical representation of the car outer profile and locations of prominent under‐bonnet
components like engine, radiator and battery are considered important for this study. References [21] and [22]
report that both the models were generated using reverse Engineering data of vehicles procured; hence it is
assumed that both are close representations of the actual locations of significant points in a real car.
Profile 1 does not have a Euro‐NCAP pedestrian rating. Profile 2 has a Euro‐NCAP pedestrian score of 21
points (60%) in the year 2011 corresponding to a 5‐star rating.
Figure 1. Injury Cost calculation from [13]
IRC-13-106 IRCOBI Conference 2013
- 898 -

TABLE I
Details of FE models from NCAC reports
Profile 1
No. of Parts 778
No. of Elements
805505
No. of shells 1057113 Profile 2
No. of Parts 771
No. of Elements
974383
No. of shells 950560
Pedestrian Model
Four anthropometric pedestrian ellipsoid multi‐body models from [18] representing the 95th%ile Male (95M), 50th%ile Male (50M), 5th%ile Female (5F) and 6 year old child (6C) shown in Figure 2 were used. These multi‐body models have been validated by TNO for kinematic prediction against Post Mortem Human Surrogate (PMHS) tests [23]. MADYMO models have also been used for crash reconstruction studies exhibiting capability to predict injury indices based on crash dynamics [24‐25].
Simulation Scenario
A lateral collision of a pedestrian with the vehicle front was simulated with a pedestrian model positioned in
front of the vehicle model as shown in Figure 3. The pedestrian legs were positioned with an angle of 0.4 radian
between the legs to represent a walking position. The pedestrian model was allowed to fall under gravity to
load the legs before impacting with the vehicle. A scenario of the crash is depicted in a simplified way in Figure
3 in both front and top view.
Figure 2. MADYMOTM multi‐body models from TNO [18]
Figure 3. Simplified scenario of pedestrian‐vehicle crash
Top view Front view
0.4 radian
CAR
IRC-13-106 IRCOBI Conference 2013
- 899 -

It is known that an impact speed of around 40+ km per hour (kmph) is likely the upper limit for pedestrian
safety relative to head injury, throw distance and head contact time [26]. For simulations, vehicle speed was 40
kmph (11.1 m/s) and braking was not modelled. Contacts were defined between vehicle front surfaces, under‐
bonnet components like engine, radiator, suspension housing, battery and bumper. In the simulation, tracking
was limited to the primary contact with the car.
The rigid‐FE coupled simulation results in force transfer from the FE solver to MADYMOTM solver which is
applied to the rigid bodies. MADYMOTM output files record estimates on the injuries to the pedestrian in the
form of injury indices processed from kinematic parameters as well as force parameters, and LS‐DYNATM output
files relate to the damage to the car.
Methodology to address a Pedestrian Population
Existing estimates of threat posed by a car front is based on the perceived threat to a particular
anthropometric size of the pedestrian model. We go on to show through simulations that threat perceptions
are not uniformly graded with change in the anthropometry across car front profiles. Hence, threat estimates
for a pedestrian population as opposed to a specific anthropometry become relevant. Design of a profile that is
optimal for a whole pedestrian population must necessarily consider a weighted measure that is biased towards
safety of more frequently occurring configurations. With the best known knowledge of distribution of
pedestrian crash impact (CI) configurations, a threat perception can be estimated for the population, knowing
the CI of the individual configurations.
Figure 4 outlines the methodology adopted for this work. A clustering of pedestrian crash cases based on
height and weight distribution of the crash population is performed. The IC calculated for each cluster is
weighted linearly with the cardinality of each cluster in a geographical region.
Pedestrian crash data from the Department of Transportation, Michigan, USA were considered for this study.
Table II has been constructed from bar charts in the report [27]. The data as shown in Table II were interpolated linearly between the intervals to operate on similar data ranges as with the data range available from US census on population height and weight. The gender distribution of the data shown in Table II was 64% for males and 36% for females [27]. This ratio is assumed to carry across within each range when correlating with census data.
Figure 4. Methodology for calculation of weighting ratio for IC
IRC-13-106 IRCOBI Conference 2013
- 900 -
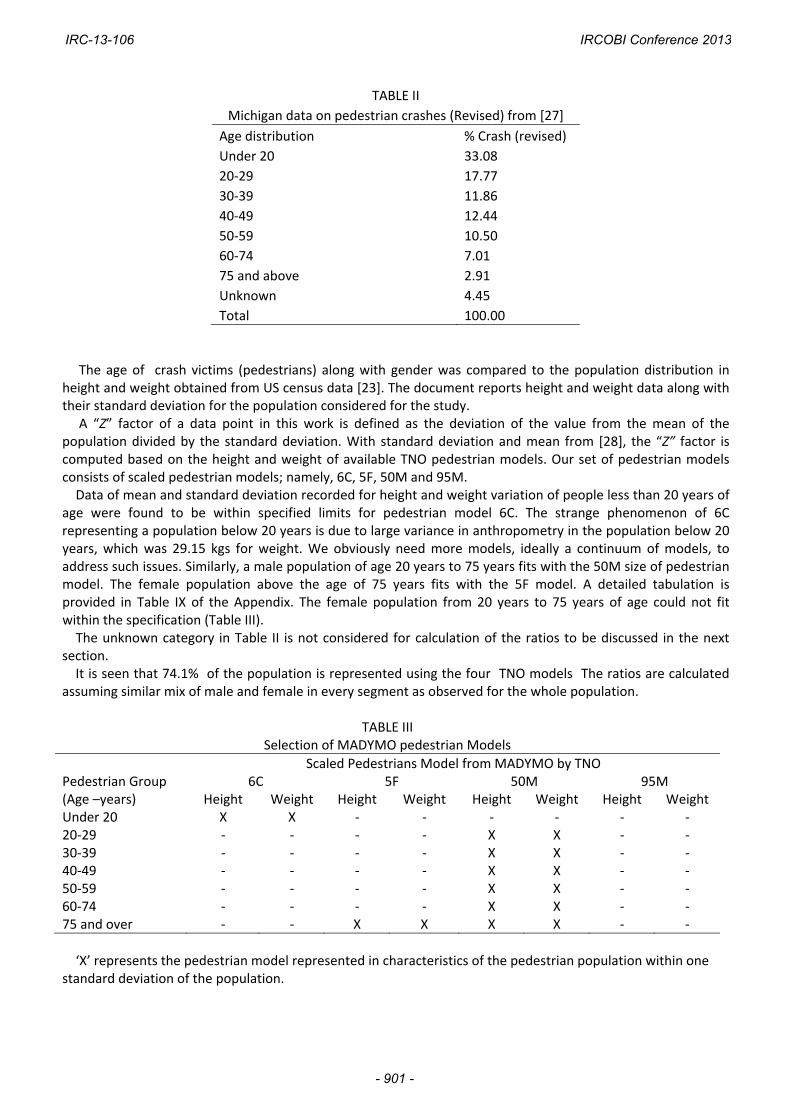
TABLE II
Michigan data on pedestrian crashes (Revised) from [27]
Age distribution % Crash (revised)
Under 20 33.08
20‐29 17.77
30‐39 11.86
40‐49 12.44
50‐59 10.50
60‐74 7.01
75 and above 2.91
Unknown 4.45
Total 100.00
The age of crash victims (pedestrians) along with gender was compared to the population distribution in
height and weight obtained from US census data [23]. The document reports height and weight data along with their standard deviation for the population considered for the study. A “Z” factor of a data point in this work is defined as the deviation of the value from the mean of the
population divided by the standard deviation. With standard deviation and mean from [28], the “Z” factor is computed based on the height and weight of available TNO pedestrian models. Our set of pedestrian models consists of scaled pedestrian models; namely, 6C, 5F, 50M and 95M. Data of mean and standard deviation recorded for height and weight variation of people less than 20 years of
age were found to be within specified limits for pedestrian model 6C. The strange phenomenon of 6C representing a population below 20 years is due to large variance in anthropometry in the population below 20 years, which was 29.15 kgs for weight. We obviously need more models, ideally a continuum of models, to address such issues. Similarly, a male population of age 20 years to 75 years fits with the 50M size of pedestrian model. The female population above the age of 75 years fits with the 5F model. A detailed tabulation is provided in Table IX of the Appendix. The female population from 20 years to 75 years of age could not fit within the specification (Table III). The unknown category in Table II is not considered for calculation of the ratios to be discussed in the next
section. It is seen that 74.1% of the population is represented using the four TNO models The ratios are calculated
assuming similar mix of male and female in every segment as observed for the whole population.
TABLE III Selection of MADYMO pedestrian Models
Pedestrian Group (Age –years)
Scaled Pedestrians Model from MADYMO by TNO 6C 5F 50M 95M
Height Weight Height Weight Height Weight Height Weight Under 20 X X ‐ ‐ ‐ ‐ ‐ ‐ 20‐29 ‐ ‐ ‐ ‐ X X ‐ ‐ 30‐39 ‐ ‐ ‐ ‐ X X ‐ ‐ 40‐49 ‐ ‐ ‐ ‐ X X ‐ ‐ 50‐59 ‐ ‐ ‐ ‐ X X ‐ ‐ 60‐74 ‐ ‐ ‐ ‐ X X ‐ ‐ 75 and over ‐ ‐ X X X X ‐ ‐
‘X’ represents the pedestrian model represented in characteristics of the pedestrian population within one
standard deviation of the population.
IRC-13-106 IRCOBI Conference 2013
- 901 -
Weighted IC
The weighting ratios are calculated to reflect specific distributions of the models within a mix of a population of pedestrians in calculating the IC measure. We define Total potential IC for a population = x1 * IC 6C + x2 * IC 5F + x3 * IC 50M + x4 * IC95M Where, x1 = weighting factor for IC calculated from 6C x2 = weighting factor for IC calculated from 5F x3 = weighting factor for IC calculated from 50M x4 = weighting factor for IC calculated from 95M
A general case giving equal importance to all sizes of pedestrians is as follows,
Equi‐weight IC (EIC) = 0.25 * IC 6C + 0.25 * IC 5F + 0.25* IC 50M + 0.25 * IC95M
The processing of the data in Table III using a point measure to obtain a set of ratios for a particular pedestrian model resulted in the weighted IC measure. Every successful “fit” within one standard deviation for both height and weight results in one point for a particular pedestrian model. Analysis of the data and “fit” with all the considered pedestrian models from TNO resulted in a match of 7 points a total of 16 points (maximum possible) (from Table VIII in Appendix). From Table II, the percentage of population is split using ratios of 64:36 for Male:Female since specific data
are not available. Such a calculation yields Table XI and it is processed as explained in the Appendix to obtain
Weighted IC for a population (WIC) = 0.45 * IC 6C + 0.08 * IC 5F + 0.47* IC 50M + 0.0 * IC95M
III. RESULTS
Coupled LS‐DYNA / MADYMO ‐ Overall kinematics
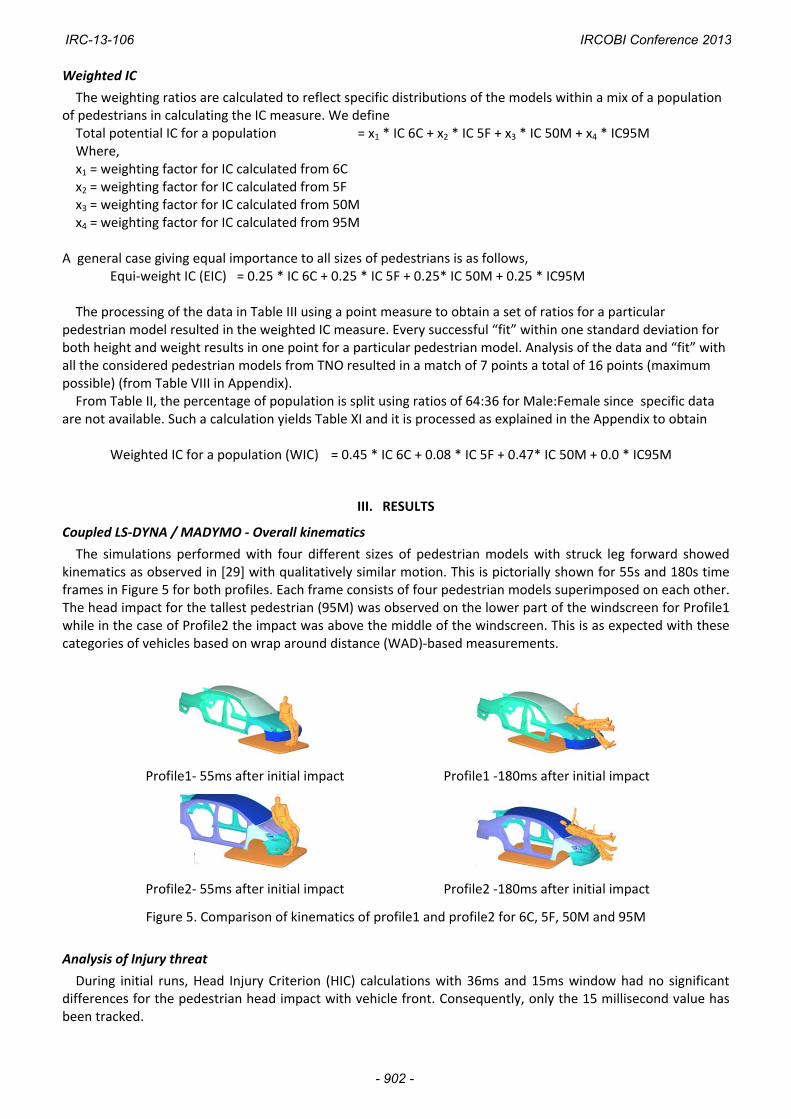
The simulations performed with four different sizes of pedestrian models with struck leg forward showed kinematics as observed in [29] with qualitatively similar motion. This is pictorially shown for 55s and 180s time frames in Figure 5 for both profiles. Each frame consists of four pedestrian models superimposed on each other. The head impact for the tallest pedestrian (95M) was observed on the lower part of the windscreen for Profile1 while in the case of Profile2 the impact was above the middle of the windscreen. This is as expected with these categories of vehicles based on wrap around distance (WAD)‐based measurements.
Profile1‐ 55ms after initial impact Profile1 ‐180ms after initial impact
Profile2‐ 55ms after initial impact Profile2 ‐180ms after initial impact
Figure 5. Comparison of kinematics of profile1 and profile2 for 6C, 5F, 50M and 95M
Analysis of Injury threat
During initial runs, Head Injury Criterion (HIC) calculations with 36ms and 15ms window had no significant differences for the pedestrian head impact with vehicle front. Consequently, only the 15 millisecond value has been tracked.
IRC-13-106 IRCOBI Conference 2013
- 902 -

Head impacts observed in Profile2 indicated a higher threat for 50M, primarily due to the impact location being in a region at the edge of the bonnet corresponding to the cowl region which in our nomenclature was the structural member called “engine top shield”. A HIC of 1246 (highest) was observed in this scenario. The other taller models had a head impact following a shoulder impact, thereby reducing the impact threat to a HIC value of 805. The shorter models scored relatively well for head impacts. In the case of Profile1, threat to head by primary impact was higher for the child model and less overall for the adult models. The HIC values for 6C showed the highest value of 952 corresponding to a direct impact of the child’s head with the stiff structural member at the bonnet edge. By working with a population, using the IC as a measure, singularities such as the 50M hitting the “engine top shield” do not unduly bias a design. Threat to the chest is conventionally represented in units of ‘g’s for the peak chest acceleration measured at
the sternum and Viscous Criterion (VC). Since both these measures scaled the same way for the crashes considered, the VC measure has been omitted in the analysis. Chest acceleration measured at the sternum is separately included in the IC calculation as it can also increase understanding of the threat during a crash scenario. The acceleration was found to be higher for 5F and 95M for the Profile2 FE model, resulting from direct
contact, and was above the threshold of 80g. The chest accelerations for the Profile1 FE model was above the threshold for 5F, but the rest of the population did not show substantial threats. The high acceleration recorded can be attributed to contact with stiffer structural members under the bonnet as mentioned in the case of head impacts. Threat to the lower extremity was measured as peak force on the tibia and femur, on the way to failure.
Evaluation of this as a measure is however somewhat limited by the capability of the pedestrian model considered. Some injury indices for comparing threat to lower extremity, head and chest are compiled in Table IV and
Table V. Comparing the threat to the lower extremity, the peak force observed at the femur and tibia of the tallest pedestrian (95M) was highest for the Profile2 FE model.
TABLE IV
INJURY MEASURED OBSERVED WITH PROFILE2
Pedestrian Model Femur peak force
(kN) Tibia peak force
(kN) HIC _ 15ms Chest acceleration
(g)
6C 5.7 2.6 307 32
5F 4.5 3.2 490 137
50M 7.0 4.9 1246 27
95M 9.6 5.2 805 210
TABLE V
INJURY MEASURED OBSERVED WITH PROFILE1
Pedestrian Model Femur peak force
(kN) Tibia peak force
(kN) HIC _ 15ms Chest acceleration (g)
6C 7 4.5 952 48
5F 4.2 2.7 578 75
50M 8.5 5.6 474 30
95M 9.3 4.6 538 32
ISS and MAIS
From the injury indices of the simulations, a potential AIS level for the injuries sustained was obtained as expressed in Table IX and Table X. With these AIS levels as input, MAIS and potential ISS were calculated for comparing the threat levels to a pedestrian from the vehicle profile. The ISS value was calculated with available AIS values and not strictly with the codes of AIS primarily due to the limitations in models chosen for simulation. The values in Table VI show that MAIS and ISS levels are the same for all adult pedestrian models. In both
profiles, taller pedestrians tend to have higher threat as shown in 95M and 50M ISS values. The 5F model has least perceived threat from both profiles. The 6C model has a significant difference in threat from the two profiles. ISS of 14 from profile 1 is significantly higher than 6 from Profile 2.
IRC-13-106 IRCOBI Conference 2013
- 903 -

TABLE VI
COMPARISON OF MAIS AND ISS
95M 50M 5F 6C
MAIS ISS MAIS ISS MAIS ISS MAIS ISS
Profile2 4 21 3 14 2 6 2 6
Profile1 4 21 3 14 2 6 3 14
Injury cost calculations
Injury cost has been calculated from the injury measures tabulated in the Appendix as Table IX and X. IC variation showed that Profile2 posed maximum threat to a 50M pedestrian while Profile1 posed maximum threat to a child. With an assumption that every cluster was equally important, a population IC can be calculated using a
weight of 1 for all pedestrian sizes. EIC was 217664 USD for Profile2 and 218404 USD for Profile1. The threat level by Profile1 was slightly higher than Profile2. WIC calculation with ratios for a pedestrian population using the Michigan crash distribution shows the value to be 226190 USD for Profile2 and 203895 USD for Profile 1. This shows a trend not in line with EIC, as shown in Table VII.
TABLE VII
COMPARISON OF TOTAL IC WITH WEIGHTED IC (USD)
IC 95M IC 50M IC 5F IC 6C Weighted IC (WIC) Equi‐weighted IC (EIC)
Profile2 209357 256720 195222 209357 226190 217664
Profile1 209357 198180 209357 256720 203895 218404
IV. DISCUSSION
Observations from Injury Measures
A child model 6C showed higher threat from Profile1 compared to Profile2. A taller pedestrian model, the 50M on the other hand, had a high HIC value in Profile1 whose magnitude is the highest observed among all crash scenarios simulated. The 5F model of pedestrian had a potentially higher threat to the chest region from both profiles. The two profiles clearly seem to be potentially more threatening to taller as well as shorter (6C) pedestrian models than those of intermediate height. Injury measures can be correlated to threat of a pedestrian using injury risk curves indicating probability of a particular AIS level of injury. In our study, the implication of injury measures on pedestrian safety is measured using the potential AIS values. Both profiles show varying levels of threat to adults based on height differences. More significantly shorter height of the bonnet leading edge resulted in severe head injury for 6C for Profile 1. A relatively shorter bonnet resulted in severe head injury for 50M in profile 2. This phenomenon suggests that a longer bonnet profile need not always be perceived as safer than a shorter bonnet profile. The rest of the injury measures in isolation also do not convincingly indicate a safer vehicle profile.
MAIS/ ISS measure
Comparison of the MAIS or ISS values does not indicate any difference between pedestrian population
category 95M, 50M and 5F. But, in case of 6C, the MAIS and ISS indicate a clear difference of Profile1 causing a
higher threat than Profile1.
ISS above 17 was regarded as potential poly‐trauma. Using this measure, the 95M would result in serious
complex injuries for both profiles.
ISS provides information on potential morbidity, mortality and hospital stay related to the injured
pedestrian. However, more information is needed than what can be gleaned from such injury measures. In
most crashes resulting in severe injuries to pedestrians, the length of hospital stay, for example, is not always
indicative of the severity of an injury resulting in long‐term disability.
IRC-13-106 IRCOBI Conference 2013
- 904 -

IC measure
An IC measure provides an indication of the hospitalization cost similar to the ISS, but it also provides
information on ancillary costs for injuries resulting in long‐term impairment or disability, thus underscoring the
potential threat to a future normal life of an injured pedestrian.
For estimating threat to a population, the EIC which gives equal weighting to all pedestrian models, indicated
Profile1 to be marginally better than Profile2.
WIC indicated Profile1 to be safer than Profile2 for a specific population. It is also noted that Profile2 has a
Euro‐NCAP pedestrian score of 5 stars whereas Profile1 does not have a published Euro‐NCAP pedestrian test
result. The car with Profile1 is from a period before the Profile2 car, when the design effort was not focused on
high pedestrian ratings.
Noted also is the fact that the minimum value of IC observed in WIC for Profile1 was less than the IC for
Profile2 in the EIC calculation (both EIC and WIC represent normalized weighting factors applied). WIC was able
to clearly differentiate the two profiles in terms of cost.
Limitations
The existing pedestrian model is restricted in prediction of soft tissue failures; hence the calculation of a cost
measure in this region was not performed. Similarly, injury associated with soft tissue damage, joint dislocations
and stress‐related are not computed due to restrictions in modelling. Two car models used in this study were
considered only for illustration and do not limit the application of the same methodology across a variety of
cars/motor vehicles. The two Finite Element models of the cars chosen have not been validated for pedestrian
safety‐related tests.
The present work demonstrates a methodology to compare threat to a pedestrian using a variation in
population, two vehicle types and only one crash configuration. The variation in crash scenarios has not been
addressed in this work. Using a population of crash scenarios and vehicles of the kind available in [1] is a logical
extension and needs to be taken up using a consistent database.
The costs calculation in this process has been based on converting injury measures to AIS and then back
again. This method was preferred to address the variations of injury and associated cost, but it has limitations in
terms of sensitivity. Other scales to convert observed trauma into cost such as ICS and ICSL have not been
attempted due to limitation in estimating them from the pedestrian model considered. These can also be
considered as supplementary measures with more detailed FE Human Body Models.
V. CONCLUSIONS
The MAIS/ISS measures present potential injury severity to a pedestrian but an IC‐based measure was able
to provide more direct information on vehicle threat to a pedestrian in terms of potential cost implications. A
cost scale with higher cost indicating severe threat to a population was proposed as WIC/EIC. All the above
mentioned secondary measures were computed from AIS values obtained from computer simulations. The
procedure adopted for IC calculation had similarity to the methodology used in the Euro‐NCAP rating system for
the initial injury measure, but it provides better insights into implications of a crash with a pedestrian.
The injury indices considered in this study were not exhaustive. The limitations of the chosen pedestrian
model stipulated the limit to the injury measures chosen. To represent threat to pedestrians using better injury
indices, a better validated pedestrian human body FE model would provide a more accurate starting point.
Within the constraints of simulations and limited accuracy in pedestrian modelling, the WIC measure was
able to provide better information of the threat to a pedestrian from a vehicle profile, taking into account
specific population distributions. In our study, Profile2 can be concluded to be of a lesser threat to a pedestrian
population than profile1.
VI. ACKNOWLEDGEMENT
We would wish to thank DAAD for providing a Sandwich model fellowship as financial support for the first
author to work in TU, Berlin. The authors also wish to thank TRIPP, IIT Delhi for providing valuable support
during the entire work.
IRC-13-106 IRCOBI Conference 2013
- 905 -

VII. REFERENCES
[1] Otte D, Jänsch M, and Haasper C, Injury protection and accident causation parameters for vulnerable road users based on German In‐Depth Accident Study GIDAS, Accident Analysis and Prevention, 44(1): 149–53, 2012.
[2] Mohan D, Tshimoni O, Sivak M, and Flannagan MJ, Road Safety in India: Challenges and Opportunities, UMTRI 2009‐1, 2009.
[3] World Health Organization, Global Status Report on Road Safety 2013: Supporting a Decade of Action, 2013.
[4] Fredriksson R, Rosén E, and Kullgren A, Priorities of pedestrian protection‐‐a real‐life study of severe injuries and car sources, Accident Analysis and Prevention, 42(6):1672–81, 2010.
[5] Kerrigan JR, Subit D, Untaroiu C, Crandall J, Rudd R, Pedestrian lower extremity response and injury: A small sedan vs. a large sport utility vehicle, SAE‐2008‐01‐1245, 2008.
[6] Desapriya E, Subzwari S, Sasges D, Basic A, Alidina A, Turcotte K and Pike I, Do light truck vehicles (LTV) impose greater risk of pedestrian injury than passenger cars? A meta‐analysis and systematic review, Traffic Injury Prevention, 11(1):48–56, 2010.
[7] Euro‐NCAP, “Pedestrian Protection ‐ Protocols”, Internet: [http://www.euroncap.com/Content‐Web‐Page/fb5e236e‐b11b‐4598‐8e20‐3eced15ce74e/protocols.aspx], Date accessed 27 March 2012.
[8] Strandroth J, Rizzi M, Sternlund S, Lie A, and Tingvall C, The correlation between pedestrian injury severity in real‐life crashes and Euro NCAP pedestrian test results, Traffic Injury Prevention, 12(60):604–13, 2011.
[9] Gennarelli TA, Wodzin E, Abbreviated Injury Scale (AIS) 2005 – Update, 2008, Association for the Advancement of Automotive Medicine, Barrington IL, USA, 2008.
[10] Payne AR and Patel S, “OPERAS Project 427519”, Internet [http://www.eurailsafe.net/subsites/operas], MIRA, 2001, Date Accessed 27 March 2013.
[11] Bull J, The injury severity score of road traffic casualties in relation to mortality, time of death, hospital treatment time and disability, Accident Analysis and Prevention, 2:249‐255, 1975.
[12] Keel M and Trentz O, Pathophysiology of polytrauma, Injury, 36(6):691–709, 2005.
[13] Zeidler F, Pletschen B, Scheunert D, Mattern B, Alt B, Miksch T, Eichendort W, Reiss S, Development of a new injury cost scale, Accident Analysis and Prevention, 25(6):675‐687, 1993.
[14] Zaloshnja E, Miller T, Romano E, Spicer R, Crash costs by body part injured, fracture involvement, and threat‐to‐life severity, United States, 2000, Accident Analysis and Prevention 36:416‐427, 2004.
[15] Sankara subramanian H, Göhlich D, Mukherjee S, and Chawla A, A bio‐mechanics based methodology to optimize vehicle front profile for pedestrian safety, Proceedings of 10th International Symposium on Biomechanics and Biomedical Engineering, Berlin, Germany, pp. 705‐710, 2012.
[16] Viano DC, Lau IV, Asbury C, King AI and Begeman P, Biomechanics of the human chest, abdomen, and pelvis in lateral impact, Accident Analysis and Prevention, 21(6):553‐574, 1989.
[17] Cavanaugh JM, Zhu Y, Huang Y and King AI, Injury and response of the thorax in side Impact cadaveric tests, 37th STAPP Car Crash Proceedings, San Antonio, Texas, 1993.
IRC-13-106 IRCOBI Conference 2013
- 906 -

[18] Schmitt KU, Niederer P, Muser M and Walz F, Trauma Biomechanics – Accidental injury in traffic and sports, 2nd edition, Springer Verlag, Berlin Heidelberg, 2007.
[19] ISO: 13232 Motorcycles − Test and analysis procedures for research evalua on of rider crash protec ve devices fitted to motorcycles, 2002.
[20] The China Automotive Technology and Research Center, C‐NCAP Management Regulation 2012, 2012
[21] Opiela DK, Development & Validation of a Finite Element Model for the 2001 Ford Taurus Passenger Sedan, 2008.
[22] Opiela DK, Kan DS, and Marzougui DD, Development & Validation of a Finite element Model for the 2010 Toyota Yaris Passenger Sedan, 2011.
[23] T. N. O. All and TASS Bv, Human Body Models Manual 7.4.1, 2012.
[24] Elliott J, Lyons M, Kerrigan JR, Wood D and Simms C, Predictive capabilities of the MADYMO multibody pedestrian model: Three‐dimensional head translation and rotation, head impact time and head impact velocity, Institution of Mechanical Engineers, Proceedings, Part K: Journal of Multi‐body Dynamics, 226(3):266–277, 2012.
[25] Van Rooij L, Bhalla K, Meissner M, Ivarsson J, Crandall J, Longhitano D, Takashi Y, Dokko Y and Kikuchi Y, Pedestrian crash reconstruction using multi‐body modeling with geometrically detailed, validated vehicle models and advanced pedestrian injury criteria, Proceedings of Experimental Safety Vehicles, Nagoya, Japan, Paper no. 468, 2003.
[26] Peng Y, Chen Y, Yang J, Otte D and Willinger R, A study of pedestrian and bicyclist exposure to head injury in passenger car collisions based on accident data and simulations, Safety Science, 50(9):1749–1759, 2012.
[27] TY Lin International and Western Michigan University, Pedestrian and Bicycle Crash Data Analysis : 2005 ‐ 2010, Michigan, 2012.
[28] Ogden CL , Fryar C, Carroll MD, and Flegal KM, Mean Body Weight , Height , and Body Mass Index , United States 1960 – 2002, CDC, Advance Data From vital and Health Statistics, no. 347, 2004.
[29] Meissner M, Van Rooij L, Bhalla K, Crandall J, Longhitano D, Takashi Y, Dokko Y, and Kikuchi Y, A multi‐body computational study of the kinematic and injury response of a pedestrian with variable stance upon impact with a vehicle, SAE 2004‐01‐1607, 2004.
IRC-13-106 IRCOBI Conference 2013
- 907 -

VIII. APPENDIX
1 point is allocated for Male and 1 point for Female in one age range. For category with just height or weight
having a one ‘Z’ score less than 1, but other ‘Z’ score greater than 1, weightage (points) allocated is 0.
TABLE VIII
SELECTION OF SCALED MODEL FOR SIMULATION – ‘Z’ score to weightage points
20‐29 years Male Female Weightage points
Z scores Height Weight Height Weight Male Female Total
6C ‐7.40 ‐3.21 ‐5.93 ‐2.08 0 0 0
5F ‐2.94 ‐1.79 ‐1.27 ‐0.92 0 0 0
50M ‐0.33 ‐0.41 1.45 0.20 1 0 1
95M 1.77 0.94 3.65 1.29 0 0 0
30‐39 years
6C ‐7.39 ‐2.61 ‐5.76 ‐2.13 0 0 0
5F ‐2.91 ‐1.50 ‐1.25 ‐1.02 0 0 0
50M ‐0.30 ‐0.43 1.38 0.07 1 0 1
95M 1.82 0.63 3.51 1.13 0 0 0
40‐49 years
6C ‐7.17 ‐3.37 ‐8.23 ‐1.73 0 0 0
5F ‐2.88 ‐2.01 ‐1.85 ‐0.86 0 0 0
50M ‐0.38 ‐0.68 1.88 ‐0.03 1 0 1
95M 1.64 0.61 4.90 0.79 0 0 0
50‐59 years
6C ‐8.00 ‐2.98 ‐6.16 ‐2.00 0 0 0
5F ‐3.10 ‐1.77 ‐1.26 ‐1.01 0 0 0
50M ‐0.24 ‐0.59 1.59 ‐0.04 1 0 1
95M 2.07 0.56 3.90 0.90 0 0 0
60‐74 years
6C ‐6.02 ‐3.36 ‐6.79 ‐2.73 0 0 0
5F ‐2.24 ‐1.96 ‐1.10 ‐1.32 0 0 0
50M ‐0.04 ‐0.60 2.21 0.04 1 0 1
95M 1.74 0.73 4.89 1.38 0 0 0
75 years and over
6C ‐6.04 ‐4.12 ‐5.81 ‐2.09 0 0 0
5F ‐2.04 ‐2.13 ‐0.63 ‐0.81 0 1 1
50M 0.30 ‐0.21 2.39 0.44 1 0 1
95M 2.19 1.68 4.83 1.65 0 0 0
IRC-13-106 IRCOBI Conference 2013
- 908 -

TABLE IX
CALCULATION OF INJURY COST – PROFILE2
Injury Values obtained Profile2_95 Profile2_50 Profile2_05 Profile2_6c
Value AIS Cost Value AIS Cost Value AIS Cost Value AIS Cost
Head _HIC 805 2 14625 1246 3 61988 307 1 490 696 2 14625
Chest _VC 0.04 4 66430
0.06 4 66430
0.04 4 66430
0.04 4 66430
Sternum acceleration(g) 210 27 137 32
Femur peak force (kN) 9.6 4 128302
7 2 128302
5.7 2 128302
4.5 1 128302
Tibia peak force (kN) 5.2 1 4.9 1 2.6 1 3.2 1
Lower Extremity PPI 0.27 0.27 0.27 0.27
Total Injury Cost (USD) 142927 190290 128792 142927
Lower Extremity cost (USD) 128302 128302 128302 128302
TABLE X
CALCULATION OF INJURY COST – PROFILE1
Injury Values obtained Profile1_95 Profile1_50 Profile1_05 Profile1_6c
Value AIS Cost Value AIS Cost Value AIS Cost Value AIS Cost
Head_HIC 538 2 14625 474 1 3448 578 2 14625 952 3 61988
Chest _VC 0.06 4 66430
0.07 4 66430
0.04 4 66430
0.04 4 66430
Sternum acceleration(g) 32 30 75 48
Femur peak force (kN) 9.3 4 128302
8.5 3 128302
4.2 1 128302
7 2 128302
Tibia peak force (kN) 4.6 1 5.6 2 2.7 1 4.5 1
Lower Extremity PPI 0.27 0.27 0.27 0.27
Total Injury Cost (USD) 142927 131750 142927 190290
Lower Extremity cost (USD) 128302 128302 128302 128302
IRC-13-106 IRCOBI Conference 2013
- 909 -

TABLE XI
CALCULATION OF PERCENTAGE POPULATION REPRESENTED BY PEDESTRIAN MODELS
Age Male Pedestrian Model Female Pedestrian Model Total
20‐29 11.37 50M 6.40 ‐ 17.77
30‐39 7.59 50M 4.27 ‐ 11.86
40‐49 7.96 50M 4.48 ‐ 12.44
50‐59 6.72 50M 3.78 ‐ 10.50
60‐74 4.48 50M 2.52 ‐ 7.01
75 and above 1.86 50M 1.05 5F 2.91
From Table XI, population represented by the pedestrian models are indicated in bold font. The models
represented Male population from 20 years to above 75 years and Female population 75 years and above.
Percentage of adult population (>20 years) represented = 41.03 %
Percentage of pedestrians under 20 years is completely represented (From Table II) = 33.08 %
Total percentage of pedestrians involved in crashes represented by the set of models = 74.11 %
Population represented by 6C = 33.08 %
Population represented by 50M = 39.98 %
Population represented by 5F = 1.08 %
A distinction is made to consider people below 20 years in a separate category as children and young
population. The data availability made it convenient to split at 20 years of age and no other reason was
considered for this specific age. The distinction would be necessary as the injury measures and other cost
implications will differ from young population to adult population. Ratio of children and young pedestrian
population is approximately 45%. To calculate the weighting ratios, the population is normalized to the total
population represented.
Weighted IC of population = Weighted IC of young population + Weighted IC of adult
= 0.45 * IC of young + 0.55 * IC of adult
= 0.45*IC of 6C + 0.47*IC of 50M +0.08*IC of 5F
IRC-13-106 IRCOBI Conference 2013
- 910 -