a method of determining the biological · pdf filea method of determining the biological value...
TRANSCRIPT
A METHOD OF DETERMINING THE BIOLOGICAL VALUE OF PROTEIN.
BY H. H. MITCHELL.
(From the Department of Animal Husbandry, University oj Illinois, Urbana.)
(Received for publication, November 19, 1923.)
Probably the most direct method of measuring the degree to which the animal body utilizes dietary protein for those pur- poses for which this class of nutrients alone can serve is by means of a study of the nitrogenous metabolism under certain definite conditions. These conditions are: first, that in so far as possible the diet contains only that protein or mixture of pro- teins which it is desired to investigate; second, that in so far as possible the diet contains no non-protein nitrogenous substances except those present in the food under investigation; and, third, that the food intake be so adjusted as to composition and amount that dietary protein will not be used as a source of energy except in so far as such disposition is conditioned by incomplete utiliza- tion for the maintenance of the nitrogenous integrity of the tis- sues, for their growth, or for the elaboration of milk. It would seem to be legitimate to investigate the value of a food in covering the body’s requirements for nitrogen, even though a considerable fraction of the nitrogen content of the food is in non-protein forms. The biological value obtained in such a case should, of course, refer to the total nitrogen of the food, not to its total protein.
However, even when these conditions are satisfactorily met, the interpretation of the data of the nitrogenous metabolism rela- tive to the purpose for which they have been obtained is not simple, being complicated by the fact that both urinary and fecal excretions contain nitrogen resulting from tissue catabolism or unavoidable tissue wastage, as well as the nitrogen resulting from the incomplete digestibility or the subsequent incomplete utilization of the dietary protein. Since it is the purpose of the experiment to measure the wastage of dietary nitrogen in digea-
873
by guest on May 25, 2018
http://ww
w.jbc.org/
Dow
nloaded from

874 Biological Value of Proteins-Method
tion and metabolism, the body’s contribution of nitrogen to the urinary and fecal excretions must be assessed. Unfortunately, no direct method is available, so that indirect methods, admittedly of uncertain accuracy, have been used. It will be the purpose of this paper to consider critically the validity of these indirect methods, utilizing for this purpose metabolism data obtained on rats in the Nutrition Laboratory of the Unitersity of Illinois.
Since the conviction is often expressed that accurate results on the nitrogenous metabolism of small animals, such as rats, cannot be obtained, it seems advisable to describe the method used in this work and to give the results of the many rigorous tests of its accuracy performed in this laboratory. As a result of these tests, the conclusion seems warranted that the method possesses a high degree of accuracy.
A Method for Nitrogenous Metabolism Investigabions on Rats.
The rats were placed in large crystallizing dishes measuring 190 mm. in diameter and 100 mm. in depth. Weighted wire covers were placed on top. The food crucibles were held in wire frames suspended from the covers. Distilled nitrogen-free water was provided by an inverted bottle or test-tube supported on the wire cover with its bent glass tube projecting into the dish. 0n the floor of the dish two or three layers of filter paper, cut to fit the dish closely, were placed to absorb the urine. A unit of ten of these metabolism dishes may be kept in a two-shelf box with a wire screen back and screen doors in front to permit eEcient ventilation and to exclude the possibility of error from the pres- ence of flies or wild mice. Proper ventilation of these dishes may be insured by the use of an electric fan.
All the rations used were mixed thoroughly in the wet, gener- ally steam-cooked, except for the vitamin preparations which were added later, spread out in thin layers on glass plates, and dried on steam radiators at low temperatures or before a blast of warm air. They were then broken up, ground fine in the laboratory mill, dried for several days in an oven at 40-5O”C., and analyzed for total nitrogen.
In practically all the experiments to be reported the metabolism periods were of 1 week duration, during which time the urine and feces were collected daily. In changing from one rat.ion to
by guest on May 25, 2018
http://ww
w.jbc.org/
Dow
nloaded from

H. H. Mitchell 875
another at least 3 days elapsed before urine and feces were again collected and analyzed. E@dy weights were taken at the be- ginning and end of each balance period.
The food was weighed out each day into the crucibles and mixed with a little water to a thick consistency to prevent scatter- ing. The next day any residue left was scraped out and dried in the same oven and at the same temperature as the original ration. The food residues for each week were weighed after several days drying, and the weight was subtracted from the total food weighed out to determine the food consumed per week. By several tests, it was shown that the error introduced into this determination, due to a possible difference in moisture con- tent of the original ration and of the residues, was less than 1 per cent. It was also determined that the percentage of nitro- gen in these food residues was identical with that of the ration from which they were taken.
Urine and feces were collected daily. The feces were pre- served under 95 per cent alcohol, containing 10 per cent thymol, or in the later experiments, a few drops of sulfuric acid or hydro- chloric acid. The dish and paper of each rat were washed thoroughly with boiling water, acidified strongly with sulfuric (or hydrochloric) acid. About 250 cc. of wash water in four to six portions were used on each dish. The washings were Gl- tered through glass-wool into 250 cc. volumetric flasks, which were then cooled in the ice box overnight. The next day they were made up to the mark at ice box temperature and emptied into 2.5 liter bottles in which the weekly composite samples were kept. The bottles contained crystals of thymol and were kept in a cold storage room until analyzed. Samples of 50 to 250 cc., measured out in the cold, were analyzed for total nitrogen.
The week’s collection of feces was digested with sulfuric acid, mercury, and potassium sulfate until completely oxidized. The residue was then transferred to a volumetric flask, and aliquots were taken for distillation.
The accuracy of the method used in determining the excretion of nitrogen in the urine was the subject of considerable study, in part because the determination of the biological value of protein is so largely dependent upon an accurate estimation of the urinary nitrogen, and in part because the results of metabolism exwri-
by guest on May 25, 2018
http://ww
w.jbc.org/
Dow
nloaded from

876 Biological Value of Proteins-Method
ments on small animals are so frequently discounted by the belief that accurate balance data on such subjects cannot be expected, possibly because of the small amounts of nitrogen involved.
The filter paper used to absorb the urine was found to contain only small amounts of nitrogen, one piece of the size used in the metabolism experiments containing about 0.4 mg. of nitrogen. Since two pieces were used generally in each dish per day, the error thus contributed amounted to 0.8 mg. at most. In so far as this was insoluble in dilute acid, it would not affect the results one way or the other. In so far as it was soluble, it would dimin-
TABLE I.
Completeness of Extraction of Urinary N from the Filter Papers Used as Ahoybents.*
Total urinary nitrogen detmmmed.
ntg.
918 913 826 860 627 619 551 576 567 398 181 174
-
-
-
Extractable nitrogen remain- ing in paper residues.
ma.
26 25 16 15 10 8
14 14 8 8 2.5 2.5
-
--
-
Error.
pm Gent
2.8 2.7 2.0 1.7 1.6 1.3 2.5 2.4 1.4 2.0 1.4 1.4
* Results expressed in mg. per week.
ish the error due to the incomplete extraction of the urinary nitrogen from the Alter paper.
The completeness of extraction of urine from the filter paper by the 250 cc. of hot dilute acid used was determined by saving the paper residues from several balance periods, extracting each with 2 or 3 liters of boiling water, acidified with sulfuric acid, Cltering, evaporating the extract to a small volume, transferring to a Kjeldahl flask, and determining nitrogen in it. The results thus obtained compared with the quantities of urinary nitrogen determined in the corresponding balance periods are given in Table I.
by guest on May 25, 2018
http://ww
w.jbc.org/
Dow
nloaded from
H. H. Mitchell 877
The error due to the retention of urine by the filter paper resi- dues is evidently negligible in biological work.
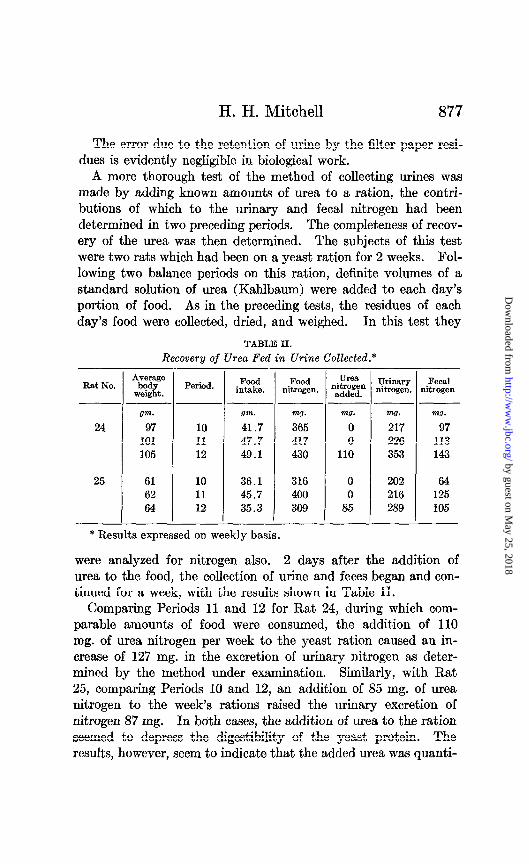
A more thorough test of the method of collecting urines was made by adding known amounts of urea to a ration, the contri- butions of which to the urinary and fecal nitrogen had been determined in two preceding periods. The completeness of recov- ery of the urea was then determined. The subjects of this test were two rats which had been on a yeast ration for 2 weeks. Fol- lowing two balance periods on this ration, definite volumes of a standard solution of urea (Kahlbaum) were added to each day’s portion of food. As in the preceding tests, the residues of each day’s food were collected, dried, and weighed. In this test they
TABLE II.
Recoveq of Urea Fed in Urine Collected.*
25 61 62 64
-
Period.
10 11 12
10 11 12
-
-
Food Food intake. nitrogen.
___~ Urn. ml.
41.7 365 47.7 417 49.1 430
36.1 316 45.7 400 35.3 309
-
-
-
UreS nitrogen added.
nZ0.
0 0
110
0 0
85
-
1
--
-
Urinary litrogen.
m0.
217 226 353
202 216 289
-
T
_-
-
WI.
97 113 143
64 125 105
* Results expressed on weekly basis.
were analyzed for nitrogen also. 2 days after the addition of urea to the food, the collection of urine and feces began and con- tinued for a week, with the results shown in Table II.
Comparing Periods 11 and 12 for Rat 24, during which com- parable amounts of food were consumed, the addition of 110 mg. of urea nitrogen per week to the yeast ration caused an in- crease of 127 mg. in the excretion of urinary nitrogen as deter- mined by the method under examination. Similarly, with Rat 25, comparing Periods 10 and 12, an addition of 85 mg. of urea nitrogen to the week’s rations raised the urinary excretion of nitrogen 87 mg. In both cases, the addition of urea to the ration seemed to depress the digestibility of the yeast protein. The results, however, seem to indicate that the added urea was quanti-
by guest on May 25, 2018
http://ww
w.jbc.org/
Dow
nloaded from

878 Biological Value of Proteins--Method
tatively recovered in the extracts of the filter paper used to ab- sorb the urine.
For further tests of the accuracy of the determinations of uri- nary and fecal nitrogen, reference is made to a paper by Nevens, published from this laboratory (1). These tests indicate errors of only 2 to 3 per cent in the extraction of urine nitrogen from the filter papers, and also indicate clearly that no losses of nitro- gen occur during 24 to 48 hours due to bacterial decomposition of either urine or feces exposed in open dishes even at a tempera- ture of 40°C.
Determination of the Amount of Fed Nitrogen Derived from the Body, the So Called Metabolic Nitrogen of the Feces.
The “biological value” of a protein, as the term was applied originally by Karl Thomas, referred to the utilization by the body of the products of protein digestion. The biological value was expressed as the percentage of the absorbed nitrogen which was retained by the body for repair or the construction of nitrog- enous tissue. Hence, differences in digestibility of different proteins did not affect their biological values.
The determination of the amount of protein digested and ab- sorbed from a given protein intake is complicated by the dish- culty of distinguishing between fecal material derived from the food and that derived from the intestinal tract and its secretions. Obviously, only the former should be deducted from the protein intake to obtain the amount of protein absorbed. While various methods have been devised for making this separation of fecal nitrogen by digestion of the feces with enzymes or special solvents, the assumptions upon which such methods have been based are not particularly convincing and the technique involves condi- tions of time and temperature quite arbitrarily imposed. Thomas preferred to measure the so called “metabolic nitrogen” of the feces by the daily fecal excretion of nitrogen from a diet practi- cally free of this element, and more recently Martin and Robison (2) have accepted this procedure in their own calculations. The assumption has been, however, that the excretion of metabolic nitrogen is constant regardless of the amount of food consumed, though the latter investigators were fully aware of the fact that the composi.tion of the diet, in particular its content of indiges-
by guest on May 25, 2018
http://ww
w.jbc.org/
Dow
nloaded from

H. H. Mitchell 879
tible material, may greatly affect the excretion of metabolic prod- ucts in the feces. They believe that the determination of the metabolic nitrogen of the feces is the factor limiting the accuracy of biological values of protein by the method of Thomas.
That the amount of roughage in the diet is a factor determining the amount of metabolic nitrogen appearing in the fecal excretion is demonstrated by some results obtained with four rats of the same litter subsisting on a ration containing 15 per cent of butter fat, 14 per cent of lard, 66 per cent of starch, 4 per cent of inor- ganic salts, and 1 per cent of an alcohol extract of carrots as a source of vitamin B. Starting on the 4th day of feeding, the
TABLE III.
E&d of Roughage on the Amount of Metabolic Nitrogen in the Feces.
Rat No. Initial Final weight. weight.
Food Urinary Fecal eaten per nitrugen nitroga
&Y. P-&Y. per dw
m3.
1 11.7
2 9.8
3 11.2
4 12.3
um.
91 86 88 82 99 95 97 90
om.
86 79 82 79 95 90 90 86
Qm.
4.84 4.43 4.26 4.21 4.94 5.16 4.44 4.21
-
ma. 6.0 7.9 4.7 6.9 6.4 8.2 5.5 8.0
Average.............................................
- - I
-_
-
m3.
180
164
159
191
173
“ZY paper.
m3.
124
111
130
123
122
feces were collected for the succeeding week during which time the rats had no access to filter paper. Following this period was one in which the same ration was used, but in which the rats had free access to filter paper and actually consumed some of it. In the latter period the urine was also collected and analyzed for nitrogen. The essential figures are given in Table III.
During the periods in which filter paper was consumed, the fecal nitrogen in all cases increased, the increase in the average amounting to 42 per cent. Therefore, if the fecal excretion on a nitrogen-free diet is to be taken as the measure of the excretion of metabolic nitrogen in the feces of subsequent feeding periods
by guest on May 25, 2018
http://ww
w.jbc.org/
Dow
nloaded from
880 Biological Value of Proteins-Method
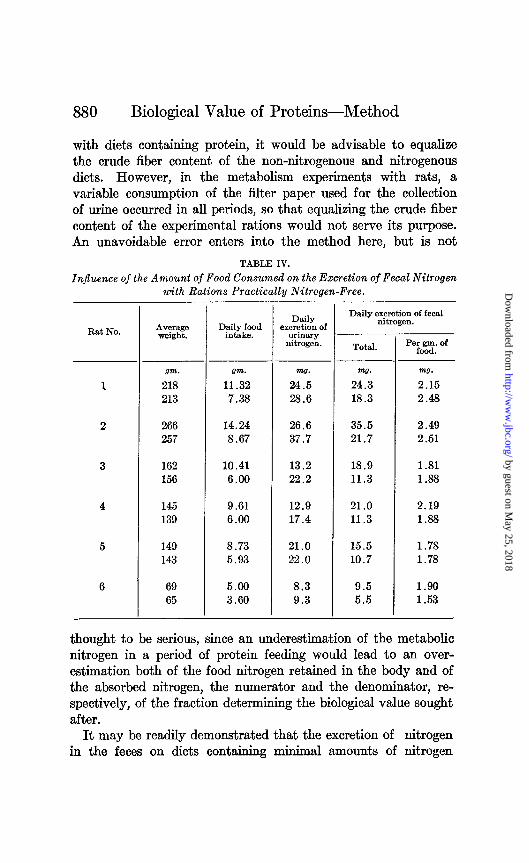
with diets containing protein, it would be advisable to equalize the crude fiber content of the non-nitrogenous and nitrogenous diets. However, in the metabolism experiments with rats, a variable consumption of the filter paper used for the collection of urine occurred in all periods, so that equalizing the crude fiber content of the experimental rations would not serve its purpose. An unavoidable error enters into the method here, but is not
TABLE IV.
Influence of the Amount of Food Consumed on the Excretion of Fecal Nitrogen with Rations Practically Nitrogen-Free.
Rat No. Daily
excretion of WiIWY
nitrogen. Total. -_
gm. gm. mg. m3. mg.
218 11.32 24.5 24.3 2.15 213 7.38 28.6 18.3 2.48
266 14.24 26.6 35.5 2.49 257 8.67 37.7 21.7 2.51
162 10.41 13.2 18.9 1.81 156 6.00 22.2 11.3 1.88
145 9.61 12.9 139 6.00 17.4
21.0 11.3
15.5 10.7
9.5 5.5
2.19 1.88
149 8.73 21.0 143 5.93 22.0
1.78 1.78
69 5.00 8.3 65 3.69 9.3
1.99 1.53
-
thought to be serious, since an underestimation of the metabolic nitrogen in a period of protein feeding would lead to an over- estimation both of the food nitrogen retained in the body and of the absorbed nitrogen, the numerator and the denominator, re- spectively, of the fraction determining the biological value sought after.
It may be readily demonstrated that the excretion of nitrogen in the feces on diets containing minimal amounts of nitrogen
by guest on May 25, 2018
http://ww
w.jbc.org/
Dow
nloaded from

H. H. Mitchell
(0.04 to 0.08 per cent) varies directly with the amount of food consumed. The experimental results in Table IV bear on this point.
Six rats of different weights were fed ad l&turn on a nitrogen- free ration. After a preliminary period of 3 days, the urine and feces were collected quantitatively for 7 days. At the end of this time the food intake was restricted to an amount corresponding to their energy requirement for maintenance as previously de- termined. A 7 day collection period at this lower level was then run, with no transition period. The average daily fecal nitrogen dropped in all cases in the second period, and, as the last column of figures shows, the decrease was closely proportional to the decrease in food consumed for three of the rats; while the relation was not so close for the other three rats, the divergence from a linear relation might well be due to the variation to be expected in biological experiments.
From these and many similar results we have concluded that the best and most practicable method of estimating the metabolic nitrogen in the feces of rats on an experimental ration containing protein is to determine in a period of feeding a non-nitrogenous ration, the excretion of fecal nitrogen per gram of food consumed, and to apply this figure to the amount of protein-containing food consumed in subsequent experimental periods. While many objections may be raised to this procedure, it seems to be the best method available, and should be judged, not by the errors theoretically possible, but by the consistency and plausi- bility of the results obtained.
Six rats of widely differing weights were fed for several months on amounts of food just sufficient to maintain constant weight. The protein in the rat,ions fed during this time was derived en- tirely (except for unavoidable impurities in the starch, sugar, butter fat, and small concentrations of the vitamin B preparation of Osborne and Wakeman) from a mixture of corn and tankage in the proportion of 85 parts of the former to 15 parts of the latter. The level of protein intake was varied by diluting this mixture of corn and tankage with varying amounts of a ration complete in every respect except for the entire absence of protein. From the different periods of this experiment, which was carried out with another object in view, it is possible to pick out periods in
by guest on May 25, 2018
http://ww
w.jbc.org/
Dow
nloaded from

882 Biological Value of Proteins-Method
which all the rats were consuming practically the same amount of this constant source of protein. These periods varied in length from 7 to 20 days. The data pertaining to the digestibility of the rations during these periods are given in Table V.
The estimates of the metabolic nitrogen in the feces given in Column 6 were obtained from the fecal nitrogen excreted on like amounts of a protein-free ration (see Table IV, the second period).
Due to the inconstant proportion of metabolic nitrogen in the fecal nitrogen excreted by these rats, the coefficients of ap- parent digestibility vary from 51.7 for the heaviest rat to 77.0
TABLE V.
Digestibility of the Proteins of a Ration of Corn and Tankage by Rats of Different Weights. Result of Correcting the Digestibility for the
Metabolic Nitrogen of the Feces.
Rat No.
-
0m. 0m.
262 8.70 213 7.50 155 6.00 145 6.00 145 6.00 57 3.60
7 -7
Daily food con- sumption.
Percenta e digesti- Estimated bility o%pmtein.
inzi?of Daily fenal metabolic nitrogen. nitrogen. nitrogen
in feces. Unoor- cor- rected. reoted.
______~~~ nag. m0. m0.
56.9 27.6 21.7 51.7 89.6 60.0 23.1 18.3 61.5 92.0 62.6 18.1 11.3 71.0 89.1 62.6 19.0 11.3 69.6 87.7 62.6 20.9 10.7 66.6 83.7 55.1 12.7 5.5 77.0 86.9
for the lightest. When ahowance is made, however, for the body nitrogen excreted in the feces, the digestibility thus corrected ranges only from 83.7 to 92.0 per cent, with no obvious relation to body weight.
Practically the same situation is shown with three other rats placed successively on rations containing approximately 5 and 10 per cent of corn protein. The metabolic nitrogen in the feces was measured in a following period on a nitrogen-free ration. The data on digestibility are summarized in Table VI.
The uncorrected coefficients are evidently seriously vitiated by varying proportions of body nitrogen in the feces. When the amounts of nitrogen of intestinal origin are estimated by the total fecal nitrogen excretion on nitrogen-free rations, and these
by guest on May 25, 2018
http://ww
w.jbc.org/
Dow
nloaded from

H. H. Mitchell 883
TABLE VI.
Digestibility of the Proteins of Corn at Diferent Levels of Intake, Corrected and Uncomected for the Metabolic Nitrogen of the Feces.
Rat No. hOt3iO.
60
61
62
corn. “
“
“
‘I
‘<
“
‘I
“
“
Concentration (approximate).
T Digestibility of protein.
Uncorrected. Corrected.
pa cent p.3 cent 5 66.6
10 79.7 10 77.8
5 5
10 10
66.7 64.4 80.9 80.5
5 10 10
67.7 80.6 76.8
TABLE VII.
In concentrations of approximately:5 per cent.
-
2 % i? - 6 5 7 3 4 4
11 6 6 5 6
-
-
4 .E! !I “0 2 - 9
10 22 4
13 12 22 12 12 9
11 -
In concentrationf3 of spprwimately 10 per cent.
-
Kind of protein.
Beef protein. Milk “ Casein. La&albumin. Yeast protein. Soy bean “ Corn “ Oats “ Rice “ Potato “ Navy bean “
f . s 3 8 E :, s --
75 94 76 97 74 93 76 92 59 78 72 91 73 95 70 90 77 96 59 78 61 76
4 . .o
8 %; ‘i; g g -- 2 ! 5 l( 3 2t
5 2( 4 25 2 2(
5 1: 5 1:
Kind of protein.
--
5 1 1 1 5 (
Beef protein. Milk “ Casein.*
Yeast protein. Soy bean “ * 30rn ‘I
Potato protein. qheat “
* These rations contained approximately 15 per cent of protein.
per cent
90.8 92.1 90.2
89.8 87.5 92.7 92.3
87.9 90.9 87.2
Digestibility of Protein for Rats.
Digesti- bility.
88 99 83 95 83 90
63 76 77 84 81 94
by guest on May 25, 2018
http://ww
w.jbc.org/
Dow
nloaded from

884 Biological Value of Proteins-Method
estimations used in the calculation of true digestibility coefficients, closely comparable values are obtained for all periods.
A summary of similar results for a number of different protein mixtures is given in Table VII.
An apparently significant difference in digestibility of the 5 and 10 per cent rations existed with soy bean and potato proteins. With the other proteins studied the differences in apparent digesti- bility indicated by the ordinary coefficients were practically elim-
TABLE VIII.
Fecal Nitrogen per Gram of Food Consumed in Successive Periods of Non- Protein Feeding.
Rat No.
9
11
12
15
16
27
Length of period.
days
4 7
lma.
103 97
4 4
86 82
7 7
104 97
8 100 7 91
104 97
168 164
-
AVWge weight of
rat.
-
_
-
Averape daily food mtake.
gm. 4.82 5.74
4.17 3.90
4.85 5.76
4.44 4.16
5.62 4.37
10.89 7.81
Average daily fecal nitrogen.
w.
8.4 9.8
6.6 7.6
8.9 9.3
8.2 8.6
9.4 9.0
15.2 14.6
w.
1.75 1.71
1.59 1.95
1.84 1.62
1.85 2.08
1.68 2.07
1.40 1.87
inated when allowance was made for the metabolic nitrogen of the feces as measured by the fecal nitrogen excreted on a nitrogen-free ration.
Rats will ordinarily excrete from 1.5 to 3.0 mg. of nitrogen per gram of nitrogen-free ration consumed. There is, however, a great deal of variation among rats in this respect. There seems to be a slight positive correlation between this value and the weight of the rat, while if the amounts of food consumed are
by guest on May 25, 2018
http://ww
w.jbc.org/
Dow
nloaded from

H. H. Mitchell
small compared to the energy requirement of the rat, abnormally large values are obtained which are obviously poor indices of the excretion of metabolic nitrogen in the feces under normal con- ditions of feeding.
The data in Table IV and those in Table VIII illustrate the agreement to be expected in successive periods of non-protein feeding.
TABLE IX.
Fecal Nitrogen per Gram of Food Consumed in Periods of Non-Protein Feeding Several Weeks Apart.
T
Rat No.! Experimental period.
Avera p:
e weight 0 rat.
Average daily food intake.
FeoalMygen
per gm. of food.
gm. gm. ma.
65 1 58 5.77 1.42 10 131 5.80 1.82 15 153 7.26 2.50
66 1 45 4.70 1.52 10 105 4.36 2.20 15 116 5.11 2.11
67 1 54 4.81 1.38 10 120 5.17 2.25 15 143 6.14 2.21
68 1 58 5.96 1.41 10 115 4.51 2.63 1.5 134 6.90 2.62
69 1 59 5.43 1.58 10 111 5.24 2.30 15 121 7.63 1.79
During an extended series of balance periods on the same rat, it is advisable to redetermine the metabolic nitrogen in the feces about every 6 weeks at most. At times unaccountable varia- tions in this value tiill be revealed by these repeated tests, as shown by the data summarized in Table IX. All collection periods were of 7 days duration.
Evidently between the first and the tenth periods of this experi- ment a marked change in the intestinal conditions of these rats occurred, leading to an increased excretion of body nitrogen in
-
by guest on May 25, 2018
http://ww
w.jbc.org/
Dow
nloaded from

886 Biological Value of Proteins-Method
the feces. In using* such results for the estimation of metabolic fecal nitrogen in the intervening eight periods it is necessary to assume a linear increase with time from the low level of excretion of the first period to the high level of the tenth period. From the tenth to the fifteenth experimental period, this high level was maintained well for three of the five rats.
Determination of the Amount of Urinary Nitrogen of Body Origin.
Having obtained a value for the absorbed nitrogen from a given nitrogen intake, the next step in measuring the biological value of dietary protein is to determine how much of the absorbed nitrogen is retained in the body. For most purposes it is suffi- cient to determine how much of the absorbed nitrogen is excreted in the urine, since the excretion of nitrogen by other paths is insignificant. The determination of the amount of nitrogen resulting from the catabolism of end-products of digestion of dietary protein is complicated by the fact that the urine is known to contain nitrogenous substances resulting from the catabolism of body tissues, as well as nitrogenous end-products of the catab- olism of dietary protein. Since the nitrogenous end-products of these two types of catabolism, the “endogenous” and “exogen- ous” catabolism of Folin, are not to be clearly distinguished chemically they must obviously be determined by an indirect method.
The only conceivable indirect method of measuring the urinary nitrogen of endogenous origin is to eliminate entirely the exog- enous catabolism by the feeding of a nitrogen-free diet, and insuring that enough of such a diet is consumed to provide sufh- Gent energy for the requirements of the experimental animal, thus preventing the oxidation of body tissue for this purpose with its inevitable loss of body nitrogen not properly included in the endogenous nitrogen that it is desired to measure. Thomas, and more recently Martin and Robison, have used this method of measuring the endogenous nitrogen excreted in the urine. In applying the values thus determined to the interpretation of balance data obtained in subsequent periods during which diets are consumed containing the protein whose biological value it is desired t,o measure, an assumption is introduced the justification
by guest on May 25, 2018
http://ww
w.jbc.org/
Dow
nloaded from

H. H. Mitchell 887
for which is purely theoretical. This assumption is to the effect that the catabolism of body substances containing nitrogen, occurring during the feeding of nitrogen-free diets, continues at a constant level when protein feeding is resumed. The assump- tion conforms with Folin’s theory of protein metabolism, but the experimental data of Folin prove simply that the excretion of cr.&in&e is constant. Since this substance seems to contain only 20 per cent or less of the urinary nitrogen excreted on a nitrogen-free diet, the theory of a constant endogenous catabolism of nitrogenous substances is not particularly convincing and in many quarters seems to have been discarded entirely.
In another publication (3) the author has discussed critically the theories on this subject, and, on the basis of analyses of the tissues of rats that had subsisted for some considerable time on a nitrogen-free dietary as compared with analyses of the tissues of other rats not so treated, has advanced a theory of endogenous catabolism supplementary to that of Folin and agreeing with it in postulating a constant breakdown of nitrogenous constituents of the tissues regardless of the amount or character of the pro- tein fed. However, the method of measuring the biological value of proteins by the method associated with the name of Thomas, cannot be justified or refuted by theoretical discussion. The question can be settled only by experimental inquiry.
There seems to be no obvious method of settling directly or Anally the question whether, during a period of protein feeding, the contribution of the tissues to the urinary nitrogen is the same as the total urinary nitrogen excreted on a protein-free ration; nor on more careful consideration has such a method occurred to the author. It is possible, nevertheless, to throw some light on this question in a more or less indirect way.
If the theory of Sherman as to the nature of the endogenous catabolism (4) is correct, or if the views of Osborne and Mendel (5) conform with the facts, then no constant basal catabolism of body tissue exists. According to these theories, the endogenous catabolism would be largely or entirely suppressed when an ani- mal is receiving protein in its food, either because of a retarda- tion of the hydrolysis of tissue protein caused by the mass action of the amino-acids coming from the digestive tract, or because of the complete suppression of the hydrolysis of tissue protein,
by guest on May 25, 2018
http://ww
w.jbc.org/
Dow
nloaded from

888 Biological Value of Proteins-Method
initiated, in the absence of amino-acids of dietary origin, by the urgent need of the body for certain nitrogenous hormones; with the influx of amino-acids from the intestinal tract, exogenous precursors of these hormones become available, and the endog- enous catabolism is reduced to the inevitable destruction of the hormones themselves in the course of general metabolism. It may be expected, therefore, if the endogenous catabolism is so readily diminished by protein feeding, that the urinary nitrogen excreted on a diet containing a small amount of a protein of high biological value would be considerably less than the urinary nitrogen excreted on a nitrogen-free diet.
In order to submit this supposition to an experimental test, five rat.s were put upon a ration of very low nitrogen content (0.06 per cent). On the 5th and 6th days of such feeding, when it may be supposed that the endogenous level of nitrogenous metabolism had been reached (3) daily collections of urine and feces were made and analyzed for nitrogen separately. For the next 3 days of the experiment, the rats were given a ration con- taining about 2.5 per cent of milk protein (0.399 per cent of nitrogen). This period was followed by a 3 day period on the low nitrogen ration, a 3 day period on a ration containing about 3.Q per cent of lactalbumin (0.506 per cent of nitrogen), and finally a 3 day period on the low nitrogen ration. Daily collections and analyses of urine and feces were made throughout the experi- ment. The detailed data for two of the rats, which consumed the rations the most satisfactorily, are given in Table X, while the averages for all five rats are summarized in Table XI. The rats were litter mates and weighed very nearly the same.
The excretion of nitrogen in the urine during the 3 days on the milk protein ration was at the same level as the excretion of nitro- gen on the last 2 days of the first period of feeding on a low nitro- gen ration, and somewhat greater than the level of excretion during the second period of such feeding. However, during the period of lactalbumin feeding, the excretion of urinary nitrogen was slightly though distinctly lower than that in either the preceding or the following period of non-protein feeding.
Following the experimental feeding periods described above, a ration containing a little less than 6 per cent of lactabumin (0.928 per cent of nitrogen) was offered the five rats, but their
by guest on May 25, 2018
http://ww
w.jbc.org/
Dow
nloaded from

H. H. Mitchell 889
TABLE X.
Effect of the Ingestion of Small Amounts of Milk Proteins and ojLactalbumin on the Endogenous Excretions of Nitrogen.
5 Low N. 6 “ “
m.
5.1 5.4
- -
d 3 .a 8 z % x 72 n -
m3.
3 3
d “m $ .a f .a B 2 a" - m3. 32 28
j ‘a z B 8 - n0.
13 18
7 Milk protein. 8 ‘I ‘I
9 “ * “ 120
4.5 18 23 10 6.6 26 24 14 6.4 26 19 16
10 Low N. 11 ‘I I‘
12 “ I‘ 117
6.3 4 23 13 5.0 3 20 6 5.7 3 21 11
13 Lactalbumin. 14 I‘
15 “ 117
6.0 30 18 13 7.0 35 19 11 7.0 35 17 13
16 Low N. 6.0 4 22 14 17 “ “ 5.2 3 17 9 18 “ ‘I 5.1 3 16 13
19 20 21 22 23 24 25 26 27
Lactalbumin . I‘ “ I‘ “ “ “ “ “
114
119
115
7.0 65 16 10 7.0 65 19 8 7.0 65 23 19 6.9 64 29 18 7.4 69 31 18 4.8 45 32 14 5.7 53 35 13 7.0 65 34 12 6.9 64 27 19
28 29 30 31
Low N. ‘L “ “ “ “ ‘I
119 4.0 5.9 4.4
2 4 3
-
35 30 26
116
7 17 9
-
- Rat 153.
-
- Rat 150.
2; !z
i 2 8
ii - 2m. 9.t 9.d
5.1 8.l 7.:
7.! 7.j 6.:
8.t 6.: 7.t
4.j 5.1 6.:
-
d 3 .a B f .$
2 - w.
5 6
23 32 31
5 5 4
40 31 35
3 3 4
-
7 -
!i .z
Fi .a B x q n - mo. 24 21
19 31 21
20 15 16
13 13 13
16 16 12
-
-
d
$
3 h 7 n - w. 18 13
13 18 23
21 15 20
12 15 14
11 11 7
- -
by guest on May 25, 2018
http://ww
w.jbc.org/
Dow
nloaded from

890 Biological Value of Proteins-Method
condition was so poor, due to the prolonged period of low protein feeding, that successful results were obtained with only one rat, No. 153. These data will be found in Table X. A.n intake of twice the amount of lactalbumin nitrogen previously given in-
TABLE XI.
Avemge Data for All Five Rats.
5 Low N. 6 “ I‘
-.
Average . . . . . . . . . . . . . . . . . .
7 Milk protein. 8 “ ‘I
9 “ ‘I
Average . . . . . . . . . . . . . . . . . . -
10 Low N. 11 I‘ “
12 “ “
Average . . . . . . . . . . . . . . . . . .
13 Lactalbumin. 14 “
15 “ -
Average . . . . . . . . . . . . . . . . . .
16 Low h’. 17 ‘I ‘I
18 I‘ “
Average . . . . . . . . . . . . . . . . . .
Qm. 7.6 8.1
7.85
5.6 7.6 6.7
6.65
7.1 6.8 6.6
6.83
7.6 6.5 6.2
6.75
5.0 5.3 5.7
5.37
Daily intake of nitrogen.
ml.
5 5
5
22 30 27
26.5
4 4 4
4
38 33 31
34
3 3 3
3
-
_
.
-
Daily urhmy
nitrogen.
mu.
24
23
23.3
20 28 21
23.1
23 19 18
19.9
15 14 15
14.8
17 16 17
16.0
_
-
--
--
_ _
.-
_ -
Dail feoa f
nitrogen.
mo.
15 15
15.4
12 14 21
14.9
18 14 15
15.7
14 14 12
13.4
12 10 9
10.9
-
.
_.
.
_
-
Body weight of
rata.
om.
130
128
124
122
120
dueed a distinct rise in urinary nitrogen; a following period of non-protein feeding also initiated a distinct fall in urinary nitro- gen, though the period was too short for the excretion to reach the endogenous level.
The results of this experiment are somewhat difficult of inter- pretation. Certainly there is no indication that the mixed pro-
by guest on May 25, 2018
http://ww
w.jbc.org/
Dow
nloaded from

H. H. Mitchell
teins of milk had any effect on the excretion of nitrogen in the urine on a nitrogen-free diet. However, on the lactalbumin ration, a distinct drop in the excretion of urinary nitrogen oc- curred, though during the succeeding period of non-protein feed- ing, the urinary nitrogen rose only slightly on the average, and to an apparently significant extent only with one of the five rats. The data as a whole do not indicate any marked effect of dietary protein on the rate of catabolism of the nitrogenous constituents
TABLE XII.
-- gm. Per cent 262 0.65 213 0.80 155 1.04 145 1.04 145 1.04
8,70 56.9 48.6 37.7 10.9 27.6 7.50 60.0 40.2 28.6 11.6 23.1 6.00 62.6 34.5 22.2 12.3 18.1 6.00 62.6 33.4 17.4 16.0 19.0 6.00 62.6 32.8 22.0 10.8 20.9
3 158 0.80 6.00 48.0 33.0 22.2 10.8 17.3 4 143 0.80 6.00 48.0 32.8 17.4 15.4 18.4 5 146 0.80 6.00 48.0 30.2 22.0 8.2 18.0 1 214 0.65 7.50 49.0 39.3 28.6 10.7 22.6
3 156 0.65 6.00 39.2 31.3 22.2 4 142 0.65 6.00 39.2 30.5 17.4 5 145 0.65 6.00 39.2 33.6 22.0 6 60 1.04 3.60 37.5 19.2 9.3
9.1 13.1 11.6 9.9
-_
15.9 16.5 17.0 11.6
of the tissues. The diminution in the excretion of urinary nitrogen with succeeding periods of non-protein feeding is another phenom- enon that will be taken up later.
Qrn. nw. ma.
-7
ma. ma. ma.
-
--
-
ma.
21.7 18.3 11.3 11.3 10.7
11.3 11.3 10.7 18.3
11.3 11.3 10.7 5.5
ma.
6.9 4.9 6.8 7.7
10.2
6.0 7.1 7.3 4.3
4.6 5.2 6.3 6.1
m cent
79 79 78 71 79
74 62 80 76
74 61 65 69
A study of the nitrogen excretion of rats differing widely in weight and receiving approximately the same amounts of a con- stant protein mixture, may be expected to throw considerable light on the correctness of the assumption of a constant basal catabolism of nitrogenous substances. Such an experiment has already been referred to on page 881, part of the data being there utilized in
by guest on May 25, 2018
http://ww
w.jbc.org/
Dow
nloaded from
892 Biological Value of Proteins-Method
connection with the estimation of the metabolic nitrogen of the feces. Complete balance data of those periods in which com- parable amounts of protein of a definite character (corn 85, tank- age 15) were consumed, are given in Table XII. The food intake of these rats was adjusted to maintenance of body weight for several months previous to the metabolism experiments.
It will be noted in the three sets of data in Table XII, that, within each set, the daily excretion of urinary nitrogen on com- parable nitrogen intakes varied with the body weights of the rats, the larger rats having the larger excretions. Assuming that the endogenous excretion of urinary nitrogen is constant for each rat and is equal to the total urinary nitrogen on a nitrogen- free diet, the figures given in Column 7 enable one to compute that fraction of the urinary nitrogen that was of dietary origin. These figures are given in Column 8. They are fairly constant except for the high figure for Rat 4, which throughout the experi- ment seemed distinctly and consistently less efficient in the utili- zation of dietary protein in metabolism than its mates. Similarly, the food nitrogen in the feces may be estimated from the total fecal nitrogen and the metabolic fecal nitrogen determined in a period of feeding a nitrogen-free ration (Columns 9, 10, and 11). Finally, the biological value of the protein, Column 12, may be computed according to the following illustration. Rat 2 con- sumed an average of 56.9 mg. of nitrogen per day in a 7 day col- lection period. On this diet, the daily excretion of fecal nitrogen was 27.6 mg., but of this nitrogen it is estimated that 21.7 mg. were derived from the body, leaving only 5.9 mg. contained in the indigestible food protein. Hence, the rat was receiving daily 56.9 - 5.9 = 51.0 mg. of absorbed nitrogen. During this period, the excretion of urinary nitrogen was 48.6 mg. daily, of which 37.7 mg. were the result of the catabolism of the body’s own tissues. Hence, only 48.6 - 37.7 = 10.9 mg. of the absorbed dietary nitrogen were wasted in metabolism, and 51.0 - 10.9 = 40.1 mg. were retained in the body. The biological value of the pro- tein, therefore, is equal to 100 X (40.1 + 51.0) = 79. The constancy of the computed biological values in the first set of data, except for the one low figure for Rat 4, is remarkable, and testifies to the essential accuracy of the assumptions upon which the calculation is based.
by guest on May 25, 2018
http://ww
w.jbc.org/
Dow
nloaded from

H. H. Mitchell
In the other two sets of data the agreement among the bio- logical values is not so good, but, considering the low values for Rat 4 as due to an exceptional physiological performance or to an inaccurate determination of endogenous nitrogen, the re- maining values, in the light of the experience of this laboratory in work of this type, exhibit a variability not greatly out of the tirdinary.
The ability of this method of measuring the biological value of proteins to harmonize results obtained with rats differing widely in size is further illustrated by the data in Table XIII.
With the first group of rats (Nos. 60 to 64,‘Table XIII), aver- aging 181 gm. in weight, the urinary nitrogen amounted to 37.3 per cent of the absorbed nitrogen on the milk protein ration, while with the second group of rats (Nos. 65 to 69), averaging only 91 gm. in weight, the urinary nitrogen on the same ration amounted to only 28.6 per cent of the absorbed nitrogen. The discrepancy may be largely accounted for by the fact that with the heavier rats the endogenous nitrogen in the urine amounted to 18.1 per cent of the absorbed nitrogen, while with the lighter rats it amounted to only 12.7 per cent. Thus, the heavier rats excreted 19.2 per cent of the absorbed nitrogen in the urine, while the lighter rats excreted 15.9 per cent.
For the corn protein ration, containing a smaller percentage of protein, the case is more striking. Here the heavier rats averaged 241 gm., and the lighter rats 97 gm. With the former, the urinary nitrogen averaged 82.4 per cent of the absorbed nitrogen, while with the latter it averaged only 66.2 per cent. The discrepancy is practically entirely accounted for by the great difference in the amount of nitrogen excreted in the urine, resulting from tissue catabolism. With the larger rats this amounted to 55.4 per cent of the absorbed nitrogen, while with the smaller it was only 39.5 per cent. The urinary nitrogen of dietary origin was, therefore, 82.4 - 55.4 = 27.0 per cent of the absorbed nitrogen for the rats averaging 241 gm. in weight, and 66.2 - 39.5 = 26.7 per cent for the rats averaging 97 gm. in weight. The biological value for the two groups of rats thus averaged very nearly the same, 73 and 74 per cent. It would seem that the close agreement revealed by this method of calculation between two sets of data, seemingly so discordant as regards the utilization of the dietary nitrogen,
by guest on May 25, 2018
http://ww
w.jbc.org/
Dow
nloaded from

894 Biological Value of Proteins-Method
Results on milk protein (10 per cent of ration).
gm. gm. ??a*. wag. ml. nag. n&g. mg. mg. 60 174 11.70 187.2 65.0 35.1 29.9 46.0 27.7 18.3 61 186 11.93 190.9 55.2 27.9 27.3 52.2 28.5 23.7 62 191 11.77 188.3 64.1 29.8 34.3 48.2 28.5 19.7 63 189 11.11 177.8 66.2 28.3 37.9 45.0 25.8 19.2 64 166 10.90 174.4 58.0 29.0 29.0 39.2 28.3 10.9
Average.......................................................
65 100 8.00 128.5 33.9 14.8 19.1 17.1 13.0 4.1 66 82 8.00 128.5 32.2 15.0 17.2 27.2 15.0 12.2 67 90 8.00 128.5 29.5 12.9 16.6 20.1 15.0 5.1 68 92 8.00 128.5 38.5 15.4 23.1 22.3 16.9 5.4 69 89 8.00 128.5 40.0 19.5 20.5 23.1 15.8 7.3
Average.......................................................
127 136 9.57 142.2 55.5 37.4 18.1 33.1 22.2 10.9 128 104 7.69 114.3 39.7 26.2 13.5 42.4 19.7 22.7 129 138 11.01 163.6 51.4 29.9 21.5 38.0 30.7 7.3 130 80 6.53 97.0 34.5 20.6 13.9 22.4 25.5 0.0
Average........................................................
Results on corn protein (5 per cent of ration).
60 231 10.94 61 249 10.10 62 244 10.56 63 241 11.03
87.8 65.2 41.3 23.9 29.3 21.2 8.1 70 81.1 63.3 45.3 18.0 27.0 18.7 8.3 75 84.8 63.5 45.3 18.2 27.4 17.1 10.3 76 88.6 59.1 36.9 22.2 30.1 19.0 11.1 71
Average.. :. . . . . . . . . . . . . . . . . . . . . . . . . . . . . . . . . . . . . . . . . . . . . . . . . . . 73
65 108 5.54 44.5 28.2 15.3 12.9 10.8 9.4 1.4 70 66 88 5.60 45.0 26.8 16.9 9.9 11.3 11.3 0.0 78 67 98 4.67 37.5 22.9 14.0 8.9 9.4 9.7 0.0 76 68 96 4.97 39.9 27.2 15.5 11.7 12.1 11.9 0.2 70 69 96 6.83 54.8 33.2 20.8 12.4 15.4 14.6 0.8 77
Average.. . . . . . . . . . . . . . . . . . . . . . . . , . . . . . . . . . . . , . . . . , . . . . . . . . . . . 74
percent 82 84 80 76 82
81
81 85 86 81 83
83
86 85 86 86
86
by guest on May 25, 2018
http://ww
w.jbc.org/
Dow
nloaded from

H. H. Mitchell 895
testifies to the essential accuracy of the assumptions upon which it is based, prominent among which is the assumption that the endogenous catabolism of nitrogen is not affected by the ingestion of protein.
However, the endogenous catabolism of nitrogenous substances is apparently affected by other factors, in the same manner as the “metabolic nitrogen” of the feces. Thus, from the data
TABLE XJS’.
Excretion of Urinary Nitrogen on a Nitrogen-Free Ration.
Bat No. AW T
weight Average daily 0 rat. food intake. -
Total.
180 181 182 184 183
om. 154 166 169 157 162
5.55 6.65 7.17 8.11
ma. ml. 35.8 23.9 29.8 18.0 26.1 15.4 32.0 20.5 29.2 18.0
142 147 5.36 34.1 23.2 140 144 5.82 29.8 20.7 141 126 6.57 24.3 19.3 144 169 8.15 35.3 20.9 143 160 8.51 35.2 22.0
129 97 4.33 21.8 22.5 123 98 5.13 26.1 26.6 127 105 5.84 22.7 21.4 122 91 5.90 27.0 29.7 126 98 6.44 24.5 25.0 124 101 8.30 24.8 24.6
- kverage daily ercmtion of nitrogen
in the urine.
-
given in Table IV, it is evident that an increase in the intake of energy on a “nitrogen-free” ration will lower the excretion of urinary nitrogen provided the former intake is approximately equal to the maintenance requirement of the rat. That there is no general inverse correlation between intake of nitrogen- free food and excretion of urinary nitrogen, however, is indicated by the values obtained on three groups of rats-each group being under observation at the same time and weighing approximately the same. The data are tabulated in Table XIV, the rats in each
by guest on May 25, 2018
http://ww
w.jbc.org/
Dow
nloaded from
896 Biological Value of Proteins-Method
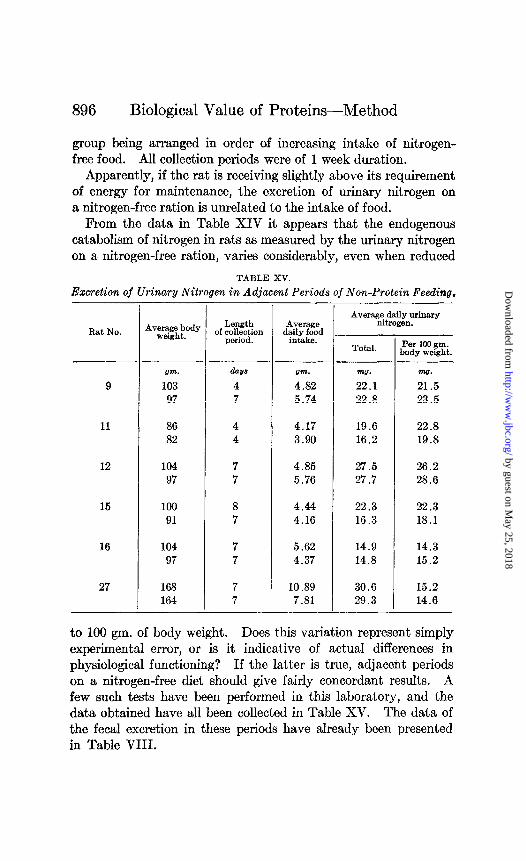
group being arranged in order of increasing intake of nitrogen- free food. All collection periods were of 1 week duration.
Apparently, if the rat is receiving slightly above its requirement of energy for maintenance, the excretion of urinary nitrogen on a nitrogen-free ration is unrelated to the intake of food.
From the data in Table XIV it appears that the endogenous catabolism of nit,rogen in raOs as measured by the urinary nitrogen on a nitrogen-free ration, varies considerably, even when reduced
TABLE XV.
Excretion of Urinary Nitrogen in Adjacent Periods of Non-Protein Feeding.
Rat No.
9
11
12
15
16
27
-
-- om.
103 97
kJs
4 7
86 4 4.17 82 4 3.90
104 97
7 7
4.85 5.76
loo 8 4.44 91 7 4.16
104 97
5.62 4.37
168 164
10.89 7.81
Length of collection
period.
-
-
-
Total.
mo.
22.1 22.8
19.6 16.2
27.5 27.7
22.3 16.3
14.9 14.8
30.6 29.3
Per 100 gm. body werght.
w.
21.5 23.5
22.8 19.8
26.2 28.6
22.3 18.1
14.3 15.2
15.2 14.6
to 100 gm. of body weight. Does this variation represent simply experimental error, or is it indicat,ive of actual differences in physiological functioning? If the latter is true, adjacent periods on a nitrogen-free diet should give fairly concordant results. A few such tests have been performed in this laboratory, and the data obtained have all been collected in Table XV. The data of the fecal excretion in these periods have already been presented in Table VIII.
by guest on May 25, 2018
http://ww
w.jbc.org/
Dow
nloaded from

H. H. Mitchell 897
The agreement among corresponding figures in the last column of Table XV seems as satisfactory in most cases as is ordinarily obtained in biological work. Certainly, the high level of endog- enous catabolism indicated by the values obtained with Rat 12 as compared with Rats 16 and 27 may be interpreted as a physio- logical fact, not an experimental aberration. Similarly, the dis- tinction between Rats 9, 11, and 15, and Rats 16 and 27 is shown.
TABLE XVI.
Results Indicating a Constamy in the Excretion of Endogenous Nitrogen in the Urhe in Adjacent Periods,
Rat No.
127
128
129
130
-
Average weight.
om.
105 103 106
82 79 79
97 97 99
63 60 60
Ration.
Non-protein. Milk protein.
‘I “
Non-protein. Milk protein.
“ I‘
Non-protein. Milk protein.
“ ‘I
Non-protein. Milk protein.
“ “
-
-
-
5.39 5.27 5.64
4.33 6.86 6.20
3.03 4.17 4.73
Average daily emre- tion of urinary
nitrogen.
Total. Per 100
gm. body weight.
m7. WT. ml.
4.6 22.7 21.4 66.9 22.8 22.1 67.9 24.5 23.1
4.3 18.4 22.4 44.0 20.2 25.6 47.1 20.3 25.7
3.4 21.8 22.5 57.3 20.4 21 .o 51.8 21.5 21.7
2.5 21.9 34.8 34.8 23.1 38.5 39.5 20.5 34.2
-
The results of an experiment demonstrating further the true significance of differences in the apparent endogenous catabolism of rats are given in Table XVI. The four rats in this experi- ment were first subjected to a period of non-protein feeding and then to two periods on a ration containing about 5 per cent of milk protein, which, according to all our experimental data, is, at this level, almost if not actually completely utilized in metabolism.
by guest on May 25, 2018
http://ww
w.jbc.org/
Dow
nloaded from

898 Biological Value of Proteins--Method
The figures in the last column of Table XVI are again fairly concordant, and in particular the comparatively high endogenous catabolism of Rat 130 in the period of non-protein feeding is abundantly substantiated by the results of the two subsequent periods.
While in adjacent periods of observation it seems justifiable to assume that the endogenous catabolism of nitrogenous constit-
TABLE XVII.
Excretion of Endogenous Nitrogen in the Urine in Periods Several Weeks Apart.
180 181 182 183 184
122 91 5.90 29.7 123 98 5.13 26.6 124 101 8.30 24.6 125 74 4.97 28.9 126 99 6.44 25.0 127 105 5.84 21.4 128 82 5.39 22.4 129 97 4.33 22.5 130 &3 3.03 34.8
Collection Period 1.
T AVW-
G$t
rat.
!Tm.
154 166 169 162 157
-
$)tp 1
intake .g
_ -
om.
3.78 5.55 6.65 8.11 7.17
iEg3: per loo m. bodJ weight.
Dail fooB
intake.
ma. gm. gm.
23.9 172 9.92 18.0 180 10.00 15.4 184 9.00 18.0 176 10.00 20.5 176 10.00
Collection Period 1. Collection Period 6. Collection Period 8.
Collection Period 6. Collection Period 12.
r II
d 7
-
-
%%dE” of rat.
mo. gm.
15.0 186 17.2 202 10.7 193 15.4 189 16.0 195
I 1 120 6.07 29.0 95 5.36 25.9
126 4.97 21 .o 73 3.96 23.4
-
1
.-
-
urinary Daily nitrogen food per loo
intake. gm. body weight.
--
r5
ma.
15.6 7.5 15.2 4.8 14.1 7.4 16.7 8.6 15.2
122 6.56 28.8 127 6.10 23.1 110 5.11 23.9 82 5.27 15.4
108 7.17 16.0
uents of the tissues remains constant, biologically speaking, and is commensurate with the excretion of urinary nitrogen on a nitrogen-free ration, there is abundant evidence that this type of metabolism varies in the course of more extended periods of time, similar to the basal metabolism of energy and possibly for the same reasons. The data collected in Table XVII indicate such changes.
by guest on May 25, 2018
http://ww
w.jbc.org/
Dow
nloaded from

H. H. Mitchell 899
The rats of the tit group (Nos. 180 to 184, Table XVII, in- clusive) were fed the same throughout the experiment. However, a lowering of the endogenous catabolism apparently occurred in some of the rats, particularly No. 184, while with the others, approximate constancy obtained. The values for Rat 180 in Period 1 and Rat 182 in Period 12, are possibly too high due to an insufficient food intake.
Occasionally, remarkable changes in the urinary output of nitrogen on a nitrogen-free ration occurred, well illustrated by the data for the second group of rats (Nos. 122 to 130 inclusive), also included in Table XVII. These rats were not all fed the same during the periods intervening between the periods con-
TABLE XVIII.
Biological Values Obtained during Periods of Protein Feeding.
Rat No. T 122 83 123 80
71 73
64 63
59 63
63 64
81 80
124 68 125 60 126 66
69 58 70
- _
-
59 56 61
37 31 34
73 56 70
127 101 128 95 129 101 130 90
102 94 96 88
100 85 94 86
-
-
-
34 22 31
86 85 86 86
2 3
Period.
4 6 -
_ 0 I
sidered in the table. The high endogenous catabolism of Rat 122 in Period 1 still persists to Period 8. With Rats 123 and 124 insignificant decreases seem to have occurred in this interval, while with Rats 125 and 126, marked decreases occurred. With the other four rats, two marked increases and one decrease in endogenous catabolism are indicated by the values in the table.
In determining whether the marked variations in endogenous catabolism, indicated for some of the rats in the latter group, are real or not, the consistency of the biological values for the proteins investigated during the intervening periods among those rats fed alike, should constitute good evidence one way or the other.
by guest on May 25, 2018
http://ww
w.jbc.org/
Dow
nloaded from

900 Biological Value of Proteins-Method
These values are listed in Table XVIII; those rats fed the same throughout being grouped together.
Rats 122 and 123 gave values throughout agreeing as closely BS could be expected. Rats 124 and 126 gave values agreeing very closely throughout, though the values for the former rat were computed on the assumption of a constant endogenous catabolism, and those of the latter rat on the assumption of a marked reduction from 25.0 to 16.0 mg. of nitrogen per 100 gm. of body weight. The values for Rat 125, were lower than those for the other two rats, indicating a markedly less efficient physio- logical utilization of protein. However, they were consistently lower, in spite of the fact that they were calculated on the assump- tion of a reduction in endogenous catabolism from 28.9 to 15.4 mg. of nitrogen per 100 gm. of body weight in 6 weeks. If such a reduction had not actually occurred, the computed biological values for Rat 125 would have been much lower as compared with those for Rat 124 during Periods 6 and 7 than during Periods 2 and 3. On the other hand, if the biological values in Period 7 are computed on the basis of the endogenous catabolism as measured in Period 1, the results would be 69, 74, and 73, instead of 68, 60, and 66. The former values indicate a superior effi- ciency of Rat 125 over the other two rats, quite contradictory to the results in Period 2. The evidence with these three rats seems to be a clear substantiation of the theory upon which the calculation of these biological values is based.
The biological values for the last four rats were obtained in four periods in which milk protein was fedat two levels, approxi- mately 5 per cent in Periods 2 and 3, and approximately 10 per cent in Periods 4 and 5. For the latter two periods good agree- ment exists among the values obtained with one exception; in the former periods the agreement was not so good, though with the smaller amounts of nitrogen contained in both food and excretions, greater variability among the resulting biological values is to be expected due to an accentuation of unavoidable experimental errors. Rats 127 and 129 in all but one period gave biological values agreeing well, though, in one case the as- sumption was that a marked increase in endogenous catabolism occurred from 21.4 to 29.0 mg. of nitrogen per 100 gm. of weight, while in the latter case a constant catabolism was assumed. Simi-
by guest on May 25, 2018
http://ww
w.jbc.org/
Dow
nloaded from

H. H. Mitchell 901
larly, Rats 128 and 130 gave values agreeing well throughout, though the assumptions involved a slight increase in one case and a marked decrease in the other in the endogenous catabolism. Recalculating the biological values of Period 5, using the values for the endogenous catabolism of nitrogen obtained in Period 1, gives the following results, respectively: 79, 82, 87, and 93.
In view of such variations in the intensity of those physiological processes involved in the degradation of nitrogenous constituents of the tissues, we have modified our experimental procedure in metabolism studies in rats, by inserting periods of non-protein feeding every 4 to 6 weeks throughout a series of studies on the biological value of proteins, and assuming, where the urinary nitrogen per unit of weight on nitrogen-free feeding varies signifi- cantly from one such period to the other, that in the intervening periods the endogenous catabolism varies in a regular fashion from week to week. It is also advisable not to use one group of rats for a very extended series of metabolism studies, since the conditions imposed seem to undermine the conditions of the rats as reflected in progressively diminishing appetite. Very probably the administration of a vitamin B preparation sepa- rately from the ration, as recommended by Osborne and Mendcl, would aid in maintaining a satisfactory food intake throughout a series of metabolism tests.
SUMMARY.
A method of measuring the biological value of protein is de- scribed and submitted to extensive investigation. The method is based upon nitrogen balance data obtained under definite experimental conditions, and involves direct determinations of the amount of nitrogen in the feces and in the urine and indirect determinations of the fractions of the fecal nitrogen and of the urinary nitrogen that were of diet,ary origin. The biological value of the protein is taken as the percentage of the absorbed nitrogen (nitrogen intake minus fecal nitrogen of dietary origin) that is not eliminated in the urine. This value is similar to that of Thomas though the reasoning upon which it is based seems more direct, and in particular does not involve the question of the precise significance of the so called “metabolic nitrogen” of the feces.
by guest on May 25, 2018
http://ww
w.jbc.org/
Dow
nloaded from

902 Biological Value of Proteins-Method
The experimental investigations, bearing on the validity of the method of calculation used, seem to justify the following con- clusions.
1. It is possible to secure reliable data on the nitrogenous metabolism of rats.
2. The “metabolic nitrogen” of the feces on a protein-contain- ing diet is related to the amount of food consumed, and may be measured by the total excretion of fecal nitrogen on a nitrogen- free diet. The latter may be used with the most confidence when the “roughage” content of the nitrogen-free diet approximates that of the protein-containing diet.
3. The excretion of nitrogen in the urine resulting from the catabolism of the tissues is not markedly depressed, if at all, by protein feeding. There seems to be a true basal catabolism of nitrogenous substances in the tissues, such that the amount of nitrogen of body origin excreted in the urine when an animal is on a protein-containing dietary may be satisfactorily measured by the total excretion of nitrogen in the urine in an adjacent period of feeding a nitrogen-free diet. While this endogenous catabolism of nitrogen does not seem to be affected by an influx of amino-acids from the intestinal tract, it may vary markedly in t,he course of a protracted series of metabolism experiments for unknown reasons, so that in such a series of experiments it is essential to redetermine the intensity of the endogenous catabo- lism by periods in which nitrogen-free diets are fed, if the most reliable biological values for protein are desired.
The biological value of the protein of a food applied to its con- tent of digestible protein has much the same significance as the coefficient of digestibility applied to the content of total protein. The latter operation gives the content of digestible protein in the food, and this muhiplied by the biological value and divided by 100 gives what the author has elsewhere termed (6) the net protein value of the food. Admittedly the net protein value of a food is not necessarily constant, any more than its content of digestible protein. There are many factors modifying the di- gestibility of the proteins of a food as well as the biological value of the digestible fraction, and the net protein content will be sub- ject to the influence of all such factors. The net protein con- ception, however, may prove to be of value in determining whether
by guest on May 25, 2018
http://ww
w.jbc.org/
Dow
nloaded from

H. H. Mitchell 903
a given ration or diet should satisfy a given protein requirement, or in compounding a ration or diet that should in the most satis- factory manner cover the protein requirement of an animal under specified conditions. In this respect it is entirely analogous to the net energy conception of Armsby, which has been of such great value in the expression of the actual energy value of farm feeds as related to the energy requirements of farm animals.
BIBLIOGFCAFHY.
1. Nevens, W. B., J. Dairy SC., 1921, iv, 552. 2. Martin, C. J., and Robison, R., Bioehem. J., 1922, xvi, 407. 3. hfitchell, H. H., Nevens, W. B., and Kendall, F. E., J. Biol. Chetn.,
1922, lii, 417. 4. Sherman, H. C., J. Biol. Chem., 1920, xii, 97. 5. Osborne, T. B., and Mendel, L. B., J. BioE. Chem., 1914, xvii, 328. 6. Mitchell, H. H., PTOC. Am. Sot. Animal Production, 1922; see &s
Mitchell, H. H., and Villegaa, V., J. Dairy SC., 1923, vi, 222.
by guest on May 25, 2018
http://ww
w.jbc.org/
Dow
nloaded from

H. H. MitchellBIOLOGICAL VALUE OF PROTEINA METHOD OF DETERMINING THE
1924, 58:873-903.J. Biol. Chem.
http://www.jbc.org/content/58/3/873.citation
Access the most updated version of this article at
Alerts:
When a correction for this article is posted•
When this article is cited•
alerts to choose from all of JBC's e-mailClick here
ml#ref-list-1
http://www.jbc.org/content/58/3/873.citation.full.htaccessed free atThis article cites 0 references, 0 of which can be
by guest on May 25, 2018
http://ww
w.jbc.org/
Dow
nloaded from