a method for evaluating climate change adaptation strategies for small-scale farmers using survey,...
Upload: ccafs-cgiar-program-climate-change-agriculture-and-food-security
Post on 21-Jul-2015
2.021 views
TRANSCRIPT
A Method for Evaluating Climate Change Adaptation Strategies for Small-Scale Farmers Using Survey, Experimental and Modeled Data
L. Claessens1,2,*, J.M. Antle3, J.J. Stoorvogel2, R.O. Valdivia3, P.K. Thornton4, M. Herrero4 1ICRISAT, 2Wageningen University, 3Oregon State University, 4ILRI
* ICRISAT, Nairobi, Kenya, [email protected] Systems 111 (2012) 85–95
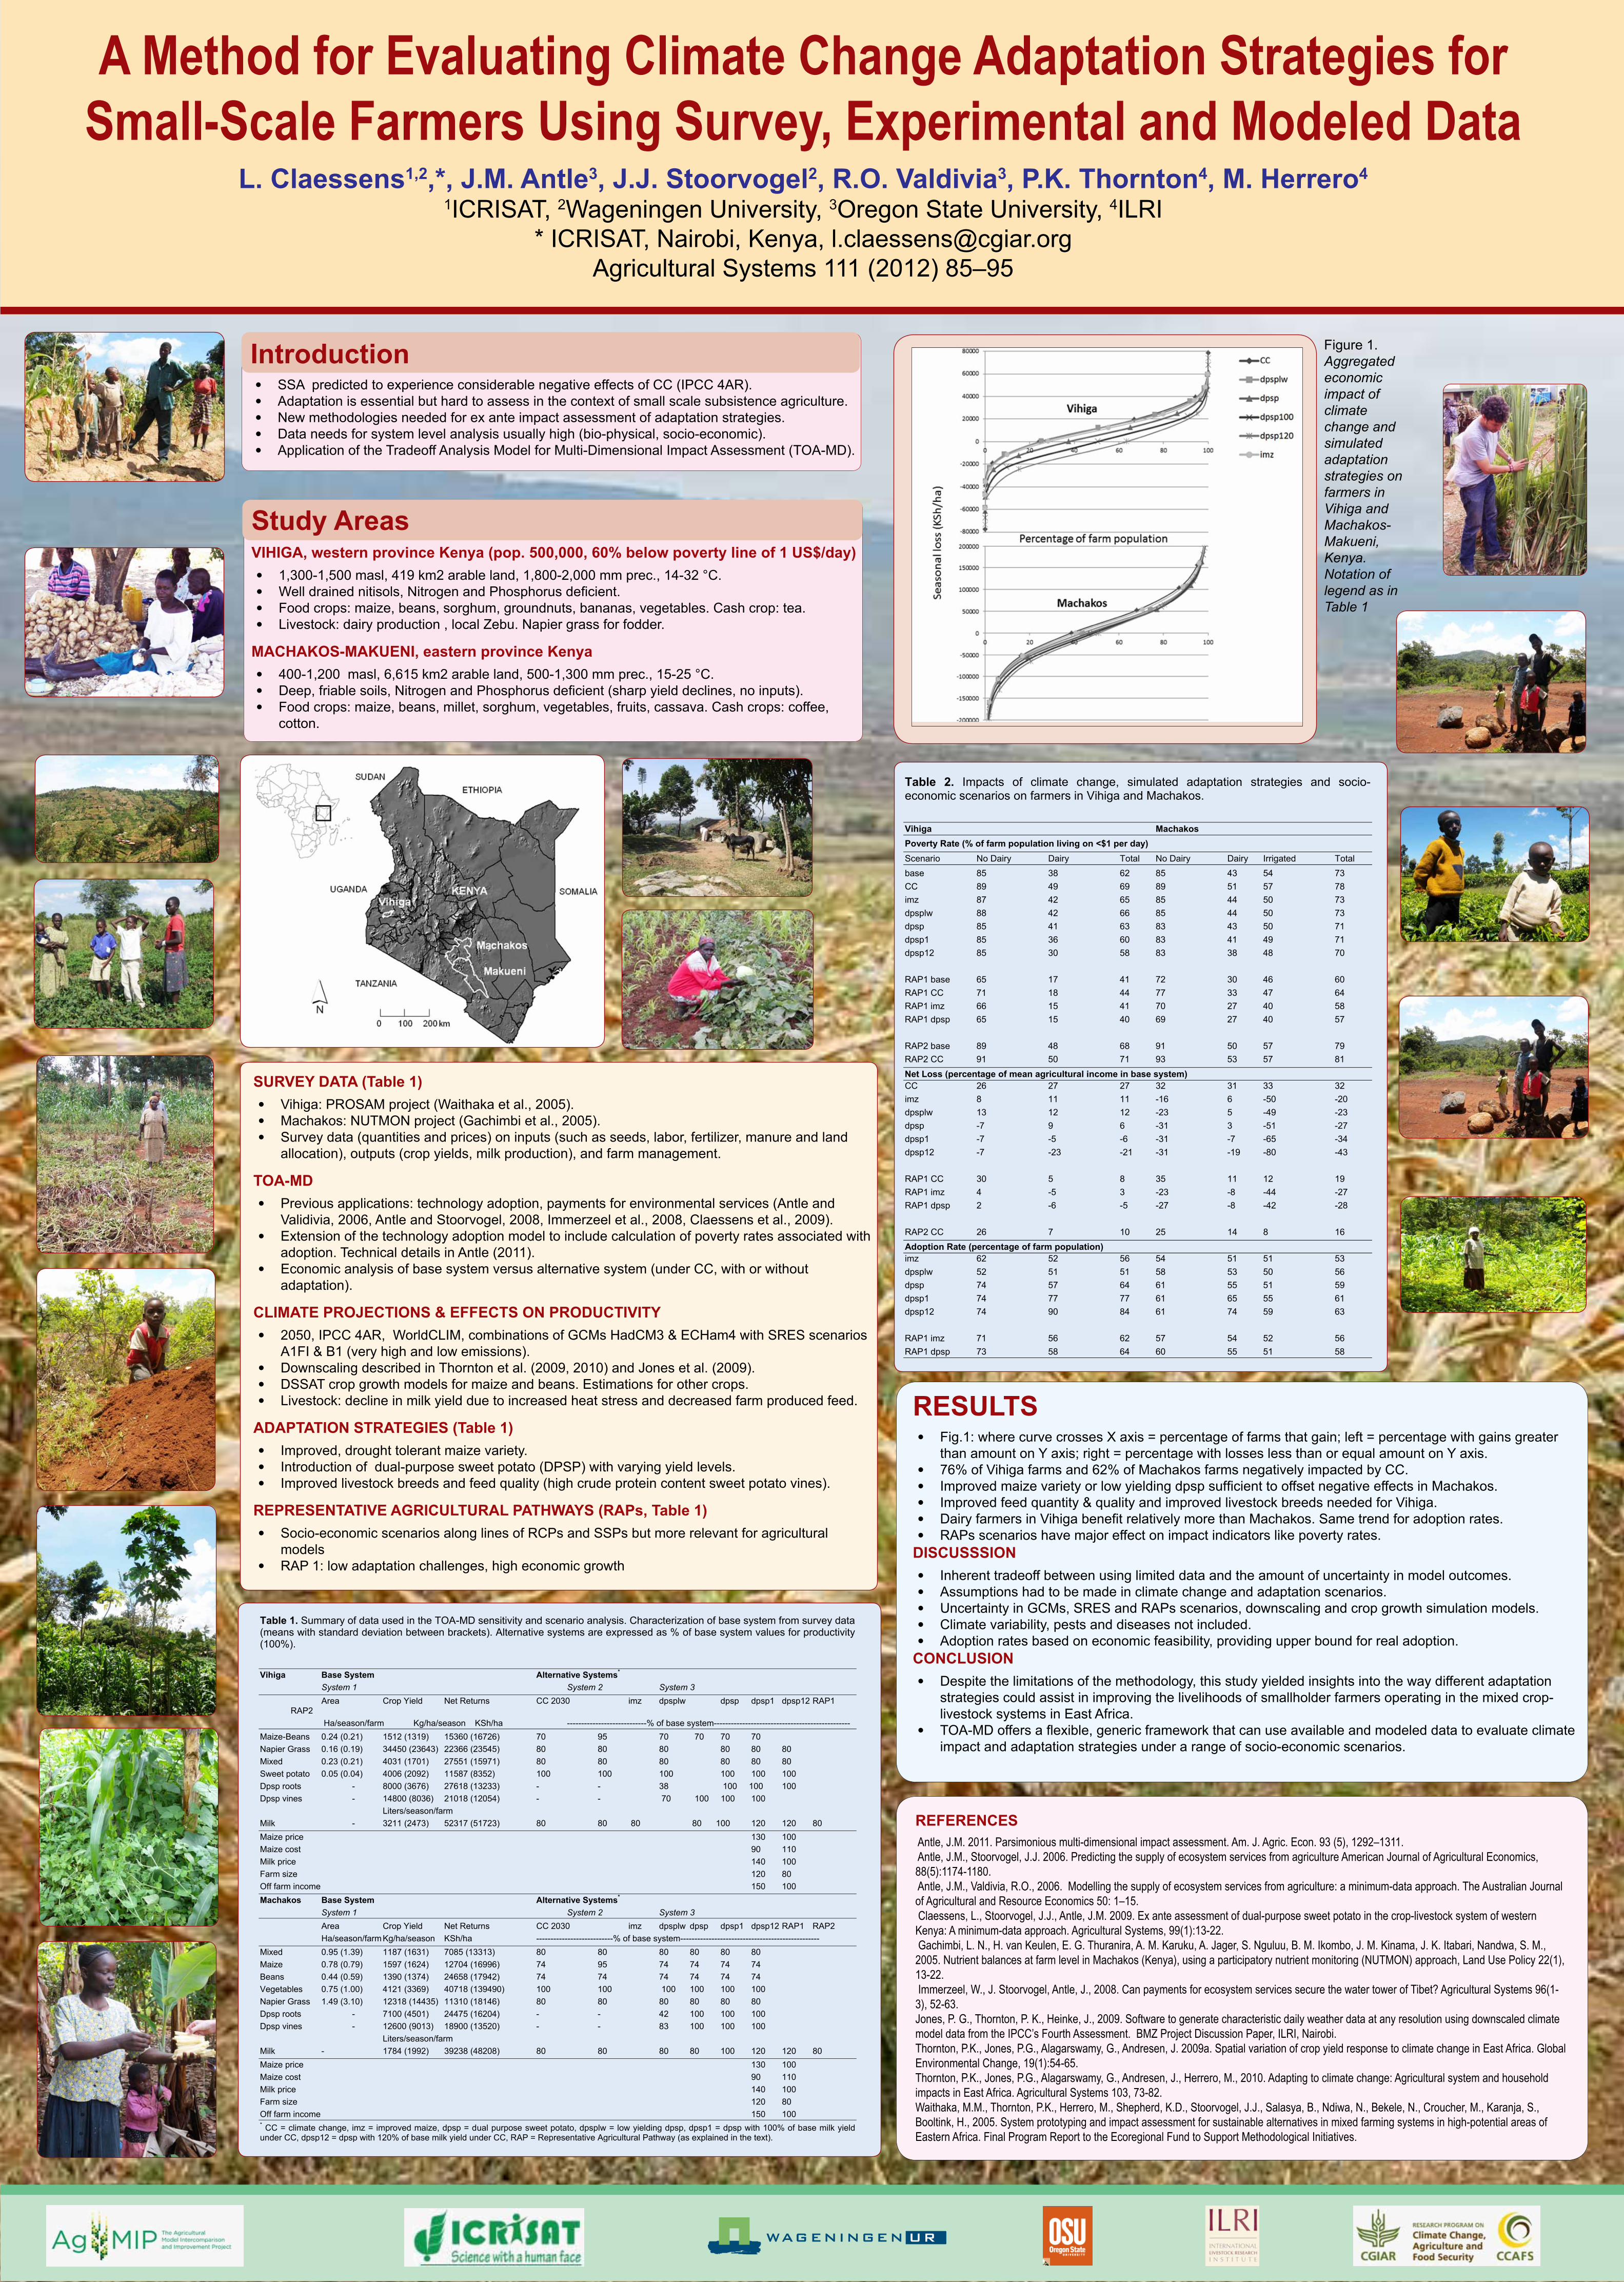
RESULTS • Fig.1: where curve crosses X axis = percentage of farms that gain; left = percentage with gains greater
than amount on Y axis; right = percentage with losses less than or equal amount on Y axis. • 76% of Vihiga farms and 62% of Machakos farms negatively impacted by CC. • Improved maize variety or low yielding dpsp sufficient to offset negative effects in Machakos. • Improved feed quantity & quality and improved livestock breeds needed for Vihiga. • Dairy farmers in Vihiga benefit relatively more than Machakos. Same trend for adoption rates. • RAPs scenarios have major effect on impact indicators like poverty rates.DISCUSSSION • Inherent tradeoff between using limited data and the amount of uncertainty in model outcomes. • Assumptions had to be made in climate change and adaptation scenarios. • Uncertainty in GCMs, SRES and RAPs scenarios, downscaling and crop growth simulation models. • Climate variability, pests and diseases not included. • Adoption rates based on economic feasibility, providing upper bound for real adoption.CONCLUSION • Despite the limitations of the methodology, this study yielded insights into the way different adaptation
strategies could assist in improving the livelihoods of smallholder farmers operating in the mixed crop-livestock systems in East Africa.
• TOA-MD offers a flexible, generic framework that can use available and modeled data to evaluate climate impact and adaptation strategies under a range of socio-economic scenarios.
Introduction • SSA predicted to experience considerable negative effects of CC (IPCC 4AR). • Adaptation is essential but hard to assess in the context of small scale subsistence agriculture. • New methodologies needed for ex ante impact assessment of adaptation strategies. • Data needs for system level analysis usually high (bio-physical, socio-economic). • Application of the Tradeoff Analysis Model for Multi-Dimensional Impact Assessment (TOA-MD).
Study AreasVIHIGA, western province Kenya (pop. 500,000, 60% below poverty line of 1 US$/day) • 1,300-1,500 masl, 419 km2 arable land, 1,800-2,000 mm prec., 14-32 °C. • Well drained nitisols, Nitrogen and Phosphorus deficient. • Food crops: maize, beans, sorghum, groundnuts, bananas, vegetables. Cash crop: tea. • Livestock: dairy production , local Zebu. Napier grass for fodder.
MACHAKOS-MAKUENI, eastern province Kenya • 400-1,200 masl, 6,615 km2 arable land, 500-1,300 mm prec., 15-25 °C. • Deep, friable soils, Nitrogen and Phosphorus deficient (sharp yield declines, no inputs). • Food crops: maize, beans, millet, sorghum, vegetables, fruits, cassava. Cash crops: coffee,
cotton.
SURVEY DATA (Table 1) • Vihiga: PROSAM project (Waithaka et al., 2005). • Machakos: NUTMON project (Gachimbi et al., 2005). • Survey data (quantities and prices) on inputs (such as seeds, labor, fertilizer, manure and land
allocation), outputs (crop yields, milk production), and farm management.
TOA-MD • Previous applications: technology adoption, payments for environmental services (Antle and
Validivia, 2006, Antle and Stoorvogel, 2008, Immerzeel et al., 2008, Claessens et al., 2009). • Extension of the technology adoption model to include calculation of poverty rates associated with
adoption. Technical details in Antle (2011). • Economic analysis of base system versus alternative system (under CC, with or without
adaptation).
CLIMATE PROJECTIONS & EFFECTS ON PRODUCTIVITY • 2050, IPCC 4AR, WorldCLIM, combinations of GCMs HadCM3 & ECHam4 with SRES scenarios
A1FI & B1 (very high and low emissions). • Downscaling described in Thornton et al. (2009, 2010) and Jones et al. (2009). • DSSAT crop growth models for maize and beans. Estimations for other crops. • Livestock: decline in milk yield due to increased heat stress and decreased farm produced feed.
ADAPTATION STRATEGIES (Table 1) • Improved, drought tolerant maize variety. • Introduction of dual-purpose sweet potato (DPSP) with varying yield levels. • Improved livestock breeds and feed quality (high crude protein content sweet potato vines).
REPRESENTATIVE AGRICULTURAL PATHWAYS (RAPs, Table 1) • Socio-economic scenarios along lines of RCPs and SSPs but more relevant for agricultural
models • RAP 1: low adaptation challenges, high economic growth
REFERENCES Antle, J.M. 2011. Parsimonious multi-dimensional impact assessment. Am. J. Agric. Econ. 93 (5), 1292–1311. Antle, J.M., Stoorvogel, J.J. 2006. Predicting the supply of ecosystem services from agriculture American Journal of Agricultural Economics, 88(5):1174-1180. Antle, J.M., Valdivia, R.O., 2006. Modelling the supply of ecosystem services from agriculture: a minimum-data approach. The Australian Journal of Agricultural and Resource Economics 50: 1–15. Claessens, L., Stoorvogel, J.J., Antle, J.M. 2009. Ex ante assessment of dual-purpose sweet potato in the crop-livestock system of western Kenya: A minimum-data approach. Agricultural Systems, 99(1):13-22. Gachimbi, L. N., H. van Keulen, E. G. Thuranira, A. M. Karuku, A. Jager, S. Nguluu, B. M. Ikombo, J. M. Kinama, J. K. Itabari, Nandwa, S. M., 2005. Nutrient balances at farm level in Machakos (Kenya), using a participatory nutrient monitoring (NUTMON) approach, Land Use Policy 22(1), 13-22. Immerzeel, W., J. Stoorvogel, Antle, J., 2008. Can payments for ecosystem services secure the water tower of Tibet? Agricultural Systems 96(1-3), 52-63.Jones, P. G., Thornton, P. K., Heinke, J., 2009. Software to generate characteristic daily weather data at any resolution using downscaled climate model data from the IPCC’s Fourth Assessment. BMZ Project Discussion Paper, ILRI, Nairobi.Thornton, P.K., Jones, P.G., Alagarswamy, G., Andresen, J. 2009a. Spatial variation of crop yield response to climate change in East Africa. Global Environmental Change, 19(1):54-65.Thornton, P.K., Jones, P.G., Alagarswamy, G., Andresen, J., Herrero, M., 2010. Adapting to climate change: Agricultural system and household impacts in East Africa. Agricultural Systems 103, 73-82.Waithaka, M.M., Thornton, P.K., Herrero, M., Shepherd, K.D., Stoorvogel, J.J., Salasya, B., Ndiwa, N., Bekele, N., Croucher, M., Karanja, S., Booltink, H., 2005. System prototyping and impact assessment for sustainable alternatives in mixed farming systems in high-potential areas of Eastern Africa. Final Program Report to the Ecoregional Fund to Support Methodological Initiatives.
Figure 1. Aggregated economic impact of climate change and simulated adaptation strategies on farmers in Vihiga and Machakos-Makueni, Kenya. Notation of legend as in Table 1
Table 2. Impacts of climate change, simulated adaptation strategies and socio-economic scenarios on farmers in Vihiga and Machakos. Vihiga Machakos Poverty Rate (% of farm population living on <$1 per day) Scenario No Dairy Dairy Total No Dairy Dairy Irrigated Total base 85 38 62 85 43 54 73 CC 89 49 69 89 51 57 78 imz 87 42 65 85 44 50 73 dpsplw 88 42 66 85 44 50 73 dpsp 85 41 63 83 43 50 71 dpsp1 85 36 60 83 41 49 71 dpsp12 85 30 58 83 38 48 70 RAP1 base 65 17 41 72 30 46 60 RAP1 CC 71 18 44 77 33 47 64 RAP1 imz 66 15 41 70 27 40 58 RAP1 dpsp 65 15 40 69 27 40 57 RAP2 base 89 48 68 91 50 57 79 RAP2 CC 91 50 71 93 53 57 81 Net Loss (percentage of mean agricultural income in base system) CC 26 27 27 32 31 33 32 imz 8 11 11 -16 6 -50 -20 dpsplw 13 12 12 -23 5 -49 -23 dpsp -7 9 6 -31 3 -51 -27 dpsp1 -7 -5 -6 -31 -7 -65 -34 dpsp12 -7 -23 -21 -31 -19 -80 -43 RAP1 CC 30 5 8 35 11 12 19 RAP1 imz 4 -5 3 -23 -8 -44 -27 RAP1 dpsp 2 -6 -5 -27 -8 -42 -28 RAP2 CC 26 7 10 25 14 8 16 Adoption Rate (percentage of farm population) imz 62 52 56 54 51 51 53 dpsplw 52 51 51 58 53 50 56 dpsp 74 57 64 61 55 51 59 dpsp1 74 77 77 61 65 55 61 dpsp12 74 90 84 61 74 59 63 RAP1 imz 71 56 62 57 54 52 56 RAP1 dpsp 73 58 64 60 55 51 58