a methcd of dethmning nhhhjscular. eddqc h w o pe sa...
TRANSCRIPT

A method of determining neuromuscularblock in the operating room
Item Type text; Thesis-Reproduction (electronic)
Authors Ham, Robert Eli
Publisher The University of Arizona.
Rights Copyright © is held by the author. Digital access to this materialis made possible by the University Libraries, University of Arizona.Further transmission, reproduction or presentation (such aspublic display or performance) of protected items is prohibitedexcept with permission of the author.
Download date 21/05/2018 18:53:58
Link to Item http://hdl.handle.net/10150/557919

A METHCD OF DETHmNING NHHHJSCULAR.
EDDQC H W O P E SA Z ^ -
; by ,
Robert Ham j r .
A Thesis Submitt ed to the Faculty o f the
DEPAKIMEOT OF ELECmCAL EKGINEmNG
In Partial Fulfillm ent of the Requirements For the Degree o f
MASTER OF SCIEMZE
In the Graduate College
THE UNIVERSITY CF mZONA
1 9 7 9
SmTB^ENT BY AUIHOR
This thesis has been submitted in p a r tia l fu lfillm ent of re - qu iranen tsfo r an advanced degree a t The University of Arizona and is deposited in the University Library to be made available to borrowers under ru les of the Library.
Brief quotations ifrcm th is thesis are allowable without special permission, provided tha t accurate acknowledgment of source is made. Requests for permission for extended quotation from or reproduction of th is manuscript in whole or in part may be granted by the head of the major department or the Dean of the Graduate College when in h is judgment the proposed use of the m aterial is in the in te rests of scholarship. In a l l other instances, however j permission must be obtained from the author.
SIGNED: ' 9 ^ —
APPROVAL BY THESIS DIRECTOR V
This thesis has been approved on the date shown below:
W / T 7 ?-T — — - '
Kenneth C. Mylrea DateAssociate Professor
E lec trica l Engineering

PREFACE
The purpose of th is study was to complete the graduate require
ments for a Master of Science degree in E lec trica l Engineering with
special enphasis in C linical Engineering.
The thesis involved fabrication and testing of a device for
use in the operating room with the in ten t to measure the re la tiv e amount
of neuromuscular block in anesthetized patien ts. While the c lin ica l
resu lts are important the deta ils pertaining to the design and fab ri
cation of the device needed to obtain these resu lts are likewise impor
tan t. However, since th is thesis was w ritten for publication as a
short a r tic le , many of those deta ils have been in ten tionally emitted.
My thanks go to Dr. Kenneth Mylrea, Dr. Lawrence Adler, and
Warren R. Jewett for th e ir time and patience in helping me, with th is
th e s is . Many thanks also for those a t Motorola Government Electronics
Division who helped design and build the transducer. My appreciation
goes to Larry Tang for the technical drawings he made of the transducer
and to Dr. C.D. B litt for allowing me to use his equipment during the
clin ica l te s ts .

TABLE OF CONTENTS
: Page
LEST OF ILLUSTRATiCES . . . . . . . . . . . . . . . . . . . . . v
LIST OF TABLES . . . . . . . . . . . . .. . . . . ... . ... . . . v i i
: ABSTEACT . ..... . . .. . . . . . . . . . ....... . . .vili3NIRCBUCTICN . . . . . . . . . . . . . . . . . ....................... 1
THE TRANSDUCER . . . . . . . . . . . . . ........................... . 4
SIGNAL PROCESSING' . . . . . ... . . . . . . . . . . . . . . . . 9
INSTRUMENT OPERATION . . . . . . . . . . . . . . . . . . . . 15
RESULTS AND DISCUSSION ............... ... . 18
laboratory Data . . . . , . . . . . . . . . . . . . . . 32
SUMMARY AND CONCLUSIONS . . . . . . . . . . . . . . . . . , . . 42
REFERENCES . . . . . . . . . . . . . . . . . . . : . . . . . . 44
iv

LIST ' OF ILLUSTRATIONS
F ig u r e Page
1. The Transducer > . . . , . . . . . . . . . . . . 6
2. The T ransducer in th e Hand . . . . . . . . . . . 8
3. B lock Diagram o f th e S ig n a l P ro c e ss in g U n i t . . . 1 0
4. C i r c u i t Diagram o f th e S ig n a l P ro c e ss in g U n it. . 12
5. Component Layout o f th e D em odulator-S tim ulusD e te c to r Board . . . . . , . . . . . . . . . 13
6. Component Layout o f th e Main S ig n a l P ro c e ss in gBoard . . . . . . . . . . . . . . . . . . . 14
7. F ro n t P anel C o n tro ls o f th e S ig n a l P ro c e ss in g-' Un L . . . . . ■. ■ . . . # . . . . . . . 6
8. P a t ie n t 1: Recorded re sp o n se s to tw itc h s t im u la t io n s d u rin g p e r io d s o f r e l a l a x t i o n and re c o v e ry . P u lse am p litu d es and in s tru m e n t
, re a d in g s a r e shown in T ab le 1 . . . . . . 19
9. P a t ie n t 2: S am ple-recorded re sp o n se s to t e t a n i cS tim u la tio n s d u rin g p e r io d s o f c o n t r o l , r e la x a t io n , and re c o v e ry . . . . . . . . . . 22
10. P a t ie n t 4: Example re c o rd in g s d em o n stra tin g th esy stem ’ s i n a b i l i t y to re c o rd th e o b serv edfad e w ith th e r e la x a n t d - tu b o c u ra r in e . 25
11. P a t ie n t 5: Example re c o rd in g showing th e la c k o ffa d e w ith th e r e la x a n t Pancuronium . . . . . 26
12. P a t ie n t 6: Example re c o rd in g d em o n stra tin g fad ew ith th e r e la x a n t Pancuronium . . . . . . . 28
13. P a t ie n t 6: Example re c o rd in g d em o n stra tin gs a tu r a t io n o f th e e le c t r o n ic s as seen on th e c h a r t re c o rd e r . . . . . . . . . . . . . . . 29
v
v i
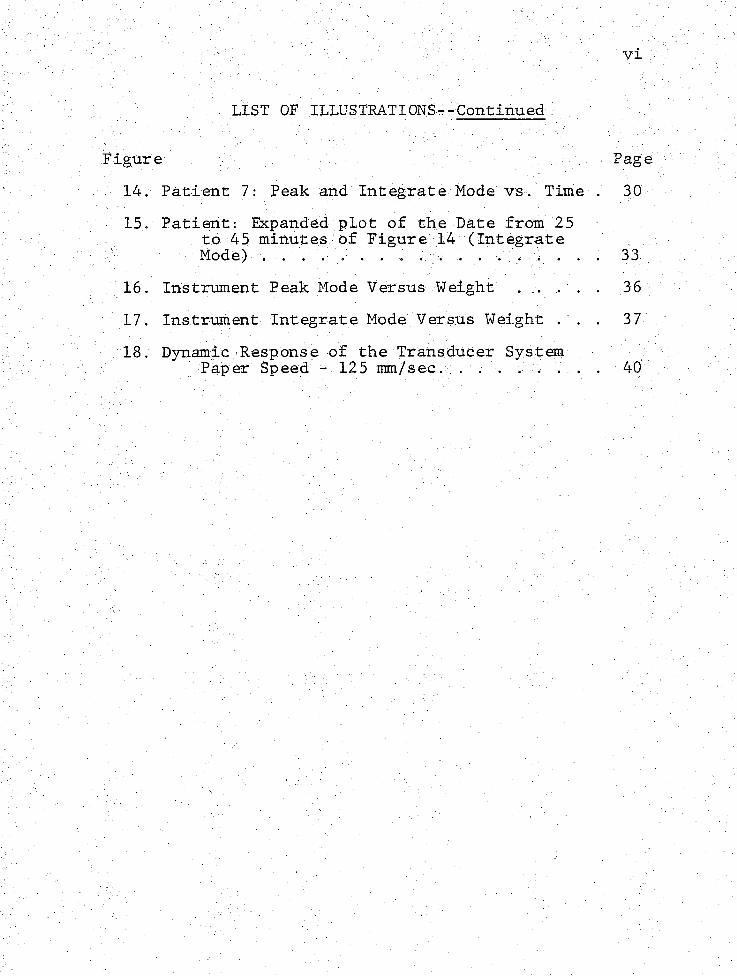
LIST OF ILLUSTRATIONS--C ontinued
F ig u re :Page '
. 14. P a t ie n t 7: Peak and I n te g r a te Mode v s . Time . 30
15. P a t ie n t : Expanded p lo t o f th e D ate from 25to 45 m in u tes o f F ig u re . 14 ( I n te g r a te
\ Mode) . . . . . . . ' . .. . .. 33
16. In s tru m en t Peak Mode V ersus W eight . .. .. . . 36
17. In s tru m en t I n te g r a te Mode V ersus W eight . , . 37
18. Dynamic R esponse o f th e T ransducer SysteinP aper Speed - 125 mm/sec. . . . . y y . . 40

UST CF TABLES
Table Page
-1 ; Patient 1: C linical Data in the Peak Mode . . .. . . . . . 20
2. Patient 2: C linical Data in the Integrate Mode . . . . . . 24
3 . Patient 7 : C linical Data in Both the In t^ r a te andPeak Modes. fo r Figures 14 and 15 . . . . . . . . . . 31
. 4. P a tio it 7: C linical Data for the Time 24 and 45 Minutes . ; 33
5. Data fftm laboratory A , . . . , . . . . . . , . . -35
6.. Data f fm Laboratory T ^ ts . '. . :. . . . . . . . . . . . 39
7. Hysteresis Data Obtained in the laboratory . . . . . , ... 39
ABSTRACT
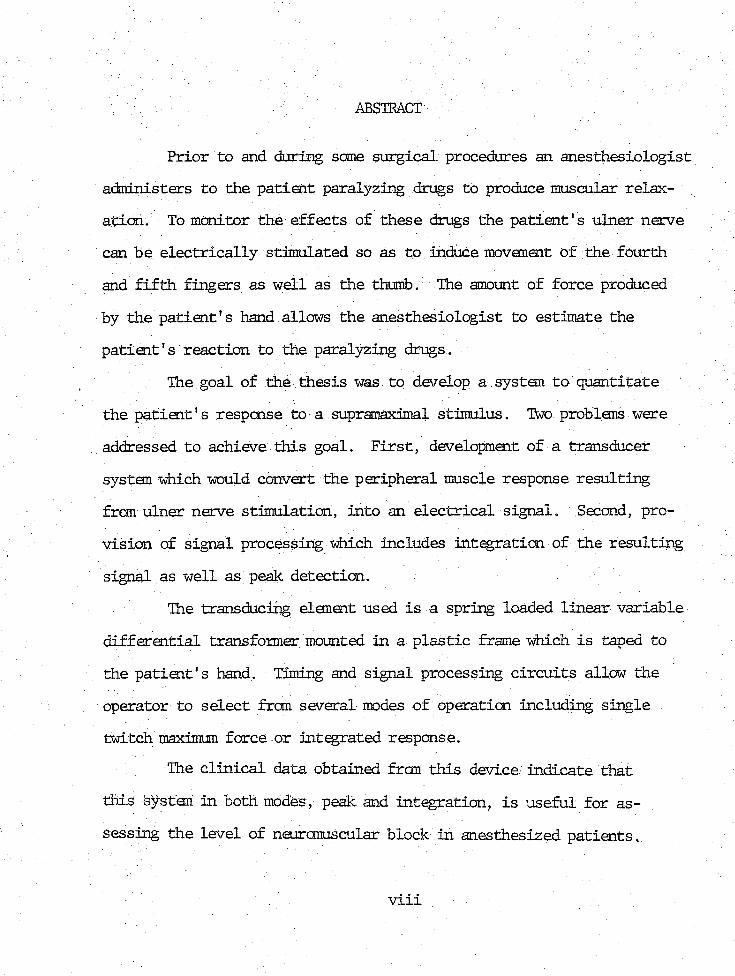
Prior to and during sane surgical procedures an anesthesiologist
administers to the patien t paralyzing drugs to produce muscular relax
ation. To monitor the effects of these drugs the p a tie n t 's ulner nerve
Can be e lec tric a lly stimulated so as to induce movement of the fourth
and f i f th fingers as well as the thumb. The amount of force produced
by the p a tie n t 's hand allows the anesthesiologist to estimate the
p a tie n t 's reaction to the paralyzing drugs.
The goal of the thesis was.to develop a systan to quantita te
the p a tien t' s response to a supramaximal stimulus. Two problens were
addressed to achieve th is goal. F irs t, development of a transducer
system which would convert the peripheral xnuscle response resulting
from ulner nerve stimulation, into an e lec tric a l signal. Second, pro
v ision of signal processing which includes in tegration of the resu lting
signal as well as peak detection.
The transducing element used is a spring loaded lin ear variable
d iffe ren tia l transformer mounted in a p la s tic frame mhich is taped to
the p a tien t 's hand. Timing and signal processing c ircu its allow the
operator to se lect from several modes of operation including single
twitch maximum force or integrated response.
The c lin ic a l data obtained from th is device indicate tha t
th is h^steii in both modes, peak and integration, i s useful for as
sessing the level of neuromuscular block in anesthesized p a tien ts ,
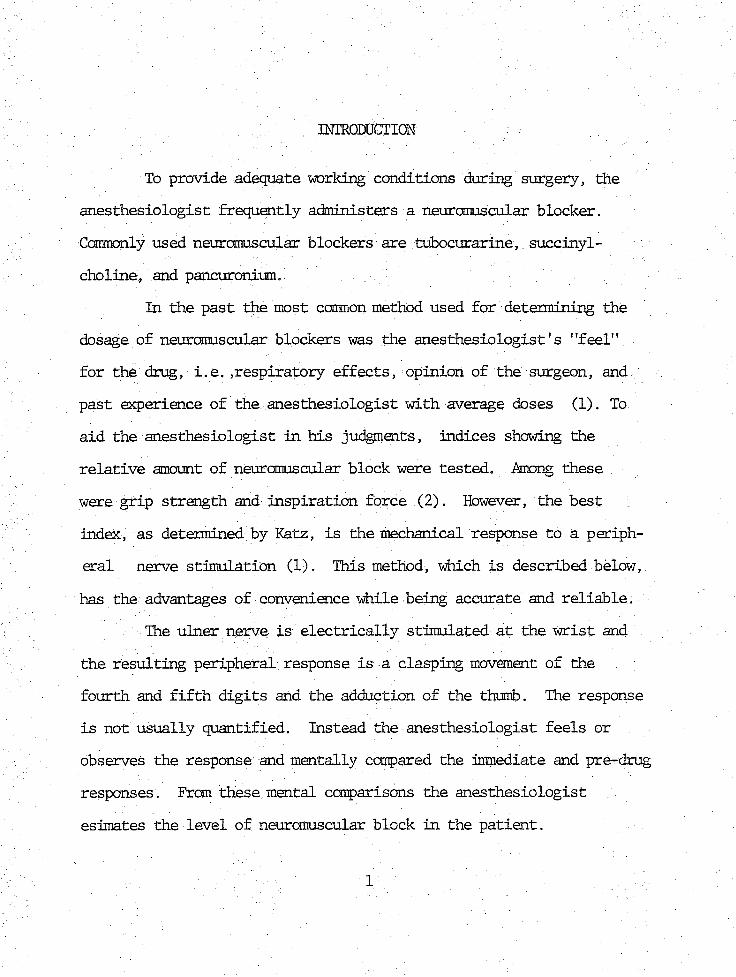
INTRODUCTION
To provide adequate working conditions during surgery, the
anesthesiologist frequently administers a neuromuscular blocker.
Ccranonly used neuromuscular blockers are tubocurarine, succinyl-
cboline^ and pancurcnium.
In the past the most cannon method used for determining the
dosage of neuromuscular blockers was the anesthesio logist' s "feel"
for the drug, i .e . ,resp iratory effects, opinion of the surgeon, and
past experience of the anesthesiologist with average doses (1). To
aid the anesthesiologist in h is judgmmts , indices showing the
re la tiv e amount of neuromuscular block were tested . . Among these
were grip strength and inspiration force (2). However, the best
index, as determined by Katz, i s the; mechanical response to a periph
eral nerve stimulation (1). This method, which is described below,
has the advantages of convenience while being accurate and re liab le .
The ulner nerve is e lec tric a lly stimulated a t the w rist and
the resulting peripheral; response is a clasping movement of the
fourth and f i f th d ig its and the adduction of the thumb. The response
is not usually quantified. Instead the anesthesiologist feels or
observes the response and mentally compared the immediate and pre-drug
responses. From these mental comparisons the anesthesiologist
esimates the level of neuromuscular block in the p a tie n t.

' - v / ; - .. 2Depending on the type of drug one can expect certa in "normal"
responses to the ulner nerve stimulus. The two. drugs/which were
studied in th is paper are succinylcholine and pancuronium. Although
th e ir responses to a twitch stimulus are sim ilar (a dose-related ;
depression), they compare. d ifferen tly when a te tan ic stimulus is applied.
The te tan ic stimulus causes the hand to close in a manner
characte ristic of the drug given. I f the drug is pancuronium or tubo-
curarine (non-depolarizer) a phenomena known as fade w ill occur, i .e .,
the hand w ill not be able to maintain the clasping force and w ill
relax even though the stimulus may s t i l l be present. The response
with succinylcholine, a depolizer, does not induce fade.
Thus the anesthesiologist, when using a non-depolarizer drug
such as pancuronium or tubocurarine, has another variable to observe,
i . e . ,the fade response. I f we integrated the area under the force
time curve created by the clasping hand the fade response could be
accurately measured.
There is a need for accurate quantitative measurements. Part
of th is need stems from the increasing emphasis on precise documenta
tion during operations. A system that would give to the anesthesiol
ogist recordable information as to the amount of muscular response to
a given stimulus would provide the anesthesiologist with accurate
information concerning the s ta te of the patien t.
Several systens have been developed to sa tisfy th is need
(1-6) . In most cases a s tra in gauge transducer was used and measure
ments of peak response, to single stim uli were recorded e ith er on a

chart recorder or d ig ita lly displayed. Early systems involved only a
s tra in gauge taped to the hand of a volunteer (3). Cantilever systems
using the Grass* FT-03 and .FT-10 s tra in gauge transducer were used by
A li and Katz (5), Watts and Dillon (6) and others. A li in 1970 (4)
made use of a tensile/compressive load transducer. A li, in 1976. (2),
designed a signal processing u n it which aided in in terpreting resu lts
from a series of four single twitch stimulations applied to the ulner
nerve a t a frequency of 2 Hz. This technique compares the f i r s t re
sponse to the subsequent ones from the tra in of four stim uli.
This paper: describes an instrument for measuring the force .
produced by the thumb in response to ulner nerve stimulation. A
spring loaded linear variable d iffe ren tia l transformer (LVDT) system
transduces th is force into an e lec tric a l signal. This signal is then
processed in e ither a peak detector c irc u it or an in tegrator c irc u it !
and the re su lt is displayed on a d ig ita l panel meter.
The design of the transducer and signal processing systan
provides certain f le x ib i l i t ie s so tha t a varie ty of force ranges
encountered can be accommodated. These f le x ib i l i t ie s include the
transducer's spring constant and the in terval of in tegration in the
signal processor.
* Grass Instrument Qmpany, C^nricy, Mass . ;

THE TRANSDUCER
Design of a neuromuscular block measurenent systan requires
careful consideration of the lim itations of the operating roan environ
ment. . In a typical surg ical, su ite the anesthesiologist is located a t
the head of the p a tie n t. The arm to be stimulated is ideally la id out
perpendicular to the p a tien t' s body on an arm extension board from the
operating ta b le . Thus the hand's response to an ulner nerve stimulus
is easily observed by the anesthesiologist. However, in some surgical
procedures the arms are la id p a ra lle l to the body or in seme other
skewed fashion such th a t the anesthesiologist cannot read ily determine
the muscular response to stimulation. There may be other cases there
; the free movement of the fingers is inhibited. These lim itations
indicate tha t the transducer should measure force from the responsive
fingers with as l i t t l e displacement as possible. Additionally, the
transducer u n it should be Small, lightweight and easy to apply.
Of the varie ty of transduction techniques available such as
capacitance pickups, FVC tubing, and pressure tran sis to rs , two were
deemed acceptable. They are the s tra in gauges and the linear variable
d iffe ren tia l transformer (LVDI). Although the s tra in gauge has been
used successfully (1-6), the spring loaded LVDT systen developed for
th is thesis has advantages over the s tra in gauge systems.
4

The spring loaded EVDT transducer systen is an easy to apply
in a c lin ic a l se ttin g as currently used s tra in gauge u n i ts . Both can
work in the operating room environment and ensure complete pa tien t
safety. However, .the; LVDT is not inherently temperature sensitive as .
are. s tra in gauges and the signal output of the LVDT is la rger than
th a t from the s tra in gauge. Thus,, tenperature compensation and ad
d itio n a l amplifying c irc u its a re not required fo r the LVDT. Also
the s tra in gauge is subject to breakage by overranging, the transducer .
systen, a condition which can easily occur w ith . large muscular
p a tie n ts . ' The. LVDT is not subj ect to breakage: under these circumstances.
The c r i te r ia considered fo r the selection of a sp e c if ic : LVDT
was size, lin ear range, output signal, and cost. I t s size was to be
a maximum of two inches in ' length, the lin ea r range was to be . between.
0.05: and 0.1 inches, and cost under $50. Schaevitz1 s* Model 50HR LVDT
meets these requirenents as w ell as providing a re la tiv e ly large
se n s itiv ity of 6,3 my/0.001 in ./v o l t • in p u t.... Other specifications o f
the 50HR are a body length of 1.13 inches, a lin ear range of. -HD.05
inches, and a cost of $32 in single u n it quantity.
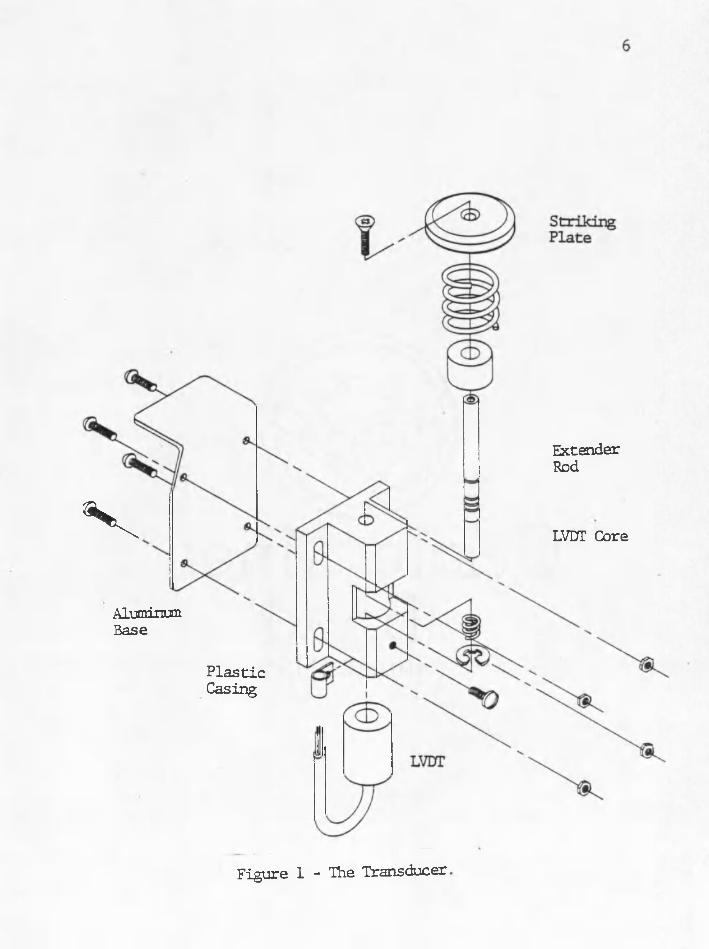
The transducer systen is made up of several "different parts .'
a l l of which ac t in the transduction of minimal thumb movement into
signal output (Figure 1). The thumb re s ts upon the strik in g p la te .
Connected to th is p la te is an extender rod which is connected to the
LVDT core. The LVDT body and core are ,held i n .l in e by a p la s tic casing.
This casing was,specially'made to assure:.easy and consistent core
trave l through the body. Two opposing springs are positioned to center
* :Schaevitz Engineering, Pennsauken, New Jersey.
ExtenderRodv LVUT Core
P las ticCasing
AluminumBase
Figure 1 - The Transducer,
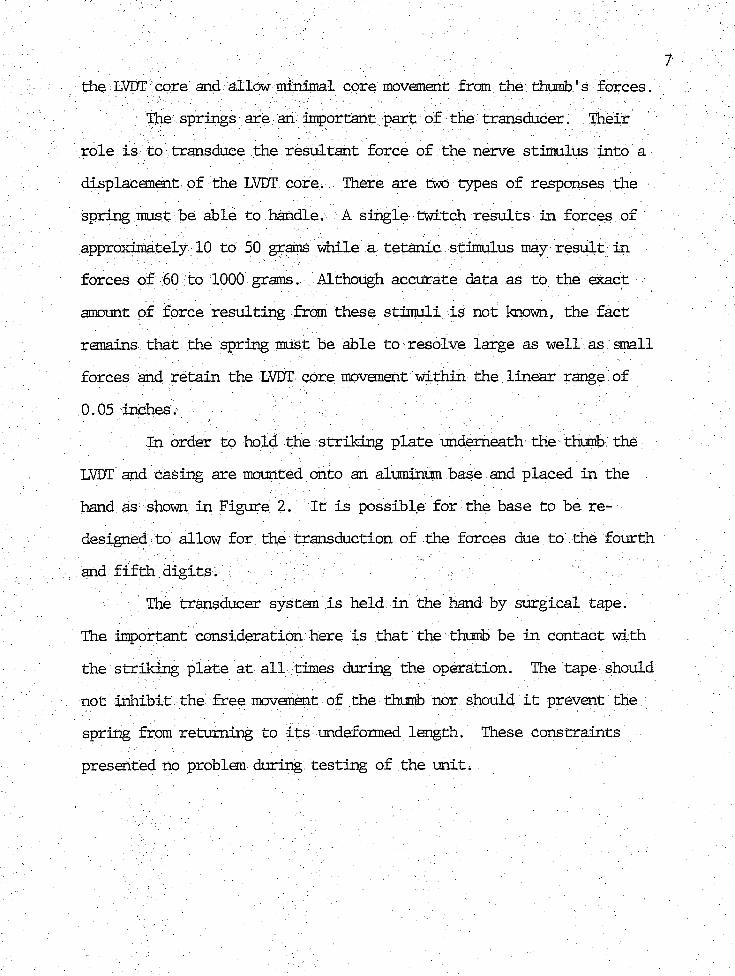
the LVDT core and allow minimal core imvement frcm the thumb's fo rces.
The springs are an important part of the transducer. Their
ro le is to transduce the resu ltan t force of the nerve stimulus into a
displacement of the LVDT core. There are two types of responses the
' spring must be able to handle. A single twitch resu lts in forces of
approximately 10 to 50 grams while a te tan ic stimulus may re su lt in
forces of 60 to 1000 grams. Although accurate data as to the exact
amount of force resu lting frcm these stim uli is not known, the fac t
remains tha t the spring must be able to resolve large as well as small
forces and re ta in the LVDT core movanent within the linear range of
0 .05 /inchesv
In order to hold the strik ing p la te underneath the thumb, the
LVDT and casing are mounted onto an aluminum base and placed in the
hand as shown in Figure 2. I t is possible for the base to be re
designed to allow for the transduction of the forces due to the fourth
and f i f th d ig its ;
The transducer systen is held in the hand by surgical tape.
The important consideration here is tha t the thumb be in contact with .
the strik ing p la te a t a l l times during the operation. The tape should
not in h ib it the free movement of the thumb nor should i t prevent the
spring frcm returning to i t s undeformed length. These constraints
presented no problem during testing of the un it.

Figure 2 - The Transducer in the Hand.
SIGNAL PROCESSING
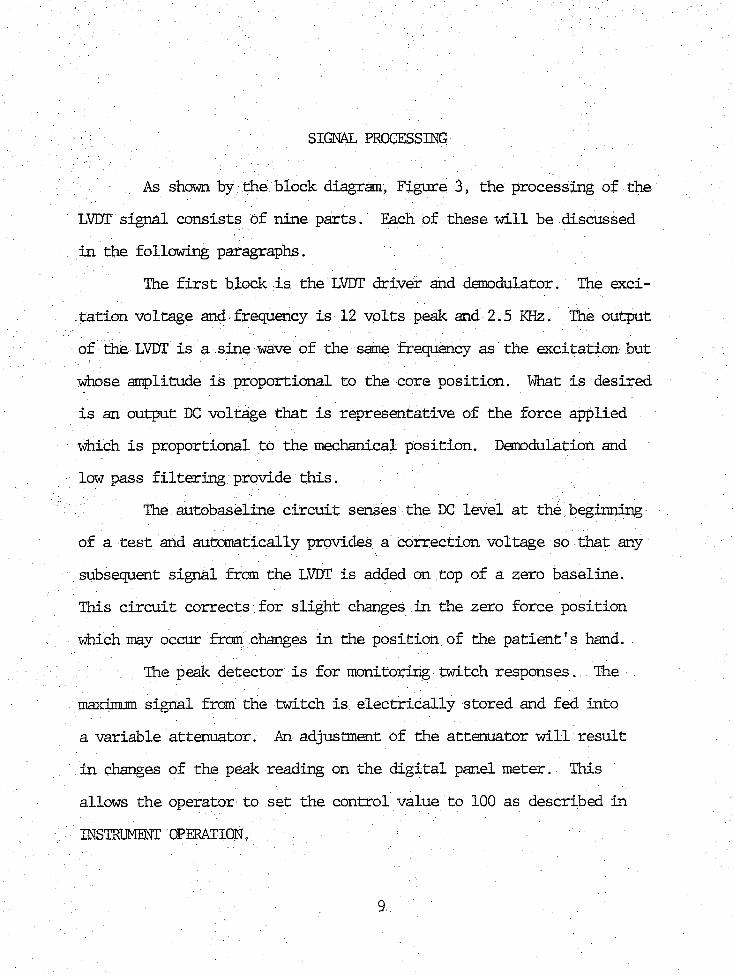
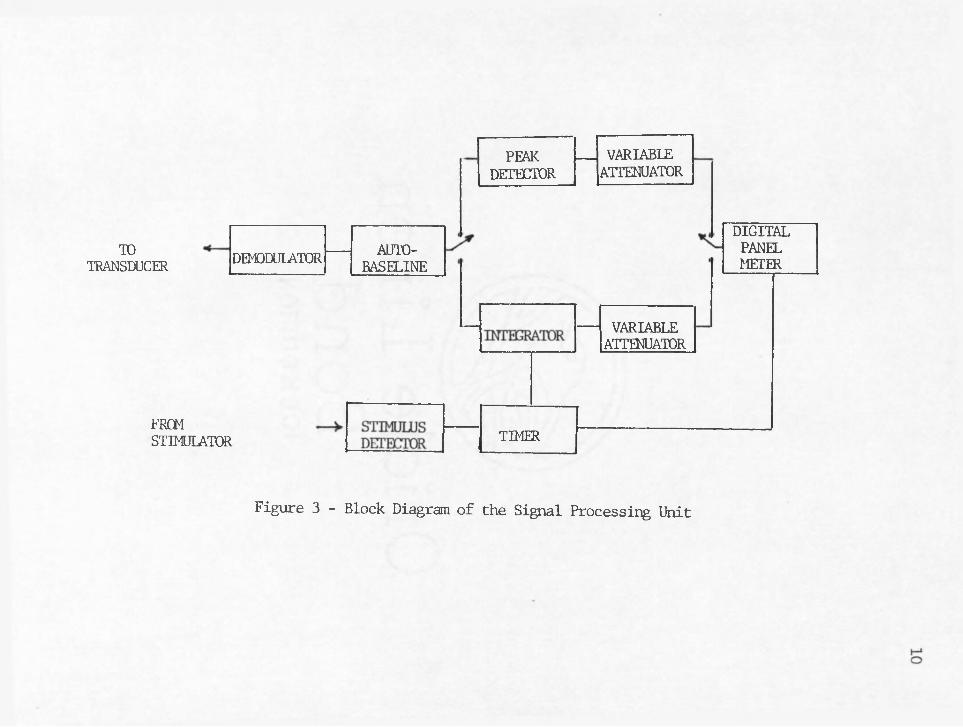
As shown by the block diagram, Figure 3, the processing of the
LVDT signal consists of nine parts. Each of these w ill be discussed
in the following paragraphs.
The f i r s t block is the LVDT driver and demodulator. The exci
ta tio n voltage and frequency is 12 vo lts peak and 2.5 KHz. The output
of liie LVDT is a sine wave of the same frequency as the excitation but
whose amplitude is proportional to the core position. What is desired
is an output DC voltage th a t is representative of the force applied
which is proportional to the mechanical position. Demodulation and
low pass f il te r in g provide th is .
The autobaseline c irc u it senses the DC level a t the beginning
o f a te s t and automatically provides a correction voltage so that any;
. subsequent signal from the LVDT is added on top of a zero baseline.
This c irc u it corrects fo r s lig h t changes in the zero force position
which may occur from changes in the position of the p a tie n t 's hand.
The peak detector is for monitoring twitch responses . The .
maximum signal frcm the twitch is. e lec tric a lly stored and fed into
a variable attenuator. An adjustment of the attenuator w ill re su lt
in changes of the peak reading on the d ig ita l panel meter. This
allows the operator to se t the control value to 100 as described in
INSTRUMENT OPERATION .
9:
TOTRANSDUCER
FROMSTIMULATOR
VARIABLEATTENUATOR
DEMODULATOR AUTO-BASELINE
TIMER
DIGITALPANELMETER
PEAKDETECTOR
VARIABLEATTENUATOR
Figure 3 - Block Diagram of the Signal Processing Unit

-■ ' ' ' ' ' : u
The in tegra to r gives th e best r ^ r e s a i ta t io n of the te tan ic
response by in tegrating the re su ltan t force-tim e curve. In tegration .
in tervals , of 1.0, 2.8, and 5.5; seconds are selectable . The in teg ra to r !
is followed by an ac tive voltage attenuator with variab le gain sim ilar
. to th a t of the peak nbde, in th e t i t i s operator controlled.
The stimulus detector senses the onset Of a stimulus and
in i t ia te s , the timer c irc u itry . The length of the stimulus' pulse does ..
not e ffec t the in te rv a l o f in tegration .
The output is displayed on a Datel* EM-3000 d ig ita l panel
m eter< Amor^. i t s many features i s one which allows the display to be.
frozen or held; The panel meter has been wired such th a t the timing .
c irc u it automatically freezes the display upon completion of the
selected in te rva l. The operator can choose to disconnect th is fea tu re
resu lting in a free run display mode.
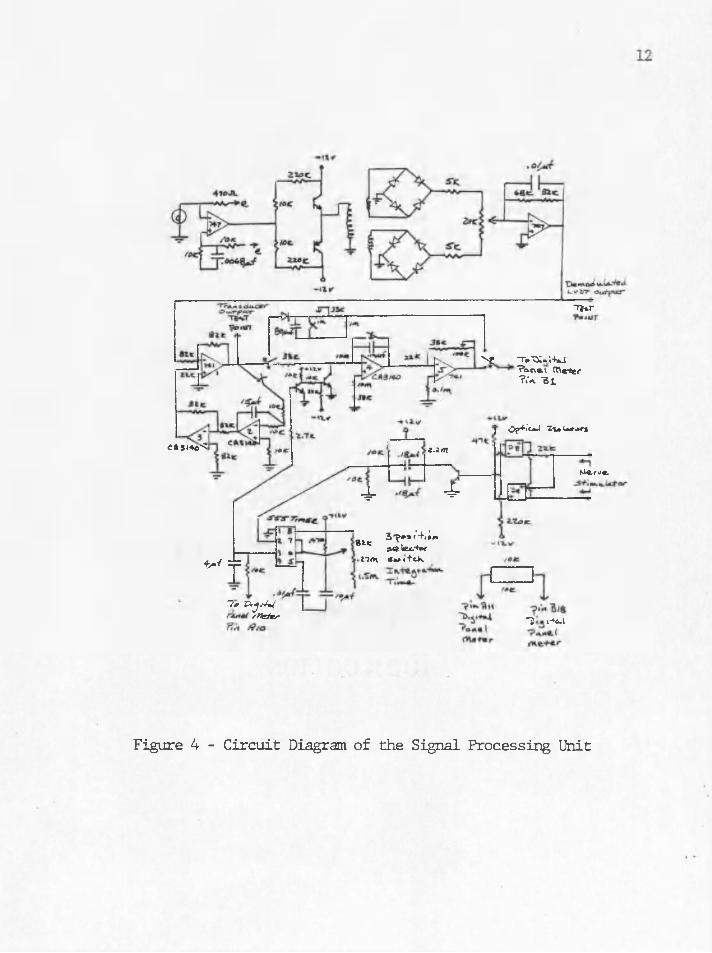
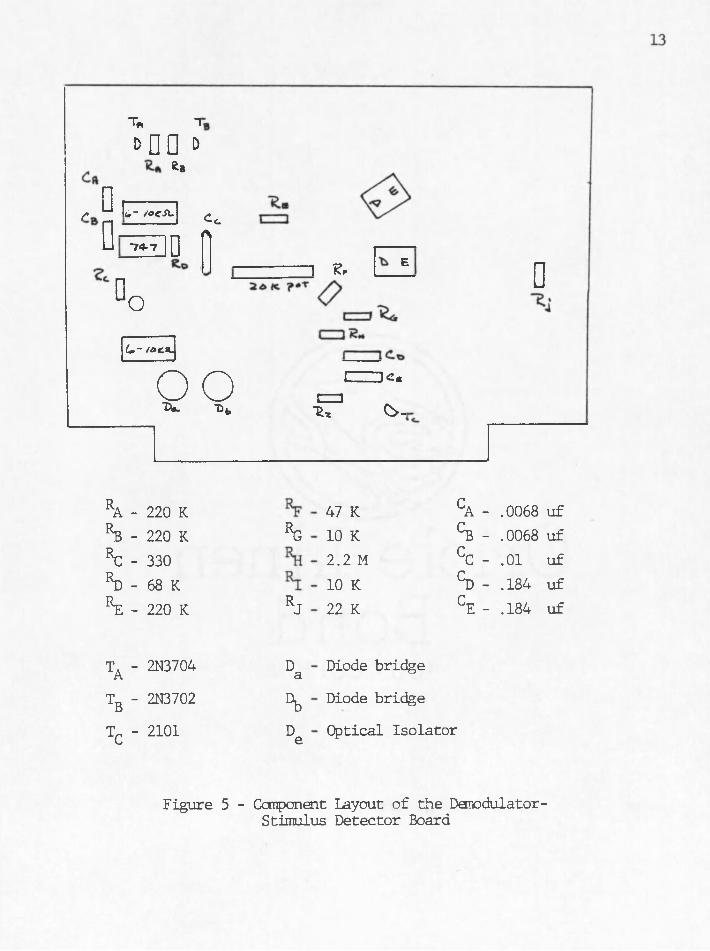
The complete c irc u it is shown in Figure 4 and a component1
layout in Figures 5 and 6.
The transducer mates with the signal ■processing u n it v ia a :
seven pin amphenol connector. The nerve stim ulator a ls o . connects to
the processing u n it v ia two banana jack recep tac les.
*Datel Systens, In c ., Canton, Mass. .
CAs«te< z-itn
Tt*r
N! ToXX.'.-UjTocxei meter ? .‘a -Bi
Op+i’oJ 1\+ U*-̂ 5
4- 4-
t*/ =)=git 3r s,'4,;'’»e lexu-hx n#t\ Sa> i tck.
"7> Rj/Vi*/ rXsater
Nle.yu<
""i f*6.l
Figure 4 - C ircuit Diagram of the Signal Processing Unit
T, 1i > n o d
Kb
f ^ L- /afJl.D —74*7 D
CcA
D o■— i e. E
C - /di:3go■Qt>
L_ K«a%% O -
D
ra - 220 KKb - 220 K %KC- 330rd - 68 Kre - 220 K RJ
ta ‘ 2N3704 Da
tb ' 2N3702 %
Tc ' 2101 De
47 K CA - .0068 uf10 K CB - .0068 uf2.:I M CC - .01 uf10 K S - .184 uf22 K CE - .184 uf
Diode bridge
Diode bridge
Optical Iso lator
Figure 5 - Component Layout of the Demodulator- Stimulus Detector Board

14
■~IA
74 (
•IT
L—I<Lq-
C-, - 15 uf EL - 82 K Ry - 82 K r13- i h R19 - 22 K R2- - 10 K
- 80 uf Rg - 22 K Rg - 82 K ^ 4 " 33 K R20 - 33 K R26 - 10 K
CL - 4 uf EL - 10 K EL - 82 K R15- 33 K R21 - 100 K R27 - 10 K
C4 -.12 uf R4 - 10 K RlO 10 K Rl6- 10 M R22 - 10 K
C- -.01 uf Rc - 10 K R1;l- 22 K R17 33 K R^g - 2.7 K
Cg - 10 uf R, - 82 K R12- 10 K R18- 10 M R̂ 4 - 470 K
All resistances in ohms
Figure 6 - Component Layout of the Main Signal Processing Board

INSTRUMENT OPERATION
Figure 7 shows the location of the front panel controls. The
RESET-READY switch (in reset) zeros the c ircu its and re se ts the base- ..
line, in preparation for a stimulation. In the READY position the un it
is ready to accept a signal from the transducer, perform the appro
p ria te processing and display an output. The function switch allows
the selection o f e ither the peak or in tegrate functions. Each function
.has i t s own variable attenuator adjustment, ATTEN 1 and ATTEN 2 re
spectively.. These gain adjustments allow the operator to se t the meter
reading to a control value corresponding to the p a tien t1 s "awake11
response^ i .e . the p a tie n t’s response ju s t p rio r to adm inistration .
of the blocking agent. Subsequent readings are then automatically
referenced to th is control value. I f , for example, the control was
100 we might expect a f te r administration of a blocking agent subsequent
readings tha t decrease to as low as 5. Upon the p a tie n t 's recovery
from the drug the readings should be a t le a s t 90% of the contro l. In
th is example readings of 90 would indicate c lin ica l recovery. ....
The operator can also choose between two types of display
modes and three time in tervals for integration. The two display
modes are FREE RUN and FREEZE. In the FREE RUN mode the d ig ita l panel
meter is constantly displaying the output of the signal processing
C ircuits. In the FREEZE mode the display is frozen when a pre-selected
time in terval has elapsed.' This time in terval is controlled by the :
' ■ : - ' ‘ ' . i s . . -

16
Reset
ReadyIntegrationTime
Function Peak Q Integrate
Free (^) Freeze Run wAtten 1 Atten 2
Figure 7 - Front Panel Controls of the Signal Processing Unit
INTE3?ATI0N TIME selector switch. The onset of the nerve stimulus marks
the beginning of the integration in terval.
An analog output of the LVDT Signal is available (Transducer
Output);. This output can be displayed, on a s tr ip chart recorder and the
d ig ita l data from the panel meter can be compared to the corresponding
analog s i g n a l . t e c h n i q u e was used during operating room testing
of the u n it.
RESULTS AND DISCUSSION
The primary goal of th is thesis was to develop and te s t a
systen which can be used to investigate the idea of in tegrating the
muscle force produced in response to a te tan ic stimulus of the ulner
nerve. The te tan ic stimulus was chosen because i t was considered a
more sensitive index of neuromuscular transmission than th a t of the
twitch (7) . The te tan ic response, as seen in Figure 9, is best repre
sented by the area under i t s curve. Thus the idea of integrating the
response due to tetanus evolved. : ;
Instrument development, included designing and building of a .
transducer, signal processing u n it and display. The systen was then
tested in a c lin ica l environment. The re su lts danonstrated the bene
f i t s of signal integration and the instrum ent's po ten tia l in deter
mining the p a tie n t 's s ta te of p ara ly sis .
, The instrument 'was tested on seven patien ts. Although there
are only three sets of meaningful data, each case was. helpful in
determining the usefulness of the system. The patien t cases are
separated into two groups. The f i r s t group tested the system's ease
of use and i t s a b ility to function in the operating room environment.
The second group was evaluated as patien t data, i . e . , nvhat the data
sign ifies.
The peak mode was tested oh p a tie n t 1. The transducer output
chart recordings and instrument readings are in Figure 8 and Table 1
18 .
19
Time — »
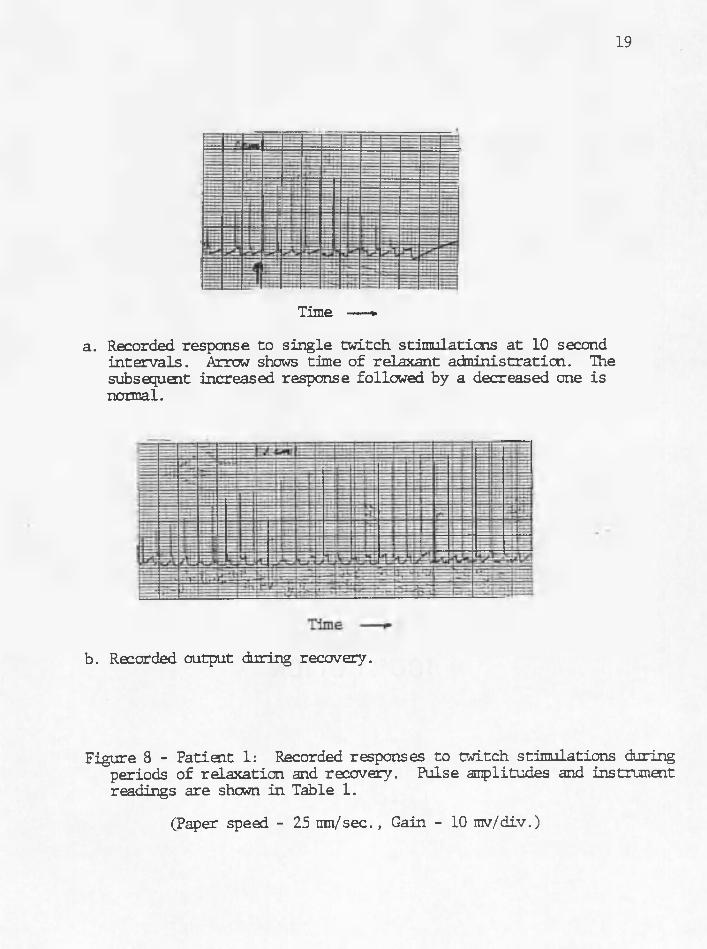
a. Recorded response to single tw itch stim ulations a t 10 second in te rva ls . Arrow shows time of relaxant adm inistration. The subsequent increased response followed by a decreased one is normal.
b. Recorded output during recovery.
Figure 8 - Patient 1: Recorded responses to twitch stim ulations duringperiods of relaxation and recovery. Pulse amplitudes and instrument readings are sham in Table 1.
(Paper speed - 25 inn/sec., Gain - 10 mv/div.)
20
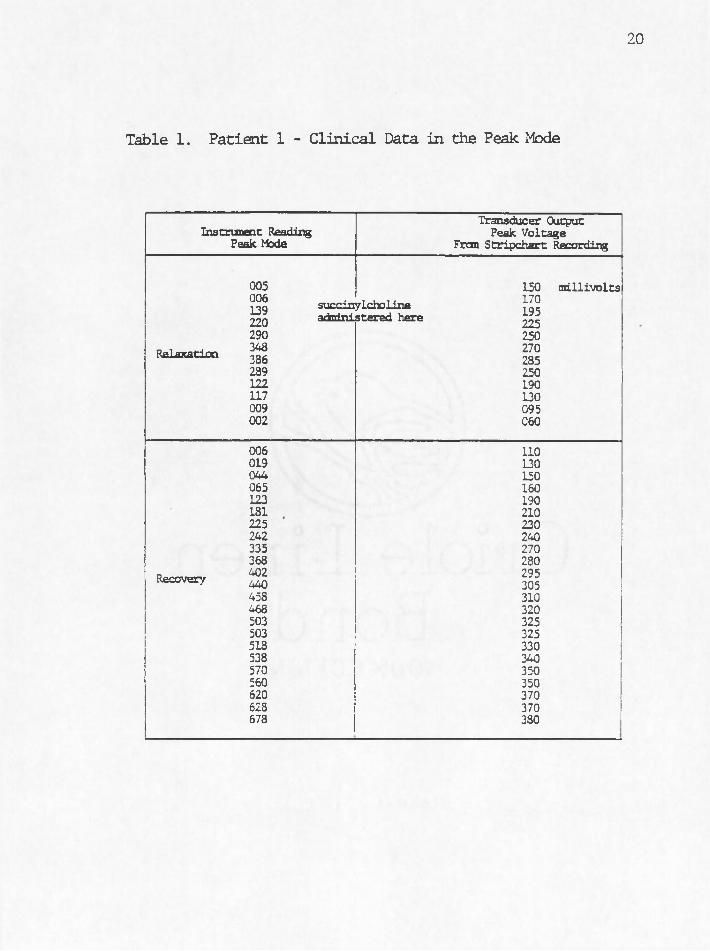
Table 1. P atien t 1 - C lin ical Data in the Peak Mode
Instrument Reading Peak Mode
Transducer Output Peak Voltage
From Stripchart Recording
Relaxation
Recovery
005006 139 220 290 348 386 289 122 117 009 002
006019044065123181225242335368402440458468503503518538570560620628678
succinylcholine administered here
150170195225250270285250190130095060
110130150160190210230240270280295305310320325325330340350350370370380
millivolts
respectively. The data shows the p a t ia i t 's reaction to the administering
of the blocking agent succinycholirie and h is subsequent recovery. Al
though no controls were obtained p rio r to the in i t ia l administering of - :
the blocker, the resu lts demonstrate tha t the system works in the peak
. mode.
On patien t 2 we tested the in tegration mode. We were able to
follow the p a tien t 's progressive s ta te of paralysis and h is subsequent
recovery. Controls were obtained and se t p rio r to the administration
of the drug and when c lin ica l recovery was declared the system's output
was 967c of the pre-drug control value. Sample recordings are shown in
Figure 9. Added to these recordings are marks indicating the in terval
of integration, 1.0 seconds in th is case.
All te tan ic responses from patients 2 through 7 were in itia te d
by a Burroughs Wellcome Block aid stimulator. The frequency of the
stimulus was e ither 50 of 100 and selected by the anesthesiologist. In .
a l l te tan ic mea,suremenfs the stimulus length exceeded the in terval of
integration.
The te s t system taken into the operating room is such tha t we
obtain a chart recording of the transducer output as well as a d ig ita l
instrument reading. The chart recording acts as a reference to which
we compare the d ig ita l reading. Both readings are a re su lt of the
single transducer described ea rlie r.
To ccmpare the two resu lts we must f i r s t normalize the force
time curve areas to the control area (area of the te tan ic response
taken ju s t p rio r to the administration of the neuromuscular blocker).

22
Time —»a. Recorded response to a te tan ic stim ulation ju s t p rio r to the
adm inistration of the neuromuscular blocker. The arrow shews the time of relaxant adm inistration.
Time
b. Recorded response to a te tan ic stim ulation while the patien t is "paralyzed".
Time — >c. Tetanic response demonstrating th is p a tie n t 's recovery.
Figure 9 - Patient 2: Sample recorded responses to te tan ic stimulationsduring periods of control, relaxation , and recovery.
(Paper speed - 25 mn/sec., Gain - 10 mv/div.)
Likewise we normalize the corresponding instrument readings to the
control instrument reading. These sets of normalized data are shown
in Table 2. The average error between the normalized instrument
readings and normalized chart recording areas was only 2.4%. Thus
. the instrument's in tegrator readings can represent the areas under
the force-time curves due to te tan ic stim uli.
Patients 3, 4, and 5 revealed the following problems which
were corrected by m odifications. Problens with triggering the timer
with the operating room stimulators were the most frequent. Without
proper triggering we were unable to te s t the integration mode. Other
problens encountered were the need for more gain and in a b ility to
record the phencmenon of the observed fade due to the use of the
drugs curare and pancuronium (Figures 10 and 11). The gain problen
was evident in patien t 2 since the instrument reading for the maximum
. of control te tan ic response was only 200. The system's output should
be a t le a s t 800 for a control response. Also a t the times when a
stimulus was available the stimulus detector c ircu itry was found to
be deficient in tha t i t did not trigger re liab ly .
These problens resulted in modifications which included
design of an optically iso lated stimulus detector which was indepen
dent of the length of the stimulus and imprpveneht of the high
■ frequency response. Gain was added to the electronics as well as
modification of the mechanical transducer system. This involved
implanentation of a two spring systen so tha t the spring under the
strik ing p la te s ta r ts a t i t s undefomed length. Thus the patien t

24
Table 2. P atien t 2 - C lin ica l Data in the In teg rate Mode
Instrument Reading Integrate
Mode
Area Under Transducer Output Curve
In Squares
Instrument Reading Referenced To
Control
Area Units Referenced to Control
200 control 775 1007. 1007.021 77 11 10030 123 15 16042 164 21 21047 171 24 22061 201 31 26081 301 41 39108 377 54 49115 428 58 55121 456 61 59131 493 66 64155 584 78 75158 585 79 75164 621 32 80176 665 88 86192 715 96 92
ave. error - 2.4%
25
Gould Inc., Instrument Systems DivisionCHART
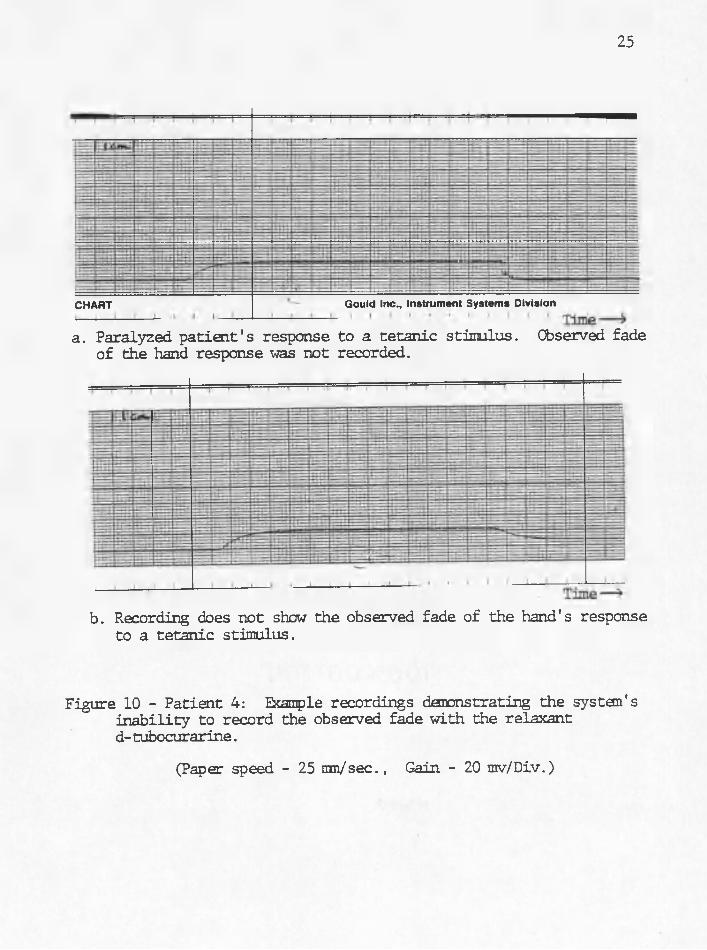
a. Paralyzed p a tie n t 's response to a te tan ic stimulus. Observed fade of the hand response was not recorded.
b. Recording does not show the observed fade of the hand's response to a te tan ic stim ulus.
Figure 10 - Patient 4: Example recordings danonstrating the systan 'sin a b ility to record the observed fade with the relaxant d- tubocurarine.
(Paper speed - 25 mm/sec., Gain - 20 mv/Div.)

26
• • • i l l i i i i i— i i
Time —»
Figure 11 - Patient 5: Example recording showing the lack of fade withthe relaxant Pancuronium.
(Paper speed - 25 um /sec., Gain - 10 m v./div.)

does not have to overcome any preset load to produce core movement ,
The maximum force of the modified system is 200 grams.
On patien t 6 we tested the modified systen. The stimulus
was adequately detected and fade from, pancuronium was noted
(Figure 12) .The gain settings were found to be too high and thus
tha electronics were heing saturated (Figure 13) . Also the forces
encountered were greater than 200 grams. Subsequent irodifications
allowed for a maximum of 500 grams before saturation of the ampli
fiers.. Patient 7 was well under th is maximum lim it. However more
data in th is area is needed. Conversations with Dr. B l i t t a t
University Hospital indicate th a t depending on the type of electrode
used, skin or needle, forces of up to 30 kilograms may be encountered.
This is fa r la rg e r than tha t measured by our systen. with skin
electrodes.
The data from patien t 7 is organized in a d iffe ren t way so
as to present a chronological comparison between the peak and integ
ra te mode. Both the peak and in tegrate instrument readings along
with th e ir corresponding voltages and areas are p lo tted against time
(Figure 14 and Table 3). The time tha t the drug was given was also
noted. Thus one can compare on one patien t the two modes and cor
responding reactions to the administration of a neuromuscular
blocker. Recovery was also monitored in both modes.
The transducer output and corresponding peak mode instrument
readings are p lo tted in the top graph of Figure 14. The bottom
graph of Figure 14 represents the calculated areas for 1 second

28
Figure 12 - Patient 6: Example recording demonstrating fadewith the relaxant Pancuroniun.
(Paper speed - 25 m n/sec., Gain - 500 rav/div.)

29
Gould Inc., Instrument Systems Div
Figure 13 - Patien t 6; Example recording demonstrating saturation of the electronics as seen on the chart recorder.
(Paper speed - 25 m n/sec., Gain - 500 mv/div.)

Transducer Output
Instrument Output .. ..0) 50
Time (minutes)
SuccinylcholineAdministered
SuccinylcholineAdministered
10C
60Time (minutes)
Figure 14 - Patient 7; Peak and Integrate Mode vs. Time.
The data plotted is normalized to the controls. Both the transducer and instrument outputs in the Peak mode are plotted on the top graph.Only the area of the corresponding instrument readings in the Integrate ^mode is available because of an integration in terval change midway othrough the operation.
31
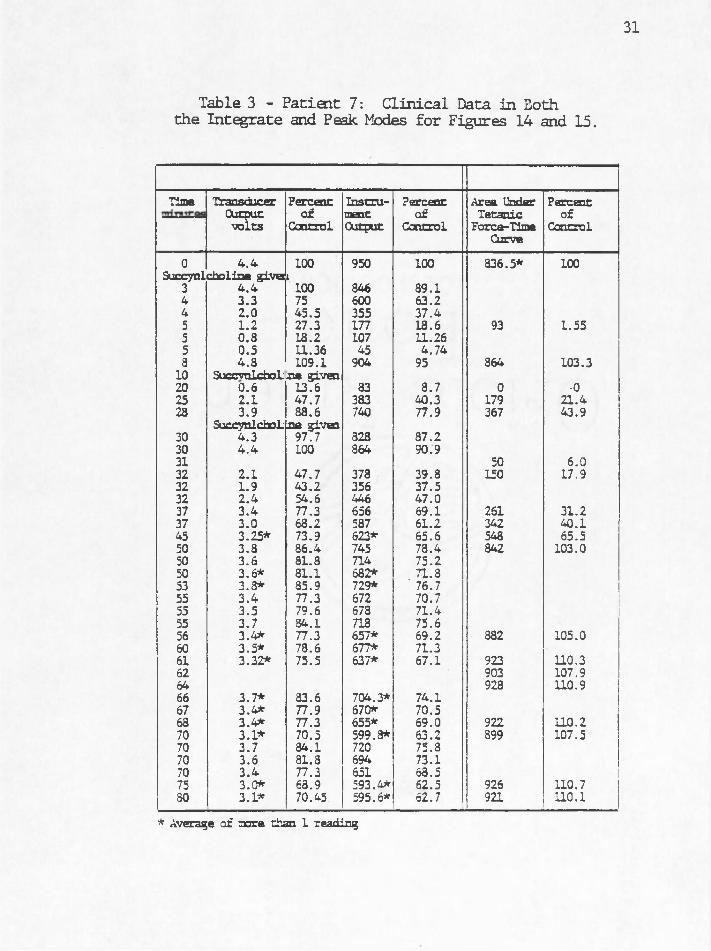
Table 3 - Patien t 7: C lin ical Data in Boththe In tegrate and Peak Modes fo r Figures 14 and 15.
Time TransducerOutput■volts
Percentof
Control
InstrumentOutput
Percentof
Control
Area Under Tetanic
Force-Time Curve
Percentof
Control
0 4.4 100 950 100 836.5* 100Succynlcholine give i
3 4.4 100 846 89.14 3.3 75 600 63.24 2.0 45.5 355 37.45 1.2 27.3 177 18.6 93 1.555 0.3 13.2 107 11.265 0.5 11.36 45 4.743 4.3 109.1 904 95 864 103.3
10 SuccvnlcfaoLjo b given20 0.6 13.6 83 8.7 0 -025 2.1 47.7 383 40.3 179 21.423 3.9 88.6 740 77.9 367 43.9
Succynlchol:_na given30 4.3 97.7 828 87.230 4.4 100 864 90.931 50 6.032 2.1 47.7 378 39.8 150 17.932 1.9 43.2 356 37.532 2.4 54.6 446 47.037 3.4 77.3 656 69.1 261 31.237 3.0 68.2 587 61.2 342 40.145 3.25* 73.9 623* 65.6 548 65.550 3.8 86.4 745 78.4 842 103.050 3.6 81.8 714 75.250 3.6* 81.1 682* . 71.853 3.3* 85.9 729* 76.755 3.4 77.3 672 70.755 3.5 79.6 678 71.455 3.7 84.1 718 75.656 3.4* 77.3 657* 69.2 882 105.060 3.5* 78.6 677* 71.361 3.32* 75.5 637* 67.1 923 110.362 903 107.964 928 110.966 3.7* 83.6 704.3* 74.167 3.4* 77.9 670* 70.563 3.4* 77.3 655* 69.0 922 110.270 3.1* 70.5 599.3* 63.2 899 107.570 3.7 84.1 720 75.870 3.6 81.8 694 73.170 3.4 77.3 651 68.5 175 3.0* 63.9 593.4* 62.5 926 110.730 3.1* 70.45 595.6* 62.7 921 110.1
* Average of oore than 1 reading

in tegration in tervals. Instrument readings throughout the operation
were unavailable due to an integration in terval change midway through
the operation. However we can demonstrate tha t the area under the
force-time curve indeed represents the instrument's in tegrate mode
reading.
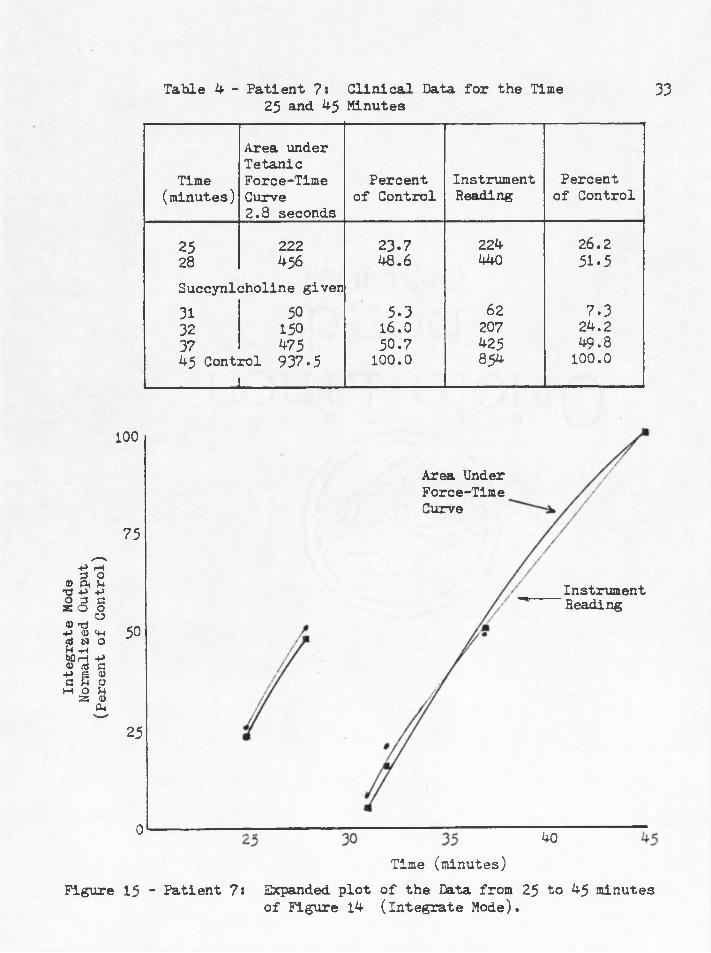
When we expand and examine the data taken between 25 and 45
minutes we note a correlation between six in tegrate mode instrument
readings and th e ir corresponding a reas ;. (Figure 15 and Table 4).
The in tegration in terval here is 2.8 seconds. .. The two curves in
Figure 15 demonstrate tha t the area under the force-time curves are :
representative of the instrument's in tegration output mode. Thus
the bottom graph in Figure 14 can be considered the same as the
instrument's integration inode reading.
; Comparisons between the peak and in tegrate modes can now be
made. Of most importance is the fac t th a t the in tegrate mode can
indeed monitor the p a tie n t 's paralyzed s ta te . Although more testing
is needed the data indicates tha t monitoring the te tan ic response
v ia the in tegrate mode is a mbre sensitive technique than tha t of
the twitch response v ia the peak mode.
Laboratory Data, ;
The system's analog output to the chart recorder is the
cannon denominator between the operating roctn and the lab. The
range of voltages seen in the c lin ica l environment on the chart
recorder can easily be reproduced in the lab . The weight or force
Inte
grat
e M
ode
Norm
alize
d O
utpu
t (P
erce
nt
of C
ontr
ol)
Table 4 - Patient ?: C linical Data for the Time25 and 4-5 Minutes
33
Area underTetanic
Time Force-Time Percent Instrument Percent(minutes) Curve
2.8 secondsof Control Reading of Control
25 222 23.7 224 26.228 456 48.6 440 51.5Succynlcholine given31 50 5.3 62 7.332 150 16.0 207 24.237 475 50.7 425 49.845 Control 937.5
i100.0 854 100.0
100
Area Under Force-Time Curve
73
InstrumentHeading
50
25
0 40Time (minutes)
Figure 15 - Patient 7% Expanded p lo t of the Data from 25 to 45 minutesof Figure 14 (Integrate Mode).

needed to recreate the c lin ic a l data gives to us the force ranges
encountered from the patien ts in the operating roan. The lab data
can also show us the characteristics of the systen. Sane Character
is t ic s studied were the systen 's lin e a rity , reproduceability,
hyste resis , and dynamic response.
Bi the c lin ical, test; systen checked the accuracy o f the
. in tegrator by comparing the instrument's output to the area under
the corresponding force-time curve (Table 2). We can sim ilarly
te s t the peak mode in the lab. This is done by placing various
weights on the transducer's strik ing p la te and recording the
resu ltan t analog and instrument output in the peak mode. The data
is normalized so tha t the control values are 100. The two can then
be compared. Table 4 shows the comparison between the "Normalized
Output to Chart Recorder" and. "Normalized Instrument Output Peak
Mode." The average error here was 0.68%.
. Figure 16 shows tha t the peak mode output is lin ear with
respect to weight up to 500 grams. When a maximum weight of 500 .
grams is encountered and the control is se t accordingly the peak
mode can resolve a minimum force of 100 grams.
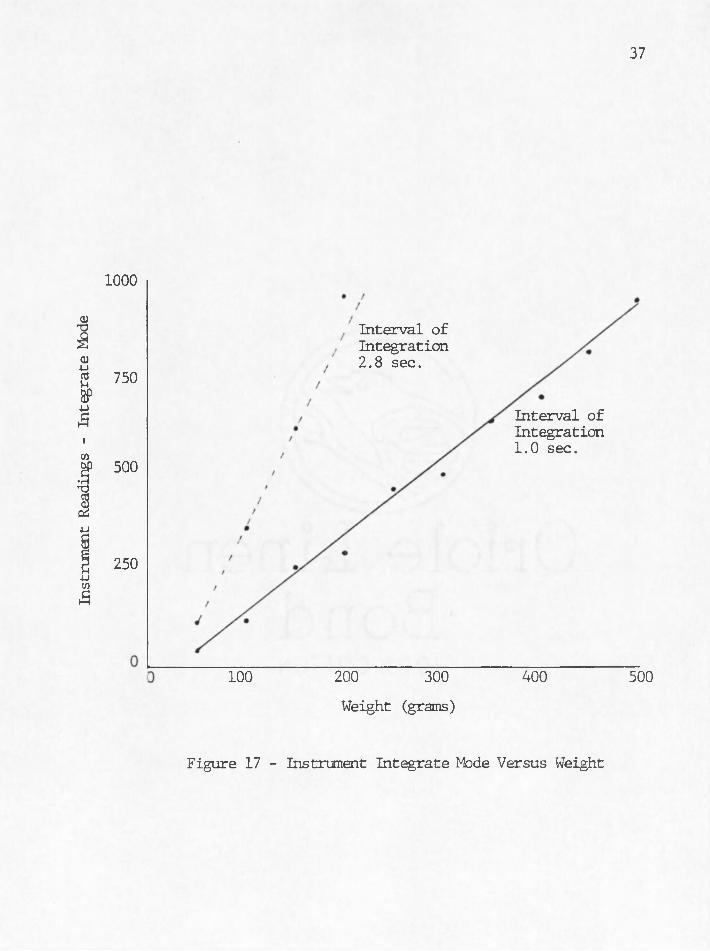
Lab data in the in tegrate mode also shows tha t the integ
ra to r is linear with respect to weight.in both the 1.0 and 2.8
second in tegration in tervals (Figure 17) . Again 500 grams was the
control weight. Hete we note that forces o f 50 grams can be
resolved by the system (Table 4).

35
Table 5 - Data from Laboratory Test A
Weight(grains) 50 100 150 200 250 300 350 400 450 500
TransducerOutput(volts)
— 1.01 1.96 2.58 3.16 4.25 4.29 6.1 6.8 7,35
Normalized Transducer Output v
13.7 26.7 35.1 43 57.8 72 ::: 83 92.5 100
Instrument Reading Peak Mode
130 247 322 393 531 660 762 857 931
Normalized Instrument Reading Peak Mode
. 14 26.5 34.6 42.2 57 70.9 81.8 92 100
Instrument Reading Integrate :iode-l sec. .
42 120 261 298 467 499 634 696 812 946
Instrument Reading Integrate yfode-2.8 sec
m 354::: 616 959

Instr
umen
t Ou
tput
- Pe
ak
Mod
e
36
1000
750
500
250
TOO------- 200------- 300------- 400------ 500
Weight (grams)
Figure 16 - Instrument Peak Mode Versus Weight
Instr
umen
t Re
adin
gs
- In
tegr
ate
Mod
e
37
1000
Interval of Integration 2.8 sec.
750
Interval of Integration 1.0 sec.
500
250
400200 300
Weight (grams)
500100
Figure 17 - Instrument Integrate Mode Versus Weight

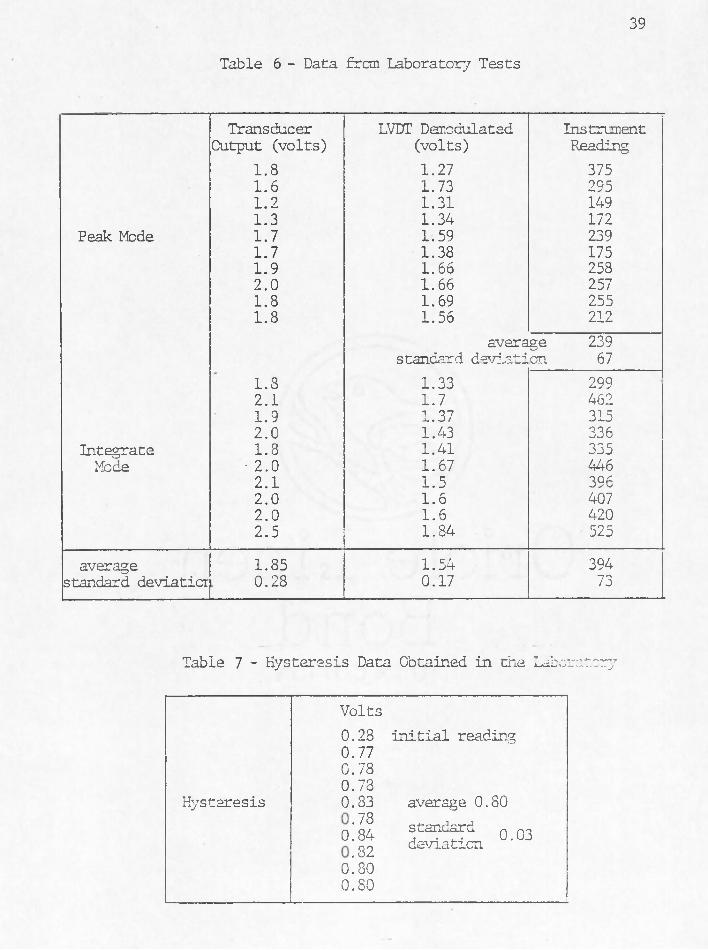
Testing the.reproducibility of the system: involved the repeated
placement of the same weight onto the transducer's strik ing p la te and
recording voltages a t various te s t points in the sy s ten . (Table 5).
These te s t points were the transducer output voltage, the demodulated
LVIJT s ig n il, and ' the ihstrm (Fi^ure>4) > ’■
In Table 5 we see tha t the average transducer output voltage
from twenty, te s ts was 1.85 vo lts with a standard deviation of .28
vo lts i .e . 68% of the twenty chart recorded voltages are within the
range of 1.57 to 2.03 v o lts . The average demodulated LVDT signal was
1,54 vo lts with a standard deviation of 0.17 vo lts . Of the twenty
te s ts , ten were recorded in the peak mode and ten . in the in tegrate
mode. Average readings and standard deviations were 239 and. 67 for
peak and 394 and. 73 for in tegrate respectively.
Hysteresis of the transducer was noted and tested in the lab
using the transducer output as the te s t point. The re su lts are shown
in Table 6. The in i t ia l reading on the chart recorder output was
.28 vo lts . A weight was placed on the strik ing p la te and then
removed. This procedure was repeated nine times without re-zeroing.
The chart recorder output never returned to the in i t ia l voltage but
instead returned on the average to .80 v o lts . The standard deviation
of the nine readings was only 0.03 v o lts . The autobaseline c ircu it
is designed to: handle the hysteresis noted in the lab .
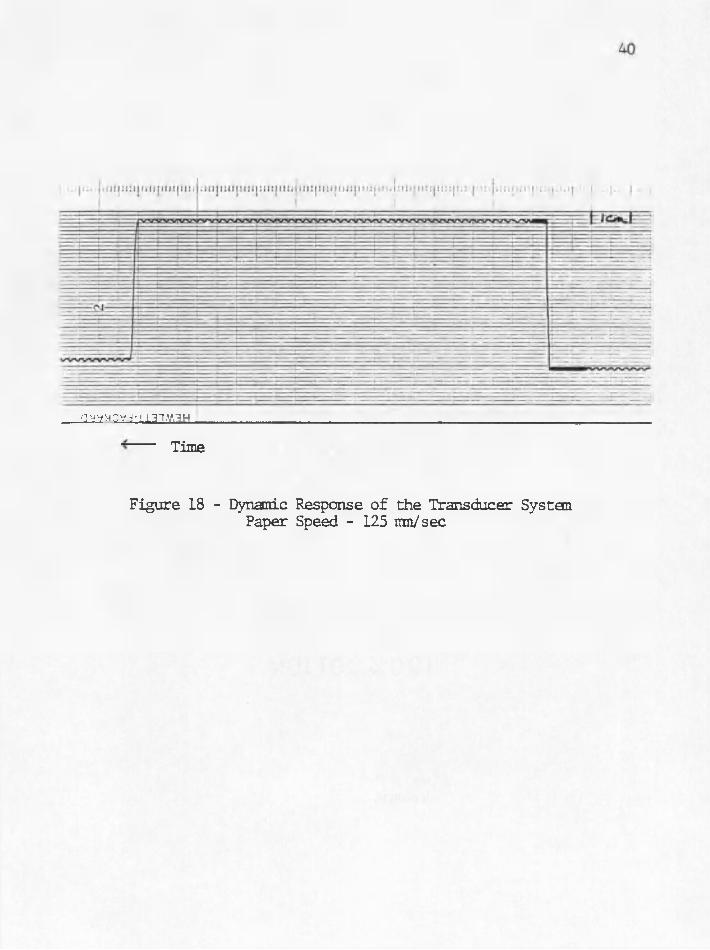
The dynamic response of the transducer system is displayed
in Figure 18. Here a 147.5 gram weight was placed on the strik ing .
p la te and then abruptly removed. This procedure was used because we
39
Table 6 - Data frcm Laboratory Tests
Transducer LVDT Demodulated InstrumentOutput (volts) (volts) Reading
1.8 1.27 3751.6 1.73 2951.2 1.31 1491.3 1.34 172
Peak Mode 1.7 1.59 2391.7 1.38 1751.9 1.66 2582.0 1.66 2571.8 1.69 2551.8 1.56 212
average 239standard deviation 67
1.8 1.33 2992.1 1.7 4621.9 1.37 3152.0 1.43 336
Integrate 1.8 1.41 335Mode • 2.0 1.67 446
2.1 1.5 3962.0 1.6 4072.0 1.6 4202.5 1.84 525
average 1.85 1.54 394standard deviatior 0.28 0.17 73
Table 7 - Hysteresis Data Obtained in the Laboratory
Volts
Hysteresis
0.28 initial reading0.770.780.730.83 average 0.80»! sss, »*==o!so0.80
gyyyCYj-iiai.v.iH .
Time
Figure 18 - Dynamic Response of the Transducer System Paper Speed - 125 mn/sec

41
could not se t the weight onto the strik ing p la te in an abrupt manner
without causing the weight to bounce. The resulting signal due to the
ranoval of the weight was recorded and the calculated time constant was
0.008 seconds or a frequent response o f 125 hz.

SUMMARY AND CONCLUSIONS
This paper presents a new system and technique fo r monitoring
a p a tien t1 s s ta te of neuromuscular block throughout an operation. The
system has been carefully designed to: be a functional instrument in
the operating room environment. The technique, in tegration of a te tan ic
response, is a viable means of monitoring an anesthesized patien t. . The
laboratory data showed the system* s characteristics and the c lin ica l .
data demonstrated i t s p o ten tia l.
More testing and modifications of the System are in order to
refine the characteristics of th is new technique. For example, the
in tegration technique applied to. a tra in of four stimulus can be stud
ied. Also important are studies on the differences in forces encoun
tered when using pad versus needle electrodes. . The findings here w ill
aid in the design o f a new transducer since accurate knowledge of the
forces involved w ill specify the required spring constant. .
The signal processing u n it can also be modified to allow for
greater ease of use and more f le x ib i l i ty e .g ., implementation of an
auto-reset c irc u it as well as c ircu its th a t automatically se t the
control values. These c ircu its w ill simplify the operation of the
instrument,. A re lia b le stimulus detector is needed. Here, also
conclusions from studies comparing the effects of skin electrodes
to needle ones would be of benefit. F inally a high/low gain switch
A ' : ; 42

would allow the operator to monitor a greater range of forces along with
an electronics saturation indicator to inform the operator tha t the
maximum lim it of the signal processor has been reached.
REFERENCES
1. Katz, R.J. "Comparison of E lectrical and Mechanical Recording ofSpontaneous and Evoked Muscle A ctiv ity ," Anesthesiology, 26: 204,1965.
2. Hassan, A. and J .J . Savarese, "Monitoring of Neuromuscular Function," Anesthesiology, 45, No. 2 ., 1976.
3. Walts, L.F., N. I^vin, and J.B. Dillon, "Assessment of Recovery From Curare," JAMA 213, No. 11, p. 1894, 1970.
4. Hassan, A ., "A New Device For Monitoring Force of Thumb Adduction,"Br. J . of Anes., 42: 83-85, 1970.
5. Hassan, A. and R.J. Katz, "Evaluation of Recovery From Non-depolarizing Neuromuscular Block, Using a D igital Neuromuscular Transmission Analyzer, Preliminary Report," Anes. in Anal., 52, No. 5, pp. 740-743 1973.
6. Walts, L.F. and J . Dillon, "A Means of Recording Force of Thumb Adduction," Anesthesiology, 29 No. 5, pp.1054-1055, 1968.
7. Gissen, A.J. and R.L. Katz, "Twitch, Tetanus and Posttetanic Pot- tia tio n as Indices of Nerve-Muscle Block in Man," Anesthesiology,30, No. 5, pp. 481-487, 1969.
44
