a mechanistic approach to the kitagawa-takahashi … · alampa, arts et metier´ s paristech...
TRANSCRIPT
HAL Id: hal-00875771https://hal.archives-ouvertes.fr/hal-00875771
Submitted on 22 Oct 2013
HAL is a multi-disciplinary open accessarchive for the deposit and dissemination of sci-entific research documents, whether they are pub-lished or not. The documents may come fromteaching and research institutions in France orabroad, or from public or private research centers.
L’archive ouverte pluridisciplinaire HAL, estdestinée au dépôt et à la diffusion de documentsscientifiques de niveau recherche, publiés ou non,émanant des établissements d’enseignement et derecherche français ou étrangers, des laboratoirespublics ou privés.
A mechanistic approach to the Kitagawa-Takahashidiagram using a multiaxial probabilistic framework
Etienne Pessard, Daniel Bellett, Franck Morel
To cite this version:Etienne Pessard, Daniel Bellett, Franck Morel. A mechanistic approach to the Kitagawa-Takahashidiagram using a multiaxial probabilistic framework. Engineering Fracture Mechanics, Elsevier, 2013,109, pp.89-104. <10.1016/j.engfracmech.2013.06.001>. <hal-00875771>

Science Arts & Métiers (SAM)is an open access repository that collects the work of Arts et Métiers ParisTech
researchers and makes it freely available over the web where possible.
This is an author-deposited version published in: http://sam.ensam.euHandle ID: .http://hdl.handle.net/10985/7416
To cite this version :
Etienne PESSARD, Daniel BELLETT, Franck MOREL, Imade KOUTIRI - A mechanistic approachto the Kitagawa-Takahashi diagram using a multiaxial probabilistic framework - EngineeringFracture Mechanics - Vol. 109, p.89-104 - 2013
Any correspondence concerning this service should be sent to the repository
Administrator : [email protected]

A mechanistic approach to the Kitagawa-Takahashi diagram using
a multiaxial probabilistic framework
Etienne Pessarda,∗, Daniel Belletta, Franck Morela, Imade Koutiria
aLAMPA, Arts et Metiers ParisTech Angers, 2 Bd du Ronceray, 49035 Angers Cedex 01
Abstract
The aim of this paper is to propose a flexible multiaxial modelling framework that is capa-
ble of combining two fatigue damage mechanisms so as to continuously describe the Kitagawa-
Takahashi diagram. It is proposed that this diagram represents two distinct fatigue damage mech-
anisms: one associated with crack initiation (or microstructurally small cracks) and the other with
crack propagation (or long cracks). It is further postulated that these damage mechanisms are
more appropriately modelled using different fatigue criteria. A probabilistic modelling framework
is proposed in which any two suitable fatigue criteria can be combined in order to simultaneously
model both damage mechanisms and the transition between them. This framework is based on the
weakest link hypothesis and results in a probabilistic Kitagawa-Takahashi type diagram.
Keywords: Probabilistic Kitagawa-Takahashi diagram, Fatigue damage mechanisms, High cycle
fatigue, Small crack problem, Defects
1. Introduction
In terms of High Cycle Fatigue (HCF), it is well known in the engineering community that
different fatigue design philosophies exist and that the choice of a certain philosophy strongly
depends on the application under consideration. Two of the more widely used design philosophies
are (a) the safe-life approach and (b) the damage tolerance approach. The safe-life approach is
one of the oldest strategies and has the simple objective of ensuring that a component will never
fail during its design life. This approach is often used, for example, in the automotive industry
∗Corresponding author. Tel.: +33 2 41 20 73 79; fax: +33 2 41 20 73 20.
Email address: [email protected] (Etienne Pessard)
Preprint submitted to Engineering Fracture Mechanics May 18, 2013

and can be thought of as controlling the phenomenon of fatigue crack initiation. The damage
tolerance approach on the other hand assumes that fatigue cracks exist and that this damage will
be controlled by an imposed maintenance regime to ensure that fatigue cracks never reach their
critical size. In this approach the focus is on crack propagation.
In the same manner the development of fatigue criteria has also followed two essentially par-
allel paths. The safe-life approach is often implemented via the application of so-called multiaxial
fatigue criteria [1, 2, 3, 4, 5], capable of predicting crack initiation due to complicated in-service
multiaxial loading conditions. The damage tolerance approach, on the other hand, is championed
by fracture mechanics. In the scientific literature there is surprisingly little overlap between these
two different approaches, which are essentially different aspects of the same engineering problem
(i.e. design against fatigue).
The basic premise of this article is that these two modelling approaches co-exist because they
model two very different fatigue damage mechanisms. One associated with crack initiation and the
other with crack propagation. This by itself is not new, however the innovation in this work is the
proposition of a flexible modelling framework in which it is possible to combine two completely
different fatigue criteria in order to model multiple damage mechanisms.
The mechanism of fatigue crack initiation in polycrystalline metallic materials has long been
understood and is discussed in most good fatigue textbooks [6]. Essentially, crack initiation is
due to localised plasticity (or dislocation movement) in well orientated slip systems of isolated
surface grains. This irreversible plastic slip leads to the formation of persistent slip bands that
can be often observed on the surface of the material and result in the creation of intrusions and
extrusions. These are essentially small peaks and valleys that increase the surface roughness and
introduce small stress concentrations that eventually lead to the development of micro-cracks. The
important things to note are: (a) the initiation process is controlled by localised plasticity (b) that
micro-cracks are initiated on crystalline slip planes and (c) that these planes are in general aligned
with the planes of maximum shear stress amplitude.
When it comes to crack propagation mechanisms, Forsyth [7] proposed in 1962 that crack
growth can be divided into two stages. When the crack and the zone of plastic deformation sur-
rounding the crack tip are confined to within a few grain diameters, crack growth occurs predom-
2

inately by single shear, in the direction of the primary slip system. This single slip mechanism,
leading to a zig-zag crack path, has been termed stage I crack growth. For longer length cracks,
for which the crack tip plastic zone encompasses many grains, the crack propagation mechanism
involves simultaneous or alternating plastic flow along two slip systems. This duplex slip mecha-
nism, termed stage II by Forsyth [7] results in a planar (mode I) crack path normal to the far field
tensile axis [6].
It is important to note that stage I crack growth (like the mechanism of crack initiation) is
controlled by the shear stress on a crystallographic slip plane. In terms of Linear Elastic Fracture
Mechanics (LEFM) terminology, this is often referred to as Mode II crack opening. On the other
hand stage II growth is dominated by the normal stress perpendicular to the crack (or Mode I crack
opening). Therefore, from a mechanistic point of view it is not surprising that crack initiation and
stage I propagation are more appropriately modelled by multiaxial fatigue criteria in which the
shear stress (on a critical plane for example) is a major ingredient of the criterion, while stage II
crack growth is better modelled by fracture mechanics approaches, which are largely focused on
mode I propagation.
Linear Elastic Fracture Mechanics (LEFM) has achieved great success in modelling long crack
fatigue behaviour. However, it is well known that classical LEFM predictions greatly overestimate
the residual fatigue strength of cracked bodies containing micro-structurally short cracks. This is
often referred to as the short crack problem and was first highlighted by Kitagawa and Takahashi
[8] who presented it in the form of their now famous Kitagawa-Takahashi diagram (see Figure 1).
They showed that experimental fatigue data could be described by two lines, one representing the
plain specimen fatigue strength and the other the LEFM prediction using the crack propagation
threshold, ∆Kth. The validity of this diagram has been confirmed by numerous investigations for
many different materials [4, 9, 10, 11].
What should be noted is that the Kitagawa diagram can be divided into three different zones:
• Zone 1: When a crack can be classified as micro-structurally small the fatigue strength
is controlled by the initiation damage mechanism, in which the damage is due to micro-
plasticity in single slip systems. The shear stress on the slip plane is the dominate driving
3
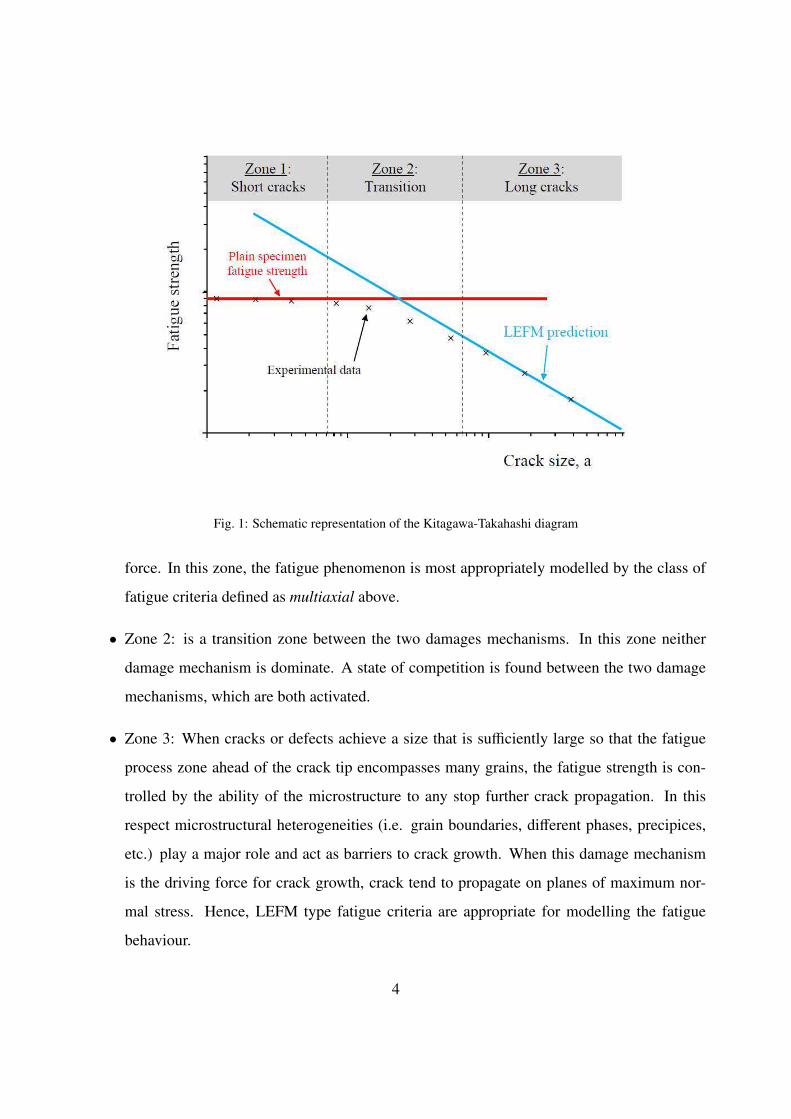
Fig. 1: Schematic representation of the Kitagawa-Takahashi diagram
force. In this zone, the fatigue phenomenon is most appropriately modelled by the class of
fatigue criteria defined as multiaxial above.
• Zone 2: is a transition zone between the two damages mechanisms. In this zone neither
damage mechanism is dominate. A state of competition is found between the two damage
mechanisms, which are both activated.
• Zone 3: When cracks or defects achieve a size that is sufficiently large so that the fatigue
process zone ahead of the crack tip encompasses many grains, the fatigue strength is con-
trolled by the ability of the microstructure to any stop further crack propagation. In this
respect microstructural heterogeneities (i.e. grain boundaries, different phases, precipices,
etc.) play a major role and act as barriers to crack growth. When this damage mechanism
is the driving force for crack growth, crack tend to propagate on planes of maximum nor-
mal stress. Hence, LEFM type fatigue criteria are appropriate for modelling the fatigue
behaviour.
4
In the previous discussion the terms crack initiation damage mechanism and crack propagation
damage mechanism have been used, however it must be kept in mind that we are talking about
fatigue. Hence, the terms non-initiation and crack arrest would be more appropriate. In the
following the term mechanism 1 will be used to describe the crack initiation damage mechanism
and mechanism 2 will be used to describe the crack propagation damage mechanism. Note also
that this work is focused on the high cycle fatigue domain in which it is more appropriate to use
the terminology fatigue strength corresponding to a fixed number of cycles, than the term fatigue
limit.
The discussion above is centred around fatigue damage mechanisms observed in relatively
homogeneous polycrystalline metallic materials. However, real metallic materials often contain
microstructural heterogeneities, many of which can be classified as material defects. Two striking
examples are the presence of micro-shrinkage pores in cast aluminium alloys [12, 13] and clusters
of elongated MnS inclusions in forged steels [14, 15, 16]. In these cases the distinction between
the two fatigue damage mechanisms is less clear. Concretely, the presence of large material defects
can result in the crack propagation mechanism (mechanism 2) always being dominate. Therefore,
the correct identification of the dominate damage mechanism is extremely important and the deter-
mination of a Kitagawa-Takahashi diagram is essential for establishing correct fatigue predictions.
The application of the proposed modelling framework to these two cases is discussed in the last
section of the paper.
As already stated, the aim of this article is to present a flexible modelling framework in which
both damage mechanisms can be simultaneously modelled using two different fatigue criteria. The
basic ingredients of this framework are:
1. The choice of two appropriate fatigue criteria to model the two damage mechanisms.
2. The threshold quantities of both criteria are defined in terms of Weibull distributions. This
allows the experimentally observed scatter to be taken into account and associates a proba-
bility of failure with each criterion (and damage mechanism).
3. The weakest link hypothesis is then used to determine the total probability of failure due
to both damage mechanisms. This leads to a continuous transition between the predictions
5
from the two criteria.
This framework results in probabilistic Kitagawa-Takahashi diagrams and if multiaxial fatigue
criteria are used, Kitagawa-Takahashi diagrams can be established for any multiaxial stress state.
In the following this framework will be demonstrated using three different criteria combinations
and is applied to multiaxial fatigue data taken from the literature.
2. The probabilistic modelling framework
It is important to realise that the focus here is on the modelling framework and that any two
appropriate fatigue criteria can be used within this framework. It is sufficient to define one crite-
rion to describe the crack initiation damage mechanism (mechanism 1) and another for the crack
propagation mechanism (mechanism 2).
It should also be recognised that the original Kitagawa-Takahashi diagram is indeed exactly
this. The two lines of the diagram represent two distinct criteria: the LEFM criterion and a simple
maximum stress amplitude criterion, combined in a deterministic manner.
2.1. Probabilistic modelling of mechanism 1
This section is devoted to the modelling of the crack initiation damage mechanism (mechanism
1). In particular, the focus is on transgranular initiation in a polycrystalline aggregate free of
geometric defects or cracks.
Over the years many modelling approaches have been proposed to determine the possibility
of crack initiation. Table 1 summarises several high cycle fatigue criteria that could be used in
the proposed framework. Note that the first criterion is the simple stress amplitude criterion,
which for uniaxial loads corresponds to the amplitude of the maximum principal stress. Even
though the maximum principal stress criterion is not well suited to model the fatigue behaviour of
ductile material, this criteria is chosen for his simplicity and is used below to explain the proposed
methodology . The last three criterion in Table 1 are well known multiaxial criteria that have been
proposed to take into account complex cyclic loading conditions.
As a general rule most fatigue criteria can be defined by an equivalent mechanical quantity
(i.e. stress, strain, energy, etc.), which is compared to a threshold quantity, for a given number of
6

cycles. Crack initiation is subsequently predicted if the equivalent quantity is greater than or equal
to the threshold quantity (see equation 1). In the following, for convenience, these will be referred
to stress quantities. Hence, the condition for crack initiation is defined by:
σeq > σth (1)
Criterion Equivalent Stress σeq Threshold σth
Stress amplitude σI,a s−1
Fatemi-Socie [3] ∆γ
(
1 + kFS
σn,max
σy
)
βFS
Crossland [17]√
J2,a + kσH,max λ
Dang Van [18, 19] max~n
[
maxt
[τmeso + αDVσH]
]
βDV
Table 1: Stress amplitude criterion and three well known fatigue criteria divided into equivalent and threshold parts
(N.B. all symbols are defined in the nomenclature)
In order to take into account the inherent stochastic nature of the fatigue phenomenon it is
proposed, as part of the modelling framework, to use a two parameter Weibull distribution [20, 21]
to describe the threshold stress. In this work the Weibull distribution is used because it is easily
applicable to the weakest link theory.
This choice then makes it possible to define the probability of crack initiation within a grain.
Equation 2 shows the probability density function used to define the threshold stress.
f01(σth) =m1
σth01
(
σth
σth01
)m1−1
exp−
(
σth
σth01
)m1
(2)
Where σth01 is the scale parameter and m1 is the shape parameter (or the Weibull exponent)
used to reflect the scatter associated with the threshold stress and by consequence the scatter asso-
ciated with the fatigue damage mechanism (see Figure 2). The probability of microcrack initiation
in a grain corresponds to the probability of finding a grain with a threshold stress σth that is less
than the applied equivalent stress σeq. This can be expressed as:
7

PF01= (σth < σeq) =
∫ σeq
0
f01(σth)dσth (3)
PF01= 1 − exp
[
−
(
σeq
σth01
)m1]
(4)
f 01
σth
σth01 m
a)
0
0,2
0,4
0,6
0,8
1
PF01
σth
σth01
m
b)
Fig. 2: Effect of the exponent m1 and the scale factor σth01 on the a)Probability density function b)the cumulative
distribution function
To obtain the probability of crack initiation for the complete structure PF1, the weakest link
theory is used [22]. The probability of survival of the structure (1 − PF1) is defined as the product
of the survival probabilities of each elementary volume or surface. In this work it will be assumed
that crack initiation is essentially a surface phenomenon, where the quantity S 01 corresponds to the
surface area of an individual surface grain and S Ω1 is the total surface area of a specimen. Hence
the probability of survival of the complete structure is given by:
1 − PF1= Π
SΩ1
(
1 − PF01(M)
)
(5)
This then implies that:
PF1= 1 − exp
[
−1
S 01
∫
SΩ1
(
σeq
σth01
)m1
dS
]
(6)
For a uniform surface stress, this expression can be simplified to:
8
PF1= 1 − exp
[
−S Ω1
S 01
(
σeq
σth01
)m1]
(7)
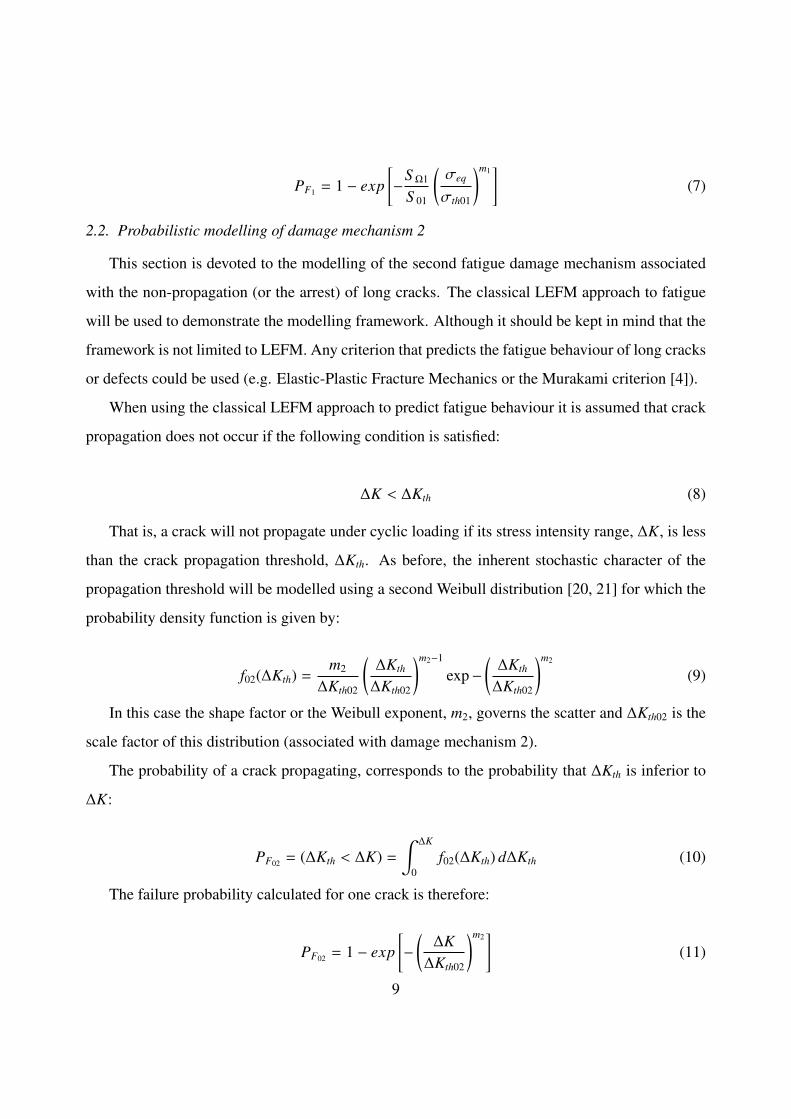
2.2. Probabilistic modelling of damage mechanism 2
This section is devoted to the modelling of the second fatigue damage mechanism associated
with the non-propagation (or the arrest) of long cracks. The classical LEFM approach to fatigue
will be used to demonstrate the modelling framework. Although it should be kept in mind that the
framework is not limited to LEFM. Any criterion that predicts the fatigue behaviour of long cracks
or defects could be used (e.g. Elastic-Plastic Fracture Mechanics or the Murakami criterion [4]).
When using the classical LEFM approach to predict fatigue behaviour it is assumed that crack
propagation does not occur if the following condition is satisfied:
∆K < ∆Kth (8)
That is, a crack will not propagate under cyclic loading if its stress intensity range, ∆K, is less
than the crack propagation threshold, ∆Kth. As before, the inherent stochastic character of the
propagation threshold will be modelled using a second Weibull distribution [20, 21] for which the
probability density function is given by:
f02(∆Kth) =m2
∆Kth02
(
∆Kth
∆Kth02
)m2−1
exp−
(
∆Kth
∆Kth02
)m2
(9)
In this case the shape factor or the Weibull exponent, m2, governs the scatter and ∆Kth02 is the
scale factor of this distribution (associated with damage mechanism 2).
The probability of a crack propagating, corresponds to the probability that ∆Kth is inferior to
∆K:
PF02= (∆Kth < ∆K) =
∫ ∆K
0
f02(∆Kth) d∆Kth (10)
The failure probability calculated for one crack is therefore:
PF02= 1 − exp
[
−
(
∆K
∆Kth02
)m2]
(11)
9
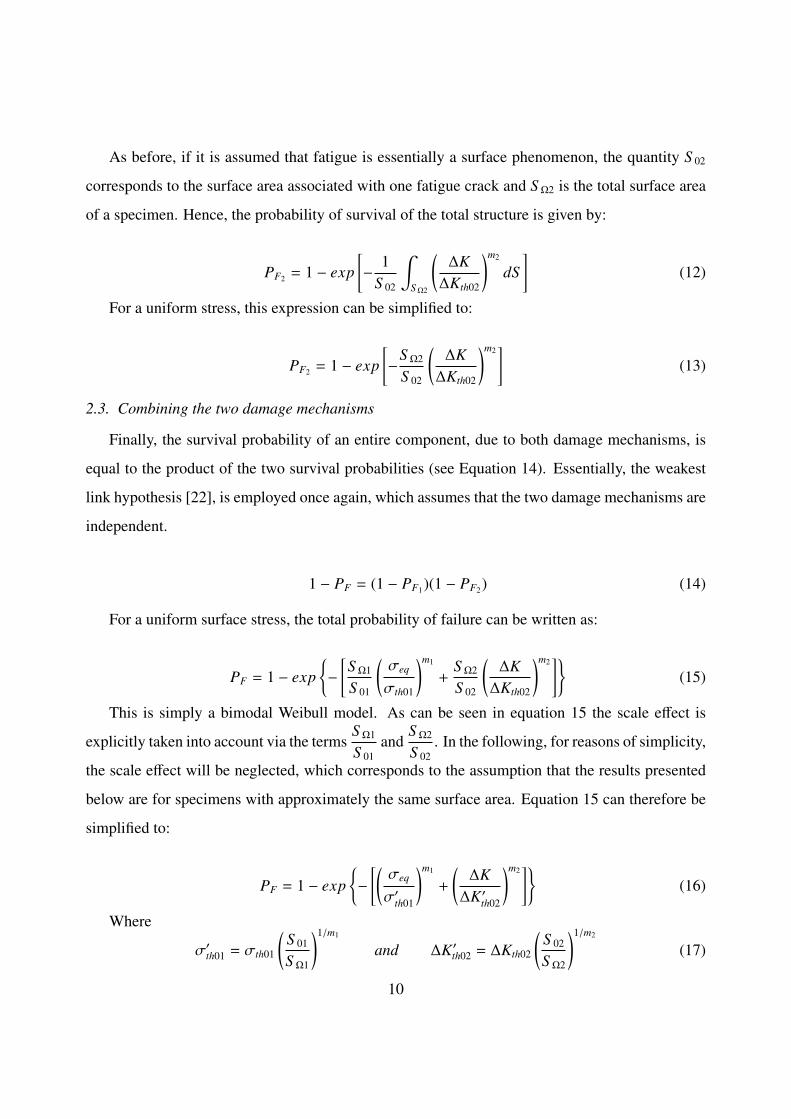
As before, if it is assumed that fatigue is essentially a surface phenomenon, the quantity S 02
corresponds to the surface area associated with one fatigue crack and S Ω2 is the total surface area
of a specimen. Hence, the probability of survival of the total structure is given by:
PF2= 1 − exp
[
−1
S 02
∫
SΩ2
(
∆K
∆Kth02
)m2
dS
]
(12)
For a uniform stress, this expression can be simplified to:
PF2= 1 − exp
[
−S Ω2
S 02
(
∆K
∆Kth02
)m2]
(13)
2.3. Combining the two damage mechanisms
Finally, the survival probability of an entire component, due to both damage mechanisms, is
equal to the product of the two survival probabilities (see Equation 14). Essentially, the weakest
link hypothesis [22], is employed once again, which assumes that the two damage mechanisms are
independent.
1 − PF = (1 − PF1)(1 − PF2
) (14)
For a uniform surface stress, the total probability of failure can be written as:
PF = 1 − exp
−
[
S Ω1
S 01
(
σeq
σth01
)m1
+S Ω2
S 02
(
∆K
∆Kth02
)m2]
(15)
This is simply a bimodal Weibull model. As can be seen in equation 15 the scale effect is
explicitly taken into account via the termsS Ω1
S 01
andS Ω2
S 02
. In the following, for reasons of simplicity,
the scale effect will be neglected, which corresponds to the assumption that the results presented
below are for specimens with approximately the same surface area. Equation 15 can therefore be
simplified to:
PF = 1 − exp
−
[(
σeq
σ′th01
)m1
+
(
∆K
∆K′th02
)m2]
(16)
Where
σ′th01 = σth01
(
S 01
S Ω1
)1/m1
and ∆K′th02 = ∆Kth02
(
S 02
S Ω2
)1/m2
(17)
10

3. A unified fatigue criterion and a probabilistic Kitagawa-Takahashi diagram
3.1. For uniaxial fully reversed tension-compression loads
In this section fully reversed uniaxial push-pull loads are investigated in conjunction with the
same criteria as those used in the original Kitagawa-Takahashi diagram to illustrate the possibilities
of this modelling framework. Consequently, a probabilistic uniaxial Kitagawa-Takahashi diagram
is generated.
The two criteria chosen are (a) the simple stress amplitude criterion and (b) the LEFM criterion,
for which it is assumed that the opening mode (Mode I) is the dominate crack propagation driving
force. These criteria are described by the following equations:
σeq = σI,a > s−1 and ∆K = Y2σI,a
√πa > ∆Kth (18)
Where Y is the crack shape correction factor, a is the crack size and 2σI,a = ∆σI . Note that
Equations 18 are valid for a fixed R-ratio and crack geometry.
In first approximation, crack closure has been neglected in this paper. For the sake of simplicity
it will be assumed that the two damage mechanisms are characterised by the same degree of scatter.
This is equivalent to assuming that the Weibull shape parameters are the same (or m = m1 = m2).
By substituting equations 18 into equation 16 the following expression for the fatigue strength as
a function of the probability of failure, and the crack length, can be established:
σI,a (PF , a) =
ln
(
1
1 − PF
)
(
1
σ′th01
)m
+
(
Y2√πa
∆K′th02
)m
1
m
(19)
Note that the fatigue life, for which PF = 0.5 is given by:
σI,a (PF = 0.5, a) =
ln (2)(
1
σ′th01
)m
+
(
Y2√πa
∆K′th02
)m
1
m
(20)
11

Equation 19, plotted as a function of the crack size, a, for a given probability of failure, results
in a probabilistic Kitagawa-Takahashi diagram. This diagram can be used to predict the fatigue
strength of a material with and without the presence of cracks (see Figure 3(a) and (b)). As
previously discussed the diagram can be divided into three zones:
• Zone 1: When the crack length is small, the fatigue strength is controlled by the initiation
damage mechanism. Mathematically, the term
(
Y2√πa
∆K′th02
)m
in the dominator of equation 19
represents mechanism 2 and is much smaller than the term
(
1
σ′th01
)m
defining mechanism 1.
• Zone 2: is a transition zone in which
(
Y2√πa
∆K′th02
)m
≈
(
1
σ′th01
)m
. This implies that both
damage mechanism are active.
• Zone 3: When crack is large
(
Y2√πa
∆K′th02
)m
≫
(
1
σ′th01
)m
. Which implies that damage mecha-
nism 2 is dominate.
It is very important to understand that, even though LEFM is one of the ingredients used to gen-
erate the Kitagawa-Takahashi diagram, the short crack problem is intrinsically taken into account
via the use of the modelling framework, which combines the two fatigue damage mechanisms.
When the crack or defect size is small, the dominate fatigue damage is due to localised cyclic
plasticity (i.e. mechanism 1) and the contribution from the LEFM part of the model becomes
negligible.
Also with this modelling framework it is possible to predict the fatigue strength for different
probabilities of failure.
Note that the shape of the curve in the transition zone is strongly dependent on the Weibull
exponent or the shape parameter m (see Figure 4). This implies that the scatter associated with
the fatigue strength greatly affects the transition between the two damage mechanisms. When the
scatter increases (i.e. m decrease) the size of the transition zone also increases. Conversely, when
the scatter is negligible (i.e. m tends to infinity) the transition zone is effectively eliminated and
the diagram becomes equivalent to the original Kitagawa-Takahashi diagram with only two lines.
12

Stade I Mode II Stade II Mode I
Competition
Stade I Mode II
Stade II Mode Ia)
b)
100
1 10 100
σI,
a (M
Pa)
crack size a (µm)
PF=0,9
PF=0,5
PF=0,1
Fig. 3: Kitagawa-Takahashi diagram, corresponding to Equation 19, for difference failure probabilities showing the
fatigue damage mechanisms a) without and b) with initial defects for the three zones of the diagram. For uniaxial
push-pull loads (m = 20, σ′th01= 234MPa,Y = 2/π,∆K′
th02= 2.3MPa.m1/2)
3.2. Comparison with the El Haddad approach
One of the original solutions to the LEFM short crack problem was proposed by El Haddad
[9], who introduced the material constant, ao, such that fatigue strength of a cracked body (and the
Kitagawa-Takahashi diagram) could be described by:
2σ1,a =∆Kth
Y√π (a + ao)
where ao =1
π
(
∆Kth
2s−1
)2
(21)
It can be demonstrated mathematically that the El Haddad approach is in fact a specific case
of the proposed probabilistic modelling framework defined by Equation 19 for a uniaxial loading
13

100
1 10 100
σI,
a (M
Pa)
crack size a (µm)
m=2
m=5
m=20
m=40
m
Fig. 4: Kitagawa-Takahashi diagram, corresponding to Equation 19, for different Weibull exponents m and for a
probability of failure of PF = 0.5
condition. The El Haddad equation corresponds to an Weibull exponent of m = 2 and a probability
of failure of PF = 0.544. The exact correspondence is given by:
2σI,a (0.544, a) =
ln
(
1
1 − 0.544
)
Y
√
πa + a0
∆K′th02
=∆Kth
Y√π (a + ao)
(22)
Figure 5, demonstrates the correspondence between the two approaches for a specific set of
data.
3.3. Extension to multiaxial loads
In order to apply the proposed modelling framework to multiaxial loading conditions, the
Crossland criterion [17] is chosen to model the first damage mechanism associated with crack
14

100
1 10 100 1000
σI,
a (M
Pa
)
crack size a (µm)
probabilistic model PF0,5
probabilistic model PF0,55
probabilistic model PF0,6
El Haddad
Fig. 5: Kitagawa-Takahashi diagram: comparison between the El Haddad approach and the proposed probabilistic
model for uniaxial push-pull loads (∆Kth = 11.9MPa.m1/2, S −1 = 230MPa, m = 2.0, σ′th01= 260MPa, Y =
1.0, ∆K′th02= 13.4MPa.m1/2)
initiation. The equivalent and threshold stresses are given in Table 1. For the sake of simplicity
it will be assumed that even under a multiaxial loading condition the most damaging long crack
opening mode is mode I and that the LEFM criterion discussed above will again be used to model
the second damage mechanism.
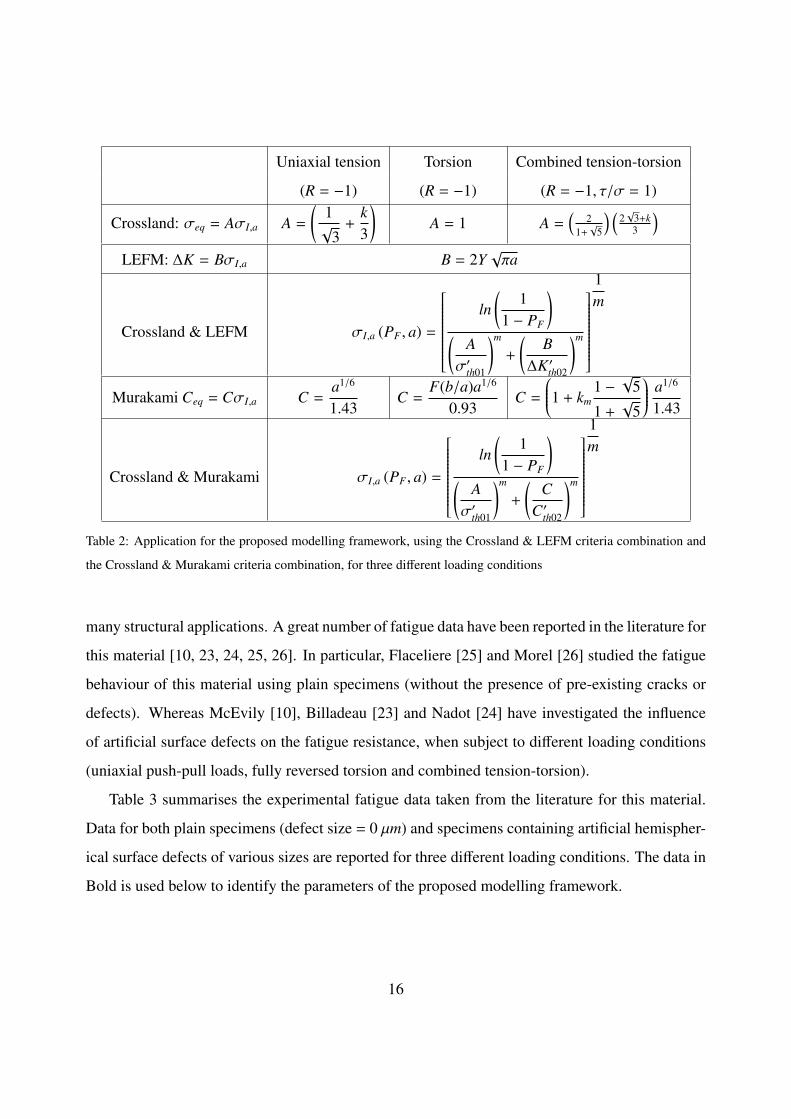
In the following three different loading conditions are investigated. These are: (a) fully re-
versed uniaxial push-pull loads (b) fully reversed torsion, and (c) combined in-phase synchronous
tension-torsion with τ/σ = 1. Table 2 summarises the application of the proposed modelling
framework for these loading conditions.
4. Numerical application using experimental data for the C35 steel
4.1. The material
In this section the proposed fatigue model, summarised in Table 2, will be applied to the C35
steel. This material is a ferrito-perlitic, low alloy steel containing 0.35% carbon that is used for
15
Uniaxial tension Torsion Combined tension-torsion
(R = −1) (R = −1) (R = −1, τ/σ = 1)
Crossland: σeq = AσI,a A =
(
1√
3+
k
3
)
A = 1 A =(
2
1+√
5
) (
2√
3+k
3
)
LEFM: ∆K = BσI,a B = 2Y√πa
Crossland & LEFM σI,a (PF , a) =
ln
(
1
1 − PF
)
(
A
σ′th01
)m
+
(
B
∆K′th02
)m
1
m
Murakami Ceq = CσI,a C =a1/6
1.43C =
F(b/a)a1/6
0.93C =
1 + km
1 −√
5
1 +√
5
a1/6
1.43
Crossland & Murakami σI,a (PF , a) =
ln
(
1
1 − PF
)
(
A
σ′th01
)m
+
(
C
C′th02
)m
1
m
Table 2: Application for the proposed modelling framework, using the Crossland & LEFM criteria combination and
the Crossland & Murakami criteria combination, for three different loading conditions
many structural applications. A great number of fatigue data have been reported in the literature for
this material [10, 23, 24, 25, 26]. In particular, Flaceliere [25] and Morel [26] studied the fatigue
behaviour of this material using plain specimens (without the presence of pre-existing cracks or
defects). Whereas McEvily [10], Billadeau [23] and Nadot [24] have investigated the influence
of artificial surface defects on the fatigue resistance, when subject to different loading conditions
(uniaxial push-pull loads, fully reversed torsion and combined tension-torsion).
Table 3 summarises the experimental fatigue data taken from the literature for this material.
Data for both plain specimens (defect size = 0 µm) and specimens containing artificial hemispher-
ical surface defects of various sizes are reported for three different loading conditions. The data in
Bold is used below to identify the parameters of the proposed modelling framework.
16

Defect size Tension Torsion Tension-Torsion
(µm) s−1(MPa) t−1 (MPa) st−1 (MPa)
0 230 140 185
90 200 140 175
500 150 120 -
Table 3: The fully reversed (R=-1) fatigue strength at 1 × 10⁷ cycles for different loading conditions and defect sizes
(i.e. artificial hemispherical surface defects)
[10]
4.2. The identification procedure
The previously presented model, using the Crossland & LEFM criteria includes five model
parameters (Σ′th01, k,∆K′
th02,m1,m2), which can be reduced to four parameters if it is assumed that
m = m1 = m2. In the following section the method of identifying these parameters is presented.
4.2.1. The parameters m1, m2 or m
For the C35 steel only the scatter associated with the plain specimen fatigue strength is known
[23], in the form of the standard deviation of the Gaussian distribution associated with the fatigue
strength at 1 × 10⁷ of cycles. Hence, in the following it will be assumed that the scatter associated
with the second damage mechanism is equivalent to that of the first mechanism (or that m1 = m2 =
m).
This assumption is made out of necessity, due to the fact that the dispersion associated with the
second mechanism is not reported in the literature. However, it has been observed that for other
metallic materials the parameters m1 and m2 can vary significantly. For example, for the hot rolled
steel, MetascoMC (25MnCrSiVB6), there is more scatter associated with the fatigue strength of
the material without defects than when defects are present (m1 = 30 and, m2 = 48) [14, 15, 16].
For this material the defects were found in the form of clusters of elongated MnS inclusions.
In general, the parameter m associated with the scatter in the fatigue strength can be calcu-
lated from the standard deviation, s−1, and the average fatigue strength, s−1, using the following
relationship.
17
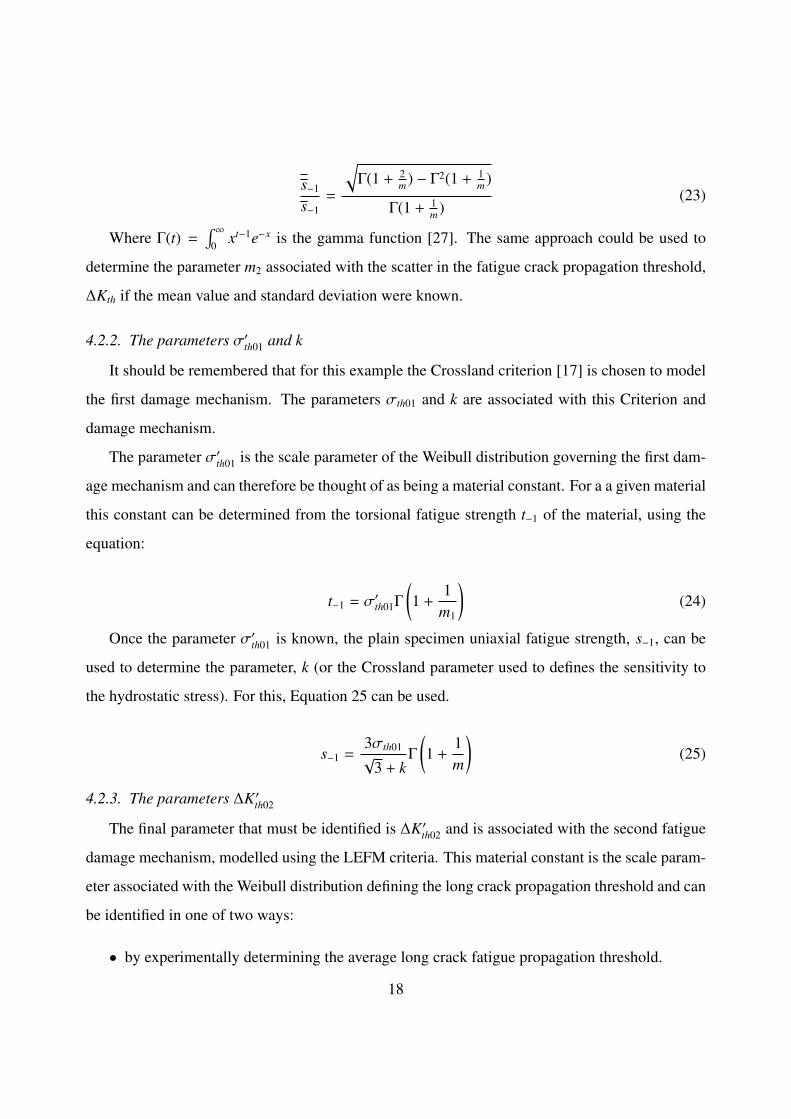
s−1
s−1
=
√
Γ(1 + 2m
) − Γ2(1 + 1m
)
Γ(1 + 1m
)(23)
Where Γ(t) =∫ ∞
0xt−1e−x is the gamma function [27]. The same approach could be used to
determine the parameter m2 associated with the scatter in the fatigue crack propagation threshold,
∆Kth if the mean value and standard deviation were known.
4.2.2. The parameters σ′th01
and k
It should be remembered that for this example the Crossland criterion [17] is chosen to model
the first damage mechanism. The parameters σth01 and k are associated with this Criterion and
damage mechanism.
The parameter σ′th01
is the scale parameter of the Weibull distribution governing the first dam-
age mechanism and can therefore be thought of as being a material constant. For a a given material
this constant can be determined from the torsional fatigue strength t−1 of the material, using the
equation:
t−1 = σ′th01Γ
(
1 +1
m1
)
(24)
Once the parameter σ′th01
is known, the plain specimen uniaxial fatigue strength, s−1, can be
used to determine the parameter, k (or the Crossland parameter used to defines the sensitivity to
the hydrostatic stress). For this, Equation 25 can be used.
s−1 =3σth01√
3 + kΓ
(
1 +1
m
)
(25)
4.2.3. The parameters ∆K′th02
The final parameter that must be identified is ∆K′th02
and is associated with the second fatigue
damage mechanism, modelled using the LEFM criteria. This material constant is the scale param-
eter associated with the Weibull distribution defining the long crack propagation threshold and can
be identified in one of two ways:
• by experimentally determining the average long crack fatigue propagation threshold.
18

• by experimentally determining the fatigue strength of the material for a known crack or
defect size s−1ai
, which is large enough so that the second damage mechanism is dominate.
For the first case Equation 26 can be used.
S −1ai=∆K′
th02
2Y√πaΓ
(
1 +1
m
)
=∆Kth
2Y√πa
(26)
4.2.4. Parameters identified for the C35 steel
Table 4 summarizes the four model parameters identified for the C35 steel, using the fatigue
data and identification procedure outlined above.
Model Parameters
scatter parameter m 24
Crossland σ′th01
143.2 MPa
k 0.09
LEFM ∆K′th02
7.7 MPa√
m
Murakami C′th02
302
Table 4: Model parameters identified for the C35 steel using the Crossland and LEFM or Crossland and Murakami
criteria to model the two damage mechanisms (N = 1 × 10⁷cycles,R = −1)
The parameter m has been determined using Equation 23 by assuming that the standard devia-
tion associated with the uniaxial fatigue strength is 12MPa [23].
4.3. Application using the Crossland & LEFM criteria combination
Figure 6 shows the predictions of the proposed modelling framework using the equations for
the Crossland & LEFM criteria combination (see Table 2). The experimental data listed in Table
3 is also shown.
It can be seen that in the short crack zone of the diagram the Crossland criterion faithfully
predicts the results for the combined tension-torsion loading condition. However, in the long
crack domain, it appears that the LEFM criterion overestimates the fatigue strength.
The difference between the experimental and predicted results, seen in Figure 6, maybe due to
the fact that the experimental results are for artificial surface defects with a hemispherical shape.
19

100
1 10 100 1000 10000
σI,
a (M
Pa
)
crack size a (µm)
tension
torsion
tension-torsion
Fig. 6: Multiaxial Kitagawa-Takahashi type diagram established using the proposed modelling framework and the
Crossland & LEFM criteria combination, for the C35 steel, showing experimental data from the literature (PF = 0.5),
large data points are used for the identification of the model
The uses of the LEFM criterion in the modelling framework, makes the assumption that these
defects are equivalent to cracks. In the following section an arguably more appropriate criterion
for the prediction of the fatigue behaviour of defects will be applied to the same experimental data.
4.4. Application using the Crossland & Murakami criteria combination
In this section, the Murakami criterion [4] will be used to model the second damage mechanism
associated with crack propagation. This empirical approach is well known for its ability to take
into account the fatigue behaviour of artificial and natural defects of various sizes and shapes. In
the following the Murakami criterion will be combined with the Crossland criterion and applied
to the experimental data for the C35 steel presented above.
The Murakami criterion uses the parameter√
area (where area is the projected area of a
defect on a plane perpendicular to the direction of the maximum principal stress) and the hardness
20

to define the fatigue strength. For fully reversed push-pull loads, the following equation can be
used to estimate the fatigue strength:
σw,a =1.43(Hv + 120)
(√
area)1/6(27)
For hemispherical surface defects, the relationship between the crack length, a, and the param-
eter√
area is defined by Murakami [4] as: a = 2√
2/π√
area. Hence, the non-failure condition,
for fully reversed uniaxial push-pull loads, can be written as:
σI,aa1/6
1.43<
Hν + 120
(2√
2/π)1/6(28)
Similarly, for fully reversed torsion loads, the survival condition can be written as:
τw,aF(b/a)a1/6
0.93=σI,aF(b/a)a1/6
0.93<
Hν + 120
(2√
2/π)1/6(29)
Where F is a function of the defect aspect ratio (b/a). For spherical defects F(b/a) = 0.8397
[30].
For combined tension-torsion loads, the extension to the Murakami criterion, proposed by
Endo and Ishimoto [28, 29], will be used. These authors consider that the fatigue strength for a
fully reversed biaxial load can be determined from the uniaxial fatigue strength, such that:
σI,a + kmσII,a = σw,a (30)
Where km represent the effect of a biaxial stress state, determined by means of a stress analysis
and is equal to km = −0.18 for a crack emanating from a round defect such as a hemispherical
surface pit or a drilled hole [30].
The condition of non-failure for this type of loading condition can therefore be written as:
(
σI,a + kmσII,a
)
a1/6
1.43<
Hν + 120
(2√
2/π)1/6(31)
In order to simplify the notation, the following two constants will be used:
• Ceq =(σI,a+kmσII,a)a1/6
1.43represent the equivalent quantity used in the Murakami criterion
21

• Cth02 =Hν + 120
(2√
2/π)1/6represents the threshold quantity with the Murakami criterion.
Using this notation, and following the same procedure outlined above, the expression for the
probability of failure relating to the Murakami criterion (to model the second damage mechanism)
can be expressed as:
PF = 1 − exp
−
[(
σeq
σ′th01
)m1
+
(
Ceq
C′th02
)m2]
(32)
Where C′th02
is the scale factor of the Weibull distribution used to model the scatter in the
threshold quantity (taking into account the scale effect).
These equations are summarised in Table 2.
Figure 7 shows the predictions obtained with the proposed modelling framework, using the
Crossland & Murakami criteria combination. It can be seen that the predictions, for all three
loading conditions, are in very good agreement with the experimental data.
100
1 10 100 1000 10000
σI,
a (M
Pa
)
crack size a (µm)
tension
torsion
tension-torsion
Fig. 7: Multiaxial Kitagawa-Takahashi type diagram established using the proposed modelling framework and the
Crossland & Murakami criteria combination, for the C35 steel, showing experimental data from the literature (PF =
0.5), large data points are used for the identification of the model
22

5. Application to other materials
In this section, two concrete applications of the proposed modelling framework are briefly
presented. These involve the high cycle fatigue behaviour of two very different materials and
engineering applications. Note that these applications are based on previous work done in the
authors research group, and represent very specific applications of the proposed modelling frame-
work, presented above in a more general form. This work is only briefly described below as it has
been well documented elsewhere. [12, 13, 14, 15, 16].As such, the objective of this section is to
highlight the usefulness and flexibility of the proposed modelling framework.
5.1. Forged bainitic steel - Metasco MC
The modelling framework was originally proposed by Pessard et al. [14, 15, 16], in order
to model the anisotropic fatigue behaviour of the hot rolled bainitic steel (Metasco MC) used
in forging applications. For this material it was shown experimentally that two distinct fatigue
damage mechanism can be activated. One damage mechanism involves crack initiation in the
bainitic matrix of the material, and the other was due to cracks forming and propagating from
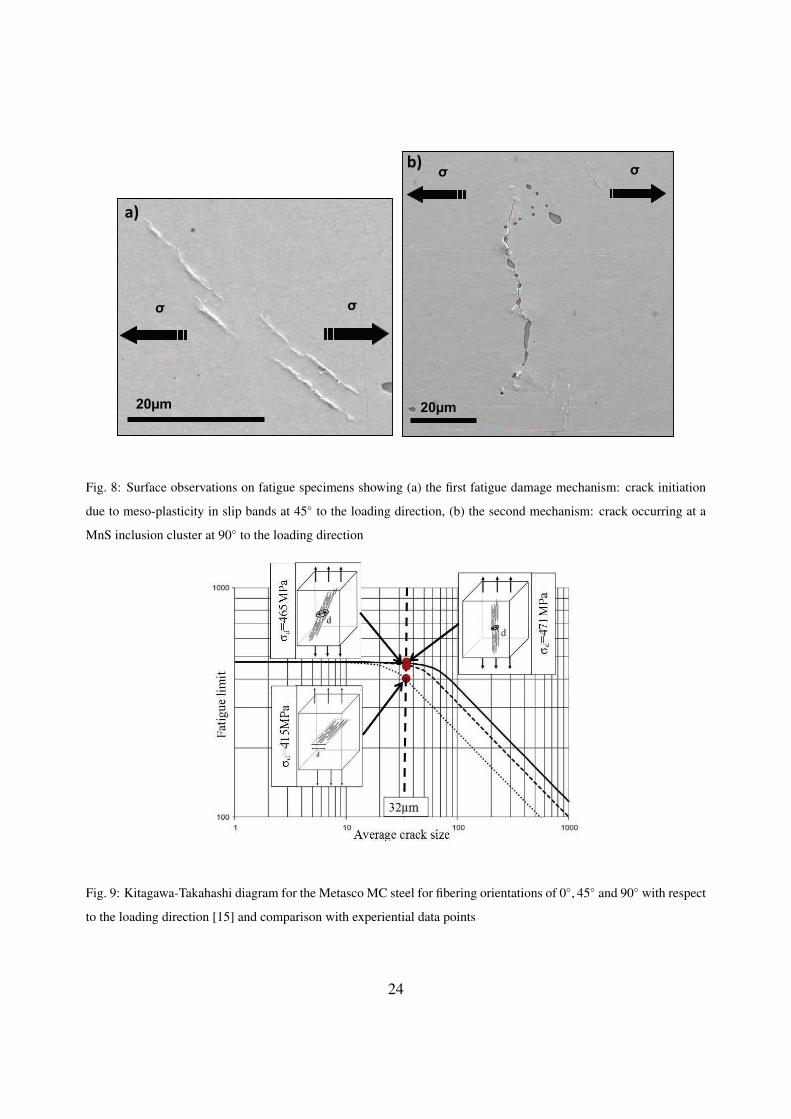
clusters or bands of elongated Magnesium Sulphide inclusions. Figure 8 shows images taken on
the surface of specimens, which illustrate these mechanisms.
Experimental observations showed that the difference in the fatigue behaviour for different
material orientations (with respect to the rolling direction) was due to the activation (or not) of the
second damage mechanism associated with the inclusion clusters.
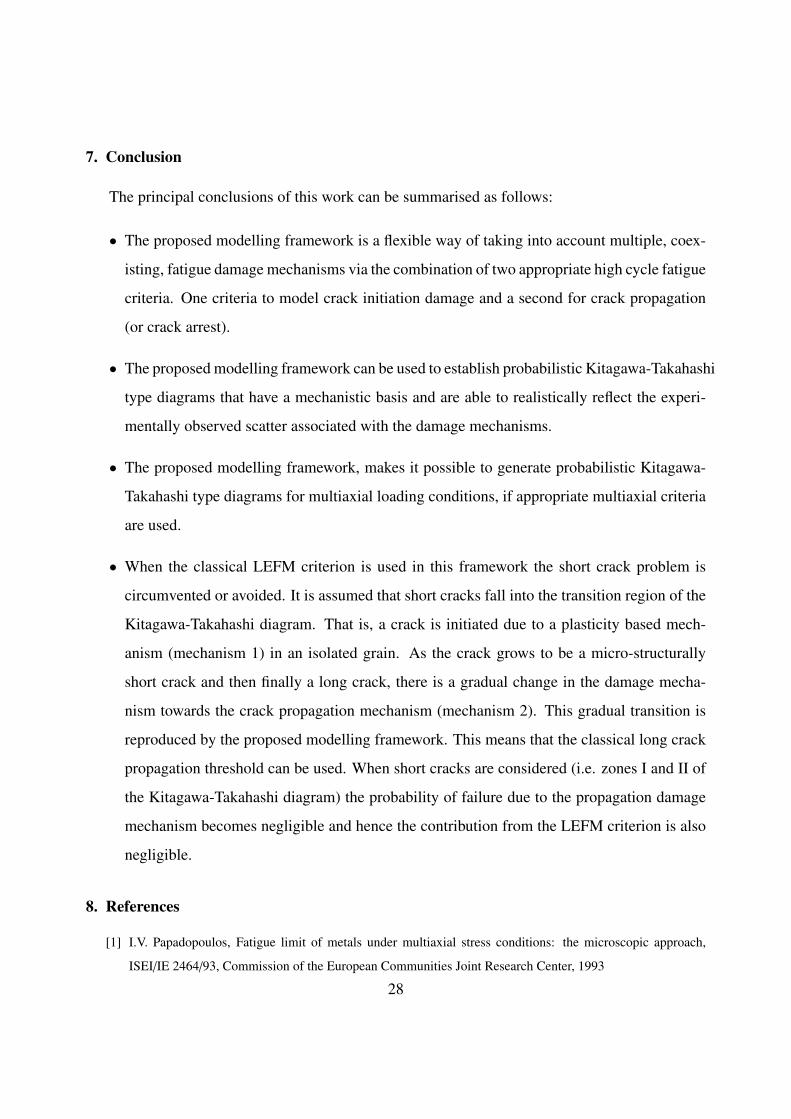
In this work, the probabilistic modelling framework was used in combination with the Morel
and Huyen [26] multiaxial fatigue criterion (to model mechanism 1) and the classical LEFM crite-
rion, in which the inclusion clusters were assimilated to pre-existing cracks (to model mechanism
2). Figure 9 shows that this modelling approach is very successful in predicting the anisotropic
fatigue behaviour of this material.
23
2200µµmm
σσ
σσ
2200µµmm
σσ
σσ
b)
a)
Fig. 8: Surface observations on fatigue specimens showing (a) the first fatigue damage mechanism: crack initiation
due to meso-plasticity in slip bands at 45 to the loading direction, (b) the second mechanism: crack occurring at a
MnS inclusion cluster at 90 to the loading direction
Fig. 9: Kitagawa-Takahashi diagram for the Metasco MC steel for fibering orientations of 0, 45 and 90 with respect
to the loading direction [15] and comparison with experiential data points
24

5.2. Cast aluminium alloys
The second application example concerns the high cycle fatigue behaviour of the AlSi7Cu05Mg03-
T7 cast aluminium alloy. Koutiri et al. [12, 13] showed experimentally, that for this material, two
fatigue damage mechanism can also be identified. These are illustrated in Figure 10. The first
mechanism is associated with crack initiation in the eutectic zones of the material and is assumed
to be controlled by a micro-plasticity type mechanism. The second mechanism is associated with
the propagation of cracks from micro-shrinkage pores.
Fig. 10: Surface observations on fatigue specimens showing (a) the first fatigue damage mechanism involving crack
initiation at Silicon particles in the eutectic zones, (b) the second damage mechanism involving crack growth from a
micro-shrinkage pore. Note that the presence of intermetallic phases acting as microstructural barriers to further crack
propagation
The probabilistic modelling framework was used in combination with the Morel and Huyen
[26] fatigue criterion (to model mechanism 1) and the classical LEFM criterion, modified to take
into account the mean stress effect, for the second damage mechanism concerning the propagation
of cracks from micro-shrinkage pores. This modification was base on a Klesnil and Lucas [31]
type correction so that the crack propagation threshold becomes a function of the load ratio.
For this material the proposed modelling framework, takes into account both of these dam-
age mechanisms, and models the state of competition between them. This leads to a probabilistic
Kitagawa-Takahashi type diagram (see Figure 11), which in this case explains the relationship
between the fatigue behaviour of the material and the different casting processes or post-casting
25

Fig. 11: Probablisitic Kitagawa-Takahashi diagram for the AlSi7Cu05Mg03-T7 cast aluminium alloy [13], schemati-
cally showing the effect of the HIP treatment
treatments. For example, a gravity cast components typically has a micro-shrinkage pore popula-
tion characterised by large pore sizes. The presence of large defects leads to the rapid activation
and dominance of the second damage mechanism. This was the case for the gravity sand cast
material investigated by Koutiri et al. [12, 13] for which it was found that the final failure was typ-
ically caused by fatigue cracks that originated from large micro-shrinkage pores. Conversely, for
a very similar material treated by the HIP post-casting process, so that micro-shrinkage porosity
is dramatically reduced, the fatigue strength is controlled by the first fatigue damage mechanism
[32] (see Figure 11).
6. Discussion
Since, the original publication of the Kitagawa-Takahashi diagram in 1976 [8] many researchers
have investigated the short crack problem and have proposed high cycle fatigue criteria capable
of predicting the fatigue strength of materials containing both long and short fatigue cracks. Two
notable examples are discussed below.
26

It was shown in 1999 by Taylor [33] that the Theory of Critical Distances in which the fatigue
strength is evaluated at a critical distance in front of a crack or notch, correctly predicts the be-
haviour of short cracks. Indeed the line method, advocated by Taylor in the publication cited above
is strictly equivalent to the El Haddad approach. These critical distance methods are extremely at-
tractive, due to their simplicity. However, the mechanistic basis for why they work is still missing,
even if Taylor and his co-workers have made efforts to establish this fundamental link [34, 35].
Another recent approach that is successful in resolving the short crack problem was proposed
by Thieulot-Laure et al.[36]. This model is based on the critical distortional energy in the crack
tip region, calculated using a linear elastic fracture mechanics approach. In particular, the first
non-singular term of the asymptotic development of the elastic stress field close to the crack tip,
(i.e. the T-stress) is used. The approach takes into account the defect size distribution, defect
orientations, shapes and positions for multiaxial loading. The authors have demonstrated that their
prediction are close to those of the Dang Van criterion for very small cracks.
Even if these criteria result in correct predictions for the short crack problem, our experimental
observations of fatigue damages mechanisms lead us to advocate the proposed modelling frame-
work [12, 13, 14, 15, 16] , which uses a probabilistic approach to explicitly take into account the
change in damage mechanism, which is at the origin of the Kitagawa-Takahashi diagram and the
short crack problem. Note also, that in this article the Crossland criterion has been used for sake
of simplicity. More sophisticated criterion such as the Morel and Huyen criterion [26] can and
have been used in this modelling framework. As such, it is very important to understand that the
identification procedure and the results obtained strongly depend on the criteria chosen to model
the two damage mechanisms.
The choice, to explicitly model multiple damage mechanisms, is also confirmed by the exper-
imental observations of other researchers, in particular Endo and Ishimoto [29], who showed that
for sufficiently small defect sizes, crack initiation does not necessarily occur from either natural or
artificial defects. In practice, when small artificial defects are introduced at the surface of smooth
specimens, cracks often initiate in areas outside the zone of influence of the defect.
27
7. Conclusion
The principal conclusions of this work can be summarised as follows:
• The proposed modelling framework is a flexible way of taking into account multiple, coex-
isting, fatigue damage mechanisms via the combination of two appropriate high cycle fatigue
criteria. One criteria to model crack initiation damage and a second for crack propagation
(or crack arrest).
• The proposed modelling framework can be used to establish probabilistic Kitagawa-Takahashi
type diagrams that have a mechanistic basis and are able to realistically reflect the experi-
mentally observed scatter associated with the damage mechanisms.
• The proposed modelling framework, makes it possible to generate probabilistic Kitagawa-
Takahashi type diagrams for multiaxial loading conditions, if appropriate multiaxial criteria
are used.
• When the classical LEFM criterion is used in this framework the short crack problem is
circumvented or avoided. It is assumed that short cracks fall into the transition region of the
Kitagawa-Takahashi diagram. That is, a crack is initiated due to a plasticity based mech-
anism (mechanism 1) in an isolated grain. As the crack grows to be a micro-structurally
short crack and then finally a long crack, there is a gradual change in the damage mecha-
nism towards the crack propagation mechanism (mechanism 2). This gradual transition is
reproduced by the proposed modelling framework. This means that the classical long crack
propagation threshold can be used. When short cracks are considered (i.e. zones I and II of
the Kitagawa-Takahashi diagram) the probability of failure due to the propagation damage
mechanism becomes negligible and hence the contribution from the LEFM criterion is also
negligible.
8. References
[1] I.V. Papadopoulos, Fatigue limit of metals under multiaxial stress conditions: the microscopic approach,
ISEI/IE 2464/93, Commission of the European Communities Joint Research Center, 1993
28

[2] D.L. Mc Dowell, K. Gall, M.F. Horstemeyer, J. Fan, Microstructure-based fatigue modeling of cast A356-T6
alloy, Eng Fract Mech, (2003), Vol. 70, pp. 49-80
[3] A. Fatemi, D. F. Socie, Critical plane approach to multiaxial fatigue damage including out-of-phase loading,
Fatigue and Fracture of Engineering Materials and Structures, (1988), vol. 11-3, pp. 149-165
[4] Y. Murakami (2002) Metal Fatigue : effects of small defects and non-metallics inclusion. London Elsevier
[5] S. Suresh, R.O Ritchie, Geometric model for fatigue crack closure induced by fracture surface roughness,
Metall. Trans. A, (1982), vol. 13A-N9, pp. 1627-1631
[6] S. Suresh, Fatigue of materials - Second edition, Cambridge University Press, Cambridge, 2004
[7] P.J.E. Forsyth, A two stage process of fatigue crack growth, In Crack Propagation: Proceedings of Cranfield
Symposium, (1962), pp. 76-94, London: Her Majesty’s Stationery Office
[8] H. Kitagawa , S. Takahashi, Applicability of fracture mechanics to very small cracks. In: ASM Proceedings
of 2nd international conference on mechanical behaviour of materials. Metalspark, Ohio; 1976, pp. 62731
[9] M.H. El Haddad , T.H. Topper , K.N. Smith, Prediction of non propagating cracks, Eng F Mech,(1979), vol.
11, pp. 573-584
[10] A.J. McEvily,M. Endo, S. Ishihara, The inuence of biaxial stress on the fatigue behaviour of defect-containing
steels. ICF11. 2005
[11] P. Lukas, L. Kunz, B. Weiss, R. Stickler, Notch Size Effect in Fatigue, Fatigue Fract. ENgn Mater. Struct.,
(1989), Vol. 12 - 3, pp. 175-186
[12] I. Koutiri, D. Bellett, F. Morel, L. Augustins, J. Adrien, High cycle fatigue damage mechanisms in cast
aluminium subject to complex loads, Int J Fatigue, Vol. 47, (2013), pp. 4457
[13] I. Koutiri, D. Bellett, F. Morel, E. Pessard, A probabilistic model for the high cycle fatigue behaviour of cast
aluminium alloys subject to complex loads, Int J Fatigue, Vol. 47, (2013), pp. 137147
[14] E. Pessard, F. Morel, A. Morel, The anisotropic fatigue behavior of forged steel, Advanced Engineering
Materials, (2009), Vol. 11, pp. 732-735
[15] E. Pessard, F. Morel, A. Morel, D. Bellett, Modelling the role of non-metallic inclusions on the anisotropic
fatigue behaviour of forged steel, Int. J. Fatigue, (2011), Vol. 33-4, pp. 568-577
[16] E. Pessard, F. Morel, C. Verdu, L. Flaceliere, G. Baudry, Microstructural heterogeneities and fatigue
anisotropy of forged steels, Materials Science and Engineering A, (2011), Vol. 529-1, pp. 289-299
[17] B. Crossland, Effect of large hydrostatic pressures on the torsionnal fatigue strength of an alloy steel, Int conf
on Fatigue of Metals, (1956), London
[18] K. Dang Van, Sur la resistance a la fatigue des metaux, Sci Tech Armement, 1973, 47
[19] E. Charkaluk, A. Constantinescu, H. Matournam, K. Dang Van, Revisiting the Dang Van criterion, Procedia
Engineering, (2009), vol 1-1, pp 143-146
[20] W. Weibull, A statistical theory of the strength of materials, Roy. Swed. Inst. Eng. Res., Report 151, 1939
29

[21] W. Weibull, A statistical distribution function of wide applicability, ASME J Appl Mech, (1951), 18, pp.
293-297
[22] A.M. Freudenthal, in: H. Liebowitz (Eds.), Fracture vol 2, Academic Press, New York, 1968, pp. 591-619
[23] T. Billaudeau,Y. Nadot,G. Bezine ,Multiaxial fatigue limit for defective materials: mechanisms and experi-
ments, Acta Materialia, (2004), vol 52, pp. 3911-3920
[24] Y. Nadot, T. Billaudeau, Multiaxial fatigue limit criterion for defective materials, Engineering Fracture Me-
chanics, (2006), vol. 73-1 , pp. 112-133
[25] L. Flaceliere, F. Morel, A. Dragon Competition between mesoplasticity and damage under HCF Elastic-
ity/damage shakedown concept,International Journal of Fatigue, (2007), vol. 29, pp. 2281-2297
[26] F. Morel and N. Huyen, Plasticity and damage heterogeneity in fatigue, Theoretical and Applied Fracture
Mechanics, (2008), vol. 49-1, pp. 98-127
[27] M. Abramowitz, A. Stegun, Handbook of Mathematical Functions, Dover, New York, 1965.
[28] M. Endo,The multiaxial fatigue strength of specimens containing small defects. In: Carpinteri A, de Freitas
M, Spagnoli A, editors. Biaxial/multiaxial fatigue and fracture ESIS publication, vol. 31. Elsevier, 2003, pp.
243-264
[29] M. Endo, I. Ishimoto, The fatigue strength of steels containing small holes under out-of-phase combined
loading, Int J Fatigue (2006), vol. 28, pp. 592-597.
[30] S. Beretta, Y. Murakami, SIF and threshold for small cracks at small notches under torsion, Fatigue Fract
Engng Mater Struct, (2000), vol. 23, pp. 97-104
[31] M. Klesnil, P. Lukas, Effect of stress cycle asymmetry on fatigue crack growth, Mater Sci Eng, (1972), Vol.
9, pp.23140
[32] J. Fan, D.L. Mc Dowell, M.F. Horstemeyer, K. Gall, Cyclic plasticity at pores and inclusions in cast AlSi
alloys, Eng Fract Mech, (2003), vol. 70, pp. 281-302
[33] D. Taylor, Geometrical effects in fatigue: a unifying theoretical model, Int J Fatigue, (1999), vol. 21, pp.
413-420
[34] D. Taylor, A mechanistic approach to critical-distance methods in notch fatigue, Fatigue Fract Engng Mater
Struct, (2001), vol. 24, pp. 215-22
[35] D. Taylor, P. Cornetti, N. Pugno, The fracture mechanics of finite crack extension, Engineering Fracture
Mechanics, (2005), vol. 72, pp. 1021-1038
[36] E. Thieulot-Laure, S. Pommier, S. Frechinet, A multiaxial fatigue failure criterion considering the effects of
defects, Int. J. Fatigue, (2007), vol. 29, pp. 1996-2004
30