a master plan for managing solid waste - appendices | october 2010 a master plan for managing solid...
TRANSCRIPT

DENVER PUBLIC WORKS PRESENTS
A MASTER PLAN FOR MANAGING SOLID WASTE IN THE
MILE HIGH CITY ‐ APPENDICES
OCTOBER 2010

APPENDICES | OCTOBER 2010
A MASTER PLAN FOR MANAGING SOLID WASTE IN THE MILE HIGH CITY ii
APPENDICES
APPENDIX A – Intentionally left blank
APPENDIX B — Denver Legal Summary of Solid Waste Rules and Regulations
APPENDIX C — Denver Solid Waste Management ‐ Public Involvement Report (July 2009)
APPENDIX D — Increasing Residential and Commercial Organics Waste Diversion in the City and
County of Denver (August 2009)
APPENDIX E — Policy Survey of Comparable Cities (April 2008) and Ten‐City Re‐Survey
(November 2009)
APPENDIX F — Denver Solid Waste Management Plan Projections Memorandum (November
2009)
APPENDIX G — Denver Solid Waste Management Plan Final Report Spring/Fall 2008 Waste
Composition Analysis (March 2009)
APPENDIX H — Refuse, Recycling and Organics Collection Cost Analysis
APPENDIX I — Projected Recyclables Revenues
APPENDIX J — LIP, Overflow and Litter Collection Cost Analysis
APPENDIX K — Short‐Term Drop‐Site Collection Cost Analysis
APPENDIX L — Public Education Cost Analysis
APPENDIX M — Long‐Term Drop‐Site Analysis
APPENDIX N — Transfer Station Cost Analysis

APPENDICES | OCTOBER 2010
A MASTER PLAN FOR MANAGING SOLID WASTE IN THE MILE HIGH CITY iii
LIST OF ACRONYMS
C&D Construction and Demolition
CCTS Cherry Creek Transfer Station
CPC Central Platte Campus
CY Cubic Yard
DADS Denver Arapahoe Disposal Site
DIA Denver International Airport
DSWM Denver Solid Waste Management
EO Executive Order
E‐Waste Electronic Waste
FTE Full Time Equivalents
HHs Households
HHW Household Hazardous Wastes
ICI Institutional, Commercial and Industrial
Waste
LEED Leadership in Energy & Environmental
Design
LIP Large Item Pick‐up
MFU Multi‐Family Unit
MRF Material Recovery Facility
MSW Municipal Solid Waste
NAICS North American Industry Classification
System
PAYT Pay‐As‐You‐Throw
SFU Single‐Family Unit
SWMP Denver Solid Waste Master Plan
WCS Waste Composition Study
USEPA U.S. Environmental Protection Agency
WMC Waste Management of Colorado
WMRA Waste Management Recycle America

APPENDICES | OCTOBER 2010
A MASTER PLAN FOR MANAGING SOLID WASTE IN THE MILE HIGH CITY
APPENDIX B Denver Legal Summary of Solid Waste Rules and Regulations

The management and collection of solid waste is subject to legal requirements set forth in state law as
well as the Home Rule Charter of the City and County of Denver, Denver municipal ordinances, and
regulations adopted by the Department of Public Works. The following summary1 is provided for the
convenience of the reader and is not intended to provide legal advice. The reader is cautioned to
consult the code itself to learn the specifics of the provisions generally described below.
State Law
A solid waste is defined as follows:
“(a) "Solid waste" means any garbage, refuse, sludge from a waste treatment plant, water supply
treatment plant, or air pollution control facility, and other discarded material, including solid, liquid,
semisolid, or contained gaseous material resulting from industrial or commercial operations or from
community activities.
(b) "Solid waste" does not include:
(I) Any solid or dissolved materials in domestic sewage;
(II) Agricultural wastes;
(III) Solid or dissolved materials in irrigation return flows;
(IV) Industrial discharges which are point sources subject to permits under the provisions of the
"Colorado Water Quality Control Act", article 8 of title 25, C.R.S.;
(V) Materials handled at facilities licensed pursuant to the provisions on radiation control in
article 11 of title 25, C.R.S.;
(VI) Exploration and production wastes, as defined in section 34-60-103 (4.5), C.R.S., except as
such wastes may be deposited at a commercial solid waste facility;
(VII) Excluded scrap metal that is being recycled; or
(VIII) Shredded circuit boards that are being recycled.” 30-20-101(6), C.R.S. (2009).”
Any person who owns or operates a solid waste disposal site and facility must obtain a certificate of
designation from the governing body having jurisdiction over the area in which the site and facility is
located. The statute also establishes the process for acquiring a certificate of designation from a county
or municipality. The solid and hazardous waste commission is charged with the adoption of rules for the
engineering design and operation of solid waste disposal sites and facilities, and the statute lists
minimum standards which these rules must contain. State inspection and enforcement authorities,
violations, and civil penalties are also prescribed.
Land disposal of certain residentially generated wastes is banned and requirements for their recycling
have been established2.
County powers to adopt ordinances for control or licensing of matters of purely local concern are
enumerated, including the removal of rubbish3, inspection of vehicles involved in the transporting of
1 This summary is based upon the state statutes and municipal code as of January 31, 2010 and does not include
any subsequent enactments or amendments. 2 Solid Waste Disposal Limitations, 30-20-1001 et seq., C.R.S. 2009
trash4, and regulating the activities of those transporting trash5. Home rule counties6 have the
specifically enumerated power to regulate and prevent the throwing or depositing of ashes, garbage, or
any offensive matter in, and to prevent any injury to, any road, street, avenue, alley, or public ground7.
Home rule cities cannot grant an exclusive territory or regulate rates for the collection and
transportation of ashes, trash, waste, rubbish, garbage, or industrial waste products or any other
discarded materials8, 9. Notice and other procedural requirements are established for persons and/or
governments wishing to start/modify a trash hauling service, or to establish user charges for waste
services provided by a governmental body10.
The general police powers of municipalities include protection of public health, declaring and abating
nuisances, and compelling the removal of rubbish from tracts of land, alleys, and sidewalks and to make
assessments/liens for such costs11. Municipalities have the power to develop and operate solid waste-
to-energy incineration systems12. These specific grants of power apply to statutory cities and can fill in
where our local laws are silent. But, Denver, as a home rule city, has the authority to legislate in matters
of local concern.
Home Rule
The Colorado Constitution, Article XX, §1 establishes the powers of home rule cities to operate public
utilities local in use and extent, in whole or in part, and everything required therefore for the use of city
and county and its inhabitants. The Constitution also provides that a home rule charter supersedes
state law in conflict for wholly local and municipal matters, §6; and, that home rule cities have the full
right of self government for local and municipal matters, §6.
This means that the state Constitution, statutes, and regulations control matters of statewide concern,
as well as matters of mixed state and local concern. The home rule charter, city ordinances, and
regulations control matters of purely local concern. If a state law purports to regulate activity, then it is
applicable. If a state law merely grants a power to a city, then the home role city can choose whether to
implement that power.
Charter of the City and County of Denver
The Home Rule Charter of the City and County of Denver establishes powers and duties that are
exclusively vested in the Department of Public Works, including:
3 30-15-401(1)(a)(I)(A), C.R.S. (2009)
4 30-15-401(1)(a)(II), C.R.S. (2009)
5 30-15-401(1)(a)(IV) and (VI)
6 Denver is a home rule city, but not a home rule county.
7 30-35-201(13)(d), C.R.S. 2009
8 30-15-401(1)(a)(III)
9 “… (T)he governing body of a city and county shall not be precluded from adopting ordinances, regulations, codes, or standards or
granting permits issued pursuant to home rule authority; except that such governing body shall not grant an exclusive territory or regulate rates for the collection and transportation of ashes, trash, waste, rubbish, garbage, or industrial waste products or any other discarded materials,” 30-15-401(5) C.R.S. 2009. 10
30-15-401(6) – (7.5), C.R.S. 2009 11
31-15-401, C.R.S. 2009 12
31-15-1001 et seq., C.R.S. 2009

“(E) Collection of sewage, trash, garbage, offal and other offensive substances.
Management and control of the collection, removal and disposition of all sewage, trash,
garbage, offal and other offensive substances either by the Department or under
contracts let by the Department. For the purposes of this Section, and in the manner
and pursuant to terms and conditions fixed by the Mayor and the cabinet and subject to
ordinance or resolution approval by the Council, the Department may enter into such
contracts as in the judgment of the Manager are to the best interests of the City and
County.” D.R.M.C. 2.3.3.
Denver Revised Municipal Code, Title 48 Solid Waste
Denver Revised Municipal Code Title 48 sets forth the local law concerning solid waste – garbage,
household garbage, commercial garbage, rubbish, litter and refuse. Broadly speaking, title 48 regulates
the collection and disposition of trash however denominated.
Article I simply states that it is unlawful to place any garbage into any ash pit or incinerator.
Article II – Household Garbage. Household garbage is the food waste generated in private, household
kitchens, and must be placed in a closed, watertight container of not more than forty-gallon capacity.
This container needs to be placed where it may be conveniently emptied and removed by the garbage
collector.
Article III – Commercial Garbage. Commercial garbage is the food waste generated by places licensed by
the City to serve food for human consumption. This does not include canneries, slaughterhouses,
packing plants, potato chip processors, or similar industries. Commercial garbage must be stored in
covered watertight containers, and must be removed and disposed of at least twice in each week.
Article IV - Rubbish. Rubbish falls into different categories. Ashes are the solid waste products of
combustion of any material. Building rubbish is the waste material from construction, remodeling, and
repair operations such as stones, bricks, plaster, concrete, roofing, etc. Yard rubbish is waste material
from the yard and garden such as tree branches, twigs, grass, leaves, etc. Household rubbish originates
from the ordinary household and includes waste other than food waste, ashes, and yard rubbish.
Collections of household rubbish, yard rubbish, and cold ashes are to be made in accordance with the
rules and regulations of the Manager of Public Works. If the rules allow for collection of household
rubbish, yard rubbish, and cold ashes, then the rubbish must be stored in accordance to the rules and
regulations. If the rules do not allow for collection, then the person from whose premises the
household rubbish, yard rubbish, and cold ashes originates must store the rubbish/cold ashes in a
sanitary manner and provide for the private collection and removal of the rubbish/cold ashes.
The Managers of Environmental Health and/or Public Works (or their authorized representatives) may
order the owner/occupant/agent of any premises to remove an accumulation of any rubbish, ashes,
garbage, or other waste matter within a reasonable time. This order can be made when the
accumulation is offensive to sight; generates a propagation of rats, vermin, flies, or other insects; or is in
any manner hazardous to the public health. The Managers and their authorized representatives have a
right of entry onto property to conduct a reasonable inspection to see if an accumulation of the above

wastes exists. If the owner/occupant/agent does not comply with an order to remove the accumulation
of waste within a specified reasonable time, then the City may remove the accumulation after notice to
the owner/occupant/agent. The City may bill the owner/occupant/agent of the premises for the cost
and expense of removing the waste, and may further initiate a lien against the property if not paid
within thirty days of billing.
Except for waste paper that is disposed in City maintained waste disposal containers, it is unlawful to
dispose of any rubbish, ashes, or other waste matter on any premises other than those designated as
official city dumps. Additionally, except where allowed by rules and regulations, garbage from
canneries, slaughter houses, packing houses, or similar industries cannot be disposed at any official city
dump.
Non-residents of the City and commercial users are not allowed to deposit any rubbish or other waste
material in city-owned trash containers. Additionally, it is unlawful for City residents to deposit any
rubbish or other waste matter in city-owned trash containers in violation of rules and regulations of the
Manager of Public Works.
The Manager of Public Works is empowered to enforce these provisions.
Article V – Rubbish Haulers. Persons who transport any rubbish or garbage within the City in or on any
motor vehicle must register the vehicle with the Department of Public Works and receive a rubbish
hauler registration number. Additionally, vehicles transporting rubbish within the City must have the
name and telephone number of the rubbish hauler, and the rubbish hauler’s registration number
painted on both sides of the vehicle. Exception: Vehicles equipped with a mechanical compactor or roll-
off rubbish container unit do not need to register or have the markings listed above.
Rubbish haulers must also obtain a receipt from any solid waste disposal site and facility in which they
deposit and must maintain copies of all receipts obtained for one year from the date of deposit.
Article VI – Littering of Watercourses. It is unlawful to dump or deposit any refuse (putrid or offensive
substances like dung, carrion, dead animals, etc.) upon any embankment or into any lake, pond,
reservoir, stream, or watercourse; or any place where the natural flow of drainage would lead to the
above areas. It is also unlawful to dump or deposit any garbage or rubbish upon any embankment or
into any lake, pond, stream, or watercourse, unless the City designates the area for the purpose of
dumping; the garbage or rubbish is placed in an appropriate receptacle on such property; the person
depositing owns such property or has obtained written consent from the owner; or the depositing is
done under the direction of the owner in lawful possession of such property. Anytime refuse, garbage,
or rubbish is deposited from a motor vehicle, the driver will be presumed to have caused the waste
material to be deposited from the motor vehicle.
Article VII – Certificate of Designation. Any person who operates a solid waste disposal site and facility
within the City and County of Denver is required to obtain a certificate of designation from the city
council acting by ordinance following a public hearing held at a regular council meeting. The city council
must take into account the effect on the surrounding property, the convenience of the site, the ability of

the site to comply with state law and state rules and regulations concerning health, and consistency of
the site with the comprehensive plan of the City and County of Denver. City council shall not issue the
certificate if the state or Manager of Environmental Health recommend disapproval, and city council can
revoke or suspend the certificate after reasonable notice and a public hearing if the site fails to comply
with all applicable laws, resolutions, and ordinances.
Article VIII – Disposal Fees. This article deals with radioactive waste and radium contaminated material.
Radioactive waste and radium contaminated materials are defined terms. The City will charge
$5.10/cubic foot of radioactive waste or radium contaminated material to any person disposing or
implementing a remedial control of the above material, unless the disposal is incidental to installation,
maintenance, repair, improvement, or replacement of utilities, streets, sidewalks, and alleys in public
rights-of-way. Permanent disposal and control of radioactive waste and radium contaminated material
are not permitted uses of property. Money collected from the radioactive waste disposal fee shall be
used to fund city costs associated with regulation, oversight, management, control and disposal of
radioactive waste. Any person who disposes or implements a remedial action to control radioactive
waste or radium contaminated material that results in the waste or material remaining on property
within the City and County of Denver must record in the real property records of the City’s Clerk and
Recorder a document stating the volume of waste or material remaining in the City and County of
Denver.
Rules and Regulations
The Manager of Public Works has the authority to issue rules and regulations regarding the collection,
removal and disposition of household garbage and commercial garbage; the categories of dwelling units
from which collection of household rubbish, yard rubbish, and cold ashes are made and the storage of
these wastes; registration of rubbish haulers.
Public Works Rules and Regulations – Governing the Preparation, Storage, and Collection of Household and Yard Rubbish
The Manager has adopted rules and regulation pertaining to household and yard rubbish, dated October
15, 1993.
Section II of the Rules and Regulations lists terms and definitions. The rules and regulations define
authorized residences, prescribed containers, collection types, acceptable waste, and the hours of
collection.
Section III deals with the collection of rubbish, for which a schedule and other requirements are
established.
Section IV of the Rules and Regulations presents the Department’s enforcement policy: agency
representatives are directed to attempt to gain voluntary compliance, with the Manager deciding
disputes. Repeated or gross violations may result in the issuance of a notice of violation up to and
including a court summons.

Section V deals with disposal of rubbish. The Manager determines the place for disposal of rubbish,
using route efficiency and costs in this determination. However, this regulation is superseded by
Executive Order 115, the City’s Landfill Agreement, and the City’s Solid Waste Agreement which require
the City to direct all non-hazardous waste that the city collects or generates to the Denver Arapahoe
Disposal Site (“DADS”). DADS is owned by the city. Non-hazardous waste, for this purpose, includes all
municipal, residential and commercial solid waste including construction debris, soil and asbestos.
Section VI states that situations involving day-to-day operations that are not listed in the rules and
regulations should be resolved by an authorized representative of the department, and retains ultimate
decision authority in the Manager.
Other Code provisions
The Municipal Code ordinances pertaining to Solid Waste are largely found in Title 48 and are
summarized, above. The Code also contains various provisions related to other requirements for waste
management which are not directly pertinent to this discussion, such as the following:
Chapter 19 – Excavation Section 19-16(6) (no garbage for backfill of clay/sand/ gravel pits)
Chapter 27 – Housing Section 27-23 (every occupant shall dispose of rubbish …)
Chapter 35 – Mobile Homes and Trailers
Sections 35-19 (rubbish containers); 35-21 (garbage disposal, incineration); 35-38 (garbage storage and removal)
Chapter 37 – Nuisances Section 37-53 (trash removal as condition of suspended sentence)
Chapter 39 – Parks and Recreation
Section 39-18 (littering prohibited including rubbish, waste, garbage, refuse, other trash)
Chapter 40 – Pest Control Section 40-50 (unlawful to accumulate garbage, trash to remain in building, land, or waterway)
Chapter 49 – Streets, Sidewalks, and Other Public Ways
Sections 49-512 (trash-free news racks); 49-550.20 (trash-free express mail drop boxes); 49-552 (containerized or covered garbage/trash transportation); 49-553 (unlawful to deposit/litter any street, alley, public place with rubbish, waste, garbage)
Chapter 54 – Traffic Regulations
Section 54-130 (unlawful to deposit or throw upon any highway, street, alley, public place with rubbish, waste paper, garbage from any moving or standing motor vehicle)
Chapter 56 – Utilities Sections 56-56 (unlawful to place garbage in sewers); 56-102 (unlawful to deposit garbage or other waste on public property); 56-203 (no disposal of garbage, sludge or waste materials in floodplain)

APPENDICES | OCTOBER 2010
A MASTER PLAN FOR MANAGING SOLID WASTE IN THE MILE HIGH CITY
APPENDIX C
Denver Solid Waste Management – Public Involvement Report (July 2009)

DENVER SOLID WASTE MANAGEMENT
PUBLIC INVOLVEMENT REPORT
JULY 2009
HDR Engineering, Inc.
In Association with:
LBA Associates
The Keystone Center

TABLE OF CONTENTS
1.0 Introduction ...................................................................................................................................... 1
1.1 Background ................................................................................................................................... 1
1.2 Purpose and Need for Public Involvement ................................................................................... 1
1.3 Greenprint Denver ........................................................................................................................ 2
2.0 Denver Solid Waste Management Services ...................................................................................... 2
2.1 How Denver Differs From Comparable Cities ............................................................................... 3
Unlimited Overflow ............................................................................................................................... 3
Fee Structure ......................................................................................................................................... 3
Dumpsters ............................................................................................................................................. 3
LIP .......................................................................................................................................................... 4
2.2 DSWM Recycling Program ............................................................................................................ 4
2.3 Composting Collection Pilot Program ........................................................................................... 4
2.4 Master Plan Activities to Date ...................................................................................................... 6
3.0 Public Meetings ................................................................................................................................. 6
4.0 Polling Procedures ............................................................................................................................ 6
5.0 Results ............................................................................................................................................... 7
5.1 Polling Results ............................................................................................................................... 7
5.2 Public Comments ........................................................................... Error! Bookmark not defined.
6.0 Conclusion ......................................................................................................................................... 7
APPENDICES
Please note: in order to keep the size of this submittal minimal, the following appendices to the
Public Involvement Report are not provided here, but have previously been provided to DSWM
and are available upon request.
APPENDIX A — PowerPoint Presentation
APPENDIX B — Meeting Agenda
APPENDIX C — Meeting Sign-in Sheets
APPENDIX D — Polling Questions and Data

July 13, 2009
DENVER SOLID WASTE MANAGEMENT PUBLIC INVOLVEMENT REPORT
1
1.0 Introduction
Denver Solid Waste Management (DSWM) is currently working to develop a Solid Waste Management
Master Planning. A Solid Waste Master Plan is typically a 20-year plan that foresees a city’s long range
plans. Midterm (typically 5- and 10-year) goals are established as implementation check points, which
provide the opportunity to make adjustments or revisions, if necessary. As part of the Master Planning
process, DSWM conducted a Spring Waste Composition Study, a Fall Waste Composition Study (WCS)
and a Policy Survey of Comparable Cities in 2008 to provide data to both guide and inform the planning
process. This Public Involvement Report describes the next phase of the process which included
informing the public about what had been gleaned from these two reports and also solicited input from
the public regarding Denver’s solid waste program now and into the future.
1.1 Background
As part of its Master Planning process, in April 2008, DSWM conducted a survey to determine how solid
waste policies and programs are implemented in ten comparable cities in the U.S. The primary topics
studied were:
User fees
Yard waste and Organics programs
Trash overages – bulky collections (i.e., Large-item pick-up [LIP]) – illegal dumping
Recycling programs
Commercial and C&D recycling
The purpose of the spring and fall WCSs was to analyze:
Data to determine the effectiveness of the existing recycling program and the recycling rates of
residents: low, medium and high
Information to support adding new materials to the recycling program
Information to support the feasibility of a future Food and Yard waste diversion program
(composting)
The report recommended that DSWM evaluate the feasibility of implementing an organics recovery
program (i.e. composting) as a primary component of both the Solid Waste Master Plan and in response
to the Greenprint Denver goal of 30% diversion by 2011. The results of this study indicate that diversion
of yard and food wastes, which constituted 48% of the residential waste stream sampled, have the
greatest potential for decreasing landfilled materials. The study also provided recommendations to
expand or enhance the existing recycling program and increase public outreach and education efforts.
1.2 Purpose and Need for Public Involvement
To assess public opinion, DSWM solicited input to determine the public’s satisfaction with the current
solid waste collection, recycling and disposal program, and interest in changing aspects of the collection

July 13, 2009
DENVER SOLID WASTE MANAGEMENT PUBLIC INVOLVEMENT REPORT
2
and disposal program to reduce reliance on landfill disposal. DSWM developed a public involvement
program which included a PowerPoint presentation to inform the public of DSWM’s current collection,
recycling and disposal processes (provided in Appendix A); interactive participation with citizens in a
public forum; polling of citizens attending the forums; and polling of citizens accessing the presentation
and polling questions online. Because of the current economic situation, if the public continues to
express interest in expanding the diversion/reuse/recycling program, some current services may need to
be reduced in order to offset the cost. Current budgetary constraints preclude both continuing the level
of service currently offered by DSWM and expanding the recycling program.
Information provided by the public is presented within this report, and will be used to draft the 20-year
Solid Waste Master Plan, which will guide DSWM programs into the future.
1.3 Greenprint Denver
In 2004, Greenprint Denver, a division of the Mayor’s Office, used a public process to establish several
goals for decreasing the City’s carbon footprint. Among the goals, Greenprint Denver articulated the
importance of decreasing reliance on landfill disposal, and increasing reuse and recycling. The
Greenprint Denver goal for solid waste management clearly stated 30% diversion from the landfill by
2011 (using 2004 as a basis), which is in line with the average diversion rate of 35% in the U.S. Facing a
drastically changed economic picture, the Mayor’s Office included two questions in its Annual Citizens’
Survey (fall 2008) related to diversion and recycling. In this survey, 88% of citizens endorsed increased
diversion/increased recycling and reuse.
In 2004, 265,000 tons of refuse was disposed of at the landfill (see Table 1). Despite an increase in
population, the volume of landfilled trash decreased to 220,000 in 2008 while diversion increased. In
order to meet the Greenprint Denver goal, landfilled tons would need to be reduced to 185,500 by
2011. Taking the steps necessary to achieve this goal would affect all City agencies.
Table 1. Tonnage Landfilled by Year.
YEAR 2004 2008 2011*
LANDFILL (TONS) 265,000 220,000 185,500
RECYCLED (TONS) 15,700 28,550 62,700 *The tonnage landfilled and recycled needed to meet the GreenPrint Denver goal.
2.0 Denver Solid Waste Management Services
DSWM currently offers the following services to 166,000 households:
Trash collection and disposal (including unlimited out-of-container pick up)
Recyclable collection and processing
Large item pick-up (LIP) and disposal (10 times per year)
Graffiti abatement

July 13, 2009
DENVER SOLID WASTE MANAGEMENT PUBLIC INVOLVEMENT REPORT
3
Keep Denver Beautiful
Fall leaves and Christmas tree composting; mulch giveaway
Of the 166,000 households served, 140,000 are single family units (SFUs) and the remaining 26,000 are
multi-family units (MFUs). DSWM only serves multi-family units that contain seven units or less.
DSWM has a $24M annual operating budget. Although the tipping fee is low compared to other
comparable cities, $15M is spent on refuse collection and disposal.
Refuse is collected via three methods: manual collection in which residents provide their own bags or
containers (this constitutes 19% of waste collected by weight). The second method is automated
barrels, which are provided by the City and comprise 33% of waste collected by weight. Dumpsters are
provided for multiple households to use. Dumpsters generate more tonnage than manual or barrel
areas—constituting 48% of waste collected by weight. Dumpster areas also generated more waste per
household as discussed below.
2.1 How Denver Differs From Comparable Cities
The following information is provided in the Denver Solid Waste Strategic Master Plan Policy Survey of
Comparable Cities (April 2008).
Unlimited Overflow
DSWM collects an unlimited amount of refuse weekly. This is to say that if residents fill their waste
container, any overflow waste can be bagged and placed next to the container and will be collected.
There is no additional charge for overflow (please see fee structure, next section).
Funding Structure
The monthly cost of waste collection and disposal is about $14 per household. Unlike other cities of
comparable size, customers are not assessed a direct monthly fee; rather, DSWM receives funds from
the City’s General Fund which is made up of sales and property taxes. Given this fee structure, the cost
is “invisible” to many residents. The volume of waste collected per household is not tied to the monthly
cost (a practice known as “pay as you throw”) that is commonly used in other cities. Although DSWM
pays a tipping fee at the landfill which is tied to volume, there is no subsequent increase in fees assessed
to residents based upon volume of waste collected. Other cities charge customers based upon the
volume of waste generated and collected above the allotted amount (container). In the 2008 Denver
survey on general services, 62% of residents surveyed supported the use of variable (pay-as-you-throw)
funding for Denver solid waste services. This would involve tying the fee to the volume of refuse
discarded.
Dumpsters
Denver is unique in that dumpsters are provided for some SFUs and MFUs. Illegal dumping frequently
occurs when residents dump their overflow trash into a dumpster that is not theirs alone. As previously
noted, dumpsters produce more tons per household than individual cans (dumpsters account for 48% of

July 13, 2009
DENVER SOLID WASTE MANAGEMENT PUBLIC INVOLVEMENT REPORT
4
waste by weight). None of the other cities surveyed used dumpsters for SFUs. The cities that formerly
used dumpsters have phased them out in favor of containers.
LIP
DSWM provides Large-Item Pickup (LIP) 10 times per year for every household. Each household is given
a schedule of pick-up times whereby they can place an unlimited amount of large items such as
mattresses, appliances and furniture at the curb and it will all be collected. As is the case with overflow
waste, there is no additional fee assessed for the quantity or frequency of LIP. According to the results
of DSWM’s 10-city SWM survey, this schedule of 10 pick-ups per year is much more frequent than other
cities surveyed. LIP requires separate equipment and extra routes are required. No distinction is made
between refuse and recyclable items. After refuse collection and disposal (which account for $15M of
the $24M annual budget), LIP/overflow costs are the second largest budgetary item ($3.4M annually).
2.2 DSWM Recycling Program
Based upon the Mayor’s Office Annual Survey conducted in fall 2008, 88% of residents said that
recycling is very important or essential. DSWM’s recycling program is voluntary—only 40% of
potentially recyclable items are actually being recycled by residents and roughly half of all residents
actually recycle. Although expanding the recycling program may decrease the volume of waste that is
landfilled, the potential exists that the quality of recyclable items (which is currently very good) could
also decrease.
2.3 Composting Collection Pilot Program
The Composting Collection Pilot Program will end in 2010 . 3,300 households spread throughout the city
participated. Yard and food debris and soiled paper were collected in carts provided to residents. This
pilot program has been extremely popular with the public (which was also indicated in the public
meetings, as discussed below). Data are currently being collected for analysis; however, the initial
results are good.

July 13, 2009
DENVER SOLID WASTE MANAGEMENT PUBLIC INVOLVEMENT REPORT
5
Figure 1. Landfilled vs. Recycled Waste: 2004, 2008 and 2011 (projected to meet Greenprint Denver goal).
0
50000
100000
150000
200000
250000
300000
2004 2008 2011
To
ns Landfilled
Recycled

July 13, 2009
DENVER SOLID WASTE MANAGEMENT PUBLIC INVOLVEMENT REPORT
6
2.4 Master Plan Activities to Date
In late 2007/early 2008, DSWM hired a consultant (HDR Engineering, Inc.) and conducted a waste sort to
characterize the waste stream. In 2008, a survey of 10 cities similar to Denver was conducted to assess
DSWM’s level of services provided with respect to comparable cities. In 2009, the public involvement
phase was conducted (this report is the result of that process). In June 2009, the Compost Collection
Pilot Program Phase 1 ended and analyses of results began.
3.0 Public Meetings
A series of five public meetings were held at various locations around the Denver Metropolitan area (see
Meeting Agenda, Appendix B). A total of 66 people attended the five meetings; the meetings on June
9th and June 16th meeting had the highest attendance (21) and the lowest attendance was at the June
10th meeting at Barnum Recreation Center (6) (see Table 2 and Sign-In Sheets, Appendix C).
Table 2. Public Meeting Attendees and Locations.
DATE REGION LOCATION ATTENDANCE
June 9, 2009 southeast Denver District 3 Police Station 21
June 10, 2009 south/central west
Denver Barnum Recreation
Center 5
June 16, 2009 north/central Denver National Jewish
Hospital 21
June 17, 2009 northeast Denver Montbello Recreation
Center 7
June 18, 2009 northwest Denver District 1 Police Station 14
TOTAL 67
The following Agenda was used for all five public meetings:
6:30 p.m. – Visit Information Stations – Questions and Answers
6:45 p.m. – Welcome and DSWM PowerPoint Presentation
7:10 p.m. – Visit Information Stations – Questions and Answers
7:25 p.m. – Polling
7:45 p.m. – Conclusion
4.0 Polling Procedures
Immediately following the PowerPoint presentation and a give-and-take discussion period, meeting
attendees (and the online respondents) were given a series of polling questions to determine
preferences on DSWM current services, the importance of expanding the recycling program, priorities
and funding preferences. Polling questions are provided in Table 3 and Appendix D.

July 13, 2009
DENVER SOLID WASTE MANAGEMENT PUBLIC INVOLVEMENT REPORT
7
To provide real-time response data, attendees were provided response cards (i.e. clickers made by
Turning Point Technology). This allowed respondents to answer each question simultaneously and to
see the data in real time, which provided an interactive audience experience.
The same PowerPoint was presented at the public meetings and on the Internet prior to polling;
likewise, the questions asked following the presentation were identical for both meeting attendees and
online respondents. The complete polling results are provided in Appendix E; what follows is a summary
of the data collected and questions asked by meeting attendees. Only the response to each question
that generated the highest percentage is provided in Table 3.
5.0 Results
5.1 Polling Results
The number of meeting attendees (66) did not provide adequate data to draw any definitive
conclusions. However, the combined feedback from both the public meetings and the online polling did
yield some interesting data. Following the online presentation, which was the same presentation
provided to meeting attendees, a series of 17 questions were posed to online participants. When asked
which of the current DSWM services constitute their top priority, 78% indicated that recyclables
collection was their top priority and approximately 84% responded that MFUs with seven or greater
units should have mandatory recycling. Approximately 72% of responders indicated that recycling for all
households served by DSWM should have mandatory recycling and the same percentage responded
that it is very important for Denver to reduce citizen’s impact on the environment.
Please see Appendix D for the complete results.
6.0 Conclusion
The purpose of the public involvement phase was to assess the public’s opinion on the importance of
DSWM services above and beyond trash collection. To that end, it was revealed that 78% of respondents
said that recycling is their priority after trash collection; this is consistent with the Mayor’s Office Survey
during the fall of 2008. The other purpose of soliciting input from the public was to determine the
degree of public support for the GreenPrint Denver goal of diverting 30% of landfill waste by 2011.
Approximately 72% of respondents believe it is very important for Denver to reduce its citizens’ impact
on the environment and 73% believe recycling should be mandatory (84% responded that it should be
mandatory for multi-family units greater than 7 units). When asked which services currently provided
by DSWM they would be willing to reduce or forego, there was a tie between removing/reducing LIP
from 10 times per year to 4 times per year and adding a city-wide composting program (approximately
31% for each).

July 13, 2009
DENVER SOLID WASTE MANAGEMENT PUBLIC INVOLVEMENT REPORT
8
The input received from the public will inform the next phase, which entails developing the Solid Waste
Master Plan, which will guide and inform future DSWM programs.

July 13, 2009
DENVER SOLID WASTE MANAGEMENT PUBLIC INVOLVEMENT REPORT
9
APPENDICES
Please note: in order to keep the size of this submittal minimal, the following appendices to the
Public Involvement Report are not provided here, but have previously been provided to DSWM
and are available upon request.
APPENDIX A
PowerPoint Presentation
APPENDIX B
Meeting Agenda
APPENDIX C
Meeting Sign-in Sheets
APPENDIX D
Polling Questions and Data

APPENDICES | OCTOBER 2010
A MASTER PLAN FOR MANAGING SOLID WASTE IN THE MILE HIGH CITY
APPENDIX D
Increasing Residential and Commercial Organics Waste Diversion in the City and County of
Denver (August 2009)

FINAL REPORT SUBMITTED TO: COLORADO DEPARTMENT OF PUBLIC HEALTH AND ENVIRONMENT
FROM
CITY AND COUNTY OF DENVER’S
SOLID WASTE MANAGEMENT DIVISION AND DENVER INTERNATIONAL AIRPORT
WITH HDR ENGINEERING’S TEAM OF
HDR ENGINEERING LBA ASSOCIATES, INC.
GRACESTONE, INC.
with in-kind donations and services from
A1 ORGANICS REHRIG PACIFIC
ISS AECOMM
August 28, 2009
Increasing Residential & Commercial
Organics Waste Diversion
in the City & County of Denver

Final Report to CDPHE on RREO Grant Denver-DIA Organic Waste Diversion Project
2 8/28/09
TABLE OF CONTENTS 1. COVER SHEET ……………………………………………………………………………….4 II. WORK PLAN …………………………………………………………………………………5 III. GRANT PROJECT INFORMATION…………………………………………………………5 1. Executive Summary
RESIDENTIAL COMPOSTING COLLECTION PILOT PROGRAM REPORT R.1.0 Project Description and Overview of Work Completed ………………………….………..7
R1.1 Related Research.…………………………………………………………………....7 R1.2. Pilot Scope and Basic Program Design……………………………………………..8
R2.0 Summary of Findings and Results.………………………………………………………...10 R2.1 Results ……………………………………………………………………………..10 R2.2. Operational Observations and Results ……………………………………………14 R2.3 Public Education …………………………………………………………………..15
R3.0 Summary of Unanticipated Outcomes or Roadblocks ……………………………………17 R4.0. Communication of Project………………………………………………………………..17 R5.0 Future Impact of Project…………………………………………………………………..17
R5.1. Future Organics Diversion Program Considerations……………………………...18 R6.0. Financial Summary………………………………………………………………………..22
DENVER INTERNATIONAL AIRPORT COMPOSTING COLLECTION PILOT PROGRAM REPORT
A.1.0 Project Description and Overview of Work Completed…………………………………..23
A1.1 About the Project…………………………………………………………………..23 A1.2 Pilot Scope and Basic Program Design…………………………………………….23
A2.0. Summary of Findings and Results ………………………………………………………..26 A2.1 Weight/volume findings …………………………………………………………...26 A3.0 Summary of Unanticipated Outcomes or Roadblocks …………………………………….27 A4.0 Communication of Project…………………………………………………………………28 A5.0 Future Impact of the Pilot………………………………………………………………….28
A5.1. Discussion and Summary………………………………………………………….28 A6.0 Financial Summary………………………………………………………………………...36 A6.1. Cost data…………………………………………………………………………..36
A6.2 In-kind …………………………………………………………………………….37 2. Next Steps for Residential and Airport Programs ……………………………………………38 3. Appendices …………………………………………………………………………………...39
Appendix 1 Maps of Residential Collection routes – attached as PDF files.
Appendix 2 Residential Program Collection Data (attached as an excel spread sheet) DIA Collection Data

Final Report to CDPHE on RREO Grant Denver-DIA Organic Waste Diversion Project
3 8/28/09
Appendix 3 Data from Sample Weights showing neighborhoods
Appendix 4 Residential Program Educational Materials DIA Educational Materials
Appendix 5 Residential Photographs DIA Photographs
Appendix 6 Waste Composition Study Final Report – attached as a PDF
Appendix 7 Survey summary and data

July 30, 2009 ORGANIZATION INFORMATION 1. Agency Name: City & County of Denver
2. Project Title: Increasing Residential & Commercial Organics Waste Diversion
in the City & County of Denver
3. Name of Project Manager: Charlotte Pitt
4. Project Manager e-mail address and phone number: [email protected], 720-865-6816
5. Name of person(s) completing this report: Charlotte Pitt and Anne Peters
6. E-mail address and phone number of person(s) completing this report: Charlotte Pitt: [email protected] , 720-865-6816 Anne Peters: [email protected] , 303-494-4934

Final Report to CDPHE on RREO Grant Denver-DIA Organic Waste Diversion Project
5 8/28/09
Final Report:
“Increasing Residential and Commercial Organics Waste Diversion in the City and County of Denver”
II. WORK PLAN
III. GRANT PROJECT INFORMATION 1. Executive Summary
The City and County of Denver’s Solid Waste Management (SWM) Division and Denver International Airport (DIA) received a grant from the Colorado Department of Public Health and the Environment’s (CDPHE) Recycling Resources Economic Opportunity (RREO) fund in July 2008. The grant funded a project from July 1, 2008 through June 30, 2009 entitled “Increasing Residential and Commercial Organics Waste Diversion in the City and County of Denver.” The purpose of this grant was to conduct a one-year pilot program to increase the diversion of organic waste in both the residential and commercial settings.
Denver designed the program to be a dual, concurrent pilot to collect and compost organics waste from (a) Denver residences (discarded yard, food and soiled paper) and (b) commercial operations at DIA (discarded food and soiled paper). The pilot program has provided data and useful observations regarding: waste composition, expected diversion rates, public acceptance, DIA vendor acceptance, staffing needs, operational needs (including number of trucks, food vendor needs, residential carts and vendor containers, education, contamination limits, etc.), and a baseline for generating some cost estimates for full implementation. The residential composting pilot program illustrated that the City might expect higher pounds per set out than initially expected (31 pounds per week per cart during the growing season, and 12 pounds per week per cart during the winter months). This is a significant number when considering that in 2008 Denver households averaged about 52 lbs of trash per household per week. The pilot also allowed the City to verify many of its other assumptions for this program. DIA, through this project, was able to learn some valuable lessons about program logistics. The pilot’s diversion of
Deliverable Completion Date Comments (if deliverable was not completed, please explain why or progress made)
Research and Plan Pilot Logistics and Outreach/Education (SWM pilot
planning) 11/08
Waste Composition Study for Denver residential pilot
11/08 Report not completed until March 2009
Research and Plan Pilot Logistics and Outreach/Education (DIA Pilot
Planning) 1/09
Implement Pilot Program (DIA) 4/09 Pilot was launched in Jan. 09 and ran through April 09
Implement Pilot Program (SWM) 10/08 Pilot program was started 10/08 but took two months to
ramp up to full participation

Final Report to CDPHE on RREO Grant Denver-DIA Organic Waste Diversion Project
6 8/28/09
approximately 31-38 tons of organic waste from DIA, over an 11 week period, will help DIA meet its goal of decreasing disposal to .45 lbs/passenger in 2009” This data will enable both Denver SWM and DIA to make informed decisions about fully developing and implementing permanent programs in both settings.
Immediate environmental and economic benefits from the grant program itself included waste diversion, job creation, participant education, reduced greenhouse gas emissions, and new data on organics diversion that will be used for program planning at DIA and Denver SWM. A key data point that the City discovered through the waste composition study was the high volume of organic material found in the residential waste stream. Considering Colorado has a semi-arid/arid climate, the City expected to be below or right at national average (38.5% as reported by the EPA in 2007); instead results showed our organic materials (about 57% of the total) is significantly higher than the average. This data can also be extrapolated to develop programs or analyze waste streams throughout Colorado.
Should there be final implementation of a citywide residential compost service and/or a food waste collection program at DIA, it benefits will include job creation, waste diversion, greenhouse gas emissions reductions, and create compost for use in and around the Denver metro area (along with the resulting benefits of its uses). For example, composting food discards yields a net reduction of 0.05 MTCE/ton1, while landfilling increases greenhouse gas emissions by 0.20 MTCE/ton.
The City and County of Denver, Denver International Airport, and other parties to the project all wish to thank the Colorado Department of Public Health and Environment (CDPHE’s Pollution Prevention Advisory Board and its Assistance Committee) for the opportunity to carry out this pilot project. It would not have been possible without grant funds. We believe the comments from Denver residents will help us further expressing out gratitude:
“Thanks for starting this program. It's nice to feel that maybe we will be part of the solution (i.e., helping reduce our environmental damage) instead of the problem”
“I really like that I can minimize my landfill garbage exponentially now.” “We are a family of 6 and we can't begin to tell you how easy you have made this for
us to do our part. We love the program and will use it all year long” (comments taken from a survey of participants in December 2008)
NOTE TO READER: In order avoid confusion, we have divided the two projects into two separate reports. First you will find a full report on the residential composting collection pilot program, followed by a full report of the DIA composting collection pilot program. We will end the report with a joint conclusion for both projects. We hope this will provide readers with the format that is easiest to follow and understand.
1 MTCE = Metric tons of carbon equivalent per short ton of material. From Exhibit ES-4 “Net GHG Emissions form Source Reduction and MSW Management Options,” in Solid Waste Management and Greenhouse Gases: A Life-Cycle Assessment of Emissions and Sinks 3rd Edition, September 2006, US EPA, available at http://epa.gov/climatechange/wycd/waste/SWMGHGreport.html

Final Report to CDPHE on RREO Grant Denver-DIA Organic Waste Diversion Project
7 8/28/09
RESIDENTIAL COMPOSTING COLLECTION PILOT PROGRAM REPORT
R.1.0 Project Description and Overview of Work Completed
The Denver Residential Composting Collection Pilot Program has long been a desire of Solid Waste Management for the belief that, despite Denver’s semi-arid climate, organic materials made up a significant portion of the waste stream and that Denver residents would embrace the ability to divert this material from the landfill. Anecdotally, SWM seasonally adds personnel to staff trash collection crews during the growing season to handle the additional organic materials in the waste stream. In order to verify this and determine the feasibility of a citywide composting collection program, Solid Waste Management submitted an application for funding to CDPHE under the RREO grant program. The grant provided partial funding of a two-season Waste Composition Study (WCS) and the establishment of a composting collection pilot program for 3,300 Denver homes.
R1.1 Related Research Waste Composition Study. A two-season waste composition study (WCS) was conducted on Denver’s residential trash during the spring and fall of 20082. The WCS was conducted on trash generated from Denver’s residential waste collection routes. It was designed to evaluate the composition of the residential trash stream and to provide data to help guide the City in making decisions about how to increase waste diversion. The aggregated WCS results indicated an organics content of over 57% by weight, with two major sub-categories: (a) yard waste, and (b) food waste.
Figure __. Average Aggregate Composition (percent by weight)
Glass, 2.3%Residue, 6.1%
Hazardous &
Special Waste, 7.4%
Metal, 2.7%
Plastics, 9.8%
Paper, 14.4%
Organics, 57.2%
2 This work was completed and funded as part of two projects: By the City of Denver (Spring 2008 WCS) as part of its Strategic Master Plan effort, and by grant funding from the Recycling Resources Economic Opportunity Fund of CDPHE (Fall 2008 WCS).

Final Report to CDPHE on RREO Grant Denver-DIA Organic Waste Diversion Project
8 8/28/09
The organics category was comprised of (provided as percent by weight): 38% yard waste – including mostly grass clippings, sod, branches and leaves which can be
managed in a curbside cart collection program 10% food waste – including food-contaminated paper and packaging 2% textiles – clothing, shoes, rags, bedding, insulation and carpeting 8% mixed, other organics – diapers, animal feces and cat litter
Although soiled paper was not a sort category for the WCS, it has been an acceptable item in the actual composting collection pilot program. Estimates are that waxy paper, milk cartons and tissue paper constitutes another 3% of readily compostable materials. These “non-recyclable” papers were not counted as organic in the WCS, but rather in the paper fraction. Therefore we believe there is a potential to capture about 51% of the waste stream through the yard, food and soiled paper waste fraction targeted by the pilot study. The WCS results were subsequently used to project annual potential waste diversion from food and yard waste recovery, based on an assumed recovery rate ranging from 40% to 60% of total organics generated. This projection indicated that between 37,300 and 56,000 tons/year of food and yard waste could be diverted through an established citywide program. This pilot project has been conducted to evaluate the feasibility of both implementing such a program and of the program’s actual potential for success3. Public Input on the City’s Solid Waste Master Plan, June 2009. In addition to the WCS, and relevant to the RREO grant project, Denver has just completed a series of public meetings and a survey on community values related to waste management (not funded by this grant). 30.4% of respondents indicated that adding a composting collection program would be the first thing they would change to increase waste diversion in the City. This was just 0.3% below first-highest response which was to eliminate or reduce bulky item collection to offset the cost of increased diversion. There were six possible answers that respondents could have chosen.
R1.2. Pilot Scope and Basic Program Design
Based on its groundwork from 2008 and earlier, Denver wished to conduct a pilot study to explore the feasibility of collecting organic waste (yard, food and soiled paper) from a cross-section of Denver’s residential neighborhoods. SWM’s goal was to test: Interest in participating in the program. Barriers to participation. Routing and collection efficiencies. Participation in various neighborhoods in Denver. Program costs. Ability to divert materials. Quantities that could be diverted, both by volume and weight.
3 The “Final Report - Spring/Fall 2008 Waste Composition Analysis” was submitted to Denver Solid Waste Management” by HDR Engineering, Inc. in association with LBA Associates and Gracestone in March 2009. It is included as Appendix 6.

Final Report to CDPHE on RREO Grant Denver-DIA Organic Waste Diversion Project
9 8/28/09
Pilot Project Team. In addition to the RREO grant funds, the program relied on a number of program partners with distinct roles and responsibilities. They were: Denver Solid Waste Management/Denver Recycles – grant management, composting
collection, residential education and outreach, data collection. A1 Organics – receiving and composting organic materials. Providing services at half price. HDR team members (including Gracestone and LBA Associates) – gathering data, including
weighing selected samples of curbside organic waste; compiling and analyzing data, and drafting final report.
Rehrig Pacific – manufactured carts, providing half the needed quantity at no cost to the City.
Pilot Design. The pilot was designed to collect organic waste from Denver residences in a manner that was easy and convenient for Denver resident in order to encourage participation.
a. Material Collected: Organic materials targeted to be collected included: Food waste (e.g. table scraps such as baked goods, left over pizza; food preparation waste
including meat, bones and dairy and fruit/vegetable scraps). Compostable paper products (e.g. non-recyclable fiber including food-contaminated paper,
waxed cardboard, waxed paper, paper towels and napkins, tissues and paper milk cartons). Yard debris such as grass, weeds and branches. Other compostable organics such as flowers, houseplants, dryer lint, etc.
Additional acceptable items can be viewed in the attached residential education resources. Due to the extensive nature of the acceptable items, Denver Recycles provided a detailed list to guide residents and then encouraged them to e-mail or call with specific questions.
b. Neighborhood Selection: Participating areas were selected based on a number of varying factors: Service was selected for Monday, Thursday and Friday, the days that SWM had additional
trucks available for use. Areas that already had recycling collection on those days were chosen so that participating households could conveniently put both their recycling and compost cart out on the same day for collection.
Areas of high, medium and low recycling participation. Areas with dumpsters, barrels and manual trash collection. Pilot neighborhoods crossed every City Council district. Anecdotally, not scientifically, staff also considered the yard size and maturity of
landscaping for the different areas.
c. Program Operations Basics: The program worked as follows: Residents in the pilot areas were invited to subscribe to service at no charge to them. Subscriptions were cut off when the maximum number of households SWM could serve
was reached. SWM provided subscribed residents with one, 65-gallon green cart; one, 2-gallon kitchen
pail for collecting food waste in their home; and educational materials (including a list of acceptable materials and a service calendar).
The customers on Friday’s routes were also given 2 boxes of BioBags (50 bags; biodegradable corn resin bags) for their kitchen pails in the initial round of delivery.

Final Report to CDPHE on RREO Grant Denver-DIA Organic Waste Diversion Project
10 8/28/09
Composting was collected on the same day of service as trash and recycling (except dumpster routes, where it mirrored only recycling collection). Organics were collected weekly during the growing season and every-other-week during the winter.
Organic materials from the residences was consolidated at the Cherry Creek Transfer Station (CCTS) and then delivered to A1 Organics’ Keenesburg, CO facility on a weekly basis4.
A1 Organics was responsible for composting the material and marketing the finished product.
d. Project Timeline. The main events in the Denver pilot project occurred as follows. This list also provides an overview of the program operations highlights: August 2008: Specify and order collection carts, kitchen pails and BioBags. August 2008: Begin design on announcement postcard, educational brochures, web site,
service calendars etc. August/September 2008: Choose and finalize participation areas. September 2008: Send announcement to eligible residents and allow residents to sign up. October 2008: Begin cart delivery the first two weekends of the month. October 2008: Expanded routes to allow more eligible residents to participate, in order to
reach maximum sign-up of 3,300 homes quickly. November 2008: Sign up complete with maximum participants. November 2008: First survey of participants. December 2008: Participant education and switch to every-other-week collection. January 2009: Second survey of participants. April 2009: Participant education and switch to weekly collection. June 2009: Notified of award for 2009/2010 grant to test additional transportation and
program parameters.
R2.0 Summary of Findings and Results
R2.1 Results
Quantities. Overall, more than 811 tons of organic wastes were collected from approximately 3,260 Denver households during the 8.5-month study. During 18 weeks of this period (December through March), collections were every-other-week (EOW), the remainder of the time (October, November and April through June) they were weekly. Collection was conducted Monday (approximately 48% of subscribing households), Thursday (9%) and Friday (43%). Figures A and B show the weekly total tons collected and pounds per household, respectively - the vertical separations in the data indicate the separation between weekly and EOW collection periods.
4 This practice was modified in May, 2009 as a result of reduced operational resources at the Cherry Creek Transfer Station. Starting in May, materials were delivered to A1 Organics Stapleton Facility where they were consolidated and transported to A1 Organics Keenesburg facility. This consolidation was provided by A1 Organics.

Final Report to CDPHE on RREO Grant Denver-DIA Organic Waste Diversion Project
11 8/28/09
Figure A - Weekly tons of Organic Waste Collected
0
10
20
30
40
50
60
13-O
ct
27-O
ct
10-N
ov
24-N
ov
8-Dec
22-D
ec
5-Ja
n
19-J
an
2-Feb
16-F
eb
2-Mar
16-M
ar
30-M
ar
13-A
pr
27-A
pr
11-M
ay
25-M
ay
8-Ju
n
22-J
un
TONS
Figure B - Household Collections of Organic Waste
15
20
25
30
35
40
45
13-O
ct
27-O
ct
10-N
ov
24-N
ov
8-Dec
22-D
ec
5-Ja
n
19-J
an
2-Feb
16-F
eb
2-Mar
16-M
ar
30-M
ar
13-A
pr
27-A
pr
11-M
ay
25-M
ay
8-Ju
n
22-J
un
Avg Lbs per Household
Tonnages were obtained using truck scales at the CCTS and A1 Organics’ Stapleton facility. Average household weights were calculated from tonnages and the number of subscriber set-outs on each collection day. Table 1 provides a summary of results as a function of the collection frequency (note that the high growing season is typically April through November, which corresponds to weekly collection during the pilot study).
EOW | Weekly
Weekly | EOW
Weekly | EOW
EOW | Weekly

Final Report to CDPHE on RREO Grant Denver-DIA Organic Waste Diversion Project
12 8/28/09
Table 1 – Summary of Results By Collection Frequency WEEKLY
October 13 - November 29, 2008
EVERY OTHER WEEK December, 1 2008 - April
3, 2009
WEEKLY April 6 - June 22,
2009 Average tons/Week 21.8 13.7 34.4
Average Pounds/ Household
31.0 23.9
(or approx 12 lbs/week) 31.8
Average Set-Out % 61.2% 64.6% 61.6%
A number of observations can be drawn from the previous figures and table: A relatively low number of tons were collected during the early weeks of the pilot, as
subscribers were still being added and participants were becoming familiar with the new service.5
Elevated tons per week associated with fall yard debris (peaked the week of November 10, 2008) were notably less than those associated with spring yard debris (which peaked the week of May 25, 2009).
Unseasonably warm weather in March followed by a cool down, most likely resulted in the March spike and subsequent fall in April.
Households maintained their participation (set-out percent) during the low season (EOW) collection period.
The slightly lower participation during the 2009 weekly collection period may be indicative of the beginning of a “leveling off” that is common for maturing programs (i.e., relatively high participation rate typically occurs with new programs, but stabilizes at a lower rate after several months). Participation can also be affected by weather conditions on the collection day.6
When pro-rated over 12 months and 165,000 households, the 811 tons collected during the pilot project equates to approximately 58,000 tons/year7 and compares favorably with the waste composition study analysis which correlated a 60% organics recovery rate to about 56,000 tons/year. In 2008, Denver’s 165,000 homes disposed of 219,000 tons of trash.
Subscriber Set-Out Rates. Figure C shows the number of subscribers who set out organics to be collected at the curb each week, as a function of the total number of subscribers in the pilot study at that time (Table 1 shows average set-out rates as a function of the collection frequency).
5 In October, there were only about 1,000 household subscribers, but this number increased to 3,260 by the end of November. Note that the number of subscribers was dynamic throughout the study as new households joined and others moved out of the area (total subscribers peaked at about 3,270). The highest subscriber number – compared to total households in the targeted areas – reflects an approximate 19% participation rate. 6 Note that a participation rate in the 60% range is good for any diversion program (in the King County, WA 2007 study of its organics collection, a 38% subscriber set-out rate was measured). Denver Recycles recorded a 78% participation rate in 2008 for its curbside residential recycling program, which is a high level for a voluntary program (especially when not supported by a pay-as-you-throw (PAYT) fee structure). 7 If only single-family homes are considered (141,600), the pro-rated estimate is approximately 50,000 tons/year (approximately 23,400 multi-family homes up to 7 units are also served by SWM).

Final Report to CDPHE on RREO Grant Denver-DIA Organic Waste Diversion Project
13 8/28/09
Figure C – Average Set-Out Rates
40%
50%
60%
70%
80%
13-O
ct
27-O
ct
10-N
ov
24-N
ov
8-Dec
22-D
ec
5-Ja
n
19-J
an
2-Fe
b
16-F
eb
2-M
ar
16-M
ar
30-M
ar
13-A
pr
27-A
pr
11-M
ay
25-M
ay
8-Ju
n
22-J
un
SET OUTS
This data indicates some variability in mid-December, early January and late March that are unexplained but could be related to weather, increased food waste and contaminated paper quantities generated around the holidays (December and January) and elevated early spring yard debris levels (March). Of particular note is the sharp drop in set-out rates in early April when the pilot returned to weekly collection. This drop probably maps the lag time for residents to adjust to a new collection frequency, but may also indicate Denver’s ability to continue EOW collection through April (at least in a spring as cool and wet as experienced in 2009). Individual Neighborhood Measurements. In addition to measuring quantities and set-out rates, individual subscriber carts were monitored in five different neighborhoods during one week each in the winter and spring seasons. The winter 2009 measurements were conducted in late February/early March, during the EOW collection period. The spring 2009 measurements were conducted in late April/early May, during the spring weekly collection.
Figure D – Neighborhood Weight Measurements
0
5
10
15
20
25
30
35
Hilltop Cook EastWashington
Park
WestWashington
Park
Wellshire
AVER
AG
E P
OU
ND
S/H
OU
SEH
OL
February/March
April/May
Weekly | EOW EOW | Weekly

Final Report to CDPHE on RREO Grant Denver-DIA Organic Waste Diversion Project
14 8/28/09
The spring 2009 data indicates notably higher weights than winter, corresponding to increasing yard waste generation during spring months. Although the East Washington Park and Hilltop neighborhoods had the highest average weights per set-out in both seasons, there is not a striking difference between neighborhoods.
A visual observation of how full the individual carts were was also made during the neighborhood measurements. During the winter 2009 (EOW collection), these neighborhoods averaged 49% full, while during the spring 2009 (weekly collection), the neighborhoods average 51% full. These numbers support the possibility of Denver extending the EOW collections (i.e., reducing the weekly collections) such that the individual carts are used more efficiently. However, the neighborhood data did not represent the full pilot and other periods during the study may have yielded greater fill levels (i.e., mid-November and late May through June). Public input suggests that cart size is adequate to allow for year round fluctuations due to seasonality. Organic Waste Composition. Although a composition analysis was not conducted on the collected organic waste, notably higher levels of yard debris than food waste were seen during visual observation overall, and particularly during the growing season. This is consistent with observations made by A1 Organics, who noted that organic waste streams similar to Denver’s may be as high as 90% yard waste on an annual average – hence the term “dirty yard waste” for these materials. A predominance of yard waste is also consistent with measurements made by King County, WA (including Seattle), which found that 97% of its organic stream consisted of yard waste in a fall 2007 waste composition study, and that only 19% of subscriber carts included food scraps.
Of significance is the fact that the Denver organics waste contained only minimal contamination, as observed both during the neighborhood measurements and by A1 Organics. Contaminants included Styrofoam products, contaminated wood, and foil-lined packaging8. While the Compostable BioBags used by some subscribers in the pilot are compostable, they can still be a nuisance at the compost facility as blowing litter. Plastics in general are the primary source of contamination and litter-related nuisance at a processing facility. R2.2. Operational Observations and Results A. Collection Operations
i. Denver Solid Waste Management used anywhere from 1 to 3 trucks to complete the composting collection routes. There were three collection routes on Mondays and Fridays and one route on Thursdays. Route maps are provided in Appendix 1.
ii. Denver crews averaged about 69 miles per route. iii. Observations from route operators indicate that there were no major collection issues
during the pilot program. The materials did not prove to be easier or more difficult than the collection of traditional recyclables or trash. For the most part, route operators observed that residents followed guidelines for material preparation and set out. This is especially useful information as it was anticipated that branches might create some significant collection challenges and that did not hold true.
B. The use of the Cherry Creek Transfer Station worked well to increase the efficiency of transporting the organic materials to A1 Organics. In May 2009, SWM did experience some
8 Some recyclable paper (cardboard, Kraft bags and newspaper) was observed.

Final Report to CDPHE on RREO Grant Denver-DIA Organic Waste Diversion Project
15 8/28/09
transfer trailer shortages, which required us to shift the consolidation of materials to A1 Organics’ Stapleton site. This switch did not impact the program or its results. The additional cost of having A1 Organics consolidate was absorbed by Solid Waste Management. C. Density: Through this pilot program we have learned that the density of the material collected was much lower than expected, which means there is a lot of air in the material. To maximize transportation efficiencies SWM believes volume reduction of the organic materials could be beneficial (note phase 2 of the pilot program will allow the City and its partners to test this). The primary reason for this is likely the large percentage of yard debris being collected and the difficulty of compacting it in collection vehicles. D. Contamination: A1 Organics reported minimal contamination of the Denver stream. The most problematic material received was plastics. E. Other: Due to our need to test a variety of parameters as part of this pilot, the collection routes created were not designed to maximize efficiency. R2.3 Public Education and Input Education and outreach is a critical component of any waste diversion program, but is especially important for a new service. The goal of the education efforts for the composting program was to provide valuable information about composting and instructions for correct participation, in the program in a manner that was appealing and eye-catching. The subscription based pilot program proved to be beneficial to City staff, because we were able to request an e-mail address from each subscriber. About two-thirds of participants provided their e-mails allowing staff to distribute much of the messaging electronically. a. Educational Strategies:
Introductory brochure direct mailed to eligible home inviting participation. Direct mail postcard to remind residents about the opportunity to participate. Program overview brochure and calendar of collection days, delivered with the
composting cart. Cart sticker on lid of cart to remind participants what is acceptable in program. Survey of participants – while questions were designed to solicit feedback, many
were worded to provide educational value. Quarterly Newsletter – email and mailed to those without address. Direct e-mails to participants as early questions and issues arose.
See Appendix 4 for samples of all the educational pieces developed. Educational Accomplishments: The data around program participation, tonnages collected and low levels of contamination indicated that the education and outreach program was successful. The ability to transmit information electronically was a big part of staff’s ability to quickly respond to concerns. For example, a participant noted that they had placed their kitchen pail on the bottom shelf of their dishwasher and it melted. We quickly sent an e-mail reminder to residents letting them know the pail was top rack dishwasher safe only. Survey results from participants indicate that educational materials and messages were effective.

Final Report to CDPHE on RREO Grant Denver-DIA Organic Waste Diversion Project
16 8/28/09
b. Survey Summary Two surveys were conducted during the program to obtain input from the 3,270 participating households about several matters: Adequacy of information at startup. Motivation to participate. Adequacy of cart size. Materials going into the carts. Seasonal and weekly vs. every-other-week use and participation variability. Perception of reduction of trash. Interest in the pilot from participants friends and neighbors. These surveys were conducted via email notifications to participants, inviting them to answer up to 7 questions on a web-based survey (using Survey Monkey). Initiated on November 17, 2008 (“Round 1”) and on January 14, 2009 (“Round 2”), both surveys were open for three weeks. Participation was excellent:
Round 1 – 1,108 total responses (34% response rate) Round 2 – 761 total responses (23% response rate) The survey obtained many comments as well as quantifiable responses. Analysis of the data yielded the following key findings about the pilot. Participants were well informed at the pilot start-up:
o 99% of Round 1 respondents said the information received with the green cart adequately prepared them to use the service and to understand what is accepted in the cart. (This question was not asked in Round 2.)
o 14% provided useful comments such as the need to clarify accepted materials and collection scheduling, appreciation for the BioBags, etc.
Participants were motivated to participate by two primary factors: o Wanting to make less garbage o Because it was the “right thing to do” o Of the 14% of respondents who provided comments, many expressed that they…
“Could have selected all of the above;” “Wanted to be part of this pilot program to help Denver;” Liked city organics collection better than backyard composting; or “To help reduce my family’s footprint on the planet.” Appreciated the program, using words like ‘thrilled,’ ‘awesome,’ ‘gleeful,’ and
‘wonderful;’ many said things like “I don't just like this service, I LOVE IT.” Residents were asked if the green cart was too big, too small, or just right, in both surveys.
o Satisfaction with cart size was very high, and went up slightly from November to January, In November, Round 1 respondents reported that leaves were the majority of materials being
placed in green carts, with food scraps as the second-highest item. Also in November, 99% said they planned to continue to use the green carts to set out food
scraps and soiled paper.
c. Public Interest: Staff made efforts to track program queries but has struggled keeping this accurate due to the number of avenues that we receive inquiries. Inquiries come to Denver

Final Report to CDPHE on RREO Grant Denver-DIA Organic Waste Diversion Project
17 8/28/09
Recycles via 3-1-1, SWM administrative phone line, e-mail, City Council Offices, the Mayor’s Office, Community meetings, neighborhood associations and more. Denver Recycles staff directly responds to multiple requests to participate each week. While anecdotal, the City has seen an immense amount of interest around this program, as can be supported by the response received from the Solid Waste Master Plan public input survey. R3.0 Summary of Unanticipated Outcomes or Roadblocks The City was fortunate that the residential portion of this project resulted in very few unexpected outcomes and the two listed below were very minor for the City to overcome.
Sign ups. The City was initially very conservative in the number of residents that were invited to participate out of concern that there would be too many interested participants. The reality is that people are often a bit slower to respond to services than expected and generally the delivery of a cart to a neighbor will spur a request. Therefore, in order to ensure full participation by November, the number of residents invited to participate was increased.
In May, the City saw a shortage in Transfer truck trailers and could no longer dedicate a trailer to the composting program. The City worked with A1 Organics to take over the consolidation and transfer of the materials, and paid for this service.
R4.0. Communication of Project Interest in the composting collection pilot program remains high. To date staff has: Presented at the CAFR Annual Summit for Recycling in May 2009. Worked with the media on a number of TV news stories and print articles. Staff will
continue to seek opportunities to promote the program. Sample print articles can be found in Appendix 4.
Communicates the program through the Denver Recycles website (currently doing so and will continue to do so).
Received numerous calls from City’s around the country about the program. R5.0 Future Impact of Project Solid Waste Management believes that the pilot composting collection program has been a huge success in regards to proving the potential for diversion, customer satisfaction and community support. There is a significant amount of demand to expand and continue the service. Should the City be successful at implementing a citywide composting collection program the future impacts would be: 1. The potential to divert significant amounts of waste, estimated between 50,000 to 58,000 tons per year for an established program. In 2008, Denver homes disposed of about 219,000 tons of trash. 2. Avoid trash collection and transportation costs. Conservative estimates suggest that for every five compost collection trucks, one garbage truck could be removed from the streets. 3. Ensure that the GreenPrint Denver goal is met, and likely exceeded. 4. Closing the Loop – ensuring Denver’s compost from its organics are made available to residents, purchased by the City, etc. 5. Ability to establish a system/infrastructure that could aid other communities and private vendors establish similar programs and services.

Final Report to CDPHE on RREO Grant Denver-DIA Organic Waste Diversion Project
18 8/28/09
The challenges for providing a citywide service remain the upfront investment in equipment to provide the service and the ability to minimize transportation costs. There is also a significant amount of education needed to around the costs of composting. There remains much confusion around the economics of the composting process and how it impacts overall service costs. R5.1. Future Organics Diversion Program Considerations
The following is a list of thoughts of things to consider while planning a citywide implementation or to consider as tools to aid in justifying a Citywide composting collection program. A. Management of Large Yard Waste Debris.
During the growing seasons, homeowners frequently generate brush and limbs that are too large to be placed in a 65-gallon organics container. These materials end up usually end up in the trash. One alternative for managing this material includes adding drop site capability to Denver’s CCTS in southeast Denver and/or another location(s) in the north/west part of the city to provide reasonable access. Ideally this site would be controlled in terms of some staff oversight and limited hours, and access, in order to minimize collection of unacceptable items such as trash. The addition of one or more drop sites at an existing city facility with a limited hauling distance to A1 Organics’ Stapleton transfer site would add minimal costs to the existing SWM program.
Another option is the addition of a separate large yard waste collection route similar to Denver’s large item pick-up collection. Unless implemented on a by-appointment basis, this option could require up to a full rear-load or manual truck route with a driver and laborer that would canvas the residential areas of the city over the course of a number of weeks. While it would provide residents with expanded yard waste collection service, it would add inefficiencies and cost to an already capital-intensive solid waste program. B. Alternative Hauling Options.
In May Denver switched from weighing and aggregating pilot study organics at the City’s CCTS to doing the same at A1 Organics’ Stapleton site. Stapleton is located north of CCTS, about 20 miles from A1’s Keenesburg composting facility. This switch addressed an equipment shortage at the transfer station and allowed A1 to make the long haul to Keenesburg instead of the City. Use of the Stapleton site will continue to make sense for the next several years (especially once A1 obtains its new State grant-funded grinder in the summer of 2009). The use of this site will generate data that could be transferable to any number of transfer sites in Denver, including the Cherry Creek Transfer Station.
One alternative to be considered at that time is to outsource the transfer and transport of Denver’s organics stream to a third-party hauler. The City could conduct a procurement process (hopefully obtaining multiple bids) for the provision of a local transfer facility and hauling to whichever compost facility Denver may be contracting with at the time9. This procurement
9 It should be noted that the city contracted with Waste Management to haul organics from DIA to Keenesburg at a rate of $211/roll-off haul, which sometimes included less than 15 cy. This contrasts with the $240 A1 Organics charged Denver during the same project to haul 100 cy of organics.

Final Report to CDPHE on RREO Grant Denver-DIA Organic Waste Diversion Project
19 8/28/09
could also include public drop-off of large-item yard waste (and processing as needed to maximize payload between Denver and the compost facility location). The cost of this service would need to be considered in overall funding obtained for a new citywide composting collection program. C. Increased Organics Stream Density.
In the organics stream, yard waste especially is likely to have high voids and lower density, resulting in the need to “haul a lot of air” which decreases hauling efficiency. While density measurements were not made on Denver organics, A1 Organics observed and the City’s set out data confirmed, the density to be 200-300 lbs/cy, noting that yard waste was the predominant component of this stream10. This value is lower than expected by A1 Organics who anticipated seeing about 400 to 600 lbs/cy, considering the addition of food waste11 and the high density of summer yard debris. The ability to reduce the volume of this material and increase density before a long haul by grinding or similar processing will increase payload and decrease transportation costs. Downsides to grinding, such as making contaminant removal difficult and shredding plastic BioBags (increasing wind-blown litter), can be addressed by selecting a coarse grinder suitable for yard waste, providing quality control, and removing (or prohibiting) bags in advance of screening. Using a 2009/2010 State grant, A1 Organics and Denver will be obtaining a new yard waste grinder to test the feasibility and effectiveness of this. This method has been used in other parts of the country, especially in cities where the haul to a compost site is greater than ours. The addition of a pre-haul processing step should be carefully estimated against the cost of hauling, before a long-term commitment is made by either Denver or its contractor, and the 2009/2010 grant project will allow that to happen. D. Alternative Compost Facility.
To increase the long-term sustainability of organics collection and composting, it would be ideal if Denver could tip its waste at a compost facility located in or near the city. However, the permitting, siting, and operation of a new facility would be challenging given the proximity and density of residents and businesses combined with the high likelihood of odor, noise and litter. In fact, although Boulder has a privately-operated compost facility located in its immediate vicinity, this is an exception – most facilities that serve U.S. communities are located well outside city limits and far from residentially-zoned areas.
Despite Denver’s strong partnership with A1 Organics (for the pilot study and on other projects), it would improve the procurement process if the City had multiple facilities to choose from when procuring new processing services12. It is possible that other private sector operators will develop regional compost facilities in the future as the demand for organics recovery grows.
10 National sources indicate that trimmings/prunings can range from 40-170 lbs/cy; leaves 250lbs/cy; grass 400 lbs/cy; leaves/grass about 350 lbs/cy; and branches/stumps 460 to 1,100 lbs/cy (USEPA, Cascadia Consulting Group, Tellus Institute and the National Recycling Coalition). 11 Food waste can have densities ranging up to 2,000 lbs/cy according to the USEPA. 12 Denver does not anticipate owning or operating its own composting facility in the foreseeable future.

Final Report to CDPHE on RREO Grant Denver-DIA Organic Waste Diversion Project
20 8/28/09
E. Collections Expanded Beyond Single-Family Homes.
Given the popularity and success of the pilot project, it is reasonable to look beyond a citywide roll-out serving all voluntary single-family homes. Expansion of a Denver organics recovery program to eventually include food, paper and yard waste from municipal buildings, schools, and maybe even multi-family homes might realistically be a good 5- or 10-year goal.
The addition of food, paper, and yard waste from municipal buildings and schools would be the easiest first step in this phase of an extended program – primarily because of existing city control over these wastes (Denver currently collects trash and recyclables from municipal buildings and is just about to roll out service to Denver Public schools). However, the separation, containerization and collection of kitchen/cafeteria, office/classroom and yard waste from these generators would be needed. In some cases, 65-gallon carts may be sufficient, but other generators will require larger containers, which can be sealed and locked to minimize leaks from food waste and scavenging13.
Expanded service to multi-family residential units has different challenges, including an existing ordinance that keeps Denver from serving these generators and a lack of space at most of these locations to separate and containerize organics. This expansion would require: Ordinance changes:
o Requiring or providing incentives for organics diversion by generators, landlords and haulers.
o Who would collect from these generators (city, private sector or both). Change to Denver’s Managers Rules if SWM pursues collection from these generators. Procurement for collection, transfer/long-haul and composting services (may be bundled into
one request for proposals/contract step depending on the services needed).
Any expansion of the service area will require extensive education efforts, ranging from early notification to workshops and continuous follow-up. F. Coordination with DIA in a Future Program.
Should DIA implement a permanent organics recovery program, it may cover only pre-consumer food waste from the Main Terminal and Airport Office Building included in the pilot project or it may expand to ultimately include pre-consumer food waste from these areas plus the existing (and future) concourses14. Despite the differences in their respective organics streams, there are definite synergies between a permanent DIA and a citywide Denver organics recovery program that could reduce overall costs including: Piggy-backing on Denver contract services for local transfer, long-haul and compost
operation services; ideally, increased tons would reduce unit costs for each service. Using a combination of SWM staff and DIA Environmental Services staff to consult on
opportunities for compacting DIA food waste on-site, on utilizing compacting collection vehicles, or on other options for reducing haul costs from DIA.
Educating the public – messages, media and products could be replicated, reducing staff time (this was accomplished effectively during the pilot program when SWM staff provided vendor training and outreach materials with a “similar-look” for both DIA and Denver).
13 Use of dumpsters in institutional and commercial applications would require DSWM to acquire front-load collection capacity (or modified rear-load for small dumpsters) – or to contract the collection with another hauler. 14 The addition of post-consumer food waste and even airport landscaping and yard waste is a less likely possibility.

Final Report to CDPHE on RREO Grant Denver-DIA Organic Waste Diversion Project
21 8/28/09
G. New Policies and Practices to Increase Diversion.
Mandatory organics recovery – If Denver’s future citywide organics program was implemented as mandatory, then every single-family home would be provided with a green cart. If actual enforcement occurred (i.e., keeping organics out of trash), then increased organic tons diverted would undoubtedly increase. However, these actions would have other ramifications such as: Elevated funding needs to purchase carts and trucks to service the about 165,000 single-
family households. Funding needed for an aggressive enforcement function. Diluted organics generation per household may decrease collection efficiency. (i.e., in a
voluntary program, such as the pilot study, the “best of the best” residents want to participate, whereas when forced, some residents do not embrace the concept of diversion and may divert only nominal quantities (low weights per set-out would increase the unit cost of collection).15
Organics quality may suffer (e.g., increased contamination).
Yard waste disposal ban - It would be difficult for Denver to implement a true disposal ban as the Denver Arapahoe Disposal Site (DADS) is operated by a private contractor. The DADS operator accepts a significant quantity of waste from other generators who may not support a ban (although nothing would preclude Denver from working with its contractor and other users to make this a regional or even statewide initiative in the future). Denver could, however, implement policy to prohibit the collection of yard waste as trash16 (similar to mandatory enforcement of yard waste diversion discussed above). This would require concerted education and enforcement measures, and could only be implemented once full yard waste collection services (including large-item yard waste collection options) are in place. Denver could also support statewide yard waste disposal bans, should some ever be introduced. Meeting Denver Greenprint’s Landfill Reduction Goal.
This goal calls for a reduction in landfill tons generated by Denver’s residential collections to 185,000 tons by 2011 (from 2004 baseline). Denver’s recent WCS analysis of 2008 tons illustrated that this goal would be achieved if 40% of each of the total potential quantity of recyclables and organics are successfully diverted. If this were accomplished, the resulting overall diversion rate would be approximately 27%, which compares much more favorably with the 2007 national average recycling/composting diversion rate of 33.4% than the current program achieves.
Based on the estimations made from the pilot project results, it appears that a citywide organics recovery program could exceed a 40% organics diversion rate and significantly contribute to meeting the Denver Greenprint goal.
15 Note that Denver Recycles program is voluntary and 53% of eligible single-family homes currently participate. These homes generated an average 34 pounds of recyclables per set-out in 2008 (a relatively high number compared to available data for other U.S. programs). 16 Other communities without the ability to enforce an actual disposal ban implement this type of mandatory diversion. One example is Fort Collins’ ban on the collection of electronics by residents (i.e., imposed on private trash haulers).

Final Report to CDPHE on RREO Grant Denver-DIA Organic Waste Diversion Project
22 8/28/09
R6.0. Financial Summary Table 2 – Budget Overview Spending trackingResidential Pilot Only
Amount Invoiced to GraDonated Amount Total BudgetEquipment over $500065-gallon wheeled carts 76,849.00$ 68,000.00$ 144,849.00$ 3-gallon kitchen pails 13,741.61$ -$ 13,741.61$ Bio-bags 5,373.17$ -$ 5,373.17$
Equipment under $5000Waste sort supplies 318.01$ -$ 318.01$
OperationsEOS drivers 25,920.00$ 30,230.00$ 56,150.00$ Supervisor 21,065.00$ 19,992.50$ 41,057.50$ Truck cost (14680 miles at $2.84) -$ 41,691.20$ 41,691.20$
Administrative Personnel- SWM -$ 30,418.00$ 30,418.00$
ConsultantsHDR 23,737.55$ 2,324.00$ 26,061.55$
Contractors/Sub-contractorsA1 Organics (processing fees) 12,037.78$ 12,037.78$ 24,075.56$
-$ -$ Education Expensesgraphic design 3,166.90$ 3,166.90$ printing and mailing 5,839.00$ 5,839.00$
Total 179,042.12$ 204,693.48$ 383,735.60$ A summary of grant dollars spent and in-kind donations are attached. It should be noted that many of the expenses incurred were start-up costs, necessary for the program’s success but if this were not a pilot they would have been spread over a larger number of participants. Of specific note: The carts and kitchen pails are a one time start up cost. Rehrig Pacific warranties its carts
for 10 years and we expect to see an average of 15 years of life. This cost should be amortized.
Supplying BioBags to participants would not be part of a citywide program. The City tested them to determine their effectiveness at encouraging the composting of more food waste. The City would work with the BioBag vendors to ensure more opportunities for residents to purchase them in retail outlets for future service.
Through the pilot program, staff has developed all the education resources needed for the service. Moving forward the City would only incur printing costs.
Routes were not designed to maximize efficiency.

Final Report to CDPHE on RREO Grant Denver-DIA Organic Waste Diversion Project
23 8/28/09
DENVER INTERNATIONAL AIRPORT COMPOSTING COLLECTION PILOT PROGRAM
A.1.0 Project Description and Overview of Work Completed
DIA Food Waste Composting Pilot Project Report
A1.1 About the Project
History. The DIA Food Waste Composting Pilot Project’s history actually goes back to 2005 when DIA Environmental Services (ES) prepared its first Integrated Waste Management Program (IWMP). The IWMP established a baseline solid waste disposal rate of 0.51 lbs of total disposed solid waste per year per passenger, and set goals for further waste reduction (Integrated Waste Management Program: Final Report for DIA, November 1, 2005, Gracestone, Inc.). The IWMP identified best management practices for a number of waste streams, including DIA’s organics waste, and recommended that a pilot project be conducted on organics composting.
In Spring 2008, a Waste Composition Study was conducted on trash generated at DIA (funded in part by a Denver Department of Environmental Health Seed Capital Fund grant as well as by DIA). This study found that approximately 29% of DIA’s overall waste stream was organic waste, with three major sub-categories: (a) food waste including bones and rinds, food-contaminated paper towels and napkins (18%); (b) paper towels and tissues from lavatories (8%); and (c) other organics, such as waxed cardboard (3%). Further, this study found that 18% of the waste, by weight, generated in only the Main Terminal and Airport Office Building (AOB) areas alone was also food waste. The Main Terminal and the AOB comprise the core DIA facility that supports three concourses and numerous support facilities.
A1.2 Pilot Scope and Basic Program Design
Based on this groundwork, DIA ES wanted to conduct a pilot study to explore the feasibility of diverting food waste from the Main Terminal and the Airport Office Building (AOB) to evaluate if diversion of organic waste could viably help meet its ongoing goals of reducing disposed solid waste. The RREO grant made the pilot project possible.
Pilot Project Participants. The DIA grant was carried out with assistance from several parties, including 16 food vendors in the Main Terminal. The project required coordination between many different parties, which include: DIA Environmental Services (ES) – oversight and coordination; backup on physical
collection. DIA ES and Denver Solid Waste Management (SWM) staff – purchase and delivery of slim
containers17 and countertop pails to vendors, compostable liners; design and printing of educational materials; vendor training.
Denver SWM staff – coordinating hauling. Staff at all the food vendors – sort and separate correct materials into slim containers and
pails, and keep the slim containers clean and functional for their needs.
17 These tall, slim cans are often referred to as ‘slim jims’ – this is actually a trademarked name (Slim Jim by Rubbermaid). The pilot used a different brand (Busch Systems); hence they are referred to here as slim containers.

Final Report to CDPHE on RREO Grant Denver-DIA Organic Waste Diversion Project
24 8/28/09
Volunteers from two different companies at DIA – ISS (janitorial, formerly BG) and AECOM (formerly DMJM), both of whom donated time to actually haul the full BioBags of food waste from the food vendors to the roll-off at the loading dock.
Waste Management, Inc. – hauling roll-off to A1 Organics composting facility in Keenesburg.
A1 Organics – receiving and composting food waste. HDR team members, which included Gracestone, Inc and LBA Associates – gathering data,
including weighing selected samples of food waste; compiling and analyzing data, and drafting final report.
Pilot Design. The pilot program was designed to collect organic waste from: Volunteer vendors in the Main Terminal with pre-consumer food or plant waste. Employee break rooms in the AOB and Main Terminal. Organic waste targeted to be collected from these areas included: Food preparation (e.g. fruit and vegetable trimmings, meat trimmings, etc.). Food waste (e.g. stale bread, unusable pretzel dough, coffee grounds, unsold food, expired
meat, plate scrapings, etc.). Compostable paper products (e.g. non-recyclable fiber including food-contaminated paper,
waxed cardboard, wax paper, paper towels and napkins). Other compostable organics such as unsold flowers, register receipts, straw wrappers, milk
cartons, etc. From the AOB and Terminal break areas, employee lunchroom-type waste (e.g. banana
peels, coffee grinds, paper cups, towels and napkins; greasy fast food bags and papers; uneaten food).
Briefly, the pilot program was planned to work as follows: For vendors in the Main Terminal
o Kitchen staff separated compostable material from other solid waste in preparation areas, and placed the compostable organic waste in either 23-gallon Busch System tall, slim containers or Norseman 2-gallon countertop kitchen pails.
o Slim containers and pails were lined with BioBags – organically-based bags that biodegrade in the compost process and enable clean tipping of collected organics.
o Pails were also placed by registers at front counters to capture register receipts, etc. o On a pre-planned route through the Main Terminal, several times a day, janitorial or
other staff removed the BioBags from the slim containers/pails and placed them into either a 65-gallon cart or a tilt cart, then putting a clean BioBag into the slim container or pail.
o Each vendor’s containers were emptied from one to five times per day, depending on the volume of organic waste generated.
o Janitorial or other staff took the full cart to a 30-cubic yard open-top roll-off in the AOB loading dock area for tipping.
For the break rooms in the Airport Office Building (AOB) and Main Terminal o Pails were placed with appropriate signage. o Designated “Environmental Focal Point” (EFP) staff volunteered to empty the pails at
the loading dock; they did so about two to three times/week, as needed to avoid overflow.

Final Report to CDPHE on RREO Grant Denver-DIA Organic Waste Diversion Project
25 8/28/09
From the loading dock, the roll-off was hauled by Waste Management (WM) once per week to A1 Organics (A1) facility in Keenesburg, CO.
WM tipped the organic loads at A1, where A1 composted the material. o WM and A1 billed Denver SWM, who then paid bills out of the RREO grant funds.
DIA ES staff coordinated collection and provided trouble-shooting and fine-tuning of the program for all aspects on-site at DIA.
Denver SWM managed the purchase of necessary equipment, design and implementation of signage.
Both ES and SWM planned and delivered necessary training to vendors’ staff and EFPs.
The HDR team provided planning, training, weighing/sampling to obtain detailed data, coordination, data gathering, and report writing.
Chronology. The main events in the DIA pilot project occurred as follows. This list also provides an overview of the management process: July 11, 2008: Kick-off meeting for both DIA and Denver programs. July 18, 2008: DIA-specific kick-off meeting. August 2008: Site tours for key players. September 4, 2008: Meeting for all program participants, including concessionaires
(vendors), janitorial (ISS, formerly BG Janitorial Services); DIA staff including Environmental Services (ES), Contract Managers, Engineering; Denver SWM; volunteers (AECOM); and HDR team. Explain program to vendors, find out needs, review what can/cannot be composted, and encourage participation.
September 2008: Survey concessionaires to better understand what is generated and other needs.
End of September, 2008: Confirm concessionaire participation. October 2008: Specify and order collection bins and bags (slim containers, pails, BioBags). Fall 2008: Design posters, labels, and table-top tents displays and get printed. November 2008: Tour A1 Organics composting facility to understand its operational needs. November – December 2008: Plan pilot rollout, including
o Planning for deploying containers. o Setting collection schedule. o Coordinating collection between ISS, ES, AECOM. o Designing training for vendor staff. o Planning roll-off placement at DIA loading dock. o Making haul arrangements from DIA to A1. o Confirming A1’s needs and contamination limits. o Identifying data needs.
Week of January 6, 2009: Training for participating vendors’ staff conducted by ES, SWM, and HDR staff.
January 26, 2009: Pilot kick-off (collections begin from all participants). January – April 2009 Pilot program operations
o 16 vendors in the Main Terminal participating. o Janitorial and other staff emptying an average of about 15 containers per shift, carting
the organic waste to the loading dock. o Fine-tuning collection schedule to meet vendors’ and staff’s needs (ES managed).

Final Report to CDPHE on RREO Grant Denver-DIA Organic Waste Diversion Project
26 8/28/09
o Random weight measurements by HDR team to get data-points on weight by day, vendor, and shift; visual fill observations (February - April 2009).
o EFPs emptying AOB break room waste. April 15, 2009: Pilot ends (no further collection).
A2.0. Summary of Findings and Results
A2.1 Weight/volume findings
Overall, it is estimated that 31-38 tons (approximately 151 cubic yards) of organic waste was collected and composted from DIA during the 11.4 weeks that the pilot ran.18 This equaled approximately 2.8 - 3.4 tons/week. Total tonnage was derived based on weight measurements of slim containers and pails taken during the pilot. Weight and volume information is critical in evaluating future program viability, as it helps predict costs and sizing for capital equipment, collection receptacle numbers, hauling costs, and labor costs. For the Main Terminal the following metrics and program parameters yielded data about
weight and volume:16 vendors participated, including 9 restaurants, 2 coffee shops, 2 quick snack shops, 2 food preparation areas (not at same spot as the restaurants), and 1 general market area (coffee, wrapped snacks, and flowers).
30 slim containers and 6 pails were placed at these vendors’ sites. Slim containers and pails were emptied each day from vendors’ kitchens in the Main
Terminal, for a total of about 820 tips of the slim container and pail containers per week (or 9,394 total). Appendix 2 shows the schedule and number of containers emptied, by vendor, during the pilot.
During February through April weight measurements, the HDR pilot team observed: o Containers averaged about 30% full (based on a visual assessment). o Slim containers contained an average of 8.1 lbs. of organic waste. o Pails contained an average of about 1.4 lbs of organic waste.
The data from measuring vendors’ organic wastes showed that weights and fill varied by vendor type as shown in Table 3 below (full detail can be found in Appendix 2). (Note that this data is based on sampling a total of about 300 weights taken of individual containers, across 18 separate shifts on each day of the week – or about 3% of all containers emptied during the pilot period).
18 This number was derived from averaged weight of all containers of 6.6 - 8.1 lbs/containers (slims and pails). The overall weight and the lbs/container are expressed as a range because only 3% of the pilot’s collected organic waste was sampled and actually weighed. Scales were not available to weigh the total material coming from the pilot, so material was measured by volume. A1 Organics estimated the weight of pilot organics received at its facility based on assumptions about density that did not match the actual density found in weights and fill-level observations taken by the pilot team.

Final Report to CDPHE on RREO Grant Denver-DIA Organic Waste Diversion Project
27 8/28/09
Table 3 – Average Weight and Visual Percent Full, by Vendor, Based on Sampling
Average visual percent full per
container[1]
Low HighRestaurants 6.7 24% 34%
Coffee Shops 7.2 24% 34%Food Prep Facilities 18.1 32% 40%Quick Snack Shops 12.2 35% 45%
General Store 5.3 19% 29%Grand Total (all sites) 7.3 25% 35%
[1] Expressed as range - volume varied as some slims had boxes in bottom so bags wouldn't break
Average lbs./container by vendor type
Clearly, food preparation facilities (2 kitchens doing all the food preparation for 3
restaurants serving plated, cooked food) generated the heaviest waste per slim container of all vendor types (food preparation facilities didn’t use pails). Restaurants’ weights are low as food waste related to their service is generated primarily at the food preparation facilities. The general market area, which had coffee grounds, wrapped snacks and flower waste, generated the least weight per slim container.
Fill volume did not correlate with weight. This is due to following variables: o How much actual food prep is done on-site by the vendor vs. how much food is
brought to the site “pre-prepared” – e.g., Domino’s brings in its food ready to serve. o How heavy the food waste is – e.g., the pretzel vendor in the Quick Snack category
threw out unused, uncooked dough before closing, notably raising the weight in that category. Coffee shops’ waste is heavy, wet grounds in contrast to restaurants (e.g., fast-food pizza or burger service) that toss large amounts of compostable paper (waxed cardboard and paper packing) which can fill a slim container without much weight.
o How well staff participated in sorting food waste as directed.
For the Airport Office Building and Main Terminal break rooms, the following observations were made about weight and volume: 12 to 15 pails were placed in AOB break rooms, and were emptied two to three times per
week. Pails from the AOB were note weighed, but the weight of waste from this location was
assumed to range from 270 - 1,500 lbs. during the pilot period. This range is based on the carrying weight of a pail full of kitchen waste – from one to three pounds.
Foot-activated pails (to avoid hand contact) were recommended by the people collecting the break room organics.
A3.0 Summary of Unanticipated Outcomes or Roadblocks The DIA project encountered two unexpected roadblocks. The first was the need to switch from DSWM providing the hauling to a private contractor (Waste Management, Inc.) after initial site checks of the loading dock area. It was determined that Waste Management was better equipment with commercial collection equipment than DSWM and would have the ability to adjust service levels if needed. The second unanticipated outcome was the odor that came from having the food waste roll off stored inside. This problem was controlled through

Final Report to CDPHE on RREO Grant Denver-DIA Organic Waste Diversion Project
28 8/28/09
regular collections of the roll off, however this meant the roll off was emptied even if it was not full. A4.0 Communication of Project
DIA has communicated this project through marketing internally to vendors, a press release about the program on February 26, 2009, and article in the GreenPrint Denver February 2009 Newsletter, and has plans to present the program at the Colorado SWANA Annual Meeting in October 2009.
A5.0 Future Impact of the Pilot
A5.1. Discussion and Summary
This section analyzes the costs and resources used for the project in order to project the costs for a full-scale, permanent program in the Main Terminal. It also provides observations and anecdotes that will be relevant to future planning. A. Lessons Learned – relevant to future implementation
A variety of lessons were learned in the course of implementing the pilot project:
Quality of feedstock (contamination issues). Organics waste as collected is a feedstock for an industrial process (the making of compost), not a waste going to landfill with no future use. Therefore it is important to meet the quality standards set by the receiving party (A1 Organics). A1 reported that it had little problem with contamination in the material received from DIA and its operator said “for the most part the material seemed cleaner than typical food waste we receive.” It rated DIA’s material contamination levels as acceptable to good.
The collection of the organics from vendors’ kitchens was performed by a more-or-less dedicated staff (as opposed to the vendors’ own staff); this meant that collectors communicated with kitchen staff daily, providing immediate corrective feedback when contaminants were found in slim containers or pails. Contaminants included mostly plastics (box and food wrapping, plates, utensils), aseptic packaging (chai tea), foil, glass, metals, and as well as some paper materials that were not contaminated and could have been recycled. This regular communication may have yielded a cleaner stream than would result from having vendor kitchen staff fill and empty organics containers on their own, with no regular (daily) corrective feedback from a janitor to kitchen staff. The ISS supervisors requested that posters be pasted on each slim container to educate kitchen staff about acceptable items.
It was observed that some restaurants (e.g. Boulder Beer, Red Rocks, Aviator’s Club) were adding post-consumer waste (plate scrapings) into the slim container accessible to the wait staff. Contamination in the form of newspapers, cigarette butts (from the Smoking Lounge), plastic coffee cups was observed, though was not pervasive.
Some contamination was observed in the open-top roll-off in the loading dock; it appears trash was dumped in the roll-off as many employees have access to the area, goods come in for distribution to restaurants, and there is little oversight. Contamination in the roll-off included secondary packaging boxes, plastic film, strapping and buckets, and trash. ES staff made a “hook” to fish out and remove contamination from the roll-off. Signage was set up and access restricted with a cloth rope, but some contamination did continue.

Final Report to CDPHE on RREO Grant Denver-DIA Organic Waste Diversion Project
29 8/28/09
Lessons Learned: Ensure mechanism for regular corrective feedback to kitchen and wait staff, including appropriate training, signage, rewards, etc. Control access to collection receptacle to avoid contamination from staff working in the loading dock. How this is done will depend on the type of container used (compactors and other receptacles have options such as locking lids to prevent unwanted tipping).
Biodegradable Liner Use. The schedule for emptying slim containers and pails in the Main Terminal called for about 9,400 separate “emptyings” during the pilot period. Over 14,600 BioBags were used during the pilot. Practices with regard to use of BioBags varied depending on who was doing the collecting. Generally, when ES and AECOM did the collection route, they would tend to consolidate waste materials, and not replace the BioBag if it was not wet, contaminated with food waste, or wasn’t full. However, ISS staff (trained janitors) would sometimes place the whole BioBag into the collection cart even if it was barely full and not dirty, and replace a new one into the slim container. Janitorial staff would also double-line the slim containers for vendors with particularly heavy or wet food waste (coffee shops, food prep facilities), sometimes tipping both bags into the collection cart. Double lining did however, keep the slim containers cleaner. Lessons Learned: Ensure mechanism to keep costs related to BioBag use down. If vendors are buying and replacing them out of their own budgets (as they do with trash bags) they may use them more sparingly. As well, vendors did find that the BioBags are not as sturdy as a trash bag when carrying, say, 20-30 lb. of wet coffee grounds all the way to the loading dock. This could be an obstacle to program success. If janitorial staff does rounds to collect organics, they will need additional training to avoid over-use of BioBags. See following discussion for additional recommendations.
Biodegradable Liner Types. BioBags are currently the most popular biodegradable bag on the market. A1 Organics’ Keenesburg facility manager did note that A1 must pay to dispose of shredded biodegradable liners that blow off the windrows and collect on perimeter fences. Recognizing the value of BioBags to participation, A1 Organics has indicated they are working on better process to handle shredded bags.
Another observation is that vendors managing their own organics disposal might forget to use biodegradable bags, forget to re-order, melt/break the bag through incorrect use, or object to the cost and thus make unacceptable substitutions.
The BioBags purchased for the pilot (20 gallons) were not deep enough for the 23-gallon Busch Systems containers. It was hard to secure them around the top of the container, resulting in the bags often slipping down into the slim container when it was heavy and full. Staff devised a temporary solution – placing a box in the bottom of the slim container to make the slim’s overall volume smaller. Larger bags might also solve this issue.
Finally, the BioBags were not always strong enough for vendors who generated really heavy waste such as pretzel dough or coffee grounds. Double-bagging solved this (at added expense). Lessons Learned: Research other biodegradable bag types that might cost less and offer a better sizing match to the containers, better ability to be secured to the container and better strength for the coffee ground generators, etc.). Train staff emptying containers carefully on when BioBags do and don’t need to be replaced, and how to manage double-bagging to ensure cleanliness but minimize expense. While this was difficult to achieve during the pilot, growing organics recovery in restaurants and similar waste generation sites may expand future liner and

Final Report to CDPHE on RREO Grant Denver-DIA Organic Waste Diversion Project
30 8/28/09
container options and also decrease prices. If vendors are managing their own compost separation and disposal at the loading dock, ES managers should monitor types of bags being used and provide corrective feedback if needed.
On-Site Collection Containers. (Busch System slim containers and Norseman kitchen pails). On the whole, these worked very well, though they did get dirty and vendors complained about this occasionally. The loading dock area has hot/cold water spigots and the ES and ISS staff provided cleaning of slim containers as needed. One slim container broke during the pilot; ES was able to replace it. Some vendor staff expressed concerns about people touching the lids of the compost pails or rims of the slim containers and thus being exposed to germs and bacteria. Lessons Learned: At the beginning of a program of this type, some adjustment is needed while vendors “right-size” their receptacles. A strong program coordinator who is responsive and can bring or remove the receptacles right away aids program success (which ES did very well). Regular cleaning of slim containers will be needed, and a plan for both swapping out slim containers while being cleaned and for replacing broken ones should be included. Other receptacle options should be explored, such as a floor pail with a lid that opens with a foot-activated pedal. This may alleviate concerns about germs. Additional education around the fact that composting and trash are very similar may also alleviate these concerns.
Setting Collection Schedules. It took two to three weeks for ES to work with vendors to establish a schedule that worked well for all parties. This should be considered during planning for a full-scale diversion program. There are many particulars in establishing a workable schedule that can maximize organics capture – e.g., one vendor closed at 10:30 pm (after last pick-up of day at 9:30 p.m.) and did not want to store organics waste overnight in its kitchen because of sanitary concerns. A 65-gallon cart was placed in the hallway outside of this vendor’s kitchen where it could toss its filled BioBags before closing. The cart needed to be added to the collection route.
The percent full (or fill) level of slim containers was observed visually during sampling activity, and averaged 25-35% full. As shown in Appendix 2, vendors’ containers were emptied from two to five times per day. It is likely that the number of collections at some vendor locations could be reduced, raising the average fill level, and reducing labor costs without compromising on sanitary or odor issues for the vendors. This would be especially true for the restaurants, coffee shops, and the general market (see Table 3).
If janitorial staff is used to empty receptacles, a schedule must be set that respects shift changes. Lessons Learned: If DIA is in charge of scheduling a route to empty the slim containers and pails, consider reducing service somewhat to lessen overall labor requirements (and to have a greater organics material-to-BioBag ratio). Vendors with light organic waste but high fill volumes might be targeted first, and encouraged to break down milk cartons, pizza boxes and other dirty or waxed cardboard or other items contributing to high volume/low weights. If janitorial staff is used to empty receptacles, a schedule must be set that respects shift changes. Data on average weights per container (Table 3), while based on random sampling, can be used to project weights when expanding the program throughout DIA.
Collection Carts and Systems. The janitorial staff observed that the 65-gallon carts were difficult to move through the collection route, and preferred the large, gray, tilt carts normally used on DIA internal trash collection routes. The larger tilt carts also enable better collection of

Final Report to CDPHE on RREO Grant Denver-DIA Organic Waste Diversion Project
31 8/28/09
waxed cardboard (it’s bulky to break down and hard to fit in a slim container). It was also easier to empty the tilt carts into the roll-off than the 65-gallon carts. Lessons Learned: If DIA is in charge of scheduling a route to empty the slim containers and pails, use of the self-dumping tilt carts may enable more efficient “routing” and better capture of entire stream. In the access corridors to vendors’ work areas, where possible, staging areas could be set up with 65-gallon carts where vendors would bring their BioBags. This would create an incentive to use fewer BioBags, would add convenience for vendors, and reduce routing frequency. Locations suggested include Carnation hallway behind the Food Court, Pour La France, and possible locations on the fifth floor.
B. Costs and Needs for Full-Scale Implementation in Main Terminal
This section addresses what would be needed for full-scale implementation of an organics pilot in the Main Terminal and AOB.
To calculate costs of a year-round Main Terminal organics collection program versus “business as usual,” it is necessary to compare against DIA’s current waste disposal practices and costs. Table 4 shows the major steps involved in waste management in the Main Terminal in order to compare the pilot program to ‘business as usual’ (trash disposal).
Table 4 – Considerations: Business-as-Usual Waste Disposal vs. Composting Pilot Business as Usual -
TRASH Composting Pilot -
ORGANICS Activity
Who does it?
Who pays and how?
Who does it? Who
pays and how?
Considerations for Full Implementation
Generate and manage waste on site
Vendor No charge Vendor No charge
Behavioral change required of staff to sort organics from solid waste. Ongoing training and feedback required to get best results
Take waste to load dock and tip
Vendor staff Vendor pays staff to do this
Pilot crew (ISS, ES, AECOM)
Donated for grant
This task could be done by dedicated janitorial staff (less cost to vendors, helps reduce contamination, avoid build-up, cost could be passed through in lease fees) or by vendor staff (as waste is hauled now)
Haul roll-off to where it’s tipped
WM to DADS landfill in compactors
DIA. Cost to vendor is in lease fees, not broken out.
WM to A1 Organics at Keenesburg in roll-offs (covered for transport)
SWM paid from grant $$
Food waste could be compacted at DIA to reduce volume (discussed below), rental cost, and space requirements. Discussed under “Loading Dock Containers” below, in this section.)
Receive and manage the discarded material
WM operates DADS landfill
DIA via contract w/ WM. Cost to vendor is in lease fees and not visible.
A1 at Keenesburg
SWM paid A1 from grant $$
If City of Denver (DIA and residential organics) became large customer of A1 we might be able to negotiate reduced tip fees. Consider buying compost from A1 as part of deal for airport and other city projects.

Final Report to CDPHE on RREO Grant Denver-DIA Organic Waste Diversion Project
32 8/28/09
Labor. The pilot was conducted with staff (ES, ISS, AECOM) providing pick-up in the kitchens of vendors. As such, it is the highest level of service possible – about 70 hours/week were used to collect from Main Terminal vendors across five shifts, seven days/week (the schedule is shown in Appendix A). Annualized, this would equal 1.8 FTEs19. Paid at ISS janitorial rates ($22.00/hour, burdened), this would cost about $81,800.00 (2009 dollars). Options to reduce labor cost, in order of decreasing the direct janitorial cost to DIA (but increasing the risk of contamination) – with pros and cons discussed – include: Provide consolidation points in hallways for organic waste collection, where feasible
o Pros: enables tipping for kitchen staff as needed, fewer stops needed to collect en route.
o Cons: access and egress issues with carts in the hallway. Reduce number of shifts collected or number of pick-ups per shift (coffee shops received
the most pick-ups per week (82) and the general store the least (19)); this could be fine-tuned to ensure higher fill volumes per tip of slim container or 65-gallon cart.
o Pros: reduces labor costs. o Cons: requires thoughtful observation by supervisor or ES staff.
Increase rent to tenants to cover the costs of trained, dedicated janitorial staff collecting organic waste from tenants’ kitchens/operations.
o Pros: ensures clean stream and smooth operations from kitchen to compost facility, creates jobs, reduces labor needs for tenant (fewer trips emptying trash).
o Cons: may require more training than janitors usually get, so they can give corrective feedback to kitchen staff on contamination, increased costs to tenants.
Simply have tenants do all hauling of organic waste (as they do presently with solid waste) to loading dock area.
o Pros: least cost to DIA directly. o Cons: increased training and training costs due to employee turnover; likely to
continue to have contamination issues.
Costs discussed above do not include the cost of training janitorial staff, and having management and oversight involvement from ES and DIA’s contract services. Those costs – after program startup – are estimated to be about 2 hours/week (at $41.00/hour burdened) or $4,300.00/year (2009 dollars). Decision Questions: (1) Should vendors be asked to purchase BioBags, and sort and haul food waste in those bags to a dedicated roll-off in the loading dock (as they do now with trash) or should DIA offer collection of food waste via janitorial staff? (2) Who should carry cost of biodegradable bags – DIA or vendors? (3) Depending on decision, modification of vendor contracts?
Costs and Contractor Service. As noted in Table 5, direct costs related to signage, BioBags, receptacles, hauling, and tipping fees over the pilot period totaled about $10,300 (labor is excluded). The direct cost for the pilot of hauling organics to A1 plus A1’s tipping fee equaled $103/ton (based on assumed total of 34.4 tons, the midpoint between the estimated range of 31 - 38 Ts collected); this equaled $23/cubic yard. This cost represents an actual cost of $63/ton
19 Actual numbers, based on pilot: 71.5 hrs/week = 3,719 hrs/year; when staffed with full-time, 40-hr/week employees = 1.8 jobs. These are direct jobs as distinct from indirect jobs which are a result of the employed person’s spending and economic activity.

Final Report to CDPHE on RREO Grant Denver-DIA Organic Waste Diversion Project
33 8/28/09
when the avoided cost of hauling plus landfilling of $40.25/ton is subtracted. As noted, A1 charged half its normal tip rate for the pilot.
When weights and costs are annualized and adjusted to actual charges, collecting the estimated 156 Ts (about 3 Ts/week, or 687 cy at 4.4 cy/T) of organic waste (that would be generated in the Main Terminal plus the AOB) would directly cost $11,600 based on: 35 pulls/year at $211/pull (assumes 30-yd roll-off pulled no less than 2/3 full). $4.20/load County Road Maintenance Fee charged at A1’s Keenseburg facility. $26.50/ton tip and process fee charged by A1 Organics. 2009 charges are used here.
Subtracting $6,300 in avoided haul and landfill tip fees (based on 2009’s cost of $40.25/ton for waste disposal), derives a total actual annual cost to DIA of $5,300 or $34/ton (based on 2009 dollars). There are a number of variables that likely will lower this $/ton fee: New disposal service costs; if the $40.25/T figure rises, the actual $/T cost for composting
will go down. Landfill tip fees may go up. Pull fees could perhaps be negotiated to be lower. These calculations are based on current density of the waste as collected in the pilot (4.4
cy/T). If a compactor were installed, the organic waste density could increase, resulting in fewer pulls and a lower cost (see discussion on compaction below).
Increased rents from tenants to cover costs on the labor side could also possibly be adjusted to recoup some of the haul and tip fee costs.
A1 has indicated it would negotiate its tip fees for a permanent program, particularly with known, clean streams from both the City and DIA.
Ability for A1 to accept food waste at a location closer to DIA than Keenesburg may result in lower tip fees.
As the program expands and matures, collection of more compostables and greater vendor participation will yield efficiencies, lowering per-ton costs.
Vendors with organic waste off-site but near to DIA (grocery stores, restaurants, even homeowner associations with organic wastes) could participate in establishing an organics collection route in the area that would increase efficiencies and lower costs.
Without these cost reductions, the cost of composting may seem high as compared to landfilling. Note however, that some of the value of composting is difficult to quantify in economic terms but of value to DIA and the City and County of Denver nonetheless: Reduced greenhouse gas impacts (composting food discards yields a net reduction of 0.05
MTCE/ton while landfilling increases greenhouse gas emissions by 0.20 MTCE/T20). Creates more jobs than landfilling (an ILSR study found composting creates 4 jobs per
10,000 Ts of waste composted, while landfilling only creates 1 job/10,000 Ts21).
20 MTCE = Metric tons of carbon equivalent per short ton of material. From Exhibit ES-4 “Net GHG Emissions form Source Reduction and MSW Management Options,” in Solid Waste Management and Greenhouse Gases: A Life-Cycle Assessment of Emissions and Sinks 3rd Edition, September 2006, US EPA, available at http://epa.gov/climatechange/wycd/waste/SWMGHGreport.html 21 “Recycling Means Business,” from the Institute for Local Self-Reliance, available at www.ilsr.org/recycling/recyclingmeansbusiness.html

Final Report to CDPHE on RREO Grant Denver-DIA Organic Waste Diversion Project
34 8/28/09
Passengers value green efforts and have expressed appreciation to vendors with table tents touting the program – adds to Denver’s image as a green city and builds on City and State goals of growing green, clean tech jobs.
Supports DIA in meeting its environmental goals, and maintaining its position as an environmental leader in both the City and County of Denver and the airport community.
Life cycle costs of diversion vs. disposal are lower. Loading Dock Containers. The ability to increase efficiency and decrease haul costs was evaluated for a permanent organics recovery program. It is not reasonable to haul food waste from the AOB loading dock to a composting facility less frequently than weekly due to potential nuisances (especially during the summer). However, smaller containers and denser food waste could be considered to decrease container rental cost, hauling cost (if based on container size), and reduce the loading dock space requirement. Discussion of these options follows.
1. Smaller roll-off: The 30-CY roll-off used for the pilot study never appeared to be filled more than 50%
between pulls and some weeks was as low as 30% full (by visual observation).
Depending upon the number of new Main Terminal vendors added to a permanent program, DIA could reduce the roll-off size to 20 CY, which would give an approximate peaking factor of 1.3 over the maximum fill level observed during the pilot.
It must be noted that volumetric measurements for the pilot are very approximate, however, and adjustments would be expected during implementation of a permanent program.
2. Volume reduction on site at DIA’s loading dock using a dedicated food grinder: On-site grinding of collected food waste at the AOB loading dock could reduce the waste
to be hauled and tipped at a processing facility but would: o Increase labor and utility requirements for DIA staff and/or contractors, and more
oversight would be required than the trash/cardboard compaction process already in place at DIA.
o Typically processing plus storage tanks will be required – hauling may be by vacuum truck instead of compaction vehicle or roll-off hoist.
Most importantly, grinding reduces the ability to remove contaminants prior to processing and would degrade the high quality of organics DIA generated during the pilot study (A1 Organics has expressed its concern about accepting pre-ground food waste due to contaminant concerns).
Therefore, organic waste grinding is not considered a viable option for DIA.
3. Volume reduction on site at DIA’s loading dock using a compactor: Front-load self-contained compactors.
o The units are available in the 6-CY range with the ability for a volume reduction of up to 4:1 (results vary based on specific waste composition).
o DIA could experiment with quantities generated during permanent operation and actual volume reduction achieved; it could use two compacting dumpsters for redundancy.
o Front-load collection vehicles would be required. Full-size self-contained compactors
o Similar to those used on-site for trash and cardboard.

Final Report to CDPHE on RREO Grant Denver-DIA Organic Waste Diversion Project
35 8/28/09
o These units can be as small as 17 CYs. o Compaction ratio is typically 4:1. o These units were evaluated in DIA’s “Integrated Waste Management Program”
(Gracestone, 2005).
DIA could investigate the collection of compostables with a front-load vehicle at once or twice per week intervals as part of a regular organics collection route.
Decision Questions: (1) Evaluate container size and features for best “fit” in terms of loading dock space, need to reduce haul frequency and costs, contamination issues with size reduction technologies, operational resources, etc.
Future Compost Processing Possibilities. Should the pilot prove feasible for permanent program development, then DIA will be adding a new method of managing a portion of its solid waste stream to its repertoire of waste management strategies. As such, it is may be valuable to consider other options for converting the organic waste stream to compost, in a way that could reduce haul and tip fees. One such alternative would be for DIA to process food waste and use the compost product on-site. Processing would require an in-vessel system (containerized bio-reactor) to control space requirements, odors and vectors. In-vessel technologies include vertical flow reactors, horizontal or inclined flow reactors and batch reactors. In general, these systems are highly mechanized and have high capital and operating costs. While these technologies would typically reduce collected food waste volume by 50% or more and avoid the cost of hauling and tip fees at a private compost facility, an on-site system would require DIA to: Dedicate indoor space for the active in-vessel composting operation (package systems can be
relatively small while aerated windrow systems can be several acres) and space for curing. Train and dedicate staff to operate and monitor. Purchase and store bulking agents (such as wood chips, shavings, etc. to achieve required
moisture levels). Provide mechanical and electrical support (especially for the aeration system needed to
maintain aerobic conditions and control odors). Provide equipment to move product. Provide aeration and bio-filtration. Manage leachate. Screen feedstock and finished product for contaminants. Utilize finished product (if used on-site, some Colorado testing, labeling and revenue
regulations would not be triggered and compliance requirements would be reduced).
It should be noted that there are small self-contained, package in-vessel system options available that require minimal space, minimal operation, and include the aeration system within the unit. One example is the Earth Tub by Green Mountain Technologies (90” diameter and 68” height), which was specifically designed to process institutional food waste on-site. These tubs could ideally be located at the loading dock or other convenient location (such as in the concourse area if composting is expanded airport-wide) close to collection aggregation points (although it is not likely that DIA would have the space near the terminal/concourses for even small composting units). Alternatively, these units could be placed in an outbuilding elsewhere on DIA’s campus. With a maximum capacity of only 30 to 40 tpy per tub, DIA would require several tubs.

Final Report to CDPHE on RREO Grant Denver-DIA Organic Waste Diversion Project
36 8/28/09
Additionally, organics sourced from residential and commercial generators in the area could contribute to feedstock and sizing options, suggesting consideration of other composting technologies and processes, based on economies of scale.
Such an option would not necessarily put DIA in to the wholesale/retail business if it used all compost on site in its own operations. Or, it could contract with a business specializing in marketing and sales of finished compost. This might be an arrangement not unlike DIA’s hosting of photovoltaic collectors with a third-party managing the distribution and sale of electricity generated onsite.
Hauling Considerations. A final note considers the ability to haul large loads of food waste within Colorado legal vehicle weight limits. This can come into play with dense food waste (in the 500 to 1,000 lbs/CY range22). However, this is not likely to be a consideration for DIA organics, based on the pilot study’s estimation of an average of up to 300-450 lbs./CY density23.
Any change to container size or addition of on-site processing of DIA’s food waste should be carefully considered based on future quantity projections, equipment selection and compost facility parameters.
Decision Questions: (1) Use density calculations as a negotiation point to secure lower tip fees? A6.0 Financial Summary
A6.1. Cost data Most direct project costs were covered by the RREO grant funds. This included the following: Equipment to get organic waste from kitchens and break rooms to loading dock:
Table 5 – Cost of Equipment for Collecting and Disposing Organic Waste
Unit Number CostTotal Bags
UsedCost/Bag
BioBags: Super Slim Liners cases 27 $3,860.16 7,620 $0.38BioBags: 2.5 gal. Pail Liners cases 27 $633.60 7,000 $0.09
Slim Jims each 30 $1,149.69Pails each 45 $280.35
65-gallon Carts each 4 $198.32Total $6,122.12 14,620
o This included nearly 8,000 individual slim liner bags and about 7,000 pail liners. o The cost of gloves was carried by the janitorial service or other collectors. o 65-gallon carts used on the Main Terminal collection routes were provided by the
grant; when the janitorial staff used the tilt carts, it was from its own fleet of carts. Hauling costs totaled $2,532.00, representing 12 pulls of the partially-filled 30-CY roll-off
by WM, over a 11.4-week period, based on submitted invoices. Tipping fees at A1 Organics totaled $998.79, based on submitted invoices
o Note that A1 provided DIA with tipping services at half its normal rate (i.e., $13.25 instead of $26.50).
22 EcoCycle’s food waste collection program has observed food waste density of about 500 lbs/CY and A1 Organics uses an average food waste density of 950 lbs/CY at its Keenesburg facility. 23 The limit for a 3-axle roll-off hoist unit is 54,000 lbs and chassis/hoist/container can weigh 31,000 lbs empty (based on Kenworth truck chassis and Wastequip hoist). A fully-loaded 30-CY container with dense food waste could exceed the total weight limit.

Final Report to CDPHE on RREO Grant Denver-DIA Organic Waste Diversion Project
37 8/28/09
A6.2 In-kind (not paid by the RREO grant) project costs were: Denver SWM spent $1,063.75 on design services for the DIA print materials and DIA spent
$652.00 for printing of table tents and posters, based on submitted invoices. HDR/Gracestone/LBA Associates donated 50 hours (approximately $5,800in labor) in
general support of this project. Gracestone/LBA Associates donated over 30 hours (approximately $3,500) to the collection
of vendor food waste weights at DIA. Labor hours and costs directly related to emptying containers, taking carts to the roll-off in the loading dock area, and tipping the carts are shown below in Table 6. These costs were not reimbursed by the grant and were donated by volunteer “Environmental Focal Points” (EFP) staff in the AOB and by a combination of janitorial (ISS), ES, volunteer staff (AECOM), and EFPs in the Main Terminal. Wages include fringe benefits (fully burdened). Note that the actual number of hours is the more relevant data point; this number is used in Section 3 below to discuss costs for a potential future project.
Table 6 – Labor Costs
Labor Provider HOURSWages/
HourCost
Average Hourly Cost
Main TerminalISS 386 $22.00 $8,483.64ES 225 $41.00 $9,221.31
AECOM 207 $44.00 $9,100.96Subtotal 817 $26,805.91 $32.80
Airport Office BuildingVolunteer EFPs 42 $41.50 $1,722.25 $41.50
Entire DIA projectTOTAL Value 859 $28,528.16 $33.22
The direct costs incurred to carry out the pilot are shown in Table 7, below.
Table 7 – Actual Costs for DIA Food Waste Composting Pilot
Category Cost Notes Grant Paid?Equipment $6,122.12 BioBags, Slim Jims, pails Yes
Printing fees $652.00 Done at DIA No, donated by DIALabor $28,528.16 See Table 3 for detail No, donated by all
Hauling $2,544.00 12 pulls over 11.4 weeks YesTip Fees $998.79 For 151 CY[1] Yes
Total $38,845.07
[1] A-1 charged for 72 Tons @ $13.25/T (half its normal rate), based on its volume to weight conversion rate,not based on actual weights. A-1 has indicated it can adjust this based on the pilot's sampled weights.
Additional resources were used to start the pilot that are not quantified here because they reflect grant implementation costs and are not reflective of non-grant, permanent program implementation: labor from Denver SWM, ES and HDR to plan the pilot, order equipment, conduct training, manage billing and payment, and gather data.
The direct cost for the pilot of hauling organics to A1 plus A1’s tipping fee equaled $103/ton (based on assumed total of 34.4 tons, the midpoint between the estimated range of 31 - 38 Ts

Final Report to CDPHE on RREO Grant Denver-DIA Organic Waste Diversion Project
38 8/28/09
collected); this equaled $23/cubic yard). Cost notes: Haul costs were $74/ton ($17/CY). 2008-2009 tip fees normally are $26.50/ton (plus County Road fee of $4.20/load) at A1.
This cost represents an actual cost to DIA of $63/ton when the avoided 2009 cost of hauling plus landfilling of $40.25/ton is subtracted. Put another way, DIA saved about $1,400 in solid waste haul/disposal costs during the pilot. 2. Next Steps for Residential and Airport Programs: Residential: Conduct additional seasonal analysis of the organics stream and test alternative hauling options through a 2009/2010 State grant.
Airport: DIA is currently renegotiating its waste services contract. DIA’s next steps are contingent on the both the costs associated with the new contract, evaluation of how the costs from the pilot extrapolate to not only the Terminal, but to the concourses over a full year, the overall economy, and the overall composting scope. Considerations for both projects: There would be value for the City to quantify the value of composting outside of the respective agencies budgets to quantify the benefits of: Reduced greenhouse gas impacts (composting food discards yields a net reduction of 0.05
MTCE/ton while landfilling increases greenhouse gas emissions by 0.20 MTCE/T24) Ability to create more jobs than landfilling (an ILSR study found composting creates 4 jobs
per 10,000 Ts of waste composted, while landfilling only creates 1 job/10,000 Ts25) The value the community and DIA passengers place on green efforts and how this impacts
Denver’s image as a green city and builds on City and State goals of growing green, clean tech jobs, etc.
Supporting the City and DIA in meeting its environmental goals, and maintaining its position as an environmental leader in both the State, Country and for DIA in the community of airports.
The environmental and financial impact of the finished compost being used locally through reduced water and fertilizer use (commercially and residentially), reduced surface run off, effects on local food production, etc.
24 MTCE = Metric tons of carbon equivalent per short ton of material. From Exhibit ES-4 “Net GHG Emissions form Source Reduction and MSW Management Options,” in Solid Waste Management and Greenhouse Gases: A Life-Cycle Assessment of Emissions and Sinks 3rd Edition, September 2006, US EPA, available at http://epa.gov/climatechange/wycd/waste/SWMGHGreport.html 25 “Recycling Means Business,” from the Institute for Local Self-Reliance, available at www.ilsr.org/recycling/recyclingmeansbusiness.html

Final Report to CDPHE on RREO Grant Denver-DIA Organic Waste Diversion Project
39 8/28/09
3. Appendices
Appendix 1 Maps of Residential Collection routes – attached as PDF files. Appendix 2 Residential Program Collection Data (attached excel spread sheet) DIA Collection Data (attached excel spreadsheet) Appendix 3 (attached as a PDF) Data from Neighborhood weighing and visuals

Final Report to CDPHE on RREO Grant Denver-DIA Organic Waste Diversion Project
40 8/28/09
Appendix 4 Residential Program Educational Materials (attached as a PDF) DIA Educational Materials (attached as a PDF) Appendix 4 Residential Program Educational Materials
1. Mailer inviting residents to participate

Final Report to CDPHE on RREO Grant Denver-DIA Organic Waste Diversion Project
41 8/28/09
2. Composting Guide provided with cart delivery

Final Report to CDPHE on RREO Grant Denver-DIA Organic Waste Diversion Project
42 8/28/09
3. Calendars provided with cart delivery

Final Report to CDPHE on RREO Grant Denver-DIA Organic Waste Diversion Project
43 8/28/09

Final Report to CDPHE on RREO Grant Denver-DIA Organic Waste Diversion Project
44 8/28/09
4. Seasonal education flyers e-mailed to participants

Final Report to CDPHE on RREO Grant Denver-DIA Organic Waste Diversion Project
45 8/28/09

Final Report to CDPHE on RREO Grant Denver-DIA Organic Waste Diversion Project
46 8/28/09

Final Report to CDPHE on RREO Grant Denver-DIA Organic Waste Diversion Project
47 8/28/09
DIA Educational Materials

Final Report to CDPHE on RREO Grant Denver-DIA Organic Waste Diversion Project
48 8/28/09
1. Marketing Flyer
2. Table tent used by participating vendors

Final Report to CDPHE on RREO Grant Denver-DIA Organic Waste Diversion Project
49 8/28/09

Final Report to CDPHE on RREO Grant Denver-DIA Organic Waste Diversion Project
50 8/28/09
3. Training Flyer

Final Report to CDPHE on RREO Grant Denver-DIA Organic Waste Diversion Project
51 8/28/09

Final Report to CDPHE on RREO Grant Denver-DIA Organic Waste Diversion Project
52 8/28/09
4. Training Poster

Final Report to CDPHE on RREO Grant Denver-DIA Organic Waste Diversion Project
53 8/28/09
Appendix 5 Photographs (attached as PDF files)
Residential DIA
Appendix 6 Waste Composition Study Final Report (attached as a PDF) Appendix 7 Residential Survey Summary and Data Two surveys were conducted during the organics pilot, to obtain input from the 3,270 participating households about several matters: adequacy of information at startup motivation to participate adequacy of cart size materials going into the carts seasonal and weekly vs. every-other-week use and participation variability perception of reduction of trash interest in the pilot from participant’s friends and neighbors These surveys were conducted via email notifications to participants, inviting them to answer up to 7 questions on a web-based survey (using Survey Monkey). Initiated on November 17, 2008 (“Round 1”) and on January 14, 2009 (“Round 2”), both surveys were open for three weeks. Participation was excellent:
Round 1 – 1,108 total responses (34% response rate) Round 2 – 761 total responses (23% response rate) The survey obtained many comments as well as quantifiable responses. Analysis of the data yielded the following key findings about the pilot. Participants were well informed at the pilot start-up:
o 99% of Round 1 respondents said the information received with the green cart adequately prepared them to use the service and to understand what is accepted in the cart. (This question was not asked in Round 2.)
o 14% provided useful comments such as the need to clarify accepted materials and collection scheduling, appreciation for the BioBags, etc.
Participants were motivated to participate by two primary factors: o Wanting to make less garbage o Because it was the “right thing to do” o Figure a below shows what motivated residents to choose to participate in the pilot.
Figure a – Reason for Participation in the Pilot

Final Report to CDPHE on RREO Grant Denver-DIA Organic Waste Diversion Project
54 8/28/09
What motivated you the MOST to participate in the composting collection program?
Keep up with neighbors
0.2%Simplicity of the
program4%
Right thing to do31%
Knowing that composting creates a natural fertilizer
10%
Wanted to make less garbage
39%
Knowing that composting reduces the
production of methane, a
greenhouse gas16%
o Of the 14% of respondents who provided comments, many expressed that they…
“Could have selected all of the above;” “Wanted to be part of this pilot program to help Denver;” Liked city organics collection better than backyard composting; or “To help reduce my families footprint on the planet.” Appreciated the program, using words like ‘thrilled,’ ‘awesome,’ ‘gleeful,’ and
‘wonderful;’ many said things like “I don't just like this service, I LOVE IT.” Residents were asked if the green cart was too big, too small, or just right, in both surveys.
o Satisfaction with cart size was very high, and went up slightly from November to January, as shown in Figure b.
Figure b – Perceptions About Green Cart Size
Round 1, 3.8%
Round 1, 81.2%
Round 1, 15.0% Round 2, 13.7%
Round 2, 3.2%
Round 2, 83.1%
0%
10%
20%
30%
40%
50%
60%
70%
80%
90%
Just the right size Too big Too small
o Residents who received the kitchen pails commented how much they appreciated it and
how effective it was in the kitchen. In November, Round 1 respondents reported that leaves were the majority of materials being
placed in green carts, with food scraps as the second-highest item, as shown in Figure c:

Final Report to CDPHE on RREO Grant Denver-DIA Organic Waste Diversion Project
55 8/28/09
Figure c – Residents Report of Majority of Organics Going Into Green Cart
This fall, what type of material would you say that you are MOSTLY putting in your green cart?
Leaves61%
Soiled paper4%
Food scraps28%
Branches5%
Grass clippings2%
Also in November, 99% said they planned to continue to use the green carts to set out food
scraps and soiled paper. o 11% provided thoughtful comments to this question, such as//we can cut the anecdotal
comments here and going forward, if you think this section gets too long. They could go in an Appendix. It was so inspiring to read these comments! We could consider using some quotes as callouts in the Ex. Summ or elsewhere. - AHP//: “… it’s a learning curve, and we're just starting to mine other bins in the house
(besides kitchen) for compostable stuff.” “We are saving some leaves to "layer" between food scraps”
The pilot sought to determine frequency of collection needed during different seasons. Weekly pickups were conducted until the week of December 8, when they moved to every other week. o Three-quarters of Round 1 respondents seemed to welcome fall weekly pickups, saying:
41% - in the fall, they had more each week than the cart could hold 34% - liked the weekly pickup 25% - every other week collection would have been adequate
o Nearly all Round 2 respondents, in January, found every-other-week collection adequate: 57% - once every other week was just right 41% - could have gone to once a month 2% - could have used every week collection
Overall, comments from Round 1 respondents showed fantastic enthusiasm, as well as some unintended benefits for the City: o Increased neighborliness, as residents discuss the ‘ins’ and ‘outs’ of what’s accepted, and
share as needed (“We share with our neighbors, if their bin is full they use ours and vice versa,” or letting those who didn’t get in the program put organics in a cart)
o Generous-spirited participants: “Please know that I will donate $20 to the program, keep up the good work”
o “Having the compost bin also makes me more motivated to spruce up my yard more than I might otherwise, which probably benefits the appearance of the neighborhood,” or “Instead of procrastinating on raking leaves and pruning back, we got after it!”
o Many said the green carts inspired them to start or resume backyard composting as well as curbside, further reducing trash for Denver to haul.

Final Report to CDPHE on RREO Grant Denver-DIA Organic Waste Diversion Project
56 8/28/09
Some stopped backyard composting: “In the past I have composted in my own back yard but this is a lot more convenient and does not draw mice and foxes, the cats are disappointed but they will get over it. Thanks.”
o Gratitude to Denver “Thanks for starting this program. It's nice to feel that maybe we will be part of the
solution (i.e., helping reduce our environmental damage) instead of the problem” “I really like that I can minimize my landfill garbage exponentially now.” “We are a family of 6 and we can't begin to tell you how easy you have made this for
us to do our part. We love the program and will use it all year long” o Some comments exposed problems or issues, or offered suggestions to better the program:
Each week I have had to clean out the alley to remove the stench left behind by the liquids leaking from the truck.
Squirrels are chewing through the lid (several people had trouble with this) Would like biodegradable leaf bags in the fall “so it would not be necessary to use the
green cart for leaves. We actually had too many leaves for the green cart.” “Denver should sell big paper bags for consumers to put additional lawn and fall
scraps in” for organics overflow, this would “pay for the additional pick up.” By January, participants had had time to notice changes in household trash levels. Round 2
survey respondents reported reductions in amount of trash, as shown in Figure d, below: o 22% saw a reduction in disposed trash of greater than 50% o 34% found a 30 - 50% reduction in trash o 11% saw trash reduced by up to 15% or not at all
Figure d – Perceived Reduction of Trash, by Percent of Respondents
How much do you think you have reduced your amount of trash since having the green cart?
More than a %75 reduction in
trash4%
No significant reduction in
trash1%
Up to a 15% reduction in
trash10%
15% to 30% reduction in
trash33%
50% to 75% reduction in
trash18%
30% to 50% reduction in
trash34%
Participation in the organics pilot seems to have engendered some old-fashioned
neighborhood envy. Round 1 respondents were asked if they’d gotten questions or comments from neighbors and friends; results are shown in Figure e. About three-quarters of participants’ neighbors and friends expressed interest in or asked questions about the program:
Figure e – Interest in the Program From Neighbors and Friends of Participants

Final Report to CDPHE on RREO Grant Denver-DIA Organic Waste Diversion Project
57 8/28/09
Have neighbors or friends shown interest in the composting collection program, perhaps asking you questions about the
program or expressing an interest to join?
No, neighbors, friends have not
expressed interest in the
program7%
No, I have not discussed the program with
neighbors, friends
18%
Yes, neighbors, friends have
asked questions or commented
on our participation in
composting program
33%Yes, neighbors, friends have expressed interest in
participating42%
By January, little yard debris was being generated. The Round 2 survey asked if participants
were still using the green carts: o 93.5% - putting both food scraps and soiled papers in the green carts o 2.4% - only occasionally putting food scraps and soiled paper in green cart o 1.7% - only putting food scraps in green cart o 1.2% - only putting soiled paper in green cart o 1.2% - not putting food or soiled paper in
Round 2 respondents were asked one open-ended question: “Please share with us some comments about the things that have most surprised you about participating in the composting collection pilot program.” 65% of those surveyed provided a total of nearly 500 comments. These comments were thoughtful and wide-ranging. Sample comments included: o Overall, tremendous enthusiasm and gratitude for the program. o Much pleasant surprise, especially pleased with:
The significant reduction in overall household trash Number of materials accepted (meat and bones, pizza boxes, milk cartons, dryer lint,
tissues); Surprisingly little smell problems Ease of handling the cart (several seniors mentioned this) Reduced use of garbage disposal and lessened burden on the wastewater system (“this
must be reducing water usage by the City” one astute person said) Getting a stolen cart replaced very quickly Compost envy from those in Denver and beyond who do not have this service Denver for doing this (“am really proud of our city”)
o Good problem-solving by participants: Working out where to store carts, especially for those with smaller lots Using milk cartons to put kitchen scraps in Freezing food scraps til set-out day Further reducing waste (“We are starting to buy products from the bulk section and
ones with less and/or recyclable packaging so we have even less for the landfill bin.”) o Closing the loop: many asked if they could get some of this compost for their yards

Final Report to CDPHE on RREO Grant Denver-DIA Organic Waste Diversion Project
58 8/28/09
o Bringing out the obsessive composters: “I find myself thinking about it everywhere I go. I am bringing paper cups, plates and napkins plus banana peels home from work for the bin. I even bring some co-worker’s compostable items home.” A surprising number of people mentioned this.
o Some concerns: Cart size too big or small Odor and bugs when it gets warmer In neighborhoods where residents don’t do own gardening, getting the commercial
landscaper to use the compost bin o Needing more information – where to buy biobags, specific material questions
Finally, Round 2 respondents were asked if they would like to get additional information from Denver Recycles about other diversion opportunities; 85% replied “Yes.”
Appendix 8 Grant Metrics Appendix 9. Community Leaders

APPENDICES | OCTOBER 2010
A MASTER PLAN FOR MANAGING SOLID WASTE IN THE MILE HIGH CITY
APPENDIX E
Policy Survey of Comparable Cities (April 2008)
and
Ten‐City Resurvey (November 2009)


REPORT – Task 2.d. Policy Survey of Comparable Cities April 7, 2008
Denver Solid Waste Management Plan
Page i
TABLE OF CONTENTS
Section Page
I. Introduction & Methodology 1
II. General Findings 1
III. Priority Policy Findings 5 A. Implementation of User Fees 5 B. Implementation of Yard Waste/Organics Collection 7 C. Reduction of Overages, Bulky Collections, Residential
Dumpster Collection and Illegal Dumping 8 D. Increased Voluntary Recycling 11 E. Implementation of Policy for Commercial and C&D Recycling 13
IV. Other Findings 14
V. Recommendations 16
Appendices Appendix A List of Abbreviations Appendix B Blank Survey Instrument Appendix C City Organization Charts Appendix D Example Ordinances Appendix E Tables

REPORT – Task 2.d. Policy Survey of Comparable Cities April 7, 2008
I. INTRODUCTION & METHODOLOGY
As part of its work to create the 2008/09 Solid Waste Master Plan, Denver asked its consultant, HDR Engineering, Inc. to survey comparable cities to learn about how policies and programs were implemented elsewhere, and to learn from other cities’ experiences. Denver’s chief topical areas of interest in this survey pertain to policy and program areas of great near-term interest to the Division of Solid Waste and the City’s environmental practices. These policy and program areas are:
A. User Fees B. Yard Waste Program C. Trash Overages - Bulky Collections - Illegal Dumping D. Recycling Program E. Commercial and C&D recycling
The communities which HDR interviewed were selected on the basis of comparable demographics, services and policy positions that would be the most relevant in assisting Denver to evaluate the feasibility of making policy and program changes in its current solid waste system. Ten communities were researched: Austin, Texas Milwaukee, Wisconsin Charlotte, North Carolina Salt Lake City, Utah
Chicago, Illinois Salt Lake County, Utah Houston, Texas San Diego, California
Louisville, Kentucky Thornton, Colorado
Senior solid waste/recycling staff professionals from each of these cities generously gave between one and three hours of their valuable time for these in-depth interviews (as well as responding to follow-up questions).
A survey instrument was designed to ask interviewees details about each of the five topical areas: what current services are, how the policies were put in place for those services, if changes had been recently implemented or are planned, how customers are educated about services, costs, operational details, and other measures. We also obtained general contextual information such as relevant state and local policies, departmental budgets, number of employees, and other descriptive information. Data has been analyzed using both quantitative and qualitative methods in this report.
Eight tables summarizing findings are at the end of this report (see Appendix E).
Secondary policy and program issues were also researched, including general collection approaches, delineating limits on size of multi-family units (MFUs) served, use of drop sites, service changes and privatization.
Appendix A is list of acronyms used in this report and its tables. Appendix B includes a copy of the survey instrument.
II. GENERAL FINDINGS
Tables 1, 2 and 3 summarize key background information to the policy questions at issue in this survey.
Table 1 – Background Information (population, department, number employees) Table 2 – Policy, Services, Budget Summary Table 3 – Collection Summary
Denver Solid Waste Management Plan
Page 1 of 18

REPORT – Task 2.d. Policy Survey of Comparable Cities April 7, 2008
General Statistics Since the primary focus of the survey was to provide guidance on key policy topics, population was not the principal determinant for community survey selection. Therefore, the cities surveyed have a broad range in sizes, with the cities having:
Populations ranging from 115,0000 to 2,800,000 (Thornton is the smallest city surveyed, and Chicago the largest, with Denver’s population at 580,000)
Customer bases ranging from 25,000 to 660,000 households (Denver serves 165,000 households)
Appendix C includes copies of organization charts as available from communities surveyed.
State Laws & Local Policies for Solid Waste Management Table 2 provides a program summary including overarching state or local laws and policies that impact solid waste management at the local level. It includes tip fees, for purposes of comparison, as well.
The most notable state laws in Table 2, in generally decreasing order of impact on local governments, include:
Requirement for local governments to provide residential trash collection – Utah and Texas (governments can provide directly or via contract with private sector)
Requirement for 50% waste diversion – California Bans on disposing recyclables, yard waste, white goods, universal/special
wastes in landfills – Illinois, Kentucky, Wisconsin, and California also Charlotte-Mecklenburg County, but not all of statewide North Carolina)
Mandatory alcoholic beverage container recycling – North Carolina Non-mandatory goal for reduced waste generation (North Carolina) and
encouragement of PAYT pricing (Texas)
Local ordinances that also have significant impact on community programs include: Prohibition on charging customers for trash collection – Houston (up to 90
gallons per week) and San Diego (in place since 1919) Requirement for citizens to use public solid waste service – Salt Lake City,
Louisville, Milwaukee, and Austin Mandatory yard waste diversion – Louisville Mandatory residential & commercial recycling – Mecklenburg County/Charlotte
(commercial only), Chicago, Milwaukee (residential), and San Diego; several have exemption options
Prohibition of container overages – Austin, Salt Lake City and Chicago Structure for franchising or hauler licensing (and fee collection) – Austin,
Charlotte, Chicago, Houston, Louisville and San Diego
Colorado and Denver, respectively, have none of these requirements or policies. This current lack of regulatory drivers is expected to make establishing some of the policy-driven programs that have been successfully implemented in other communities more challenging for Denver. Landfill Tip Fees (Table 2) It is worth noting that four of the ten communities surveyed pay landfill tip fees with ranges that have mid-points from $35 to $55/ton. Four other communities pay fees ranging from $23 to $26/ton. This rate is more than twice what Thornton and Denver pay ($10 to $11/ton), and likely reflects the state and local mandates and policies outside of Colorado. At least one state (Texas) has a tip fee surcharge ($1.25) that
Denver Solid Waste Management Plan
Page 2 of 18

REPORT – Task 2.d. Policy Survey of Comparable Cities April 7, 2008
generates revenues split between the state Department of Environmental Quality and local Council of Governments to cover administrative costs. General Services (Table 2) The communities surveyed have a number of common elements:
Most all serve multi-family unit dwellings (MFUs) with between two and eight units for waste collection (Charlotte serves MFUs up to 29 units by rollout cart and 30 units or greater by City-contracted bulk container service; San Diego has no limit on number of units per MFU)
All provide collection of trash and recyclables All provide collection of bulky materials except Chicago All provide collection of yard waste on some level except Thornton Half the communities contract for some level of these residential curbside
services – all rely on open-subscription for customers not serviced by the city/county (except San Diego which implements a non-exclusive franchise)
Most communities augment curbside recycling with drop-off sites to take extra materials or to serve generators without recycling service
Every community provides drop-off collection for household hazardous waste (HHW) and special/universal wastes
Most communities offer “ back door” service for the disabled and elderly (also called “back yard” and “carry out” service by some communities)
Collection (Table 3)
All communities have semi- or fully-automated trash collection – two-thirds are fully automated
Six of the programs have automated recyclables collection (Milwaukee has a split-body system to accommodate dual-stream materials); four have manual systems for recyclable collection
Of the six communities that provide regular curbside yard waste collection, two are automated and four are manual (Milwaukee and Salt Lake County also have irregular, seasonal collections)
Every community that provides bulky materials service utilizes special collection equipment
Five of the communities conduct at least of 95% of residential collection curbside instead of in alleys; five have significant alley collection (Austin, Chicago, Milwaukee and Louisville are more than half alley service)
In terms of general programs and services, Denver’s automated system with its mix of alley and curbside collection, is well bracketed by these communities.
Cost Observations In order to estimate ballpark unit costs of the solid waste systems surveyed, three estimations were made for each city surveyed below – calculated to provide Denver with a general feel for system-wide costs only. Data should be compared judiciously as each system includes different services and service areas, different levels of regulation, and different program and financing constraints. The estimates include:
(1) Annual Cost Per Household: based on the total city/county solid waste budget divided by the total of single-family units (SFUs) and MFUs served (calculation will be falsely high as budgets typically cover non-residential services which were not quantified)
(2) Annual Cost Per Ton: based on the total city/county solid waste budget divided by the total tons of trash, recyclables and yard waste managed by
Denver Solid Waste Management Plan
Page 3 of 18

REPORT – Task 2.d. Policy Survey of Comparable Cities April 7, 2008
the city/county (this will also be falsely high as tons of special waste streams are not included)
(3) Annual Tons Per Household: based on the total tons of trash, recyclables and yard waste managed divided by the total of SFUs and MFUs serviced (the numerator and denominator do not include non-quantified special wastes and non-residential customers, respectively)
Observations from this approximation include: Salt Lake City’s and Thornton’s low costs appear to be related to their lack of yard
waste management and aren’t as comparable to the other communities Austin’s and Charlotte’s low cost/household reflects a low per-customer tonnage
even with yard waste included Milwaukee’s high unit costs may be caused in part by the provision of significant
“back door” service that is extended to regular trash and recyclables customers (Milwaukee noted that its program saved $700,000/year when curbside rather than “back door” collection for garbage was instituted in 1993 for eight months per year)
High costs for Chicago, Louisville, and Milwaukee include significant additional services such as rodent control, servicing many special events, neighborhood clean-ups, street sweeping, leaf collection, multiple drop-off centers, weed abatement and dead animal collection
Chicago, Houston, and Louisville collect recyclables and yard waste collection manually, which may also lead to higher program costs
COMMUNITY ANNUAL COST
PER HOUSEHOLD1,3
ANNUAL COST PER
TON2,3
ANNUAL TONS PER HOUSEHOLD2,3
Warmest Climates4 Austin, TX $150 $140 1.1
Charlotte, NC $140 $110 1.3 Houston, TX $160 $85 1.9
Louisville, KY $240 $130 1.8 San Diego, CA $180 $110 1.6
Moderate to Cold Climates Thornton, CO $140 $85 1.6 (no yard waste program) Denver, CO $140 $90 1.6
Coldest Climates Chicago, IL $250 $110 2.2
Milwaukee, WI $200 $120 1.7 (yard waste not included) Salt Lake City,
UT $140 $80 1.8 (yard waste program starts
March 2008) Salt Lake
County, UT $160 $90 1.9
1 Excludes non-residential customers 2 Excludes HHW, special and universal wastes 3 Rounded to nearest $10 or nearest 0.1 tons; includes trash, recyclables, and yard waste
unless noted otherwise 4 Climate impacts quantity of yard waste – warmer climates have longer growing seasons
Note that Denver’s 2008 budget is $23M and is expected to manage approximately 265,000 tons (235,000 trash and 30,000 recyclables). Denver’s base services – in addition to residential trash, recyclables and bulky material collections – include graffiti control and Keep Denver Beautiful. Ancillary services include seasonal yard waste
Denver Solid Waste Management Plan
Page 4 of 18

REPORT – Task 2.d. Policy Survey of Comparable Cities April 7, 2008
programs, backyard composting education, alley cleanup and other miscellaneous cleanup activities. The City of Denver’s costs are at the low end relative to programs surveyed, and are generally consistent with those communities that do not manage yard waste (especially Salt Lake City and Thornton).
III. PRIORITY POLICY FINDINGS
A. Implementation of User Fees (Table 4)
The Denver solid waste program is paid for from the City’s General Fund and currently collects no user fees for regular services. Although the cost of services is passed on to customers through their property tax bill, there is no separate or visible line item that customers see through the course of the year that delineates solid waste costs. It should also be noted, that the largest contributions to Denver’s General Fund (which supports the city’s solid waste program) does not come from property tax revenues, but instead from sales tax revenues – a source that does not give price signals to solid waste users either. As a result, most Denver residents perceive trash (including bulky materials collection) and recycling collection as a “free” service. In an effort to generate revenues to support existing programs as well as additional services, Denver intends to explore the implementation of some level of user fees that are visible to the customer and that provide an incentive for preferred behavior (i.e., decreased waste generation and increased diversion).
Residential Programs As shown in Table 4, six of the community programs surveyed are funded by general funds, and have no user fee tied to specific solid waste services for at least the first trash cart and recycling services (most do have purchase fees for additional trash carts). Of these, both Charlotte and Milwaukee assess visible, flat fees:
Charlotte includes a flat “Solid Waste Disposal Fee” as a line item on its annual City-County property tax bill - SFUs are assessed $57/year and MFUs $39/year (approximately 70% of these fees go to the city’s general fund and the rest goes to Mecklenburg County)
Milwaukee assesses a Solid Waste Fee on its quarterly water bills of $33/quarter-SFU; MFUs up to 4 units pay $33/quarter/dwelling unit. It also serves some larger apartment buildings with dumpsters (billed quarterly)
Four cities’ programs are operated as enterprise funds and collect user fees from residential customers, using a variable rate pricing structure for trash collection:
Salt Lake City (its new rate structure is being implemented in March 2008) uses three cart sizes (40, 60- and 90-gallons) with fees linked to size
Thornton uses one 95-gallon cart size with additional fees for more carts (up to four)
Salt Lake County also uses only one 95-gallon cart, with varying fees for additional carts (no cart limit)
Austin has several monthly, per-household fees it uses for residential customers; there are comparable, slightly higher fees for small businesses in residential neighborhoods (Loveland, CO has a very similar rate structure):
(1) Base fee: $7.00 (2) Cart fees: Three sizes (30-, 60- and 90-gallons) with fees linked to size (3) Anti-Litter Fee: $2.60 anti-litter fee (pays for street sweeping, dead
animal collection, HHW facility, & code enforcement)
Denver Solid Waste Management Plan
Page 5 of 18

REPORT – Task 2.d. Policy Survey of Comparable Cities April 7, 2008
The range of per-household monthly fees for weekly collection of 90-95-gallons cart is $11 to $13.50, although rates can be as low as $4.75 (30-gallon cart, Austin) or $8.25 (40-gallon cart, Salt Lake City). These fees cover trash and recycling collection – and Austin includes yard waste management as well.
Other residential program funding sources include charges for: Additional services – such as for containers beyond base service, larger carts, or
pre-paid fees for extra bag stickers (Austin, Charlotte, Houston, Louisville, Salt Lake County, and Thornton)
Curbside yard waste – Salt Lake City and Salt Lake County Services outside customer base (Houston and Salt Lake City) Special services – such as for dead animal collection (Houston) Penalties for delinquent overage fees (Austin, Houston, and Milwaukee) Penalties for illegal dumping (Chicago, Houston, Milwaukee, and San Diego) New service – new customers pay to set up account (Austin)
Note that Salt Lake County has observed that for every $1 million increase in annual budget, its user fees need to increase by $1/household-month (this covers 80,100 SFUs and MFUs up to 3 units).
Mixed Residential & Commercial Program San Diego’s solid waste program is also generally funded, and its residents are not assessed service-specific user fees. Like many California cities, it has a complex set of funding sources for its waste/recycle operations, which demonstrates creativity in structuring a waste/recycling budget:
(1) General Fund: In 1919, the “People's Ordinance” was passed and mandated free trash collection (it was put in place by pig farmers who needed garbage to feed their pigs). This ordinance is still in place and would take a vote of the people to change it.
(2) Revenue from private sector: Two sources include a Recycling Fee paid to the city by private haulers of $7/ton, and materials recovery facility (MRF) revenue sharing (expected range from $5M to $6M in 2008).
(3) AB939 funds from state: These funds help cover costs of meeting diversion goals.
(4) At the City-owned landfill the $8/ton Refuse Collection Business Tax (RCBT) is levied on all commercial and non-residential MSW, regardless of weight (residential self-haul is charged if greater than 2 tons). The RCBT revenue goes to the General Fund for broader city operation needs (e.g., police, fire, library, streets, etc.).
(5) Hauler licensing fees: $11 to $12/ton for haulers collecting over 40,000 tpy.
San Diego is also considering a new flat recycling fee which could generate $8M/yr and thus enable the city to go to weekly collection.
Commercial Program & Other Funding Sources Commercial service fees:
Per ton fees – such as San Diego’s RCBT assessed on haulers of non-residential materials
Hauler licensing fees (Louisville and San Diego) Revenue sharing from facility operations – such as between Salt Lake City and
County, and both Milwaukee and San Diego the and processing/disposal facilities they use
Denver Solid Waste Management Plan
Page 6 of 18

REPORT – Task 2.d. Policy Survey of Comparable Cities April 7, 2008
Revenue sharing from sale of designated recyclables – such as between Charlotte and Mecklenburg County
State or other funding – such as that provided to California communities through AB939 legislation that mandates diversion
Interest income, sales of equipment, permit fees and other miscellaneous – also unclaimed deposits such as those expected from the construction and demolition (C&D) recycling program in San Diego starting summer 2008
Billing Mechanisms & Delinquency Management The four enterprise fund programs bill customers on the local utility bill, with the exception of Salt Lake County, which includes the cost of solid waste services as a separate line item on customers’ property tax bill. Milwaukee (a generally-funded program that assesses a flat fee), bills on quarterly water bills with a line item for garbage services; recycling collection is paid through the general fund levy.
To handle delinquent accounts, those that use utility billing will turn off water service and/or remove trash/recycling carts. In Salt Lake County, delinquent customers’ outstanding fees are listed in the county’s tax notice, service is stopped, and the county’s carts are removed.
Fee Changes Pursued Several of the communities have pursued changing the rate structures, but have found inadequate “political will” to:
Make user fees “visible” to customers by itemizing on property tax bills or use other billing mechanisms (Chicago, Louisville and San Diego)
Implement new flat or variable rates (Houston and Milwaukee) Franchise or contract private haulers (Chicago) Regularly and systematically increase fees to fully cover program costs
(Milwaukee initially assessed a Solid Waste Fee that only recouped about 50% of its costs but has slowly been raising rates to capture the true service costs)
Raise rates (Austin has not had a rate increase since 1997, though through the use of modest fees for various services has been effective in recouping many costs)
B. Implementation of Yard Waste/Organics Collection (Table 5)
Denver currently provides no yard waste or organic waste collection services, other than its fall leaf drop-off option, which collected about 200 tons in 2007. The US EPA estimates that combined, yard trimming and food waste comprise about 25% of all waste nationally (Municipal Solid Waste Generation, Recycling, and Disposal in the United States: Facts and Figures for 2006, EPA-530-F-07-030, November 2007). As well, recent regional data on waste composition matches this, showing compostable organic waste may comprise 24% of the waste stream overall, and at least 25.8% of the residential waste stream. This data shows yard waste alone is 6.6% of the entire waste stream and 8% of the residential stream (Larimer County Two-Season Waste Composition Study, May 2007).
Denver is considering adding yard waste and/or other compostable waste (food, compostable paper) collection to its services to meet diversion goals outlined in Greenprint Denver. Overall findings, by city, are in Table 5.
Denver Solid Waste Management Plan
Page 7 of 18

REPORT – Task 2.d. Policy Survey of Comparable Cities April 7, 2008
Yard Waste Diversion All the cities surveyed, except Thornton, have yard waste diversion programs of some sort. None are diverting food or other compostable organic waste. Cities’ annual diversion of yard waste ranges widely:
Southern, wetter cities with long growing season – from 430 lbs/household-year in Louisville to 750 lbs in Houston
Dryer, colder climates – from 50 lbs/household-year in Salt Lake County to 230 lbs in Milwaukee
These are well-established programs (all have been in place for 10-20 years), with the exception of Salt Lake City which is starting March, 2008. Most serve all residences (including multi-family dwellings) with year-round service, except in Milwaukee and Salt Lake City, which cease collection in the winter. Austin distinguishes between yard trimmings and brush – the former is picked up weekly and latter during specially scheduled brush collection days twice a year. Salt Lake County has an unusual service – it rents out its yard waste trailer to residents for $24/pull; this likely explains the low diversion as well. Operationally, most cities use rear load trucks with two- or three-person crews to collect yard waste. All have been successful in finding nearby processing options, whether private or public – and many offer mulch to residents for free.
A majority of the communities surveyed use bags or cans to collect yard waste. These may be provided by the customer or city. Chicago, also a bag-based yard waste system, is also piloting cart collection in “leafier” neighborhoods with good success. However, the city contact believes that yard waste “complicates everything and is expensive” – and, preferably, should be directed to a backyard composting program.
Note that Salt Lake City’s new yard waste program requires a minimum one-year subscription from residents. Despite restrictions, the program is already popular, with more than 10% of eligible households subscribed early in 2008.
Austin makes its green waste into the very popular “Dillo Dirt” compost product, sold in area nurseries; the compost facility operator would like to be taking more green waste from the city.
The survey respondents did not provide costs specifically broken out for yard waste services, such as cost per ton or cost per household. Perhaps because these are mature services integrated into existing waste and recycle collection, the cities have not needed to allocate distinct costing to yard waste.
Food Waste Diversion Only Chicago has seriously considered adding food waste, but budget limitations or lack of access to appropriately permitted processing facility have hindered implementation. Austin is beginning to look at food waste diversion.
C. Reduction of Overages, Bulky Collections, Residential Dumpsters and Illegal Dumping (Table 6)
Denver currently does not have a policy to limit or control overages (overflowing waste receptacles). While overages are less problematic in neighborhoods served by dumpsters for trash, these areas (as well as some public locations) suffer from illegal dumping. Denver provides bulky materials collection at each household every fifth week through its Large Item Pickup service. Denver would like to find ways to reduce costs
Denver Solid Waste Management Plan
Page 8 of 18

REPORT – Task 2.d. Policy Survey of Comparable Cities April 7, 2008
associated with overages, bulky waste pickup, and illegal dumping – without reducing overall services to residents.
Overages & Illegal Dumping As noted in Table 6, none of the communities reported currently having significant problems with overages or illegal dumping – nor are their observations consistent with Denver’s. Those with dumping problems (particularly the larger cities) have well-tested mechanisms for resolving overages and illegal dumping. Several noted that these issues occur more often in lower economic and vacant areas. Several communities rely on city agencies outside the solid waste department for handling residents that fail to comply after warnings (e.g., Charlotte’s Code Enforcement Division within its Neighborhood Development Department, Milwaukee’s Department of Neighborhood Services, the Houston Police Department’s Neighborhood Protection Division, and the Salt Lake County Health Department).
None of the communities have fees or penalties originating from the waste division for failure to comply, with the exception of Milwaukee. Residents can place neat piles outside their cart up to 4 cy in size with no fee associated; fees of $50 apply when the pile exceeds 4 cy. Milwaukee noted that it has good support for the resources needed for enforcement (staffing, back-up by courts) but that the $50 does not recoup all its costs. San Diego says “we hold the line and make people buy an additional cart” if customers keep overflowing waste.
Most have a system in place to address overages, typically consisting of a multi-tiered warning system that ultimately leads to refusal by the city or county to collect trash. Other cities (such as Charlotte) will turn offenders over to code enforcement officers who take ticketed offenders through the court system, with fees coming from the courts, not a solid waste division. Fees vary: Houston’s charges ($50-$2,000 for first violation and $250-$2,000 for second) is not atypical.
Houston and Austin both require any additional bags or overages to be labeled with a pre-paid tag or sticker – from $1-$2 each; Austin customers are charged $4 on the next bill for each bag collected without a sticker. For multi-family units that continued to have overages after repeated education and enforcement attempts, Austin put these households on dumpsters, which are serviced by a private hauler under contract with the city; it bills them to recoup all its costs.
San Diego handled 20,000 illegal dumping abatements in 2007, including weed abatement and dead animal collection. It has 3 crews and trucks (packer, flatbed, crane truck – depending on need) working on just this. Eleven code enforcement officers work full-time on illegal dumping. San Diego also reports success partnering with local non-profits (using homeless or juveniles for labor) working year-round on mini-cleanups.
Overage waste from non-city customers can result in cost and expense to a city as well. Chicago’s Streets & Sanitation crews routinely clean up loose trash in alleys, regardless of whose customer generated it. To address this cost, an ordinance requires all dumpsters to be labeled with the name and number of the contracting party right on the dumpster. Chicago actively tickets overflowing dumpsters. As well, all haulers are required to have a broom and a shovel on trucks at all times to cleanup overages. Finally, Chicago and Salt Lake City also enforce the requirement that lids must be closed on all trash containers, with notices and tickets. Chicago’s aggressive enforcement of these requirements stems from its ongoing need for citywide rodent control.
Denver Solid Waste Management Plan
Page 9 of 18

REPORT – Task 2.d. Policy Survey of Comparable Cities April 7, 2008
Austin’s Public Assembly Code Enforcement (PACE) multi-agency team addresses litter and illegal dumping associated with special events (e.g., music festivals or university move-in/move-out). The PACE team includes solid waste, EMS, fire, and police who meet and educate event organizers and participants on public safety – including litter and trash. This has reduced post-event cleanup costs and increased overall safety.
Unlike Denver, none of the communities tie illegal dumping occurrences directly to dumpster areas. Only half of the communities utilize dumpsters for city/county trash collection.
As a budget-tightening measure, Charlotte ceased litter pickup on state highways, telling the state it must bear the cost of that. Charlotte prides itself on being a clean and beautiful city; the state hasn’t provided litter pick-up at the City’s preferred service level and this remains an issue of concern.
Several solid waste directors remarked how important it is to have City Council understand the health and environmental issues associated with overflowing waste – so when citizens call and complain that their overages are not picked up, the solid waste division is supported by Council, and Council officials actually educate their constituents about waste-related responsibilities.
Residential Dumpster Collection Denver’s service where single-family units share dumpsters appears to be unique – none of the cities surveyed had a comparable service. We noted that dumpsters are not used for any residential collection excepting horse properties in rural Salt Lake County. Milwaukee will provide dumpsters to MFUs, but only with repeated problems with overages - and then the City’s contractor services the dumpsters and the City bills the MFU to recover full costs. Illegal dumping disposal of unacceptable materials in commercial dumpsters appears to be relatively easily controlled in surveyed cities through contracts or ordinances for private sector hauling (e.g., Chicago, Austin) or through issuing permits with space and fencing requirements to businesses (Houston).
Bulky Materials Collection Every community except Chicago includes some frequency of separate bulky material collection in its basic residential service (only Thornton contracts for bulky waste collection). Three provide annual curbside collection, one twice a year (Austin), one monthly (Houston) and one quarterly (Louisville). The others offer this collection on an irregular (“as needed”) schedule or with scheduled collection – Charlotte and Milwaukee take bulky items at the curb with regular waste collection (which depending on demand could amount to a weekly service). Four out of the ten surveyed communities had no quantity limits for bulky materials; Milwaukee tells residents “up to two couches worth of bulky items at a time,” and readily gets this material on its regular trash collection trucks.
Costs available from Houston and Thornton indicate that this service component constitutes 34% and approximately 10% of their annual budgets, respectively. We note that Denver expects to spend 7% of its 2008 solid waste budget on its large-item pick-up service.
Commonly excluded materials are hazardous wastes, Freon-containing units, building materials, yard wastes, and items covered by disposal bans. With the exception of programs that separate out wood waste destined for mulching or composting (Austin, Houston, Louisville, San Diego, and Salt Lake City), all materials are disposed.
Chicago discontinued bulky item pickup when its blue bag recycling program started in the early 1990s as a way to be able to afford recycling. Residents kept putting bulky
Denver Solid Waste Management Plan
Page 10 of 18

REPORT – Task 2.d. Policy Survey of Comparable Cities April 7, 2008
items in alleys – and Chicago saw a thriving cottage industry emerge of folks with pickups who simply drive around and take appliances and other large items. The city reports it can easily collect remaining bulky items on its regular routes, and does not report a problem with costs or dumping.
Louisville, San Diego and Houston’s solid waste divisions all sponsor community cleanup events on an as-requested basis. San Diego does 75 events a year and bears the cost of printing language-appropriate door-hangers but expects local contacts to promote the neighborhood cleanup. If the local contacts fail to get the word out, and residents don’t turn up with material for collection, San Diego simply won’t come back to that neighborhood again.
As well, Houston and Louisville have ongoing, staffed drop-off sites that take bulky items and junk.
Denver’s Large Item Pickup program is generally consistent with these programs, although the current collection cycle of once every five weeks is among the more frequent of those surveyed.
D. Increased Voluntary Recycling (Table 7)
Denver operates a voluntary recycling program. The program provides 65-gallon carts for weekly collection of single-stream materials and is fully automated. Approximately 45% of eligible households participated in 2006, generating an average 38 pounds per set out. Denver collected about 25,900 tons of recyclables from its residents in 2007. Denver would like to:
Increase total tons diverted through its program Maintain participation by residents who want to recycle (and who recycle at fairly
high levels) Encourage residents not currently recycling to do so Keep very low contamination rates (curbside contamination rate was only 2% as
recently as November, 2007)
Programs Table 7 provides a summary of programs surveyed. Only Chicago, Milwaukee, and San Diego have mandatory residential recycling programs, though Chicago’s and Milwaukee’s are not heavily enforced (see Appendix D for information on ordinances). Chicago’s mandate applies to MFUs with more than 4 units, but is not enforced. San Diego just passed mandatory residential recycling requirements, which are being phased in over the next two years. All other programs are voluntary, with participation varying from mid-forty percent (Houston and Thornton) to nearly 100% in Salt Lake County, where recycling carts are provided to all residents.
Six programs are single-stream and four are dual-stream (with Austin migrating to single stream by the end of 2008). Neither of the Salt Lake communities collects glass curbside, which is consistent with recycling trends in Utah and reflects the lack of local markets.
Five programs (two single- and three dual-stream) are collected weekly, and four (also evenly split) are every-other-week collection. Milwaukee’s dual-stream recyclables are collected via “back door” service roughly every 20 work days or every 28 calendar days; it is running a pilot for “set” scheduled collection (and its garbage collection schedule is only “set” from April through November). Only Salt Lake City and San Diego (25% of residents) rely on contract collection.
Denver Solid Waste Management Plan
Page 11 of 18

REPORT – Task 2.d. Policy Survey of Comparable Cities April 7, 2008
Chicago’s recycling budget ($15M) is about 9% of the Streets & Sanitation Department’s total solid waste budget, while Milwaukee allocated about 26% ($4M for yard waste and $6M for recycling) of its Sanitation Department budget to diversion programs. Denver expects to spend approximately $2.5M (11% o its 2008 budget) on recycling.
Several of the recycling programs have undertaken significant changes recently: Chicago is currently piloting single-stream, weekly cart service Milwaukee will pilot twice per month collection this summer (Setout of carts
required for those in the routes that have curb rather than alley collection.) Salt Lake City made curbside yard waste collection available to residents for an
additional fee as well as smaller trash carts for lower fees (March, 2008) Salt Lake County provided recycle carts to every resident, removed recycling fees
but increased trash fees (June, 2007) San Diego made residential and business recycling mandatory and added
recycling requirements for C&D and special event recycling (January, 2008 through 2010)
Thornton changed from dual to single-stream recycling (January, 2007) and from monthly to every other week collection (January, 2008)
Austin is just about to go citywide to single stream (by end of 2008)
All communities reported that these programs were relatively easy to implement at both the public and council/commission level (though it took San Diego many years to garner needed support from all community sectors). Salt Lake County acknowledges that delays in rolling out its program did frustrate some residents and that its outreach message wasn’t precisely on target (see Section V), but that virtually no social or political obstacles were encountered. Austin’s single-stream pilot effort was so successful, residents refused to give carts back and return to recycling bins at end of pilot; this more than convinced the city council of the value of the program.
Finally, as well as pay-as-you-throw billing for trash collection, Austin uses other price signals to encourage diversion. Customers pay a $15 fee for a larger or additional cart there is – but there is no fee to switch to a smaller cart.
Education and Outreach Educating and reaching out to citizens is vital to keeping diversion rates high and contamination low. Most communities emphasized that public education is the key to increased recycling (especially without mandates or other strong incentives) and low levels of contamination.
Effective efforts toward these ends include: Providing recycling programs in schools and educating schoolchildren yields a
measurable increase in residential diversion as children bring recycling behavior home and encourage families to participate (most cities reported this)
Miami/Dade solid waste requires senior solid waste staff to give talks on recycling and waste reduction to schools and community groups – it deepens commitment and understanding of their solid waste staff of the importance of ongoing outreach, and helps keep diversion up
Do outreach in the language people speak and use social communication channels they use (e.g., many don’t read city newspaper and can’t read flyers in English) – in Chicago’s pilot blue cart program Sanitation staff goes to neighborhood events and uses block captains who lend credibility to the program by being from the neighborhoods
Denver Solid Waste Management Plan
Page 12 of 18

REPORT – Task 2.d. Policy Survey of Comparable Cities April 7, 2008
Competition between neighborhoods for greatest recycling increase with $5,000 reward to be used for neighborhood improvement programs (Houston’s “Go Green” program)
A Milwaukee pilot program uses high school students to go door to door in lower participation area and distribute (correct language) educational materials and chat about recycling – early results show increased set-out rates, lowered contamination rates, lowered rates of empty carts, and increased diversion
Quality inspectors tagging set-outs with incorrect materials – Salt Lake County observes this has provided strong one-on-one public relations and education that’s been very effective
Being sensitive to the fact that recycling is simply not in the vocabulary of some groups and adjusting service and expectations accordingly – one large city manager observed that “For about a third of our customers, we’re just happy if they put garbage IN the can. If we gave them recycle carts, they’d be filled with water & kids using them as swimming pools, and folks would store clothes in them inside”
Back-yard composting programs which yield modest source reduction yet are popular with the interested public – Austin, Louisville, and Milwaukee
Success Rates Reported diversion rates vary from “guesstimates” to measured results and range from single digit numbers (Houston and Thornton) to 55% in San Diego (driven by state regulation). While Milwaukee’s 12% recycle diversion rate seems relatively low for a city with mandatory recycling, its monthly collection service and no enforcement of requirements are probable causes; note that it diverts another 12% via yard waste collection.
Chicago earns the highest recyclables revenues (in this survey and beyond) of $65/ton. The range of curbside contamination levels were from 5% to 10% in Salt Lake County and Salt Lake City, respectively (both are single-stream programs). Contamination in Charlotte’s and Milwaukee’s dual-stream programs ranged from 7% to 9%.
E. Implementation of Policy for Commercial and C&D Recycling (Table 8)
Waste and recycle customers not served by Denver use an open subscription system for hauling services from the private sector. There is no hauler registration, licensing or data reporting requirement. Private haulers are not required to offer recycling service to their trash customers, and non-residential customers are not required to recycle.
Denver also has no requirement to recycle construction and demolition (C&D) debris by contractors. C&D debris includes paper/cardboard, yard/land clearing debris, wood, and building materials (drywall, block/brick/stone, carpet, insulation, asphalt roofing, plastic, and miscellaneous junk). The regionally relevant May, 2007 Larimer County Two-Season Waste Composition Study estimated C&D debris to be upwards of 26% of the waste stream. The US EPA does not break out C&D materials as a separate category in its national municipal solid waste composition analyses; however, it did find that the following materials found in the C&D waste stream comprise as follows: wood - 13%, metals – 19%, and other materials – 5%.
Denver is interested in assessing the pros and cons of policies to encourage waste diversion in non-residential sectors, which would provide the City some level of control and information on these activities, as well as increase waste diversion levels.
Denver Solid Waste Management Plan
Page 13 of 18

REPORT – Task 2.d. Policy Survey of Comparable Cities April 7, 2008
Commercial and Institutional Recycling As shown in Table 8, many communities require licensing of private sector haulers (who collect primarily from non-residential areas in the communities surveyed). Both Charlotte (exclusive) and San Diego (non-exclusive) franchise some portion of their residential sector. Only San Diego and Louisville require reporting of trash or recycling data. Charlotte and San Diego require businesses to recycle.
It notable that most public trash (and some recycling) programs do serve city or county buildings (Salt Lake County buildings are required to recycle), as well as smaller facilities such as libraries, fire stations and other city departments – those that do not need compactors or dumpsters.
Austin manages a waste and recycling collection contract serving its central business district and City buildings. Thus it has some measure of control over hauler services provided to all its core downtown businesses – e.g., the hauler must provide recycling services.
Several cities provide recycling services to public schools. In some communities, such as San Diego, Charlotte and Salt Lake County, large MFUs can receive public service upon request. Austin, Charlotte, Houston, Louisville, and San Diego also provide various levels of trash service to small businesses.
Construction and Demolition Recycling Both Chicago and San Diego have C&D recycling requirements for building construction and demolition activities within city limits. Chicago’s ordinance requires reporting of quantities diverted and establishes penalties if less than 50% of construction/deconstruction materials are not recycled. It was put in place primarily for job site cleanliness and safety; while site cleanliness is enforced, the reporting requirement is not generally enforced. San Diego’s new C&D recycling ordinance requires a deposit (as high as $50,000 depending on project size) that is refundable only if the contractor can document that at least 50% of all debris generated was recycled. Milwaukee is conducting a pilot project to recycle C&D from its city building projects (or those using city funds); this data will help decide if an ordinance should be passed requiring C&D recycling on all city-owned or -funded C&D projects.
Appendix D includes a copy of the Chicago and San Diego C&D ordinances. San Diego reported that staff and citizen advocates worked for nearly 15 years to get the mandatory recycling ordinances for all sectors passed in late 2007 approved by Council and the public.
IV. OTHER FINDINGS
Our survey respondents also generously shared information on a number of issues that, while not policy priority areas for Denver, are relevant to its upcoming Solid Waste Management Plan. These topics are discussed briefly below.
Multi-Family Units (MFU) Many cities provide both recycle and waste service to MFUs. Of interest to Denver is the number of MFUs served. This survey observed that the surveyed communities’ residential trash and recycling services include:
Duplexes and vertical town homes in Thornton Up to 4 or 5 units in Austin, Chicago, Milwaukee, Salt Lake City/County and San
Diego
Denver Solid Waste Management Plan
Page 14 of 18

REPORT – Task 2.d. Policy Survey of Comparable Cities April 7, 2008
Up to eight units in Houston and Louisville Up to 29 units in Charlotte by City crews; greater than 29 units by City’s contractor No limit on MFU size in San Diego – if the property manager can place a cart in
the right-of-way, the city will service it
Drop Sites All cities reported using drop sites to collect recyclables from customers not served by regular collection, and/or to take additional materials not collected curbside. Table 7 includes full details; highlights include:
Cities have from one (Thornton) to over 40 (San Diego) All report their drop sites are popular with citizens and well used Some have a mixture of staffed and unstaffed sites (Houston and Louisville) Many of these sites also take other materials such as HHW, bulky items,
appliances, etc. Several cities augment permanent collection facilities with periodic collection
events for materials including recyclables, bulky materials, large brush, batteries/oil/paint/anti-freeze, e-waste, HHW/CESQG, and even trash
One of Houston’s drop site distributes small, used industrial and consumer items for art projects, and has a book and magazine swap area
All are free (some require proof of residency) except Louisville’s Waste Reduction Center that takes bulky items.
Service Changes (also see Increased Voluntary Recycling above). Highlights include: Thornton increased rates and added variable fees for additional carts in 2003 – at
same time it moved bulky collection from the city’s general fund to Environmental Services enterprise fund and was able to tell public that the trade of increased fees was the ability to free up $250k (2003 dollars) for parks and recreational improvements
Salt Lake City made curbside yard waste collection available to residents for an additional fee at the same time it added two smaller trash carts available for lower fees (March, 2008)
Salt Lake County provided recycle carts to every resident at the same time it removed recycling fees but increased trash fees (June, 2007)
When Chicago started its blue bag recycle program in the early 1990s, it discontinued bulky item collection, using that cost savings to pay for recycling (see Section III. C, above on bulky items)
Privatization Many cities have privatized (contracted for) various aspects of waste services to achieve cost reductions or to meet other goals. Some examples include:
Charlotte and San Diego franchise/contract 25% and 75%, respectively, of waste and recycle collection services
Louisville and Salt Lake City contract recyclables collection Thornton contracts bulky collection Austin contracts for waste and recyclables collection in its central business district Most use contract MRFs San Diego is considering contracting for collection from its drop-off centers
located in city parks
Denver Solid Waste Management Plan
Page 15 of 18

REPORT – Task 2.d. Policy Survey of Comparable Cities April 7, 2008
V. RECOMMENDATIONS
Recommendations from Communities Surveyed
We asked an open-ended question of interviewees: “What recommendations might you have for Denver?” People responded with thoughtful observations, provided here without screening or prioritization:
General Don’t be rushed into implementing changes or new programs too quickly – explore
with pilot programs and phase in new efforts Get rates right the first time; use unit-based pricing Keep exemptions to a minimum Include employees in decisions and make them accountable, Educate employees on what keeps costs down but also on what keeps customers
happy Make customer service #1 priority (even though it may conflict with operational
cost efficiencies) Do find new service to add when deleting an existing one or increasing prices
(“service exchange”) “Need public services to be better and more cost effective than private sector
services or what’s the point?” Do litter abatement program – work to get state funds to help on major roadways Use “optimized” or other incentives to maintain costs (if Charlotte’s actual costs
are under budget, up to one-third of difference is shared with employees) instead of “managed competition” which public and private sectors compete (if city wins and has costs less than budget, up to one-half difference shared with employees)
Cost Efficiencies Implement unit-based user fees that provide incentives for recycling
(recommended by all of those with enterprise funds, plus Milwaukee) Charge for everything except first recycling cart (recommended by both enterprise
and general fund programs) Make all collections semi- or fully automated Switching from same-day collection to varied routes saved money through staffing
and vehicle efficiencies (Austin) Standardize carts and collection (Chicago) Turning over fleet every three years leads to decreased down time/overtime and
increased employee morale Know exactly how much each service costs Provide incentives to employees to keep costs down (Charlotte has bonuses for
employees if efficiency goals are met) Negotiate for revenue sharing from MRFs with clear floor/ceilings on pricing Shifting from weekly to every-other-week recycle collection can decrease costs
without decreasing diversion (however, Salt Lake County argues for establishing weekly collection at the beginning of the program)
Diversion Implement/increase yard waste collection to really increase diversion Strong MRF contracts – require minimum processing metrics (residue), monthly
reporting, and access by local government for spot checks Give new customers a smaller cart to begin with along with the recycle and yard
waste carts; charge for larger carts but not for downsizing cart size
Denver Solid Waste Management Plan
Page 16 of 18

REPORT – Task 2.d. Policy Survey of Comparable Cities April 7, 2008
Have multiple drop sites for wide range of materials – staff those with more critical items (recyclables, special/universal wastes)
Have direct, well-targeted and honest public outreach/education program
Public Outreach Keep messages honest – for example, claiming that recycling is “free” is not
honest Do explain cost increases with real reasons like increased fuel Don’t begin outreach for new program too far in advance - public can become
frustrated with delay Do use relationship building and “carrot versus stick” approach (such as Salt Lake
County uses with its Quality Assurance inspectors) Include stakeholders early and often (haulers, HOAs, construction contractors,
member communities and neighborhood groups)
Sustainability Programs The six largest cities we interviewed all have sustainability programs, which have programs or other efforts at the mayor’s or comparable level within the city structure. Other cities have a sustainability focus (usually in an environmental services division, as distinct from sanitation/solid waste divisions); only one has no sustainability focus at present.
Recommendations from HDR
The following are HDR’s recommendations for continued evaluation in Denver’s Strategic Master Plan. These recommendations are based in part upon the survey results reported in this document. However, most of the cities surveyed had regulatory, policy and/or fiscal drivers not available to Denver. The survey also did not provide comprehensive information on one or two aspects of the priority policies researched. As a result, these recommendations are based on both the survey findings and our understanding of the specific needs of Denver’s SWM program. We understand that future discussions amongst SWM staff and city leadership will provide substantive input to sociopolitical feasibility of these recommendations.
Residential user fees (ideally including an incentive for diversion)
Residential curbside collection of yard waste
Increase in residential recycling – including adding drop-off sites, adding service to larger MFUs, and increasing public education
Commercial recycling – including a private hauler ordinance that generates fees and promotes recycling
Construction and demolition (C&D) debris recycling ordinance
Service controls – use fees, enforcements, changes in service levels, and other mechanisms to collect full costs associated with problems such as trash overages, bulky wastes, and overflowing dumpster trash
Specific programs and policies will be evaluated in detail in the SMWP. The evaluation will consider necessary outcomes (increased diversion/decreased disposal, decreased costs, sustained customer satisfaction, etc.), planning and implementation needs, capital costs, and annual operations/maintenance costs.
Denver Solid Waste Management Plan
Page 17 of 18

REPORT – Task 2.d. Policy Survey of Comparable Cities April 7, 2008
Denver Solid Waste Management Plan
Page 18 of 18
Appendices
A List of Acronyms
B Blank Survey Instrument
C City Organization Charts
D Example Ordinances
E Tables

REPORT – Task 2.d. Policy Survey of Comparable Cities April 7, 2008
APPENDIX A – LIST OF ACRONYMS
Al Aluminum
BOPA Batteries, oil, paint, anti-freeze (HHW/special waste collection)
CESQG Conditionally-exempt small quantity generators
C&D Construction and demolition debris
CY Cubic yards
DOC Drop-off site (drop site)
EPA Environmental Protection Agency
E-Waste Electronic waste
FTE Full-time equivalent
Gal Gallons
HDR HDR Engineering, Inc.
Hg Mercury
HH Household
HHW Household hazardous waste
HOA Homeowners association
K One thousand
LBS Pounds
LF Landfill
M One million
MFU Multi-family units
MRF Materials recovery facility
MO Month
MSW Municipal solid waste
OCC Old corrugated cardboard
ONP Old newspaper
OMG Old magazines
PAYT Pay-as-you-throw (trash unit pricing)
PB Lead
PD Police department
SFU Single-family units
SS Single-stream
SWMP Solid waste management plan
TPY Tons per year
YR Year
YW Yard waste
WK Week
Denver Solid Waste Management Plan

Appendix B - Blank Survey Instrument
I Organization Profile1 Solid Waste Programs
Overarching issues: (policy, ops context, state bans or mandates req'g local public sector SW svc.)
a City Budget = $ Million/yrb Service Providers 1 = Public 2 = Contract 3 = Franchise 4 = Private
Residential Trash Yard Waste Recyclables Bulky WasteMulti-family Trash Yard Waste Recyclables Bulky WasteInstitutional Trash Yard Waste Recyclables Bulky WasteCommercial Trash Yard Waste Recyclables
c Municipal Collection (define service limits)Multi-family # of Units Single-family # of UnitsInstitutional TypesCommercial TypesAirport ServicesSpecial events?
d Processing/DisposalTransfer StationLandfillMRFHHW Oil/AntifreezeEWasteOther
2 Tonnages Handled by City Forces (2007)Trash tpyRecyclables tpyYard Waste tpyBulky Waste tpy
3 Collection Methods R = Rear S = Side-Load F = Front-LoadCurbside Manual Automated Semi-automatedAlley Manual Automated Semi-automatedCarryout Notes on collection:
Container Sizes: ResidentialContainer Sizes: Multi-familtyContainer Sizes: Commercial
4 Private Hauler Control Mechanismsa Contracts
FranchisesOrdinancesHauler Licensing
b Service RestrictionsOther
c Is there a city code/ordinance requiring any sector to use municipal SW/Recycle/YW service?
5 About the operations:Number employees:Service restrictions? Mandates driving service?Other services? (e.g., graffiti?)Organization chart?
HDR, Inc. for Denver SWMP Project Winter 2008 page 1 of 6

Appendix B - Blank Survey Instrument
II Municipal Funding Mechanisms6 General Fund User Fees Enterprise Funda Describe how program expansions/improvements were impacted by this funding mechanism?
7 User Fee Structurea Flat Rate Customer Type
Variable Rate Container Size Customer type
b Is there a different Price structure for single vs multi-family units; commercial? (Y,N)
c Are fees adequate to cover all costs? (Y,N)
d Billing: how done? Admin. costs? (how deadbeats, delinquincies handled, etc.?)
8 How was system implemented?
a
b Public Education Methods Used
c Service Level Changes ImplementedChange ContainersService FrequencyReduced ServicesOther
d Customer ReactionsIllegal Dumping?Other
Politics addressed?
HDR, Inc. for Denver SWMP Project Winter 2008 page 2 of 6

Appendix B - Blank Survey Instrument
III Collection System Issues9 Container Overflows/Quantity Problem Areasa Container Sizes
Service SectorsExtra ContainersOther
b Overflow Handling MethodCollected Extra Fees? Fee MethodNot-Collected Warning TagCustomer Options Virtually none
c What policy changes have been considered or implemented?
10 Bulky Waste Collection Methods/Optionsa Periodic Collection Frequency
AppointmentsRoll-off/Dumpster Drop-off Locations
b Bulky Material RestrictionsQuantity RestrictionsMaterial Restrictions
c Penalties/Enforement Mechanisms
d What policy changes have been considered or implemented?
11 Multi-family Dumpters IssuesIllegal Use Solution UsedHigher Waste/HH Solution Used
12 Are waste drop sites used? Waste Recyclables Othera
HDR, Inc. for Denver SWMP Project Winter 2008 page 3 of 6

Appendix B - Blank Survey Instrument
IV Residential Recycling Policies13 Recycling Mandate Diversion Goal
LF Disposal BansEnforcement Mechanisms
14 City Residential Recycling Programa Diversion Rate = (excluding yard waste)b Commingling
Single Stream Dual Stream Dirty MRF Otherc Collection Frequency
Weekly Bi-weekly Drop-off Other
d Material ProcessingCity MRF Multi-City MRF Private MRF
Contamination Rate %15 Recycling Participation Mandatory All Sectors?
a Subscription All Residential Multi-Familyb Participation Rate % Set-out Rate %
c Methodology16 How has participation been expanded?
a Mandates Variable Rates Service Options OtherWas a waste sort conducted to assess quantities/diversion? (Y,N)
b Did the program expansion change participations rates?Impact on contamination rates?
17 How are multi-family different from single-family participation?
18 What education efforts have been most cost-effective for maximizing recycle diversion?
HDR, Inc. for Denver SWMP Project Winter 2008 page 4 of 6

Appendix B - Blank Survey Instrument
V Residential Organic Waste Policies - describe
19 Yard Waste Bans State LocalEnforcement
20 Yard Waste Programsa,b Start of Program Year-round Seasonal # weeks
c Diversion Rate =d Materials Accepted
Grass, Leaves, etc. Gardening Brush Kitchene Processing
City Multi-City Private21 Yard Waste Participation
a Subscription All Residential Multi-Familyb Participation Rate % Set-out Rate %
Methodologyc Was a waste sort conducted to assess quantities/diversion?
22 Has a food waste program been sucessful? (define success)
Processing City Multi-City Private
23 What education programs have been most cost-effective for maximizing organics diversion?
VI Institutional & Commercial Service Policies24 Service Segments
a,b Schools City Buildings Federal Buildings Other
Materials Handledc Trash Recyclables Yard Waste Other
25 Commercial Recycling Ordinances (Obtain copy) a Business Regs Mandate Data
Hauler Regs Mandate Data Licensingb Enforcement Mechanismc Program Startup
26 Were private haulers involved in developing the requirements & implementation?
27 What education/outreach strategies have been most cost-effective for maximizing C/I diversion?
28 Impact on city infrastrucure?
29 What is the level of participation?
30 C&D Recycling Requirements a Ordinanace Mandate De-minmus % Plans Req'd Data Submit
Fees Req'd? $b Enforcement Mechanismc Program Startup d Were contractors involved in developing the requirements & implementation?
e What assistance programs have been most cost-effective for maximizing C&D diversion?
f Diversion Impact =
(yes or no)
HDR, Inc. for Denver SWMP Project Winter 2008 page 5 of 6

Appendix B - Blank Survey Instrument
VI Closing Questions31 How would you rank department pro-activeness? (1-10)32 What is the single most effective action the city has taken to improve diversion?
33 What is the single most effective action the city has taken to control program costs?
34 By the way, is there a city sustainability proram? Does it address waste/diversion/etc.?
35 Any recommendations for Denver?
Any other notes of interest:
Interview Date:Persons present, titles, contact info:Interviewer:
HDR, Inc. for Denver SWMP Project Winter 2008 page 6 of 6

REPORT – Task 2.d. Policy Survey of Comparable Cities April 7, 2008
APPENDIX C – CITY ORGANIZATION CHARTS
Organization charts were provided by several of the surveyed cities:
Austin, Texas Charlotte, North Carolina Salt Lake County, Utah Thornton, Colorado
Denver Solid Waste Management Plan

REPORT – Task 2.d. Policy Survey of Comparable Cities April 7, 2008
Austin, TX Functional Organization Chart
Denver Solid Waste Management Plan
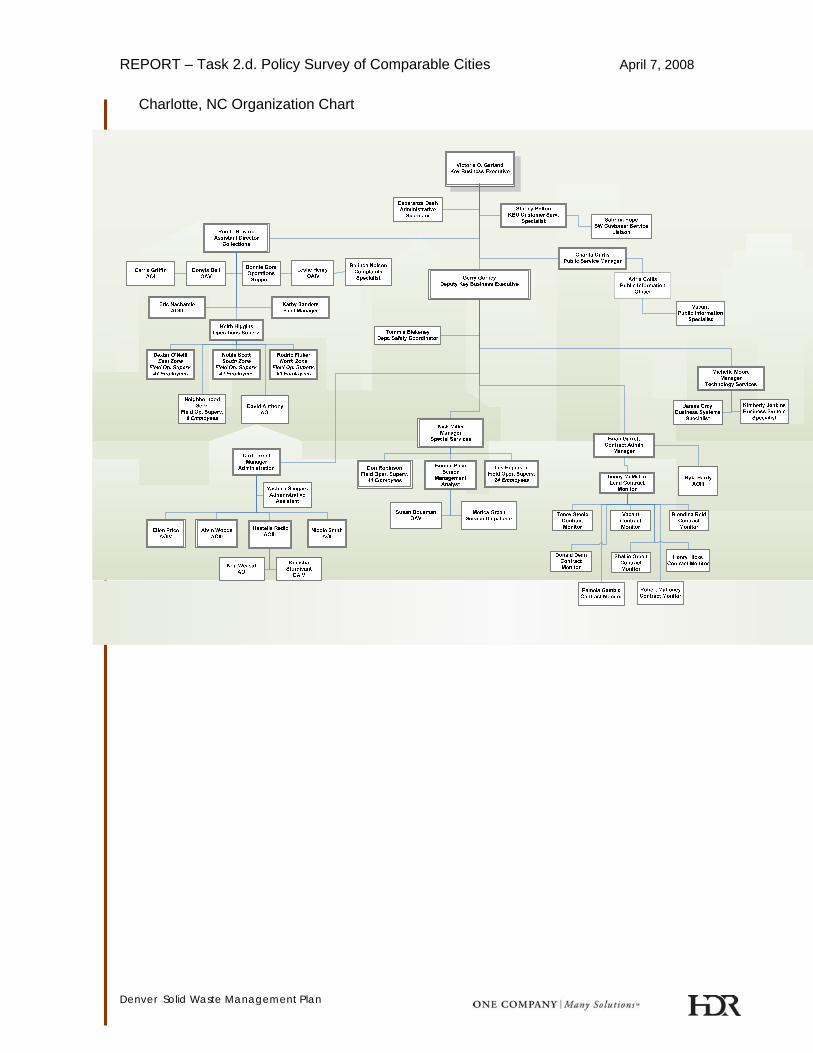
REPORT – Task 2.d. Policy Survey of Comparable Cities April 7, 2008
Charlotte, NC Organization Chart
Denver Solid Waste Management Plan

REPORT – Task 2.d. Policy Survey of Comparable Cities April 7, 2008
Salt Lake County, UT Organization Chart
Denver Solid Waste Management Plan

REPORT – Task 2.d. Policy Survey of Comparable Cities April 7, 2008
Thornton, CO Organization Chart
ENVIRONMENTAL SERVICES MANAGER (1)
ENVIRONMENTAL SERVICES SUPERVISOR (1) ENVIRONMENTAL SERVICES SUPERVISOR (1)
EQUIPMENT OPERATOR I (1) ENVIRONMENTAL SERVICES SPECIALIST (1)
EQUIPMENT OPERATOR I (1)
EQUIPMENT OPERATOR II (6)
EQUIPMENT OPERATOR II (7)
EQUIPMENT OPERATOR IVACANT (1)
FIELD MAINTENANCE WORKER II (1)
Page 1
Environmental Services – March 07, 2008
21 Employees
Denver Solid Waste Management Plan

REPORT – Task 2.d. Policy Survey of Comparable Cities April 7, 2008
APPENDIX D – EXAMPLE ORDINANCES
Chicago
Construction or demolition site waste recycling ordinance – attached.
contact HDR for a copy of Chicago’s High Density Residential & Commercial Source Reduction and Recycling Ordinance (20 pages)
Louisville – contact HDR for a copy of its solid waste ordinance (70 pages)
Milwaukee’s solid waste ordinance is online: http://cctv25.milwaukee.gov/code/volume1/ch79.pdf. The recycling subchapter begins on the 13th page of the 22-page pdf. Recycling is required for single family through 4-unit households. Recycling language: “79-31. Residences, Except Multiple-Family Dwellings. Occupants of single family residences, 2- to 4-unit residences and condominium complexes shall provide for the preparation and collection of separated standard recyclable materials in accordance with the rules of the commissioner. This ("in accordance with the rules...") means through the Department of Public Works recycling program.
San Diego
New recycling ordinance – contact HDR for a copy (20 pages) or read it online at www.sandiego.gov/environmental-services/recycling/ro
Construction or demolition site waste recycling ordinance – contact HDR for a copy (10 pages) or read it online at www.sandiego.gov/environmental-services/recycling/cdrecycling.shtml
Denver Solid Waste Management Plan

REPORT – Task 2.d. Policy Survey of Comparable Cities April 7, 2008
Denver Solid Waste Management Plan
APPENDIX E – TABLES

TABLE 1BACKGROUND INFORMATION
CITY POPULATION DEPARTMENTNUMBER OF EMPLOYEES
CONTACT
Austin, TX 710,000 Solid Waste Services 446Willie Rhodes, Director of SW [email protected]
Charlotte, NC
610,000 Solid Waste Services 290Victoria Garland, Director [email protected] 704-432-4223
Chicago, IL 2,800,00 Streets & Sanitation1,770 (entire Bureau
of Sanitation)
Jim Conlon, Asst Commissioner [email protected] 312-744-0789
Houston, TX 2,150,000 Solid Waste Management ~ 200Harry Hayes, Director [email protected] 713-837-9103
Louisville, KY
230,000 Metro Solid Waste 245Keith Hackett, Director [email protected]
Milwaukee, WI
590,000 Sanitation 467Rick Meyers, Recycling Prgm Mgr [email protected] 414-286-2334
Salt Lake City, UT
180,000 Streets & Sanitation25 full-time; 25 seasonal
David Lust [email protected] 801-535-6928
Salt Lake County, UT
1,000,000 Sanitation Services65 full-time; 25 temps
Pam Roberts, Director [email protected]
San Diego, CA
1,300,000 Environmental Services ~ 235
Stephen Grealy, Waste Reduction Program Manager [email protected]
Thornton, CO
115,000 Environmental Services 21Adam Lovato, Manager [email protected] 720-977-6310
Den SWMP Survey Rept Tables 4-7-08 final.xls Table 1 - Page 1 of 1 See Appendix A for List of Acronyms

TABLE 2 POLICY, SERVICES and BUDGET SUMMARY
CITY KEY POLICIESCUSTOMER
BASE
ANNUAL BUDGET (account-
ing)
TONS MANAGED per YEAR
LANDFILL TIP FEES
FACILITIES OWNED (exclude DOCs)
CITY'S CUSTOMER SERVICES
PRIVATE SERVICES
Austin, TX
State no LF bans (may be future ban on computers & TVs); $1.25/T surcharge at LFCity requires residents to use trash service (can use another service but must still pay city); working on a zero waste plan (over next 32 years, reduce to zero waste to LF)
177,000 customers (don't break out MFUs separately)
$27M 137k trash+ bulky;29k recycle;21k YW + brush
~$30-40/ton MRFLandfill (in closure process)
Trash, recycling, yard waste & bulky (twice/yr)
HHW, e-waste, BOPA, recyclables
Manage contract for dumpster MSW & recycle collection in central business district & special events
Charlotte, NC
State disposal bans for tires, automotive fluids, Pb-acid batteries, Hg-containing devices, free liquids, Al cans, white goods, yard waste, oyster shells; goal to reduce waste generation per capita by 1%; mandate SWMPs; requires recycling of alcoholic beverage containersMecklenburg County yard waste disposal ban & mandatory business recycling for > 15 cy OCC/wk) City allows private sector to
City crews collect 202,000 SFUs & MFUs in complexes up to 29 units, and 4,000 small businesses; City-contractor collects 97,000 MFUs in large complexes & city buildings
$42M 285K trash; 33K recyclables; 46K yard waste
$26/ton residential waste; clean wood $16.50/ton;concrete, brick & block $5/ton; C&D $35/ton
None Trash, recycling, yard waste & bulky (by appt)
HHW, recyclables
Contract for non-city customers (managed competition) in half of service area; open subscription for commercial
Chicago, IL
State disposal bans for yard waste, Pb-acid batteries, white goods, whole tires, used oil City recycling for MFUs > 4 & commercial areas (not enforced); requires all trash lids to be closed; contracting parties to be identified on all dumpsters; private haulers to
660,000 SFUs and MFUs up to 4 units; some businesses; plus school, city buildings & departments (cart service only)
$163M 1.16M trash; up to 200K recyclables; 114K yard waste
$40/ton None Trash, recycling & yard waste (no regular schedule)
HHW, e-waste, recyclables
Open subscription for all non-city customers
Houston, TX
State "encourages" PAYT; $1.25/T surcharge at LFCity prohibits fees for customers w/ < 90 gal trash/wk; HOAs can use private hauler w/ city reimbursement
460,000 SFUs & MFUs up to 8 units
$73M 860K all materials
Ranges from $26-$42/ton depending on LF used, bulky waste at $4-7/ton
None Trash, recycling, yard waste & bulky (monthly)
HHW, BOPA, e-waste & recyclables
Open subscription for all non-city customers
Den SWMP Survey Rept Tables 4-7-08 final.xls Table 2 - Page 1 of 3 See Appendix A for List of Acronyms

TABLE 2 POLICY, SERVICES and BUDGET SUMMARY
CITY KEY POLICIESCUSTOMER
BASE
ANNUAL BUDGET (account-
ing)
TONS MANAGED per YEAR
LANDFILL TIP FEES
FACILITIES OWNED (exclude DOCs)
CITY'S CUSTOMER SERVICES
PRIVATE SERVICES
Louisville, KY
State disposal bans for yard waste, tires, automotive fluids, Pb-acid batteries, Hg-containing devices, free liquids; City mandates yard waste collection for customers. Also required hauler licensing
93,000 SFUs & MFUs (Urban Service District only); small businesses with cart service only
$22M 128K trash; 21K recyclables; 20K yard waste
NA None Trash, recyclables, yard waste & bulky (quarterly)
HHW, BOPA, yard waste, e-waste & bulky
Contract recyclables collection; open subscription for all non-city customers
Milwaukee, WI
State disposal bans for Pb-acid batteries, yard waste, major appliances, oil, tires, ONP, glass/plastic/aluminum/steel containers, OCC, OMGs - also requires govts to prove local enforcement of bansCity mandates trash & recycle collection for SFUs & MFUs up to 4 units, plus condominiums
190,000 SFUs & MFUs up to 4 units; city bldgs/departments schools, libraries
$38M Trash ~ 185,000 T from 1-4 unit curbside collection. 55K recyclables
~ $45-65/ton City MRF Trash, recycling, bulky (~ weekly) & yard waste (regular schedule in fall only)
Yard waste, appliances bulky, BOPA, trash, e-waste, recyclables, scrap metal
Open subscription for all non-city customers
Salt Lake City, UT
State requires govts to provide residential trash collection & mandates school recyclingCity requires residents to use public service & close all trash lids
50,000 SFUs & MFUs up to 3 units; govt bldgs
$7M 75K trash & bulky; 14K recyclables
$23/ton Co-own LF/compost/ transfer station with Salt Lake County
Trash, recycling & bulky (annual); yard waste started March 2008
Seasonal yard waste & HHW
Contract recyclables collection; open subscription for all non-city customers
Salt Lake County, UT
State requires govts to provide residential trash collection & mandates school recycling
80,100 SFUs & MFUs up to 3 units; govt bldgs, some large MFU, schools & businesses
$13M 134K trash & bulky; 15K recyclables; 2K yard waste
$23/ton Co-own LF/compost/ transfer station with Salt Lake City
Trash, recycling & bulky (annual)
Rental trailer & seasonal yard waste; BOPA; HHW & CESQG
Open subscription for all non-city customers
Den SWMP Survey Rept Tables 4-7-08 final.xls Table 2 - Page 2 of 3 See Appendix A for List of Acronyms

TABLE 2 POLICY, SERVICES and BUDGET SUMMARY
CITY KEY POLICIESCUSTOMER
BASE
ANNUAL BUDGET (account-
ing)
TONS MANAGED per YEAR
LANDFILL TIP FEES
FACILITIES OWNED (exclude DOCs)
CITY'S CUSTOMER SERVICES
PRIVATE SERVICES
San Diego, CA
State requires SWMPs & mandates 50% diversion with penaltiesCity ordinance provides free residential service; mandates residential & commercial recycling (also requirements for C&D and special event recycling); mandates non-exclusive franchise license by private haulers for all waste
303,000 SFUs & MFUs (no limit on MFU size - carts only); small businesses cart service only
$17.8M recyc + YW$37M trash = $54.8M
380k trash; 80k recyclables; 30k yard waste
MSW - from $35 to $49/ton (res/non-res, city/non-city); clean YW free for residents and $22-25/ton from business
City LF Trash, recycling, yard waste & bulky (periodic)
Trash, recyclables; HHW, BOPA & e-waste
Franchise collection for all non-city customers (~75% of city - by weight of trash collected)
Thornton, CO
No local requirement for residents to use City services
25,000 SFUs, duplexes, vertical town houses; govt bldgs
$3.4M 37K trash & bulky; 3K recyclables
$10.34/ton includes taxes
None Trash, recycling & bulky (annual)
BOPA, recyclables & trash
Open subscription for all non-city customers; contract for bulky collections
Den SWMP Survey Rept Tables 4-7-08 final.xls Table 2 - Page 3 of 3 See Appendix A for List of Acronyms

TABLE 3COLLECTION SUMMARY
RESIDENTIAL CURBSIDETrash Recyclables Yard Waste Bulky
Austin, TX
40/60/90-gal carts; semi- automated collection (side loader)
Has been split body side loaders; when whole city goes single stream later in 2008 will be automated side loader
Automated collection (side loader)
Rear loader & trailers for bulky & clean ups
Contracted dumpster service for MFUs in problem areas, city buildings, central business district, and special events
Roughly 35% alley collection (feels alley collection best if vehicles designed correctly; recommends automated side loaders with carts if size permits)
Charlotte, NC95/96-gal carts; automated collection (side loader)
16-gal bins; manual collection (rear loader)
Manual (rear loader) - bags
Manual (rear loader) collection
Rear loader collection for backyard service to disabled/elderly
New communities being built requiring alley collection
Chicago, IL
95-gal carts; semi-automated (rear loader with tipper)
Bags collected in trash vehicles, sorted at dirty MRF (except for current cart pilot - side loaders)
Manual (rear loader) - sorted at dirty MRF
Manual (rear loader) (no set collection)
Cart service only; have split-body for co-collecting trash & recyclables at events
Nearly all alley collection
Houston, TX40/60/90-gal carts; automated collection (side loader)
18-gal bins; manual collection (rear loader)
Plastic bags; manual (rear loader)
60-cy trailers & bucket loader
Contracted collection - dumpster service for MFUs
1% alley collections (city req'ts for physical limitations)
Louisville, KY
95-gal carts; semi-automated (rear loader with tipper)
18-gal bins; manual collection (rear loader) - MFUs > 8 units can have 90-gallon cart service upon request
Customer bags or cans; manual (rear loader)
Collected with regular trash
95-gal carts for business yard waste
Majority alley collection (have short-axle trucks for tight areas)
Milwaukee, WI
95-gal carts; semi-automated (rear loader with tipper) - customer can also select dumpster service
95-gal split carts (semi-automated rear loader with tipper) - some neighborhoods still have 18-gal bins (manual)
Rear loader for unscheduled yard waste collection
Collected with regular trash, unless over 4 cy, in which case a skid crew is sent.
MFU & commercial dumpsters are responsibility of property owner
57% alley collection; union workers cannot work if temp < 10 degrees Fahrenheit at 6 am; curbside customers get "carryout" service in winter
Salt Lake City, UT
40/60/90-gal carts; automated collection (side loader)
Contracted collection - 60-gal carts; automated collection (side loader)
Starting March 2008 - 90-gal carts; automated collection (side loader)
Rear loader & trailers for bulky & clean ups
90-gal cart or 300-gal dumpsters for city bldg trash
5% alley collection
Salt Lake County, UT
95-gal carts; automated collection (side loader)
65-gal carts; automated collection (side loader)
Via trailer rental by residents only (5-wheel trailers)
Rear-load collection; also roll-offs & 6-wheel trucks
Rear-load collection for overages, cardboard box collection (new homeowners)
1% alley collection (mostly commercial)
CITY OTHERCOMMENTS:
Alley v. Curbside
Den SWMP Survey Rept Tables 4-7-08 final.xls Table 3 - Page 1 of 2 See Appendix A for List of Acronyms

TABLE 3COLLECTION SUMMARY
RESIDENTIAL CURBSIDETrash Recyclables Yard Waste Bulky
CITY OTHERCOMMENTS:
Alley v. Curbside
San Diego, CA
96-gal carts; automated ("mini" side loader)
Automated (side loader) collection for single-stream from carts; front loaders for dumpster collection
32/45-gal carts; mostly manual (rear loader) - 3 communities automated
Flat bed crane & rear loader
96-gal carts; automated (side loader)
Nearly all alley collection
Thornton, CO95-gal carts; automated collection (side loader)
95-gal carts; automated collection (side loader)
NA Lightening loader with grapple
DOC - rear loader with cart tipper (wench box)
Less than 5% alley collection (side loader)
Den SWMP Survey Rept Tables 4-7-08 final.xls Table 3 - Page 2 of 2 See Appendix A for List of Acronyms

TABLE 4 FUNDING SUMMARY
USER FEES (trash)
Residential (per HH-mo)
Other Fees
Austin, TX
Enterprise Base fee $7; 30/60/90-gal cart - $4.75/$7.50/$10.25 per hh-mo; anti-litter fee $2.60
$2 extra garbage sticker OR charged $4 per bag if no sticker; new service fee = $15 to start
One-time $15 fee to bet bigger or extra cart but no fee if getting smaller car; fee waived if within 60 days of starting service
On monthly city-owned utility bills (also bills for electric & water)
Utility Dept. has cost recovery procedure
Charlotte, NC
General No user fees (until 2nd trash cart, a one-time purchase)
Annual Solid Waste Disposal Fee (line item on property tax bill) of $57/yr SFU ($45 to city), $39 MFU ($27 to city)
$44.86 purchase price for 2nd 95-gal residential cart (no monthly fee); planned revenue share from Mecklenburg County facilities to support single stream recycling ($1M/yr)
Property tax bill (no separate line item)
NA
Chicago, ILGeneral No user fees No No charge for extra carts Property tax bill
(no separate line item)
NA
Houston, TXGeneral No user fees (until > 90
gallons trash)$13.50/mo for non-residential customers
$7.50/HH/mo for trash carts after 1st 90-gal (2 cart limit); overflows ($1/extra container); $25 dead animal collection
NA NA
Louisville, KY
General No user fees (until 2nd trash cart, a one-time purchase)
No $65/hh-yr for 2nd 95-gal cart of $60 for add'l 65-gallon cart; fees for bulky materials collected at drop site (first 2 visits free)
Property tax bill (no separate line item)
NA
Milwaukee, WI
General No user fees up to 4-units; city serves some MFUs >4 units with dumpsters, which it bills at cost quarterly
Flat fee on quarterly water bill: $33/dwelling unit (e.g., SFU=$33, duplex=$66 per quarter. Adjusted annually - based on 96-gal service/unit with up to 4-CY overage)
Overages that exceed 4 cy charged $50; No charge for extra carts
Water bill Unpaid charges are added on to the property tax bill
Salt Lake City, UT
Enterprise 40/60/90-gal trash cart - $8.25/$9.25/$11.25 per hh-mo
$3.50/hh-mo for voluntary yard waste; cart replacement/delivery fees; $3.75/hh-mo non-customer recycling fee
Utility bill Water turned off & remove carts
Salt Lake County, UT
Enterprise 1st 95-gal trash cart - $1/hh-mth; add'l 95-gal carts - add'l $15 (no limit)
Trash service from $40/mo (4 CY once/wk) to $410 (8cy five times/wk); all recycling dumpster service available ($30 to $140/mo)
Trailer rentals ($25/$80 per pull for yard waste/bulky); interest income; sales of equipment
Property tax bill as separate line item
Tax notice; stop service & remove carts
DELINQUENT ACCOUNTS
CITYACCOUNT-
INGOTHER FUNDING SOURCES
BILLING MECHANISM
Den SWMP Survey Rept Tables 4-7-08 final.xls Table 4 - Page 1 of 2 See Appendix A for List of Acronyms

TABLE 4 FUNDING SUMMARY
USER FEES (trash)
Residential (per HH-mo)
Other Fees
DELINQUENT ACCOUNTS
CITYACCOUNT-
INGOTHER FUNDING SOURCES
BILLING MECHANISM
San Diego, CA
General Fund No user fees up to 4 or 5 units for city-served residences
Refuse Collector Business Tax ($8/ton) assessed at landfill on non-residential loads - supports non-solid waste services.
Recycling fees ($7/ton) paid by private haulers; franchise/hauler fee of $11-$12/ton if > 40K tpy (goes to general fund); MRF revenue sharing ($5-6M in 2008); state funding (AB939 funds); permit fees; C&D recycling deposits
NA NA
Thornton, CO
Enterprise 1st 95-gal trash cart - $13.50/hh-mo; add'l 95-gal cart - add'l $9.20 (max of 4 carts)
NA NA Utility bill Water turned off; $30 service & full pymt to turn back on
Den SWMP Survey Rept Tables 4-7-08 final.xls Table 4 - Page 2 of 2 See Appendix A for List of Acronyms

TABLE 5YARD WASTE SUMMARY
CITY
HAS PROGRAM? FREQUENCY of SERVICE
WHEN STARTED
SERVES?
DIVERTED per
Household-YR
(pounds)
MATERIALS ACCEPTED
TRUCKS USED;
PROCESSING
ADD FOOD
WASTE?COMMENTS
Austin, TX
YesWeekly curbside collectionYear-round (brush collected twice/yr)
Over 20 years ago
All residential
240 Grass, leaves, garden, waste, brush (size reduced); bag in up to 50 lb. bundles
YW in side loaders; brush in rear loader with skids
Beginning to think about it
Compostable material is made into the popular "Dillo Dirt" sold widely at nurseries etc in area; compost ops wants more green waste
Charlotte, NC
YesWeekly curbside collectionYear-round
Over 20 years ago
Single family houses; MFU less than 30 units
470 Grass, leaves, garden, waste, brush (size reduced)
City collects using manual rear loader; Mecklenburg County processes
No plans County landfill bans yard waste
Chicago, IL
YesWeekly collectionYear-round
Early 1990s
All residential
350 Grass, leaves, garden, waste, brush (size reduced)
Rear-load collection w/ MSW; sorted at dirty MRF and directed to compost facility
Might take food but no permitted facilities nearby
State LF ban on YW; having success in small pilot giving "leafier" neighborhoods a black trash cart with Yard Waste sticker; promotion of backyard composting
Houston, TX
YesWeekly collectionYear round
1993 All residential
750 Grass, leaves, garden, waste, brush (size reduced); bag in up to 50 lb. bundles
Manual, rear loader; private processor
No plans High diversion due to nearly year-round growth; may do yard waste ban in future
Louisville, KY
YesWeekly (same day as recycle)Year-round
Early 1990s
All residential
430 Grass, leaves, brush, Christmas trees, straw, pine needles, wood ash, sawdust.
Rear-load collection
No plans State landfill ban for yard waste. Mandatory YW collection; backyard composting has been successful - some Council members have taken leadership on this; also offer "lawn Care Rebate" program promoting old mower trade-in with regional air pollution & schools - includes leaving grass on lawn
Den SWMP Survey Rept Tables 4-7-08 final.xls Table 5 - Page 1 of 2 See Appendix A for List of Acronyms

TABLE 5YARD WASTE SUMMARY
CITY
HAS PROGRAM? FREQUENCY of SERVICE
WHEN STARTED
SERVES?
DIVERTED per
Household-YR
(pounds)
MATERIALS ACCEPTED
TRUCKS USED;
PROCESSING
ADD FOOD
WASTE?COMMENTS
Milwaukee, WI
Yes; brush only Mar-Nov. resi-dents call for pickup & city sets up routes based on requests (no winter service)
Early 1990s
All residential
230 Mar-Nov - brush only. During Oct-Nov leaf collection, also take garden debris w/ leavesraked to the street.
Rear-load collection skid crew; Tipped at TS before haul to nearby compost facility
Would like to but not enough funds
State landfill ban for yard waste; if resident puts yard waste in cart, crews leave whole cart uncollected and tag for resident to remove; extensive waste reduction education (in cooperation w/ statewide effort) for leaving grass on lawn, backyard composting
Salt Lake City, UT
Program just started (March - November)
March 2008
Residential (10% households signed up
Too early for data
Grass, leaves, garden, waste, brush (size reduced)
Compost facility at city/county LF
Not done. Residents will pay $3.50/hh-mo over entire year; have provided Christmas tree collection previously
Salt Lake County, UT
Residents can rent YW trailer at $24/pull
1998 All county residents
50 Grass, leaves, garden, waste, brush (size reduced)
Compost facility at city/county LF
Not done Low diversion rate partly due to very dry climate
San Diego, CA
Yes; weekly collection (year-round)
1987 All residential
320 Grass, leaves, garden, waste, brush (up to 40 lbs & size reduced)
Side-load collection; processed at city-owned facility "the Greenery" at LF
No plans Did waste comp study; acceptable YW includes plywood and particle board, invasive plants, clean lumber (no nails); do not accept other plans, sawdust or ashes, tree stumps > 4’, or any one piece > 6” in diameter, shingles, chemically treated or painted wood; bags (plastic or paper), C&D debris, pet waste & other materials
Thornton, CO
No NA NA NA NA NA NA May evaluate in 2008
Den SWMP Survey Rept Tables 4-7-08 final.xls Table 5 - Page 2 of 2 See Appendix A for List of Acronyms

TABLE 6OVERAGES, BULKY and ILLEGAL DUMPING SUMMARY
OVERAGES BULKY MATERIALS
Violations Issues Current Collection Issues
Austin, TX
1st - educate re diverting more; next must buy larger cart
Previously had similar problems as Denver - no education message worked; no issues now
Twice/yr; ~ 36 FTEs required
Purposely don't advertise bulky collection dates to avoid scavenging; instead send postcard 3-4 wks ahead & flyer 1 wk ahead
Use dumpsters in chronic MFU overflow areas (city has contract hauler) & charges to cover all costs (~ 1,100 dumpster customers); education in English & Spanish
Violators ticketed; Litter Abatement Dept provides street cleaning, litter control, brush/bulk collection & Keep Austin Beautiful (~100 FTE & $8M budget)
Charlotte, NC
1st & 2nd time - warning; 3rd time no collection & turn over to Code Enforcement
Biggest issue in lower economic areas
Scheduled collection by citizen ("as needed") - plus drop site collection
All materials except hazardous, C&D materials (no quantity limit)
None by city City ceased litter clean up on state highways to reduce costs.
Chicago, IL
Not specifically addressed for residential (crews "just do it"); ticket dumpster overages (commercial)
Yes - but don't quantify Not a separate collection program (customers put in alleys & drivers pick up as time/room allow) - plus drop site collection
Not significant problem None by city NA
Houston, TX
$1 tag req'd for all overflows; not collected if not tagged
Created Neighborhood Protection Division in Houston Police Dept to ticket offenders (both overflow & bulky materials)
Monthly residential plus drop site collection (34% of SWMD budget - approx $28M/yr) - plus drop site collection
All materials except hazardous & Freon-containing units; residents asked to separate out wood waste; max 8 cy per pick-up total & max 4 cy bldg materials
Used for community clean-up & commercial trash (permit req'd)
Problem mostly limited to vacant & low economic areas (PD's Neighborhood Protection Division) investigates & tickets offenders
Louisville, KY
NA No significant problem except over Christmas & during Kentucky Derby
Quarterly collection - plus drop site collection
No quantity or material limit None by city Problem in alleys; city does all clean up
Milwaukee, WI
Warning tags & $50 fee for > 4 cy (use Sanitation inspectors)
Not significant problem Customers place at alley or curb. If over 4 CY, then scheduled for skid crew to pick up (& $50 fee). Plus drop site collection
Size limits on tree limbs; They tell customers to visualize "2 couches worth of 'stuff'" for th 4 CY limit and that is limit on quantity.
None by city.Will issue 20 cy roll-off containers for neighborhood cleanups for about 7 months of yr.
Not significant problem
DUMPSTERS ILLEGAL DUMPINGCITY
Den SWMP Survey Rept Tables 4-7-08 final.xls Table 6 - Page 1 of 2 See Appendix A for List of Acronyms

TABLE 6OVERAGES, BULKY and ILLEGAL DUMPING SUMMARY
OVERAGES BULKY MATERIALS
Violations Issues Current Collection IssuesDUMPSTERS ILLEGAL DUMPINGCITY
Salt Lake City, UT
1st time - warning; 2nd time no collection (no fees)
Not significant problem Once/yr residential; residents pile materials street-side
All materials except hazardous, rock, dirt, concrete, bldg materials; residents asked to separate out wood waste (no quantity limit)
Used for city bldg trash only
Not significant problem
Salt Lake County, UT
Residents encouraged to purchase add'l trash (fee) or recycling (free) carts
Not significant problem Once/yr residential; large trailers & roll-offs placed in neighborhoods
All materials except hazardous (no limit except 2 tons on small trailers)
Used for homes with stables, commercial, schools, govt bldgs
Issue managed by County Health Dept - not significant per Sanitation Dept
San Diego, CA
Don't collect; encourage residents to but add'l cart
Not significant problem Periodic/requested city clean-up by community (~ 125 per year)
All materials except hazardous, green waste & materials with state disposal bans (e-waste, appliances, motor oil)
None by city Have rec'd as many as 20K trash dumping incident reports (includes weed abatement)
Thornton, CO
2nd time courtesy notice; 3rd time no collection & supervisor contacts resident (no fees)
Not significant problem Private contractor collection (cost ~ $250k) - once/yr residential collection; add'l collection by appointment
All materials except hazardous & Freon-containing units (no quantity limit)
NA Not significant problem
Den SWMP Survey Rept Tables 4-7-08 final.xls Table 6 - Page 2 of 2 See Appendix A for List of Acronyms

TABLE 7RESIDENTIAL RECYCLING SUMMARY
CITYBANS OR
MANDATES
CURRENT CURBSIDE PROGRAM
RECENT CHANGES
RECYCLING DIVERSION
(by weight)
PUBLIC EDUCATION RECYCLE DROP SITES OTHER
Austin,TX
No; voluntary residential participation
Source-separated bins and bags weekly; going to single-stream carts by end of 2008
Planned move to single-stream in 2008
28% (includes yard waste, which is slightly less than half of diversion)
In schools starting in 3rd grade and go all the way up to math classes at the University of Texas
2 (north & downtown) run by Ecology Action; in south there is drop site at LF for recyclables & other items
Single-stream pilot was so successful residents refused to give carts back & return to bins at end of pilot
Charlotte, NC
No; voluntary residential participation
Dual-stream (bins) every week; hauled by city (75%) & contractors (25%) to county MRF
Planned move to single-stream recycling in FY2010
10-12% diversion. 45% average set out rate (MFU 25% lower than SFU)
County SWMP & City public education focused on SFU & MFU recycling; also school program
Provided by Mecklenburg County but city residents use; have 40 sites - 4 full-service, 9 self-service; 27 business locations (OCC & paper)
If move to single-stream, county MRF ok's <10% contamination but City must cost share contamination > 10%
Chicago,IL
Mandatory recycling for MFUs > 4 units & other commercial generators (not enforced)
Single-stream (bag excepting pilot areas) weekly; hauled by city to contract dirty MRF (also takes yard waste)
On-going pilot study to switch to carts
8% bag program; 18% in cart pilot areas
Strong for current pilot - flyers, letters, libraries, schools, brochures, magnets, block captains
20 drop sites; very popular as many residents live in high-rises and don't get recycling services
MFU recycling requirement is not enforced
Houston, TX
No; voluntary residential participation
Dual-stream (bins) collected every other week; hauled by city to contract MRF (includes used oil in separate container)
No 2-10% diversion (conflicting data); 43% of residents in service area participate
Dedicated outreach staff, "Go Green" neighborhood competition to increase recycling, good website
4 neighborhood depositories (soon to be six - half are staffed); 3 Consumer Recycling Centers
Louisville, KY
No; 25% recycling & 20% yard waste diversion goals (not actively pursued)
Single-stream (18-gal bins for SFU) collected weekly; hauled by contractor to contract MRF
No 22% (hauler contract based on 85% participation by eligible residents)
"Green City" schools, OP recycling program for businesses, strong business outreach/ technical assistance
5 staffed drop site & 12 unstaffed (located at regional firehouses, other public buildings; also has Metro Waste Reduction Center for junk
Den SWMP Survey Rept Tables 4-7-08 final.xls Table 7 - Page 1 of 3 See Appendix A for List of Acronyms

TABLE 7RESIDENTIAL RECYCLING SUMMARY
CITYBANS OR
MANDATES
CURRENT CURBSIDE PROGRAM
RECENT CHANGES
RECYCLING DIVERSION
(by weight)
PUBLIC EDUCATION RECYCLE DROP SITES OTHER
Milwaukee, WI
Mandatory recycling for SFUs & MFUs up to 4 units (not strictly enforced); ONP, OCC, OMG & all containers are banned from disposal
Dual-stream (95-gal split carts) collected monthly but schedule is not regular; hauled by city to city MRF
On-going pilot to switch to twice/month curbside collection
12-13% (yard waste diversion 11-12%)
Door-to door, use students, packets, focus on high contamination areas, give MRF tours; Sanitation newsletter sent each fall to all 190,000 HH prior to start of leaf collection
2 "Self-Help Centers" take recycle plus YW, metals, auto wastes, C&D (only recycle concrete), appliances, e-scrap; wood chips given out to public there. HHW only at one site (run by Milwk. Metro Sewerage Dist., not City)
"Back door" service. Crews collect monthly in summer & as time permits in winter - from snow plowing duties
San Diego, CA
State reqt for 50% diversion, LF bans on appliances, certain metals, HHW, all batteries, & e-waste; new city ordinances require residential, commercial;& C&D recycling with recycling reqts for special events
Single-stream collected every other week; hauled by city/franchise hauler to private MRF (includes aerosol cans)
Mandatory residential & commercial recycling; recycling reqts for C&D and special event
55% diversion Program is brand new - just implementing new public education (don't know effectiveness yet)
44 parks in City have drop sites; city shares revenue from this particular recycle stream back to Parks & Rec based on participation (which gets their buy-in on maintaining the drop sites)
Mandatory residential & commercial recycling to be phased in over next 2 yrs, by # of units per dwelling; exemptions for MFUs, commercial, & mixed use with < 6 CY trash; city is considering managed competition for drop sites
Salt Lake City, UT
No; voluntary residential participation (approximately 82% of residents have carts)
Single-stream collected weekly; hauled by contractor to contract MRF (excludes glass)
Add yard waste curbside collection & variable trash cart sizes/rates in March 2008
Approx 18% diversion (estimated by hauler)
Hauler req'd to do public education by contract
Yes - for glass (not collected curbside) + other recyclables
10% curbside contamination (plus 26% of recyclables contaminated by trash); city helps contract hauler reduce curbside contamination
Salt Lake County, UT
Mandatory school & govt building recycling; voluntary residential participation (97% of residents have carts);
Single-stream collected every other week; hauled by county to 2 contract MRFs (excludes glass)
Provided carts to all customers, removed recycling fee & increased trash fee in June w007
11% diversion Two full-time quality assurance inspectors monitor contamination & interact directly with residents (carrot v stick approach)
Drop sites in neighborhoods, with seasonal drop sites used for leaves, Xmas trees; drop sites take glass (not taken curbside)
5% curbside contamination; public wants weekly recycling
Den SWMP Survey Rept Tables 4-7-08 final.xls Table 7 - Page 2 of 3 See Appendix A for List of Acronyms

TABLE 7RESIDENTIAL RECYCLING SUMMARY
CITYBANS OR
MANDATES
CURRENT CURBSIDE PROGRAM
RECENT CHANGES
RECYCLING DIVERSION
(by weight)
PUBLIC EDUCATION RECYCLE DROP SITES OTHER
Thornton, CO
No; voluntary residential participation
Single-stream collected every other week; hauled by city to private MRF
Was dual-stream collected monthly until Jan 2007; then single-stream monthly until Jan '08
9% diversion; 45% average weekly set out rate (ranges from 15-70%)
Has education line item in budget ($20k) for first time in 2008; have good website, annual mailing
Drop site at Recreation Center takes auto waste (Pb-acid batteries, oil, antifreeze, tires) & SS recyclables (serves MFUs that don't have city service); for residential only
Feel "ardent recyclers" participate at high level with minimal contamination (per MRF)
Den SWMP Survey Rept Tables 4-7-08 final.xls Table 7 - Page 3 of 3 See Appendix A for List of Acronyms

TABLE 8COMMERCIAL AND CONSTRUCTION/DEMOLITION DEBRIS RECYCLING
COMMERCIAL RECYCLING C&D RECYCLING
City AccountsOrdinances for Public
HaulersComments
Ordinance for C&D Contractors
Comments
Austin,TX
Only collects from small businesses in residential neighborhoods; manages dumpster contract serving all downtown biz district, city bldgs, & some MFUs
No ordinance but haulers pay fees; these fees cover waste reduction assistance program
Has strong program for commercial waste reduction assistance
No Interested in this; SWS manages Code Enforcement and plans to use this division to encourage C&D recycling
Charlotte, NC
City buildings (MFUs < 30 units) Mecklenburg County requires larger businesses generating > 15cy OCC/wk to recycle
NA No City will pick up only tenant setout C&D as part of bulky program (not recycled)
Chicago, IL
Only cart service - city bldgs/department, airports, MFUs up 4 units
Hauler licensing; mandatory recycling for MFUs > 4 units & other commercial
Req'ts of ordinance were not strict & was never enforced. Under consideration for change
Yes Done by permit (small sites exempt), penalty if <50% materials not recycled (not enforced), generally supported by builders but space issues
Houston,TX
MFUs up to 8 units Franchise fee for haulers operating within city limits
Commercial dumpsters must be permitted by city
No City will pick up bldg materials as part of bulky program (not recycled)
Louisville, KY
Cart service only - small businesses
Hauler licensing ($100/yr plus $10/truck); require private solid waste facilities to be licensed & submit quarterly reports
Strong business outreach/technical assistance program
No
Milwaukee, WI
City bldgs/departments, libraries & MFUs up to 4 units
No Outreach is weak Pilot for recycling at city bldg projects at present
Ordinance requiring C&D recycling at city projects under consideration; infrastructure for C&D recycling is not developed yet
Salt Lake City, UT
City buildings, any MFU & commercial (can only provide trash to MFUs up to 3-plex)
No NA No NA
CITY
Den SWMP Survey Rept Tables 4-7-08 final.xls Table 8 - Page 1 of 2 See Appendix A for List of Acronyms

TABLE 8COMMERCIAL AND CONSTRUCTION/DEMOLITION DEBRIS RECYCLING
Salt Lake County, UT
County buildings, can also service commercial/school/large MFUs if requested
No NA No Private C&D LF located adjacent to city/county LF with lower tip fees & some processing
San Diego, CA
MFUs up to 29 units, large MFUs not franchised
Mandatory business/MFU recycling; franchise/hauler licensing ($11-12/ton) for haulers with > 40K tpy
Mandatory recycling ordinance new in 2008
Yes (beginning July 2008); surcharge at LF for C&D fees
Builders must put deposit ($200-$50,000) down when getting bldg permit & must recycle 50% of waste; also reporting requirements
Thornton, CO
City buildings (working to expand to schools & libraries)
No NA No NA
Den SWMP Survey Rept Tables 4-7-08 final.xls Table 8 - Page 2 of 2 See Appendix A for List of Acronyms

RE-SURVEY FINDINGS - DENVER SWMP
AUSTIN, TX 783,000 pop
SA=177,267
hhs/2,160
commercial
CHARLOTTE, NC700,000 pop
SA=240,000 hhs
CHICAGO, IL 2.8M pop
SA=600,000 HHs
HOUSTON, TX 2.2M pop
SA=360,000 hhs
LOUISVILLE, KY230k city pop SA=700,000
hhs (metro area)
SA = 93,000 HHs
(all data from 2008 survey)
MILWAUKEE, WIpop 604,407 (08)
SA=190,000 hhs
SALT LAKE CITY, UT 180,000 pop
SA=45,000 hhs
SALT LAKE
COUNTY, UT 1M pop
SA=80,000 hhs
incl 4 cities
SAN DIEGO, CA1.3M pop
SA=304,000 hhs T,
280,000 hhs R, 191,000
hhs O
THORNTON, CO 120,000 pop
SA=25,134 hhs
Mandates
City requires
MF>100 &
businesses>100
employees to
recycled 2-4
materials;
working on
YW/FW
disposal ban
State disposal ban on YW,
plastic & aluminum
containers; state requires
bars/restaurants to recycle
alcohol bottles; county
mandates businesses>15 cy
OCC/week to recycle
State YW, other disposal
bans
State YW disposal ban; city
requires customers to divert
YW
State disposal ban on YW, ONP, OCC,
OMG, containers, etc.
State mandate for
school recycling; city
considering mandatory
diversion of recyclables
& organics for all
customers
State mandate
for school
recycling
State mandates 50%
diversion at city level;
city mandates recycling
for residential &
commercial customers
Service Area
Residential (SF,
MF<5), some
commercial -
T,R,B,O
Residential (SF, MF<5) - T, R,
O
Residential (SF, MF<4) -
T,R,B,O
Residential (SF, MF<9) -
T,R,B,OResidential (SF, MF<4) - T,
R, B, O Residential (SF, MF<4) - T,R,B, Leaves
Residential - (SF, MF< 4)
- T, R, B, O
Residential (SF,
MF<4) - T,R, B
Residential (SF, MFs incl
some high-rises)
Residential (SF, duplex,
some townhomes) - T,
R, B
Landfill Tons
2007/2008-09
05 - 121k tons
06 - 132k; 07 -
139k; 08 -
144k; 09 154k
est
Down 1.5% over past two
yrs; pop growing too Been dropping since 06
Down 5.5% 07/08; down
2% 08/09 na Down 5.4% since '06
Down 4% each of last 2
yrs
Down 2-3%/yr
since 07
Down 2.7 - 3.4%/yr since
06
Dropped 8% 07/08; 2%
08/09 (projected)
Trends/ ReasonsRecession; possibly
reductions in packaging
Increased recyclables routes;
recession na Recession Recession
New SS,
recession
Economy; new C&D
ordinance/facility;
mandatory commercial
MF recycling Recession
Recycling
Program/
Frequency
Transitioned
from DS wkly to
SS EOW 10/08
DS wkly - transitioning to SS
wkly 7/2010
Blue bag program -
transitioning to SS carts (35%
of routes have SS now) DS/SS EOW SS wkly
SS monthly (small part of city wkly DS
bins) - not that half year curbside, half
year "at the door" collection SS w/o glass Wkly
SS w/o glass
EOW SS EOW SS EOW
AgeCurbside since
1986 > 2 year
Bag 20 yrs; SS rollout for 2-3
years
1992 DS - started SS 3/09
(today 150k hhs DS, 22k SS) > 2 year ~1994 2001 2007 2001 started SS
Started SS Feb-08
(previously DS)
Participation100% - all SA
gets carts 100% - all SA gets cart
na - R tons are 14.5% of total
tons on SS routes 46% (41% DS, 6% SS) Approximately 85% 100% - all SA gets cart ("mandatory") 84% subscribe (free)
10% 07; 30% 08;
98% 09 >80% (measured 1 time) 85% subscribe (free)
Set-Out
Approx 90%
when
education is
strong na (guesstimate 45%) na na na
85% based on 1-time phone survey/field
check na (guesstimate <100%)
na (guesstimate
as high as 90%) na
About 47% (ranges
from ~ 40-50%)
Lbs/HH-
Collection
Back-calcu-
lates based on
full SA - has
increased to
11.5 #/hh-wk
since SS (up to
~13# at 90% set-
out)
na (new pgm will have RFID
tags) na
Was 15# DS - now 33# SS -
saw decrease when 2nd
local major newspaper
failed na
Back-calculates based on full SA (varies
from 4-40#);
'06 22.05 lbs/hh/mo;
'07 21.22 lbs/hh/mo;
'09 19.49 lbs/hh/mo (up to ~23# at 85%
set-out)
Back-calculates based
on full SA 13# up
slightly from 07/08 - incl
20-30% contamination
(up to 15# at 84%
subscription w/o
glass )
Back-calculates
based on full SA
18.5# (1600 tpm
09) (up to 21#
at 90% set-out
w/o glass )
Back-calculates based on
full SA; 9 lbs/hh/wk (65k
tons/yr) - flat-lined for 3
yrs but dropped 10% last
year (up to 11# at 80%
participation)
Back-calculates based
on full SA 12-13# for
ALL hhs in SA (up to
31# at 85%
subscription, 47% set-
out)
Trends/ Reasons
45% increase in
tons since SS &
began
accepting al
plastics
Recycle tons "stagnant" -
attribute to recession
Rolling out SS slower than
planned due to budget limits
Subscriptions not increasing
wo funding - saw DS
decrease wo outreach + 1-
mth suspension Hurricane
Rita (but doubling of
participation as SS
implemented) na
Recession; decreasing newspaper
subscriptions (less ONP in SS); began big
R promo 10/08 - # down but set-out
higher
Economy; R has
decreased LESS than T
Tons doubled since SS
(2/08) but leveling off
(recession)
LBA Associates, Inc. Page 1 of 3 v8 November 23, 2009

RE-SURVEY FINDINGS - DENVER SWMP
AUSTIN, TX 783,000 pop
SA=177,267
hhs/2,160
commercial
CHARLOTTE, NC700,000 pop
SA=240,000 hhs
CHICAGO, IL 2.8M pop
SA=600,000 HHs
HOUSTON, TX 2.2M pop
SA=360,000 hhs
LOUISVILLE, KY230k city pop SA=700,000
hhs (metro area)
SA = 93,000 HHs
(all data from 2008 survey)
MILWAUKEE, WIpop 604,407 (08)
SA=190,000 hhs
SALT LAKE CITY, UT 180,000 pop
SA=45,000 hhs
SALT LAKE
COUNTY, UT 1M pop
SA=80,000 hhs
incl 4 cities
SAN DIEGO, CA1.3M pop
SA=304,000 hhs T,
280,000 hhs R, 191,000
hhs O
THORNTON, CO 120,000 pop
SA=25,134 hhs
Organics
Program/Freque
ncy Yr round Wkly yr-round Wkly Apr-Nov Wkly yr-round Wkly yr-round Apr-Nov on demand service for brush Wkly seasonal Trailer pgm Wkly yr-round na
Age > 2 yrs > 2 yrs > 2 yrs 11 mths (January 2010) since early 90s > 2 yrs Since 3/08 1997 1989 na
YW - FW? YW YW YW
YW - grass/leaves weekly;
brush every-other month
YW + straw, pine needles,
wood ash, sawdust
YW-brush only; on demand (routes are
compiled daily based on demand is);
leaves collected citywide all fall (SA
rakes to curb & city picks up) Woody, YW YW
YW - just started taking
FW from commercial
(there is a wait list) na
Container
Kraft bags, tied
bundles,
individual
containers Bags Bags set next to T carts
Biodegradable bags for
grass, leaves na Bundles, piles of leaves 90-gal auto Rental trailers
Bags - transitioning to
carts (10% of HHs have
carts now) na
Participation na na na Provided to 100% hhs na
Leaves collected from entire city (beyond
SA)
18% and increasing (pay
extra for) As needed 89% of 191k SA na
Set-Out na na na 30-40% estimated na na na na na na
Lbs/HH
06/07 - 4.8
#/hh-wk; 07/08
- 5.2#; 08/09 -
4.3 # na na 50k tons brush for 360k hhs na
Brush ranges from 15.6 in 07 to 22.7
lbs/hh-yr in 08
Back-calculates based
on 100% set-out ~27#
(8 months only) na
Lower than San Jose
(same number of hhs);
YW tons down 25% over
last 5 years na
Trends/ Reasons
08/09 YW
quantities
down due to 2-
yr drought
Quantity generally flat
unless drought or other
weather variation Quantity flat na na
Quantity dependent on weather (early
snow, rainy autumns) na
No reminders or
education (vs. R which
gets lots of reminders) na
DOC MaterialsOperated by
NPOs & private
Run by County - R, O, B,
scrap metal, tires R, O, HHW, e-scrap B, R, scrap metal, tires
B, R, C&D, scrap metal, tree
limbs & stumps
MSW, B, R, O, scrap metal, tires, C&D,
WGs, (not FW, motor oil/other car
waste) R (glass + OCC)
Leaf bag
collection only
R, YW/FW, C&D, cooking
oil (Goodwill has drop
box) R, branches/limbs
No/City
Coverage Varies
Many around city/county - 4
staffed, 9 self-serve, 27 for
business (OCC & paper)
35 locations, none staffed,
all areas of City
4 all materials (staffed) w/
2 more in progress, 4 R only
(unstaffed)
1 serves whole city; 2
times/yr DSWM provides
free junk & B DOC at same
facility 2, serving whole city 3 locations 10 locations
1 central location at LF
(in center of City) 4 locations
Users/Year na na na
6,000 users/mo (at staffed
DOC) na 300,000 vehicles/yr na na 120k customers/year
700 vehicles w
branches
Quantities/Year
(/Generator) na na 4,200 tpy 15,000 tpy na 51,880 MSW/yr in 2008
~1,020 glass + 120 tons
OCC annually
200 tpy-DOC
(leaves) + 150
tons Xmas
curbside 20k TPY R
600 tpy SS (est 2009)
50 tpy branches (est
2009)
Charge? na No No No
Yes except free DOC days 2
times/year
No but will start small fee for C&D in
2010 No No No No - subsidized
Restricted Use? na Residents, small businesses No
City residents have
unlimited use of unstaffed
sites; 4 visits/month limit at
staffed sites na Residents, no commercial Residents (but any)
Residents (but
any) Residents only Open to all
MFU/Commer-
cial DiversionVoluntary glass
recycling
MF>30 city manages
contract w/ private hauler
for T, R na na
Take T,R daily from business
district na
None but exploring for
residential/ commercial na Serve many MFUs na
LBA Associates, Inc. Page 2 of 3 v8 November 23, 2009

RE-SURVEY FINDINGS - DENVER SWMP
AUSTIN, TX 783,000 pop
SA=177,267
hhs/2,160
commercial
CHARLOTTE, NC700,000 pop
SA=240,000 hhs
CHICAGO, IL 2.8M pop
SA=600,000 HHs
HOUSTON, TX 2.2M pop
SA=360,000 hhs
LOUISVILLE, KY230k city pop SA=700,000
hhs (metro area)
SA = 93,000 HHs
(all data from 2008 survey)
MILWAUKEE, WIpop 604,407 (08)
SA=190,000 hhs
SALT LAKE CITY, UT 180,000 pop
SA=45,000 hhs
SALT LAKE
COUNTY, UT 1M pop
SA=80,000 hhs
incl 4 cities
SAN DIEGO, CA1.3M pop
SA=304,000 hhs T,
280,000 hhs R, 191,000
hhs O
THORNTON, CO 120,000 pop
SA=25,134 hhs
Enforcement Minimal
State bans not enforced - w
SS city will add education
more than enforcement for
contamination na na na na na na na
B = bulky HH = household OMG = magazines TPM = tons per month
C&D = construction/demolition debris HHW = household hazardous waste ONP = newspaper TPY = tons per year
CY = cubic yards LF = landfill POP = population W = with
DOC = drop-off collection MF = multi-family RFID = radio frequency identification display WG = white goods (appliances
DS = dual-stream recyclables collection MO = month R = recycling WK = week
EOW = every other week NA = not available or not applicable SA = service area WKLY = weekly
EST = estimated NPO = non-profit organization SF = single-family W/O = without
FW = food waste O = organics SS = single-stream recyclables collection YR = year
K = 1,000 OCC = cardboard T = trash YW = yard waste
Back-calculations for pounds of materials set-out on collection days: Unless these calculation consider both the specific program's subscription and set-out rate (i.e., when these are not available), the actual set-out weight is expected to be higher than that shown.
LBA Associates, Inc. Page 3 of 3 v8 November 23, 2009

APPENDICES | OCTOBER 2010
A MASTER PLAN FOR MANAGING SOLID WASTE IN THE MILE HIGH CITY
APPENDIX F
Denver Solid Waste Master Plan Projections Memorandum (November 2009)

APPENDICES | OCTOBER 2010
A MASTER PLAN FOR MANAGING SOLID WASTE IN THE MILE HIGH CITY
The purpose of projecting Denver MSW tons is to establish a basis for estimating short‐term (2015) and
long‐term (2030) quantities that will be used to identify potential diversion as well as implementation
costs in the Denver SWMP. While it is likely that these quantities will be adjusted slightly during the
analyses, the HDR Team’s intent is to generally establish an agreed upon basis at this time that supports
future work.
1.0 Background
MSW generation projections are often tied to population increases. However, these correlations do not
always exist. Figure 1 shows that MSW generation (US) and landfill disposal (CO) have increased faster
than population based on historical data (see trend line projections). The Colorado State Demography
Office predicts that the state population will increase nearly 40% between 2010 and 20301.
Figure 1 National & State Waste Trends (including linear trend lines)
Conversely, quantities observed in recent years indicate that more current trends in national and state
MSW generation and disposal are increasing at a slower rate:
1 Colorado State Demography Office predicts that Denver’s population will increase by 18% between 2010 and
2030.

APPENDICES | OCTOBER 2010
A MASTER PLAN FOR MANAGING SOLID WASTE IN THE MILE HIGH CITY
US MSW generation rates fell for the first time in 2007 despite a growing population and economy – this trend continued in 20082
In a recent national survey, 75% of respondents observed lower than average landfill quantities during the 2nd and 3rd quarter 2009 – 72% expect flat to more than 4% quantity declines over the next 12 months3
The 10 cities re‐surveyed in October/November 2009 observed MSW landfill tonnages have decreased by 2% to 8% per year since 20074
Various other US landfill observations range from no impact to a 26% decrease over the last one to two years5
The DADS landfills tonnages fell 21% between 2007 and 2008, 25% between 2008 and 2009
CDPHE’s database shows a 6.2% decrease between 2001 and 2002 and a 14.2% decrease between 2007 and 2008
These recent quantity trends are attributed to economic recessions (2001 and 2008/2009), non‐
recession events (such as the September 11, 2001 terrorist attacks), increased source reduction and
waste diversion, and the global move towards on‐line media and paperless communication (less
newspaper, office paper and commercial printing). A summary of economic indicators include:
The US Gross Domestic Product is projected to level off/begin increasing between the 4th quarter 2009 and the 2nd quarter 20106
The US civilian unemployment rate is projected to increase nearly every month into the 2nd quarter 20107
Housing inventory is expected to delay real growth in Colorado residential construction for one to two years
Colorado manufacturing growth is down 8% and mimics the decrease seen following the previous recession in 2002‐20038
While employment numbers are down close to 2001 recession levels, other indicators showed improvement in September (the state unemployment rate, mortgage rates, home re‐sales, housing inventory and the Denver/Boulder inflation) ‐ that have caused some to state that the recession is “moderating” statewide9
2 USEPA’s Municipal Solid Waste Generation, Recycling, and Disposal in the United States: Facts and Figures for 2008. 3 First Analysis Cooperation, October 2009 – survey included both MSW and C&D landfills. 4 HDR/LBA Draft Re‐Survey Findings, November 2009. 5 For example: McPherson Area Solid Waste Authority, KS no impact in 2008; Lancaster County, PA – 4% decline in 2008; State of South Carolina – 6% decline in 2008; State of North Carolina – 5% decline in 2008; Winston‐Salem/Forsythe County, NC – 4.4% decline in 2009; Orange County, CA – 11.7% decline in 2009 (MSW and recycling tons); City of Grand Island Landfill, NE – 12.2% decline in 2009; and Los Angeles County, CA – declines of 7% (Chiquita Canyon Landfill), 21% (Calabasas Landfill), 27% (Puente Hills Landfill). 6 forecasts.org/economic‐indicator/gdp.htm (updated September 2009) and PNC National Economic Outlook (October 2009). 7 forecasts.org/economic‐indicator/gdp.htm (updated September 2009). 8 University of Colorado at Boulder LEEDS School of Business, Colorado Business Review, Volume 7, Number 3, 2009. 9 www.coloradoeconomy.com/coind/html (September 2009).

APPENDICES | OCTOBER 2010
A MASTER PLAN FOR MANAGING SOLID WASTE IN THE MILE HIGH CITY
2.0 Projecting Denver’s Future Tons The MSW tons collected by Denver Solid Waste and disposed at the DADs landfill (Figure 2) have fallen
since 2001 – on the heels of both the 2001 recession, the multi‐year drought during the implementation
of the city’s recycling program. While disposal tons collected by Denver increased by 1.4% to 4.3% per
year from 1996 to 2000, they decreased from 0.6% to 5.8% per year from 2001 to 2008. These historical
landfill tons have no clear relationship with the population projections for the city (i.e., growth rate of
just over 0.8%/year between 2010 and 2030).
Denver Solid Waste collects residential waste from single‐family and multi‐family homes up to 7 units, as
well as from city government buildings and Denver Public Schools. Waste generated by multi‐family
homes greater than 8 units, commercial businesses, non‐DPS institutions and industries is collected by
private haulers. The quantity of this waste is unknown.
Figure 2 Denver Solid Waste Landfill Tons and Population
2.1 Total Tons
As landfill tons are only one component of MSW generation, it is important to evaluate Denver’s total
MSW tons. Figure 3 shows how recycling, organic and other material quantities (e‐waste, appliances,
HHW, leaves and trees) were combined with landfill quantity data to determine the total MSW tons. A
linear trend line through the resulting total tonnage data from 1996 to 2008 shows a decrease over

APPENDICES | OCTOBER 2010
A MASTER PLAN FOR MANAGING SOLID WASTE IN THE MILE HIGH CITY
time (nearly 400 tons/year)10. This quantity reflects historical landfill and recycling tonnages, as well as
organics and miscellaneous (e‐waste, appliance, HHW, Christmas tree and leaf) tonnages tracked since
2008.
Using current estimates from the Colorado Demography Office, it appears that as many as 197,000
households could exist by 2030. Given apparent limitations on residential building growth observed by
Denver Solid Waste staff, however, these projections were modified for the SWMP planning periods
noted in Tables 2 and 3.
Figure 3 Denver Solid Waste MSW Tons
2.2 Recyclables
The SWMP evaluates expanding DSWM’s current household collection service. This program provides
every‐other‐week collection of single‐stream materials. Table 1 includes available performance data for
this program to date.
10 Linear trend line equation y = ‐382.26x + 267,185 tons.

APPENDICES | OCTOBER 2010
A MASTER PLAN FOR MANAGING SOLID WASTE IN THE MILE HIGH CITY
Table 1 Historical Denver Recycles Program Data
YEAR a Year‐End
Subscribers
Average
Subscriber (% of
Eligible HHs)
Average
Pounds/Set‐
Out
Average
% Set‐Out
2004 80,987 not available 35.58 42.86% 2005 80,555 not available 34.13 48.42%
2006 66,298 not available 38.07 57.35%
2007 76,841 44.5% 39.69 71.29%
2008 87,227 49.8% 34.36 77.90%
2009 (through
mid‐October) 95,317 54.9% 30.04 79.15%
a Phasing in of Denver’s single‐stream recycling program began mid‐2005 HHS = households
A projection of future recycling tons was based on continued growth of the existing program. Using
Table 1 data, 2009 Re‐Survey findings11 and other available information, assumptions were made for the
expanded program’s future performance metrics. Specifically:
The rapid increase in the recycling subscription rate between 2007 and 2008 (about 5% per year) is typical of new programs like Denver Recycle’s single‐stream collection – this growth is expected to slow in the short‐term as the program matures (2% was observed between 2008 and 2009)
A similar trend in the percent of set‐outs (number of subscribed households that set out recyclables on their collection day) occurred as single‐stream collection was fully implemented (as much as a 14‐percentage‐point growth was observed between 2006 and 2007) – this rate is also expected to slow and stabilize at about 78% in the short‐term as household compost collection service is implemented (see Section 2.3)
The set‐out weight (pounds of recyclables set out on each collection day) is expected to have similar trend during the short‐term with a slight decrease as the compost program is implemented (assumed to stabilize around 29 pounds/set‐out in the short‐term)
The subscription, pounds/set‐out and set‐out rate are each expected to grow over the long‐term planning period, however, as the city continues to emphasize waste diversion through both program and policy changes
Quantities generated from the collection of additional materials, more frequent collection, or the
addition of drop‐site collections are not considered here. The assumptions used in Table 2 may be
adjusted slightly during the SWMP analyses.
11 Note that the cities surveyed generally do not measure set‐out rates or weight/set‐out. Instead, most “guesstimate” a set‐out rate, and back‐calculate set‐out weight by dividing annual tonnage by households (usually eligible ‐ not subscribing ‐ households). Therefore these findings must be used very carefully. Note that 4 cities achieved recycling program set‐out rates of 80% or greater for mature programs – Louisville, KY; Salt Lake City, UT; San Diego, CA (has residential/commercial recycling mandate); and Thornton, CO.

APPENDICES | OCTOBER 2010
A MASTER PLAN FOR MANAGING SOLID WASTE IN THE MILE HIGH CITY
During the two‐season 2008 Waste Composition Study (WCS), it was noted that as much as 21.3% of
landfill waste was recyclable paper and containers. This represented nearly 47,000 tons in 2008 (which
was in addition to the 28,550 tons diverted through household collection service). It is expected that
expanded household collection service would reduce the quantity of these materials in landfill waste in
the future.
Table 2 Projected Recyclable Tons (rounded to nearest 100 tons)
Future Program Assumptions a
Current
Program
(2009)
Phase 1 Phase 2 Phase 3 Phase 4 Phase 5 2030
Subscriber (% of Eligible
Households) b 55% 57% 59% 61% 63% 65% 80%
Eligible Households c 167,662 172,900 175,400 178,000 180,300 181,800 190,000
Pounds/Set‐Out 30 30 29 29 29 29 30
% Set‐Out 79% 78% 78% 78% 78% 78% 80%
Total Tons 29,116 30,000 30,400 31,900 33,400 34,700 47,400 a Assumptions for subscriber and set‐out rates based on observations from the existing program and knowledge of other U.S. household recycling collection programs b Subscription rate increase corresponds to 20%/20%/20%/20%/20% implementation during short‐term c Based on current service area (only 98.6% of Denver’s service area is eligible for recycling services) and Colorado State Demography office population projections (October 2009); 2030 households were capped given known property constraints
2.3 Organics
The SWMP evaluates adding permanent household collection of yard and food waste organics to
voluntary, subscribing households similar to the recycling program. It is expected that organics would be
collected weekly April through November, and every other week December through March. Using data
obtained from Denver’s 2008/09 pilot study and 2009 Re‐Survey findings12, assumptions were made for
the new program’s future performance metrics. Specifically:
Table 3 shows that the 2008/09 pilot study was successful in terms of both set‐out rate and weight
The escalation of these factors and the subscription rate through Phase 5 were assumed to mimic the short‐term implementation of Denver Recycles single‐stream program – assumptions for the new program therefore included assumptions for a steady increase to 55%, 80% set‐out and moderate pounds/set‐out were assumed
12 Again, surveyed cities have little performance data (set‐out weight is back‐calculated) – most programs collect yard waste only.

APPENDICES | OCTOBER 2010
A MASTER PLAN FOR MANAGING SOLID WASTE IN THE MILE HIGH CITY
The subscription, pounds/set‐out and set‐out rate are each expected to grow over the long‐term planning period as the city continues to emphasize waste diversion through both program and policy changes
The projected organic tons shown in Table 3 are based on quantities generated through an expansion of
the existing pilot program. Yard waste quantities generated from future drop‐site collections are not
considered here. The assumptions used in this table may be adjusted slightly during the SWMP analyses.
The 2008 WCS identified that as much as 42.4% of City‐collected landfill wastes were food (13.7%) and
yard waste (28.7%) organics during the spring and fall seasons. This represented over 93,000 tons of
Denver’s landfilled waste in 2008.
Table 3 Project Organic Tons (rounded to nearest 100 tons)
Future Program Assumptions a
2009 Pilot
Program Phase 1 Phase 2 Phase 3 Phase 4 Phase 5 2030
Subscribers
(% of Eligible
Households) b
2% 11% 33% 41% 50% 55% 68%
Eligible
Households c 172,900 175,400 178,000 180,300 181,800 190,000
Pounds/ Weekly
Set‐Out Collection (April‐
Nov) 31 20 20 20 20 20 30
Every‐Other‐
Week Collection
(Dec‐March)
13 9 9 9 9 9 13
% Set‐Out Weekly
Collection (April‐
Nov) 61% 40% 50% 60% 70% 80% 80%
Every‐Other‐
Week Collection
(Dec‐March)
65% 40% 50% 60% 80% 80% 80%
Total Tons 1,400 2,900 11,200 16,900 24,300 30,900 59,600a Assumptions for subscriber and set‐out rates based on observations from the pilot program, the existing recycling program, and knowledge of other U.S. household collection programs b Subscription rate increase corresponds to 20%/40%/15%/15%/10% implementation during short‐term c Based on current service area (only 98.6% of Denver’s service area is eligible for recycling services) and Colorado State Demography office population projections (October 2009); 2030 households were capped given known property constraints HHS = households

APPENDICES | OCTOBER 2010
A MASTER PLAN FOR MANAGING SOLID WASTE IN THE MILE HIGH CITY
2.4 Other Diverted Materials
These materials ‐ including e‐waste, appliances, HHW, Christmas trees and leaves – totaled
approximately 760 tons in 2008/09. It is assumed that generation of these materials may increase by 3%
annually.
2.5 Landfill Tons
By subtracting recyclable, organic and other tons from total MSW generation projections, potential
landfill tonnage can be estimated as shown in Table 4. However, when the historical trend of total
tonnage (described by the linear regression equation y = ‐382.26x + 267,185 tons in Section 2.1) is
applied to projections for 2010 and the planning period, the total tonnage does not match DSWM
expectations (i.e., projected landfill tons would be nearly 261,800 – notably more than the actual
253,100 tons in 2009). In order to address significant changes to tonnages in the last decade, the
projection analysis was modified on the basis of annual total ton change described by historical data
(382‐ton decrease per year), and current tons (253,100 total tons in 2009). This modification is reflected
in Table 4.
Year 2004 data is provided as 2004 is the baseline year used by Greenprint Denver to establish its goal of
a 30% reduction in landfill tons managed by Denver Solid Waste. Thirty‐percent reduction of 2004
landfill tons requires a landfill quantity of 178,100 tons. Table 4 indicates that this reduction is not
expected to be reached during the short‐term planning period through implementation of voluntary
diversion programs alone. If the city is successful in growing the diversion programs at a faster rate than
estimated in this analysis – and/or if additional programs are implemented which support additional
diversion ‐ the goal may be achieved more quickly.
Based on assumed growth of the household recycling and compost collection programs, the short‐term
diversion rate may reach as high as 27% (Phase 5), with significant potential growth in later years. The
long‐term landfill ton projections indicate an average annual decrease between 2011 and 2030 of about
2.4% compared to a decrease in total MSW generation of about 0.2% per year.

APPENDICES | OCTOBER 2010
A MASTER PLAN FOR MANAGING SOLID WASTE IN THE MILE HIGH CITY
Table 4 MSW Quantity Projectionsa (rounded to nearest 100 tons)
Projections
Actual
Short‐Term Long‐
Term
2004 2010 Phase 1 Phase 2 Phase 3 Phase 4 Phase 5 2030 Phase 1‐2030
%
Total MSW
Tons
270,194 252,700 252,300 251,900 251,600 251,200 250,800 245,100 ‐0.2%
Recycling
Tons 15,705 29,600 30,000 30,400 31,900 33,400 34,700 47,400 2.4%
Organic Tons 0 1,400 2,900 11,200 16,900 24,300 30,900 59,600 17.3%
Other Tons 0 800 800 900 900 900 900 1,500 3.4%
Landfill Tons 254,489 220,900 218,600 209,400 201,900 192,600 184,300 136,600 ‐2.4%
% Diversion 6% 13% 13% 17% 20% 23% 27% 44% 6.6%a Summations may not appear to total exactly due to rounding errors

APPENDICES | OCTOBER 2010
A MASTER PLAN FOR MANAGING SOLID WASTE IN THE MILE HIGH CITY
APPENDIX G
Denver Solid Waste Management Plan Final Report Spring/Fall 2008 Waste Composition
Analysis (March 2009)

Final Report
SSpprriinngg//FFaallll 22000088 WWaassttee CCoommppoossiittiioonn AAnnaallyyssiiss Denver Solid Waste Management
March 2009
HDR Engineering, Inc.
In Association with LBA Associates

Denver Solid Waste Management and HDR Engineering would like to thank Kessler Consulting for their assistance with the Spring WCS and CDPHE’s Recycling Resource Economic Opportunity
Fund for its support of the Fall WCS.
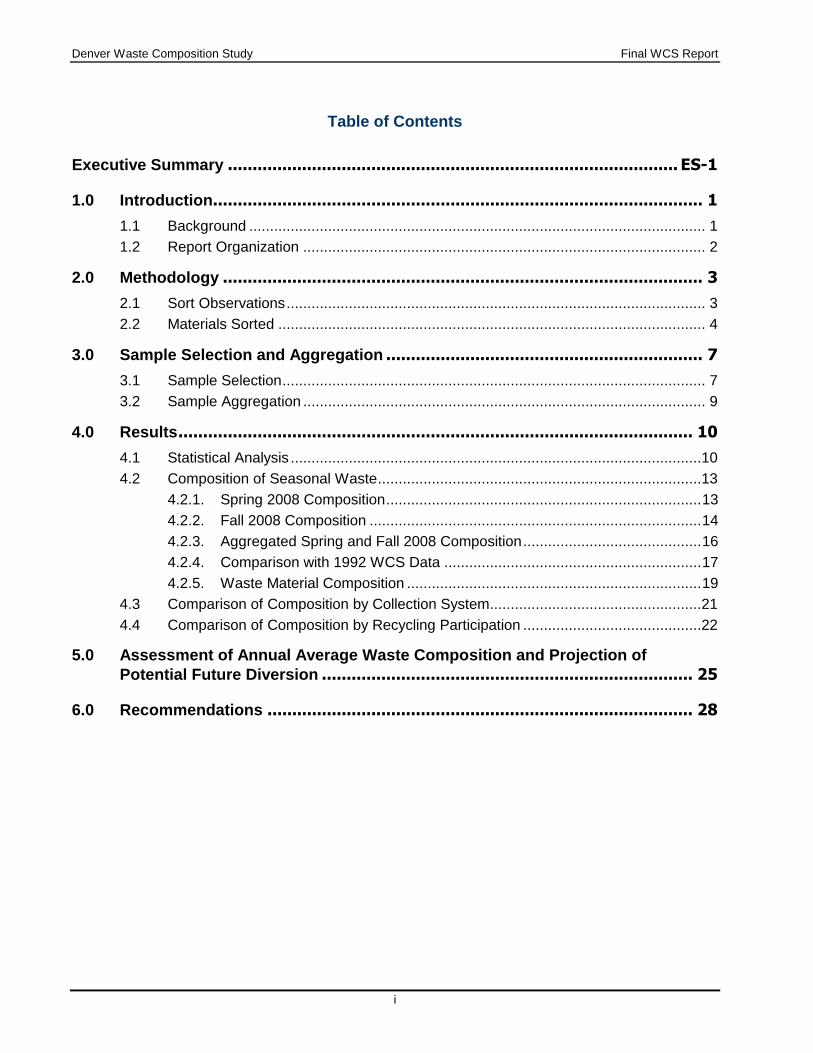
Denver Waste Composition Study Final WCS Report
i
Table of Contents
Executive Summary ........................................................................................... ES-1
1.0 Introduction................................................................................................... 1
1.1 Background .............................................................................................................. 1
1.2 Report Organization ................................................................................................. 2
2.0 Methodology ................................................................................................. 3
2.1 Sort Observations ..................................................................................................... 3
2.2 Materials Sorted ....................................................................................................... 4
3.0 Sample Selection and Aggregation ................................................................ 7
3.1 Sample Selection ...................................................................................................... 7
3.2 Sample Aggregation ................................................................................................. 9
4.0 Results ........................................................................................................ 10
4.1 Statistical Analysis ...................................................................................................10
4.2 Composition of Seasonal Waste ..............................................................................13
4.2.1. Spring 2008 Composition ............................................................................ 13
4.2.2. Fall 2008 Composition ................................................................................ 14
4.2.3. Aggregated Spring and Fall 2008 Composition ........................................... 16
4.2.4. Comparison with 1992 WCS Data .............................................................. 17
4.2.5. Waste Material Composition ....................................................................... 19
4.3 Comparison of Composition by Collection System ...................................................21
4.4 Comparison of Composition by Recycling Participation ...........................................22
5.0 Assessment of Annual Average Waste Composition and Projection of
Potential Future Diversion ........................................................................... 25
6.0 Recommendations ...................................................................................... 28

Denver Waste Composition Study Final WCS Report
ii
List of Tables
Table 1. Material Categories and Description ................................................................................. 5 Table 2. Targeted Routes by Area and Actual Routes Sampled ..................................................... 8 Table 3. Households Served and Waste Quantities from Each Collection System ......................... 9 Table 4. Spring WCS - Raw Data Including 90% Confidence Intervals for Each Material Type
(not weighted) .................................................................................................................11 Table 5. Fall WCS - Raw Data Including 90% Confidence Intervals for Each Material Type
(not weighted) .................................................................................................................12 Table 6. Comparison of Spring & Fall Sort Results (aggregated, percent by weight) .....................16 Table 7. Comparison with 1992 Waste Composition Study (percent by weight) ............................18 Table 8. Comparison of Waste Composition (Unweighted) by Collection System
(percent by weight) ..........................................................................................................21 Table 9. Comparison of Waste Composition by Recycling Participation (Subscription) Levels
(percent by weight) ..........................................................................................................24 Table 10. Assessment of Annual Average Waste Composition .....................................................25 Table 11. Future Potential Diversion (based on 100% recovery) ...................................................26 Table 12. Total Tons Diverted if Recyclables/Organics Recovered at 40%-60% Level ..................27
List of Figures
Figure 1. Sampling Grid .................................................................................................................. 4 Figure 2. Spring WCS - Aggregate Composition by Material Category (percent by weight) ...........13 Figure 3. Spring WCS - Aggregate Composition by Material Types (percent by weight) ...............14 Figure 4. Fall WCS - Aggregate Composition by Material Category (percent by weight) ...............15 Figure 5. Fall WCS - Aggregate Composition by Material Types (percent by weight) ....................15 Figure 6. Aggregate of Composition Spring and Fall Sorts by Material Category (percent by weight) ..........................................................................................................17 Figure 7. Comparison of Material Categories by Recycling Participation Level (not weighted) ......23
List of Appendices
Appendix A Denver Waste Composition Study: Sampling & Sorting Guidelines ....................... A-1 Appendix B Denver WCS Photographs .................................................................................... B-1 Appendix C Spring WCS Summary Data and Analysis ............................................................. C-1 Appendix D Fall WCS Summary Data and Analysis ................................................................. D-1 Appendix E Spring WCS Field Data ........................................................................................ E-1 Appendix F Fall WCS Field Data ............................................................................................. F-1

Denver Waste Composition Study Final WCS Report
ES-1
Executive Summary
As part of its on-going Solid Waste Strategic Master Plan, Denver Solid Waste Management
conducted a two-season spring/fall waste composition analysis in 2008, which included a Spring
Waste Composition Study (WCS) during the week of June 9th
and a Fall WCS during the week of
November 3rd
. These sorts were scheduled to target yard wastes in the waste stream, and to provide
information that supplements the city’s 2008/09 organics collection pilot program. The results of
this analysis provided insight into both residential yard waste generation and other disposal practices.
The purpose of the WCS was to analyze:
The effectiveness of the existing Denver recycling program, including the relative impact of both
the three collection systems used by DSWM for residential waste (characterized by dumpster,
barrel/cart and resident-provided or manual containers) and the varying recycling subscription
rates (low, medium and high) of Denver’s residents.
Information to support adding new materials to the existing recycling program.
Information to support the feasibility of a future food and yard waste diversion program (this
WCS was scheduled to coincide with spring/early summer and fall yard waste generation).
Information to provide material focus to a Denver Solid Waste Master Plan.
An aggregate of the spring and fall 2008 WCS results, while not reflective of Denver’s annual
average waste stream, illustrates peak yard waste management needs. The figure below illustrates
the combined composition of residential spring/fall waste. The Organics category included the
greatest quantity of materials at 57.2% by weight.
Key observations included:
In the Organics category, spring Yard Waste was primarily grass clippings, sod and branches and
fall Yard Waste was primarily leaves - these materials could easily be managed by curbside or
alley collection (i.e., would fit in a 65- or 95-gallon cart).

Denver Waste Composition Study Final WCS Report
ES-2
Average Aggregate Composition Spring & Fall Sorts by Material Category
(percent by weight)
Glass, 2.3%Residue, 6.1%
Hazardous &
Special Waste,
7.4%
Metal, 2.7%
Plastics, 9.8%
Paper, 14.4%
Organics, 57.2%
It was noted that dumpster routes generate the greatest amount of Organics (i.e., Yard and Food
Waste) during the spring season, followed by barrel routes.
Within the Paper category, Single-Stream Paper included primarily Cardboard (mostly not
broken down) and Newspaper (heavily contaminated with Food Waste and Other Organics).
In the Hazardous & Special Waste category, C&D debris included primarily construction waste
from home improvement projects such as treated wood, shingles, bricks and ceramics.
Large quantities of small, easily mixed materials (such as grass clippings, leaves and dirt) plus
high winds (which caused paper and plastics to blow throughout the sort area) resulted in
elevated levels of contamination and Residue weights for some samples.
An evaluation of probable average annual results indicates slightly lower Organics percentages and
slightly higher percentages for other materials, as shown below. These results indicate that at least
67,000 tons/year of material could be diverted from disposal (based on 2008 quantities) if the current
recycling program is maintained and city-wide organics collection (Yard and Food Waste) is added
such that both systems recover 40% of the targeted recyclables and organics.
Assessment of Annual Average Waste Composition
AVERAGE DENVER ASSESSMENT OF AVERAGE ANNUAL
Spring & Fall 2008 COMPOSITION
2.4% 2.9%
2.7% 3.7%
9.9% 10.2%
14.5% 18.0%
57.1% 52.7%
Hazardous &
Special Waste 7.4% 7.1%
6.3% 5.0%
100% 100%

Denver Waste Composition Study Final WCS Report
ES-3
The primary recommendations from the spring/fall 2008 waste composition analysis are:
1. Evaluate the feasibility of adding permanent organics recovery program - the WCS results
strongly support the potential for significant diversion through the recovery of Yard and Food
Waste (the primary components of the largest material category observed).
2. Increase public outreach to capture existing recyclables and launch new diversion programs
effectively.
The spring/fall 2008 waste composition analysis was conducted as part of an on-going Solid Waste
Master Plan that DSWM will use to comply with Greenprint Denver. It also satisfied the second task
in an organics pilot project, partially funded by a grant from the Recycling Resources Economic
Opportunity Fund of the Colorado Department of Public Health and Environment. Denver is
conducting the organics collection pilot program under this grant for 3,300 residences from October
2008 through June 2009. Data from the WCS will be an instrumental part of analyzing the viability
of the pilot for full-scale implementation.

Denver Waste Composition Study Final WCS Report
1
1.0 Introduction
Denver Solid Waste Management (DSWM) conducted a spring/fall 2008 waste composition analysis
of its residential waste in 2008, including a Spring Waste Composition Study (WCS) during the
week of June 9th
and a Fall WCS during the week of November 3rd
. Both sorts were conducted at
Denver’s Cherry Creek Transfer Station (CCTS) in southeast Denver. The WCS was coordinated for
DSWM by the HDR Engineering Team. DSWM staff conducted the actual sorting.
These studies were scheduled to target yard wastes in the waste stream, and to provide information
that supplements the city’s 2008/09 organics collection pilot program. The results of this analysis
provide excellent insight into both residential yard waste generation and other disposal practices, but
because of the seasonal focus is not necessarily reflective of average annual waste generation.
The over-arching purpose of the WCS was to analyze the composition of waste generated by Denver
residents. DSWM collects residential waste using a combination of dumpster, barrel and manual
systems. The study was designed to identify:
The effectiveness of the existing Denver recycling program, including relative impact of the three
collection systems.
Information to support adding new materials to the recycling program.
Information to support the feasibility of a future food and yard waste diversion program.
Both sorts were conducted by DSWM as part of a larger, on-going strategic master planning effort
that will evaluate new and/or revised solid waste programs and policies over the next year. The Fall
WCS was also completed by DSWM as part of an organics recovery grant project funded in part by
the Colorado Department of Public Health & Environment (CDPHE). The combined results from
both studies, covering two waste generation seasons, will provide critical information to DSWM’s
short- and long-term planning work.
1.1 Background
DSWM’s residential waste collections were the target of both seasonal sorts. The City’s residential
program serves approximately 141,600 single-family and about 23,400 multi-family (two to seven
units each) homes. Regular service includes weekly waste collection plus bulky materials (also
known as large item pick-up). Weekly waste collection is broken into three systems, classified by
type of waste receptacle and the corresponding truck needed to empty those receptacles, which vary
by areas of the city:
Dumpster Collection (in all parts of the City excepting southwest area) - small groups of
residents are provided with dumpsters; DSWM collects with automated side-load vehicles.
Barrel Collection (in all parts of the City excepting northwest area) - each resident is provided
with 95-gallon carts; DSWM collects with automated side-load vehicles (overflows are allowed).
Manual Collection (predominately in northern half of the City) - residents provide their own bags
or containers; DSWM collects with rear-load vehicles.

Denver Waste Composition Study Final WCS Report
2
Large-item pickup (LIP) collection is provided to every resident ten times each year on a pre-set
schedule. LIP waste was not specifically included in the WCS, although some routine collections
include these bulky materials as daily schedules allow.
DSWM’s residential recycling program is voluntary and approximately 80,000 residents (or one-half
of Denver residents) currently subscribe. These homes are provided with a 65-gallon cart, which
DSWM collects every other week with automated side-loaders. Acceptable materials include most
paper, plus glass, plastic and metal containers and are fully commingled in a single-stream system.
Denver currently does not have permanent organics collection, although DSWM operates seasonal
yard waste programs (i.e., Fall Leaf Drop and Christmas Tree recycling). Beginning in early
October, however, Denver initiated a pilot program for the curbside collection of Yard and Food
Waste from nearly 3,300-homes under the same CDPHE organics recovery grant project described
above. Materials - including such items as food-contaminated paper and paper milk and juice
cartons - will be collected through June 2009. Collection is weekly through mid-December and
every other week for the duration of the program. Sixty-five-gallon automated carts are being used
by targeted households, which are spread throughout the City.
In 2007, DSWM disposed of 226,000 tons of waste at the Denver Arapahoe Disposal Site (DADS)
landfill and recycled nearly 27,000 tons. In accordance with Greenprint Denver, the City’s 2006
sustainability agenda, the disposal tons need to be reduced to 185,000 tons by 2011. Therefore,
DSWM is focusing current research and planning efforts on waste diversion.
1.2 Report Organization
This report presents the background, methodology and results for the two waste composition studies.
The document is divided into the following sections:
Methodology (Section 2.0) - based on the Denver Waste Composition Study: Sampling &
Sorting Guidelines (Appendix A), this section includes observations on the sorting procedure as
well as the list of materials sorted for.
Sample Selection & Aggregation (Section 3.0) - describes which of the City’s collection routes
were selected for sampling and explains how the results were weighted to develop an aggregate
composition.
Results (Section 4.0) - an analysis of waste composition in terms of aggregate composition as
well as type of collection and current recycling participation is summarized in this section.
Projection of Potential Future Diversion (Section 5.0) - evaluates existing and future materials in
the residential waste stream with diversion potential.
Recommendations (Section 6.0) - this section includes suggestions for conducting the Fall 2008
study and focusing the City’s Strategic Solid Waste Master Plan.
Appendices - Appendix A is the Sampling-Sorting Guidelines used for both sorts; Appendix B
includes sort photographs; Appendices C and D include summary results; and Appendices E and
F include the field data logs.
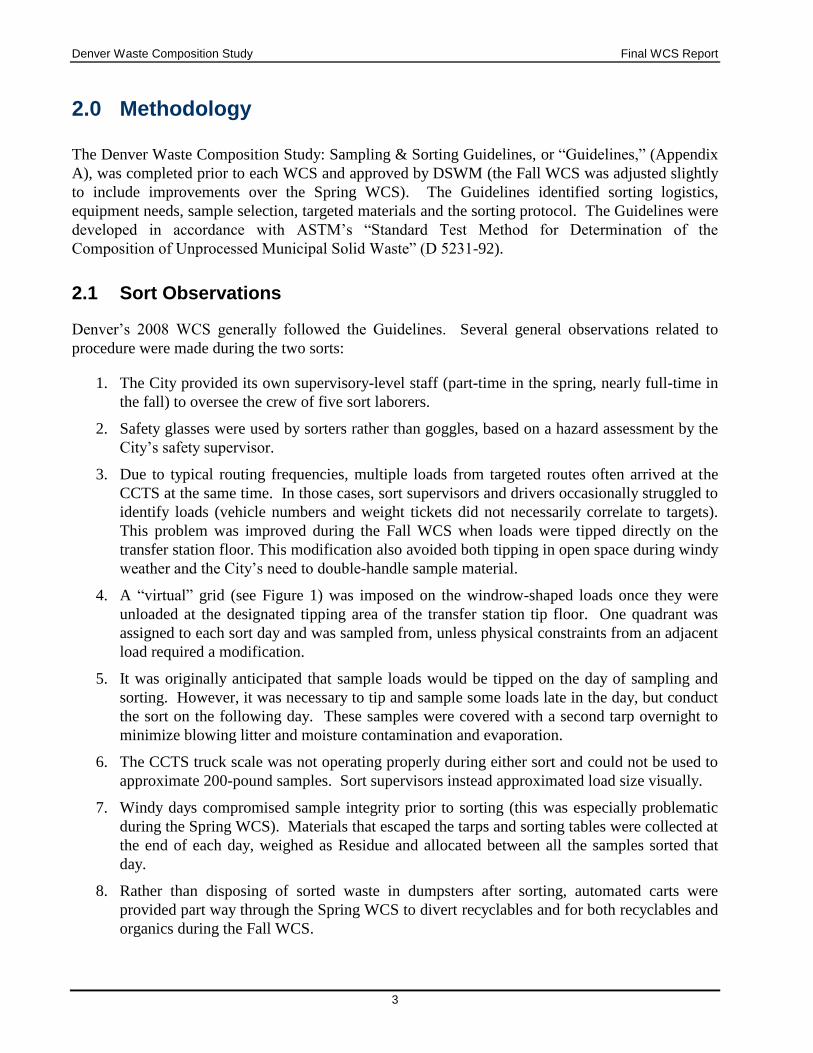
Denver Waste Composition Study Final WCS Report
3
2.0 Methodology
The Denver Waste Composition Study: Sampling & Sorting Guidelines, or “Guidelines,” (Appendix
A), was completed prior to each WCS and approved by DSWM (the Fall WCS was adjusted slightly
to include improvements over the Spring WCS). The Guidelines identified sorting logistics,
equipment needs, sample selection, targeted materials and the sorting protocol. The Guidelines were
developed in accordance with ASTM’s “Standard Test Method for Determination of the
Composition of Unprocessed Municipal Solid Waste” (D 5231-92).
2.1 Sort Observations
Denver’s 2008 WCS generally followed the Guidelines. Several general observations related to
procedure were made during the two sorts:
1. The City provided its own supervisory-level staff (part-time in the spring, nearly full-time in
the fall) to oversee the crew of five sort laborers.
2. Safety glasses were used by sorters rather than goggles, based on a hazard assessment by the
City’s safety supervisor.
3. Due to typical routing frequencies, multiple loads from targeted routes often arrived at the
CCTS at the same time. In those cases, sort supervisors and drivers occasionally struggled to
identify loads (vehicle numbers and weight tickets did not necessarily correlate to targets).
This problem was improved during the Fall WCS when loads were tipped directly on the
transfer station floor. This modification also avoided both tipping in open space during windy
weather and the City’s need to double-handle sample material.
4. A “virtual” grid (see Figure 1) was imposed on the windrow-shaped loads once they were
unloaded at the designated tipping area of the transfer station tip floor. One quadrant was
assigned to each sort day and was sampled from, unless physical constraints from an adjacent
load required a modification.
5. It was originally anticipated that sample loads would be tipped on the day of sampling and
sorting. However, it was necessary to tip and sample some loads late in the day, but conduct
the sort on the following day. These samples were covered with a second tarp overnight to
minimize blowing litter and moisture contamination and evaporation.
6. The CCTS truck scale was not operating properly during either sort and could not be used to
approximate 200-pound samples. Sort supervisors instead approximated load size visually.
7. Windy days compromised sample integrity prior to sorting (this was especially problematic
during the Spring WCS). Materials that escaped the tarps and sorting tables were collected at
the end of each day, weighed as Residue and allocated between all the samples sorted that
day.
8. Rather than disposing of sorted waste in dumpsters after sorting, automated carts were
provided part way through the Spring WCS to divert recyclables and for both recyclables and
organics during the Fall WCS.

Denver Waste Composition Study Final WCS Report
4
Figure 1. Sampling Grid
Quadrant Quadrant
Quadrant Quadrant
2.2 Materials Sorted
Seven over-arching materials categories were identified to sort for, with several material types within
each category also sampled. In the Spring WCS, 18 material types were sampled (excluding
residue). Because of interest in additional materials, three more material types were added in the Fall
sort. Table 1, below, shows a full description of materials. Samples with unusual materials or a
predominance of one material were noted in the Field Data Logs (Appendices E and F) and in
Section 4.0 as appropriate.

Denver Waste Composition Study Final WCS Report
5
Table 1. Material Categories and Description
MATERIAL
CATEGORIES
DESCRIPTION
(include each material in sorting unless noted)
GLASS
Glass Food &
Beverage Containers
All colors of food & beverage bottles & jars
All Other Glass Non-fluorescent light bulbs, glassware, window glass, ceramic dishware
METAL
Aluminum/Steel/Tin
Food/Beverage
Containers, Foil & Pie
Tins
Aluminum, tin, steel & bi-metal beverage & food cans, empty aerosol cans, foil, food trays and pie tins
All Other Metal Non-food containers, all scrap metal & items that are primarily metal, container lids/caps - excluding aerosols still containing product (move to Hazardous/Special Waste)
PLASTICS
Plastic Bottles Any bottles with necks/openings narrower than body including beverage containers and cleaning containers (any resin)
Rigid Plastic Food
Containers Plastic cups, tubs, clamshells, etc.
All Other Plastic Film, Styrofoam, other extruded polystyrene, other rigid packaging, foil-lined chip bags, foam products
PAPER
Single-Stream Paper Unwaxed/uncoated corrugated cardboard, Kraft paper/bags, newspaper, office paper, shredded paper, magazines/catalogues, telephone books
Waxy/Coated Paper Waxed or coated milk cartons, food packaging, etc. excluding any foil-lined paper (move to Other Paper)
All Other Paper Any foil-lined paper, carbon paper, photographs
ORGANICS
Food Waste All food/beverage waste (out of containers where active emptying not required) including bones & rinds, including food-contaminated paper towels & napkins
Yard Waste &
Untreated Wood
(excludes sod)
Grass, leaves, weeds, pruning, stumps trees (excludes sod) Unpainted or untreated wood, wood that is not heavily mixed with other materials (such as dimensional lumber, pallets, crates, etc.)
Sod1 Sod clumps and associated dirt
Textiles1 Clothing, bedding, sleeping bags, etc.
Pumpkins1 Whole or partial pumpkins (leftover from Halloween)
All Other Organics Carpet & padding, diapers, rubber products, upholstery, leather products, animal foods & waste, combustibles including wax, soap, cigarettes, briquettes, ash

Denver Waste Composition Study Final WCS Report
6
MATERIAL
CATEGORIES
DESCRIPTION
(include each material in sorting unless noted)
HAZARDOUS/SPECIAL WASTES
Electronics
Electronics with circuit boards (computer monitors, televisions, VCR or DVD players, portable music devices, cell/wireless phones, answering machines, digital cameras, electric razors, newer small household appliances) but excluding toasters, toaster ovens, older small household appliances (move to Other Metal)
Other Consumer
Products
Furniture (unless primarily textiles or leather, plastic, metal - move to other categories as appropriate), mattresses & box springs, electronics or similar devices without circuit boards (such as head sets)
Motor Vehicle Waste Automobile batteries, used oil, used filters, tires
C&D Debris1
Construction, demolition and rehabilitation debris including concrete, asphalt, painted or treated wood, drywall, fiberglass, rock/brick, ceramics (other than glassware), sawdust, scrap debris, etc.
Other
Hazardous/Special
Waste
Antifreeze Non-auto batteries Pesticides, herbicides, cleaners, adhesives, glues, explosives, asbestos Latex & oil paint, aerosol containers with product Medicines, cosmetics & other household chemicals Gasoline, kerosene, fuels Medical/biohazard waste Other hazardous materials or difficult to manage (requires special handling)
RESIDUE
Residue Sand, soil, dirt (but not sod) Inorganic materials not classified elsewhere Mixed MSW fines
1 Added in Fall WCS - not included in Spring WCS

Denver Waste Composition Study Final WCS Report
7
3.0 Sample Selection and Aggregation
3.1 Sample Selection
The Sampling and Sorting Guidelines included a plan for targeting DSWM’s residential routes to
obtain 40 samples of approximately 200 lbs. each, to represent the dumpster, barrel and manual
collection systems, and to represent the City’s four collection quadrants.
The two WCS each targeted for sampling:
16 dumpster routes from three of the four City areas served by dumpster collection;
13 barrel routes (including overflow) from the three areas served by this system; and
11 manual routes from throughout the City
Targeted loads are summarized in Table 2, below. Loads ultimately sampled during each sort
deviated slightly from the Guidelines to accommodate City routing schedules in each of the sort
weeks, and are noted in the table.
Due to the normal vagaries of a collection schedule, a total of 41 loads were sampled in the Spring
sort (from 40 routes) and 39 were sampled in the Fall sort (from 38 routes); meeting the overall
target of a total of 80 samples for 2008. These differences in the sample selection were due to the
following reasons:
Most of the City’s waste collection routes generate multiple loads of waste on any given day –
the load from each targeted route tipped for the WCS was chosen primarily at the discretion of
the route driver and may not fully represent the overall route.
Routes with the same designation collect from different households on different days of the week
in the same sector (e.g., ANW #1 on Mondays is a different route from ANW #1 on Tuesdays).
An “overflow” load was included in the barrel loads sampled - while this collection is made
manually with a rear-loader, the wastes collected are from a barrel route where the materials do
not fit in the automated cart provided the resident.
For data comparison purposes, the samples averaged approximately 275 pounds in the Spring WCS
and approximately 210 pounds in the Fall WCS, for a total of 19,465 pounds sorted (i.e., 9.7 tons).
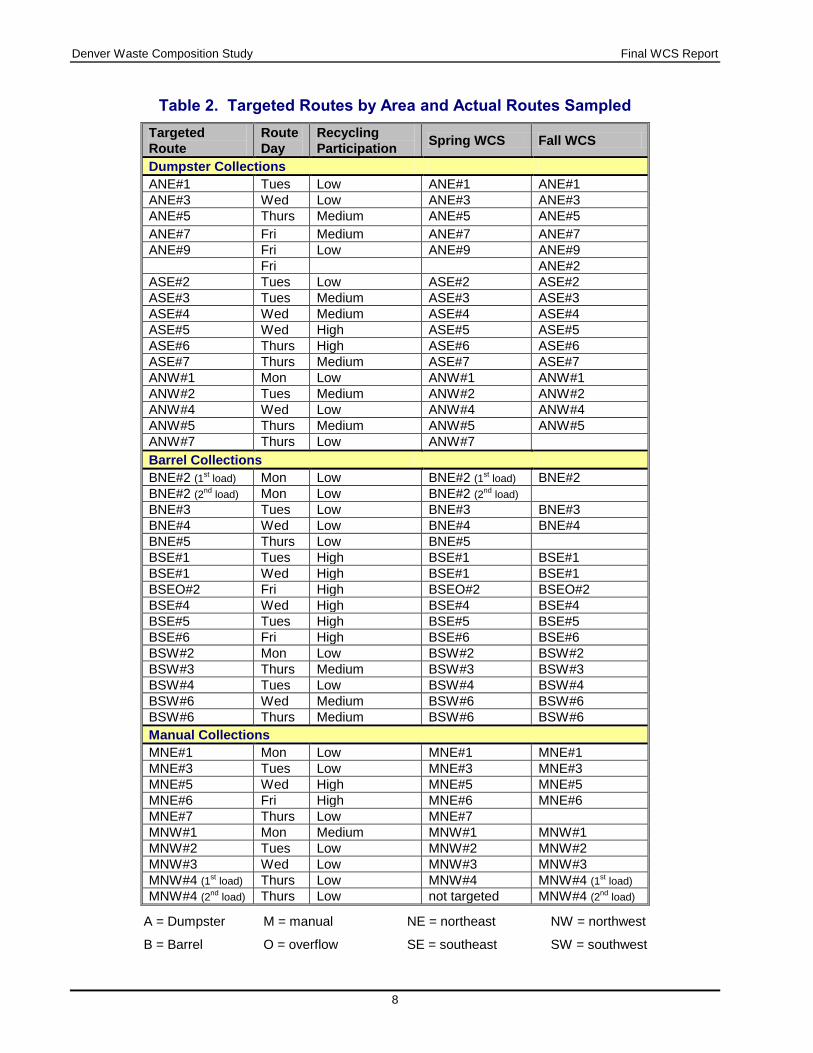
Denver Waste Composition Study Final WCS Report
8
Table 2. Targeted Routes by Area and Actual Routes Sampled
Targeted
Route
Route
Day
Recycling
Participation Spring WCS Fall WCS
Dumpster Collections
ANE#1 Tues Low ANE#1 ANE#1
ANE#3 Wed Low ANE#3 ANE#3
ANE#5 Thurs Medium ANE#5 ANE#5
ANE#7 Fri Medium ANE#7 ANE#7
ANE#9 Fri Low ANE#9 ANE#9
Fri ANE#2
ASE#2 Tues Low ASE#2 ASE#2
ASE#3 Tues Medium ASE#3 ASE#3
ASE#4 Wed Medium ASE#4 ASE#4
ASE#5 Wed High ASE#5 ASE#5
ASE#6 Thurs High ASE#6 ASE#6
ASE#7 Thurs Medium ASE#7 ASE#7
ANW#1 Mon Low ANW#1 ANW#1
ANW#2 Tues Medium ANW#2 ANW#2
ANW#4 Wed Low ANW#4 ANW#4
ANW#5 Thurs Medium ANW#5 ANW#5
ANW#7 Thurs Low ANW#7
Barrel Collections
BNE#2 (1st load) Mon Low BNE#2 (1st
load) BNE#2
BNE#2 (2nd load) Mon Low BNE#2 (2nd
load)
BNE#3 Tues Low BNE#3 BNE#3
BNE#4 Wed Low BNE#4 BNE#4
BNE#5 Thurs Low BNE#5
BSE#1 Tues High BSE#1 BSE#1
BSE#1 Wed High BSE#1 BSE#1
BSEO#2 Fri High BSEO#2 BSEO#2
BSE#4 Wed High BSE#4 BSE#4
BSE#5 Tues High BSE#5 BSE#5
BSE#6 Fri High BSE#6 BSE#6
BSW#2 Mon Low BSW#2 BSW#2
BSW#3 Thurs Medium BSW#3 BSW#3
BSW#4 Tues Low BSW#4 BSW#4
BSW#6 Wed Medium BSW#6 BSW#6
BSW#6 Thurs Medium BSW#6 BSW#6
Manual Collections
MNE#1 Mon Low MNE#1 MNE#1
MNE#3 Tues Low MNE#3 MNE#3
MNE#5 Wed High MNE#5 MNE#5
MNE#6 Fri High MNE#6 MNE#6
MNE#7 Thurs Low MNE#7
MNW#1 Mon Medium MNW#1 MNW#1
MNW#2 Tues Low MNW#2 MNW#2
MNW#3 Wed Low MNW#3 MNW#3
MNW#4 (1st load) Thurs Low MNW#4 MNW#4 (1st
load)
MNW#4 (2nd load) Thurs Low not targeted MNW#4 (2nd
load)
A = Dumpster M = manual NE = northeast NW = northwest
B = Barrel O = overflow SE = southeast SW = southwest

Denver Waste Composition Study Final WCS Report
9
3.2 Sample Aggregation
The majority of the tonnage collected by the City is collected under the dumpster system. Table 3
shows the breakdown of the relative service area size (by number of households served) and
tonnages collected by each of Denver’s collection systems. The waste tonnage percentages in the far
right column of Table 3 were used as weighting factors in order to estimate the aggregate
composition of the residential waste collected by DSWM.
Table 3. Households Served and Waste Quantities from Each Collection System
Collection
System
Single-Family
Households
Served
Multi-Family
Households
Served
2007 Tons Collected
(to nearest 1,000
tons)
Percent of Total
Tons
Dumpster 50,000 14,000 109,000 48.2%
Barrel (includes barrel overflow)
54,200 800 74,000 32.8%
Manual 37,400 8,600 43,000 19.0%
Total 141,600 23,400 226,000 100%

Denver Waste Composition Study Final WCS Report
10
4.0 Results
4.1 Statistical Analysis
The following statistical measures were used to indicate how well the samples represent the
residential waste managed by DSWM. The ASTM D 5231-92 procedures call for a four-season
waste composition analysis to generate data that is fully representative of average waste generated
for disposal over the course of a year. Typically, a statistical analysis run on a full data set would be
used to assess correlation between sort samples and actual Denver waste composition. Given the
availability of only two sorts, however, individual statistical analyses of each sort have been run, but
should be considered independently of one another, and reflective only of the season being studied.
The analysis included a calculation of:
Sample Mean - or average weight for each material type and category.
Standard Deviation - measures how widely the values for each material varied around the mean
(or average).
Confidence Interval - the range of values expected to encompass the mean of the overall
population (i.e., the full quantity of compactor loads from which the WCS samples were
collected); the Denver confidence interval was calculated at a 90% level of confidence (a typical
interval used by ASTM for MSW waste study work).
Tables 4 and 5 include summaries of raw (not yet weighted by Table 3 calculations) data with the
90% confidence intervals for each material. Appendices C and D include the statistical analysis on
the raw data for each material type for the spring and fall sorts respectively (see the “Results
Summary & Statistics” tables).
A higher standard deviation indicates greater variation in the samples than a lower standard
deviation. And typically, the width of the confidence intervals decreases as the sample size
increases. For example, the Spring WCS results in Table 4 show that the range between lower and
upper confidence limits (high minus low confidence interval values) for Food Waste in manual
samples only (9 samples) was 19.4 pounds. However, the same range for Food Waste in dumpster
samples (16 samples) was only 9.8 pounds.

Denver Waste Composition Study Final WCS Report
11
Table 4. Spring WCS - Raw Data Including 90% Confidence Intervals
for Each Material Type (not weighted)
Dumpsters Barrel Manual
Material
Category Material Type
Confidence
Interval
Confidence
Interval
Confidence
Interval
90%
Confidence
Limit
Low High
90%
Confidence
Limit
Low High
90%
Confidence
Limit
Low High
Glass Containers 2.3% 4.1 7.9 1.8% 3.4 6.8 1.8% 2.8 7.5
Other Glass 0.4% 0.4 1.6 0.1% -0.1 0.8 0.0% -0.1 0.4
Metals
Alum/Steel/Tin
Food & Beverage 0.9% 1.7 3.2 1.4% 2.9 4.7 0.8% 1.3 3.4
Other Metal 1.2% 0.2 6.2 1.0% 1.4 4.4 1.1% 1.6 4.7
Plastic Bottles 1.8% 2.8 6.6 2.1% 4.0 7.6 1.4% 2.5 5.7
Rigid Plastic Food
Containers 0.6% 1.2 2.1 1.3% 2.0 5.4 0.7% 1.1 3.1
Other Plastic 7.0% 14.9 22.2 7.0% 13.4 25.5 9.2% 20.2 33.6
Single-Stream
Paper 10.7% 22.7 33.5 12.1% 26.0 41.6 13.1% 30.0 46.3
Waxy-Coated
Paper 1.1% 1.6 4.1 1.2% 2.1 4.5 2.8% 1.9 14.6
Other Paper 0.5% 0.6 1.9 0.9% 0.2 4.8 0.4% 0.3 1.9
Food Waste 6.9% 13.1 23.0 11.8% 24.0 41.8 9.1% 16.7 36.1
Yard Waste 45.2% 88.6 149.4 34.2% 58.8 131.8 31.6% 58.0 126.2
Other Organics 9.4% 17.3 31.9 10.1% 18.5 38.2 11.3% 21.1 44.7
Hazardous
& Special
Waste
Electronics 0.2% -0.1 1.0 0.2% 0.0 1.1 0.2% -0.3 1.5
Other Consumer
Products 0.5% -0.4 3.0 0.0% 0.0 0.2 0.2% 0.0 1.2
Motor Vehicle
Waste 1.6% -2.7 10.9 0.0% NA NA 0.0% NA NA
Other Haz &
Special Waste 3.4% 3.0 14.7 7.6% 8.5 33.9 3.3% -0.1 19.1
Residue 6.4% 8.5 25.4 7.1% 13.7 26.1 13.0% 19.5 56.0

Denver Waste Composition Study Final WCS Report
12
Table 5. Fall WCS - Raw Data Including 90% Confidence Intervals for Each Material
Type (not weighted)
Dumpsters Barrel Manual
Confidence
Interval
Confidence
Interval
Confidence
Interval
Material
Category
Material
Type
90%
Confidence
Limit
Low High
90%
Confidence
Limit
Low High
90%
Confidence
Limit
Low High
Glass
Containers 2.2% 1.7 5.7 2.3% 3.3 7.4 2.5% 2.1 10.0
Other Glass 0.1% 0.0 0.4 0.1% 0.0 0.3 0.1% -0.1 0.5
Metals
Alum/Steel/
Tin Food &
Beverage
1.0% 1.2 2.3 1.9% 2.6 6.3 1.8% 2.7 6.1
Other Metal 2.7% 1.6 7.5 1.4% 1.6 4.8 0.0% 0.0 0.1
Plast
Plastic
Bottles 1.1% 1.3 2.4 2.6% 2.2 10.2 1.5% 2.3 4.9
Rigid
Plastic Food
Containers
1.2% 1.2 3.0 1.0% 1.7 3.0 0.8% 0.8 2.8
Other
Plastic 5.9% 7.3 12.6 6.9% 11.0 21.3 8.9% 13.9 29.0
Single-
Stream
Paper
14.5% 19.8 29.3 12.0% 22.8 33.5 12.3% 14.9 44.5
Waxy-
Coated
Paper
0.1% 0.1 0.3 0.6% 0.5 2.4 0.4% 0.3 1.7
Other Paper 2.3% 0.9 7.1 0.6% 0.1 2.6 2.3% 1.8 9.3
Food Waste 10.4% 12.3 23.1 12.3% 18.7 39.1 10.7% 12.9 38.7
Yard Waste 34.4% 40.4 76.6 33.9% 55.7 103.4 36.0% 41.7 131.7
Pumpkins 2.4% 0.7 7.4 2.2% 1.3 8.9 2.1% 0.4 9.9
Sod 0.0% NA NA 0.0% NA NA 0.0% NA NA
Textiles 3.6% 3.5 8.7 2.5% 2.4 9.2 3.3% 4.2 11.6
Other
Organics 5.5% 6.6 12.2 4.4% 4.8 15.9 5.2% 3.1 21.9
Hazardous
& Special
Waste
Electronics 1.5% 0.1 4.9 0.7% 0.3 3.0 0.1% 0.0 0.5
Other
Consumer
Products
0.0% 0.0 0.1 0.0% NA NA 0.1% -0.1 0.3
C&D Debris 0.7% -0.3 2.7 0.0% NA NA 1.7% NA NA
Motor
Vehicle
Waste
6.2% 3.0 17.9 8.1% -2.9 40.9 5.0% -2.5 26.6
Other Haz &
Special
Waste
0.3% 0.0 1.1 0.8% -0.3 4.0 0.3% 0.1 1.5
Residue 3.8% 2.2 10.6 6.0% 5.5 22.5 4.9% 2.6 20.9

Denver Waste Composition Study Final WCS Report
13
4.2 Composition of Seasonal Waste
4.2.1. Spring 2008 Composition
Figure 2 illustrates the Spring WCS aggregated waste composition for the 7 over-arching material
categories observed in the 41 residential waste samples. Figure 3 shows the aggregate composition
by the 18 specific materials types (plus residue).
Note that the Organics category included the greatest weight of observed waste (58.3%), while Yard
Waste was the single most prevalent material type (39.5%). The top five material types by weight
were Yard Waste, Single-Stream Paper, Other Organics, Food Waste and Residue.
These materials types represent 77.3% of the total residential waste stream sampled. Three of these
(Yard Waste, Single-Stream Paper and Food Waste) could potentially be diverted in the future (see
Section 5.0).
Figure 2. Spring WCS - Aggregate Composition by Material Category
(percent by weight)
Organics,
57.9%
Paper, 13.7%
Hazardous &
Special
Waste, 6.0%
Plastics,
10.1%
Glass, 2.3%
Metal, 2.2%
Residue, 7.9%

Denver Waste Composition Study Final WCS Report
14
Figure 3. Spring WCS - Aggregate Composition by Material Types
(percent by weight)
39%
12%10% 9% 8% 7%
5%2% 2% 1% 1% 1% 1% 1% 1% 0% 0% 0%
0.0%
10.0%
20.0%
30.0%
40.0%
Yar
d W
aste
Sin
gle-
Strea
m P
aper
Oth
er O
rgan
ics
Food
Was
te
Res
idue
Oth
er P
last
ic
Oth
er H
az &
Spe
cial W
aste
Glass
Con
tain
ers
Plast
ic B
ottle
s
Wax
y-Coa
ted Pap
er
Alum
/Ste
el/T
in F
ood & B
ever
age
Oth
er M
etal
Rigid
Plast
ic F
ood C
onta
iner
s
Mot
or Veh
icle W
aste
Oth
er P
aper
Oth
er C
onsu
mer
Pro
ducts
Oth
er G
lass
Elect
ronics
4.2.2. Fall 2008 Composition
Similarly, Figures 4 and 5 illustrate the composition of the Fall WCS samples in terms of the over-
arching categories and specific material types, respectively (the Fall WCS had 21 material types plus
residue). The aggregated results for the Fall WCS indicate that that Organics was the largest
category (56.2%) by weight. The largest material types of Yard Waste, Single-Stream Paper, Food
Waste, Other Plastics and C&D Debris were the largest material types, comprising 72.2% of all
samples. Of these, the three largest categories provide opportunity for more diversion in the future.

Denver Waste Composition Study Final WCS Report
15
Figure 4. Fall WCS - Aggregate Composition by Material Category
(percent by weight)
Glass
2.4%
Metal
3.2%
Residue
4.7%
Plastics
9.5%
Paper
15.3%
Organics
56.2%
Hazardous &
Special Waste
8.7%
Figure 5. Fall WCS - Aggregate Composition by Material Types (percent by weight)
35%
13%11%
7% 7% 5% 5%3% 2% 2% 2% 2% 2% 1% 1% 1% 1% 0% 0% 0% 0% 0%
0.0%
10.0%
20.0%
30.0%
40.0%
Yard W
aste
Single
-Stre
am P
aper
Food Was
te
Oth
er Pla
stic
C&D D
ebris
Oth
er Org
anics
Residu
e
Textil
es
Pumpki
ns
Gla
ss C
onta
iner
s
Oth
er Pap
er
Plast
ic B
ottles
Oth
er Met
al
Alum
/Ste
el/Tin
Food &
Bev
erage
Rigid
Pla
stic
Food C
onta
iner
s
Elect
ronic
s
Moto
r Vehic
le W
aste
Oth
er Haz
& S
pecia
l Was
te
Waxy
-Coat
ed P
aper
Oth
er Gla
ss
Oth
er Consu
mer P
roduct
s
Sod

Denver Waste Composition Study Final WCS Report
16
4.2.3. Aggregated Spring and Fall 2008 Composition
Although the spring and fall 2008 sort results are two distinct snapshots of the Denver waste stream,
their aggregated results provide reasonable insight into the yard waste management needs during
peak generation periods. It is noted that the aggregated results do not necessarily represent the
average annual composition of Denver waste.
Table 6 and Figure 6 compare the aggregated results of the two seasonal sorts. Overall, the results
are very comparable, but two key differences should be noted:
Three material types were added to the Fall WCS. Thus, the Fall weights were spread out
over more materials, making some categories look smaller in the second sort - most notable is
Other Organics (which included sod and textiles during the Spring WCS) and Other
Hazardous and Special Waste (which included C&D Debris during the Spring WCS).
Residue was higher during the spring (7.5% versus 4.7% in the fall) as a result of higher
winds during the week of June 9th
.
Table 6. Comparison of Spring & Fall Sort Results (aggregated, percent by weight)
Spring WCS Fall WCS Average WCS Results
Glass Containers 2.1% 2.3% 2.2%
Other Glass 0.2% 0.1% 0.1%
Alum/Steel/Tin Food &
Beverage 1.1% 1.5% 1.3%
Other Metal 1.1% 1.7% 1.4%
Plastic Bottles 1.9% 1.7% 1.8%
Rigid Plastic Food Containers 0.9% 1.1% 1.0%
Other Plastic 7.3% 6.8% 7.0%
Single-Stream Paper 11.5% 13.2% 12.4%
Waxy-Coated Paper 1.3% 0.3% 0.8%
Other Paper 0.6% 1.8% 1.2%
Food Waste 8.9% 11.1% 10.0%
Yard Waste 39.5% 34.5% 37.0%
Pumpkins 2.3% 1.1%
Sod 0.0% 0.0%
Textiles 3.2% 1.6%
Other Organics 9.9% 5.1% 7.5%
Hazardous
& Special
Waste
Electronics 0.2% 1.0% 0.6%
Other Consumer Products 0.3% 0.0% 0.2%
Motor Vehicle Waste 0.8% 0.6% 0.7%
C&D Debris 6.6% 3.3%
Other Haz & Special Waste 4.9% 0.5% 2.7%
Residue 7.5% 4.7% 6.1%
TOTALS 100.0% 100.0% 100.0%

Denver Waste Composition Study Final WCS Report
17
The top five material types observed on the basis of averaged results from the two seasonal sorts
include Yard Waste (37.0%), Single-Stream Paper (12.4%), Food Waste (10.0%), Other Organics
(7.5%) and Other Plastics (7.0%).
Figure 6. Aggregate of Composition Spring and Fall Sorts by Material Category
(percent by weight)
Glass, 2.3%Residue, 6.1%
Hazardous &
Special Waste,
7.4%
Metal, 2.7%
Plastics, 9.8%
Paper, 14.4%
Organics, 57.2%
4.2.4. Comparison with 1992 WCS Data
RW Beck completed a “Limited Waste Composition Study” for Denver during the summer of 1992.
As shown in Table 7, that study evaluated fewer materials than the 2008 WCSs. This comparison
looks at composition only (percent by weight) - it does not compare the amount of waste generated
by a growing population over the 16-year period.
Three observations between 1992 (when there was no city-wide recycling program) and 2008 (when
more than half of Denver’s 165,000 households currently have curbside/alley recyclables collection)
waste compositions are noted below.
1. It appears that the relatively same proportion of Paper was disposed during both time frames,
however:
The 1992 study counted only Newspaper and Cardboard while the 2008 study counted a
much larger number of paper types.
EPA data estimates the national average for Newspaper/Cardboard at less than half of the
total Paper category (based on national waste characterization data).
The difference in materials sorting between the two studies likely masks a notable decrease in
the disposal (increase in diversion) of these Newspaper and Cardboard fractions in 2008, as a
result of the Denver Recycles program.

Denver Waste Composition Study Final WCS Report
18
The 2008 studies were conducted during seasons when the Yard Waste percentage was at its
highest for the year, causing the relative percentages of all other materials (including
recyclables such as paper) to be reduced below their likely average annual level (see Table
10).
2. The container composition (especially the ratio of Glass to Plastic Bottles) has changed
slightly:
This reflects the national change in food and beverage packaging over the last several years,
trending toward more plastic.
The 1992 study only counted PETE and HDPE Plastic Bottles (resins #1 and #2) and only
Aluminum/Tin cans - while the 2008 sort counted 7 types of Plastic Bottles as well as
several additional types of food and beverage container metals.
It is likely that these differences also hide a notable increase in container recycling.
The high Yard Waste percentage in the 2008 studies caused the relative percentages of
containers to be reduced below their average annual rate (see Table 10).
3. There are two reasons for the notable difference between the 1992 and 2008 Yard Waste
component. The 1992 sort was conducted in August and missed the late spring peak of yard
waste, and Beck admitted that the 1992 Yard Waste measurement was low as much of the grass
clippings during that sort were counted as Other Material. The Spring WCS captured the peak
(or near peak spring yard waste generation), while the Fall WCS captured the peak (or near
peak) of leaf generation.
Table 7. Comparison with 1992 Waste Composition Study
(percent by weight)
Material
1992 Summer
WCS
(RW Beck)
2008 Spring WCS
(HDR)
2008 Fall WCS
(HDR)
Paper 10.3%
newspaper & cardboard only
11.6% newspaper, cardboard, Kraft
paper/bags, office paper, shredded paper, paperboard,
magazines/catalogues, telephone books
13.2% newspaper, cardboard, Kraft paper/bags,
office paper, shredded paper, paperboard, magazines/catalogues,
telephone books
Plastic Containers
0.8% resin #1 and #2
only
2.0% resins #1-#7
1.7% resins #1-#7
Glass Containers
4.2% 2.0% 2.3%
Metal Containers
1.4% alum/tin only
1.0% alum/tin/steel/bimetal cans; foil, food
trays & pie tins
1.5% alum/tin/steel/bimetal cans; foil, food
trays & pie tins
Yard Waste 17.6% 39.0% 34.5%
Other Materials
65.7%
56.2% Other Paper, Plastics, Glass, Metal,
Organics; Food Waste; Hazardous/Special Waste; Residue
46.8% Other Paper, Plastics, Glass, Metal,
Organics; Food Waste; Hazardous/Special Waste; Residue
Total 100% 100% 100%

Denver Waste Composition Study Final WCS Report
19
4.2.5. Waste Material Composition
ORGANICS - The Organics category represents an average of 57.2% of all residential waste samples
between the two sorts, and included two of the heaviest material types observed during the sort (Yard
and Food Waste). Key observations about these material types include the following:
Yard Waste (average of 37.0%) was primarily grass clippings during the Spring WCS with
some sod, small- to medium-sized stumps and branches (especially from juniper bushes),
untreated wood and sawdust; the Fall WCS samples were predominately leaves.
Food Waste (average of 10.0%) included notable quantities of food-contaminated paper
towels, napkins, paper packaging and coffee grounds.
Pumpkins (average of 1.2% but measured for the Fall WCS only) - were observed in about
40% of the fall samples (the fall sort was held the week of November 3rd
and included
Halloween-related waste); note that this material is typically only generated during fall months
and is not typical of the average annual waste stream.
Textiles (average of 1.6% but measured for the Fall WCS only) - included clothing, shoes,
rags, bedding, insulation and carpeting.
Other Organics (average of 7.5%) included high quantities of diapers with lesser quantities of
animal feces and cat litter.
The high quantity of grass clippings, sod and leaves (easily mixed with other materials) often made
sorting these materials into individual types difficult. In a small number of samples there were also
portions of waste with high organics content too foul for sorting (animal fecal material, highly
degraded food, etc.). In each of these cases, the waste was sorted to the extent feasible - remaining
materials were then weighed and counted as the type of organics visually observed in the greatest
quantity. Notes about mixed materials and contamination were subsequently made on the log sheets
in Appendices E and F.
PAPER - The Paper category represented an average 14.4% between the two sorts, and included the
second highest material observed during the sort (Single-Stream Paper). Key observations about
these materials included:
Single-Stream Paper (average of 12.4%) included more cardboard and newspaper than Kraft
paper, office paper, shredded paper, magazines, paperboard and telephone directories - much
of the cardboard was not broken down and much of the newspaper was heavily contaminated
with Food Waste and Other Organics.
Waxy-Coated Paper (average of less than 1%) included mostly paper cups, plates (often from
take-out food) and milk cartons.
Other Paper (average of 1.2%) included freezer food packaging and other foil-lined packaging.

Denver Waste Composition Study Final WCS Report
20
Windy weather during the Spring WCS caused paper and plastics (along with other light-weight
materials) to be blown away from the sorting areas. These materials were collected at the end of
sorting and allocated to the Residue category for all samples sorted that day. As a result, some paper
materials were counted in the Residue versus Paper category.
PLASTICS - The Plastics category represented an average of 9.9% for the two sorts. Key
observations about these materials included:
Plastic Bottles (average of 1.8%) included mostly empty water/juice/soda bottles and milk
jugs.
Rigid Plastic Food Containers (average of 1.0%) included cups, clamshells, yogurt containers
and other mixed packaging.
Other Plastic (average of 7.1%) included primarily film - with notably less quantities of foam,
Styrofoam, mixed packaging, hoses and several 5-gallon plastic buckets.
The mixed plastic packaging during the Fall WCS included observable quantities of candy wrappers,
which was consistent with timing of Halloween. Some Other Plastic materials (primarily packaging)
were counted in the Residue versus Other Plastic category due to contamination (especially during
windy weather during the Spring WCS) as noted above.
GLASS & METAL - The Glass (average of 2.4% between the two sorts) and Metal (average of 2.7%)
categories included the lowest quantity of materials sorted. It was noted that most containers were
empty, and that non-container materials were minimal.
HAZARDOUS & SPECIAL WASTE - The Hazardous & Special Waste category represented an average
of 7.5% for the two sorts. Electronics, Other Consumer Products and Motor Vehicle Waste each
represented less than 1% and included such items as bits of circuit boards, small motors, parts of
household electronics, and cell phones; small appliances; furniture; and tires. No whole computers,
televisions, CRT monitors, or laptops were observed, though parts of these items were observed.
C&D Debris was measured for the Fall WCS only (average of 3.3%) and included notable quantities
of treated wood, asphalt shingles, bricks and ceramics (rolls of carpet were also observed in waste
loads, but not weighed). Other Hazardous & Special Waste averaged 2.7%, and included C&D
Debris in the spring but not the fall. Non-C&D materials observed included syringes, batteries,
partially filled aerosol cans, paint and filters.
RESIDUE - Residue includes inorganic materials not included in the other material types, as well as
contamination that cannot reasonably be separated from other materials. Grass clippings and leaves
were especially hard to separate, as were small pieces of paper and plastic packaging. The Residue
total represented an average 6.1% between the two sorts.

Denver Waste Composition Study Final WCS Report
21
4.3 Comparison of Composition by Collection System
DSWM has documented that households served by dumpsters generate more waste (1.7
tons/household-year excluding Large Item Pick-Up) than those served by carts in the barrel system
(1.4 tons/household-year) or those who provide their own containers in the manual system (1.1
tons/household-year). However, the relative quantities of material types from each collection system
were unknown. An evaluation was therefore conducted on unweighted results (i.e., not adjusted by
Table 3 calculations) to identify any waste patterns that might be helpful in Denver’s future program
changes or improvements. Table 8 compares findings for the Spring and Fall 2008 WCSs.
Table 8. Comparison of Waste Composition (Unweighted) by Collection System
(percent by weight)
SPRING 2008 FALL 2008
Material Dumpster Barrel Manual Dumpster Barrel Manual
Glass Containers 2.3% 1.8% 1.8% 2.2% 2.3% 2.5%
Other Glass 0.4% 0.1% 0.0% 0.1% 0.1% 0.1%
Alum/Steel/Tin Food &
Beverage 0.9% 1.4% 0.8% 1.0% 1.9% 1.8%
Other Metal 1.2% 1.0% 1.1% 2.7% 1.4% 0.0%
Plastic Bottles 1.8% 2.1% 1.4% 1.1% 2.6% 1.5%
Rigid Plastic Food Containers 0.6% 1.3% 0.7% 1.2% 1.0% 0.8%
Other Plastic 7.0% 7.0% 9.2% 5.9% 6.9% 8.9%
Single-Stream Paper 10.7% 12.1% 13.1% 14.5% 12.0% 12.3%
Waxy-Coated Paper 1.1% 1.2% 2.8% 0.1% 0.6% 0.4%
Other Paper 0.5% 0.9% 0.4% 2.3% 0.6% 2.3%
Food Waste 6.9% 11.8% 9.1% 10.4% 12.3% 10.7%
Yard Waste 45.2% 34.2% 31.6% 34.4% 33.9% 36.0%
Pumpkins 0.0% 0.0% 0.0% 2.4% 2.2% 2.1%
Sod 0.0% 0.0% 0.0% 0.0% 0.0% 0.0%
Textiles 0.0% 0.0% 0.0% 3.6% 2.5% 3.3%
Other Organics 9.4% 10.1% 11.3% 5.5% 4.4% 5.2%
Electronics 0.2% 0.2% 0.2% 1.5% 0.7% 0.1%
Other Consumer Products 0.5% 0.0% 0.2% 0.0% 0.0% 0.1%
Motor Vehicle Waste 1.6% 0.0% 0.0% 0.7% 0.0% 1.7%
C&D Debris 0.0% 0.0% 0.0% 6.2% 8.1% 5.0%
Other Haz/Special Waste 3.4% 7.6% 3.3% 0.3% 0.8% 0.3%
Residue 6.4% 7.1% 13.0% 3.8% 6.0% 4.9%
100.0% 100.0% 100.0% 100.0% 100.0% 100.0%
On a collection system basis, the most notable observation is that more Yard Waste, percent by
weight, was collected in the dumpsters during the spring (45.2%) than in the other containers.
However, the barrel system included slightly more Food Waste than the other systems. The
combined percentage of Yard and Food Waste was most diverse in the spring, when dumpster, barrel
and manual results were 52.1%, 46.0% and 40.7%, respectively.

Denver Waste Composition Study Final WCS Report
22
This supports a recommendation to add organics collection in dumpster areas first, followed by
barrel areas, if implementation occurs in phases.
Other Organics were observed in greater quantities during the spring sort and are likely a result of
spring clean-up activities by residents. Less Other Paper was observed during the spring sorts of
dumpster and manual loads - these materials probably ended up in the Residue fraction due to windy
conditions during the May sort.
4.4 Comparison of Composition by Recycling Participation
During the Spring WCS, DSWM conducted an evaluation of waste composition as a function of
recycling participation. DSWM tracks recycling participation on a per route basis in terms of the
percent of households that have subscribed for recycling (Table 2 identified participation levels for
the targeted sampling routes). This tracking data has been organized into three categories for the
purpose of the Spring WCS:
Low recycling participation = <31% average subscribers per route
Medium recycling participation = 31% to 55% subscribers
High recycling participation = >55% subscribers
During the spring 2008 WCS, 20 samples were taken from low participation routes (<31%
households subscribed to the Denver Recycles’ program); 11 from medium participation routes (31%
to 55% subscribed); and 10 from high participation routes (>55% subscribed). Figure 7 graphically
compares the material categories collected in these samples. Table10 provides numerical data for
both material types and categories, as a function of recycling participation.
Note that this analysis considered dumpster, barrel and manual collections for each level of
participation, and that samples associated with each collection type were weighted based on Table 3
calculations.
Figure 7 indicates that - from a broad category perspective - there was little difference in waste
composition between routes with households that recycle at low, medium or high rates for materials
in the Glass, Metal, Plastics and Paper categories (the range between recycling areas for these
materials is 2.2% or less). More notable variation occurred in the last two categories, with high-
participating samples containing less than one-half to one-third of the Hazardous and Special Waste
(primarily construction debris) of the others.
Table 9 provides more only slightly more insight on a material-specific level. With respect to
materials that can be recycled in Denver Recycles’ existing program, it was noted that:
With respect to recyclable containers, the results do not indicate that low-participating areas had
the most Glass Containers, Alum/Steel/Tin Containers and Plastic Bottles in their waste as
expected - or that high-participating areas had the least (these results were mixed although the
results were all within only 1% of each other and too close for clear differentiation).

Denver Waste Composition Study Final WCS Report
23
Single-Stream Paper results were also not expected - low-participating areas had less of this
material than the other areas (although results were also very close - within 0.8% of one another).
Observations for other materials included:
Low-participating areas had more Other Plastic, primarily plastic film (the results were within
only 2.5%).
High-participating areas had more Organics (the results for material types within this category
were within 5.2%).
Figure 7. Comparison of Material Categories by Recycling Participation Level
(not weighted)
These results do not present clear differentiation between participation (or subscription) levels. One
possible reason for these results may be that WCS samples were not collected from every load on
each route. It is possible that samples were not specifically collected from those portions of the
routes that best represent the households whose participation levels drive DSWM’s metrics of low,
medium and high recycling.
Another explanation for these results could be that actual recycling levels are not tied to average
subscription rates in any given route. In other words, if the recycling households on low-
participating routes recycled more aggressively than those in high-participating areas, the resulting
waste composition might have the same general lack of differentiation as noted in Table 10.
Note that, due to the inconclusive results obtained during the Spring WCS, this analysis was not
repeated for the Fall WCS.
2.1% 1.8%
11.1%13.1%
1.6% 1.7%
8.9%
7.9%
6.0%
58.1%
5.4%
8.4%
57.2%
13.8%9.6%
2.8%2.8%9.1%
2.5%
62.4%
13.7%
0.0%
10.0%
20.0%
30.0%
40.0%
50.0%
60.0%
70.0%
Glass Metal Plastics Paper Organics Hazardous &
Special Waste
Residue
Low Participation
Medium Participation
High Participation

Denver Waste Composition Study Final WCS Report
24
Table 9. Comparison of Waste Composition by Recycling Participation
(Subscription) Levels (percent by weight)
Participation
Material Category Material Type
Low Medium High
Type % Category
% Type %
Category
% Type %
Category
%
Glass Containers 2.0% 2.4% 1.4%
Other Glass 0.1% 2.1% 0.4% 2.8% 0.2% 1.6%
Alum/Steel/Tin Food
& Beverage 1.1% 1.3% 0.5%
Other Metal 0.7% 1.8% 1.5% 2.8% 1.2% 1.7%
Plastic Bottles 2.1% 1.7% 1.5%
Rigid Plastic Food
Containers 0.5% 1.2% 1.6%
Other Plastic 8.4% 11.1% 6.8% 9.6% 5.9% 8.9%
Single-Stream
Paper 11.1% 11.9% 11.8%
Waxy-Coated Paper 1.4% 1.6% 1.3%
Other Paper 0.6% 13.1% 0.3% 13.8% 0.6% 13.7%
Food Waste 9.1% 8.8% 9.4%
Yard Waste 39.3% 37.5% 43.1%
Other Organics 9.7% 58.1% 10.8% 57.2% 9.8% 62.4%
Hazardous &
Special Waste
Electronics 0.1% 0.6% 0.0%
Other Consumer
Products 0.1% 0.5% 0.0%
Motor Vehicle
Waste 0.0% 1.9% 0.0%
Other Haz/Special
Waste 5.7% 6.0% 5.3% 8.4% 2.5% 2.5%
Residue 7.9% 7.9% 5.4% 5.4% 9.1% 9.1%
Totals 100.0% 100.0% 100.0% 100.0% 100.0% 100.0%

Denver Waste Composition Study Final WCS Report
25
5.0 Assessment of Annual Average Waste Composition and
Projection of Potential Future Diversion
Due to the targeted seasonal nature of the 2008 waste composition analysis, it was necessary to
consider other information to assess the average annual composition. DSWM evaluated composition
results obtained from waste characterization studies on waste samples at the Larimer County
Landfill. Larimer County’s work was based on two seasonal sorts (summer and winter) and was
completed in 2006. Table 10 includes a summary of Denver and Larimer County results, and an
assessment of annual Denver waste composition based on the combined data sets.
Table 10. Assessment of Annual Average Waste Composition
DENVER 2008 WCS
RESIDENTIAL
LARIMER 2006
WCS
RESIDENTIAL Denver
Material
Category Material Type
Spring
WCS
Fall
WCS
Avg
Denver
Average
Summer/Winter
Annual
Composition
Glass Containers 2.0% 2.3% 2.2% 3.1% 2.6%
Other Glass 0.2% 0.1% 0.2% 0.4% 0.3%
Alum/Steel/Tin
Food & Beverage 1.1% 1.5% 1.3% 2.1% 1.7%
Other Metal 1.1% 1.7% 1.4% 2.5% 2.0%
Plastic Bottles 1.8% 1.7% 1.8% 2.3% 2.0%
Rigid Plastic Food
Containers 0.9% 1.1% 1.0% 3.2% 2.1%
Other Plastic 7.4% 6.8% 7.1% 5.1% 6.1%
Single-Stream
Paper 11.6% 13.2% 12.4% 23.5% 15.0%
Waxy-Coated Paper 1.4% 0.3% 0.9% 0.2% 0.5%
Other Paper 0.6% 1.8% 1.2% 7.7% 2.5%
Food Waste 8.9% 11.1% 10.0% 17.4% 13.7%
Yard
Waste/Pumpkins 39.0% 36.8% 37.9% 9.9% 28.7%
Sod 0.0% 0.0% 0.0% 0.0% 0.0%
Textiles 0.0% 3.2% 1.6% 2.4% 2.0%
Other Organics 10.0% 5.1% 7.6% 9.0% 8.3%
Hazard-
ous &
Special
Waste
Electronics 0.2% 1.0% 0.6% 2.2% 1.4%
Other Consumer
Products 0.3% 0.0% 0.2% 0.4% 0.3%
Motor Vehicle
Waste 0.8% 0.6% 0.7% 0.0% 0.4%
C&D Debris 0.0% 6.6% 3.3% 4.1% 3.7%
Other Haz & Special
Waste 4.7% 0.5% 2.6% 0.8% 1.7%
Residue 7.9% 4.7% 6.3% 3.7% 5.0%
99.9% 100.1% 100.0% 100.0% 100.0%

Denver Waste Composition Study Final WCS Report
26
In an effort to identify potential diversion of recyclables and yard waste based on the waste
composition in Table 10, material quantities have been estimated based on percent by weight and the
2008 landfill tonnage (220,000 tons). This estimation is shown in Table 11.
Table 11. Future Potential Diversion (based on 100% recovery)
Material
Category Material Type
Avg
Type % Tons
Potential
Tons
Diverted
Glass Containers 2.6% 5,720 5,720
Other Glass 0.3% 660
Alum/Steel/Tin Food &
Beverage 1.7% 3,740 3,740
Other Metal 2.0% 4,400
Plastics
Plastic Bottles 2.0% 4,400 4,400
Rigid Plastic Food
Containers 2.1% 4,620 4,620
Other Plastic 6.1% 13,420
Single-Stream Paper 15.0% 33,000 33,000 Existing Recyclables
46,860
Waxy-Coated Paper 0.5% 1,100 1,100 Future Recyclables 5,720
Other Paper 2.5% 5,500
Food Waste 13.7% 30,140 30,140 Future Organics
97,680
Yard Waste/Pumpkins 28.7% 63,140 63,140
Sod 0.0% 0 0
Textiles 2.0% 4,400 4,400
Other Organics 8.3% 18,260
Hazardous
& Special
Waste
Electronics 1.4% 3,080
Other Consumer Products 0.3% 660
Motor Vehicle Waste 0.4% 880
C&D Debris 3.7% 8,140
Other Haz & Special Waste 1.7% 3,740
Residue 5.0% 11,000
TOTALS 100% 220,000 150,260 Total Potential 150,260
Note that 100% recovery is unreasonable and consideration of lower recovery rates is needed
As shown, if DSWM recovered 100% of these materials, Denver has the maximum potential to
divert as much as 150,260 tons in 2008, which represents 68.3% of the 220,000 tons landfilled.
These materials include:
Existing recyclables (21.3%) - containers and fiber that are not being captured by the
current Denver Recycling program.
Future recyclables (2.6%) - Rigid Plastic Food containers and Way-Coated Paper that
may be accepted by DSWM’s recycling and organics vendors in the future.

Denver Waste Composition Study Final WCS Report
27
Future organics (42.4%) - Yard and Food Waste that may be part of a permanent organics
collection program implemented by DSWM in the future.
However, it is not reasonable that any program achieve 100% recovery of its potentially diverted
materials. To estimate more reasonable levels, a range of 40% to 60% diversion for both recyclables
and organics was evaluated.
Table 12. Total Tons Diverted if Recyclables/Organics Recovered at 40%-60% Level
(tons unless otherwise indicated)
Actual
Assume 40%
Diverted
Recyclables/40%
Diverted Organics
Assume 50%
Diverted
Recyclables/50%
Diverted
Organics
Assume 60%
Diverted
Recyclables/60%
Diverted Organics
Existing Recyclables
2008 Diversion 28,600 30,180 37,730 45,280
Recyclables in Waste 46,860 45,280 37,730 30,180
Total Recyclables 75,460 75,460 75,460 75,460
Recyclables Diversion Rate 37.9% 40.0% 50.0% 60.0%
Organics
2008 Diversion 0 37,310 46,640 55,970
Recyclables in Waste 93,280 55,970 46,640 37,310
Total Recyclables 93,280 93,280 93,280 93,280
Organics Diversion Rate 0.0% 40.0% 50.0% 60.0%
Diverted Tons (Recyc + Org) 28,600 67,490 84,370 101,250
Landfilled Tons 220,000 181,110 164,230 147,350
Total (Recyc + Org + LF) 248,600 248,600 248,600 248,600
Overall Diversion Rate 11.5% 27.1% 33.9% 40.7%
Table 12 indicates that DSWM’s current program recovers 37.9% of its recyclables and 0% organics,
and achieves an overall landfill diversion rate of 11.5%. The table also shows that if DSWM is able
to develop and maintain mature recyclables and organics diversion programs that consistently divert
between 40% and 60% of the materials in each category, overall diversion of materials from landfill
disposal can range from 27% to 41%. This estimate does not consider diversion benefits achieved
through DSWM’s handling of electronic, household hazardous or other wastes.
It is clear that Denver has significant opportunities for additional diversion. Notably, Table 12 also
demonstrates that the Denver Greenprint goal of reducing landfilled quantities to at least 185,000
tons can be met by generally maintaining the current recycling program and adding an organics
recovery program that diverts 40% of the total yard and food waste generated by residents. In the
40% diversion scenario, approximately 67,000 tons of recyclables and organics would be diverted.

Denver Waste Composition Study Final WCS Report
28
6.0 Recommendations
A number of recommendations are made for Denver’s future waste diversion activities based on the
two-season waste sort and evaluation of annual waste composition. These recommendations should
be a primary component of both DSWM’s Solid Waste Master Plan and its response to the
Greenprint Denver goals.
DEVELOP A CITY-WIDE ORGANICS RECOVERY PROGRAM - diversion of yard and food wastes holds
the biggest diversion potential for Denver.
1. Evaluate and utilize pilot study results:
Preliminary results from the still-ongoing study indicate positive results (i.e.,
approximately 55% of participating households place organics out each collection day;
nearly 32 pounds/set out were observed during the weekly collection and 20-26
pounds/set out were observed during the every-other-week collection).
Contamination of captured organics appears to be very low.
Final pilot study results should be used to project the cost and logistics of a city-wide
program - additional grant or sponsorship funding should be pursued for container
purchase and public outreach.
2. Consider permanent program design:
Carts - the Spring WCS yard waste included primarily grass waste as well as other yard
debris that would, with few exceptions, be small enough to fit into 65- or 95-gallon carts
collected weekly or every-other-week; the same was true of the leaves and miscellaneous
yard debris in the Fall WCS.
Collection frequency - every-other-week collection may be too frequent for many
residents during the winter months (may require education about handling food waste and
not placing organics out on collection day unless cart is at least 50% full).
3. Evaluate phased implementation - the combination of Yard and Food Waste (percent by
weight) was generated in greatest quantities from dumpster routes in the spring (the greatest
amount of Organics are generated during this season), followed by barrel routes. Phased
implementation should consider adding organics collection to dumpster areas first and barrel
areas second.
Note that adding organics recovery as a new service could be “exchanged” with existing
service DSWM would like to reduce, change or remove, such as replacing dumpsters with
carts, reducing Large Item Pick-Up collections or other. An “exchange” of services is one
way to minimize customer concern over changed service, as well as encourage diversion.
4. Evaluate long-term options for compost processing:
The cost of transfer/hauling/tipping associated with A1 Organics’ Keenesburg facility
may not be cost-effective over the life this program - a cost/benefit analysis will be
necessary to fully develop costs.

Denver Waste Composition Study Final WCS Report
29
The city should explore - either on its own or in partnership with a private sector
processor - the ability of developing a compost facility closer to Denver.
Other organics sources should be considered when evaluating future processing options -
such as DIA’s food waste (currently a pilot study), drop-site and seasonal yard waste from
residents and commercial generators and potentially other sources.
EXPANDED PUBLIC OUTREACH - additional focus in the following areas is recommended to
encourage residents to:
1. Leave grass clippings on lawns and practice backyard composting.
2. Use the fall leaf drop program.
3. More effectively recycle paper (especially newspaper and cardboard);
Encourage residents to break down cardboard boxes (they may not understand that
cardboard is fully recyclable in the current program, that cardboard left outside recycling
carts is treated as overflow and landfilled - or they may not be willing to break down
boxes for recycling).
Consider replacing one of the Large Item Pick-Up routes with a cardboard collection
route and/or drop site collection.
Encourage residents to wrap dirty diapers, food scraps and animal feces in plastic bags
that aren’t recyclable (yet) instead of high-valued newspaper (largely contaminated by
Food Waste and Other Organics) - implementation of permanent organics collection with
kitchen pails and biobags is likely to reduce this practice.
RE-EVALUATION OF RECYCLING PARTICIPATION - DSWM should reconsider the use of “number of
recycling subscriptions” as an indicator of actual recycling levels. If information on how waste
composition varies between routes with differing levels of recycling data is still needed by DSWM,
an alternate sampling methodology should be evaluated. As well, set-out data from recycling routes
should be linked to waste collection routes to better correlate recycling and waste practices.
ADDITIONAL WASTE COMPOSITION STUDIES - DSWM obtained good waste composition data from
the sorts conducted in 2008. They yielded detailed information about Yard and Food Waste, and
also provided reasonable data on recyclables still being disposed. While additional WCSs
(especially to evaluate summer and winter waste characteristics) would be beneficial, they are
probably not critical. And if additional studies are conducted after 2009/10, their relativity to 2008
results will probably be limited as well.

APPENDICES | OCTOBER 2010
A MASTER PLAN FOR MANAGING SOLID WASTE IN THE MILE HIGH CITY
APPENDIX H
Refuse, Recycling and Organics Compost Cost Analysis

APPENDIX H - ORGANICS COLLECTION COST OPINION
Project: Denver Solid Waste Management PlanTechnology: Organics Collection - Automated and Semi-AutomatedDate: 3/8/2010 UpdatedCost Estimate Basis: 2010$ - Cost assumptions from Denver, costing manuals & other projectsLocation: Denver, Colorado
ORGANICS COLLECTION EXPANSION COSTSPhase 1 Phase 2 Phase 3 Phase 4 Phase 5
Automated Organics CollectionNo. of Carts/Yr 20,000 40,000 15,000 15,000 10,000New Households in Program 20,000 60,000 75,000 90,000 100,000No. of Routes/Day (April - November) 6 16 20 24 27No. of Routes/Day (Dec - March) 3 8 10 12 14
No. Automated Vehicles Purchase/Yr 6 10 4 4 3Automated Spares - Assume existing vehicles at end of replacement schedule used as sparesAutomated Vehicle Capital Cost $1,440,000 $2,400,000 $960,000 $960,000 $720,000
Annual O&MAmortized Vehicle $283,700 $756,500 $945,600 $1,134,700 $1,276,600
Organics Cart Costs $835,000 $2,000,000 $750,000 $750,000 $500,000less 3300 carts existing; one time
Collection Labor $267,600 $713,700 $892,100 $1,070,500 $1,213,200Weekly (Apr-Nov); EOW (Dec-Mar)
Fleet Maintenance $282,900 $754,400 $943,000 $1,131,600 $1,282,200Weekly (Apr-Nov); EOW (Dec-Mar)
Misc. Cart Delivery $2,300 $4,500 $1,700 $1,700 $1,100 one time
Organics Collection Subtotal $1,671,500 $4,229,100 $3,532,400 $4,088,500 $4,273,100
Phase 1 Phase 2 Phase 3 Phase 4 Phase 5Organics Composting Tip Fee
Organics Diversion Quantities (tons) 1,500 9,800 15,500 22,900 29,500Composting Tip Fees (1) $40,500 $264,600 $418,500 $618,300 $796,500Organics Composting Subtotal $40,500 $264,600 $418,500 $618,300 $796,500
Notes:1. Projected tip fee at Stapleton location; $27 per ton Includes transfer operations from Stapleton, haul and composting fee at A1 Organics facility in Keenesburg.

APPENDICES | OCTOBER 2010
A MASTER PLAN FOR MANAGING SOLID WASTE IN THE MILE HIGH CITY
APPENDIX I
Projected Recyclables Revenues

APPENDIX I - PROJECTED RECYCLABLES REVENUES
2010 2011 2012 2013 2014 2015 2030
Months 120 132 144 156 168 348
Avg Annual Mkt Value $84.28 $84.28 $84.28 $84.28 $84.28 $84.28 $84.28
ONP8 (34%) $84 $84 $84 $84 $84 $84 $84
ONP7 (34%) $74 $74 $74 $74 $74 $74 $74
OCC (10%) $75 $75 $75 $75 $75 $75 $75
Alum (2%) $1,053 $1,053 $1,053 $1,053 $1,053 $1,053 $1,053
Glass (20%) $10 $10 $10 $10 $10 $10 $10
Annual Tons
Sec 7 Tons 29600 400 800 2,300 3,800 5,100 17,800
Sec 8 Tons 1,600 1,700 2,000 2,200 5,200 2,600
Sec 9 Tons 0 1,700 1,700 2,500 2,500
Sec 10 Tons (hauler) 30,700 30,800 31,000 31,100 31,200 33,100
Sec 16 (all 3 sites) 5,200
Sec 17 (PAYT ‐ low) 7,400
Sec 17 (PAYT ‐ hi) 11,900
Base Payment ($33/ton X 95%)
Sec 7 Tons $928,000 $12,500 $25,100 $72,100 $119,100 $159,900 $558,000
Sec 8 Tons $0 $50,200 $53,300 $62,700 $69,000 $163,000 $81,500
Sec 9 Tons $0 $0 $53,300 $53,300 $78,400 $78,400 $0
Sec 10 Tons (hauler) $0 $962,400 $965,600 $971,900 $975,000 $978,100 $1,037,700
Sec 16 (all 3 sites) $163,000
Sec 17 (PAYT) $232,000
Sec 17 (PAYT ‐ hi) $373,100
Up‐Market Payment (> BMV)
BMV $80.70
Sec 7 Tons $53,000 $700 $1,400 $4,100 $6,800 $9,100 $31,900
Sec 8 Tons $2,900 $3,000 $3,600 $3,900 $9,300 $4,700
Sec 9 Tons $0 $3,000 $3,000 $4,500 $4,500 $0
Sec 10 Tons (hauler) $0 $0 $0 $0 $0 $0
Sec 16 (all 3 sites) $9,300
Sec 17 (PAYT) $13,200
Sec 17 (PAYT ‐ hi) $21,300
Total Payment
Sec 7 Tons $981,000 $13,200 $26,500 $76,200 $125,900 $169,000 $589,900
Sec 8 Tons $53,100 $56,300 $66,300 $72,900 $172,300 $86,200
Sec 9 Tons $0 $56,300 $56,300 $82,900 $82,900 $0
Sec 10 Tons (hauler) $962,400 $965,600 $971,900 $975,000 $978,100 $1,037,700
Sec 16 (all 3 sites) $172,300
Sec 17 (PAYT) $245,200
Sec 17 (PAYT ‐ hi) $394,400
Percentage Base Payment
Sec 7 Tons 95% 95% 95% 95% 95% 95%
Sec 8 Tons 95% 95% 95% 95% 95% 95%
Sec 9 Tons 0% 95% 95% 95% 95% #DIV/0!
Sec 10 Tons (hauler) 100% 100% 100% 100% 100% 100%

APPENDICES | OCTOBER 2010
A MASTER PLAN FOR MANAGING SOLID WASTE IN THE MILE HIGH CITY
APPENDIX J
LIP, Overflow and Litter Collection Cost Analysis

APPENDIX J - LIP, OVERFLOW LITTER COST OPINION
Project: Denver Solid Waste Management PlanTechnology: Large Item Pickup and OverflowDate: 3/8/2010 UpdatedCost Estimate Basis: 2010$ - Cost assumptions from Denver, costing manuals & other projectsLocation: Denver, Colorado
LARGE ITEM PICKUP (LIP)Phase 1 Phase 2 Phase 3 Phase 4 Phase 5
General LIP Frequency 6 6 4 4 4Estimated Quantities (tons) 4,800 4,200 3,900 3,400 3,100Collection Routes 4 4 3 3 3Rearloader Capital Cost - Use existing rear loaders
Annual O&MFixed Charges $145,200 $145,200 $145,200 $145,200 $145,200
Variable Charges $1,104,000 $1,104,000 $736,000 $736,000 $736,000Waste Disposal $76,800 $67,200 $62,400 $54,400 $49,600
General LIP Subtotal $1,326,000 $1,316,400 $943,600 $935,600 $930,800
Currently 5 rearloaders are dedicated to routes and 3 spares.At least 3 rearloaders currently in the fleet do not need to be replaced.
Savings of $86,800 per year in amortized rearloader capital
No change to Night LIP and Special Districts LIP (not included). These costs remain the same.
OVERFLOWPhase 1 Phase 2 Phase 3 Phase 4 Phase 5
Overflow Collection Frequency 17 4 4 4 0Est. Refuse Quantities* (tons) 12,000 10,800 10,100 9,200 8,500Rearloader Capital Cost - Use existing rear loaders
Annual O&MOverflow Labor $567,200 $377,100 $377,100 $377,100 $0
Fleet Maintenance $157,700 $114,200 $114,200 $114,200 $0Waste Disposal $192,000 $172,800 $161,600 $147,200 $0
Overflow Total $916,900 $664,100 $652,900 $638,500 $0
*Refuse in 2015 managed through curbside collection, litter management, and drop sites.
LITTER MANAGEMENTPhase 1 Phase 2 Phase 3 Phase 4 Phase 5
Estimated Quantities (tons) 2,400 2,100 2,000 1,800 1,600Rearloader Capital Cost - Use existing rear loaders from LIP and Overflow programsEnforcement Hours: Personnel FTE 0.5 0.6 0.6 0.5 0.3
Annual O&MEnforcement Labor $31,200 $37,400 $37,400 $31,200 $18,700
Collection Labor $191,600 $191,600 $191,600 $191,600 $191,600Fleet Maintenance $88,400 $88,400 $88,400 $88,400 $88,400
Waste Disposal $38,400 $33,600 $32,000 $28,800 $25,600Litter Management Total $349,600 $351,000 $349,400 $340,000 $324,300

APPENDIX J - LARGE ITEM PICKUP, OVERFLOW, LITTER COST ASSUMPTIONS
Project: Denver Solid Waste Management PlanTechnology: Large Item Pickup and OverflowDate: 3/8/2010 UpdatedCost Estimate Basis: 2010$ - Cost assumptions from costing manuals & other projectsLocation: Denver, Colorado
INPUT ASSUMPTIONSInterest Rate 5%Annual Escalation Rate 3% (from year 2009 to 2010)Average Disposal Cost (2010$) $16 per ton
Large Item Pickup (LIP)Manual collection with up to 2 workersDriver (Equip. Operator) = $35,491 Step 5 of EO (2009$ escalated at 3%)
Laborer (Sr. Utility Worker) = $33,943 Step 5 of SUW (2009$ escalated at 3%)38% benefits
Fleet MaintenanceRear loader $3.86 per mile (Rearloaders - LIP, 2009$ escalated at 3%)
Dump truck with plow $2.77 per mile (Dump truck, 2009$ escalated at 3%)Pick-up $8,800 per pick-up (based on 10-month 2009$ & # pickups)
Rear Loader Capital $187,000 per vehicle (2009$ purchase escalated)Vehicle Replacement Schedule 8 years
Year 2010 Budget Total LIPNight LIP
(est.)
Special District LIP
(est.) General LIPLabor $1,087,687 $776,687
Fixed Labor (estimate) $96,000 $96,000 $119,000 supervisor & on-callOther Services $25,500 $25,500 excludes disposal
Fleet Maint Straight Charge $730 $730Fleet Maintenance $382,343 $34,000 $23,000 $325,343 estimated Night & SD
$1,496,260 $130,000 $119,000 $1,247,260
General LIP (Fixed Charges) $145,200General LIP (Variable Charges) $1,102,030 $184,000 per LIP frequency
OverflowManual collection with 2 workers
Driver (Equip. Operator) $35,491 Step 5 of EO (2009$ escalated at 3%)Laborer (Sr. Utility Worker) $33,943 Step 5 of SUW (2009$ escalated at 3%)
On-Call (Utility Worker) $31,046 Step 5 of UW (2009$ escalated at 3%)38% benefits
Fleet Maintenance - Rearloader $3.86 per mile (Rearloaders, 2009$ escalated at 3%)Rearloader $35,400 per vehicle (based on 2009$ annual fleet maintenance per route)
2010 & 2011 2012 2015Barrel HHs 55900 99200 179500
Driveby/HH/year 17 4 0Collection Routes (year-round) 4 3 0 44 miles/day/route
Add'l Collection Routes(summer) 2 1 0 4 days/weekNo. of Route Rearloaders 9 4 0No. of Spare Rearloaders 1 1 0
LaborEquipment Operator 3 3 0Senior Utility Worker 5 3 0
Senior Utility Worker - rotation 1 1 0Oncall Utility Worker 3.25 1 0
Barrel routes only; # barrel routes increasing through short-term period

APPENDIX J - LARGE ITEM PICKUP, OVERFLOW, LITTER COST ASSUMPTIONS
2009$ Fleet Maint. Budget $392,0002009$ Labor Budget $867,000 (3 EO; 9 SUW; 3 SUW-rotation; 4.6 OUW)
Litter Collection Litter increase due to reduced LIP and conversion to barrelsAssume # routes 2 rotated through all collection areas
55 miles/day/route4 days/week
Assume 2-worker crew:Driver (Equip. Operator) $35,491 Step 5 of EO (2009$ escalated at 3%)
Laborer (Sr. Utility Worker) $33,943 Step 5 of SUW (2009$ escalated at 3%)38% benefits
Fleet Maintenance - Rearloader $3.86 per mile (Rearloaders, 2009$ escalated at 3%)Rearloader $35,400 per vehicle (based on 2009$ annual fleet maintenance per route)
Enforcement applies to LIP, overflow and litter management. Enforcement included under ongoing litter management since LIP and Overflow reduced.
Enforcement (Assoc City Insp) $45,204 Step 5 plus 3% escalation to 201038% benefits
Hours estimated from # barrel households and approximate time/complaint

APPENDICES | OCTOBER 2010
A MASTER PLAN FOR MANAGING SOLID WASTE IN THE MILE HIGH CITY
APPENDIX K
Short‐Term Drop‐Site Collection Cost Analysis

APPENDIX K - DROP-OFF SITES CAPITAL IMPROVEMENT COSTS
Project: Denver Solid Waste Management PlanTechnology: Drop-Off Site Collection Standard LocationDate: 3/8/2010 UpdatedCost Estimate Basis: 2010$ - Cost assumptions from costing manuals & other projectsLocation: Denver, Colorado
CAPITAL COST PER DROP-SITE
Item Quantity Units Unit Cost TotalLand Purchase (1) 0.5 Acres $0 $0Final Grading (1) 2420 SY $3 $7,300Concrete Pad (2) 45 CY $350 $15,750Steel Rails (3) 3 sets $1,000 $3,000Crushed Rock/Gravel (4) 2220 SY $10 $22,200Access Stairs/Platform 3 EA $2,000 $6,000Drop-Site Signage 2 EA $500 $1,000Security Fencing (5) 590 LF $24 $14,200Personnel Convience Building (6) 1 EA $10,000 $10,000
Subtotal Site Improvements $79,450Contingency (10%) $7,950
Drop-Site Improvements $87,400
Covered Recycling Roll-Off 1 EA $6,000 $6,000Organics Roll-Off 1 EA $5,000 $5,000Large Items Roll-Off 1 EA $5,000 $5,000
Subtotal Mobile Equipment $16,000Contingency (10%) $1,600
Mobile Equipment $17,600
Total Drop-Site Capital Cost Per Location $105,000
Assumptions:1 Land assumed to be existing city property or donated use.
Area estimated for 4 roll-offs (3 plus spare) plus manuevering & expansion.2 Concrete slab on grade under roll-offs and tractor approach (10' x 60' x 8" thick).3 Steel rails to be placed under each roll-off container - 2 rails per set.4 Crushed rock/gravel cover over remaining area.5 Perimeter 6-ft chain link fence and gate.6 Pre-fabricated convience building (8' x8') installed. Electricity assumed available at site(s) selected.
If drop sites co-located with other facilities or functions, this can be eliminated.
DROP-SITE PROGRAM SHARED EQUIPMENT
Item Quantity Units Unit Cost TotalCovered Recycling Roll-Off 1 EA $6,000 $6,000Organic/Large Item Roll-Off 1 EA $5,000 $5,000Roll-off Truck 1 EA $125,000 $125,000
Subtotal $136,000Contingency (10%) $13,600
Total Drop-Site Shared Capital Costs $149,600

APPENDIX K - DROP-OFF SITE HAULING COSTS
Project: Denver Solid Waste Management PlanTechnology: Drop-Off Site Collection
Standard LocationDate: 3/8/2010 UpdatedCost Estimate Basis: 2010$ - Cost assumptions from costing manuals & other projectsLocation: Denver, Colorado
DROP SITES MRF Organics LIP MRF Organics LIP Comments
No 40-CY Containers: 2 1 1 2 1 1 Container Payload (tons): 3.7 6.0 3.4 3.7 6.0 3.4 Avg Product Density; 85% full
Tonnages (tpy): 2015 1,700 1,100 300 800 500 200 Hook-Up/Unload Time (min): 30 20 30 30 20 30 One-Way Distance (miles) 15 12 14 8 12 25Average Speed (mph): 40 50 30 40 50 45 Average Trips/Year: 460 184 89 217 84 59 Average Trips/Month: 38.4 15.4 7.5 18.1 7.0 5.0 Average Trips/Week: 8.9 3.6 1.8 4.2 1.7 1.2 Hours Per Trip 1.3 0.8 1.4 0.9 0.8 1.6 Weekly Freight Hours: 11.1 2.9 2.6 3.8 1.4 1.9 Wkly Veh Inspect/Breaks: 2.1 0.5 0.5 0.7 0.3 0.4 Ratio to freight hours
Annual Freight Hours: 578.5 152.3 134.2 196.6 71.9 100.5 Freight hours for vehicle operations
Total Miles/Yr 13,800 4,416 2,492 3,472 2,016 2,950
Annual Costs Assumptions:Maintenance, Repairs, Tires & Fuel
Denver Fleet Maintenance (based on miles) $2.74 $2.74 $2.74 $2.74 $2.74 $2.74
Uses Transfer Tractor fleet maint. at $2.66/mile (Rollof had only 2138 miles per 10 month period)
Driver LaborDriver % (based on freight time) 34% 9% 8% 12% 5% 6%Driver annual salary $35,491 $35,491 $35,491 $35,491 $35,491 $35,491 DSWM Equipment Operator
Fringe benefits (% of salary) 38% 38% 38% 38% 38% 38%Truck Amortization - Included with Drop Sites Capital CostRecycling Roll-Off Container Purchase - Included with Drop Sites Capital CostInsurance (per yr/RO truck)@ 3% $ - Included with Fleet Maintenance Estimate % of capital cost
License&Taxes (per yr/RO truck)@1.5% $ - Included with Fleet Maintenance Estimate % of capital cost
Annual Recycling Haul Costs: MRF Organics LIP MRF Organics LIPAvg. Total Comments
Maintenance, Repairs, Tires & Fuel $37,800 $12,100 $6,800 $9,500 $5,500 $8,100 Mileage BasedDriver Labor $16,700 $4,400 $3,900 $5,900 $2,400 $2,900 Time BasedTruck Replacement $0 $0 $0 $0 $0 $0 In Capital CostsRoll-Off Container Amortization $0 $0 $0 $0 $0 $0 In Capital CostsInsurance $0 $0 $0 $0 $0 $0 In Fleet MaintenanceLicensing & Taxes $0 $0 $0 $0 $0 $0 In Fleet Maintenance
Haul Cost $54,500 $16,500 $10,700 $15,400 $7,900 $11,000 $116,000
Haul Cost/Ton $32.10 $15.00 $35.70 $19.30 $15.80 $55.00 $25.20
Total Haul Cost/Pull $118 $90 $120 $71 $94 $186 $106
SE Quadrant Drop-Site NW Quadrant Drop-Site
CVPC Drop-SiteCCTS Drop-Site

APPENDIX K - DROP-OFF SITE ANNUAL COSTS
Project: Denver Solid Waste Management PlanTechnology: Drop-Off Site Collection Standard LocationDate: 1/21/2010Cost Estimate Basis: 2010$ - Cost assumptions from costing manuals & other projectsLocation: Denver, Colorado
Item Description Quantity Units Unit Cost TotalLABOR
Job Classification Qty Labor Rate Hrs/Yr TotalSenior Utility Worker 1 $22.50 2080 hrs 46,800$
Subtotal 46,800$ Notes:
Labor rate assumes fringe benefits 38%SUW annual rate (step 5) = $33,943 (without benefits; escalate 3% to year 2010)
SITE MAINTENANCE & UTILITIESItem Quantity Unit Price TotalSite Maintenance 1.50% $87,400 1,300$ Building Repair & Depreciation 3.33% $10,000 300$ Electricity 1,500 kwh $0.10 200$ Heating (Space Heater) 2,100 kwh $0.10 200$ Sanitary Service 1 port-a-let service/month $200 /month 2,400$ Water 0 No on-site water; minimal bottled water -$ Mobile Phone 1 phone $60 /month 700$
Subtotal 5,100$ Notes:
Building lighting based on 1.66 watts/sf 2080 hours/yearSite Lighting 2 1000W Lights 620 hours/year
ANNUAL TOTAL 51,900$

APPENDICES | OCTOBER 2010
A MASTER PLAN FOR MANAGING SOLID WASTE IN THE MILE HIGH CITY
APPENDIX L
Public Education Cost Analysis

APPENDIX L - PUBLIC EDUCATION COST OPTIONS
General Menu of Education Options and Cost Estimates
1 Direct mail per household under 10,000 Per household over 10,000 All residents
a Direct mail 1 page brochure 0.57$ 0.50$ 0.35$
b multiple page brochure 0.98$ 0.78$ 0.49$
2 Flyers/Posters/audit tags 0.25$ 0.22$ 0.18$
Total Campaign Cost
3 Print Advertising ‐ local 3,500.00$ per round approx. one ad in 8‐10 neighborhood publications
4 Print Advertising ‐ daily need to get updated pricing but don't envision using this option much
5 Radio Advertising 5,000.00$ for about 200 runs in one month ‐ varies per station
6 TV/Cable Advertising 15,000.00$ minimum buy ‐ give minimal coverage
7 Web 10,000.00$ investment in more interactive technology
8 Social networking sites/blog minimal cost/staff time
9 Staff Time ‐ 1 new program coordinators 76,180.00$ Labor Category = Prog Admin 2009 Step #5,
escalated 3% to 2010, plus 38% benefits
10 Required Public Notices 2,000.00$
11 Truck signs 1,200.00$ per round of messages = minimum of 5
12 Professional Services ‐ Design 25,000.00$ Annually
Note costs are average based on low and high range and are based on best current knowledge.
Split on across‐the‐board options ‐ these are all in the per‐household costs
7 options 10 options 11 options 11 options 12 options
2011 2012 2013 2014 2015
2011 15,882.86$ 11,118.00$ 10,107.27$ 10,107.27$ 9,265.00$

APPENDIX L - ANNUAL PUBLIC EDUCATION COSTS
SHORT‐TERM OPTION EVALUATION Phase 1 Phase 2 Phase 3 Phase 4 Phase 5
7.0 Standardize Automated Collection & Provide Recyclable/Organics Diversion to Full Service Area (0‐7 units)
Automate 70.7% current manual customers (~34.3k hhs) 10% 25% 20% 25% 20%
number of homes to reach 3700 9300 7400 9300 7400
Options recommended 1a, 2 1a, 2 1a, 2 1a, 2 1a, 2
Estimated cost per household 0.82$ 0.82$ 0.82$ 0.72$ 0.72$
Total estimated cost 18,916.86$ 18,744.00$ 16,175.27$ 16,803.27$ 14,593.00$
Automate 87.5% current dumpster customers (~ 57.1k hhs) 10% 25% 20% 25% 20%
number of homes to reach 6200 15600 12500 15600 12500
Options recommended 1a, 2 1a,2 1a, 2 1a, 2 1a, 2
Estimated cost per household 0.82$ 0.82$ 0.82$ 0.82$ 0.82$
Total estimated cost 20,966.86$ 23,910.00$ 20,357.27$ 22,899.27$ 19,515.00$
Semi‐automate "narrow alley" manual (14.2k hhs) & dumpster (8.1k
hhs) (total homes 22,300)Match needs as automation implemented for manual
number of homes to reach 2400 6100 4900 6100 4900
Options recommended 1a, 2 1a, 2 1a, 2 1a, 2 1a, 2
Estimated cost per household 0.82$ 0.82$ 0.82$ 0.82$ 0.82$
Total estimated cost 17,850.86$ 16,120.00$ 14,125.27$ 15,109.27$ 13,283.00$
Total # homes to reach each year 12,300 31,000 24,800 31,000 24,800
Total estimated cost per year 57,734.57$ 58,774.00$ 50,657.82$ 54,811.82$ 47,391.00$
Recycling carts to growing number of voluntary subscribers ‐ overlap
w/ switch to automation where possible
(approx 19,700 hhs added 2010‐2015)
20% 20% 20% 20% 20%
number of homes to reach 4600 4600 4600 4600 4600
Options recommended 1a, 2, 3, 5 1a, 2, 3, 5 1a, 2, 3, 5 1a, 2, 3, 5 1a, 2, 3, 5
Estimated cost per household 2.67$ 2.67$ 2.67$ 2.67$ 2.67$
Total estimated cost 28,154.86$ 23,390.00$ 22,379.27$ 22,379.27$ 21,537.00$
Organics carts to voluntary subscribers ‐ overlap w/ switch to
automation where possible (approx 97,700 hhs added 2010‐2015) 20% 40% 15% 15% 10%
number of homes to reach 20000 40000 15000 15000 10000
Options recommended 1a,2,3,5,6,11 1a,2,3,5,6,11 1a,2,3,5 1a,2,3,5 1a,2,3
Estimated cost per household 2.87$ 2.10$ 1.54$ 1.54$ 1.18$
Total estimated cost 73,373.95$ 95,291.59$ 33,189.77$ 33,189.77$ 21,047.40$

APPENDIX L - ANNUAL PUBLIC EDUCATION COSTS
SHORT‐TERM OPTION EVALUATION Phase 1 Phase 2 Phase 3 Phase 4 Phase 5
8.0 Evaluate Policy for LIP, Overflows & Late Set‐Outs
Policy to reduce free service to 1/quarter (1/9 weeks as of Jan 2010) None None Reduce to
1/quarter
Maintain Maintain
number of homes to reach 0 0 168000
Options recommended 0 0 1b Wastewise Wastewise
Estimated cost per household 0 0 $ 0.51
Total estimated cost 0 0 $ 85,820.00
Policy to eliminate free overflow collections (1 OF every 3 wks Jan
2010) ‐ move to fee‐, appointment‐based 60K home?
None Reduce to 1 OF
every 3 mths
None None Eliminate free
OF
number of homes to reach 0 60000 0 0 60000
Options recommended 0 1 a, 2 0 0 1a,2
Estimated cost per household 0 $ 0.89 0 0 $ 0.87
Total estimated cost 0 $ 53,307.27 0 0 $ 52,465.00
Identify needs for enforcement 10% 50% 10% Maintain 30%
Options recommended Use Wastewise to
inform residents
about changes?Identify needs for clean alleys (57% of trash hhs served in alleys) 10% 50% 10% Maintain 30%

APPENDIX L - ANNUAL PUBLIC EDUCATION COSTS
SHORT‐TERM OPTION EVALUATION Phase 1 Phase 2 Phase 3 Phase 4 Phase 5
9.0 Implement Two Drop‐Site Collection for Large Items, Recyclables & Organics (0‐7 units) at CCTS & Central Platte Valley Campus
Add two drop sites None First DOC None Second DOC None
number of homes to reach
0 Promote
Citywide
continued
promotion of
First site
ongoing
Options recommended 0 3, 5 6 3, 5 3,5,6 3,5
Estimated cost per household 0 N/a n/a n/a n/a
Total estimated cost 0 34,618.00$ 18,607.27$ 33,607.27$ 17,765.00$
10.0 Implement Private Hauler Requirements (applies only to all MFUs>7 units except as noted)
Licensing for all "rubbish" haulers (see Chapter 48 SOLID WASTE) =
registration with fee (fee may not be determined in SWMP)
None None Implement fully None None
Reporting requirements for all haulers None None Implement fully None None
Policy for all haulers to offer recyclables & organics collection from
voluntary customers plus restaurants
None None Implement fully None None
Policy for restaurants w/ certain criteria to divert organics (includes
coordination with haulers)
None None None Implement fully
(0.5 FTE
trainer)
None (0.5 FTE
trainer)
Identify needs for enforcement None None 50% 50% Maintain
Identify needs for tracking data (assume annual requirement w/ 1‐yr
delay before data is submitted)
None None 60% 40% Maintain
Total estimated cost (Pgm Coor step #4, 3% esc, 38% benefits) 0 ‐$ ‐$ $33,335 $33,335
12.0 Implement Capacity Assessment for >7 Unit Residential Trash/LIP Generators
Policy for generators to provide proof of storage capacity & collection
service ‐ coordinate w/ hauler requirement to collection
recyclables/organics from non‐residential generators None None None None I00%
Identify needs for verification & enforcement None None None None 100%

APPENDIX L - ANNUAL PUBLIC EDUCATION COSTS
SHORT‐TERM OPTION EVALUATION Phase 1 Phase 2 Phase 3 Phase 4 Phase 5
13.0 Maintain HHW Contract Collection Service
Continue current service, expanded to match population As needed to match population
number of homes to reach need to outreach citywide
Options recommended 3 and 5
Estimated cost per household n/a
Total estimated cost 27,882.86$ 23,118.00$ 22,107.27$ 22,107.27$ 21,265.00$
Add policy for paint collection at retail locations None None Implement fully Maintain full implementation
number of homes to reach citywide citywide citywide
Options recommended 3 and 5 3 and 5 3 and 5
Estimated cost per household n/a n/a n/a
Total estimated cost $ 29,107.27 $ 29,107.27 $ 28,265.00
Expand Public Education Program ‐ to support each of short‐term options aboveBritton/Anne/Charlotte ‐ to addBritton/Anne/Charlotte ‐ please add
Annual Total 187,146.24$ 288,498.87$ 261,868.68$ 228,537.68$ 243,070.40$

APPENDICES | OCTOBER 2010
A MASTER PLAN FOR MANAGING SOLID WASTE IN THE MILE HIGH CITY
APPENDIX M
Long‐Term Drop‐Site Analysis

APPENDIX M - DROP-OFF SITES CAPITAL IMPROVEMENT COSTS
Project: Denver Solid Waste Management PlanTechnology: Drop-Off Site Collection Standard LocationDate: 3/8/2010 UpdatedCost Estimate Basis: 2010$ - Cost assumptions from costing manuals & other projectsLocation: Denver, Colorado
CAPITAL COST PER DROP-SITE
Item Quantity Units Unit Cost TotalLand Purchase (1) 0.5 Acres $0 $0Final Grading (1) 2420 SY $3 $7,300Concrete Pad (2) 45 CY $350 $15,750Steel Rails (3) 3 sets $1,000 $3,000Crushed Rock/Gravel (4) 2220 SY $10 $22,200Access Stairs/Platform 3 EA $2,000 $6,000Drop-Site Signage 2 EA $500 $1,000Security Fencing (5) 590 LF $24 $14,200Personnel Convience Building (6) 1 EA $10,000 $10,000
Subtotal Site Improvements $79,450Contingency (10%) $7,950
Drop-Site Improvements $87,400
Covered Recycling Roll-Off 1 EA $6,000 $6,000Organics Roll-Off 1 EA $5,000 $5,000Large Items Roll-Off 1 EA $5,000 $5,000
Subtotal Mobile Equipment $16,000Contingency (10%) $1,600
Mobile Equipment $17,600
Total Drop-Site Capital Cost Per Location $105,000
Assumptions:1 Land assumed to be existing city property or donated use.
Area estimated for 4 roll-offs (3 plus spare) plus manuevering & expansion.2 Concrete slab on grade under roll-offs and tractor approach (10' x 60' x 8" thick).3 Steel rails to be placed under each roll-off container - 2 rails per set.4 Crushed rock/gravel cover over remaining area.5 Perimeter 6-ft chain link fence and gate.6 Pre-fabricated convience building (8' x8') installed. Electricity assumed available at site(s) selected.
If drop sites co-located with other facilities or functions, this can be eliminated.
ADDITIONAL THIRD DROP-SITE EQUIPMENT
Item Quantity Units Unit Cost TotalCovered Recycling Roll-Off 1 EA $6,000 $6,000Organic/Large Item Roll-Off 1 EA $5,000 $5,000Roll-off Truck 1 EA $125,000 $125,000
Subtotal $136,000Contingency (10%) $13,600
Total 3rd Drop-Site Equipment Capital Costs $149,600

APPENDIX M - DROP-OFF SITE HAULING COSTS
Project: Denver Solid Waste Management PlanTechnology: Drop-Off Site Collection
Standard LocationDate: 3/8/2010 UpdatedCost Estimate Basis: 2010$ - Cost assumptions from costing manuals & otheLocation: Denver, Colorado
DROP SITES MRF Organics LIP
No 40-CY Containers: 1 1 1 Container Payload (tons): 3.7 6.0 3.4
Tonnages (tpy): 2030 2,400 1,500 500 Hook-Up/Unload Time (min): 30 20 30 One-Way Distance (miles) 8 5 17Average Speed (mph): 40 40 45 Average Trips/Year: 649 250 148 Average Trips/Month: 54.1 20.9 12.4 Average Trips/Week: 12.5 4.9 2.9 Hours Per Trip 0.9 0.6 1.3 Weekly Freight Hours: 11.3 2.9 3.6 Wkly Veh Inspect/Breaks: 2.1 0.5 0.7 Annual Freight Hours: 585.0 148.6 189.3 Total Miles/Yr 10,384 2,500 5,032
Annual Costs Assumptions:Maintenance, Repairs, Tires & Fuel
Denver Fleet Maintenance (based on miles) $2.74 $2.74 $2.74
Driver LaborDriver % (based on freight time) 34% 9% 11%Driver annual salary $35,491 $35,491 $35,491Fringe benefits (% of salary) 38% 38% 38%
Truck Amortization - Included with Drop Sites Capital CostRecycling Roll-Off Container Purchase - Included with Drop Sites Capital CostInsurance (per yr/RO truck)@ 3% $ - Included with Fleet MaintenanceLicense&Taxes (per yr/RO truck)@1.5% $ - Included with Fleet Maintenance
Annual Recycling Haul Costs: MRF Organics LIP Avg. Total
Maintenance, Repairs, Tires & Fuel $28,500 $6,800 $13,800Driver Labor $16,700 $4,400 $5,400Truck Replacement $0 $0 $0Roll-Off Container Amortization $0 $0 $0Insurance $0 $0 $0Licensing & Taxes $0 $0 $0
Haul Cost $45,200 $11,200 $19,200 $204,000
Haul Cost/Ton $18.80 $7.50 $38.40 $21.50
Total Haul Cost/Pull $70 $45 $130 $90
Northeast Drop-Site
Northeast Drop-Site

APPENDICES | OCTOBER 2010
A MASTER PLAN FOR MANAGING SOLID WASTE IN THE MILE HIGH CITY
APPENDIX N
Transfer Station Cost Analysis
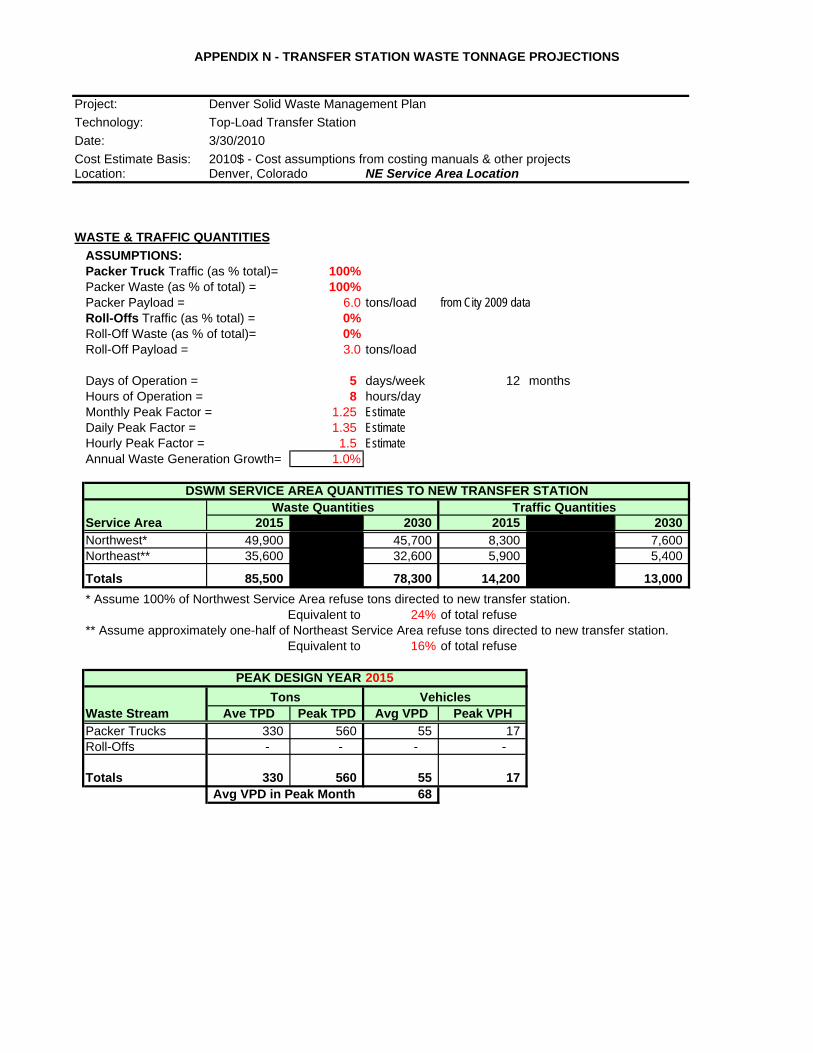
APPENDIX N - TRANSFER STATION WASTE TONNAGE PROJECTIONS
Project: Denver Solid Waste Management Plan
Technology: Top-Load Transfer Station
Date: 3/30/2010
Cost Estimate Basis: 2010$ - Cost assumptions from costing manuals & other projectsLocation: Denver, Colorado NE Service Area Location
WASTE & TRAFFIC QUANTITIES
ASSUMPTIONS:Packer Truck Traffic (as % total)= 100%Packer Waste (as % of total) = 100%Packer Payload = 6.0 tons/load from City 2009 dataRoll-Offs Traffic (as % total) = 0%Roll-Off Waste (as % of total)= 0%Roll-Off Payload = 3.0 tons/load
Days of Operation = 5 days/week 12 monthsHours of Operation = 8 hours/dayMonthly Peak Factor = 1.25 EstimateDaily Peak Factor = 1.35 EstimateHourly Peak Factor = 1.5 EstimateAnnual Waste Generation Growth= 1.0%
DSWM SERVICE AREA QUANTITIES TO NEW TRANSFER STATIONWaste Quantities Traffic Quantities
Service Area 2015 2025 2030 2015 2025 2030Northwest* 49,900 47,100 45,700 8,300 7,900 7,600 Northeast** 35,600 33,600 32,600 5,900 5,600 5,400
Totals 85,500 80,700 78,300 14,200 13,500 13,000
* Assume 100% of Northwest Service Area refuse tons directed to new transfer station.Equivalent to 24% of total refuse
** Assume approximately one-half of Northeast Service Area refuse tons directed to new transfer station.Equivalent to 16% of total refuse
2015
Waste Stream Ave TPD Peak TPD Avg VPD Peak VPHPacker Trucks 330 560 55 17 Roll-Offs - - - -
Totals 330 560 55 17 Avg VPD in Peak Month 68
PEAK DESIGN YEAR
Tons Vehicles

APPENDIX N - TRANSFER STATION WASTE TONNAGE PROJECTIONS
Project: Denver Solid Waste Management Plan
Technology: Top-Load Transfer Station
Date: 3/30/2010
Sizing Basis: Solid Waste Projections and Northwest and Northeast Service Areas TonnagesLocation: Denver, Colorado NE Service Area Location
TRANSFER STATION BUILDING SIZE CALCULATIONSSummary Length Width
DESIGN SIZE (Peak Day) = 560 TPDFACILITY SIZE = 8,800 SF 80 110
Tipping Floor Size = 7,500 SF 80 94 Loadout Area Size = 1,300 SF 80 16
Outside Manuevering Area Size = 6,400 SF 80 80 Average Bldg Footing Depth = 6 FT
Push Wall Height = 12 FT
TRANSFER TYPE = TOP LOAD
I. ESTIMATE INTERIOR VEHICLE UNLOADING SPACE REQUIREDAssumptions: 1. Unloading distance required approx. 30 feet. (Utilized in LENGTH)
2. Assume outside manuevering space (> Storage or Unloading dist.)at width of stalls required by 80 feet. Minimum of 60 feet.
UNLOADING AREA FOR DESIGN YEARPEAK UNLOAD STALLS WIDTH/ WIDTH SQ. FT.
Waste Stream VPH TIME REQ'D. STALL REQ'D. FT REQ'D. Packer Trucks 17 6 1.7 16Roll-Offs 0 10 0.0 0
12 Totals 17 NA 2 NA 28 840
II. ESTIMATE TIPPING FLOOR WASTE STORAGE SIZE
STORAGE AREA FOR DESIGN YEARAverage Storage DENSITY CU. FT. SQ. FT. LENGTH
Waste Stream TPD TPD LB/CU.FT. STORAGE REQ'D. REQ'D. FT (7)Packer Trucks 330 330 15 44,000 Roll-Offs 0 0 13 -
Totals 330 330 NA 44,000 5,490 70
Assumptions: 1. Size to store average tons in 2015 at 1 day avg waste.2. Effective average pile height at 10 feet. Assume push wall height of 12 feet. Side Slopes are 1:1 (horizontal to vertical)3. Width required (hoppers versus tipping) = 65 feet VERSUS 28 feet4. Aisle width required for loader 12 feet
ADD AISLE WIDTH REQUIRED FOR LOADER TO LENGTH REQUIRED. WIDTH = 80 FT (Unloading Bays)LENGTH = 94 FT (Max of Unloading or Storage Distance)
Tipping Floor Area = 7,500 square feet
Outside Manuevering Area = 6,400 square feet
Columns, Door Framing, & Person Door

APPENDIX N - TRANSFER STATION WASTE TONNAGE PROJECTIONS
III. LOWER LEVEL LOADOUT AREAOPEN TOP TRANSFER OPTION
Assumptions: 1. Open-top load-out2. Typical # of Trailer Loads per hour = 3.0 loads/hour/hopper3. Trailer payload estimated to be avg. 20 tons/container load.4. Hours of transfer operation = 8 hours.
AVERAGE PEAKOUT OUT
Waste Stream TPD TPD TPHPacker Trucks 330 560 Roll-Offs 0 -
Total 330 560 60 Peak Trailer Loads/Day 28 No. Loadout Hoppers 1
Size Loadout Area: 1. Number of traffic lanes required. 1 2. Total tunnel width = 16 feet wide.
12 feet per lane 2 feet clearance each side lane3. Width for Tamping Cranes 0 feet.4. Required Loadout Length = 65 feet for trailer single lane
45 feet trailer length5. Total Loadout Length = 65 feet.
Loadout Area = 1,300 square feet
LOADOUT DATA FOR YEAR 2015

APPENDIX N - TRANSFER STATION WASTE TONNAGE PROJECTIONS
ITEM DESCRIPTION QUANTITY UNIT UNIT PRICE TOTAL PRICESite Acquisition
Land - Assume City Owned 4 acre $0 $0Site Work
Bonds, Mobilization and Insurance 4% of WORK $2,054,000 $82,000Demolition 1 LS $50,000 $50,000Clearing and Grubbing 4 acre $2,000 $8,000Site Grading - General (1 FT across site) 6,500 CY $3 $19,500Earthwork/Structural Fill (Building Area) 1,300 CY $10 $13,000Earthwork/Structural Fill (Man'vg Area) 900 CY $10 $9,000Excavation - Loadout Tunnel (Grade Diff.) 2,300 CY $5 $11,500Site Retaining Walls (at Loadout) 280 CY $450 $126,000Roadways - Paved 2,800 SY $23 $64,400Erosion Control/Stormwater Management 1 LS $50,000 $50,000Landscape and Planting 1 Allowance $20,000 $20,000Misc Site (Signage, Sidewalks, etc.) 1 LS $5,000 $5,000Surveying 1 LS $25,000 $25,000Site Utilities
Water Supply & Fire Protection 1 LS $75,000 $75,000Sanitary Sewer 1 LS $50,000 $50,000
Natural Gas System 1 LS $10,000 $10,000Electrical 1 LS $100,000 $100,000
Site Lighting 5 EA $3,000 $15,000Chain Link Security Fence (6' high) 1,700 LF $22 $37,400Chain Link Gate (cantilever, automatic) 1 EA $9,500 $9,500
Concrete & FoundationsFoundation Excavation/Structural Fill 600 CY $10 $6,000Manuevering Area Paving - Concrete 710 SY $55 $39,100TS Loadout Approaches - Concrete 200 SY $55 $11,000Building Foundations 70 CY $350 $24,500Concrete Aprons @ Roll-Up Doors 70 CY $350 $24,500Building Retaining Walls - Lower Level 140 CY $450 $63,000Concrete Floor Pits/Drains-Lower Level Scales 3 EA $500 $1,500Steel Grating at Scales-Lower Level Scales 6 EA $3,000 $18,000Elevated Floor Slab at Hoppers 50 CY $700 $35,000Tipping Floor 830 SY $75 $62,300Interior Push Walls (12' high) 100 CY $450 $45,000Interior Push Walls (3' high) @ Loadout 20 CY $450 $9,000
Transfer Station BuildingPre-Engineered Building 8,800 SF $40 $352,000Misc. Building Steel, Panels, Etc. 8,800 SF $10 $88,000Building Electrical 8,800 SF $9 $79,200Building Mechanical (fire protect'n, venting, etc.) 8,800 SF $13 $114,400Roll-Up Doors 6 EA $7,500 $45,000Load-out Scales (1 set per load-out hopper) 1 EA $50,000 $50,000Load-Out Hopper Framing & Metals 1 EA $36,000 $36,000
Truck ScaleMotor Truck Scale (10'x70') 1 EA $65,000 $65,000Scale Approaches 23 CY $55 $1,300Automated Reader & Software 1 EA $30,000 $30,000Misc. Scale Protection (bollards, curbs, etc.) 1 EA $5,000 $5,000
PRELIMINARY ENGINEERING OPINON OF PROBABLE CONSTRUCTION COST (2010$)DENVER, COLORADO - TRANSFER STATION
ESTIMATED COST

APPENDIX N - TRANSFER STATION WASTE TONNAGE PROJECTIONS
ITEM DESCRIPTION QUANTITY UNIT UNIT PRICE TOTAL PRICE
PRELIMINARY ENGINEERING OPINON OF PROBABLE CONSTRUCTION COST (2010$)DENVER, COLORADO - TRANSFER STATION
ESTIMATED COST
Office BuildingPre-Engineered Metal Building - One Story 900 SF $65 $58,500Concrete Slabwork 17 CY $300 $5,100Concrete Footings 18 CY $300 $5,400HVAC 900 SF $16 $14,400Plumbing 900 SF $7 $6,300Electrical 900 SF $23 $20,700Interior Treatments 900 SF $45 $40,500
SUBTOTAL $2,136,000General Contractor Fees (10% of Sitework, Bldg Elec/Mech, Utilities) $107,000
Design/Engineering (8%) $179,000Permitting (3%) $67,000
Construction Management/Observation (8%) $179,000Contingency (25%) $561,000
TOTAL SITEWORK & FACILITY $3,229,000
Annual Capital Debt Payment (5% interest rate over 20 years) = $259,000Does not include potential costs of financing.
QUANTITY UNIT UNIT PRICE TOTAL PRICERolling Stock & Equipment
Front Loader 1 EA $350,000 $350,000
SUBTOTAL EQUIPMENT $350,000Contingency (10%) $35,000
TOTAL ROLLING STOCK $385,000
Annual Equipment Debt Payment (5% interest rate over 10 years) = $50,000
ESTIMATED COST

APPENDIX N - TRANSFER STATION WASTE TONNAGE PROJECTIONS
Project: Denver Solid Waste Management PlanTechnology: Top-Load Transfer StationDate: 3/11/2010Cost Estimate Basis: 2010$ - Cost assumptions from City, costing manuals & other projectsLocation: Denver, Colorado NE Service Area LocationTransfer Station Northeast TS CommentsTonnages (tpy): 78,300
Daily TPD: 330 Trailer Payload (tons): 20 based on average loads out of CCTS
Days Operation/Week: 5 Load/Unload Time (min): 40 One-Way Distance (miles) 17Average Speed (mph): 40 Average Trips/Year: 3,915 Average Trips/Month: 326 Average Trips/Week: 75 Hours Per Trip 1.5 Weekly Freight Hours: 114 Wkly Veh Inspect/Breaks: 21 Ratio to freight hours
Annual Freight Hours: 5,939 Freight hours for vehicle operations
Total Miles/Yr 133,110
Annual Costs Assumptions:Maintenance, Repairs, Tires & Fuel
Denver Fleet Maintenance (per miles) $2.74Transfer Tractor fleet maintenance at $2.66/mile (2009$)
Driver LaborDriver % (based on freight time) 340%# of Drivers 4Driver annual salary $39,366 DSWM transfer operator (STTO)
Fringe benefits (% of salary) 38%Transfer Truck Purchase/Amortization
# of Trucks 5 includes one spare
Capital Cost - per Tractor $150,000 Other projects and vendor data
Resale Value (% of truck $) 20%Replacement Schedule (years) 10 Interest Rate 5%Capital Recovery Factor (A/P,i,n) 0.1295
Trailer Purchase/Amortization# of Trailers 5 includes one spare
Capital Cost -- per Trailer $95,000 Other projects and vendor data
Replacement Schedule (years) 10 Interest Rate 5%Capital Recovery Factor (A/P,i,n) 0.1295
Insurance (per yr/truck)@ 3% $ - Included with Fleet MaintenanceLicense&Taxes (per yr/truck)@1.5% $ - Included with Fleet Maintenance
Annual Haul Costs: Northeast TS CommentsMaintenance, Repairs, Tires & Fuel $364,700 Mileage BasedDriver Labor $217,300 # of DriversTransfer Truck Amortization $77,700 # TrucksTrailer Amortization $61,510 # TrailersInsurance $0 In Fleet Maintenance
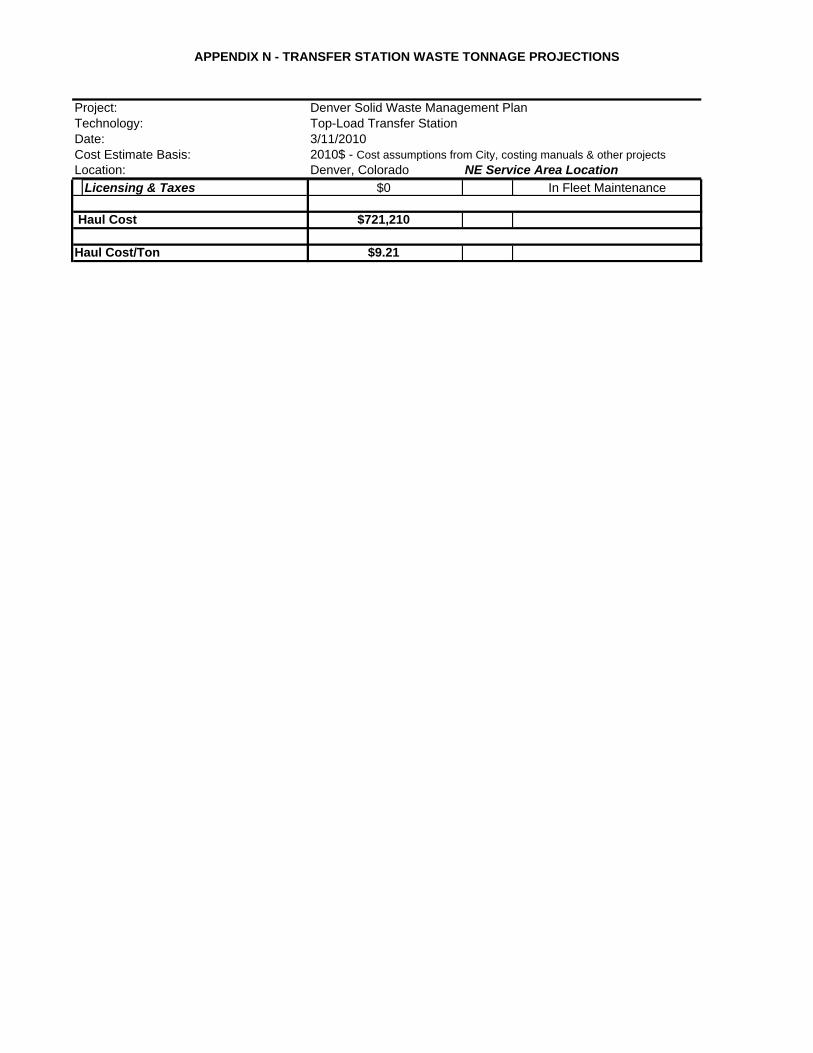
APPENDIX N - TRANSFER STATION WASTE TONNAGE PROJECTIONS
Project: Denver Solid Waste Management PlanTechnology: Top-Load Transfer StationDate: 3/11/2010Cost Estimate Basis: 2010$ - Cost assumptions from City, costing manuals & other projectsLocation: Denver, Colorado NE Service Area Location
Licensing & Taxes $0 In Fleet Maintenance
Haul Cost $721,210
Haul Cost/Ton $9.21

APPENDIX N - TRANSFER STATION WASTE TONNAGE PROJECTIONS
ITEM DESCRIPTION QUANTITY UNIT UNIT PRICE TOTAL PRICELABOR
Job Classification FTE Labor Rate Hrs/Yr TotalOperations Supervisor 1 $33.60 2080 hrs 69,890$ Heavy Equipment Operator 1 $28.10 2080 hrs 58,450$ Utility Worker 1 $20.60 2080 hrs 42,850$ Oncall Utility Worker 1 $20.60 2080 hrs 42,850$ STTO - Rotation 1 $26.90 2080 hrs 55,950$
Subtotal 269,990$ Notes/Assumptions:
Labor rate assumes fringe benefits 38%STTO = Semi-Tractor Trailer Operator
INSURANCEItem Quantity Unit Price TotalGeneral, Liability, Fire, Etc. 1% $1,600,300 bldgs/equipment 16,000$
FACILITY MAINTENANCEItem Quantity Unit Price TotalSite Maintenance 1.50% $737,400 11,060$ Building Repair & Depreciation 3.33% $1,215,300 40,470$ Scale Maintenance 1.50% $101,300 1,520$ Electricity 35,000 kwh $0.10 3,500$ Electricity Demand - Peak Est. 20 kw $50 1,000$ Heating - Natural gas 1,800 DTH $5 /DTH 9,000$ Sanitary Service 90% 214,500 gpy $5 /1000 gal 970$ Water 214,500 gpy $8 /1000 gal 1,720$ Mobile Phone 2 phone $50 /month 1,200$
Subtotal 70,440$ Notes/Assumptions:
Building lighting based on 0.5 watts/sf 2600 hours/year (50 hrs/week)Site Lighting 5 1000W Lights 4380 hours/year (night)Assume natural gas use 2 therm/sf/season (DTH = decatherm)Assume water use at 15 gals/day/person 0.1 gpd/SF tipping floor washdown
EQUIPMENT O&MItem Qty Rate Hrs/Yr Unit Price TotalFront Loader Fuel 1 3.0 gal/hr 2080 hrs $3.00 18,720$ Front Loader O&M 1 2080 hrs $12 24,960$ Supervisor Pick-Up 1 LS $650 650$
Subtotal 44,330$ Notes/Assumptions:
CCTS Loader fleet maintenance cost in 2008 was $42,169 (including fuel).
ANNUAL TOTAL 400,760$ Note: Excludes Transfer Station Facility and mobile equipment capital debt amortization.
Also excludes haul costs. See Summary table for total.
ESTIMATED COST
PRELIMINARY ENGINEERING OPINON OF PROBABLE OPERATING COST (2010$)DENVER, COLORADO - TRANSFER STATION