a map of binding cavity conformations reveals differences ...chen/papers/2016bibm/bibm2016.pdf · a...
TRANSCRIPT

A Map of Binding Cavity Conformations Reveals
Differences in Binding Specificity
Ziyi Guo and Brian Y. Chen∗
Dept. of Computer Science and Engineering
Lehigh University
Bethlehem, PA, USA
Abstract—Protein structure comparison algorithms are useful
for predicting aspects of protein function. Some algorithms
identify remote homologs, while others distinguish closely related
proteins that prefer different substrates. Most of these methods
assume that proteins are rigid in order to perform comparisons
more rapidly, while others compensate for flexibility by repre-
senting proteins as a connected group of rigid components. To
consider the motion of individual atoms, this paper presents a
method for generating a map of binding cavity conformations
based on conformational snapshots. We use clusters of protein
conformations to distinguish proteins that have different binding
preferences. Our results, on the serine proteases and enolase
superfamilies show that, despite structural flexibility in binding
sites, our methods correctly classify proteins with different
binding specificities both qualitatively and quantitatively.
I. INTRODUCTION
Conformational flexibility is a universal challenge in the
comparison of protein structures because flexibility interferes
with typical notions of geometric similarity. Most comparison
algorithms model proteins as rigid objects. This simplifying
assumption facilitates rapid comparison and it is most compat-
ible with the available data, because alternative conformations
are infrequently available from experimental sources. Rigid
representations of protein structure use carbon alpha coor-
dinates [1]–[7], distance matrices [8], graphs [9]–[11] and
geometric surfaces [12]–[15] to detect similarities between
remote homologs or to identify proteins with different binding
preferences [16]–[20]. A second class of comparison methods
use hinges [21], [22], graphs [23], [24], fragments [25] or
dynamic programming [26]–[28] to represent proteins as rigid
structural elements connected by flexible regions. Since these
representations do not compensate for structural motion within
binding sites, accurate classification of binding cavities, when
they appear with different conformations, can be a challenge.
The specific problem we are addressing is to distinguish
binding cavities with different binding specificities in the
presence of conformational flexibility. This paper presents
an algorithm for generating a map of binding cavity confor-
mations from multiple proteins. Our method happens to use
molecular dynamics trajectories to generate conformations, but
it is not simply a technique for analyzing molecular dynamics
trajectories. Other techniques for generating conformations,
∗ Corresponding author.
such as Monte Carlo sampling methods, would be equally
effective. Our method works by first selecting amino acids that
describe the binding site, called a motif. Cognate amino acids
are identified in all proteins being compared in a process we
call motif propagation. Finally, the coordinates of each amino
acid, represented by its alpha carbon location, are identified
in every conformation of every protein. These coordinates
are collected as a data points in a high dimensional space.
Finally, we use Principal Component Analysis (PCA) and
Non-negative Matrix Factorization (NMF) to project the data
points into a 3D space. We hypothesize that binding sites with
identical binding preferences will cluster together.
This approach contrasts from our earlier studies in repre-
senting all-atom motion at binding cavities. Our initial efforts
combined multiple conformational snapshots into a single ag-
gregate representation of the binding cavity, using conserved
3D regions [29], cavity clusters [30] or prediction ensembles
[31]. While these representations reflect detailed conforma-
tional data, our comparisons of aggregate representations only
produced single dimensional measures of similarity rather than
the nuanced picture of similarity at different conformations.
The mapping technique proposed here avoids generalizations
produced by aggregate representations.
Our approach is inspired in part by existing methods that
define protein structure space as either a discrete or continuous
geometric space of protein folds (e.g. [8], [32]–[34]). Protein
structure space leverages structure comparisons to provide a
comprehensive view on how protein structures are distributed,
which is significantly different from hierarchical classification
systems such as Structural Classification of Proteins (SCOP)
[35] and CATH [36]. One way to approach protein struc-
ture space understanding is to represent the space in lower
dimensional space, such as three dimensional maps. Several
efforts [33], [37]–[42] have been reported to construct maps
of protein structure space. These methods develop clever tech-
niques for computing structure similarities between all pairs of
conformations, and then use dimension reduction methods to
create lower-dimensional embeddings for visualization. Here,
we adapt these concepts to the comparison of binding sites
with varying binding preferences.
To our knowledge, our method is the first effort for an-
alyzing maps of binding cavity conformations to classify

proteins with different specificities. We tested our method
on sequentially nonredundant protein structures of serine pro-
teases and enolases. In both datasets, we observe that cavities
with the same binding preference form closely-located clusters
in the conformation map produced by our software. The
quantitative clustering evaluations show that our method can
distinguish proteins with different binding specificities despite
considerable variations of their binding cavities.
II. METHODS
Overall, our method accepts conformational samples of one
family of protein structures as input. These proteins exhibit
identical folds but reveal different binding specificities. Our
method outputs a conformation space map that models con-
formational flexibilities of binding cavities. First, we describe
how we define the template motif which is a collection of
residue positions of the template structure that are adjacent to
the ligand molecule, in the selected template structure. Each
amino acid in the template motif is close to the binding cavity
and its motion may affect the shape of the binding site. Second,
we explain how we perform whole structure alignment to
identify analogous substructures, thus propagating structural
motifs to other proteins. We extract three dimensional Carbon
alpha coordinates for each member in the structural motif
for all protein conformations. Therefore, the motif of each
conformation can be characterized with a feature vector. Since
motifs are propagated by detecting substructural matches,
some features could be highly similar. These features will
increase feature space dimensionality but are not necessarily
discriminative for different binding specificities, leading to
perform dimension reduction in step three. Here, we select
two effective reduction methods, Non-negative Matrix Factor-
ization (NMF) and Principal Component Analysis (PCA).
Each binding cavity conformation can then be represented
as a data point in the reduced feature space. It is hypoth-
esized that conformations of proteins with identical binding
specificity should be close to each other and be grouped into
the same cluster. Finally, we discuss how we perform data
clustering to test our hypothesis.
A. Template motif generation
Formally, from one family of protein structures, we select
one protein T as the template structure and its conformational
samples are referred as {T1,T2,...,TN}. The binding cavity
conformations, {t1,t2,...,tn}, can be generated using VASP
[16]. For each amino acid r of T , we compute the median
intersection volume between r of the conformation Ti and the
binding cavity conformation tj for all pairs of i and j. The non
trivial average intersection volume indicates that r frequently
overlaps with the binding cavity so it could change the shape
of the binding cavity substantially. We continue to rank all
amino acids by their average intersection volume, and add top
k into the template motif S = {S1, S2, ..., Sk}. The motif size
is defined as the number of selected amino acids.
B. Motif propagation
To identify similar motifs in proteins that are not template
structures, T is structurally aligned against a family of protein
structures F = {f1, f2, ..., fM}. Here, we run FATCAT [24]
between T and each protein structure to find substructural
match MS→fi by searching every residue in the template and
returning the matched residue in fi. FATCAT is used because
it is compatible and available to flexible structure comparisons.
MS→fi defines a structural match between the template motif
and a substructure in fi, and all the matched residues in this
substructure is called the propagated motif. If any residue in
the template motif is matched to a gap, it will be removed
from the motif. It is noted that our method is independent of
FATCAT alignment, other substructure matching algorithms,
such as LabelHash [43] and Match Augmentation [44], can
also work.
C. Dimension Reduction
Given propagated motifs, one binding cavity conformation
can be characterized as a geometric feature vector where each
value is the x or y or z direction coordinate of Cα atom.
All feature vectors will be normalized so that each data point
has unit norm. The feature matrix X = {x1, ..., xn} ∈ Rm×n
represents geometric features of all conformation samples of
all proteins where n is the total conformation number and mis the feature dimensionality, and the matrix will be taken as
input for dimension reduction.
Non-negative matrix factorization (NMF) [45] is a matrix
decomposition algorithm for parts-based data representation of
matrices with non-negative elements. Given input matrix X ,
NMF aims to find two non-negative components W ∈ Rm×r
and H ∈ Rr×n to minimize the objective function where r is
the reduced feature dimensionality:
minW,H
F = ||X −WH ||2
s.t. Wij ≥ 0, Hij ≥ 0 (1)
The objective is convex with respect to either W or H , but not
convex in both together so that the global optimal is difficult
to find. Starting from random initialization of W and H , Lee
Serine Protease Superfamily:
Chymotrypsins: 1ex3
Elastases: 1b0e, 1elt
Trypsins: 1a0j, 1ane, 1aq7, 1bzx, 1fn8, 1h4w, 1trn,
2eek, 2f91
Enolase Superfamily:
Enolases: 1ebh, 1iyx, 1te6, 3otr
Mandelate Racemase: 1mdr, 2ox4
Muconate Lactonizing Enzyme: 2pgw
Fig. 1. PDB codes used in the data set.
and Seung [46] presented an algorithm to iteratively update
W and H and a local minimum can be guaranteed:
Wij = Wij
(XHT )ij(WHHT )ij
Hij = Hij
(WTX)ij(WTWH)ij
(2)
Usually, we have r ≪ m and r ≪ n. Thus, NMF essentially
try to discover latent structures using very few dimensions as
a compressed representation. If there exists negative elements
in the matrix, we translate the matrix so that the non-negative
constraint is guaranteed.
Principal Component Analysis (PCA) [47] is one of the
most popular dimension reduction methods. PCA orthogonally
project a set of data points onto a lower r dimensional
principal subspace such that variances between projected data
are maximized. The projection vectors can be computed as a
set of eigenvectors with top r largest eigenvalues.
D. Cluster analysis
We perform the canonical K-means clustering to identify
data clusters. The performance is evaluated using clustering
accuracy (AC).
Given the predicted cluster label li and the ground truth gi,AC is definted as:
AC =
∑n
i=1δ(gi,map(li))
n(3)
Where δ(·) is the delta function that equals to one for identical
comparison and equals to zero otherwise and map(·) is a
mapping function that permutes the predicted label set to
match the ground truth set as much as possible. This can be
done using the Hungarian method [48].
III. DATASET
A. Protein superfamily selection
We tested our method on sequentially nonredundant struc-
tures of two protein superfamilies: the serine protease and the
enolase superfamily. In serine proteases, trypsin, chymotrypsin
and elastase subfamilies were selected. In the enolase su-
perfamily, the enolase, mandelate racemase and muconate
lactonizing subfamilies were selected.
The serine protease is a family of enzyme proteins that
selectively cleaves peptide bonds where serine functions as the
nucleophilic amino acid at the binding site. The preferences for
hydrolyzing a specific scissile bond can be achieved by recog-
nizing amino acids on both sides of the bond. The most well-
known residue is the P1 just before the bond. The S1 binding
pocket, which recognizes P1, exhibits three different binding
specificities: positively charged amino acids for trypsins [49],
large hydrophobic amino acids for chymotrypsins [50] and
small amino acids for elastases [51].
The enolase superfamily proteins catalyze biochemical
reactions with an abstraction of a proton from a carbon that is
adjacent to a carboxylic acid and a requirement of a divalent
metal ion [52]. Here we focus on the specificities of three
catalysts. The enolase subfamily converts 2-phosphoglycerate
(2-PG) to phosphoenolpyruvate (PEP) [53], the mandelate
racemases convert between (S)-mandelate and (R)-mandelate
[54] and the muconate-lactonizing enzymes convert lignin-
derived aromatics, catechol and protocatechuate to citric acid
cycle intermediates [52].
B. Protein structure selection
We downloaded all protein structures of the serine protease
and the enolase superfamily from Protein Data Bank [55]. We
removed all the structures with mutation, disordered regions
or closed regions. We further kept one structure from any pair
of structures with more than 90% sequence similarity where
structures associated with publications were preferred. Few
structures, such as 8gch and 1aks, were removed because of
technical issues of MD simulation. In the end, we have 12serine proteases and 7 enolase structures, and they are shown
in Figure 1 with classification into subfamilies by their binding
specificities.
We superposed all the conformational samples using ska
[56], a whole structure alignment tool. We superposed all
conformation structures of serine proteases onto 8gch and all
conformation structures of the enolases onto 1mdr. These two
structures were selected because of ligand bound existence.
C. Protein structure simulation
Conformational samples of all protein structures were sim-
ulated using GROMACS 4.5.4 [57]. The input protein was
centered inside a cubic waterbox using a 3-point solvent model
SPC/E [58] with at least 10 A between the structure and
the neartest part of the waterbox. Charge balanced sodium
and potassium were added with lower than 0.1% salinity.
Isothermal-Isobaric (NPT) equilibration in four 250 picosec-
onds steps was run for temperature and pressure equilibration.
Each equilibration step reduced the position restraint force by
250 kJ/(mol∗nm) where backbone positions constraints were
released and system energies were computed. Temperature was
set to 300 Kelvin and pressure was set to 1 bar. Temperature
coupling was computed using Nose-Hoover thermostat [58]
and pressure coupling was computed using the Parrinello-
Rahman algorithm [59], [60]. The simulation update bonds
using P-LINCS [61] and calculate electrostatic energies using
particle mesh Ewald summation (PME) [57]. The primary
MD simulation was perfomred for 100 nanoseconds with
1 femtosecond timesteps on multiple 16 core nodes of the
Lehigh corona server. The trajectory file was convert to the
PDB format with only atomic positions. For each protein
structure, 600 samples were selected at uniform intervals.
IV. RESULTS
In this section, we first demonstrate considerable variations
of binding cavity volumes in our data set, and these variations
could be sources of errors that weaken rigidity assumption for
protein structure comparisons. Second, we show 3D structures
of template motifs and propagated motifs where co-located

1a0j 1ane 1aq7 1bzx 1fn8 1h4w 1trn 2eek 2f91 1b0e 1elt 1ex3 1ebh 1iyx 1te6 3otr 1mdr 2ox4 2pgw
Bind
ing
Cavity
Volume(A
3)
100
200
300
400
500
600
700
Serine Proteases Enolase Superfamily
Fig. 2. Aggregate variations in cavity volume in our whole data set. Cavity of almost all proteins varied considerably.
substructure clusters are observed that reveal specificities.
Finally, we evaluate clustering performance for predicting
binding specificity.
A. Binding cavity varies considerably
Considerable variations of protein cavity volumes can be de-
tected over all conformations in our data set as shown in Figure
2. To be specific, in serine proteases, trypsin volumes ranged
from 249 A3 to 693 A3, chymotrypsin cavity volumes ranged
from 127 A3 to 553 A3 and elastase cavity volumes ranged
from 277 A3 to 569 A3. Similarly, in the enolase superfamily,
enolase cavity volumes ranged between 90 A3 to 508 A3,
mandelate racemase cavity volumes ranged between 225 A3
to 673 A3 and muconate lactonizing enzyme cavity volumes
ranged between 90 A3 to 344 A3. All these observations reveal
structural variations of binding cavities in the same protein.
The cavity variations create errors for flexible binding cavity
comparison, preventing accurate specificity prediction when
protein conformational samples are used [29]. Protein cavities
varied because of motions of adjacent amino acids, and thus
we identify these amino acids for representing binding cavities.
B. Motif definition and propagation
We selected 1a0j as the template structure for serine
proteases and selected 1ebh as the template structure for
the enolases. All the proteins in the same superfamily have
identical folds and the choice of the template structure has little
influence in generating structural motifs. Figure 3 illustrates
1a0j 1ebh
Fig. 3. The 3D structure of template motifs in 1a0j (left) and 1ebh (right).The whole protein structure is shown in blue cartoon, the template motif isshown in green stick and the binding ligand is shown in red balls. This figureis generated with Pymol [62].
K224
S195
S190
D189
G216
G219
A)
B)
K396
Q295
K345
D320
H373
Fig. 4. Superposition of sampled template motifs and propagated motifs ofproteins in A) serine proteases and B) the enolases where 15 samples areselected for each protein subfamily. The color of each aligned substructureindicates the ligand binding specificity of the protein. It can be seen thatpropagated motifs of proteins with identical binding specificity group intostructurally co-located clusters (dotted rectangle). This figure is generatedwith Pymol [62].
the 3D structure of template motifs that have 6 residues of
1a0j and 1ebh. We observe that both two template motifs are
close to the binding ligand, and their variations may enlarge,
shrink or even separate binding cavities.
Figure 4 illustrates superposition of propagated motifs. The
superposition exhibits geometrical diversities and motifs struc-
tures in proteins with identical binding specificity tend to form
closely-located substructure clusters. We hypothesize that it is
the structural differences within the selected amino acids in the
structural motif that cause proteins in different subfamilies to
exhibit different binding specificities. We apply data clustering
on binding cavity conformation map to categorize different
clusters to predict binding specificity.

1.5
1
0.5
00
0.2
0.4
0.6
0.8
1
1.2
1.4
1.6
1.5
1
0.5
0
1.8
Enolases
Mandelate Racemases
Muconate Lactonizing Enzymes
0.1
0.05
0
-0.05-0.04
-0.02
0
0.02
0.04
0.06
-0.05
-0.04
-0.03
-0.02
-0.01
0
0.01
0.02
0.03
0.04
0.05
0.08
Fig. 5. A binding cavity conformation space map of the enolase superfamily where the size of motif is set to be 8 and each protein is presented with 600
conformations. The left figure shows the NMF reduced space and the right figure shows the PCA reduced space. The coloring indicates the binding specificityby EC number.
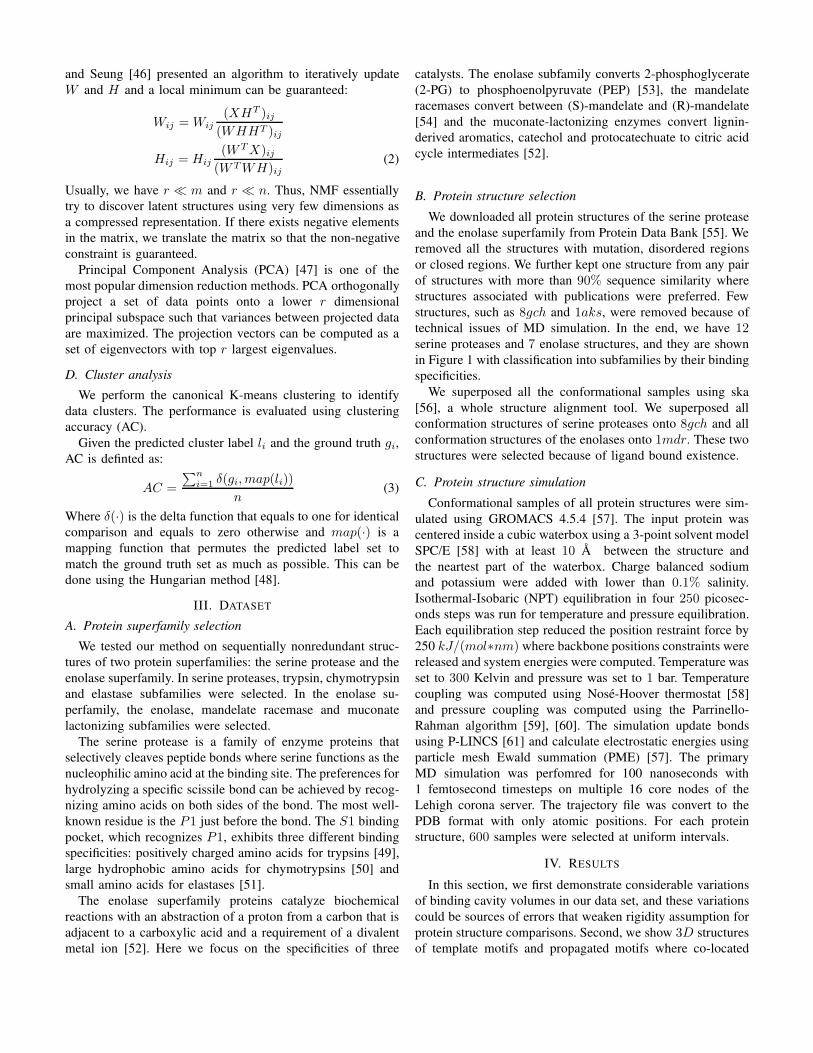
C. Clustering evaluation
The map of binding cavity conformation on the enolases is
illustrated in Figure 5. We observe that in both NMF and
PCA map space, conformations of proteins with the same
binding specificity are represented by spatially adjacent points.
A similar map can also be found on serine proteases. Such rep-
resentations reveal a high level organization for binding cavity
conformation classification. Adjacent points form specificity-
sensitive clusters that can be further evaluated when compared
with ground truth EC numbers.
We conducted evaluations with different size of structural
motifs. Figure 6 and Figure 7 report clustering results in
the original feature space (K-means), PCA reduced space
(PCA+K-means) and NMF reduced space (NMF+K-means)
on our date set. Clustering always take 3 as the number of
clusters because both serine proteases and the enolases exhibit
3 subfamilies. For each motif size k, 100 clustering runs
were conducted and 100 NMF runs were conducted for every
clustering since both K-means and NMF are dependent of
data initialization. The average performance is reported for K-
means and PCA+K-means, and NMF+K-means performance
is shown in boxplot.
These two figures reveal several insights. First, in the
original feature space, performance increases as more amino
acids are added into structural motifs but suddenly decreases
when the size of motif is larger than a threshold. The threshold
is about 13 on both superfamilies, indicating the maximal
number of amino acids that are relevant to binding. This means
that, if the motif size is too small, the binding cavity will be
under-represented because some other influential amino acids
are not included. If the motif size is too large, the binding
cavity will be over-represented with systematic noises because
these exist amino acids that are irrelevant to binding. Second,
in most cases (except when k ranged between 8 to 12 on serine
proteases), PCA+K-means achieve comparable or even better
Size of structural motif1 2 3 4 5 6 7 8 9 10 11 12 13 14 15 16 17 18 19 20
Acc
ura
cy
0
0.1
0.2
0.3
0.4
0.5
0.6
0.7
0.8
0.9
1
K-means
PCA+K-means
NMF+K-means
Fig. 6. Clustering accuracy with respect to the size of structural motif onserine proteases.
performance to K-means in the original space. This suggests
PCA extracts most data variances that are sufficient enough to
distinguish protein conformations with different specificities.
Third, in average, NMF performs not as well as the other
two methods. This is because NMF is largely affected by data
initialization. However, if we only consider the best result,
NMF+K-means achieves better performances when k is larger
than 12 on serine proteases and for almost all k values on
enolases.
Overall, our conformation space map reveals high-level rep-
resentations of binding cavity motions. The clustering results
show that our method is able to correctly classify similar
proteins with different binding specificities. Therefore, our
method could be a robust tool for protein structure compar-
isons, despite great flexibility in the binding cavity.
Size of structural motif1 2 3 4 5 6 7 8 9 10 11 12 13 14 15 16 17 18 19 20
Acc
ura
cy
0
0.1
0.2
0.3
0.4
0.5
0.6
0.7
0.8
0.9
1
K-means
PCA+K-means
NMF+K-means
Fig. 7. Clustering accuracy with respect to the size of structural motif onenolases.
V. DISCUSSION
In this paper, we have presented a computational method to
build a map of binding cavity conformations. Our method is
essentially different from existing works. First, without rigidity
or partial rigidity simplification, we extract structural motifs to
model conformational flexibility of binding cavities. Second,
our conformation space map focuses on examining proteins
with similar folds but bind to different substrates, not proteins
that change conformations or proteins with different folds.
We tested our method on sequentially nonredundant struc-
tures of serine proteases and the enolases. Protein structures
in both superfamilies exhibited highly flexible binding sites.
Despite these structural variations, proteins with identical
binding specificity are represented as adjacent points in our
binding cavity conformation map. The clustering evaluations
show that our method predicts binding specificity with high
accuracy.
Applications of our method exist in comparisons of similar
proteins with different binding preferences. In such cases,
our conformation space map gives a comprehensive visual
distribution of protein cavity conformations with different
specificities, which is not restricted by hierarchical catego-
rizations of the EC number. Moreover, our method generates
structural motifs to represent conformational flexibilities of
protein cavities, pointing to individual residues that affect
binding. These characteristics can be useful for structure-based
function annotation of molecular design.
ACKNOWLEDGEMENT
This work was supported in part by National Science Foun-
dation Grant 1320137 to Brian Chen and Katya Scheinberg.
REFERENCES
[1] C. A. Orengo and W. R. Taylor, “Ssap: sequential structure alignmentprogram for protein structure comparison,” Computer methods formacromolecular sequence analysis, 1996.
[2] R. Nussinov and H. J. Wolfson, “Efficient detection of three-dimensionalstructural motifs in biological macromolecules by computer visiontechniques,” Proceedings of the National Academy of Sciences, vol. 88,no. 23, pp. 10 495–10 499, 1991.
[3] I. N. Shindyalov and P. E. Bourne, “Protein structure alignment byincremental combinatorial extension (ce) of the optimal path.” Proteinengineering, vol. 11, no. 9, pp. 739–747, 1998.
[4] D. Petrey and B. Honig, “Grasp2: visualization, surface properties, andelectrostatics of macromolecular structures and sequences.” Methods inenzymology, vol. 374, pp. 492–509, 2002.
[5] R. B. Russell, “Detection of protein three-dimensional side-chain pat-terns: new examples of convergent evolution,” Journal of molecularbiology, vol. 279, no. 5, pp. 1211–1227, 1998.
[6] B. Y. Chen, V. Y. Fofanov, D. H. Bryant, B. D. Dodson, D. M. Kris-tensen, A. M. Lisewski, M. Kimmel, O. Lichtarge, and L. E. Kavraki,“The mash pipeline for protein function prediction and an algorithmfor the geometric refinement of 3d motifs,” Journal of ComputationalBiology, vol. 14, no. 6, pp. 791–816, 2007.
[7] D. H. Bryant, M. Moll, P. W. Finn, and L. E. Kavraki, “Combinatorialclustering of residue position subsets predicts inhibitor affinity across thehuman kinome,” PLoS computational biology, vol. 9, no. 6, p. e1003087,2013.
[8] L. Holm and C. Sander, “Mapping the protein universe,” Science, vol.273, no. 5275, pp. 595–602, 1996.
[9] L. Xie and P. E. Bourne, “A robust and efficient algorithm for the shapedescription of protein structures and its application in predicting ligandbinding sites,” BMC bioinformatics, vol. 8, no. Suppl 4, p. S9, 2007.
[10] J.-F. Gibrat, T. Madej, and S. H. Bryant, “Surprising similarities instructure comparison,” Current opinion in structural biology, vol. 6,no. 3, pp. 377–385, 1996.
[11] A. R. Poirrette, P. J. Artymiuk, D. W. Rice, and P. Willett, “Comparisonof protein surfaces using a genetic algorithm,” Journal of Computer-Aided Molecular Design, vol. 11, no. 6, pp. 557–569, 1997.
[12] T. A. Binkowski, S. Naghibzadeh, and J. Liang, “Castp: computed atlasof surface topography of proteins,” Nucleic Acids Research, vol. 31,no. 13, pp. 3352–3355, 2003.
[13] T. A. Binkowski, L. Adamian, and J. Liang, “Inferring functional rela-tionships of proteins from local sequence and spatial surface patterns,”Journal of molecular biology, vol. 332, no. 2, pp. 505–526, 2003.
[14] T. A. Binkowski and A. Joachimiak, “Protein functional surfaces: globalshape matching and local spatial alignments of ligand binding sites,”BMC structural biology, vol. 8, no. 1, p. 45, 2008.
[15] K. Kinoshita and H. Nakamura, “Identification of the ligand bindingsites on the molecular surface of proteins,” Protein Science, vol. 14,no. 3, pp. 711–718, 2005.
[16] B. Y. Chen and B. Honig, “VASP: A volumetric analysis of surfaceproperties yields insights into protein-ligand binding specificity,” PLoScomputational biology, vol. 6, no. 8, p. e1000881, 2010.
[17] J. Dundas, L. Adamian, and J. Liang, “Structural signatures of enzymebinding pockets from order-independent surface alignment: a study ofmetalloendopeptidase and nad binding proteins,” Journal of molecularbiology, vol. 406, no. 5, pp. 713–729, 2011.
[18] B. Chen and S. Bandyopadhyay, “VASP-S: A Volumetric Analysis andStatistical Model for Predicting Steric Influences on Protein-LigandBinding Specificity,” in Proceedings of 2011 IEEE International Con-ference on Bioinformatics and Biomedicine, 2011, pp. 22–9.
[19] B. Y. Chen and S. Bandyopadhyay, “A statistical model of overlappingvolume in ligand binding cavities,” in Bioinformatics and BiomedicineWorkshops (BIBMW), 2011 IEEE International Conference on. IEEE,2011, pp. 424–431.
[20] B. Y. Chen, “Vasp-e: Specificity annotation with a volumetric analysis ofelectrostatic isopotentials,” PLoS Comput Biol, vol. 10, no. 8, 08 2014.
[21] K. Gunasekaran and R. Nussinov, “How different are structurally flexibleand rigid binding sites? sequence and structural features discriminatingproteins that do and do not undergo conformational change upon ligandbinding,” Journal of molecular biology, vol. 365, no. 1, pp. 257–273,2007.
[22] M. Shatsky, R. Nussinov, and H. J. Wolfson, “Flexprot: alignment offlexible protein structures without a predefinition of hinge regions,”Journal of Computational Biology, vol. 11, no. 1, pp. 83–106, 2004.
[23] J. Konc and D. Janezic, “Probis algorithm for detection of structurallysimilar protein binding sites by local structural alignment,” Bioinformat-ics, vol. 26, no. 9, pp. 1160–1168, 2010.
[24] Y. Ye and A. Godzik, “Multiple flexible structure alignment using partialorder graphs,” Bioinformatics, vol. 21, no. 10, pp. 2362–2369, 2005.
[25] R. Mosca and T. R. Schneider, “Rapido: a web server for the alignmentof protein structures in the presence of conformational changes,” Nucleicacids research, vol. 36, no. suppl 2, pp. W42–W46, 2008.
[26] F. Birzele, J. E. Gewehr, G. Csaba, and R. Zimmer, “Vorolign—faststructural alignment using voronoi contacts,” Bioinformatics, vol. 23,no. 2, pp. e205–e211, 2007.
[27] M. Menke, B. Berger, and L. Cowen, “Matt: local flexibility aids proteinmultiple structure alignment,” PLoS computational biology, vol. 4, no. 1,p. e10, 2008.
[28] J. Vesterstrøm and W. R. Taylor, “Flexible secondary structure basedprotein structure comparison applied to the detection of circular permu-tation,” Journal of Computational Biology, vol. 13, no. 1, pp. 43–63,2006.
[29] Z. Guo, T. Kuhlengel, S. Stinson, S. Blumenthal, B. Y. Chen, andS. Bandyopadhyay, “A flexible volumetric comparison of protein cavitiescan reveal patterns in ligand binding specificity,” in Proceedings of the5th ACM Conference on Bioinformatics, Computational Biology, andHealth Informatics. ACM, 2014, pp. 445–454.
[30] Z. Guo and B. Y. Chen, “Variational bayesian clustering on protein cav-ity conformations for detecting influential amino acids,” in Proceedingsof the 5th ACM Conference on Bioinformatics, Computational Biology,and Health Informatics. ACM, 2014, pp. 703–710.
[31] ——, “Predicting protein-ligand binding specificity based on ensembleclustering,” in Bioinformatics and Biomedicine (BIBM), 2015 IEEEInternational Conference on. IEEE, 2015, pp. 1239–1245.
[32] R. I. Sadreyev, B.-H. Kim, and N. V. Grishin, “Discrete–continuousduality of protein structure space,” Current opinion in structural biology,vol. 19, no. 3, pp. 321–328, 2009.
[33] M. Osadchy and R. Kolodny, “Maps of protein structure space reveala fundamental relationship between protein structure and function,”Proceedings of the National Academy of Sciences, vol. 108, no. 30,pp. 12 301–12 306, 2011.
[34] J. Skolnick, A. K. Arakaki, S. Y. Lee, and M. Brylinski, “The con-tinuity of protein structure space is an intrinsic property of proteins,”Proceedings of the National Academy of Sciences, vol. 106, no. 37, pp.15 690–15 695, 2009.
[35] A. G. Murzin, S. E. Brenner, T. Hubbard, and C. Chothia, “Scop:a structural classification of proteins database for the investigation ofsequences and structures,” Journal of molecular biology, vol. 247, no. 4,pp. 536–540, 1995.
[36] C. A. Orengo, A. Michie, S. Jones, D. T. Jones, M. Swindells, andJ. M. Thornton, “Cath–a hierarchic classification of protein domainstructures,” Structure, vol. 5, no. 8, pp. 1093–1109, 1997.
[37] J. Hou, S.-R. Jun, C. Zhang, and S.-H. Kim, “Global mapping of theprotein structure space and application in structure-based inference ofprotein function,” Proceedings of the National Academy of Sciences ofthe United States of America, vol. 102, no. 10, pp. 3651–3656, 2005.
[38] J. Hou, G. E. Sims, C. Zhang, and S.-H. Kim, “A global representationof the protein fold space,” Proceedings of the National Academy ofSciences, vol. 100, no. 5, pp. 2386–2390, 2003.
[39] L. Tapia, S. Thomas, and N. M. Amato, “Using dimensionality reductionto better capture rna and protein folding motions,” Computer Science,Texas A&M University, Tech. Rep, 2008.
[40] I. Budowski-Tal, Y. Nov, and R. Kolodny, “Fragbag, an accurate rep-resentation of protein structure, retrieves structural neighbors from theentire pdb quickly and accurately,” Proceedings of the National Academyof Sciences, vol. 107, no. 8, pp. 3481–3486, 2010.
[41] C. Keasar and R. Kolodny, “Using protein fragments for searching anddata-mining protein databases,” in Workshops at the Twenty-SeventhAAAI Conference on Artificial Intelligence, 2013.
[42] K. Molloy, M. J. Van, D. Barbara, and A. Shehu, “Exploring represen-tations of protein structure for automated remote homology detectionand mapping of protein structure space,” BMC bioinformatics, vol. 15,no. 8, p. 1, 2014.
[43] M. Moll, D. H. Bryant, and L. E. Kavraki, “The labelhash algorithm forsubstructure matching,” BMC bioinformatics, vol. 11, no. 1, p. 1, 2010.
[44] B. Chen, “Algorithms for structural comparison and statistical analysisof 3d protein motifs by chen, vy fofanov, dm kristensen, m. kimmel, o.lichtarge, and le kavraki pacific symposium on biocomputing 10: 334-345 (2005),” in Pacific Symposium on Biocomputing, vol. 10. Citeseer,2005, pp. 334–345.
[45] D. D. Lee and H. S. Seung, “Learning the parts of objects by non-negative matrix factorization,” Nature, vol. 401, no. 6755, pp. 788–791,1999.
[46] ——, “Algorithms for non-negative matrix factorization,” in Advancesin neural information processing systems, 2001, pp. 556–562.
[47] I. Jolliffe, Principal component analysis. Wiley Online Library, 2002.[48] L. Lovasz and M. D. Plummer, Matching theory. American Mathe-
matical Soc., 2009, vol. 367.[49] K. Morihara and H. Tsuzuki, “Comparison of the specificities of various
serine proteinases from microorganisms,” Archives of biochemistry andbiophysics, vol. 129, no. 2, pp. 620–634, 1969.
[50] L. Graf, A. Jancso, L. Szilagyi, G. Hegyi, K. Pinter, G. Naray-Szabo,J. Hepp, K. Medzihradszky, and W. J. Rutter, “Electrostatic complemen-tarity within the substrate-binding pocket of trypsin,” Proceedings of theNational Academy of Sciences, vol. 85, no. 14, pp. 4961–4965, 1988.
[51] G. I. Berglund, A. O. Smalas, H. Outzen, and N. P. Willassen, “Pu-rification and characterization of pancreatic elastase from north atlanticsalmon (salmo salar),” Molecular marine biology and biotechnology,vol. 7, no. 2, pp. 105–114, 1998.
[52] P. C. Babbitt, M. S. Hasson, J. E. Wedekind, D. R. Palmer, W. C. Barrett,G. H. Reed, I. Rayment, D. Ringe, G. L. Kenyon, and J. A. Gerlt, “Theenolase superfamily: a general strategy for enzyme-catalyzed abstractionof the α-protons of carboxylic acids,” Biochemistry, vol. 35, no. 51, pp.16 489–16 501, 1996.
[53] K. Kuhnel and B. F. Luisi, “Crystal structure of the escherichia coli rnadegradosome component enolase,” Journal of molecular biology, vol.313, no. 3, pp. 583–592, 2001.
[54] S. L. Schafer, W. C. Barrett, A. T. Kallarakal, B. Mitra, J. W. Kozarich,J. A. Gerlt, J. G. Clifton, G. A. Petsko, and G. L. Kenyon, “Mechanismof the reaction catalyzed by mandelate racemase: structure and mech-anistic properties of the d270n mutant,” Biochemistry, vol. 35, no. 18,pp. 5662–5669, 1996.
[55] H. M. Berman, J. Westbrook, Z. Feng, G. Gilliland, T. Bhat, H. Weissig,I. N. Shindyalov, and P. E. Bourne, “The protein data bank,” Nucleicacids research, vol. 28, no. 1, pp. 235–242, 2000.
[56] A.-S. Yang and B. Honig, “An integrated approach to the analysisand modeling of protein sequences and structures. I. Protein structuralalignment and a quantitative measure for protein structural distance.” JMol Biol, vol. 301, no. 3, pp. 665–78, Aug. 2000.
[57] B. Hess, C. Kutzner, D. Van Der Spoel, and E. Lindahl, “Gromacs 4:algorithms for highly efficient, load-balanced, and scalable molecularsimulation,” Journal of chemical theory and computation, vol. 4, no. 3,pp. 435–447, 2008.
[58] H. Berendsen, J. Postma, W. van Gunsteren, and J. Hermans, “In-termolecular forces,” Pullman, B., Ed.; Reidel Publishing Company:Dordrecht, pp. 331–342, 1981.
[59] M. Parrinello and A. Rahman, “Polymorphic transitions in single crys-tals: A new molecular dynamics method,” Journal of Applied physics,vol. 52, p. 7182, 1981.
[60] S. Nose and M. Klein, “Constant pressure molecular dynamics formolecular systems,” Molecular Physics, vol. 50, no. 5, pp. 1055–1076,1983.
[61] B. Hess, “P-lincs: A parallel linear constraint solver for molecularsimulation,” Journal of Chemical Theory and Computation, vol. 4, no. 1,pp. 116–122, 2008.
[62] W. L. DeLano, “The pymol molecular graphics system,” 2002. [Online].Available: https://www.pymol.org/