a longitudinal analysis of k-12 computing education
TRANSCRIPT

A Longitudinal Analysis of K-12 Computing Education R esearch in the U.S .:
Implications and R ecommendations for Change
Dr. Monica McGillKnox College & CSEdResearch.org
Dr. Adrienne DeckerUniversity at Buffalo
Bishakha UpadhyayaKnox College

Thank you to our sponsors!
Knox College - Baker Velde Grant:
STEM Research Scholarship Grant for Undergraduate Students
This material is based upon work supported by the U.S. National Science Foundation under Grant Nos. 1625005, 1625335, 1757402, 1745199 and 1933671. Any opinions, findings, and conclusions or recommendations expressed in this material are those of the author(s) and do not necessarily reflect the views of the National Science Foundation.

Introduction
● What we know:○ That K-12 CS Education is in its infancy○ So, K-12 CS Education Research is also still in its infancy○ The U.S. has a decentralized education system - differing policies for
different states and districts○ 44 of the 50 states have some policy in place to bring computing into
K-12 schools (Code.org)

Research Question
Over the last seven years (2012-2018), what have been the major trends in K-12 computer science education research in the U.S.?
● Locations of students/interventions studied● Type of articles (research, experience, position paper)● Program data (e.g., concepts taught, when activity offered,
etc.)● Student data (e.g., disabilities, gender, race/ethnicity, SES)

Why is this important?
● If the data is robust:○ Analysis can provide a longitudinal trend of what the research
shows and we can start to see trends develop to help predict future trends
○ Identify gaps in what is being researched
● If the data is not robust:○ Gives us data needed to improve the state of the field○ Gaps in what is reported

Methodology● Analyzed the data from CSEdResearch.org dataset
○ Ten publication venues (ACM/IEEE + a couple of others)○ 2012-2018○ All manually curated data
● Most of the data is from U.S. researchers at present, so we chose to focus on U.S. only for now
● Focused on articles that had K-12 students as participants● The dataset is available to the public (just contact us)● SQL queries were added to a Tableau workbook that pulled
data from the site● Visual graphics were created from the results

CSEdResearch.org
● Evaluation instruments for computing
● Data manually curated from articles
● Research guides

Evaluation Instruments for CS Ed

Article Summary Search Capability

Article Summaries

Research Guide
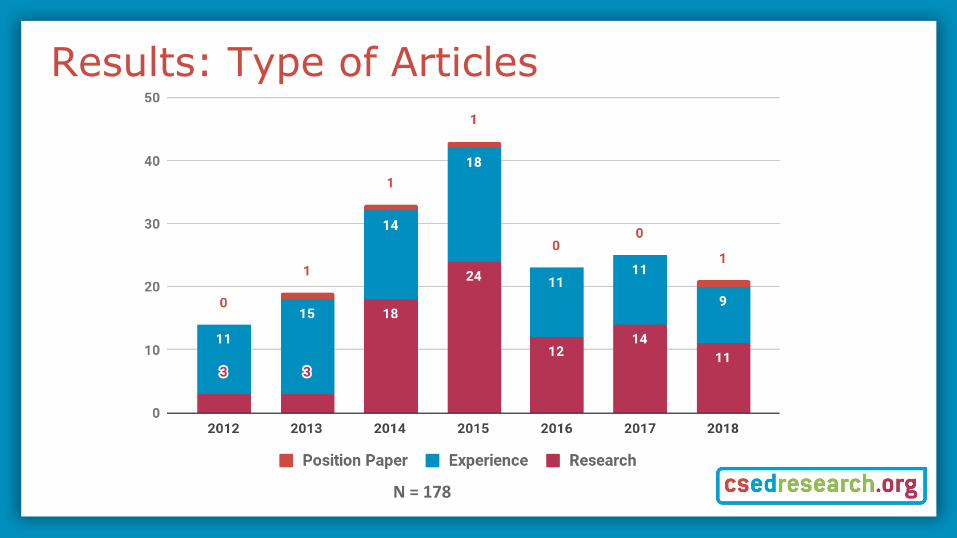
Results: Type of Articles
N = 178

Locations of Student Participants
N = 178

Program Data: Curriculum Taught

Program Data: Most Frequent Concepts Taught2012 2015 2018
Programming (11) Programming (20) Programming (6)
AI (3) Problem Solving Skills (12) Computational Thinking (4)
Design Skills (3) Computational Thinking (12) Abstraction (4)
Problem Solving Skills (3) Abstraction (8) Variables (3)
Video Game Design and Dev (3) Iteration (7) Game Programming (2)
Video Game Design (2) Video Game Design(6) Video Game Design (2)
Computational Thinking (2) Algorithms (4) Debugging (2)
Internet (2) 3D Modeling (4) Cybersecurity (2)
Cryptography (2) Algorithm Logic (4) Computing Concepts (2)
Mobile App Development (4)
Robotics (4)

Program Data: Type of Activity
N = 172
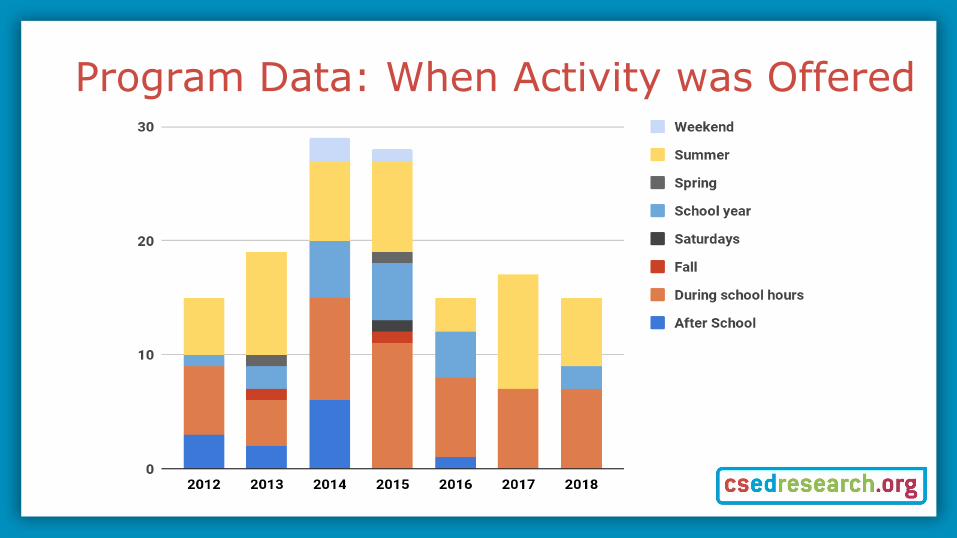
Program Data: When Activity was Offered
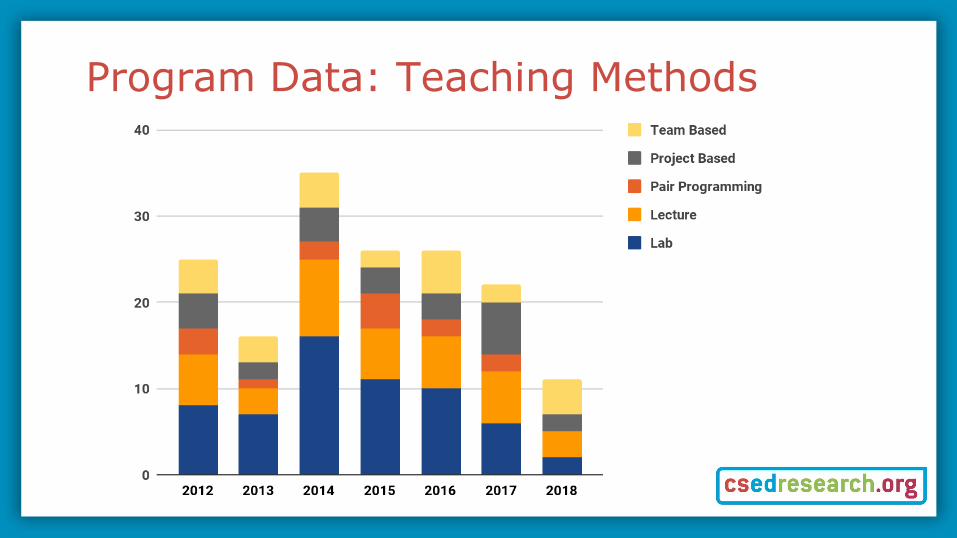
Program Data: Teaching Methods

Program Data: Tools, Languages, Environments
2012 2015 2018
Scratch (9) Scratch (19) Scratch (15)
CS Unplugged (3) Java (6) Java (4)
Java (2) AppInventor (6) Python (4)
App Inventor (2) Python (4) App Inventor (3)
Python (2) Arduino (3)
Alice (2)
CSS (2)
Top 3 across these years
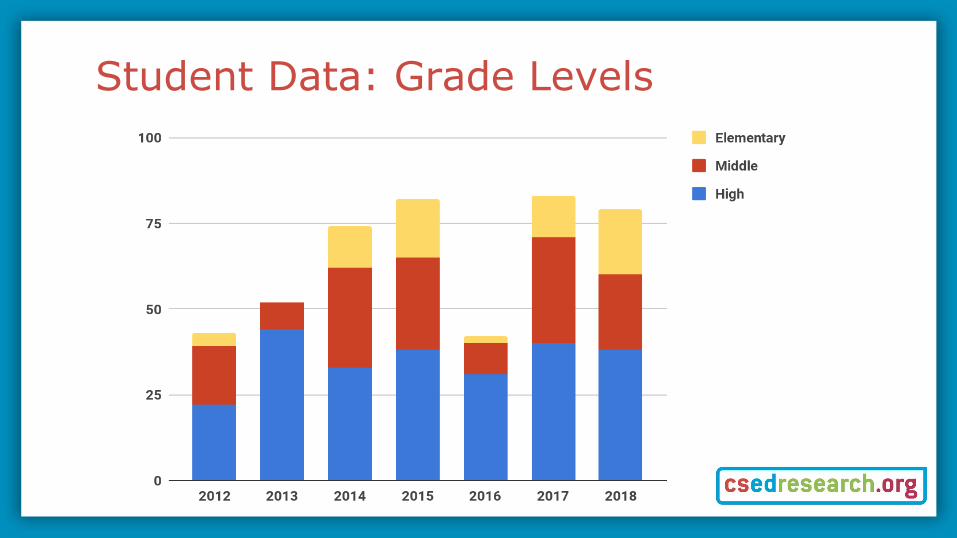
Student Data: Grade Levels

Student Data: Disabilities
● Only 5 out of 178 articles reported information related to disabilities
● Information curated related to disabilities:○ Disability instruction○ Receiving disability services○ Reported Disabilities
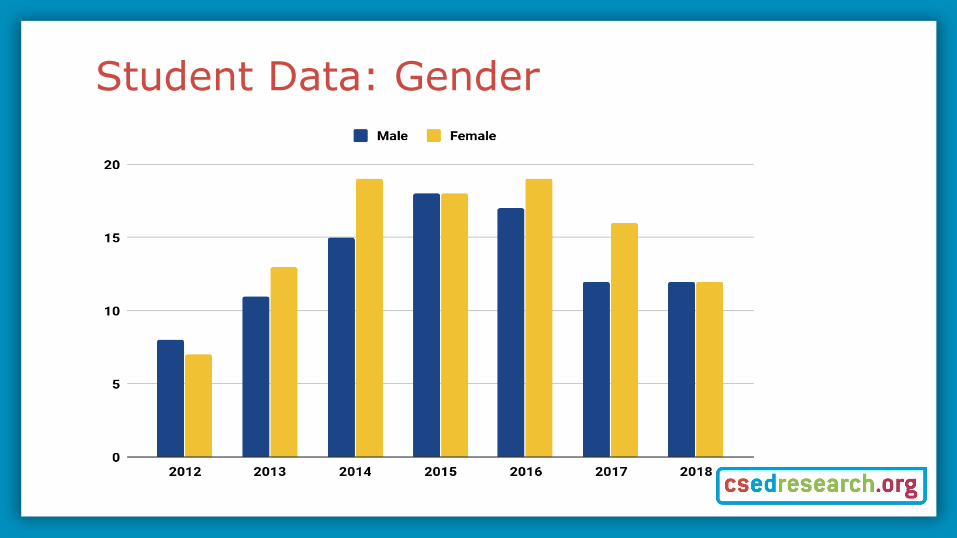
Student Data: Gender
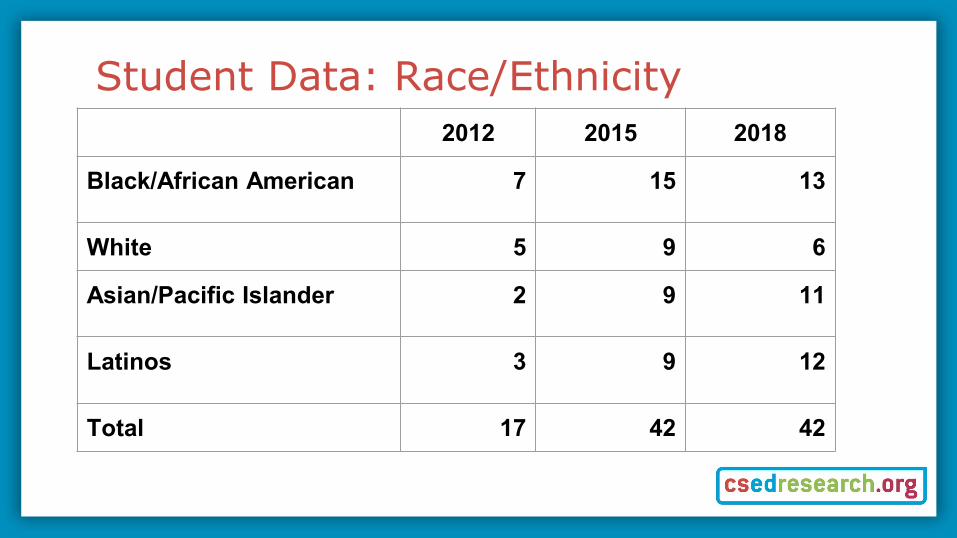
Student Data: Race/Ethnicity2012 2015 2018
Black/African American 7 15 13
White 5 9 6
Asian/Pacific Islander 2 9 11
Latinos 3 9 12
Total 17 42 42
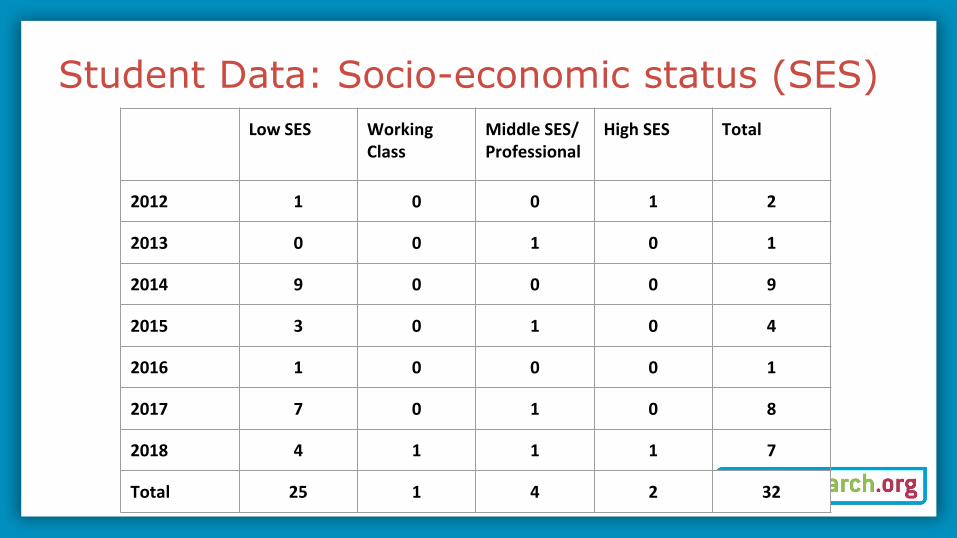
Student Data: Socio-economic status (SES)Low SES Working
ClassMiddle SES/ Professional
High SES Total
2012 1 0 0 1 2
2013 0 0 1 0 1
2014 9 0 0 0 9
2015 3 0 1 0 4
2016 1 0 0 0 1
2017 7 0 1 0 8
2018 4 1 1 1 7
Total 25 1 4 2 32
Discussions and Recommendations● Lack of consistency in reporting of SES, disabilities, gender,
location, and Race/Ethnicity of the students.○ As well as program data!
● Seems fairly consistent over the last 7 years○ Indicates lack of progress in reporting

Discussion
● Fewer K-12 articles published in 2018 than previous years● Other factors (e.g. Policies) that affect the reporting of the
location of students in the articles.● Outreach programs and workshops being researched
appears to be decreasing as CS is being integrated in the formal curriculum.

Recommendations
● Consistency in the reporting of data○ Reporting states instead of region○ Both school groups and age
● Reporting of demographic data regardless of the focus of the study○ If there were participants, there’s demographic data

Limitations
● Data is manually curated and thus prone to data entry errors○ Mitigated by a two-reviewer process
● Data curation only categorizes location of students/intervention, not the researchers○ So, if authors did not mention where in which state student participants were
located, it is not on the map (underrepresentation)● Several articles may report on one study (overrepresentation)● Significant underreporting with demographics (underrepresentation)● Limited to U.S., but this can serve as a model for investigating article
data from other countries

Conclusion
● Initial indications is that the research landscape is not equitable, but with underreporting difficult to determine
● Lack of reporting of the key demographic data has not improved over the years
● What may have worked in a primarily white upper-middle class suburban school may not work for a poverty level rural school or an ethnically diverse urban school. ○ Or it just may? ○ Wouldn’t it be nice to have the data to show this?

Thank you!
Questions?
Dr. Monica McGillKnox College & CSEdResearch.org
[email protected]: VirtuallyFine
Dr. Adrienne DeckerUniversity at Buffalo
[email protected]: AdrienneMDecker
Bishakha UpadhyayaKnox College
Follow CSEdResearch.org on Twitter and Facebook!@csedresearch / csedresearch.org