a little history of urban transportation · all of these help to explain history of urban...
TRANSCRIPT

A little history of urban transportation
TTP 220S. Handy3/30/16
Recap of Key Concepts
• Travel as a derived demand• Accessibility vs. mobility• Travel time budgets• Demand vs. volume• Latent demand and induced travel• Needs vs. desires
All of these help to explain history of urban transportation

• Land use and transportation are inextricably linked.
Dr. Handy’s Tenet
TransportationInvestments
Land UsePatterns
TravelPatterns
Derived demand –where activities are
located determines where we go
Accessibility –land with better access is
more attractive for development

Key Concept: Density GradientAssume a monocentric city…
Density
($)
Distance from City Center0
What’s the trade-off people make?
Where is density (and value) highest?
What determines the slope?

Density
($)
Distance from City Center0
So does lower transportation cost mean steeper or flatter
curve?
Key Concept: Density GradientAssume a monocentric city…

Historic Rule 1
Transportation innovation
Higher travel speeds
Outward expansionLower densitiesGreater separation
Travel time budget –Given fixed amount of time
available, people can travel farther if speeds are
higher

Historic Rule 2
Transportation investment(road or rail)
Higher accessibilityIn those sites
Greater development potential in those sites
Accessibility –land with better access is
more attractive for development

Historic Rule 3
Transportation innovation
Outward expansion
Outward expansion
Transportation innovation

Recreational Car Era
Urban Transportation System
1800 20001900
Walking-Horsecar Era
Streetcar Era
Freeway Era
Rise of Transit
Rise of the Automobile
Fall of Transit

The early 1800s
• What was going on in cities?• What created the pressure for
transportation innovations?

Transit Innovations
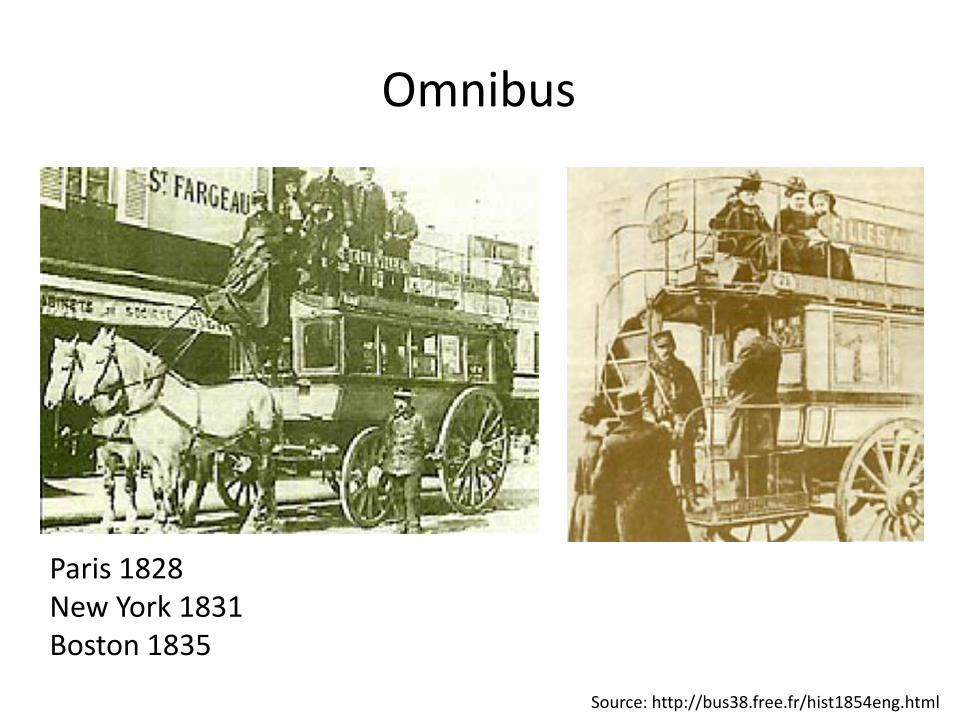
• Omnibus – 1820s • Steam trains – 1830s• Horse-car – 1830s• Electric streetcar – 1890s• Mass transit – 1900s in some places• Motorbus – 1920s • Rapid transit – 1950s
Source: http://bus38.free.fr/hist1854eng.html
Omnibus
Paris 1828New York 1831Boston 1835

Steam Trains
1830s - Linking cities to upper class suburbs

Horsecar
1830s – Horse-drawn but on tracks

Key points about transit so far
• Operated by private companies, with “franchise” given by city
• Because costly, tendency to serve only the best paid workers, not the masses
• Often operated in conjunction with land development, resulting in more continuous suburbanization 2-3 miles from city center

Concerns in the late 1800s
• Speeds still only 5-6 mph• Need for grade separation – up or down• Need for mechanical traction:
– Problems with horse-drawn modes…– Problems with steam power…

Cable Cars
1873 – San Francisco

Electric Streetcar
http://americanhistory.si.edu/onthemove/exhibition/exhibition_4_6.html
1888 - Richmond, VA1895 - 900 systems and 11,000 miles of track in the U.S.

Streetcar System Impacts• Affordable for working class, who could now live
away from factories– 5 cent fare to anywhere– 3-5 times as fast as horse-cars
• Led to more outward expansion, e.g. Boston:– 1850: 2-3 mile radius, mixed land uses– 1900: 10 mile radius, industrial and commercial core
surrounded by residential
• Growth in mobility, e.g. avg. trip length:– 1890: 7 miles – city area = πx72= 153.9 square miles– 1900: 10.5 miles – city area = πx10.52= 346.4 square miles

Changing views of streetcar systemsat the turn of the century
Pre-1900 Post-1900

The Fall of Transit
“Few industries have risen so rapidly or declined so quickly, and no industry of its size has had a worse financial record”
– J. Vance

Streetcar Problems
• Misguided public policy– Multiple companies within each city– Insistence on 5 cent fare
• Poor financial management– Systems heavily over-built and over-expanded– 5 cent flat fare didn’t cover cost of expansion– Costs of upkeep put off

Interesting Implications
• Private industry but in effect a subsidy from investors to general public
• Poor management led to dramatic and lasting change in form of cities

Urban Situation 1900 to 1920
• Massive urban growth• Fringe growing faster than center• Increasing criticisms of streetcars
Film of Market Street in 1905…

Mass Transit
http://www.nycsubway.org/perl/caption.pl?/img/irt/building-1.jpg; http://www.nycsubway.org/irt/irtbld.html
New York, Boston, Chicago NY’s last cable car – 1905NY’s last horse-car line – 1917

Options for Streetcar Companies following cost rises during WWI
• Raise fare… – cities wouldn’t let them
• Increase ridership, e.g. through land speculation…– riders didn’t come.
• Get public subsidy…– voters rejected it.
• Result: Streetcars reached peak in 1923
Government actionGovernment inactionPublic choice

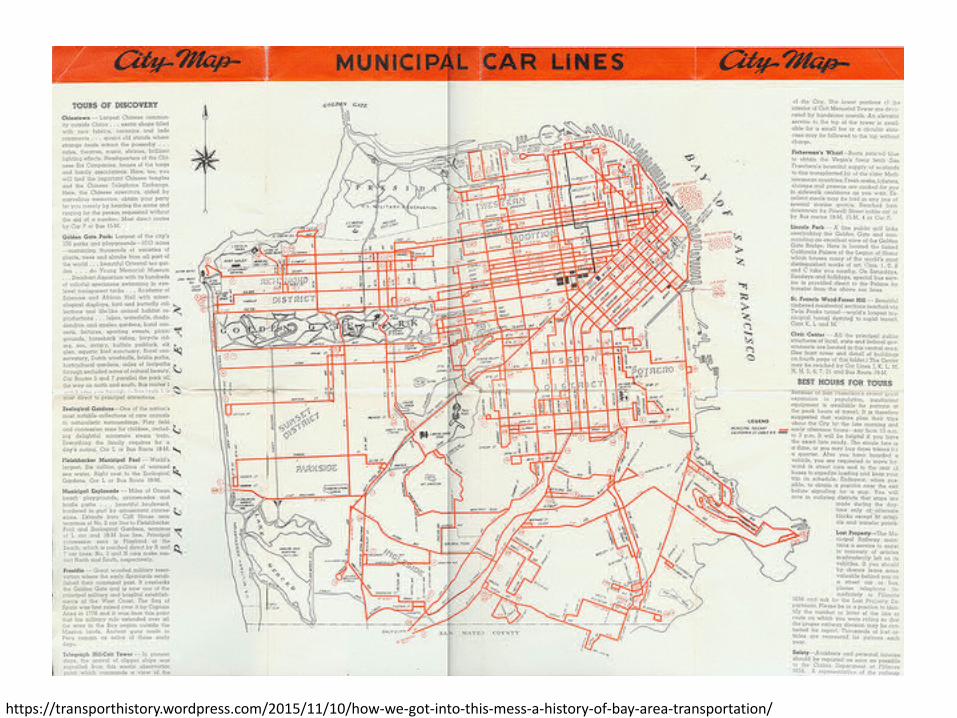
Bay Area Streetcars
Source: http://www.trainweb.org/mts/ctc/ctc06.html: http://en.wikipedia.org/wiki/Key_System

After 100 Years, Muni Has Gotten Slower
The Bay Citizen, March 31, 2012
The San Francisco Muni is turning 100 this year. And in that century of great technological progress, in which an aircraft broke the sound barrier in 1947 and a supersonic car did the same in 1997, Muni has actually become slower.
“Streetcars ruled the road, and there wasn’t much getting in the way — no car traffic — and we didn’t have all the traffic lights and stop signs,” said Peter Straus, a retired Muni service planner.
“I wouldn’t be surprised if a horse-drawn carriage got there faster than Muni,” Angie Murphy, a regular Muni commuter.
http://www.nytimes.com/2012/04/01/us/san-francisco-muni-strives-to-recapture-streetcar-speeds-of-1912.html

LA’s Red Car System
http://latimes.image2.trb.com/lanews/media/photo/2009-02/14250188.jpg
http://www.usc.edu/libraries/archives/la/historic/redcars/redcar_map.jpeg

http://land.allears.net/blogs/jackspence/Red%20Car%2004.jpg
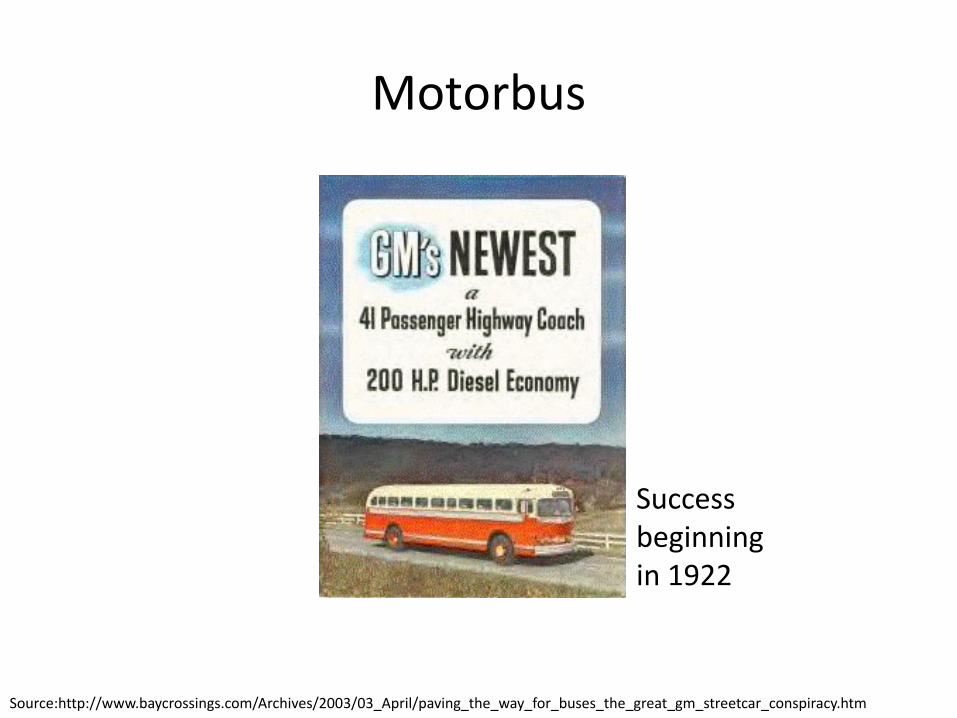
Motorbus
Source:http://www.baycrossings.com/Archives/2003/03_April/paving_the_way_for_buses_the_great_gm_streetcar_conspiracy.htm
Success beginning in 1922


Situation in 1930s
• Depression meant slowdown in urban growth, lay offs of urban workers
• Public criticisms of large investments in subways• Merchants in outlying areas opposed investments• Planners opposed elevateds and subways
– Thought it would make congestion worse– Thought it would increase centralization
• Public subsidies for highways, education, housing, other programs, but not for transit
• Increase in busses – “trackless trolleys”


1950s Situation
• Role of General Motors:– Bought up bankrupt streetcar systems in 1920s,
replaced with busses– Found guilty of criminal conspiracy in 1950s
• Role of Public Sector:– Cities bought up streetcar and bus operations
beginning in depression– Nearly all systems converted to public by end of
1950s– Talk of federal funding for transit but no action
https://transporthistory.wordpress.com/2015/11/10/how-we-got-into-this-mess-a-history-of-bay-area-transportation/
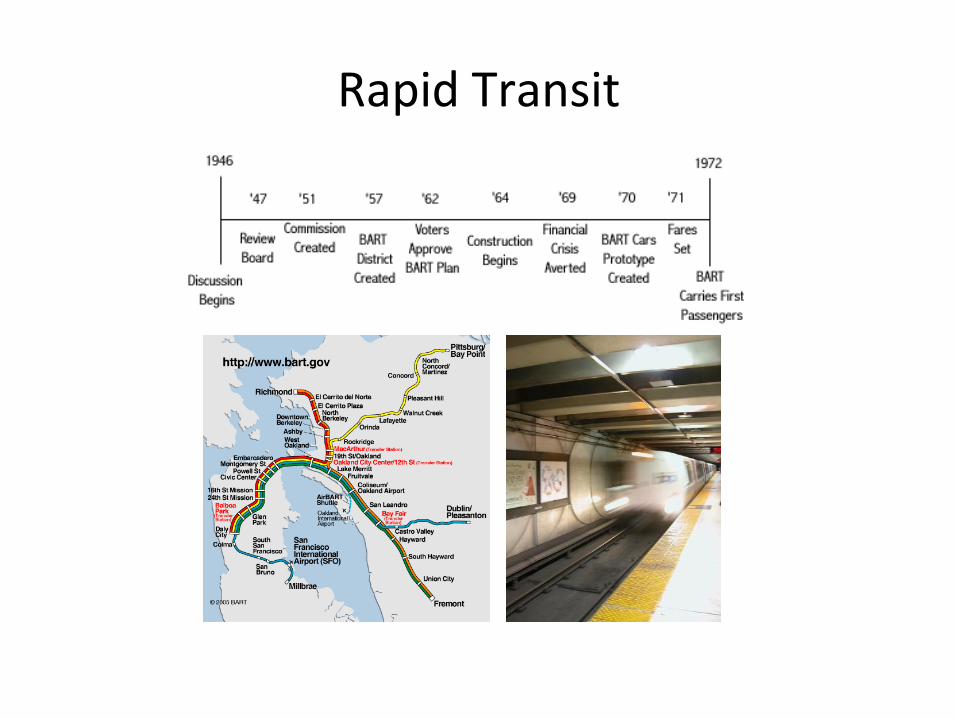
Rapid Transit

The Rise of the Automobile
• Recreational car era (1920-1945)• Freeway era (1945 – now)

Recreational car era (1920-1945)
Source: http://www.autolife.umd.umich.edu/Environment/E_Overview/E_Overview6.htm#scenic

By the 1920s
• Ford Model T– $600 in 1913– $393 in 1923
• Auto ownership– 1 car for every 13 Americans
in 1920– 1 car for every 5 Americans in 1929
• Cheaper to own a house in the suburbs with a car than own house in city

Growth in Auto Ownership

WWII Drive-Less Campaign

Freeway era (1945 – now)
• After WWII, increased demand for cars:– Pent-up demand and rising incomes – Increasing suburbanization

Growth in Auto Ownership
0
50,000,000
100,000,000
150,000,000
200,000,000
250,000,000
300,000,000
350,000,000
1900 1910 1920 1930 1940 1950 1960 1970 1980 1990 2000 2010
Vehicles
Population
Source: Highway Statistics, Bureau of Transportation Statistics


Public Sector Support for Cars from the Start
• Cars seen as way to decentralize, to get people away from ills of the city
• Public investment seen as needed to improve roads and reduce congestion
More next time!

“Taken for a Ride”
• What was the state of the streetcar systems by the 1950s?
• What were the options for the streetcar systems at that time?
• What role did GM play in determining their future?• Who were the other players and what roles did they
play?• What did people really want at that time?• What about the role of government?• What points especially strike you or surprise you from the
movie?
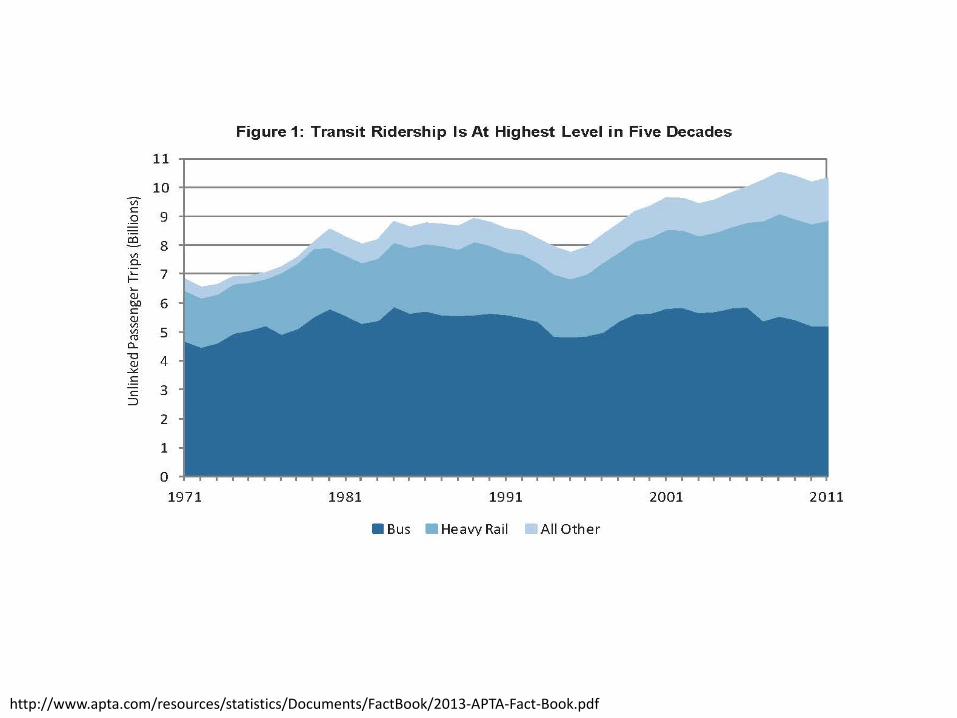
http://www.apta.com/resources/statistics/Documents/FactBook/2013-APTA-Fact-Book.pdf
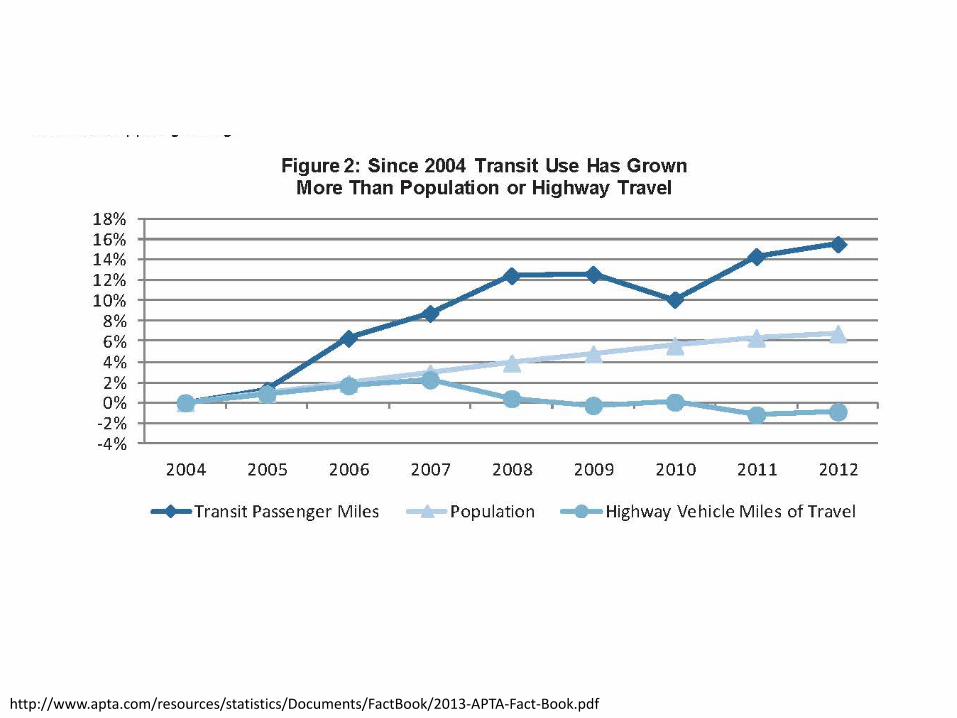
http://www.apta.com/resources/statistics/Documents/FactBook/2013-APTA-Fact-Book.pdf

Bike sharing45 operations in the U.S. as of Jan 2015
Solving the first-mile, last-mile problem?
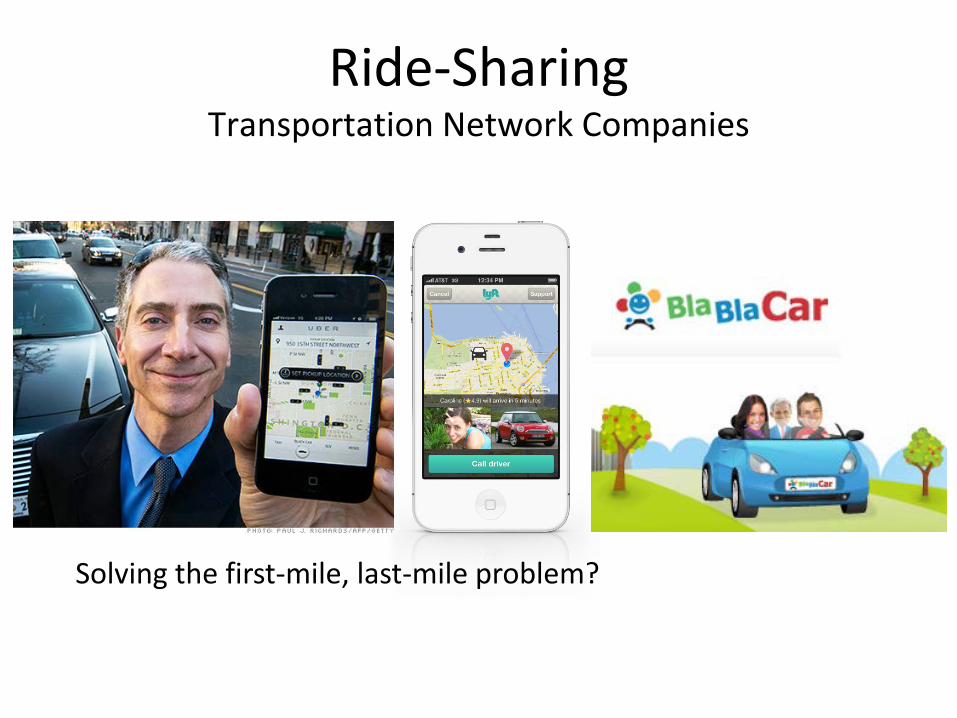
Ride-SharingTransportation Network Companies
Solving the first-mile, last-mile problem?

http://www.bizjournals.com/sanfrancisco/blog/2015/03/leap-transit-commuter-bus-san-francisco-loup.html
Micro-transit on demande.g Bridj, Chariot, Leap
Competing with public transit?Getting people out of their cars?

Check out this video:Future Transportation Technology Will Blow Your Mind

Next up:History of Federal
Transportation Policy