a little help: the impact of on-line calculators and ...€¦ · financial advisors on setting...
TRANSCRIPT

A monthly newsletter from the EBRI Education and Research Fund © 2013 Employee Benefit Research Institute
March 2013 • Vol. 34, No. 3
A Little Help: The Impact of On-line Calculators and Financial Advisors on Setting Adequate Retirement-Savings Targets: Evidence from the 2013 Retirement Confidence Survey, p. 2
“Post” Script: What’s Next for Employment-Based Health Benefits? p. 16
A T A G L A N C E
A Little Help: The Impact of On-line Calculators and Financial Advisors on Setting Adequate Retirement-Savings Targets: Evidence from the 2013 Retirement Confidence Survey, by Jack VanDerhei, Ph.D., and Nevin Adams, J.D., EBRI Those using an on-line calculator or asking a financial advisor appear to set more adequate savings targets, as
measured by the probability of not running short of money in retirement.
Those in the lowest-income quartile show a 9.1−12.6 percentage point improvement (depending on family/gender) in the probability of not running short of money in retirement if a financial advisor has been asked, and a 14.6−18.2 percentage point increase if an on-line calculator is used.
Those who “guessed” at a retirement savings target were less likely to choose an adequate target.
“Post” Script: What’s Next for Employment-Based Health Benefits? by Nevin Adams, J.D., EBRI At EBRI’s 71st policy forum, some of the nation’s top health policy experts raised these points, among others:
Recent discussions in Congress to possibly cap or reduce the tax exclusion for health benefits could result in a big shock for workers.
A major problem underlying rising healthcare spending is the nation’s rapidly aging population.
While health care cost trends made change inevitable, PPACA exacerbated the impact on two key fronts: the administrative difficulties in dealing with health exchanges, and the fees imposed on employers.
For small employers, the attraction of having workers get health coverage through a health exchange (rather than their jobs) is going to be very strong.
ebri.org Notes • March 2013 • Vol. 34, No. 3 2
A Little Help: The Impact of On-line Calculators and Financial Advisors on Setting Adequate Retirement-Savings Targets: Evidence from the 2013 Retirement Confidence Survey
By Jack VanDerhei, Ph.D., and Nevin Adams, J.D., Employee Benefit Research Institute
Introduction For nearly a quarter century, the Retirement Confidence Survey (RCS)1 has tracked how confident households are that they will have enough money to live comfortably throughout their retirement years. The 2013 RCS2 finds a decline in worker confidence, resuming the slow downward trend that began in 2008, along with the onset of the financial and real estate market crises in 2008 and 2009.
Previous simulation analysis by the Employee Benefit Research Institute (EBRI) has found that the percentage of households that would not have been “at risk” of running short of money in retirement except for the impact of the 2008–2009 crises, but that ended up “at risk” as a result, varies from a low of 3.8 percent to a high of 14.3 percent (depending on whether they had 401(k) and/or individual retirement account (IRA) accounts and whether they had net housing equity).3
In an attempt to test whether the 2008–2009 crisis produced a “new normal” with respect to workers’ expectations, Helman, Copeland and VanDerhei (March 2011) compared the average confidence for workers responding to the 2010 RCS vs. those in the 2011 RCS, plotting the average confidence against the empirical, age-specific retirement preparedness for each of four preparedness quartiles. Workers in the first (least-prepared) quartile had the lowest degree of actual preparedness,4 whereas those in the fourth (most-prepared) quartile had the highest. In general, if workers who have low actual preparedness levels for their ages became more realistic with respect to their confidence levels, one would expect to observe a significantly lower average confidence in 2011 compared with the 2010 level. That is indeed what is observed for the first quartile. However, those whose age-specific preparedness is relatively high (i.e., those in the fourth quartile) would not be expected to have much of a difference between the 2010 and 2011 levels (which was precisely what was observed).
As in previous years, the 2013 RCS asked workers how much they believed they (and their spouses) would need to accumulate by the time they retire so that they can live comfortably in retirement. While these results varied with the household’s expected retirement age and with whether they believed that a defined benefit pension plan will provide a major source of retirement income, EBRI has not previously evaluated how accurate those estimates might be in terms of the resulting probabilities of success, specifically the probability of NOT running short of money in retirement.
The results in this Notes article are based on a modified version of the EBRI Retirement Security Projection Model® (RSPM)5 used to produce the simulation results published in the March 2013 Money Magazine cover feature6 toassess the probability that respondent households would not run short of money in retirement if they did, in fact, accumulate the amount they said would be required in the 2013 RCS.7 To do so accurately, a couple of additional data filters must be applied. First, since there is no way to verify the likely amounts of defined benefit accruals that would be accumulated by retirement age, any household that indicated that an employer-provided, traditional pension or cash balance plan would be a major source of income in retirement was excluded.8
Secondly, previous EBRI research has found a significant association between the probability of not running short of money in retirement and the household’s retirement age.9 Therefore, for purposes of this analysis, only those
ebri.org Notes • March 2013 • Vol. 34, No. 3 3
households that designated age 65 as their expected retirement age were included.10 Applying both these filters provided a sample of 101 respondents with useable information (the methodology appears on pg. 9).
Results by Age, Income The modified Retirement Readiness Ratings® (RRRs) for the 2013 RCS respondents are provided in Figure 1, by age cohort. Based on those results, it seems that younger households are providing assessments of required savings that are more likely to be adequate than their older counterparts. Less than half (44.1 and 47.6 per-cent) of the simulated retirement paths for Early Boomers (individuals born between 1948–1954) and Late Boomers (born between 1955–1964) would have adequate retirement income based on their estimated savings target. However, 62.7 percent of the simulated retirement paths for the Generation X cohort (born between 1965–1980) and 55.4 percent of the Generation Y cohort (born after 1980) would have adequate retirement income based on their estimated savings target.
For comparison purposes, results for three of the four age cohorts modeled with the full 2010 RSPM are included in Figure 1.11 The RSPM 2010 results showed very little age-cohort impact, with the RRRs tightly banded between 53−56 percent for the Boomer and Generation X cohorts.12 However, it is important to note that these results are based on a full stochastic model that generates retirement savings under a full distribution of expected rates of return, as well as asset allocations, contribution rates, participation rates, and cash-outs prior to retirement. In contrast, the modified RRRs for the 2013 RCS respondents described above are based on their (single-point) expectations of retirement income needs. Moreover, in view of previous EBRI research on the importance of defined benefit accruals on retirement income adequacy, the modified RSPM’s exclusion of RCS respondents who assumed defined benefit plans would provide a major source of retirement income is likely to provide meaningful differences from the full RSPM results.13
Figure 2 illustrates the results of the modified RRR by relative income quartiles in real-dollar (inflation-adjusted) terms.14 Consistent with previous EBRI research applying the full RSPM model,15 there is a significant improvement in retirement readiness when considering the differences between findings for the lowest-income quartile (26.0 percent of the simulated retirement paths are projected to have sufficient retirement income) and that of the highest-income quartile (75.9 percent of the simulated retirement paths would have sufficient retirement income).
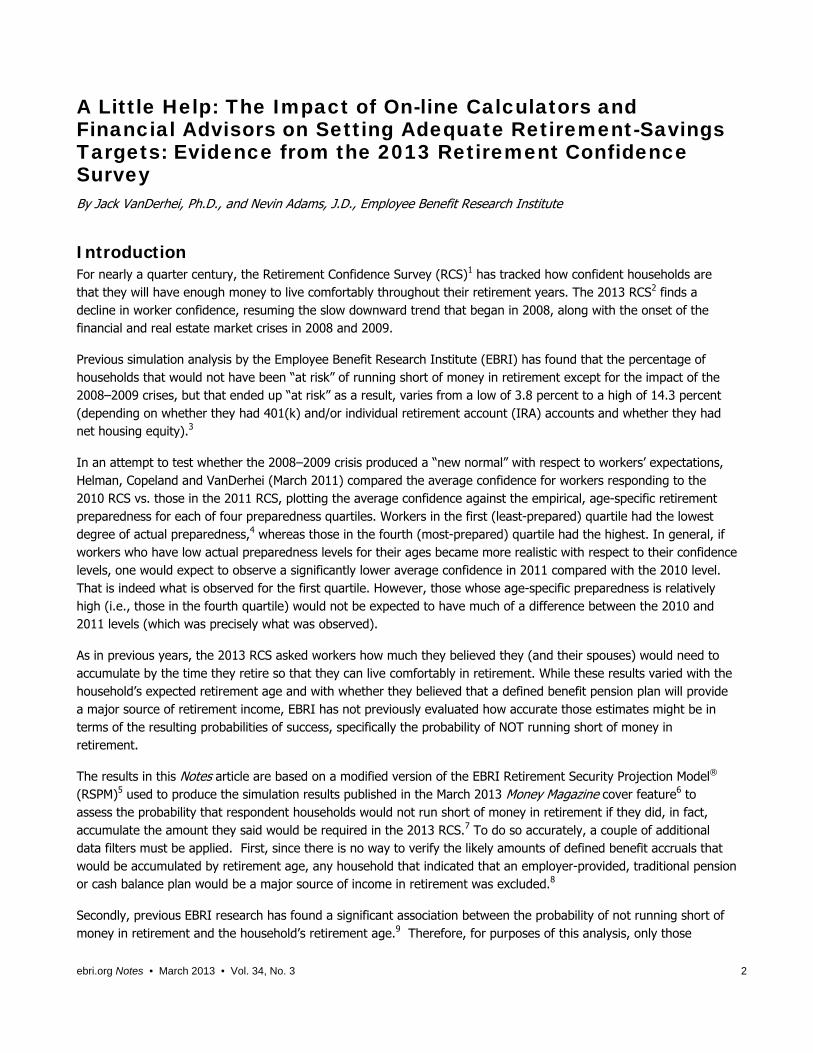
As Cheaply As One? Figure 3 shows the modified RRR results by family status and gender. Previous EBRI research with the full RSPM model has used similar categorizations to investigate the unconditional Retirement Savings Shortfall (RSS).16 Unlike the RRR, this metric combines the probability of having adequate retirement income with the magnitude of any simu-lated shortfalls. In VanDerhei (May 2012), the unconditional RSS was found to be significantly lower for single males than single females, and the (per-person) RSS for married household respondents to the 2013 RCS is even lower than for single males. While the decumulation module of the RSPM recognizes that expenses for married households would be expected to be higher than their single male or single female counterparts while both members are still alive, other things being equal, the results in Figure 3 suggest that married households may not be taking those additional expenses fully into account. The modified RRR values suggest that nearly two-thirds (66.1 percent) of simulated retirement paths for single males would have adequate retirement income, and single females chose savings targets with a modified RRR almost as large (61.6 percent). However, less than half (45.8 percent) of the simulated retire-ment paths of married households would have adequate retirement income based on their chosen savings targets.
Impact of On-Line Calculators, Advisors Today, individuals have available to them a wide and expanding variety of tools and resources to help them make more informed decisions about their retirement savings needs. This section provides an assessment of the association

Early Boomers Late Boomers Generation X Generation YRCS 2013 44.1% 47.6% 62.7% 55.4%RSPM Baseline
(2010) 52.8% 56.3% 55.5% na
0%
10%
20%
30%
40%
50%
60%
70%
Figure 1Comparison of Retirement Readiness Ratings from 2010 RSPM
Baseline (Without Net Housing Equity Used for Retirement) With the Modified RRRs* for 2013 RCS Respondents
(only those expecting to retire at age 65 and without those expecting defined benefit plans to be a major source of retirement income)
Source: EBRI Retirement Security Projection Model® version 1685.* The modified Retirement Readiness Rating is simulated given the 2013 RCS respondents' age, income, gender, and family status and their response to: "amount you think you (and your spouse) will need to accumulate in total by the time you retire so that you can live comfortably in retirement."
Lowest Income 2 3 HighestRRR 26.0% 42.4% 67.8% 75.9%
0%
10%
20%
30%
40%
50%
60%
70%
80%
Figure 2Modified RRRs* for 2013 RCS Respondents, by Relative Income Quartile
(only those expecting to retire at age 65 and without those expecting defined benefit plans to be a major source of retirement income)
Source: EBRI Retirement Security Projection Model® version 1685.* The modified Retirement Readiness Rating is simulated given the 2013 RCS respondents' age, income, gender, and family status and their response to: "amount you think you (and your spouse) will need to accumulate in total by the time you retire so that you can live comfortably in retirement."
ebri.org Notes • March 2013 • Vol. 34, No. 3 4
ebri.org Notes • March 2013 • Vol. 34, No. 3 5
of various household behaviors/beliefs with the selection of adequate savings targets, as measured by the probability of having sufficient retirement income, after controlling for relative pre-retirement income-quartile and family/gender status.17
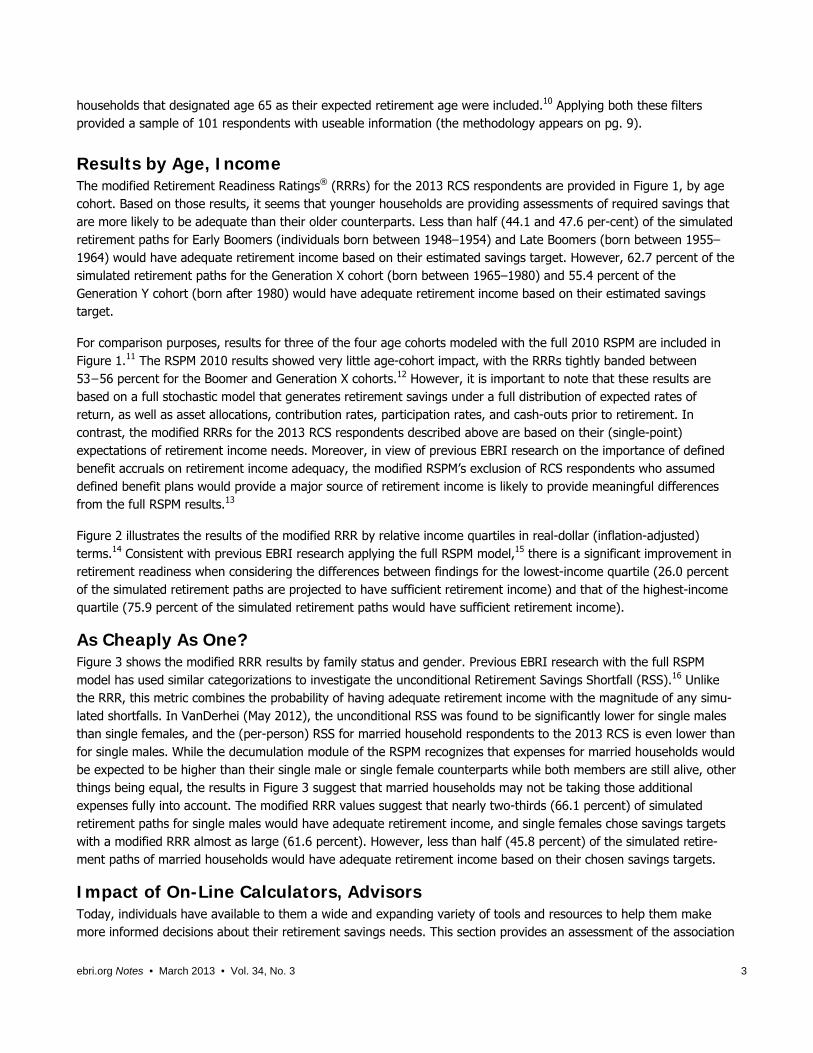
Figure 4 illustrates the association between the modified RRR values when the respondent used an on-line calculator to determine his or her savings target (a total of 7.9 percent of the 2013 RCS sample used in this analysis used an on-line calculator). An increase in the modified RRR values is predicted for each combination of relative income quartile and family/gender status. For those in the lowest relative income quartile, the increase in the modified RRR value—that is, the increase in the likelihood of establishing a retirement savings target adequate to provide sufficient income in retirement—ranged from 14.6 to 18.2 percentage points. In view of their higher modified RRR values, reflective of a higher savings threshold to provide retirement income adequacy, one would expect that, in general, the percentage-point increase would tend to be smaller for those in higher relative income quartiles as shown in Figure 4. Indeed, the increase in modified RRR values ranged from 8.7 to 14.7 percentage points for those in the highest relative income quartile.
Figure 5 provides a picture of the association between the modified RRR values when the respondent sought the counsel of a financial advisor (a total of 17.6 percent of the 2013 RCS sample used in this analysis asked a financial advisor). For those in the lowest relative income quartile, the increase in the modified RRR value—that is, the betterment in their likelihood of having established an adequate retirement target—ranged from 9.1 to 12.6 percent-age points. Among those in the highest relative income quartile, the increase in modified RRR values ranged from 6.3 to 11.0 percentage points.
Single Male Single Female Married
RRR 66.1% 61.6% 45.8%
0%
10%
20%
30%
40%
50%
60%
70%
Figure 3
Modified RRRs* for 2013 RCS Respondents, by Gender/Family Status (only those expecting to retire at age 65 and without those expecting
defined benefit plans to be a major source of retirement income)
Source: EBRI Retirement Security Projection Model® version 1685.* The modified Retirement Readiness Rating is simulated given the 2013 RCS respondents' age, income, gender, and family status and their response to: "amount you think you (and your spouse) will need to accumulate in total by the time you retire so that you can live comfortably in retirement."

family single female single male
lowest 14.6% 18.1% 18.2%
second 18.0% 17.6% 17.3%
third 16.8% 12.0% 11.4%
highest 14.7% 9.3% 8.7%
0%
2%
4%
6%
8%
10%
12%
14%
16%
18%
20%
Figure 4
Estimated Percentage-Point Increase in Modified RRRs* for 2013 RCS Respondents Who Used an On-line Calculator to Determine the Savings Target,
by relative income quartile and gender/family status (only those expecting to retire at age 65 and without those expecting
defined benefit plans to be a major source of retirement income)
Source: EBRI Retirement Security Projection Model® version 1685.* The modified Retirement Readiness Rating is simulated given the 2013 RCS respondents' age, income, gender, and family status and their response to: "amount you think you (and your spouse) will need to accumulate in total by the time you retire so that you can live comfortably in retirement."
family single female single male
lowest 9.1% 12.5% 12.6%
second 12.3% 12.4% 12.2%
third 12.4% 9.1% 8.6%
highest 11.0% 6.7% 6.3%
0%
2%
4%
6%
8%
10%
12%
14%
Figure 5
Estimated Percentage-Point Increase in Modified RRRs* for 2013 RCS Respondents Who Asked a Financial Advisor to Determine the Savings Target,
by Relative Income Quartile and Gender/Family Status(only those expecting to retire at age 65 and without those expecting
defined benefit plans to be a major source of retirement income)
Source: EBRI Retirement Security Projection Model® version 1685.* The modified Retirement Readiness Rating is simulated given the 2013 RCS respondents' age, income, gender, and family status and their response to: "amount you think you (and your spouse) will need to accumulate in total by the time you retire so that you can live comfortably in retirement."
ebri.org Notes • March 2013 • Vol. 34, No. 3 6
family single female single male
lowest -5.7% -8.1% -8.3%
second -8.0% -8.7% -8.6%
third -8.6% -6.8% -6.4%
highest -7.8% -5.3% -4.9%
-10%
-9%
-8%
-7%
-6%
-5%
-4%
-3%
-2%
-1%
0%
Figure 6
Source: EBRI Retirement Security Projection Model® version 1685.* The modified Retirement Readiness Rating is simulated given the 2013 RCS respondents' age, income, gender, and family status and their response to: "amount you think you (and your spouse) will need to accumulate in total by the time you retire so that you can live comfortably in retirement."
Estimated Percentage-Point Increase in Modified RRRs* for 2013 RCS Respondents Who Guessed to Determine Their Savings Target,
by Relative Income Quartile and Gender/Family Status(only those expecting to retire at age 65 and without those expecting
defined benefit plans to be a major source of retirement income)
family single female single male
lowest -4.7% -6.6% -6.6%
second -6.9% -7.4% -7.3%
third -7.1% -5.6% -5.6%
highest -6.2% -4.3% -4.2%
-8%
-7%
-6%
-5%
-4%
-3%
-2%
-1%
0%
Figure 7
Estimated Percentage-Point Increase in Modified RRRs* for 2013 RCS Respondents Who Are Very or Somewhat Confident That They Will Have
Enough Money to Live Comfortably Through Their Retirement Years,by Relative Income Quartile and Gender/Family Status
(only those expecting to retire at age 65 and without those expecting defined benefit plans to be a major source of retirement income)
Source: EBRI Retirement Security Projection Model® version 1685.* The modified Retirement Readiness Rating is simulated given the 2013 RCS respondents' age, income, gender, and family status and their response to: "amount you think you (and your spouse) will need to accumulate in total by the time you retire so that you can live comfortably in retirement."
ebri.org Notes • March 2013 • Vol. 34, No. 3 7

ebri.org Notes • March 2013 • Vol. 34, No. 3 8
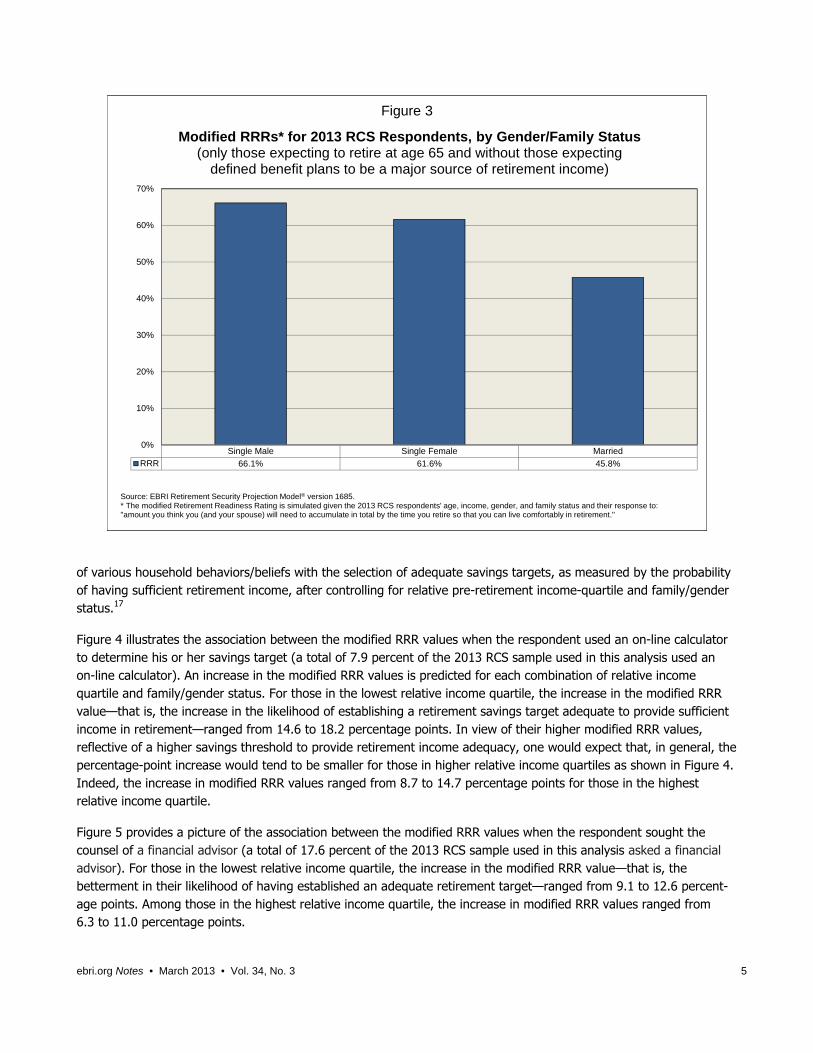
“Over” Confident? Figure 6 provides an assessment of the association between the modified RRR values and whether the respondent “guessed” to determine their savings (a total of 44.6 percent of the 2013 RCS sample used in this analysis said they determined their savings target by guessing). Perhaps highlighting the inexactitude inherent with the process of guessing about a complex result, one might well expect, and the results show, a decrease in the modified RRR values predicted for each combination of relative income quartile and family/gender status. The estimated impact is rather tightly bound, with a range of only -4.9 to -8.7 percentage points.
Finally, Figure 7 provides a visualization of the association between the modified RRR values and whether the respondent is either somewhat or very confident that he or she will have enough money to live comfortably through his or her retirement years (a total of 53.1 percent of the 2013 RCS sample used in this analysis are in this category). Similar to the results displayed in Figure 6, a decrease in the modified RRR values is predicted for each combination of relative income quartile and family/gender status, suggesting that their confidence may be misplaced, relative to the actual projected retirement savings needs. Once again, not only is the estimated impact rather tightly bounded, with a range of only -4.2 to -7.4 percentage points, but the impact is generally larger for those in the lower relative income quartiles.
Conclusions As American workers bear a growing responsibility for accumulating retirement income and managing the drawdown of those savings during retirement, it is more important than ever that households be able to set adequate targets for their retirement savings.
For nearly a quarter century the Retirement Confidence Survey (RCS) has garnered a sense of American worker and retiree confidence about their financial prospects in retirement. This analysis of the retirement savings targets set by individual respondents to the 2013 RCS, coupled with the EBRI Retirement Security Projection Model® (RSPM), provides an assessment of how various household behaviors/beliefs are associated with the adequacy of retirement savings targets, as indicated by the modified Retirement Readiness Rating® (RRR) values. It finds that both the use of on-line calculators and seeking the advice of financial advisors result in estimated savings targets that not only increase the estimated probability of retirement income adequacy, but also result in double-digit percentage-point increases for many of the groups when analyzed by relative income quartiles and family/gender combinations.
On the other hand, those who “guessed” at those targets tended to underestimate their savings needs, as did the subset in this sampling that were somewhat or very confident in their prospects. Unfortunately, only about one-fourth of the sample studied (25.6 percent) used either of these two methods. Respondents in the RCS sample were much more likely to simply guess (44.6 percent) at their savings needs; not surprisingly, this study finds a significant decrease in the estimated probability of retirement income adequacy based on the savings targets derived from guessing.
While the implications for these three behaviors may appear intuitive (more adequate savings targets established by those who use on-line calculators and those who seek the advice of financial advisors, less adequate for those who guess at the proper amount), the problem of overconfidence (or false confidence) suggested by Figure 7 appears to be more problematic. While 65.0 percent of the 2013 RCS sample that used either on-line calculators or asked the advice of financial advisors were somewhat or very confident that they will have enough money to live comfortably through their retirement years, nearly half (44.6 percent) of those who simply guessed were also somewhat or very confident.
Clearly, confidence alone is insufficient to assure the establishment of savings targets sufficient to provide adequate income throughout retirement. More importantly, it would appear that encouraging the broader use of tools, such as

ebri.org Notes • March 2013 • Vol. 34, No. 3 9
on-line calculators, or the services of trained professionals, such as licensed financial advisors, would be an important public-policy consideration.
Methodology The following variables were obtained from the 2013 RCS:18
The midpoint for the respondent’s savings target at age 65. This was accumulated at an assumed Consumer
Price Index for Urban Wage Earners and Clerical Workers (CPI-W) rate of 2.8 percent until the year the
respondent turns 65.19
The midpoint for individual household income, which was accumulated at a real wage differential of 1.2 percent
until the year the respondent turns 65.
The annual Social Security benefit commencing at age 65 was obtained from the Social Security Quick Calculator,20
assuming the household income was earned equally by both members of the household.21
These values were then added to a modified version of the RSPM (in essence circumventing the accumulation
module and assuming a deterministic value for savings and pre-retirement income). Additionally, the modeling
assumed that net housing equity was not used for retirement income purposes, and defined benefit accruals were
assumed to be zero. A total of 1,000 post-retirement scenario alternatives were simulated for each household.22
Appendix A: Brief Description of the RSPM One of the basic objectives of the RSPM is to simulate the percentage of the population that will be “at risk” of not having retirement income adequate to cover average expenses and uninsured health care costs at age 65 or older throughout retirement in specific income and age groupings. The RRR also provides information on the distribution of the likely number of years before those at risk “run short of money,” as well as the percentage of compensation they would need in terms of additional savings in order to have a 50, 70, or 90 percent probability of retirement-income adequacy.
VanDerhei (February 2011) describes how households (with heads who are currently ages 36–62) are tracked through retirement age, and how their retirement income/wealth is simulated for the following components:
Social Security.
Defined contribution balances.
IRA balances.
Defined benefit annuities and/or lump-sum distributions.
Net housing equity.
A household is considered to run short of money in this model if aggregate resources in retirement are not sufficient to meet minimum retirement expenditures, defined as a combination of deterministic expenses from the Consumer Expenditure Survey (as a function of income), and some health insurance and out-of-pocket health-related expenses, plus stochastic expenses from nursing home and home health care (at least until the point such expenses are picked up by Medicaid). This version of the model is constructed to simulate retirement income adequacy, as noted above. Alternative versions of the model allow similar analysis for replacement rates, standard-of-living calculations, and other ad hoc thresholds.

ebri.org Notes • March 2013 • Vol. 34, No. 3 10
The baseline version of the model used for this analysis assumes all workers retire at age 65 and immediately begin to withdraw money from their individual accounts (defined contribution and cash balance plans, as well as IRAs) whenever the sum of their expenses and uninsured medical expenses exceed the after-tax annual income from Social Security and defined benefit plans (if any). If there is sufficient money to pay expenses without tapping into the tax-qualified individual accounts, the excess is assumed to be invested in a non-tax-advantaged account where the investment income is taxed as ordinary income. Individual accounts are tracked until the point at which they are depleted. At that point, any net housing equity is assumed to be added to retirement savings in the form of a lump-sum distribution (not a reverse annuity mortgage). If all the retirement savings are exhausted and if the Social Security and defined benefit payments are not sufficient to pay expenses, the entity is designated as having “run short of money” at that time.
Appendix B: Brief Chronology of EBRI’s Retirement Security Projection Model® 2001 The RSPM grew out of a multi-year project to analyze the future economic well-being of the retired
population at the state level. EBRI and the Milbank Memorial Fund, working with the office of the governor of Oregon, set out in the late 1990s to see if this situation could be evaluated for the state. The resulting analysis (VanDerhei and Copeland, 2001a) focused primarily on simulated retirement wealth with a comparison to ad hoc thresholds for retirement expenditures.
2002 With the assistance of the Kansas Insurance Department, EBRI was able to create RRRs based on a full stochastic decumulation model that took into account the household’s longevity risk, post-retirement investment risk, and exposure to potentially catastrophic nursing-home and home-health-care risks.
The first state-level RSPM results were presented to the Kansas’ Long-Term Care Services Task Force on July 11, 2002 (VanDerhei and Copeland, July 2002), and the results of the Massachusetts study were presented on Dec. 1, 2002 (VanDerhei and Copeland, December 2002).
2003 RSPM was expanded to a national model -- the first national, micro-simulation, retirement-income-adequacy model, built in part from administrative 401(k) data. The initial results were presented at the EBRI December 2003 policy forum (VanDerhei and Copeland, 2003). The basic model was subsequently modified to quantify the beneficial impact of a mandatory contribution of 5 percent of compensation for testimony for the Senate Special Committee on Aging (VanDerhei, January 2004).
2004 The model was enhanced to allow an analysis of the impact of annuitizing defined contribution and IRA balances at retirement age (VanDerhei and Copeland, 2004).
2005 Additional refinements were introduced to evaluate the impact of purchasing long-term care insurance on retirement income adequacy (VanDerhei, 2005).
2006 The model was used to evaluate the impact of defined benefit freezes on participants by simulating the minimum employer-contribution rate that would be needed to financially indemnify the employees for the reduction in their expected retirement income under various rate-of-return assumptions (VanDerhei, March 2006).
Later that year, an updated version of the model was developed to enhance the EBRI interactive Ballpark E$timate® by providing Monte Carlo simulations of the replacement rates needed for specific probabilities of retirement-income adequacy under alternative-risk-management treatments (VanDerhei, September 2006).

ebri.org Notes • March 2013 • Vol. 34, No. 3 11
2008 RSPM was significantly enhanced for the May 2008 EBRI policy forum by allowing automatic enrollment of 401(k) participants with the potential for automatic escalation of contributions to be included (VanDerhei and Copeland, 2008).
2009 Additional modifications were added for a Pension Research Council presentation that involved a “winners/losers” analysis of defined benefit freezes and the enhanced employer contributions provided to defined contribution plans at the time the defined benefit plans were frozen (Copeland and VanDerhei, 2010).
Also in 2009, a new subroutine was added to allow simulations of various styles of target-date funds for a comparison with participant-directed investments (VanDerhei, June 2009).
2010 In April 2010, the model was completely re-parameterized with 401(k)-plan design parameters for sponsors that had adopted automatic-enrollment provisions (VanDerhei, April 2010). A completely updated version of the national model was produced for the May 2010 EBRI policy forum and used in the July 2010 Issue Brief (VanDerhei and Copeland, 2010).
The new model was used to analyze how eligibility for participation in a defined contribution plan impacts retirement income adequacy in September 2010 (VanDerhei, September 2010), and was later used to compute RSSs for Baby Boomers and Generation Xers in October 2010 (VanDerhei, October 2010a).
In October testimony before the Senate Health, Education, Labor and Pensions Committee on “The Wobbly Stool: Retirement (In)security in America,” the model was used to analyze the relative importance of employer-provided retirement benefits and Social Security (VanDerhei, October 2010b).
2011 In February the model was used to analyze the impact of the 2008–2009 crisis in the financial and real estate markets on retirement income adequacy (VanDerhei, February 2011).
An April 2011 article introduced a new method of analyzing the results from RSPM (VanDerhei, April 2011). Rather than simply computing an overall percentage of the simulated life paths in a particular cohort that would not have sufficient retirement income to pay for the simulated expenses, the new method computed the percentage of households that would meet that requirement more than a specified percentage of times in the simulation.
As explored in the June 2011 EBRI Issue Brief, the RSPM allowed retirement-income adequacy to be assessed at retirement ages later than 65 (VanDerhei and Copeland, June 2011).
In a July 2011 EBRI Notes article (VanDerhei, July 2011), RSPM was used to provide preliminary evidence of the impact of the “20/20 caps” on projected retirement accumulations proposed by the National Commission on Fiscal Responsibility and Reform.
The August 2011 EBRI Notes article (VanDerhei, August 2011) used RSPM to demonstrate the impact of defined benefit plans in achieving retirement income adequacy for Baby Boomers and Gen Xers.
In September, it was used to support testimony before the Senate Finance Committee (VanDerhei, September 2011) in analyzing the potential impact of various types of tax-reform options on retirement income. This was expanded in the November 2011 EBRI Issue Brief (VanDerhei, November 2011).
2012 A March 2012 EBRI Notes article (VanDerhei, March 2012) used new survey results to update the analysis of the potential impact of various types of tax-reform options on retirement income.
The May 2012 EBRI Notes article (VanDerhei, May 2012) provided 2012 updates for the previously published RRRs as well as the RSS.

ebri.org Notes • March 2013 • Vol. 34, No. 3 12
The June 2012 EBRI Notes article (VanDerhei, June 2012) introduced severity categories in the RSS projections for Gen Xers.
The August 2012 EBRI Notes article (VanDerhei, August 2012) provided additional evidence on whether deferring retirement to age 70 would provide retirement income adequacy for the vast majority of Baby Boomers and Gen Xers.
The September 2012 EBRI Notes article (VanDerhei, September 2012) analyzed the impact of increasing the default contribution rate for automatic enrollment 401(k) plans with automatic escalation of contributions.
The November 2012 EBRI Notes article (VanDerhei, November 2012) reclassified the RRRs to provide additional information on those substantially above the threshold; close to the threshold; and substantially below the threshold.
References Braverman, Beth, Donna Rosato, and Penelope Wang. “Dream Big, Act Now: Six Secrets to a Dream
Retirement.” Money Magazine. March 2013. http://money.cnn.com/2013/02/18/retirement/investments-stocks-funds.moneymag/
Copeland, Craig, and Jack VanDerhei. “The Declining Role of Private Defined Benefit Pension Plans: Who Is Affected, and How.” In Robert L. Clark and Olivia Mitchell, eds., Reorienting Retirement Risk Management. Oxford University Press for the Pension Research Council, 2010: 122–136.
Helman, Ruth, Craig Copeland, and Jack VanDerhei. “The 2011 Retirement Confidence Survey: Confidence Drops to Record Lows, Reflecting “the New Normal”” EBRI Issue Brief, no. 355 (Employee Benefit Research Institute, March 2011).
VanDerhei, Jack. “All or Nothing? An Expanded Perspective on Retirement Readiness.” EBRI Notes, no. 11 (Employee Benefit Research Institute, November 2012): 11-23.
.“ Increasing Default Deferral Rates in Automatic Enrollment 401(k) Plans: The Impact on Retirement Savings Success in Plans With Automatic Escalation.” EBRI Notes, no. 9 (Employee Benefit Research Institute, September 2012): 12-22.
. “Is Working to Age 70 Really the Answer for Retirement Income Adequacy?” EBRI Notes, no. 8 (Employee Benefit Research Institute, August 2012): 10–21.
. “Retirement Readiness Ratings and Retirement Savings Shortfalls for Gen Xers: The Impact of Eligibility for Participation in a 401(k) Plan.” EBRI Notes, no. 6 (Employee Benefit Research Institute, June 2012): 9–21.
. “Retirement Income Adequacy for Boomers and Gen Xers: Evidence from the 2012 EBRI Retirement Security Projection Model.®” EBRI Notes, no. 5 (Employee Benefit Research Institute, May 2012): 2–14.
. “Modifying the Federal Tax Treatment of 401(k) Plan Contributions: Projected Impact on Participant Account Balances.” EBRI Notes, no. 3 (Employee Benefit Research Institute, March 2012): 2–18.
. “Tax Reform Options: Promoting Retirement Security.” EBRI Issue Brief, no. 364 (Employee Benefit Research Institute, November 2011).
ebri.org Notes • March 2013 • Vol. 34, No. 3 13
. Testimony. U.S. Congress. Senate Finance Committee. Tax Reform Options: Promoting Retirement Security (T-170), 15 Sept. 2011.
. “The Importance of Defined Benefit Plans for Retirement Income Adequacy.” EBRI Notes, no. 8 (Employee Benefit Research Institute, August 2011): 7–16.
. “Capping Tax-Preferred Retirement Contributions: Preliminary Evidence of the Impact of the National Commission on Fiscal Responsibility and Reform Recommendations.” EBRI Notes, no. 7 (Employee Benefit Research Institute, July 2011): 2–6.
. “Retirement Income Adequacy: Alternative Thresholds and the Importance of Future Eligibility in Defined Contribution Retirement Plans.” EBRI Notes, no. 4 (Employee Benefit Research Institute, April 2011): 10-19.
. “A Post-Crisis Assessment of Retirement Income Adequacy for Baby Boomers and Gen Xers.” EBRI Issue Brief, no. 354 (Employee Benefit Research Institute, February 2011).
. Testimony. U.S. Congress. Senate Health, Education, Labor and Pensions Committee. The Wobbly Stool: Retirement (In)security in America (T-166), 7 Oct. 2010b.
. “Retirement Savings Shortfalls for Today’s Workers.” EBRI Notes, no. 10 (Employee Benefit Research Institute, October 2010a): 2−9.
. “Retirement Income Adequacy for Today’s Workers: How Certain, How Much Will It Cost, and How Does Eligibility for Participation in a Defined Contribution Plan Help?” EBRI Notes, no. 9 (Employee Benefit Research Institute, September 2010): 13–20.
. “The Impact of Automatic Enrollment in 401(k) Plans on Future Retirement Accumulations: A Simulation Study Based on Plan Design Modifications of Large Plan Sponsors.” EBRI Issue Brief, no. 341 (Employee Benefit Research Institute, April 2010).
. “Falling Stocks: What Will Happen to Retirees' Incomes? The Worker Perspective,” Presentation for The Economic Crisis of 2008: What Will Happen to Retirees’ Incomes? 2009 APPAM Fall Conference (November 2009).
. Testimony. Joint DOL/SEC Public Hearing on Target Dates Funds. How Would Target-Date Funds Likely Impact Future 401(k) Contributions? (T-160), June 2009.
. “The Expected Impact of Automatic Escalation of 401(k) Contributions on Retirement Income.” EBRI Notes, no. 9 (Employee Benefit Research Institute, September 2007): 2–8
. “Measuring Retirement Income Adequacy: Calculating Realistic Income Replacement Rates.” EBRI Issue Brief, no. 297 (Employee Benefit Research Institute, September 2006).
. “Defined Benefit Plan Freezes: Who's Affected, How Much, and Replacing Lost Accruals.” EBRI Issue Brief, no. 291 (Employee Benefit Research Institute, March 2006).
. “Projections of Future Retirement Income Security: Impact of Long Term Care Insurance.” 2005 American Society on Aging/National Council on Aging Joint Conference, March 2005.
. Testimony. U.S. Congress. Senate Special Committee on Aging. “Do We Have a Crisis in America? Results From the EBRI-ERF Retirement Security Projection Model” (T-141), 27 Jan. 2004.
VanDerhei, Jack, and Craig Copeland. “The Impact of Deferring Retirement Age on Retirement Income Adequacy.” EBRI Issue Brief, no. 358 (Employee Benefit Research Institute, June 2011).
. “The EBRI Retirement Readiness Rating:TM Retirement Income Preparation and Future Prospects.” EBRI Issue Brief, no. 344 (Employee Benefit Research Institute, July 2010).
ebri.org Notes • March 2013 • Vol. 34, No. 3 14
. “The Impact of PPA on Retirement Income for 401(k) Participants.” EBRI Issue Brief, no. 318 (Employee Benefit Research Institute, June 2008).
. “ERISA At 30: The Decline of Private-Sector Defined Benefit Promises and Annuity Payments: What Will It Mean?” EBRI Issue Brief, no. 269 (Employee Benefit Research Institute, May 2004).
. “Can America Afford Tomorrow's Retirees: Results From the EBRI-ERF Retirement Security Projection Model.®” EBRI Issue Brief, no. 263 (Employee Benefit Research Institute, November 2003).
. “Kansas Future Retirement Income Assessment Project.” A project of the EBRI Education and Research Fund and the Milbank Memorial Fund. July 16, 2002.
. “Massachusetts Future Retirement Income Assessment Project.” A project of the EBRI Education and Research Fund and the Milbank Memorial Fund. December 1, 2002.
. “Oregon Future Retirement Income Assessment Project.” A project of the EBRI Education and Research Fund and the Milbank Memorial Fund. 2001a.
. “A Behavioral Model for Predicting Employee Contributions to 401(k) Plans.” North American Actuarial Journal (2001b).
VanDerhei, Jack, and Lori Lucas. “The Impact of Auto-enrollment and Automatic Contribution Escalation on Retirement Income Adequacy.” EBRI Issue Brief, no. 349 (Employee Benefit Research Institute, November 2010); and DCIIA Research Report (November 2010).
Endnotes 1 The RCS is co-sponsored by the Employee Benefit Research Institute (EBRI), a private, nonprofit, nonpartisan, public-policy research organization, and Mathew Greenwald & Associates, Inc., a Washington, D.C.-based market-research firm. The 2013 RCS data collection was funded by grants from 20 organizations. The full report, RCS Fact Sheets, and other resources are on-line at www.ebri.org/surveys/RCS/2013
2 Helman, Adams, Copeland, and VanDerhei (March 2013).
3 VanDerhei (February 2011).
4 Actual preparedness is proxied by the ratio of: (1) the midpoint of the range of current savings divided by the midpoint of the range of current income divided by (2) the predicted savings/income ratio needed to produce a 75 percent, nominal replacement ratio when combined with average, current Social Security replacement ratios. The calculation assumes the worker starts saving at age 25 and retires at age 65. A linear trend is assumed for the predicted savings/income ratio during the working career, although more technically correct approximations (e.g., exponential curves) produce a similar conclusion.
5 See Appendix A for a technical summary of the RSPM and Appendix B for a brief chronology of the analyses previously conducted with the model.
6 Braverman, Rosato, and Wang (2013).
7 It is important to note that this article does not deal with the probability that the respondent households would actually accumulate this amount. See VanDerhei (May 2012) for a recent version of a model that provides a stochastic accumulation model that provides an entire distribution of likely results for a household at retirement age.
8 A similar analysis was conducted excluding only those households that expect a traditional pension or cash balance plan will be a major or minor source of income in retirement as well as those that currently have a defined benefit plan. The explanatory power of the model was similar in these cases, and the results for the variables of interest were largely unchanged.
9 VanDerhei (August 2012)

ebri.org Notes • March 2013 • Vol. 34, No. 3 15
10 For additional information on the likely impact of deferring retirement age with respect to at-risk ratings see VanDerhei and Copeland (2011).
11 The 2010 RRR was used as a comparison because the 2012 RRR had switched the baseline to net housing equity used as a lump-sum distribution. See VanDerhei (May 2012) for additional details.
12 Generation Y is not included in RSPM due to the difficulties in establishing future wage paths for these individuals at the current time.
13 VanDerhei (August 2011).
14 Family income was divided by two for purposes of this analysis.
15 VanDerhei and Copeland (July 2010).
16 See VanDerhei (October 2010a) for a full explanation of the Retirement Savings Shortfalls.
17 The results in Figures 4 through 7 are based on probit estimates (controlling for relative income quartiles and gender/family status) of 1,000 simulated retirement paths for each of the 101 respondents in the 2013 RCS who satisfied the filters previously mentioned.
18 The 2.8- and 1.2-percent assumptions were based on the alternative II assumptions from The Long-Range Economic Assumptions For The 2012 Trustees Report Office Of The Chief Actuary Social Security Administration, April 23, 2012.
19 The actual question asked: “How much do you think you (and your spouse) will need to accumulate in total by the time you retire so that you can live comfortably in retirement?” The assumption in this analysis is that they replied in 2013 dollars, and adjustments were made to inflate these numbers to the year they would reach age 65.
20 www.socialsecurity.gov/OACT/quickcalc/
21 A similar analysis was performed on the assumption that one of the spouses earned 100 percent of the income and the other received the spousal benefit under Social Security.
22 See Appendix A for more detail on the model.

ebri.org Notes • March 2013 • Vol. 34, No. 3 16
Steve Wojcik
“Post” Script: What’s Next for Employment-Based Health Benefits? By Nevin Adams, J.D., Employee Benefit Research Institute
Introduction On December 13, 2012, the Employee Benefit Research Institute (EBRI) convened its 71st biannual policy forum, focused on the topic: “’Post’ Script: What’s Next for Employment-Based Health Benefits?”
With the so-called fiscal cliff still looming, and the new Congress not yet in place, a wide range of national experts on U.S. health policy offered the roughly 130 attendees:
A post-election perspective on fiscal impacts from the federal budget.
New findings from the EBRI Center for Research on Health Benefits Innovation.
Insights on how employment-based health benefits might evolve between 2014−2018 as a result of the Patient Protection and Affordable Care Act (PPACA), as well as the budgetary issues confronting the nation, a new Congress, and a returning Obama administration.
“Come Hill or High Water” In a panel entitled, “Come Hill or High Water: A Post-Election Perspective on Fiscal Impacts,” Steve Wojcik, vice president of Public Policy at the National Business Group on Health, noted the high degree of uncertainty in the business community—both economic and in the area of health care and health benefits following enactment of the Patient Protection and Affordable Care Act (PPACA). Moreover, he noted that potential changes in the Medicare program (particularly raising the eligibility age, which he noted has a broad impact beyond Medicare for both employers and workers) contribute to the climate of uncertainty.
Into that mix, Wojcik noted that recent discussions in Washington about possibly capping or reducing the exclusion for health benefits would be a “big shock” for workers who have “no clue” what their employer is paying for those benefits. After the passage of PPACA, most employers did their due diligence and asked their consultants about options once the 2014 provisions begin coming online, he explained. “Most came to the conclusion that ‘we're offering benefits for good reasons that continue, including the tax advantages for both the employer and employee’—but if that is changed, that determination could change as well.” Part of that changing calculation could involve pressure on employers by workers to “make up” for the impact of taxation on these benefits in terms of additional compensation.
Numbers “Crunching” Wojcik noted that one of the most direct impacts of Medicare changes was likely to be for employers that offer pre-Medicare retiree coverage to pay even more for that benefit, even if it's an access-only plan. In terms of the added numbers and the length of service on the employer's plan, “it's going to add to their overall healthcare spending costs,” he explained, “because if employees stay working longer, that's going to have an impact on utilization and healthcare costs for employers—and for everybody in the plan.”
He explained that the average age and tenure of workers would likely change in response, and that employers hoping to encourage talented workers to stay longer would be helped by these changes. On the other hand, those not

ebri.org Notes • March 2013 • Vol. 34, No. 3 17
Randy Hardock
looking to cultivate that response might well have to change their workforce and retirement strategy to accommodate workers who are staying longer, perhaps in some kind of mentoring role or phased retirement.
He also noted that if there were any changes, such as reducing the tax credits for the exchange coverage, delaying the exchanges, or a stepped-up pressure to make exchange coverage affordable by paying providers less, those approaches could affect employers, particularly those with early retiree populations and workers eligible for COBRA, as well as part-timers who potentially could have or move to coverage via the exchanges.
Wojcik said that he anticipated “tremendous pressure” to make exchange coverage affordable, and that he thought there would be lots of pressure for hospitals and physicians to shift cost to the private sector, including the most obvious target: employment-based health plans. Moreover, he cautioned that if there were changes in PPACA provisions, that would have, and indeed, was already having, a profound impact on the decisions of smaller and mid-sized employers that are struggling to cover health care costs today.
Below the Surface Randy Hardock, partner in the tax and legislative law firm of Davis & Harman LLP, highlighted three problems lurking below the surface—the first being the Social Security Disability Insurance program, which he termed the "neglected step-child" of entitlement reform. “We've all heard a million times that Social Security's trust fund is going to run out of money in 20 years, that the Medicaid Part A trust fund will run out of money in 12 years,” he noted. “But how often do we hear that the Social Security Disability Insurance Trust Fund is going bust in 2016?”
If it isn’t dealt with, Hardock noted that it would result in an immediate drop of more than 20 percent in across-the board benefits for 10 million individuals and their beneficiaries. “We need to realize you can't discuss Medicare and Social Security reform without addressing disability insurance,” he said, explaining that those programs are intertwined, and that employer health, retirement, and disability plans all wrap around those entitlement programs. “If you raise the Medicare eligibility age,
more people are going to try to claim disability benefits, putting that program further in the hole.”
A second hidden problem Hardock described was the “ever-increasing importance of determining which workers are employees,” noting that the significance of getting employee classification right is substantially increased because of PPACA.
“You need to know in order to determine if the mandate applies,” he explained. “But you also need to know so you can ensure that one or some of your employees, who you may not think are employees but really are, are not getting a subsidy in the exchange.” He explained that employers will need to consider whether workers, such as outsourced low-wage cafeteria workers or security guards are really employees of the food service company or the security firm, “especially if that firm you outsourced them to isn't giving them health benefits.” He noted that the Labor Department might get involved in these issues, or perhaps the Health and Human Services Department, since misclassified workers would likely not only be lower paid, but also would likely be getting coverage from the exchanges, along with a federal subsidy.
Finally, Hardock cited the potential implications of PPACA on employment-based health plans, especially the interactions between those plans and the subsidies available via health exchanges. Individuals eligible for an affordable health plan at work are not eligible for subsidies through the exchange, even if the worker would get better pricing/coverage there. “If the employee's premiums would be lower in the exchange because they were getting

ebri.org Notes • March 2013 • Vol. 34, No. 3 18
Bill Hoagland
generous government subsidies, or if the exchange plan was just better than the employer plan, it doesn't matter, the employee is just stuck with the employer plan,” noted Hardock.
Keeping Employers Involved Hardock said that PPACA was built on a foundation that it was critical to keep most employers in the health insurance market and keep most of those employers bearing most of the cost, one way or the other. He observed that this balance—public- and private-sector sponsorship of health plans—needed to be maintained, because otherwise there just wasn’t enough public money to underwrite the subsidies.
Hardock cited a number of key elements in PPACA that aim to maintain that balance: the penalty for not providing coverage; the tax advantages; the potential savings from a healthier workforce, as well as inertia keeping the current system in place; and a concern on the part of employers that their workers wouldn’t receive as good a price or better coverage via the exchanges. He noted that businesses with very low-wage work forces, or disproportionately old and sick work forces, might be better off financially paying the penalty, and allowing their workforces to obtain coverage and subsidies via the exchange.
“It is important to be careful because if the balance is disrupted by, for example, reducing the tax benefits for employer-provided coverage, then more employers could leave the system. And, if employers start to exit the system, a few go, then a few more, and the next thing you know, it will become a tidal wave,” he said.
An Aging Problem? Bill Hoagland, senior vice president at the Bipartisan Policy Center, having spent 33 years in federal government service, including 25 years spent as staff in the U.S. Senate dealing with the federal budget, noted that, regardless of the outcome of the discussions about the budget and spending levels, debt levels will continue to increase, and that
the nation will face significant debt-to-gross domestic product (GDP) ratios far into the future. “There are significant structural changes that are going to have to be incorporated if we're going to address that issue—particularly in the federal entitlement programs—even with increased revenues,” he said.
Hoagland said that health care spending was the real issue that was going to drive the debt-to-GDP ratio into the future. Furthermore, he cautioned that he didn’t consider increasing the age of eligibility to be a “fundamental structural change” to Medicare at all: “It raises maybe $100 billion over 10 years, but that's not going to change the fundamental path going forward in terms of overall healthcare expenditures,” he explained.
Hoagland said the real problem is an aging population problem—nearly half of it (until 2037) driven by aging itself, but well over half driven by what he termed excess cost growth in health care.
On the revenue side, Hoagland noted that tax reform that raises revenue from something other than tax rates means that exclusions, credits, and deductions have to provide the income. “And everybody in this room knows”, he said, “that the number-one ‘tax expenditure’ is the employer exclusion for health insurance”—a figure that is almost double the home mortgage interest deduction, he said. “It [the health exclusion] has to be a part of this discussion.”
He added: “But all that is not going to fundamentally address the long-term problems that we face here. And that means really serious changes to the tax code as well as serious changes to our entitlement programs that are not really being discussed right now.”

ebri.org Notes • March 2013 • Vol. 34, No. 3 19
Stephen Sanker
Evolving “Doors” In a session titled Evolving "Doors," panelists considered how employment-based health benefits are likely to evolve between 2014 and 2018 as a result of the changes set to come following the implementation of PPACA.
Stephen Sanker, of the National Rural Electric Cooperative Association (NRECA), noted that thus far PPACA had been successful in expanding coverage but had done very little to control cost. He predicted that over the next several years costs are likely to continue going up, as a result of the transitions into the health exchanges, the rule eliminating pre-existing condition restrictions, and a variety of other fees and costs included in the legislation. Sanker suggested this could change between 2014 and 2018, however: “Employers are businesses, and businesses are in business to make money or some other purpose,” he noted, not solely to provide employee benefits. “We think that businesses are going to see this as one more business issue, another competitive issue, that they have to deal with.”
Sanker acknowledged that while employers were likely to find ways to avoid the more onerous costs, much uncertainty remained. “We don't know what's going to happen with the deductibility of the employee benefit expenses, we don't know what's going to happen relative to the taxability of individual employee benefits, we don't know what's going to happen with the economy overall. But we do know what's in play in the marketplace and in the popular press.”
He noted that NRECA’s membership was comprised of a thousand rural electric cooperatives in 47 states across the country, ranging in size from a minimum of two employees to as many as 3,500, with an average employee size of about 50 employees. Sanker said he anticipated their member firms would continue to offer health and welfare benefits and that they will remain a key attraction and retention tool, since having a skilled work force with a low turnover rate is critical to the overall operating expense of each of the NRECA cooperatives.
“They recognize that benefits are simply a portion of that cost,” he noted, and an important tool in attracting and retaining the qualified experienced workforce that they need, going on to note that “Cooperatives today have a very favorable position” as a major employer in their communities.
That said, he noted some places where costs need to be lowered because some local NRECA co-ops still have indemnity plans with fairly rich benefits, rather than managed care plans, and he noted that NRECA is working with those employers to move them into network-based plans. “We're also putting even greater emphasis on high-deductible health plans and consumer-driven plans than we've had over the last several years,” he said, going on to explain that, of the 600 co-ops in their medical plan at present, over half currently offer a qualified high-deductible health plan. He also noted that they were working on maximizing PPO discounts, and that as long as the network-driven discounts are available, they planned to maximize access to them.
“We're looking at value-based plans and we're looking particularly for the biggest cost drivers, so that we are paying for performance and not just paying,” he explained. Sanker also noted that his organization was looking to shift all of the retiree medical coverage currently offered through the cooperatives to private health exchanges as early as 2014, explaining that nearly all of the 600 cooperatives in their medical plan offer access to retiree medical today, and about 40 percent of them subsidize retiree medical costs.

ebri.org Notes • March 2013 • Vol. 34, No. 3 20
Mike Callender
A Finance Perspective Mike Callender, staff director of Internal Controls and Benefits at FedEx Corp., offered a finance perspective to the issue, noting that while PPACA was creating change, change was inevitable in any event because of cost shifting already underway, as well as the health costs that had, and were continuing to, take a financial toll on employers.
“The rising cost of health care, whether from shifting demographics, the rising expense of top-end workers, the age of our employees, or their inability to retire largely because of the fear of what their health care cost would be once they left—employers are now, and have been for years, looking at ways of shifting costs in one form or another, whether it's through plan design or shifting contributions,” he said.
But while the cost trends made change of some kind inevitable, Callender noted that PPACA exacerbated the impact on two key fronts: the administrative difficulties in dealing with health exchanges, and the fees imposed on employers. “We cover 400,000 individuals,” he said, “and the reinsurance tax for us in 2014, at $63 a head…you do the math. That's a direct hit on our bottom line that we have to cover, and our employees get no direct benefit out of that.”
He also cited the as-yet-unknown difficulties in dealing with 50 different state exchanges, in communicating employee demographic data, and determining who's eligible for the subsidies. ”Then if our employees do go out and seek coverage, and get the subsidy, what happens on the back end if the IRS comes in and looks at us and says you owe a fee for this?” he asked. These new processes and the current uncertainty add significantly to the administrative burden for large employers, he explained.
But there are benefits, he added. “We've extended coverage to more people, added the adult dependents to age 26, and continued to add the preventive coverage,” he noted, although those changes have added costs and great uncertainty to the system for employers because there are so many things still in motion. Callender predicted that large employers in particular would take a period of time to evaluate what the long-term landscape is going to look like.
“You're going to have to consider shifting down the coverage that you offer your employees to stabilize the excise tax, because no one's going to pay a 40 percent non-deductible excise tax. It's just not good business practice,” he explained. “There are just so many of these things that create an administrative burden for employers: the 30-hour rule, the measurement periods…how you measure and track those things? The systems and the reporting requirements that come along with PPACA greatly affect employers' decisions about what they do and how they continue to offer benefits.”
Valued Proposition Callender said “we know employees value benefits,” but added that “the value proposition (of workers staying in the plan) is going to continue to change as we're forced to bring down the value of the plan.” Additionally, he highlighted how changes in benefit offerings could affect worker choice.
“We have a large number of people who work for us in the middle of the night—our part-time workforce that we extend coverage to because it's part of the value proposition for them working for us,” Callender said. But once the exchanges are running and those individuals find out what kind of subsidy they are eligible for, “They may elect to discontinue working for us because they can get coverage cheaper elsewhere than they could get it from us, and take some other job during the daytime.” Callender noted that such decisions could affect the employee labor markets—another potential problem for large employers, particularly for employers of lower-wage employees.

ebri.org Notes • March 2013 • Vol. 34, No. 3 21
Frank McArdle
Ultimately, Callender thought that small- and mid-size employers might find private exchanges to be a palatable option for health insurance, while large employers would continue to try to offer health coverage for as long as possible because it is currently a way to attract talented employees.
“As the plan design and the value of the plans become a commodity, as everyone reaches the floor where it's the same value, I believe what you'll see is large employers looking for other ways to seek differentiation in value, and they will add other things around those benefits to add perceived value to their employees, at least in the near term,” he said. “I believe employers are seeking to keep that value proposition for their employees and that will continue to be the driver of health care offerings for large employers.” But he added that this “could continue to create even more of a two-tier health system for the country than already exists.”
Exchange “Rates” Frank McArdle, an independent consultant who previously managed the Washington, DC, research office of Aon Hewitt, described the health exchanges as among the biggest and most controversial set of new options in PPACA—and discussed the future of state-run exchanges, the federally assisted exchanges, and private exchanges.
Acknowledging there was still a fair amount of uncertainty around the exchanges, McArdle said he was confident that the state-run or federally facilitated exchanges would be available in every state, that there would be a lot of “bumps” in implementation come 2014, but that those bumps will be ironed out by 2018 and these exchanges will be operating as PPACA drafters had intended.
He also said that for employers on the small end of the market (particularly those with fewer than 50 full-time employees) the attraction of having employees get coverage through the exchange is going to be very strong because the availability of premium credits and cost-sharing subsidies will be too good to refuse—especially since there is no penalty for employers with fewer than 50 full-time workers that don't offer any health insurance coverage. “If there aren't any better financial deals for small employers outside the exchange, and there are these subsidies, I think it will come down to a quality issue—whether these employers see the user experience for their employees in the exchange as being okay or inadequate,” he explained. For medium- and large-size employers, which are subject to the law’s coverage mandate, “it is going to be a pay-or-play decision,” he noted.
Echoing comments from the first panel, McArdle stated his belief that the drafters of PPACA fully intended to preserve employer-sponsored coverage, both out of a need to control the cost of the federal subsidies and because of strong philosophical support for preserving the employment-based system—concepts that he said were combined in how drafters came up with the “firewall.” He noted that even under the worst-case assumptions of the Congressional Budget Office (CBO) analysis—20 million people losing employer coverage on a base of 150−160 million people currently covered by that system—the loss is “still relatively modest” and unlikely to overturn the employer-based system.
However, he predicted an increase in self-insurance in the small- and mid-size employer sectors if they do not use the health exchanges. He also predicted that states would generally be reluctant to let large employers purchase coverage for their workers through the exchange because of concerns of the potential risk of adverse selection.
But theoretically, McArdle suggested that PPACA waivers that become available in 2017 might allow some individual states, depending on their political persuasion and economic circumstances, to eventually use the exchange as a tool

ebri.org Notes • March 2013 • Vol. 34, No. 3 22
to shift away from an employer-based system toward more of a single-payer kind of state system or alternatively toward more of an individually based purchasing system while “keeping employers on the hook for some money.”
Among large employers that he’s worked with, McArdle said there is still too much uncertainty at this point about opting to “pay” rather than “play.” However, he noted those employers are looking at exchanges “very carefully” and are tracking them. But for large employers, it's not necessarily cheaper to pay the penalty: “It's going to depend on what the company is offering, what they decide to do about grossing up their employees’ compensation or not, and what tax rates are,” he said, going on to note that the free-rider penalty will be a “brake pedal” on large employers sending employees into the state exchanges by ending coverage.
Regulatory Uncertainties McArdle singled out two regulatory uncertainties that could have profound effects. One is the set of rules around automatic enrollment, which currently have been deferred. Especially for companies with large, low-margin businesses, high turnover and a high percentage of employees that have previously opted out of employer coverage, analysis shows that the rules “could potentially have a significant enough cost increase that it would drive them to pay rather than play,” he said.
Another big uncertainty is what responsibility, if any, employers may feel they have to subsidize family coverage. Proposed regulations issued at the end of 2012 require that, to avoid the free-rider penalties, employers must offer coverage to full-time employees and their dependents, i.e., children under the age of 26. But employers are not required under these proposed rules to offer coverage to spouses of employees.
In addition, the affordability test is calculated with respect to the employee’s cost for employee self-only coverage, not the cost of family coverage. Depending on the level of future health cost increases, employers may need to offset some of the higher costs by increasing the share of the cost that employees pay for dependent coverage. While there's already been some movement in that direction, and there’s likely to be more in the future, McArdle didn’t see employers eliminating dependent coverage as a result of PPACA.
He also cited the outstanding question about how it will work out in practice for a family that has an employee who's got affordable self-only coverage from the employer but cannot afford the cost of family coverage, and whether the family members in that instance can get subsidies in the state or federally facilitated exchanges to purchase their own coverage.
If the drop coverage and “pay” avenue is effectively closed off for large employers, McArdle said that private exchanges would be an option, and he noted that employer surveys show strong interest in this option, since private exchanges may provide a way to ease administrative burdens, achieve more predictable costs, and give workers more choice.
Consequently, McArdle said that by 2018, he expects state exchanges, federally facilitated exchanges, single-employer-sponsored health insurance coverage and private exchanges, would all be in place and co-exist as a hybrid system and potentially compete as options for coverage and as public policy alternatives even if they are not serving the same groups of employees and individuals.
“Over time, external factors and public policy changes can really drive and even push more people into the state or federally facilitated exchanges,” he said. Individual company business failures and any broader industry-wide economic dislocations, for example, would lead to more people getting exchange-based coverage, with the exchanges serving as the safety net they were intended to be when workers lose employer-based coverage. And if something was to change cutting back on public sources of health coverage (such as an increase in the age for Medicare eligibility), putting retirees in state exchanges may become even more attractive.
ebri.org Notes • March 2013 • Vol. 34, No. 3 23
Paul Fronstin
“If you're one of the millions of Baby Boomers who won't have retiree health coverage and the Medicare age is increased, you'll be in the exchanges two years longer, assuming it's eventually age 67 for Medicare,” he said.
If there was a change in the federal tax exclusion for employer-provided health benefits as part of deficit reduction, or if that value was diluted by lower tax rates under tax reform, McArdle said that would fundamentally change the arithmetic, which “could possibly make it easier for employers, even large ones who have been on the fence, to send their employees into state exchanges.”
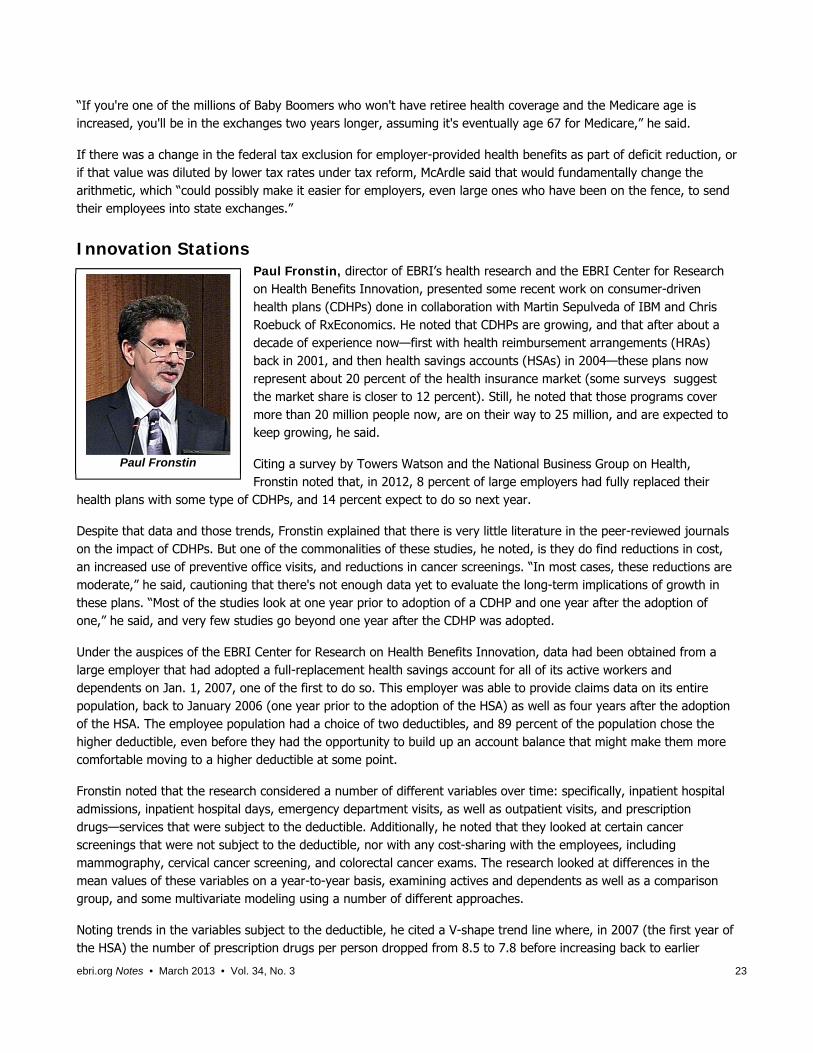
Innovation Stations Paul Fronstin, director of EBRI’s health research and the EBRI Center for Research on Health Benefits Innovation, presented some recent work on consumer-driven health plans (CDHPs) done in collaboration with Martin Sepulveda of IBM and Chris Roebuck of RxEconomics. He noted that CDHPs are growing, and that after about a decade of experience now—first with health reimbursement arrangements (HRAs) back in 2001, and then health savings accounts (HSAs) in 2004—these plans now represent about 20 percent of the health insurance market (some surveys suggest the market share is closer to 12 percent). Still, he noted that those programs cover more than 20 million people now, are on their way to 25 million, and are expected to keep growing, he said.
Citing a survey by Towers Watson and the National Business Group on Health, Fronstin noted that, in 2012, 8 percent of large employers had fully replaced their
health plans with some type of CDHPs, and 14 percent expect to do so next year.
Despite that data and those trends, Fronstin explained that there is very little literature in the peer-reviewed journals on the impact of CDHPs. But one of the commonalities of these studies, he noted, is they do find reductions in cost, an increased use of preventive office visits, and reductions in cancer screenings. “In most cases, these reductions are moderate,” he said, cautioning that there's not enough data yet to evaluate the long-term implications of growth in these plans. “Most of the studies look at one year prior to adoption of a CDHP and one year after the adoption of one,” he said, and very few studies go beyond one year after the CDHP was adopted.
Under the auspices of the EBRI Center for Research on Health Benefits Innovation, data had been obtained from a large employer that had adopted a full-replacement health savings account for all of its active workers and dependents on Jan. 1, 2007, one of the first to do so. This employer was able to provide claims data on its entire population, back to January 2006 (one year prior to the adoption of the HSA) as well as four years after the adoption of the HSA. The employee population had a choice of two deductibles, and 89 percent of the population chose the higher deductible, even before they had the opportunity to build up an account balance that might make them more comfortable moving to a higher deductible at some point.
Fronstin noted that the research considered a number of different variables over time: specifically, inpatient hospital admissions, inpatient hospital days, emergency department visits, as well as outpatient visits, and prescription drugs—services that were subject to the deductible. Additionally, he noted that they looked at certain cancer screenings that were not subject to the deductible, nor with any cost-sharing with the employees, including mammography, cervical cancer screening, and colorectal cancer exams. The research looked at differences in the mean values of these variables on a year-to-year basis, examining actives and dependents as well as a comparison group, and some multivariate modeling using a number of different approaches.
Noting trends in the variables subject to the deductible, he cited a V-shape trend line where, in 2007 (the first year of the HSA) the number of prescription drugs per person dropped from 8.5 to 7.8 before increasing back to earlier

ebri.org Notes • March 2013 • Vol. 34, No. 3 24
levels. A comparable trend line was found for office visits. Fronstin observed that the increase might be attributable to the fact that the data is drawn from a population that is aging over the period of the study, and was four years older in 2010 than it was in 2006.
However, he noted that the dip and spike did not occur with the control group, which was also a continuously eligible participation. “But these are just the bivariate findings,” Fronstin noted. “When we put all this into a multivariate setting, using the negative binomial model and the probit model, what you see happen is that despite the fact that outpatient services rebounded for at least a year or two, and prescription drug use rebounded in each year, but when compared to the control group, the CDHP reduced use of those services in each of the years.”
Similarly, he noted a rebound in utilization of cancer screenings not subject to any cost-sharing or deductibles. The research found a drop in the first year of the HSA, followed by a rebound, and then basically a leveling off. Even in the control group, where these services were always free, the data show a decline in use of these services.
“One of our concerns, and a possible explanation why you see such a large drop in the consumer-driven health plan group in 2007, might be that people didn't quite understand their plan,” he noted. But he went on to explain that when the use of these services on a quarterly basis was examined throughout 2010, in each year after the HSA was adopted there is an ongoing spike in use of these services. He noted that while this might be the result of concerns that this free service will be taken away at some point, it was an area requiring further analysis.
According to preliminary findings, “the overall impact on cost of moving to the full-replacement HSA was $161 per member, per year,” he explained. “It may not sound like a lot compared to what it would have been in 2006, but when you add it all up it's about a cumulative 10 percent savings.” For the employer in this study, just taking the population of people in the continuous sample, it was about a $10 million savings on about $100 million spent over the four years, after the HSA was adopted, he said.
Fronstin noted that EBRI was also researching medication adherence, specifically for people with certain chronic conditions. Utilization and adherence measures were being examined in a number of different ways; the number of prescriptions filled on a 30-day adjusted basis, the proportion of days covered, etc. Here too, the same pattern emerged: an initial drop both in the study group and the comparison group in adherence in 2007, and a higher rebound in 2008 for the CDHP group than for the comparison group.
Fronstin noted there is a fair amount of literature looking at selection, which confirms that when people have a choice, healthier people tend to migrate to the CDHP, at least in the first year. However, that research tends to look only at one year, and that it tends not to take into account sufficient information in terms of what happens with premiums and premium savings. “They don't take into account the role of the account, meaning if people have an opportunity to build up account balances, and they change deductible levels when they have choices of deductibles,” he explained. Moreover, he noted that when only a single year is examined, longer-term implications of these responses cannot be assessed.
“We looked at a single employer, a manufacturing employer located in the Midwest,” Fronstin said. “Can we generalize the findings from this employer to other employers? No. But it is an example of what might happen.”
Among the policy implications, he said, “the bottom line is that when it comes to medication adherence, we're not sure that the HSA plan design is the best.” Additionally, he cited the interest of employers and insurers in value-based insurance design and innovative approaches to designing health benefits so that they are more than just a one-size-fits-all plan design with HSAs, because everything has to be covered by the deductible. “You would think HRAs are the same, and they do look alike, but they're completely different,” he noted.

ebri.org Notes • March 2013 • Vol. 34, No. 3 25
Phyllis Borzi
Fronstin acknowledged some limitations of the study, such as not knowing how continuous eligibility might limit the generalizability of the results and not controlling for why people choose a high-deductible health plan. “We don't have HSA balances,” he noted, “We don’t know how much money the employee is putting in the account. We'd like to know whether people are rolling over money, we'd like to know if that changes the psychology behind their decision to use healthcare services.”
View from the Obama Administration Bringing a “View from the Obama Administration” to the policy forum, Assistant Secretary of Labor Phyllis C. Borzi noted that many regulations, especially those generated by PPACA, are multi-agency regulations: They can involve the Department of Health and Human Services (HHS), the U.S. Treasury Department, the Internal Revenue Service, and the Department of Labor (DOL). The three departments typically involved are HHS, Treasury, and DOL.
“We not only have to clear the legal hoops in our own departments—four groups of lawyers—we also ultimately have to pass muster with the White House counsel's office, and in many instances the Justice Department lawyers as well,” she explained. “It's very, very important that we not exceed our statutory authority,” particularly in implementing legislation like PPACA where critics argue that statutory authority has been exceeded.
She noted that the major regulatory focus after the legislation was passed was to deal with the market/insurance reform provisions, and other provisions of PPACA that were effective within the first six or eight months. Drawing laughter from the audience, Borzi noted that she heard two things from her friends in the private sector: "We need more guidance," and "Stop sending out so much guidance."
After initially working on the tri-agency regulations—and publishing a lot of proposed regulations—Borzi explained that DOL had since been focusing primarily on sub-regulatory guidance, or SRG. In those cases, the first question that had to be answered was: “Is this something that we have the authority, under the statute and our regulations, to issue?” She noted that the SRG process had been focused on issuing interpretations of the law, with a focus on additional required guidance based on meeting with people—“lots and lots of people” from different groups across the spectrum of different stakeholders.
FAQ Checks Borzi said the sub-regulatory guidance has primarily taken the form of FAQs, or frequently asked questions. “We've issued 10 sets of them,” she explained, “and we're currently working on number 11.” She noted that these FAQs have the same format, though sometimes they're focused on particular issues, and sometimes a “grab bag” of various issues, emphasizing that the inspiration for what needs to be addressed comes from the meetings and interactions noted earlier.
Even while the Supreme Court was busy considering the constitutionality of PPACA, “we never ground to a halt,” Borzi said. “We always continued to work because we believed, and the court eventually upheld, the constitutionality of the law. We always continued to work notwithstanding the swirl of legislative activity on Capitol Hill, we always continued to work because the challenge is enormous. There's so much to do.”
Now that some of the early regulatory issues have been resolved, Borzi said that a wide range of regulatory guidance on a variety of areas could be expected, especially in two areas: The first emphasis is on trying to issue exchange guidance on operational issues, an area she acknowledged that the Labor Department didn’t have any specific jurisdiction over (even though they had been involved in discussions around employer responsibilities), reporting

ebri.org Notes • March 2013 • Vol. 34, No. 3 26
requirements, and the SHOP (Small Business Health Options) exchanges (to the extent that states choose to implement them), among other issues.
Tax Mien The other major emphasis is on various tax provisions and tax issues, especially involving self-insured health plans. “The one discrete issue that we had is, who should pay these taxes?” Borzi said. “Which expenses are settlor or fiduciary, and, if settlor expenses, the Labor Department’s stance is that those can't be paid out of plan assets.”
While the tax provisions were more clear than some of the other provisions in the bill, Borzi said they have been a challenge for DOL where tax responsibility for certain kinds of plans (multi-employer plans, VEBAs, MEWAs) isn't intuitively obvious, and (to the extent that those taxes are imposed on employers) how they should be allocated and how they should be paid.
In addition to the exchange provisions, Borzi noted that the one other set of PPACA regulations that are solely within DOL purview are those affecting MEWAs, or Multiple Employer Welfare Arrangements. She noted that there have been regulatory problems with these structures even before the enactment of ERISA in 1974, and that it was a cyclic problem: When it's hard and expensive for employers to get coverage, then small employers in particular are vulnerable to vendors who try to sell them a health plan that's too good to be true. She noted that in PPACA, Congress gave DOL a number of new tools to protect employers that contribute to these plans, as well as workers covered under these plans. This should be helped by new DOL reporting requirements that eliminate confusion over who does and doesn’t have to report, she explained.
Multi-employer Plans Borzi said another set of difficult tri-agency issues currently under development involve multi-employer plans. She noted that primarily smaller employers contribute to multi-employer plans, and that small employers (those with fewer than 50 workers) aren’t subject to PPACA’s employer “pay or play penalty. As a result, there is widespread concern that PPACA might destabilize some multi-employer plans because they typically provide much more generous benefits than individuals are likely to get in a health exchange.
Borzi also noted that DOL issued a request for information on stop-loss insurance in mid-2012, since the department is required to do an annual study on self-insured health plans. She said that Form 5500 reports, the backbone of the research around this annual report on self-insured plans, were found to be insufficient to produce the kind of report Congress had requested without additional data. This generated worries among plan sponsors that DOL was planning to regulate stop-loss, which Borzi said was not the case; she assured the audience that DOL was just trying to gather data and analyze comments, and trying to decide whether more information is needed.
Earlier in her remarks, Borzi noted that her law school professors would often cite “black letter” law, where specific issues are “well settled.” In contrast, she noted that one of the things she loved about ERISA, generally—especially implementation of PPACA—is that nothing is “well settled.”
“If you're the kind of person who likes to think about how to take complicated problems and make them work, how to create structures and organizations that are designed to achieve the goals of a piece of legislation or regulation, and in a way that is the most cost-efficient and cost-effective, then welcome to our world—because that's the challenge that we all face in dealing with this,” Borzi said.

CHECK OUT EBRI’S WEB SITE! EBRI’s website is easy to use and packed with useful information! Look for these special features:
• EBRI’s entire library of research publications starts at the main Web page. Click on EBRI Issue Briefs and EBRI Notes for our in-depth and nonpartisan periodicals.
• Visit EBRI’s blog, or subscribe to the EBRIef e-letter.
• EBRI’s reliable health and retirement surveys are just a click away through the topic boxes at the top of the page.
• Need a number? Check out the EBRI Databook on Employee Benefits.
• Instantly get e-mail notifications of the latest EBRI data, surveys, publications, and meetings and seminars by clicking on the “Notify Me” or “RSS” buttons at the top of our home page.
There’s lots more!
Visit EBRI on-line today: www.ebri.org
EBRI Employee Benefit Research Institute Notes (ISSN 10854452) is published monthly by the Employee Benefit Research Institute, 1100 13th St. NW, Suite 878, Washington, DC 20005-4051, at $300 per year or is included as part of a membership subscription. Periodicals postage rate paid in Washington, DC, and additional mailing offices. POSTMASTER: Send address changes to: EBRI Notes, 1100 13th St. NW, Suite 878, Washington, DC 20005-4051. Copyright 2013 by Employee Benefit Research Institute. All rights reserved, Vol. 34, no. 3.
The Employee Benefit Research Institute (EBRI) was founded in 1978. Its mission is to contribute to, to encourage, and to enhance the development of sound employee benefit programs and sound public policy through objective research and education. EBRI is the only private, nonprofit, nonpartisan, Washington, DC-based organization committed exclusively to public policy research and education on economic security and employee benefit issues. EBRI’s membership includes a cross-section of pension funds; businesses; trade associations; labor unions; health care providers and insurers; government organizations; and service firms.
EBRI’s work advances knowledge and understanding of employee benefits and their importance to the nation’s economy among policymakers, the news media, and the public. It does this by conducting and publishing policy research, analysis, and special reports on employee benefits issues; holding educational briefings for EBRI members, congressional and federal agency staff, and the news media; and sponsoring public opinion surveys on employee benefit issues. EBRI’s Education and Research Fund (EBRI-ERF) performs the charitable, educational, and scientific functions of the Institute. EBRI-ERF is a tax-exempt organization supported by contributions and grants.
EBRI Issue Briefs are periodicals providing expert evaluations of employee benefit issues and trends, as well as critical analyses of employee benefit policies and proposals. EBRI Notes is a monthly periodical providing current information on a variety of employee benefit topics. EBRIef is a weekly roundup of EBRI research and insights, as well as updates on surveys, studies, litigation, legislation and regulation affecting employee benefit plans, while EBRI’s Blog supplements our regular publications, offering commentary on questions received from news reporters, policymakers, and others. EBRI’s Fundamentals of Employee Benefit Programs offers a straightforward, basic explanation of employee benefit programs in the private and public sectors. The EBRI Databook on Employee Benefits is a statistical reference work on employee benefit programs and work force-related issues.
Contact EBRI Publications, (202) 659-0670; fax publication orders to (202) 775-6312. Subscriptions to EBRI Issue Briefs are included as part of EBRI membership, or as part of a $199 annual subscription to EBRI Notes and EBRI Issue Briefs. Change of Address: EBRI, 1100 13th St. NW, Suite 878, Washington, DC, 20005-4051, (202) 659-0670; fax number, (202) 775-6312; e-mail: [email protected] Membership Information: Inquiries regarding EBRI membership and/or contributions to EBRI-ERF should be directed to EBRI President Dallas Salisbury at the above address, (202) 659-0670; e-mail: [email protected]
Editorial Board: Dallas L. Salisbury, publisher; Stephen Blakely, editor. Any views expressed in this publication and those of the authors should not be ascribed to the officers, trustees, members, or other sponsors of the Employee Benefit Research Institute, the EBRI Education and Research Fund, or their staffs. Nothing herein is to be construed as an attempt to aid or hinder the adoption of any pending legislation, regulation, or interpretative rule, or as legal, accounting, actuarial, or other such professional advice.
EBRI Notes is registered in the U.S. Patent and Trademark Office. ISSN: 10854452 10854452/90 $ .50+.50
© 2013, Employee Benefit Research InstituteEducation and Research Fund. All rights reserved.
Who we are
What we do
Our publications
Orders/ Subscriptions