a limited investigation of boundary avoidance … · have bat was the first flight test exploring...
TRANSCRIPT

HAVE BAT Technical Information Memorandum Edwards Air Force Base June 2006 Air Force Flight Test Center
i
AFFTC-TIM-06-04
A LIMITED INVESTIGATION OF BOUNDARY
AVOIDANCE TRACKING (PROJECT HAVE BAT)
Capt Randy Warren Maj Brian Abell Project Manager/Flight Test Engineer Project Flight Test Navigator Major Scott Heritsch Capt Kyle Kolsti Project Test Pilot Project Test Pilot
Capt Brandon Miller Project Test Pilot
JUNE 2006
FINAL TECHNICAL INFORMATION MEMORANDUM
Approved for public release; distribution is unlimited.
AFFTC
AIR FORCE FLIGHT TEST CENTER EDWARDS AIR FORCE BASE, CALIFORNIA
AIR FORCE MATERIAL COMMAND UNITED STATES AIR FORCE


HAVE BAT Technical Information Memorandum Edwards Air Force Base June 2006 Air Force Flight Test Center
Form Approved REPORT DOCUMENTATION PAGE OMB No. 0704-0188
Public reporting burden for this collection of information is estimated to average 1 hour per response, including the time for reviewing instructions, searching existing data sources, gathering and maintaining the data needed, and completing and reviewing this collection of information. Send comments regarding this burden estimate or any other aspect of this collection of information, including suggestions for reducing this burden to Department of Defense, Washington Headquarters Services, Directorate for Information Operations and Reports (0704-0188), 1215 Jefferson Davis Highway, Suite 1204, Arlington, VA 22202-4302. Respondents should be aware that notwithstanding any other provision of law, no person shall be subject to any penalty for failing to comply with a collection of information if it does not display a currently valid OMB control number. PLEASE DO NOT RETURN YOUR FORM TO THE ABOVE ADDRESS. 1. REPORT DATE June 2006
2. REPORT TYPEFinal Technical Information Memorandum
3. DATES COVERED (From – To) 10 April – 4 May 2006
4. TITLE AND SUBTITLE Limited Investigation and Characterization of Boundary Avoidance Tracking
5a. CONTRACT NUMBER
5b. GRANT NUMBER
5c. PROGRAM ELEMENT NUMBER
5d. PROJECT NUMBER
5e. TASK NUMBER
6. AUTHOR(S) Randy Warren, Captain, USAF Brian Abell, Major, USAF Scott Heritsch, Major, USAF Kyle Kolsti, Captain, USAF Brandon Miller, Captain, USAF
5f. WORK UNIT NUMBER
8. PERFORMING ORGANIZATION REPORT NUMBER
7. PERFORMING ORGANIZATION NAME(S) AND ADDRESS(ES) Air Force Flight Test Center 412th Test Wing USAF Test Pilot School 220 South Wolfe Avenue Edwards AFB CA 93524-6485
AFFTC-TIM-06-04
9. SPONSORING / MONITORING AGENCY NAME(S) AND ADDRESS(ES) 10. SPONSOR/MONITOR’S ACRONYM(S)
11. SPONSOR/MONITOR’S REPORT NUMBER(S)
USAF TPS/EDF (Mr. Bill Gray) USAF Test Pilot School 220 South Wolfe Avenue Edwards AFB CA 93524-6485 12. DISTRIBUTION / AVAILABILITY STATEMENT Approved for public release; distribution is unlimited.13. SUPPLEMENTARY NOTESCA: Air Force Flight Test Center Edwards AFB CA CC: 012100 14. ABSTRACT HAVE BAT was the first program to gather flight test data on the phenomenon of boundary tracking. Boundary tracking occurs when a pilot perceives an impending hazardous situation and abandons other tasks to avoid the hazard (avoiding the boundary). The purpose of the HAVE BAT test program was to determine the relationship between longitudinal characteristics of an airborne system (consisting of the pilot and the aircraft) and the characteristic parameters of the boundary avoidance tracking events. 15. SUBJECT TERMSPilot-in-the-Loop Oscillation (PIO), T-38C Aircraft, Boundary Avoidance, Boundary Tracking, Visual Tracking, Camera Tracking, Longitudinal Characteristics
16. SECURITY CLASSIFICATION OF: 17. LIMITATION 18. NUMBER OF PAGES
19a. NAME OF RESPONSIBLE PERSON Mr. William Gray OF ABSTRACT
60 SAME AS REPORT a. REPORT b. ABSTRACT c. THIS PAGE 19b. TELEPHONE NUMBER (include area code)
(661)-527-3000 Unclassified Unclassified Unclassified
Standard Form 298 (Rev. 8-98)Prescribed by ANSI Std. 239.18
iii

HAVE BAT Technical Information Memorandum Edwards Air Force Base June 2006 Air Force Flight Test Center
This page intentionally left blank.
iv

HAVE BAT Technical Information Memorandum Edwards Air Force Base June 2006 Air Force Flight Test Center
EXECUTIVE SUMMARY
This test report presents the results of the Boundary Avoidance Tracking (BAT) Test Management Project (TMP). The HAVE BAT TMP was conducted at the request of the Air Force Test Pilot School in collaboration with the Air Force Institute of Technology (AFIT), Wright Patterson AFB, OH. The project logged approximately 23.7 hours over 10 flight test missions in the R-2508 complex during April and May 2006 to accomplish the test objectives.
HAVE BAT was the first flight test exploring the phenomenon of boundary tracking. Boundary tracking occurs when a pilot perceives an impending hazardous situation and abandons other tasks to avoid the hazard (or boundary). When the pilot is confined between opposing boundaries, divergent oscillations akin to pilot-in-the-loop oscillations (PIO) have occurred. The purpose of the HAVE BAT test program was to determine the relationship between longitudinal characteristics of an airborne system consisting of the pilot and the aircraft, and the characteristic parameters of the boundary avoidance tracking events. The HAVE BAT TMP had three primary objectives: (1) determine the system open-loop characteristics; (2) determine the values of selected parameters that characterize the boundary avoidance tracking; and (3) determine the degree of correlation between the system open-loop characteristics and the boundary avoidance tracking parameters. The first objective was met; however the other objectives were only partially satisfied. However, the test team did find PIO attributable to the imposed boundaries. Conversely, no PIO were experienced when boundaries were not imposed. Even though not all of the objectives were met, the qualitative connection between boundaries and PIO warrants further flight testing and continued analysis of current flight test data.
HAVE BAT flight testing pursued the open-loop characteristics of the system (the pilot plus the aircraft) and the closed-loop boundary avoidance tracking parameters thought to characterize boundary avoidance tracking. The open-loop characteristics were system time delay and longitudinal stick frequencies during out-of-phase aircraft motion. The boundary avoidance tracking parameters were: times to the boundaries, feedback gain, and times at which the minimum and maximum gain were employed. The test flights involved a formation of a test and target aircraft. Test-specific markings on the target aircraft served as boundaries to limit the vertical deviation from the formation position. To induce boundary avoidance tracking, the target aircraft maneuvered in pitch, forcing the test pilot to act to avoid breaking the boundaries. The open-loop and boundary avoidance tracking parameters were then compared in order to determine their degree of correlation.
Representative test runs were selected at varying flight conditions and boundary avoidance parameters were estimated using a previously developed simulator-validated model. While the expected boundary tracking behavior was observed qualitatively, direct measurement of the boundary parameters from the time series data was not possible due to insufficient sampling rate and a dynamic flight environment. These parameters were therefore estimated using a previously developed model that had been validated during simulator testing. Applying this model to the flight test data, varying degrees of correlation between the open-loop parameters and boundary avoidance tracking parameters were identified. However, due to lengthy data reduction timelines, all of the data could not be analyzed within the project timeline and the correlation was of low confidence. Despite that, the pilots’ comments on the direct influence of the boundaries on PIO events warrant continued data analysis and further flight testing.
v

HAVE BAT Technical Information Memorandum Edwards Air Force Base June 2006 Air Force Flight Test Center
TABLE OF CONTENTS
Page No. LIST OF ILLUSTRATIONS........................................................................................................ vii
LIST OF TABLES........................................................................................................................ iix
INTRODUCTION ...........................................................................................................................1 General..................................................................................................................................... 1 Background.............................................................................................................................. 1 Program Chronology ............................................................................................................... 2 Test Item Description .............................................................................................................. 3 Test Objectives ........................................................................................................................ 3 Limitations............................................................................................................................... 4
TEST AND EVALUATION ...........................................................................................................5 General..................................................................................................................................... 5 Target Aircraft Markings and Configuration........................................................................... 5 Pilot Tasks and Mindset........................................................................................................... 6 Target Maneuver Profiles ........................................................................................................ 7 Test Point Design and Selection .............................................................................................. 7 Data Collection ........................................................................................................................ 8 Open-loop Characteristics: System Time Delay.................................................................... 10 Open-loop Characteristics: System Crossover Frequency .................................................... 11 Closed-loop Pilot Actuation Frequency................................................................................. 13 Determination of Closed-loop Boundary Avoidance Parameters ......................................... 15 Relationships Between Open-loop Characteristics and Boundary Avoidance...................... 17
CONCLUSIONS AND RECOMMENDATIONS ........................................................................20
REFERENCES ..............................................................................................................................21
APPENDIX A – BOUNDARY AVOIDANCE PARAMETER DEVELOPMENT ................. A-1 APPENDIX B – AFRL SIMULATOR PREPARATION...........................................................B-1 APPENDIX C – SORTIES AND TEST POINTS FLOWN .......................................................C-1 APPENDIX D – DATA REDUCTION ..................................................................................... D-1 APPENDIX E – DATA PRODUCTS, CLOSED-LOOP TASKS ..............................................E-1 APPENDIX F – MODEL PARAMETER ESTIMATION RESULTS .......................................F-1 APPENDIX G – PLOTS OF OPEN/CLOSED LOOP CORRELATIONS ............................... G-1 APPENDIX H – LESSONS LEARNED.................................................................................... H-1 APPENDIX I – LIST OF ABBREVIATIONS, ACRONYMS, AND SYMBOLS .....................I-1
vi
HAVE BAT Technical Information Memorandum Edwards Air Force Base June 2006 Air Force Flight Test Center
LIST OF ILLUSTRATIONS
Page No.
Figure 1: Photograph of HAVE BAT Test In Progress .................................................................. 5
Figure 2: Target Aircraft Markings................................................................................................. 6
Figure 3: Tracking Task Visual Reference ..................................................................................... 6
Figure 4: Aircraft-Mounted Camera Placement ............................................................................. 9
Figure 5: System Time Delays at the Test Flight Conditions....................................................... 11
Figure 6: System Crossover Frequency Results ........................................................................... 13
Figure 7: Example Pilot Actuation Frequency Analysis............................................................... 14
Figure 8. Example of direct determination of Kbm and tmax ......................................................... 16
Figure A-1: Relationships of tmin and tmax with respect to boundaries........................................ A-1
Figure A-2: Boundary Avoidance feedback model .................................................................... A-2
Figure A-3: Variable gain (equivalent to stick deflection) during boundary avoidance tracking.............................................................................................................................................. A-3
Figure B-1: AFRL Simulator Visual Presentation...................................................................... B-1
Figure D-1: Data Reduction Flow Chart..................................................................................... D-1
Figure D-2: Example ScratchClick Video Data Extraction........................................................ D-2
Figure D-3: Example ScratchClick Video Data Extraction........................................................ D-3
Figure E-1: Closed-loop Task Time-to-Boundary Results (20,000 feet, 375 KIAS) ..................E-1
Figure E-2: Closed-loop Task Time-to-Boundary Results (20,000 feet, 250 KIAS) ..................E-2
Figure E-3: Closed-loop Task Time-to-Boundary Results (20,000 feet, 210 KIAS) ..................E-3
Figure E-4: Closed-loop Task Time-to-Boundary Results (10,000 feet, 375 KIAS) ..................E-4
Figure E-5: Closed-loop Task Time-to-Boundary Results (10,000 feet, 250 KIAS) ..................E-5
Figure E-6: Closed-loop Task Time-to-Boundary Results (10,000 feet, 210 KIAS ...................E-6
Figure F-1: Closed-loop Task Output (20,000 feet, 375 KIAS) ..................................................F-1
vii

HAVE BAT Technical Information Memorandum Edwards Air Force Base June 2006 Air Force Flight Test Center
Figure F-2: Closed-loop Task Output (20,000 feet, 250 KIAS) ..................................................F-2
Figure F-3: Closed-loop Task Output (20,000 feet, 210 KIAS) ..................................................F-3
Figure F-4: Closed-loop Task Output (10,000 feet, 375 KIAS) ..................................................F-4
Figure F-5: Closed-loop Task Output (10,000 feet, 250 KIAS) ..................................................F-5
Figure F-6: Closed-loop Task Output (10,000 feet, 210 KIAS) ..................................................F-6
Figure G-1: Time-to-Boundary Correlation with System Time Delay...................................... G-2
Figure G-2: Boundary Tracking Feedback Gain Correlation with System Time Delay ........... G-2
Figure G-3: Boundary Tracking Parameter (BTP) Correlation with System Time Delay ........ G-3
Figure G-4: Time-to-Boundary Correlation with System Crossover Frequency....................... G-3
Figure G-5: Boundary Tracking Feedback Gain Correlation with System Crossover Frequency............................................................................................................................................. G-4
Figure G-6: Boundary Tracking Parameter (BTP) Correlation with System Crossover Frequency............................................................................................................................................. G-4
viii

HAVE BAT Technical Information Memorandum Edwards Air Force Base June 2006 Air Force Flight Test Center
LIST OF TABLES
Page No.
Table 1: Flight Conditions .............................................................................................................. 8
Table 2: System Time Delays ....................................................................................................... 11
Table 3: System Crossover Frequencies ....................................................................................... 13
Table 4: Calculated Pilot Actuation Frequencies.......................................................................... 14
Table 5: Estimated Values of the Boundary Tracking Parameters ............................................... 17
Table 6: Comparison of Pilot Actuation to System Crossover Frequencies................................. 18
Table C-1: Sorties and Test Points Flown .................................................................................. C-1
ix

HAVE BAT Technical Information Memorandum Edwards Air Force Base June 2006 Air Force Flight Test Center
This page intentionally left blank.
x

HAVE BAT Technical Information Memorandum Edwards Air Force Base June 2006 Air Force Flight Test Center
INTRODUCTION
General
The HAVE BAT Test Management Project (TMP) was one of a series of investigations into the phenomenon of boundary tracking. Boundary tracking occurs when a pilot perceives an impending hazardous situation and abandons other tasks to avoid the hazard. The goal of this research was to determine the degree of correlation between specific open-loop characteristics of the pilot-aircraft system and selected parameters that represent boundary tracking during various longitudinal tracking tasks. Establishing a relationship could lead to a better understanding and characterization of the boundary tracking phenomenon and could potentially lead to better predictions of aircraft PIO susceptibility. HAVE BAT was the first known effort to investigate and quantify boundary tracking in flight.
This technical report presents the findings of the HAVE BAT Test Team from the USAF Test Pilot School (TPS) at Edwards AFB, CA. The HAVE BAT TMP was conducted at the request of the Air Force Test Pilot School in collaboration with the Air Force Institute of Technology (AFIT), Wright Patterson AFB, OH. The Commandant of USAF TPS directed this program. All testing was accomplished under TPS Job Order Number (JON) M06TMP00. The flight test program consisted of ten test flights, each with both a test T-38C and a target T-38A aircraft. A third T-38A aircraft carried a professional photographer and served as photo chase during the last test flight. Total flight time for the 21 sorties was 23.7 flight hours. Simulator preparation was conducted at the Air Force Research Laboratories (AFRL), Wright-Patterson Air Force Base, Ohio (See appendix B). All flight testing was accomplished within the R-2508 complex at Edwards Air Force Base, California.
Background
Boundary tracking was first described by Mr. William Gray in a paper presented to the Society of Experimental Test Pilots (SETP) (reference 1,2). Observations into tracking tasks, traditionally thought as striving to maintain a certain condition, revealed that sometimes a tracking task included trying to avoid a condition. Anecdotal accounts seemed to support this in that pilots were often found to control an aircraft in order to avoid a hazardous situation or operational limit. These thoughts led to the theory of boundary avoidance tracking. Boundary avoidance tracking was to prevent or minimize crossing a boundary. There was not a tracking point to get towards, but rather a boundary to track away from, or avoid. This was a fundamental difference from traditional tracking tasks.
Another fundamental difference included the size of control inputs during traditional tracking tasks compared to those during boundary avoidance tracking. Tracking to a certain point, the control inputs are smaller while the pilot is trying to maintain a track point. Only when the pilot deviates far from the intended track point do the control inputs increase in order to get back to the track point. Conversely, during boundary avoidance tracking, control inputs increase as boundaries, the things being tracked, become more of a threat. When the boundaries then
1

HAVE BAT Technical Information Memorandum Edwards Air Force Base June 2006 Air Force Flight Test Center
become less of a threat, the control inputs get smaller. It was even possible to consider a time where the boundaries were never a concern and the pilot could continue onto another task.
This highlighted another difference between traditional tracking and boundary avoidance tracking. Point tracking is strived to be maintained, boundary avoidance tracking only comes in to play once the boundaries become a threat. Once they do become a threat, the pilot could abandon the point tracking task and move to boundary avoidance tracking. Then if the boundaries stopped being a threat the boundary avoidance tracking would be abandoned and point tracking would then be resumed.
Mr. Gray’s original simulation revealed that the application of sufficiently tight boundaries to a point tracking task results in coupled pilot-aircraft oscillations between the boundaries. These events of boundary avoidance tracking were characterized by the time-to-boundary – a function of the distance to the boundary and the rate at which the boundary was approached.
Two primary times-to-boundary were found to be descriptors of boundary avoidance tracking during Mr. Gray’s original simulation. Boundary awareness was defined as the time-to-boundary at which minimal control input was used by the tracker to avoid a boundary; this parameter was named “tmin” relating to the minimal feedback used. Boundary avoidance was defined as the time-to-boundary at which maximum feedback was used by the tracker to avoid the rapidly approaching boundary. This parameter was named “tmax” referencing the application of maximum feedback at the specified time-to-boundary. Boundary tracking occurs when the time-to-boundary is less than tmin and maximum pilot response occurs at times less than tmax.
The next iteration of the boundary tracking theory conducted by Mr. Gray was a pilot-in-the-loop simulation (reference 1,2) in which eight test subjects were provided a tracking task where boundary distances were successively decreased throughout the simulation. The test subjects were to minimize altitude differences between their aircraft and the lead aircraft while avoiding the ever-encroaching boundaries. Although a relatively small test population was used, the results of the study provided fairly well correlated mean values of tmin and tmax for test subjects with highly varied flight experience (from no experience to thousands of fighter flight hours). This study showed that the boundary avoidance tracking parameters for a specific flying task at a specific flight condition were fairly constant for all pilot experience levels. Both studies also revealed that system time delay had a significant impact on the time-to-boundary parameters.
HAVE BAT took the next step by investigating boundary avoidance tracking in flight for the first time, varying flight conditions (altitude, airspeed, and configuration) to examine how the change in system characteristics affected the boundary avoidance tracking behavior. Future projects are scheduled to further analyze the data and build upon the results of HAVE BAT, including graduate research theses by two AFIT graduate students and additional flight test programs at the USAF Test Pilot School.
Program Chronology
A joint Technical Review Board/Safety Review Board (TRB/SRB) was held on 24 March 2006. The TRB was chaired by the USAF TPS Education Division (USAF TPS/ED), and the
2
HAVE BAT Technical Information Memorandum Edwards Air Force Base June 2006 Air Force Flight Test Center
SRB was chaired by the AFFTC Safety Office (AFFTC/SET). The HAVE BAT team performed pre-test simulator preparation at the AFRL simulators on March 16-17, 2006. Flight testing took place from 10 April to 4 May 2006.
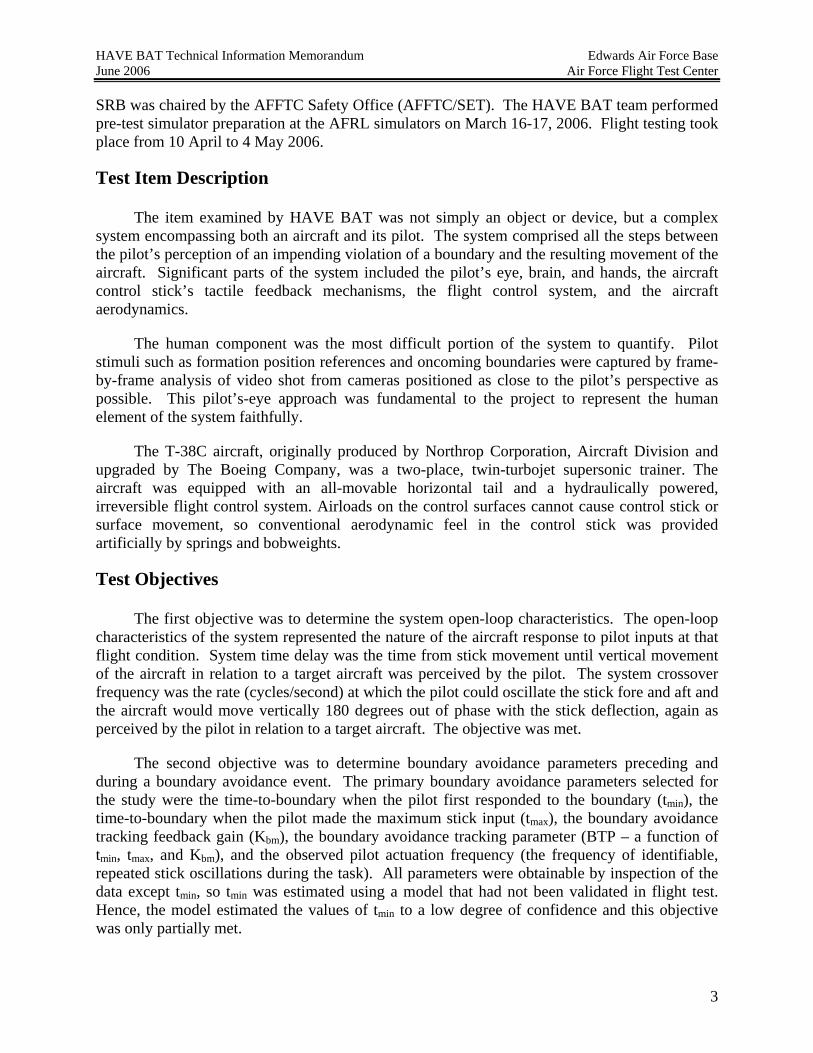
Test Item Description
The item examined by HAVE BAT was not simply an object or device, but a complex system encompassing both an aircraft and its pilot. The system comprised all the steps between the pilot’s perception of an impending violation of a boundary and the resulting movement of the aircraft. Significant parts of the system included the pilot’s eye, brain, and hands, the aircraft control stick’s tactile feedback mechanisms, the flight control system, and the aircraft aerodynamics.
The human component was the most difficult portion of the system to quantify. Pilot stimuli such as formation position references and oncoming boundaries were captured by frame-by-frame analysis of video shot from cameras positioned as close to the pilot’s perspective as possible. This pilot’s-eye approach was fundamental to the project to represent the human element of the system faithfully.
The T-38C aircraft, originally produced by Northrop Corporation, Aircraft Division and upgraded by The Boeing Company, was a two-place, twin-turbojet supersonic trainer. The aircraft was equipped with an all-movable horizontal tail and a hydraulically powered, irreversible flight control system. Airloads on the control surfaces cannot cause control stick or surface movement, so conventional aerodynamic feel in the control stick was provided artificially by springs and bobweights.
Test Objectives
The first objective was to determine the system open-loop characteristics. The open-loop characteristics of the system represented the nature of the aircraft response to pilot inputs at that flight condition. System time delay was the time from stick movement until vertical movement of the aircraft in relation to a target aircraft was perceived by the pilot. The system crossover frequency was the rate (cycles/second) at which the pilot could oscillate the stick fore and aft and the aircraft would move vertically 180 degrees out of phase with the stick deflection, again as perceived by the pilot in relation to a target aircraft. The objective was met.
The second objective was to determine boundary avoidance parameters preceding and during a boundary avoidance event. The primary boundary avoidance parameters selected for the study were the time-to-boundary when the pilot first responded to the boundary (tmin), the time-to-boundary when the pilot made the maximum stick input (tmax), the boundary avoidance tracking feedback gain (Kbm), the boundary avoidance tracking parameter (BTP – a function of tmin, tmax, and Kbm), and the observed pilot actuation frequency (the frequency of identifiable, repeated stick oscillations during the task). All parameters were obtainable by inspection of the data except tmin, so tmin was estimated using a model that had not been validated in flight test. Hence, the model estimated the values of tmin to a low degree of confidence and this objective was only partially met.
3

HAVE BAT Technical Information Memorandum Edwards Air Force Base June 2006 Air Force Flight Test Center
The third objective was to determine the degrees of correlation between the open-loop characteristics and the boundary avoidance parameters preceding and during a longitudinal boundary avoidance event. Flight conditions were varied by performing the flight testing at various combinations of airspeed, altitude, and configuration (gear extended or retracted). The open-loop characteristics varied at the different flight conditions and HAVE BAT investigated whether the boundary avoidance parameters changed accordingly. While correlations were observed to varying degrees, the statistical significance could not be determined because inadequate camera quality precluded automated video data reduction techniques and only a portion of the massive volume of video data could be reduced. This objective was therefore partially met because the results were based on limited test points and qualitative comments.
Limitations
Determination of a key boundary tracking parameter, tmin, was not possible by direct analysis of the data and was therefore estimated to a low level of confidence by a model. As a result, the objective of determining the key boundary tracking parameters was only partially met.
The camera provided video of insufficient quality for use by automated video data reduction procedures developed by the HAVE BAT team. The backup procedures required an analyst to manually click frame-by-frame to convert the video data to numerical data. This manual method proved excessively time-consuming and to meet project timelines the number of closed-loop test points analyzed was reduced to one per flight condition. Therefore, while relationships between the open-loop parameters and closed-loop results were investigated, a rigorous statistical analysis was impractical and the objective was only partially met.
4

HAVE BAT Technical Information Memorandum Edwards Air Force Base June 2006 Air Force Flight Test Center
TEST AND EVALUATION
General
HAVE BAT flight testing involved a test aircraft flying in precise formation with a target aircraft (see figure 1). Vertical position was determined by visually referencing parts of the target aircraft. Test-specific markings on the target aircraft served as artificial boundaries; the pilot of the test aircraft treated the crossing the boundaries by deviating too high or too low from the formation position as a hazardous event. To induce boundary avoidance tracking the target aircraft maneuvered in pitch, forcing the test pilot to act quickly to avoid breaking the boundaries.
Figure 1: Photograph of HAVE BAT Test In Progress
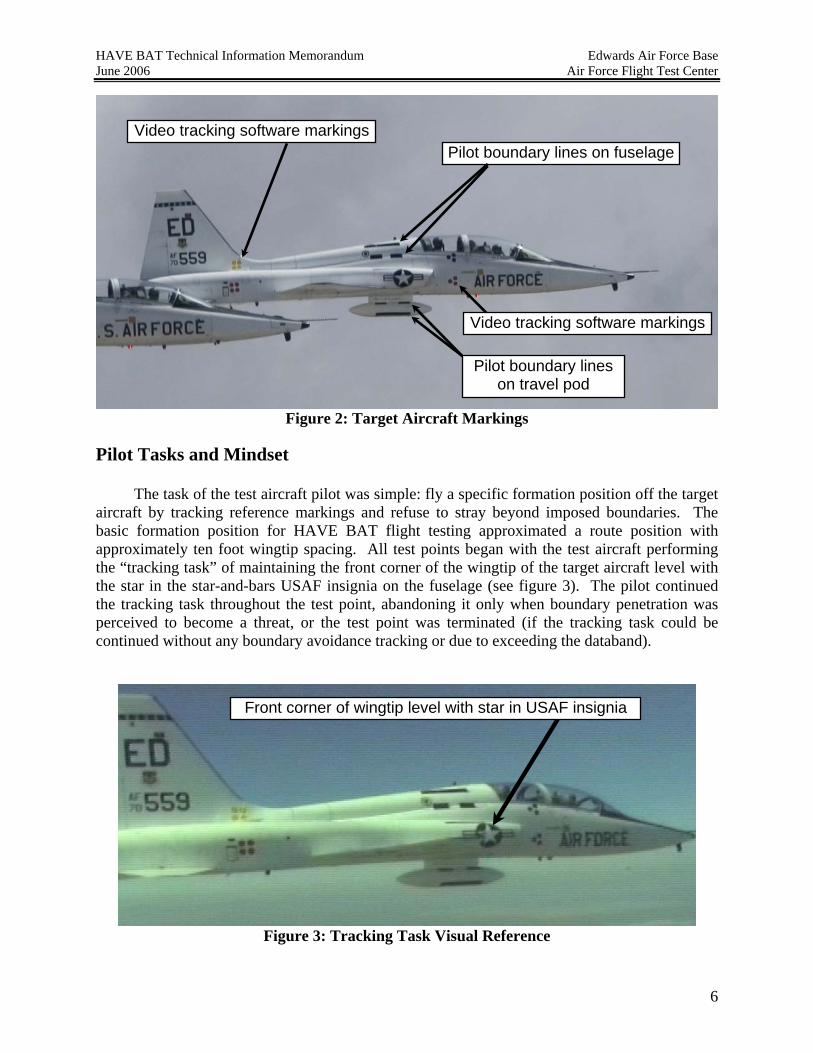
Target Aircraft Markings and Configuration
Two T-38A aircraft were marked with tape and decals by the test team to serve as target aircraft as shown in figure 2. A travel pod was installed on the scheduled aircraft to provide additional locations for boundary markings. The red and yellow circles under the cockpit and near the tail served as color-unique targets for use by automated video target-tracking software. Black horizontal stripes on the fuselage and on the travel pod served as the artificial boundaries when imposed upon the pilot.
5
HAVE BAT Technical Information Memorandum Edwards Air Force Base June 2006 Air Force Flight Test Center
Video tracking software markingsPilot boundary lines on fuselage
Video tracking software markings
Pilot boundary lines on travel pod
Figure 2: Target Aircraft Markings
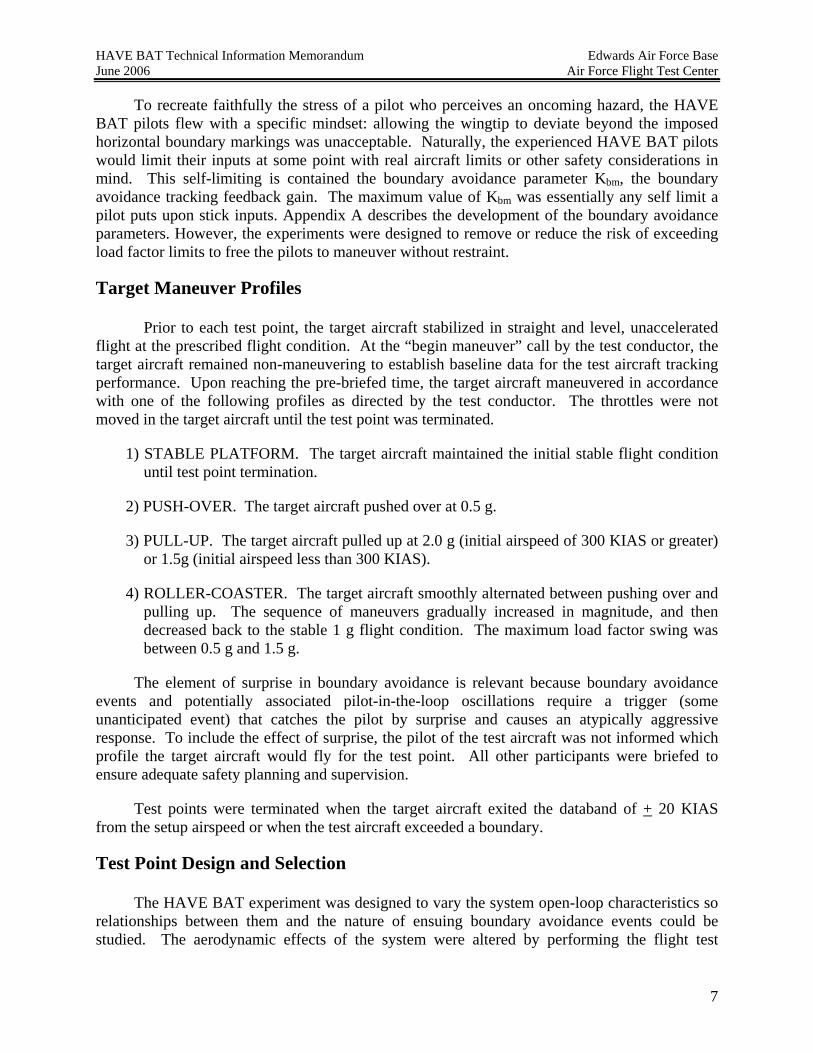
Pilot Tasks and Mindset
The task of the test aircraft pilot was simple: fly a specific formation position off the target aircraft by tracking reference markings and refuse to stray beyond imposed boundaries. The basic formation position for HAVE BAT flight testing approximated a route position with approximately ten foot wingtip spacing. All test points began with the test aircraft performing the “tracking task” of maintaining the front corner of the wingtip of the target aircraft level with the star in the star-and-bars USAF insignia on the fuselage (see figure 3). The pilot continued the tracking task throughout the test point, abandoning it only when boundary penetration was perceived to become a threat, or the test point was terminated (if the tracking task could be continued without any boundary avoidance tracking or due to exceeding the databand).
Figure 3: Tracking Task Visual Reference
Front corner of wingtip level with star in USAF insignia
6
HAVE BAT Technical Information Memorandum Edwards Air Force Base June 2006 Air Force Flight Test Center
To recreate faithfully the stress of a pilot who perceives an oncoming hazard, the HAVE BAT pilots flew with a specific mindset: allowing the wingtip to deviate beyond the imposed horizontal boundary markings was unacceptable. Naturally, the experienced HAVE BAT pilots would limit their inputs at some point with real aircraft limits or other safety considerations in mind. This self-limiting is contained the boundary avoidance parameter Kbm, the boundary avoidance tracking feedback gain. The maximum value of Kbm was essentially any self limit a pilot puts upon stick inputs. Appendix A describes the development of the boundary avoidance parameters. However, the experiments were designed to remove or reduce the risk of exceeding load factor limits to free the pilots to maneuver without restraint.
Target Maneuver Profiles
Prior to each test point, the target aircraft stabilized in straight and level, unaccelerated flight at the prescribed flight condition. At the “begin maneuver” call by the test conductor, the target aircraft remained non-maneuvering to establish baseline data for the test aircraft tracking performance. Upon reaching the pre-briefed time, the target aircraft maneuvered in accordance with one of the following profiles as directed by the test conductor. The throttles were not moved in the target aircraft until the test point was terminated.
1) STABLE PLATFORM. The target aircraft maintained the initial stable flight condition until test point termination.
2) PUSH-OVER. The target aircraft pushed over at 0.5 g.
3) PULL-UP. The target aircraft pulled up at 2.0 g (initial airspeed of 300 KIAS or greater) or 1.5g (initial airspeed less than 300 KIAS).
4) ROLLER-COASTER. The target aircraft smoothly alternated between pushing over and pulling up. The sequence of maneuvers gradually increased in magnitude, and then decreased back to the stable 1 g flight condition. The maximum load factor swing was between 0.5 g and 1.5 g.
The element of surprise in boundary avoidance is relevant because boundary avoidance events and potentially associated pilot-in-the-loop oscillations require a trigger (some unanticipated event) that catches the pilot by surprise and causes an atypically aggressive response. To include the effect of surprise, the pilot of the test aircraft was not informed which profile the target aircraft would fly for the test point. All other participants were briefed to ensure adequate safety planning and supervision.
Test points were terminated when the target aircraft exited the databand of + 20 KIAS from the setup airspeed or when the test aircraft exceeded a boundary.
Test Point Design and Selection
The HAVE BAT experiment was designed to vary the system open-loop characteristics so relationships between them and the nature of ensuing boundary avoidance events could be studied. The aerodynamic effects of the system were altered by performing the flight test
7

HAVE BAT Technical Information Memorandum Edwards Air Force Base June 2006 Air Force Flight Test Center
techniques at different altitudes, airspeeds, and landing gear configurations to cause the desired open-loop differences. The flaps and speed brakes were not extended for any test points. Table 1 lists the test conditions used for the investigation. A comprehensive breakdown of the test flights and test points flown is provided in appendix C.
Table 1: Flight Conditions
Altitude
(feet) Landing Gear
Position Airspeed(KIAS)
TypicalFlight Condition Mach
Typical Dynamic Pressure, q(pounds/square foot)
High Fast Cruise 20,000 Up 375 0.80 477 High Slow Cruise 20,000 Up 250 0.55 212 High Configured 20,000 Down 210 0.46 150 Low Fast Cruise 10,000 Up 375 0.67 477 Low Slow Cruise 10,000 Up 250 0.45 212 Low Configured 10,000 Down 210 0.38 150
The different target profiles (push-up, pull-over, etc.) were not treated as factors in the experiment. The profiles served the purpose of inducing boundary avoidance events for study, and the overall nature of the response was assumed to be independent of the trigger. Therefore, not every target profile was required at every test point to successfully gather data.
Because of the inescapable human element of the experiment, the individual pilots could possibly generate different results while performing closed-loop tasks under similar conditions. Control aggressiveness, reaction speed, and self-limitation (real-world shackles to avoid over-g or excessive buffet) could potentially vary widely from pilot to pilot. Because the pilot was a key factor in the experiment, closed-loop data were obtained from all of the pilots at each test condition. While open-loop results could conceivably vary slightly from pilot to pilot, they were assumed to be independent of pilot technique but were sampled by each pilot to ensure they were indeed independent and that adequate data existed for study.
Data Collection
Three types of data were required for this project: (1) the view of the target aircraft from the perspective of the test pilot to capture the pilot’s view; (2) a time history of the longitudinal stick position of the test aircraft to record the test pilot’s inputs to the system; and (3) pilot comments. All three sets of data were captured with each event except on Flight 8, when the recorder failed to function.
Video was required to record the tracking and boundary stimuli as seen by the pilot of the test aircraft. Three camera systems were employed: an aircraft-mounted camera, a helmet-mounted camera, and a digital video handheld camera operated by the rear cockpit occupant. For reasons explained below, only the aircraft-mounted camera produced consistently acceptable results.
The aircraft-mounted camera was installed immediately behind the ejection seat of the front cockpit, approximately three feet behind and slightly higher than the eyes of the pilot. The aircraft-mounted camera location is shown in figure 4. The camera was fixed into position by a
8

HAVE BAT Technical Information Memorandum Edwards Air Force Base June 2006 Air Force Flight Test Center
bracket so some amount of trial and error was required to properly align the camera’s field of view; however, once calibrated the camera required no maintenance or recalibration throughout the testing. The installation of the aircraft-mounted camera was a minor modification that integrated the camera with the aircraft electrical system for power and with three 8mm tape decks in the rear cockpit (one recorded the production aircraft HUD/MFD feed, the second recorded the aircraft-mounted camera feed, and the third recorded the data acquisition system data). All three tapes contained a time stamp for data synchronization. The video frame rate was 30 frames per second.
Figure 4: Aircraft-Mounted Camera Placement
The handheld and helmet-mounted camera systems proved to be insufficiently reliable over the course of the flight test program. Handheld digital video from the rear cockpit of the test aircraft tended to be shaky and the canopy bows occasionally blocked the line of sight during test points. It also lacked an accurate time stamp and lacked any aircraft intercom audio. A helmet-mounted camera with all components self-contained in a modified survival vest rarely captured the target aircraft fully in the field of view despite repeated calibrations and adjustments. Despite the inconsistency of these other cameras, the aircraft-mounted camera successfully recorded all of the test points (with exception of one flight) and provided all of the video data for this technical report.
Aircraft-mounted camera
Longitudinal stick position of the test aircraft was recorded by the aircraft data acquisition system (DAS). The sampling rate was 20 Hz. Stick position was in degrees.
Pilot comments were recorded by the aircraft-mounted camera audio feed. Comments of particular interest dealt with pilot stimuli. Pilot comments pertaining to whether they were performing the tracking task or avoiding a boundary were particularly valuable for interpreting the stick inputs and correlating them to the visual data.
9

HAVE BAT Technical Information Memorandum Edwards Air Force Base June 2006 Air Force Flight Test Center
Open-loop Characteristics: System Time Delay
System time delay is the lag time between the pilot’s input and the response of the aircraft. Excessive system time delays have often been associated with poor handling qualities and pilot-in-the-loop oscillations. In systems with excessive time delays, several phenomena may be present. First, pilots may feel compelled to make corrections sooner to compensate for the delayed response. Second, as the aircraft fails to respond to an input in a timely manner, the pilot may make a more aggressive input to avoid or escape the boundary. Third, if the input becomes too aggressive and the response lag is extreme, the aircraft may rapidly approach operating limitations (an over-stress boundary) or rapidly approach a second boundary.
To obtain the system time delay data, the test aircraft stabilized in the standard tracking formation position off of the target aircraft. The target aircraft provided a stable reference platform by maintaining straight and level, unaccelerated flight. When cleared to maneuver, the pilot of the test aircraft performed an aft stick step input.
After the flight, the system time delay was calculated as the length of time between two events: the pilot’s initial movement of the stick from the trim position, and the initial response of the aircraft. Definite stick movement was determined by a rapid stick deflection beyond the noise levels observed while stabilized in the trim condition. The step inputs were of sufficient quality to readily identify the moment the input was commenced. The time of the first aircraft response was determined by watching the video data, freezing the video at the first frame with definite vertical movement, and noting the time of the frame. This analysis technique closely reproduced the perception of the airborne pilot that the input had taken effect.
Table 2 summarizes the system time delays for each flight condition. The time delay values were calculated from one test run at each flight condition. The Mach and total dynamic pressure values were calculated using standard atmosphere pressure ratios. Figure 5 depicts the system time delays as functions of altitude and indicated airspeed. Hand-faired curves were drawn through test points at a given altitude to illustrate the trends from the data and verify the absence of gross outliers. The system time delay was treated as independent of the gear position because the flight control system was unaffected and parasitic drag was not relevant to the response time; therefore, the curves connect points regardless of whether the gear were extended or retracted. The system time delays showed nearly identical behavior when plotted as a function of Mach rather than indicated airspeed.
10

HAVE BAT Technical Information Memorandum Edwards Air Force Base June 2006 Air Force Flight Test Center
Table 2: System Time Delays
Altitude (feet)
Landing GearPosition
Airspeed(KIAS)
Typical Typical Dynamic Pressure, q
(pounds/square foot)
System Time Delay(seconds)
Flight Condition Mach
High Fast Cruise 20,000 Up 375 0.80 477 0.07 High Slow Cruise 20,000 Up 250 0.55 212 0.17 High Configured 20,000 Down 210 0.46 150 0.30 Low Fast Cruise 10,000 Up 375 0.67 477 0.03* Low Slow Cruise 10,000 Up 250 0.45 212 0.10 Low Configured 10,000 Down 210 0.38 150 0.17 * Note: The data sampling rates limited the precision of the system delays when less than 1/20 of a second.
0.00
0.05
0.10
0.15
0.20
0.25
0.30
0.35
150 200 250 300 350 400
Airspeed (KIAS)
Syst
em T
ime
Del
ay (s
econ
ds)
10,000 feet Pressure Altitude
20,000 feet Pressure Altitude
Gear Extended
NOTE: All curves hand-faired Data Source: Flight Test Aircraft: T-38C / 64-13197 Test Dates: 10 Apr - 4 May 06Test Conditions:10K/20KFT PA - 210 KIAS - PA Config10K/20K FT PA - 250 KIAS - CR Config10K/20K FT PA - 375 KIAS - CR Config
frame rate minimum limit = 0.03 sec
Figure 5: System Time Delays at the Test Flight Conditions
Open-loop Characteristics: System Crossover Frequency
Currently prevailing handling qualities paradigms link phase lag with undesirable tendencies, particularly when pilot-in-the-loop oscillations (PIO) enter the discussion. Definition of a PIO often includes the requirement that the cause (stick input) and effect (aircraft motion) be 180 degrees out of phase. Because boundary avoidance tracking events between opposing boundaries can result in divergent oscillations that look and feel like a PIO, HAVE BAT
11

HAVE BAT Technical Information Memorandum Edwards Air Force Base June 2006 Air Force Flight Test Center
included frequency analysis in the investigation to compare the boundary avoidance tracking phenomenon to the characteristics of the classic PIO. This analysis compared the stick oscillation frequency at which out-of-phase behavior was observed (the system crossover frequency) to the actual frequencies (the “pilot actuation frequencies”) observed during flight test closed-loop tasks.
The system crossover frequency (ω180) is defined for this study as the rate at which an oscillatory pitch input by the pilot results in the opposite vertical movement from the aircraft. When cycling the stick at this frequency, the aircraft will climb during forward stick application and descend during aft stick application because the aircraft is still responding to the previous input (a symptom of system time delay described earlier). If the pilot’s input is slower than the crossover frequency, the aircraft will follow the stick inputs (aft stick results in a climb, as one would expect); if the pilot’s input is faster, the aircraft does not have enough time to respond to the rapidly alternating commands and merely twitches near the trim state. The system crossover frequency is of interest because if the pilot makes repeated corrections at this rate (such as when bouncing between two opposing boundaries), the aircraft may move in a direction opposite what the pilot is commanding and anticipating. Such a situation increases the potential for divergent oscillations and classic pilot-in-the-loop oscillations.
The system crossover frequency investigation required the test aircraft to perform a frequency sweep in pitch while at or near the standard formation position off the target aircraft. To perform the frequency sweep, the pilot made slow, alternating inputs of small stick deflections and gradually increased the frequency. Once the pilot perceived the aircraft vertical movement to be out of phase with the stick deflection, the pilot dwelled at that frequency to record a sufficient stick trace on the DAS for later analysis. Throughout the frequency sweep, the pilot adjusted stick deflections to keep the target aircraft within the field of view of the aircraft-mounted camera for post-flight video analysis. Post-flight analysis entailed measuring the period of the oscillations and taking the reciprocal to determine ω180.
The measured system crossover frequencies are listed in table 3 and depicted in figure 6 as a function of aircraft Mach number. Overall, the pilot had to oscillate the stick more rapidly at higher Mach numbers or with the landing gear extended to obtain out-of-phase response from the aircraft. Two straight lines – one line through the points with the gear retracted and another line through the two points with the gear extended – were hand-faired to indicate trends and verify the absence of gross outliers. Clear trends were not readily identifiable when plotted against indicated airspeed rather than Mach number.
12

HAVE BAT Technical Information Memorandum Edwards Air Force Base June 2006 Air Force Flight Test Center
Table 3: System Crossover Frequencies
Flight Condition
Altitude
(feet)
Landing
Gear Position
Airspeed(KIAS)
Mach
System Crossover Frequency
(Hz) High Fast Cruise 20,000 Up 375 0.80 0.88 High Slow Cruise 20,000 Up 250 0.55 0.59 High Configured 20,000 Down 210 0.46 0.56 Low Fast Cruise 10,000 Up 375 0.67 0.71 Low Slow Cruise 10,000 Up 250 0.45 0.45 Low Configured 10,000 Down 210 0.38 0.45
0.3
0.4
0.5
0.6
0.7
0.8
0.9
1
0.30 0.40 0.50 0.60 0.70 0.80 0.90
Mach
Syst
em C
ross
over
Fre
quen
cy (A
ctua
tions
/sec
ond)
20,000 feet10,000 feet
NOTE: All curves hand-faired
Gear Retracted
Gear Extended
Data Source: Flight Test Aircraft: T-38C / 64-13197 Test Dates: 10 Apr - 4 May 06Test Conditions:10K/20KFT PA - 210 KIAS - PA Config10K/20K FT PA - 250 KIAS - CR Config10K/20K FT PA - 375 KIAS - CR Config
Figure 6: System Crossover Frequency Results
Closed-loop Pilot Actuation Frequency
The pilot actuation frequencies were determined much like the system crossover frequencies by searching the DAS stick deflection data during boundary avoidance tracking for multiple oscillations and measuring the period. Typically, at least two sequences of readily identifiable constant-frequency oscillations would be present, revealing two predominant frequencies (referred to here as low and high). Figure 7 illustrates this analysis technique on a sample plot of stick deflection. The two discernable pilot actuation frequencies were 0.80 and 2.56 Hz. Of note, the pilot commented in flight that he was performing tracking during the 0.80 Hz oscillations, but not during the 2.56 Hz oscillations that preceded a high-gain boundary escape and subsequent boundary penetration in the other direction. Fast Fourier Transforms
13

HAVE BAT Technical Information Memorandum Edwards Air Force Base June 2006 Air Force Flight Test Center
were examined but not used for analysis because the frequencies of interest (especially the system crossover frequencies) were buried in a spike of frequencies below 5 Hz. For a human-driven mechanical feedback system, higher frequencies would be extremely unlikely. Also, the pilot theoretically need only cycle the stick at the crossover frequency a few times to unleash the effects. That chain of events would be evident during the study of the time series.
-2
0
2
4
6
8
10
12
3764 3765 3766 3767 3768 3769 3770 3771 3772
DAS Time Stamp (seconds)
Stic
k D
efle
ctio
n(de
gree
s)
1.25 sec 1.25 sec1.25 sec
0.38 sec 0.40 sec
LOW FREQUENCY = 0.80 HzHIGH FREQUENCY
= 2.56 Hz
EXPECTED PILOT ACTUATION FREQUENCY (SYSTEM CROSSOVER FREQUENCY OF 0.71 HZ)
MEASURED PILOT ACTUATION FREQUENCIES
Data Source: Flight Test Aircraft: T-38C / 64-13197 Test Dates: 20 Apr 06Test Conditions:10K FT PA - 375 KIAS - CR Config
Figure 7: Example Pilot Actuation Frequency Analysis
Pilot actuation frequencies measured from a run at each flight condition are listed in table 4. The pilot actuation frequencies were higher than the system crossover frequencies with the smallest difference at the 250 KIAS conditions. Inspection of the data in the time domain confirmed that the system never responded 180 degrees out of phase with the pilot.
Table 4: Calculated Pilot Actuation Frequencies
Flight Condition
Altitude
(feet)
Landing
Gear Position
Airspeed(KIAS)
Low
Frequency(Hz)
High
Frequency (Hz)
High Fast Cruise 20,000 Up 375 1.03 2.78 High Slow Cruise 20,000 Up 250 0.68 2.78 High Configured 20,000 Down 210 0.75 1.41 Low Fast Cruise 10,000 Up 375 0.80 2.56 Low Slow Cruise 10,000 Up 250 0.56 2.54 Low Configured 10,000 Down 210 0.61 1.92
14

HAVE BAT Technical Information Memorandum Edwards Air Force Base June 2006 Air Force Flight Test Center
Determination of Closed-loop Boundary Avoidance Parameters
Six (6) closed-loop tracking events were selected from the collected data for each flight condition and configuration considered. Initial qualitative analysis of push-over, pull-up, and rollercoaster events showed some similarities between both push-over and pull-up events; as such, only these two types of maneuvers were initially considered. The analysis and data provided assumes that the push-over and pull-up events are sufficiently similar as to provide directly comparable results. Further analysis must be conducted to determine if the rollercoaster maneuvers can be compared directly with push-over and pull-up data.
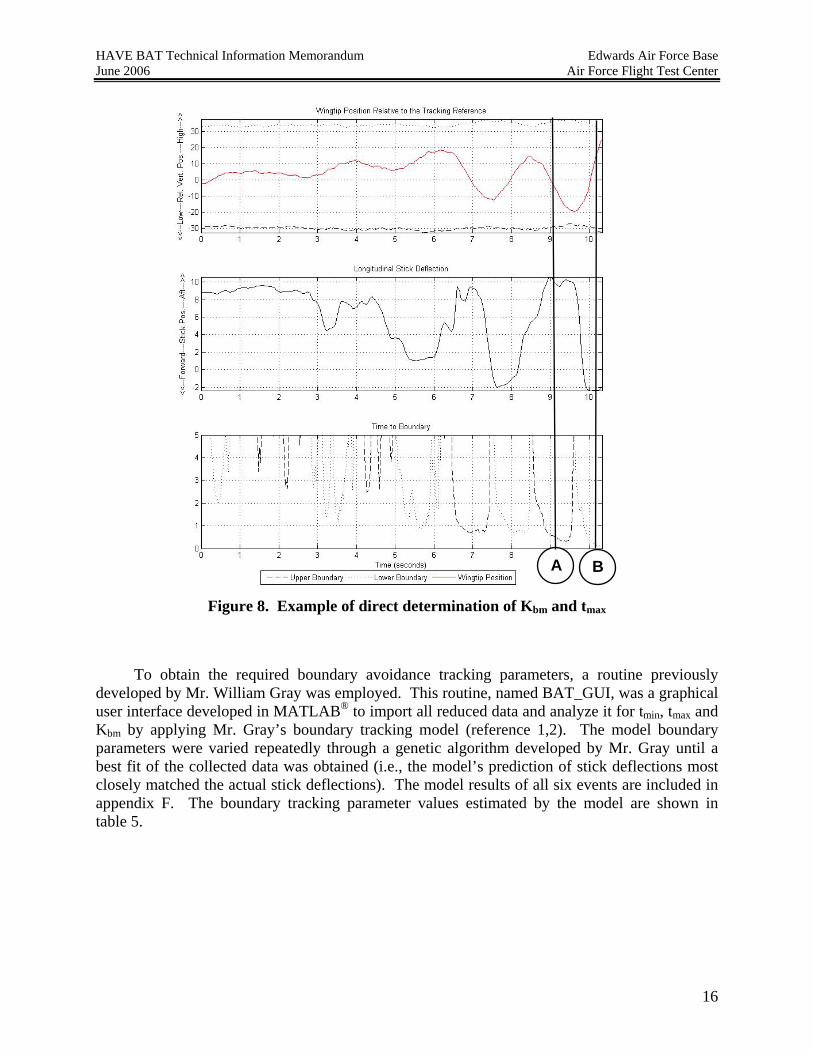
To determine the boundary avoidance tracking parameters, the test team developed the BAT MATLAB® routine to calculate and display the continuously changing time-to-boundary during a test run. The time-to-boundary at a point in time was calculated as the distance of the wingtip reference from the boundary divided by the rate of travel of the wingtip towards the boundary. An example data plot from the BAT routine is provided in figure 8 to illustrate how boundary tracking parameters were determined directly from the collected data. The value of Kbm corresponded to the maximum stick position seen during the boundary avoidance tracking event. Two points for Kbm were required as both a maximum forward and aft stick position were associated with both lower and upper boundary avoidance tracking events – point A depicts the greatest aft stick deflection, and point B depicts the greatest forward stick deflection. Since tmax corresponded to the time-to-boundary at which the greatest stick deflection was observed, tracing each line down from the stick position plot to the time-to-boundary plot revealed the corresponding values for tmax.
To complete the analysis, values for tmin had to be determined. Based on simulator test results (references 1,2), the test team expected that tmin would correspond with a rapid change in stick position seen as the pilot began to input into the system based on the encroaching boundaries. However, due to the complicated flight dynamics and frequent movement of the stick by the pilots in flight, visually inspecting the time series data to ascribe particular stick movements to boundary stimuli unexpectedly proved intractable. Appendix E contains the BAT MATLAB® output plots for all of the closed-loop test runs; each demonstrates likewise that the direct determination of tmin from the collected data was occluded by noise and non-attributable stick movements. Pilot comments also did not provide such a correlation because the time delay from the pilot boundary reaction to the audible remark by the pilot spanned multiple stick movements. Since only two of the three parameters could be determined by direct observation, an alternate method was used to determine all three parameters: a predictive model.
15
HAVE BAT Technical Information Memorandum Edwards Air Force Base June 2006 Air Force Flight Test Center
Figure 8. Example of direct determination of Kbm and tmax
To obtain the required boundary avoidance tracking parameters, a routine previously developed by Mr. William Gray was employed. This routine, named BAT_GUI, was a graphical user interface developed in MATLAB® to import all reduced data and analyze it for tmin, tmax and Kbm by applying Mr. Gray’s boundary tracking model (reference 1,2). The model boundary parameters were varied repeatedly through a genetic algorithm developed by Mr. Gray until a best fit of the collected data was obtained (i.e., the model’s prediction of stick deflections most closely matched the actual stick deflections). The model results of all six events are included in appendix F. The boundary tracking parameter values estimated by the model are shown in table 5.
B A
16

HAVE BAT Technical Information Memorandum Edwards Air Force Base June 2006 Air Force Flight Test Center
Table 5: Estimated Values of the Boundary Tracking Parameters
Flight Condition
Altitude
(feet)
LandingGear
Position
Airspeed(KIAS)
tmin(sec)
tmax(sec)
Kbm
BTP High Fast Cruise 20,000 Up 375 3.69 0 2.95 1.25 High Slow Cruise 20,000 Up 250 2.83 1.31 4.20 0.36 High Configured 20,000 Down 210 2.07 1.04 0.98 1.05 Low Fast Cruise 10,000 Up 375 1.77 1.35 4.50 0.09 Low Slow Cruise 10,000 Up 250 3.49 0.71 5.78 0.48 Low Configured 10,000 Down 210 2.50 0.40 7.65 0.27
The model and associated BAT_GUI routine were written for and validated in simulator testing using test procedures different from those used in HAVE BAT flight testing. In the simulator testing, the stick trim position of the test “aircraft” never changed. In contrast, during HAVE BAT the target aircraft maneuvered to a target load factor and the test aircraft trim stick position varied during the course of each test maneuver. This was not accounted for in the BAT_GUI algorithm and introduced errors in all three boundary avoidance tracking parameters. In an attempt to minimize the effect of this error, the test team attempted to set the trim stick position qualitatively to the perceived trim position during the boundary avoidance tracking event. This error will be corrected for during continued analysis of the data for continuing associated projects.
Relationships Between Open-loop Characteristics and Boundary Avoidance
While relationships between the open-loop parameters and boundary avoidance tracking parameters were examined, statistical significance could not be determined because hardware deficiencies hampered data reduction. The camera systems that collected vital video data did not provide video of sufficient quality for automated data reduction. Prior to flight testing, the HAVE BAT team developed MATLAB® video tracking routines that would automatically track markings of unique shape and color attached to the target aircraft and convert the video data into numerical data. The markings consisted of groupings of yellow and red circles at the forward and aft ends of the aircraft and green covering over the wingtip. Armed with the video clip of a test point, the data analyst would distinguish the markings for the tracking software and run the clip. The software would continuously track the markings and output time-tagged pixel coordinates for further computational analysis. Computer simulations and tests with stock footage validated the concept and the process. In flight, however, the camera’s white balance frequently fluctuated as sun angles and backgrounds changed. These washouts combined with marginal resolution to make the video clips unusable by the tracking software. The HAVE BAT team was forced to resort to the backup, “brute force” data reduction process of manually clicking on the video data frame by frame (with 30 frames per second of video) to produce the necessary numerical data. This manual method proved to be excessively time-consuming. Given the inflexible time constraints of the project, the team was unable to reduce the massive volume of data required for the desired rigorous statistical analyses. Instead, the team was forced to parse the data and select only the most representative and illustrative test points for in-depth study while reserving the remaining data points for overall comments and qualitative
17

HAVE BAT Technical Information Memorandum Edwards Air Force Base June 2006 Air Force Flight Test Center
comparisons. A wealth of quality data remains to be examined to produce more rigorous analyses. Reduce and analyze the remaining data gathered by HAVE BAT (R1).
All estimated closed-loop parameters were plotted as functions of the open-loop parameters to determine the degree of correlation. All plots are presented in appendix G. The relationship that showed the strongest correlation was that of the Boundary Tracking Parameter to the System Time Delay. Most other data showed little apparent correlation given the limited data available. Overall, there is evidence that a relationship between both system time delay and system crossover frequency exists with the boundary avoidance tracking parameters. Though this relationship was not apparent from the current set of analyzed data, based on the test team’s experience and pilot comments during this project boundary avoidance behavior was affected by the system open-loop characteristics and more study is warranted. Further investigate the boundary tracking phenomenon (R2).
To examine the system open-loop effects in the frequency domain, the system crossover frequencies were compared to the pilot actuation frequencies (table 6). Across all flight conditions examined, the pilots tended to operate at frequencies higher than the system crossover frequencies. At no point did the pilots dwell at the system crossover frequency for that flight condition. As expected, out-of-phase control was therefore not observed during any test runs. It is interesting that the pilots did operate at the system crossover frequency for other flight conditions – for example, during the “Low Slow Cruise” test run the pilot dwelled at 0.56 Hz, the system crossover frequency if configured at 20,000 feet. This indicates that the pilots’ input patterns adapted to the flight conditions. Insufficient data exist to determine whether the pilots adapted specifically to the open-loop parameters studied by HAVE BAT, in particular by not dwelling at the system crossover frequency because the undesirable out-of-phase tendency was unconsciously sensed and avoided.
Table 6: Comparison of Pilot Actuation to System Crossover Frequencies
Flight Condition
Altitude
(feet)
Landing
Gear Position
Airspeed(KIAS)
System Crossover Frequency
(Hz)
Low
Frequency (Hz)
High
Frequency(Hz)
High Fast Cruise 20,000 Up 375 0.88 1.03 2.78 High Slow Cruise 20,000 Up 250 0.59 0.68 2.78 High Configured 20,000 Down 210 0.56 0.75 1.41 Low Fast Cruise 10,000 Up 375 0.71 0.80 2.56 Low Slow Cruise 10,000 Up 250 0.45 0.56 2.54 Low Configured 10,000 Down 210 0.45 0.61 1.92
One of the most intriguing findings of HAVE BAT dealt with the nature of perceived pilot-
in-the-loop oscillations. Despite the fact that the pilots’ stick oscillation rates did not correspond to system crossover frequency and 180 degree out-of-phase response was not observed, the pilots universally described the divergent boundary episodes as feeling like a PIO. The phase lag was measured in reference to the visual perception of the target aircraft – perhaps the stick inputs were indeed out of phase with some other source of feedback (like load factor) that was
18

HAVE BAT Technical Information Memorandum Edwards Air Force Base June 2006 Air Force Flight Test Center
surreptitiously entering the feedback loop and affecting the pilot’s control inputs. However, examination into this behavior was beyond the scope of this study. Examine the frequency aspect of boundary avoidance tracking-related pilot-in-the-loop oscillations (R3).
19

HAVE BAT Technical Information Memorandum Edwards Air Force Base June 2006 Air Force Flight Test Center
CONCLUSIONS AND RECOMMENDATIONS
The HAVE BAT TMP demonstrated the correlation of system open-loop characteristics and boundary avoidance tracking parameters through the use of visual tracking hardware and software. Though the designed system and the employed system varied greatly, the project was able to employ several reserve assets to obtain the data required for analysis. The following recommendations address the issues that resulted from the use of a visual tracking system to obtain the data required for HAVE BAT.
While relationships between the open-loop parameters and boundary avoidance tracking parameters were indeed examined, statistical significance could not be determined because hardware deficiencies hampered data reduction. The camera systems that collected vital video data did not provide video of sufficient quality for automated data reduction. Given the inflexible time constraints of the project, the team was unable to reduce the massive volume of data required for the desired rigorous statistical analyses. Instead, the team was forced to parse the data and select only the most representative and illustrative test points for in-depth study while reserving the remaining data points for overall comments and qualitative comparisons. A wealth of quality data remains to be examined to produce more rigorous analyses. Reduce and analyze the remaining data gathered by HAVE BAT (R1, page 18).
The relationship that showed the strongest correlation was that of the Boundary Tracking Parameter to the System Time Delay. Most other data showed little apparent correlation given the limited data available. However, there is evidence that a relationship between both system time delay and system crossover frequency exists with the boundary tracking parameters. Though this relationship was not apparent from the current set of analyzed data, based on the test team’s experience and pilot comments during this project boundary avoidance behavior was affected by the system open-loop characteristics and more study is warranted. Further investigate the boundary tracking phenomenon (R2, page 18).
Across all flight conditions examined, the pilots tended to operate at frequencies higher than the system crossover frequencies. At no point did the pilots dwell at the system crossover frequency for that flight condition. As expected, out-of-phase control was therefore not observed during any test runs. Despite the fact that the pilots’ stick oscillation rates did not correspond to system crossover frequency and 180 degree out-of-phase response was not observed, the pilots universally described the divergent boundary episodes as feeling like pilot-in-the-loop oscillations. Examine the frequency aspect of boundary avoidance tracking-related pilot-in-the-loop oscillations (R3, page 19).
HAVE BAT was the first program to gather flight test data on the concept of boundary avoidance tracking. The test team observed first-hand that (1) pilots adapt their control inputs based on the handling qualities of the aircraft and the level of threat posed by a boundary, and (2) that the imposition of boundaries can lead to divergent oscillations. Further examination could reveal much about how pilots react to stimuli and how the system characteristics impact the final outcome.
20

HAVE BAT Technical Information Memorandum Edwards Air Force Base June 2006 Air Force Flight Test Center
REFERENCES 1. Gray, William III, “Boundary Avoidance Tracking: A New Pilot Tracking Model,” American
Institute of Aeronautics and Astronautics.
2. Gray, William III, “Boundary Escape Tracking: A New Conception of Hazardous PIO,” Society of Experimental Test Pilot
21

HAVE BAT Technical Information Memorandum Edwards Air Force Base June 2006 Air Force Flight Test Center
APPENDIX A – BOUNDARY AVOIDANCE PARAMETER DEVELOPMENT
One boundary avoidance tracking parameter of interest was the time to boundary (tb). The value of tb was a function of distance to (or the displacement from) a predetermined boundary (Db) and the rate towards that boundary (rb). The rate towards the boundary was the first derivative of the displacement from the boundary. This relationship is shown in the following equation.
•==b
b
b
bb
D
DrD
t
The other parameters of interest, tmin and tmax, were respectively the times at which the minimum and maximum feedback gain occurred during a boundary avoidance event. The relationship of tmin and tmax, to the boundaries are shown in figure A-1, where the feedback gain is represented by the oscillatory time history of stick position.
tmin tmaxtmin tmax
Figure A-1: Relationships of tmin and tmax with respect to boundaries
The point tracking task was modeled with a simple feedback system, containing a "plant", and a loop with feedback saturation and delay (reference 1,2) . The plant could have been a spring-mass-damper system, or open-loop aircraft characteristics. The pilot was represented by the saturation and delay in the feedback loop. Adding boundary avoidance along with point tracking required the addition of a parallel feedback loop. The boundary avoidance model can be seen in figure A-2. Two boundaries and a point tracking task were contained in this model and only one boundary is respected at a time, based on priority. The boundary avoidance tracking feedback gain, Kbm, was contained in each boundary feedback loop.
A-1

HAVE BAT Technical Information Memorandum Edwards Air Force Base June 2006 Air Force Flight Test Center
Figure A-2: Boundary Avoidance feedback model
It was hypothesized that contribution of Kbm was a function of time to the boundary (tb), tmin, and tmax. This relationship is shown in figure A-3. When the pilot was at tmax, it was the time where maximum feedback gain occurred to avoid the boundary. As the time to the boundary increased, the gain decreased until tmin was reached, this was the point of minimum boundary avoidance. At times above tmin, the pilot was thought to switch back to a point tracking task and disregarded the boundary. The relationship between the boundary avoidance tracking feedback gain and the times that bounded it can be shown in the following equation (equation A-1).
bmb K
tttt
)()(
maxmin
min
−−
[Equation A-1]
A-2

HAVE BAT Technical Information Memorandum Edwards Air Force Base June 2006 Air Force Flight Test Center
Time to boundary
Gai
n
Kmax
tmax tmin
Boundary Avoidance
Point Tracking
Time to boundary
Gai
n
Kmax
tmax tmin
Boundary Avoidance
Point Tracking
Figure A-3: Variable gain (equivalent to stick deflection) during boundary avoidance
tracking
A pilot makes either a conscious or subconscious decision to abandon point tracking (or chooses to disregard the boundaries). However, as shown in figure A-2, there are multiple feedback loops, and there could be instances a pilot could be in a point tracking task while being aware of and reacting to a boundary, but at boundary avoidance gains much lower than what is required for the point tracking task.
However, for the purposes of this testing the test team assumed these feedback loops were mutually exclusive and when a pilot switched between the feedback loops, the other loop is disregarded. This was felt to be a safe assumption as the responses to the feedback of the lower priority task was so small as to be thought of as nonexistent. This assumption required the test pilot to verbalize when they switched from point tracking to boundary avoidance tracking, and vice versa. This verbalization should also allow for a determination of tmin when switching tracking modes.
Kbm was thought to be analogous to the amplitude of the stick deflection required to avoid a boundary. Small stick displacements when the boundary was not a threat, and full displacements for maximum effort to avoid a boundary were good examples of the relation between Kbm and stick displacement.
It was hypothesized that tmin, tmax and Kbm were constant for a boundary avoidance associated with a particular boundary tracking task. The value of tmin was determined by pilot comments when the pilot noted boundary avoidance tracking began and it was be assumed to be at minimum gain. In the instances of boundary avoidance tracking, the magnitude of the stick displacement was thought to be representative of the gain Kbm applied to the feedback model. The value for tmax was the time-to-boundary when the maximum gain was applied. The values
A-3

HAVE BAT Technical Information Memorandum Edwards Air Force Base June 2006 Air Force Flight Test Center
for Kbm, tmin and tmax can be combined into one parameter, dubbed the Boundary Tracking Parameter (BTP) as shown in equation A-2.
bmKtt
BTP)( maxmin −= [Equation A-2]
During a sustained boundary avoidance tracking event, it was thought that there would be a frequency that the pilot makes consistently high gain inputs in order to keep from violating a set of boundaries. This frequency was termed the pilot actuation frequency, and was measured during sustained boundary avoidance tracking events. It was thought that the pilot actuation frequency would be constant for boundary avoidance associated with a particular tracking task.
A-4

HAVE BAT Technical Information Memorandum Edwards Air Force Base June 2006 Air Force Flight Test Center
APPENDIX B – AFRL SIMULATOR PREPARATION
In March 2006, the HAVE BAT team traveled to Wright Patterson AFB, OH, to use a T-38 simulator in preparation for flight testing. The Infinity Cube simulator of AFRL/VACD was a full non-linear six degree of freedom simulation of the T-38A aircraft developed over a one-year period for use in this project. The handling qualities of the simulator were good representations of the actual aircraft and the simulator provided an excellent visual presentation of a target T-38A aircraft. Figure B-1 depicts the view available to the pilots during a simulator session.
Figure B-1: AFRL Simulator Visual Presentation
Each potential target profile was flown and recorded by the simulator. Then, the console operator reset the simulator, input a location shift to place the target aircraft in the proper location, and replayed the profile while the HAVE BAT pilot flew formation. The test team validated numerous target profiles in this manner and selected the most effective for later use. Overall, the AFRL simulator was instrumental in developing and rehearsing the flight test techniques later employed in flight testing.
B-1

HAVE BAT Technical Information Memorandum Edwards Air Force Base June 2006 Air Force Flight Test Center
APPENDIX C – SORTIES AND TEST POINTS FLOWN
Table C-1 details the HAVE BAT test flights and the test points performed on each. Each HAVE BAT flight consisted of one test aircraft and one target aircraft.
Table C-1: Sorties and Test Points Flown
10,000 feet 20,000 feet
FLIGHT DATE 2006
PILOT 375 KIASGear Up
250 KIAS 210 KIAS Gear Down
375 KIASGear Up
250 KIAS Gear Up
210 KIAS Gear Down Gear Up
1 10 Apr 3 O T O T O 2 14 Apr 2 O T O T O 3 19 Apr 3 T T T T 4 20 Apr 2 T T T T 5 21 Apr 3 Flight dedicated to trail task execution 6 24 Apr 1 T T O T 7 25 Apr 2 T T T
[O T] [O T] [O T] 8 1 May 1 9 2 May 1 O T O T O T T
10 4 May 2 O O T O O T O T Notes: 1. Altitudes are Pressure Altitude 2. The pilot of the test aircraft is indicated as pilot 1, 2, or 3 3. “O” indicates open-loop test points and “T” indicates closed-loop tracking tasks at the flight condition 4. The aircraft-mounted camera failed to function on Flight 8 so no video data was collected
C-1

HAVE BAT Technical Information Memorandum Edwards Air Force Base June 2006 Air Force Flight Test Center
APPENDIX D – DATA REDUCTION
Data reduction tools consisted of both commercial off-the-shelf software and locally created MATLAB® routines. Each served a specific purpose in reducing the separate streams of data and integrating them into the required data products for analysis. After each flight, data reduction generally followed two tracks in parallel: one for the video data, and one for the stick deflection data. The two data streams were integrated at the last step to produce the final data products for analysis. Figure D-1 illustrates the flow of data through the data reduction process.
Post-Flight
Video Data (Video stream with time stamp, 30 Hz)
DAS Data (Stick displacement, time, 20 Hz)
Adobe Premiere® Convert video file into a series of sequential still frame image files.
Text Editor Extract data for selected time period
ScratchClick MATLAB® routine Frame by frame, convert pilot’s visual references to (x,y) pixel coordinates.
BAT MATLAB® Routine Integrate visual reference coordinates
and stick deflections into one database.
Adobe Premiere® Extract video for time of each event.
Figure D-1: Data Reduction Flow Chart
The onboard camera used to capture the pilot’s perspective stored the captured images on an analog tape. To process the video digitally, a commercial off-the-shelf video tape player converted the analog signal to an uncompressed version of the Audio Video Interleave (AVI) file format and digitally exported the file to a computer via an Institute of Electrical and Electronics Engineers (IEEE) standard 1394 bus also known as FireWire.
Once the analog file was converted to a digital format, Adobe Premiere® was used to reduce the typical 14 gigabyte video file into a more manageable 2 gigabyte size. This was done by deleting the nonessential portions of the typical 1 hour and 15 minute flight. These portions included all events except the actual test points which were typically 10 to 15 seconds long. The end result was a reduction of the flights video length from 1 hour and 15 minutes to roughly 7 minutes. Two seconds of video data prior to the beginning of the maneuver were collected as a
D-1

HAVE BAT Technical Information Memorandum Edwards Air Force Base June 2006 Air Force Flight Test Center
buffer to determine trim information and the clip was ended at either the “terminate” call or when the aircraft departed the field-of-view (FOV) of the camera. The 15 to 17 minute AVI clip contained all the pertinent events of the sortie but was still in video format. To analyze each individual 10 to 15 second event, the AVI clip was parsed and converted into a 30 frames-per-second (fps) still image sequence and saved in individual folders descriptively labeled to organize and separate individual events.
ScratchClick, a MATLAB® routine created by a member of the HAVE BAT team, converted the pilot’s perspective (converted to individual frames in Adobe Premiere®) into numerical data. ScratchClick enabled the analyst to cycle from frame to frame of a desired event’s video and select multiple points per frame. These selected points were then stored for future analysis. To determine the time-to-boundary as perceived by the pilot, six points of interest per frame were required: one at the leading corner of the target aircraft wingtip, one at the tracking reference where the wingtip was to be maintained, and two to define each linear boundary above and below the tracking reference. Figure D-2 illustrates the ScratchClick interface as well as how ScratchClick displays these 6 points. From this information the vertical distances from the tracking point to the wingtip and to each boundary were calculated. Other key features include an image export section which converts the still images back into an AVI format which also includes the overlay of the selected points.
Figure D-2: Example ScratchClick Video Data Extraction
D-2

HAVE BAT Technical Information Memorandum Edwards Air Force Base June 2006 Air Force Flight Test Center
Upper Boundary
Lower Boundary
Reference Track Line
Selected six Points
1
2
3
5
6
4
Wingtip Track Line (parallel to the Reference Track Line)
Figure D-3: Example ScratchClick Video Data Extraction
Figure D-3 graphically shows how the six points selected were used to derive the time-to-boundary condition. Points 1 and 2 defined the upper boundary while 5 and 6 defined the lower boundary. Point 4, the leading edge of the wingtip, was the reference point the pilot was using while flying the tracking task. Point 3, the center of the star, was used to define the path the wingtip followed during the tracking task. Two critical assumptions were made to determine the time-to-boundary using point 3 as a reference track line. The first was that the ratio between the upper and lower boundary and the star was constant throughout the test event envelope. This allowed the track line to be defined by a single point (point 3) and two distances (distance to top and distance to bottom boundary). This relationship was independent of video camera orientation or test aircraft pitch attitude. The second assumption was that the wingtip traveled parallel to the track line during the course of the tracking event. With the slope of the reference track line defined and the wingtip coordinates known, the wingtip’s time-to-boundary was found.
The BAT MATLAB® routine assimilated and synchronized both the ScratchClick video-derived data described above and the stick deflection data. Because the sample rates were different, the routine created time histories at the faster rate of the video (30 Hz) and linearly interpolated the stick deflection data when there was not a data point sampled at that time. The photo interpretation required while using ScratchClick introduced a small amount of noise into the data from frame to frame that was amplified when derivatives of the time series were taken to determine the time-to-boundary. Therefore, the BAT routine also applied the “5-point moving average” method developed by engineers at NASA/Dryden to smooth the video data. Once the stick deflection data rates were adjusted and the noise from the ScratchClick data was reduced, the BAT MATLAB® routine produced the outputs found in appendix E.
D-3

HAVE BAT Technical Information Memorandum Edwards Air Force Base June 2006 Air Force Flight Test Center
APPENDIX E – DATA PRODUCTS, CLOSED-LOOP TASKS
Figure E-1: Closed-loop Task Time-to-Boundary Results (20,000 feet, 375 KIAS)
E-1

HAVE BAT Technical Information Memorandum Edwards Air Force Base June 2006 Air Force Flight Test Center
Figure E-2: Closed-loop Task Time-to-Boundary Results (20,000 feet, 250 KIAS)
E-2

HAVE BAT Technical Information Memorandum Edwards Air Force Base June 2006 Air Force Flight Test Center
Figure E-3: Closed-loop Task Time-to-Boundary Results (20,000 feet, 210 KIAS)
E-3

HAVE BAT Technical Information Memorandum Edwards Air Force Base June 2006 Air Force Flight Test Center
Figure E-4: Closed-loop Task Time-to-Boundary Results (10,000 feet, 375 KIAS)
E-4

HAVE BAT Technical Information Memorandum Edwards Air Force Base June 2006 Air Force Flight Test Center
Figure E-5: Closed-loop Task Time-to-Boundary Results (10,000 feet, 250 KIAS)
E-5
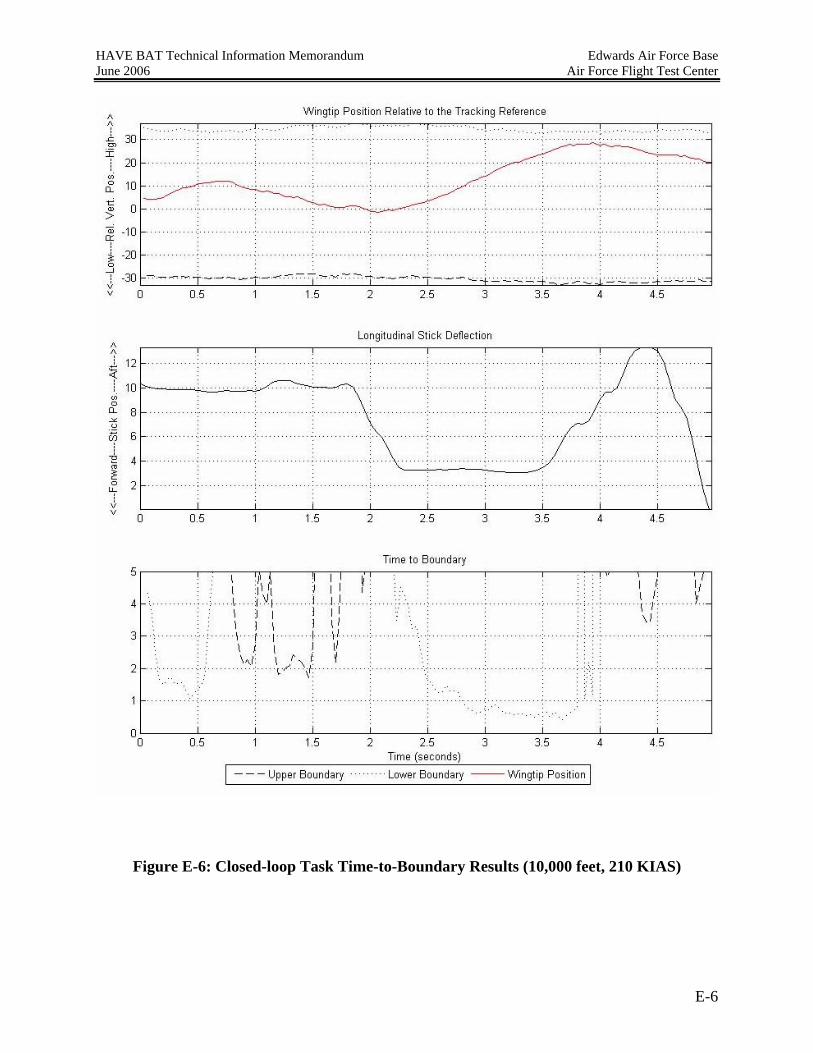
HAVE BAT Technical Information Memorandum Edwards Air Force Base June 2006 Air Force Flight Test Center
Figure E-6: Closed-loop Task Time-to-Boundary Results (10,000 feet, 210 KIAS)
E-6

HAVE BAT Technical Information Memorandum Edwards Air Force Base June 2006 Air Force Flight Test Center
APPENDIX F – MODEL PARAMETER ESTIMATION RESULTS
Figure F-1: Closed-loop Task Output (20,000 feet, 375 KIAS)
F-1

HAVE BAT Technical Information Memorandum Edwards Air Force Base June 2006 Air Force Flight Test Center
Figure F-2: Closed-loop Task Output (20,000 feet, 250 KIAS)
F-2

HAVE BAT Technical Information Memorandum Edwards Air Force Base June 2006 Air Force Flight Test Center
Figure F-3: Closed-loop Task Output (20,000 feet, 210 KIAS)
F-3

HAVE BAT Technical Information Memorandum Edwards Air Force Base June 2006 Air Force Flight Test Center
Figure F-4: Closed-loop Task Output (10,000 feet, 375 KIAS)
F-4

HAVE BAT Technical Information Memorandum Edwards Air Force Base June 2006 Air Force Flight Test Center
Figure F-5: Closed-loop Task Output (10,000 feet, 250 KIAS)
F-5

HAVE BAT Technical Information Memorandum Edwards Air Force Base June 2006 Air Force Flight Test Center
Figure F-6: Closed-loop Task Output (10,000 feet, 210 KIAS)
F-6
HAVE BAT Technical Information Memorandum Edwards Air Force Base June 2006 Air Force Flight Test Center
APPENDIX G – PLOTS OF OPEN/CLOSED LOOP CORRELATIONS
The following plots are the final data products developed from both the open- and closed-loop investigations. All closed-loop boundary avoidance tracking parameters (tmin, tmax, Kbm, and BTP) are presented as functions of the open-loop parameters system time delay and system crossover frequency.
G-1

HAVE BAT Technical Information Memorandum Edwards Air Force Base June 2006 Air Force Flight Test Center
-0.5
0
0.5
1
1.5
2
2.5
3
3.5
4
0 0.05 0.1 0.15 0.2 0.25 0.3 0.35
Time Delay (seconds)
Tim
e-to
-Bou
ndar
y (s
econ
ds)
tmin
tmax
Data Source: Flight Test Aircraft: T-38C / 64-13197 Test Dates: 10 Apr - 4 May 06Test Conditions:10K/20KFT PA - 210 KIAS - PA Config10K/20K FT PA - 250 KIAS - CR Config10K/20K FT PA - 375 KIAS - CR Config
No correlation apparent from collected data.
Figure G-1: Time-to-Boundary Correlation with System Time Delay
0
1
2
3
4
5
6
7
8
9
0 0.05 0.1 0.15 0.2 0.25 0.3 0.35
Time Delay (seconds)
Gai
n
Data Source: Flight Test Aircraft: T-38C / 64-13197 Test Dates: 10 Apr - 4 May 06Test Conditions:10K/20KFT PA - 210 KIAS - PA Config10K/20K FT PA - 250 KIAS - CR Config10K/20K FT PA - 375 KIAS - CR Config
No correlation apparent from collected data.
Figure G-2: Boundary Tracking Feedback Gain Correlation with System Time Delay
G-2

HAVE BAT Technical Information Memorandum Edwards Air Force Base June 2006 Air Force Flight Test Center
BTP = 3.6037τdelay + 0.0184
0.00
0.20
0.40
0.60
0.80
1.00
1.20
1.40
0 0.05 0.1 0.15 0.2 0.25 0.3 0.
Time Delay (seconds)
Bou
ndar
y Tr
acki
ng P
aram
eter
(sec
onds
)
35
Data Source: Flight Test Aircraft: T-38C / 64-13197 Test Dates: 10 Apr - 4 May 06Test Conditions:10K/20KFT PA - 210 KIAS - PA Config10K/20K FT PA - 250 KIAS - CR Config10K/20K FT PA - 375 KIAS - CR Config
bmKttBTP maxmin −=
Figure G-3: Boundary Tracking Parameter (BTP) Correlation with System Time Delay
0
0.5
1
1.5
2
2.5
3
3.5
4
0 0.1 0.2 0.3 0.4 0.5 0.6 0.7 0.8 0.9 1
Crossover Frequency (Hz)
Tim
e-to
-Bou
ndar
y (s
econ
ds) tmin
tmax
Data Source: Flight Test Aircraft: T-38C / 64-13197 Test Dates: 10 Apr - 4 May 06Test Conditions:10K/20KFT PA - 210 KIAS - PA Config10K/20K FT PA - 250 KIAS - CR Config10K/20K FT PA - 375 KIAS - CR Config
No correlation apparent from collected data.
Figure G-4: Time-to-Boundary Correlation with System Crossover Frequency
G-3

HAVE BAT Technical Information Memorandum Edwards Air Force Base June 2006 Air Force Flight Test Center
0
1
2
3
4
5
6
7
8
9
0 0.1 0.2 0.3 0.4 0.5 0.6 0.7 0.8 0.9 1
Crossover Frequency (Hz)
Gai
n
Data Source: Flight Test Aircraft: T-38C / 64-13197 Test Dates: 10 Apr - 4 May 06Test Conditions:10K/20KFT PA - 210 KIAS - PA Config10K/20K FT PA - 250 KIAS - CR Config10K/20K FT PA - 375 KIAS - CR Config
No correlation apparent from collected data.
Figure G-5: Boundary Tracking Feedback Gain Correlation with System Crossover
Frequency
0.00
0.20
0.40
0.60
0.80
1.00
1.20
1.40
0.3 0.4 0.5 0.6 0.7 0.8 0.9
Crossover Frequency (Hz)
Bou
ndar
y Tr
acki
ng P
aram
eter
(BTP
)
1
Data Source: Flight Test Aircraft: T-38C / 64-13197 Test Dates: 10 Apr - 4 May 06Test Conditions:10K/20KFT PA - 210 KIAS - PA Config10K/20K FT PA - 250 KIAS - CR Config10K/20K FT PA - 375 KIAS - CR Config
bmKtt
BTP maxmin −=
No correlation apparent from collected data.
Figure G-6: Boundary Tracking Parameter (BTP) Correlation with System Crossover
Frequency
G-4

HAVE BAT Technical Information Memorandum Edwards Air Force Base June 2006 Air Force Flight Test Center
APPENDIX H – LESSONS LEARNED
One area of interest observed during the analysis of figure 11 was that the value of tmax seemingly varied as a function of load factor. For load factors greater than zero, tmax was seen as significantly smaller than for load factors less than zero. This relationship was not evaluated during this project but warrants further investigation in future boundary avoidance projects.
The airframe mounted camera must be high resolution or hi-definition.
The automated tracking system developed for HAVE BAT was never employed because the resolution of the airframe mounted camera was insufficient. The low resolution led to inconsistent tracking of the video markings on the target aircraft as well as the total inability to track the slender T-38 wingtip. Review of hi-definition video and photographs taken by Edwards flight photographers during HAVE BAT’s final mission showed that similar hi-definition camera systems would provide adequate resolution for the automated tracking system.
T-2 modification process
The initial impression from the T-2 modification shop for the addition of the airframe-mounted camera (AMC) was that the addition of a camera mount and integration into the aircraft’s existing recorder and power supply was that it was going to be an extraordinarily simple modification. The original estimate of two days was off by nearly 12 days due to delays within the modification shop (due to manning issues) and complications integrating into the aircraft power supply. This two week slip prevented some planned ground testing of the AMC. Additionally, USAF TPS personnel were required for the electromagnetic interference and compatibility (EMIC) testing of the new camera. The modification shop does not supply aircrew when EMIC is required and TPS had to supply qualified aircrew to conduct the testing. The biggest lesson learned was to use the expertise within TPS to first explain any delays in any modification and then to have a plan to use the school’s expertise if necessary to complete the modification.
Helmet camera setup was not ideal for task.
The first issue with the helmet camera was one of documentation. The safety paperwork seemed to indicate that the system existed and was approved for use, but it had fallen to the wayside at the test center, and nobody knew exactly where it was or if it was approved for use. Thanks to some outstanding work from the AFFTC technical library, the remainder of the supporting documentation for the helmet camera system was located and the camera was approved for use. Next the system had to be found and its operation deciphered. The system was located a few days before the start of flight testing in storage at 412TW/ENFH (Human Factors) and was borrowed by the test team. There was not any documentation on the operation of the system, or any corporate knowledge on its operation and it fell upon the test team to figure out how to run the system. The system included a battery powered Hi-8 recorder, and a battery powered video encoder contained in a modified survival vest. The vest was described as bulky and cumbersome by the pilots. The color camera was housed in a mount that attached to the helmet with a hook and loop fastener. Errors in camera setup prevented two of the test missions
H-1
HAVE BAT Technical Information Memorandum Edwards Air Force Base June 2006 Air Force Flight Test Center
from being recorded. Once the camera operation was figured out by trial and error, some deficiencies in its design were discovered. The biggest deficiency was there was no way to verify the aimpoint of the camera with the system as built until the tape was replayed. There wasn’t a display on the recorder, and a hand held recorder had to be plugged into the system by a FTE/FTN to verify its aimpoint while on the ground. If the pilot inadvertently moved the camera mount on the side of the helmet, there would be no way to readjust the aimpoint in-flight. The other issue was the aimpoint itself. It was relatively easy to get the azimuth of the camera correct, but the test team had repeated difficulty getting the elevation of the camera correct. This was due to namely to a lack of an accurate formation position on the ground, but was also aggravated by day to day differences in how the helmet was worn by each pilot. Without a reliable spot to aim the camera to, the aimpoint was either too low or too high. If a good aimpoint was found on one flight, putting the camera in the same location on the helmet was not a guarantee of a good aimpoint during a later flight due to differences in how the pilot wore his helmet from flight to flight. The camera aiming issues could have been alleviated by changing the recorder to one with a display that could be safely opened on the ground and in flight to verify the aim of the camera, and the pilot could adjust it as required. A more permanent mount once a good aimpoint was found would be desirable as well. Another draw back of the system was there was not a way to add an aircraft time stamp to the recording without an additional T-2 modification. The actual camera seemed to be of sufficient resolution for the task, but the inability to accurately aim the camera precluded it’s usefulness as a data collection tool.
Develop a method for determination of tmin from flight test data.
Ideally, locating the boundary avoidance parameters from flight test data should not rely on a model that attempts to predict those very parameters. The use of Mr. Gray’s model to determine the boundary avoidance tracking parameters from flight test data was not the desired solution. It was required, however, to obtain some initial data from HAVE BAT mission flights to present in the time allowed.
Use of verbal annotation by the test pilot during maneuvering was unreliable and imprecise because the delay between pilot perception to action and finally the verbalization the thought process was significant compared to the dynamic stick actuations. The use of a triggering device actuated by the pilot during flights could help more easily identify when the pilot actually switches from point to boundary avoidance tracking.
Investigate the load factor dependence on tmin and tmax.
Figure 8 shows an initial analysis of a boundary avoidance tracking event (20,000 feet PA, 250 KIAS, cruise configuration). Of interest is the difference seen in tmax for points A and B. Point A shows an event where maximum aft stick was obtained in an attempt to avoid the approaching upper boundary as the test aircraft sinks below the target aircraft. This tmax appears to be approximately 0.5 seconds. Point B shows an event where maximum forward stick was reached in attempt to avoid the approaching lower boundary as the test aircraft rises above the target aircraft. This tmax value appears to be approximately 1.8 seconds.
Since aft stick provides for load factors greater than one and forward stick provides for load factors less than one, it initially appears that there is some load factor dependence on the
H-2

HAVE BAT Technical Information Memorandum Edwards Air Force Base June 2006 Air Force Flight Test Center
time-to-boundary parameters. Whether this is a result of the pilot self-limiting his inputs based on aircraft limits (an unstated, unanalyzed boundary during this project) or an innate sense ingrained in the pilot is unknown, but the initial review of the data shows potentially some sort of relationship between time-to-boundary and load factor. This relationship should be investigated further as it could have an effect on the development of boundary avoidance tracking flight test techniques.
H-3

HAVE BAT Technical Information Memorandum Edwards Air Force Base June 2006 Air Force Flight Test Center
APPENDIX I - LIST OF ABBREVIATIONS, ACRONYMS, AND SYMBOLS
AFB : Air Force Base AFI : Air Force Instruction AFIT : Air Force Institute of Technology AFRL Air Force Research Laboratory APU : Auxiliary Power Unit BTP Boundary Tracking Parameter CA : California COMSEC : Communications Security DAS : Data Acquisition System Db : Distance to boundary DoD : Department of Defense DSN : Defense Switching Network DTC : Data Transfer Card FAA : Federal Aviation Administration FCC : Federal Communications Commission FLTS : Flight Test Squadron HUD : Head Up Display IAW : In Accordance With Kbm : Boundary avoidance tracking feedback gain MOP : Measure Of Performance N/A : Non Applicable OPSEC : Operation Security PAR : Program Assessment Review PCMCIA : Personal Computer Memory Card International Association PFPS : PreFlight Planning System rb : Rate to boundary RTO : Responsible Test Organization SRB : Safety Review Board TAP : Test Assessment Panel TDY : Temporary Duty tmax : Time to boundary for maximum pilot feedback (seconds) tmin : Time to boundary for minimal pilot feedback (seconds) TMP : Test Management Project tb : time-to-boundary TPS : Test Pilot School USAF : United States Air Force VMC : Visual Meteorological Conditions ω180 : System crossover frequency (Hertz)
I-1

HAVE BAT Technical Information Memorandum Edwards Air Force Base June 2006 Air Force Flight Test Center
DISTRIBUTION LIST OFFICE Paper/PDF NUMBER OF
COPIES AFFTC/HO 305 E Popson Ave, Bldg 1405 Edwards AFB, CA 93524-6595
PDF 1
412 TW/ENTL (AFFTC Technical Library) 307 E Popson Blvd, Bldg 1400, Room 110 Paper
PDF 1 1 Edwards AFB, CA 93524-6630
USAF TPS/EDT Attn: Mr. Gary Aldrich 220 S. Wolfe Blvd Edwards AFB, CA 93524-6485
Paper PDF
1 1
USAF TPS/EDC Attn: Ms. Dottie Meyer 220 S. Wolfe Blvd Edwards AFB, CA 93524-6485
Paper PDF
1 1
Defense Technical Information Center DTIC/OMI 8725 John J. Kingman Road, Suite 0944 Ft. Belvoir VA 22060-6218
PDF 1
AFIT/ENY Attn: Maj Paul Blue, Dr Brad Liebst, and Dr. Donald Kunz 2950 Hobson Way
, OH 45433-7765 Wright-Patterson AFB
Paper PDF
3 3
HQ AFMC/HO 4375 Chidlaw Road, Suite S231
6 PDF 1
Wright-Patterson AFB, OH 45433-500412 TW/EN 30 N Wolfe Ave, Bldg 1609 Paper 3
Edwards AFB, CA 93524-6843 PDF 1
USAF TPS/EDF Attn: Mr. William Gray, III
24-6485
Paper 1 220 S. Wolfe Blvd. Edwards AFB, CA 935
PDF 1
Capt Randy Warren Class 05B 220 S. Wolfe Blvd
524-6485
PDF 1
Edwards AFB, CA 93Maj Brian Abell Class 05B 220 S. Wolfe Blvd
524-6485 PDF 1 Edwards AFB, CA 93

HAVE BAT Technical Information Memorandum Edwards Air Force Base June 2006 Air Force Flight Test Center
Capt Kyle Kolsti
3523 PDF 1 6718 Doolittle Dr
Edwards AFB, CA 9Capt Scott Heritsch 6833 Spaatz Drive PDF 1 Edwards, CA 93523 Capt Brandon Miller 6850 Lindbergh Ave PDF 1 Edwards, CA 93523 Capt Jason Dotter Class 06A 220 S. Wolfe Blvd
524-6485
PDF 1
Edwards AFB, CA 93
Total Copies PDF
Paper
17
10