a life scientists guide to physical chemistry
DESCRIPTION
Chemistry simplifiedTRANSCRIPT


P1: SFK Trim: 247mm × 174mm Top: 14.586mm Gutter: 23.198mm
CUUK1808-FM CUUK1808/Roussel 978 1 107 00678 2 October 31, 2011 7:53
A LIFE SCIENTIST’S GUIDE TO PHYSICAL CHEMISTRY
Motivating students to engage with physical chemistry through biological examples, thistextbook demonstrates how the tools of physical chemistry can be used to illuminatebiological questions. It clearly explains key principles and their relevance to life sciencestudents, using only the most straightforward and relevant mathematical tools.
More than 350 exercises are spread throughout the chapters, covering a wide range ofbiological applications and explaining issues that students often find challenging. These,along with problems at the end of each chapter and end-of-term review questions, encour-age active and continuous study. Over 130 worked examples, many deriving directly fromlife sciences, help students connect principles and theories to their own laboratory stud-ies. Connections between experimental measurements and key theoretical quantities arefrequently highlighted and reinforced.
Answers to the exercises are included in the book. Fully worked solutions andanswers to the review problems, password-protected for instructors, are available atwww.cambridge.org/roussel.
marc r. roussel is Professor of Chemistry and Biochemistry at the University ofLethbridge, Canada. His research on the dynamics of biological systems lies at the interfaceof chemistry, biology and mathematics. He has been teaching physical chemistry for thepast 15 years.

P1: SFK Trim: 247mm × 174mm Top: 14.586mm Gutter: 23.198mm
CUUK1808-FM CUUK1808/Roussel 978 1 107 00678 2 October 31, 2011 7:53

P1: SFK Trim: 247mm × 174mm Top: 14.586mm Gutter: 23.198mm
CUUK1808-FM CUUK1808/Roussel 978 1 107 00678 2 October 31, 2011 7:53
A LIFE SCIENTIST’S GUIDE TOPHYSICAL CHEMISTRY
MARC R. ROUSSELDepartment of Chemistry and Biochemistry
University of LethbridgeCanada
P1: SFK Trim: 247mm × 174mm Top: 14.586mm Gutter: 23.198mm
CUUK1808-FM CUUK1808/Roussel 978 1 107 00678 2 October 31, 2011 7:53
cambridge university pressCambridge, New York, Melbourne, Madrid, Cape Town,
Singapore, Sao Paulo, Delhi, Tokyo, Mexico City
Cambridge University PressThe Edinburgh Building, Cambridge CB2 8RU, UK
Published in the United States of America by Cambridge University Press, New York
www.cambridge.orgInformation on this title: www.cambridge.org/9781107006782
C© M. R. Roussel 2012
This publication is in copyright. Subject to statutory exceptionand to the provisions of relevant collective licensing agreements,no reproduction of any part may take place without the written
permission of Cambridge University Press.
First published 2012
Printed in the United Kingdom at the University Press, Cambridge
A catalog record for this publication is available from the British Library
Library of Congress Cataloging in Publication data
ISBN 978-1-107-00678-2 HardbackISBN 978-0-521-18696-4 Paperback
Additional resources for this publication at www.cambridge.org/9781107006782
Cambridge University Press has no responsibility for the persistence oraccuracy of URLs for external or third-party internet websites referred to
in this publication, and does not guarantee that any content on suchwebsites is, or will remain, accurate or appropriate.

P1: SFK Trim: 247mm × 174mm Top: 14.586mm Gutter: 23.198mm
CUUK1808-FM CUUK1808/Roussel 978 1 107 00678 2 October 31, 2011 7:53
Dedicated to all the studentswho have studied and will study
physical chemistryin my classes at
the University of Lethbridge

P1: SFK Trim: 247mm × 174mm Top: 14.586mm Gutter: 23.198mm
CUUK1808-FM CUUK1808/Roussel 978 1 107 00678 2 October 31, 2011 7:53

P1: SFK Trim: 247mm × 174mm Top: 14.586mm Gutter: 23.198mm
CUUK1808-FM CUUK1808/Roussel 978 1 107 00678 2 October 31, 2011 7:53
Contents
Preface page xi
1 Orientation: What is physical chemistry about? 1A note on graph axis labels and table headings 3
Part One Quantum mechanics and spectroscopy 5
2 A quick tour of quantum mechanical ideas 72.1 Light 72.2 Wave properties of matter 132.3 Probability waves 152.4 Quantization of energy 162.5 A first look at spectroscopy 19
Key ideas and equations 21
3 Spectroscopy 233.1 Molecular energy 233.2 The Boltzmann distribution 253.3 Classes of spectroscopy experiments 313.4 Absorption spectroscopy 323.5 Fluorescence 46
Key ideas and equations 52
Part Two Thermodynamics 55
4 Thermodynamics preliminaries 574.1 The domain of classical thermodynamics 574.2 Temperature, heat and thermometers 584.3 Sign convention 594.4 Molar, specific and “total” quantities 60
Key ideas and equations 61
5 The First Law of Thermodynamics 625.1 Differentials 62
vii
P1: SFK Trim: 247mm × 174mm Top: 14.586mm Gutter: 23.198mm
CUUK1808-FM CUUK1808/Roussel 978 1 107 00678 2 October 31, 2011 7:53
viii Contents
5.2 Pressure–volume work 645.3 The First Law of Thermodynamics 685.4 Calculus of differentials 695.5 Heat and enthalpy 705.6 Heat capacity 715.7 Phase transitions 785.8 Standard states and enthalpies of formation 825.9 More on the relationship between internal energy and enthalpy 905.10 The dependence of energy and enthalpy changes on temperature 965.11 Measuring the energy requirements of living organisms 98
Key ideas and equations 105
6 The Second Law of Thermodynamics 1096.1 The Second Law of Thermodynamics 1096.2 Intensive and extensive properties 1106.3 Reversible processes and entropy 1116.4 The Second Law of Thermodynamics and entropy 1136.5 A microscopic picture of entropy 1186.6 Entropy and evolution 1266.7 The Third Law of Thermodynamics 1286.8 Heat engines and the Carnot cycle 1326.9 Refrigerators 1366.10 Thermodynamics: the cynic’s view 138
Key ideas and equations 139
7 Free Energy 1417.1 The Clausius inequality 1417.2 Free energy functions 1427.3 Free energy as maximum work 1447.4 Standard states and tabulated values of the state functions 1457.5 Activity: expressing the dependence of Gibbs free energy on
concentration 1487.6 Adjusting �G to different temperatures 152
Key ideas and equations 154
8 Chemical equilibrium and coupled reactions 1578.1 What does �rGm mean? 1578.2 Free energy and equilibrium 1598.3 Catalysts and equilibrium 1648.4 Coupled reactions 1658.5 Active transport 1698.6 Temperature and equilibrium 173
Key ideas and equations 180

P1: SFK Trim: 247mm × 174mm Top: 14.586mm Gutter: 23.198mm
CUUK1808-FM CUUK1808/Roussel 978 1 107 00678 2 October 31, 2011 7:53
Contents ix
9 Non-ideal behavior 1859.1 Activity coefficients 1869.2 Electrolyte solutions 1899.3 The solubility of ionic compounds in aqueous solution 1969.4 Beyond the limiting law 198
Key ideas and equations 199
10 Electrochemistry 20210.1 Free energy and electromotive force 20210.2 Reduction and oxidation 20410.3 Voltaic cells 20610.4 Standard reduction potentials 20810.5 Other types of cells 212
Key ideas and equations 218
Part Three Kinetics 221
11 Basics of chemical kinetics 22311.1 The business of kinetics 22311.2 Subtleties of the rate concept 22411.3 Kinetics experiments 22511.4 Elementary and complex reactions 22611.5 The law of mass action 22811.6 Microscopic reversibility and chemical equilibrium 230
Key ideas and equations 232
12 Initial rate experiments and simple empirical rate laws 23412.1 Initial rate studies 23412.2 Simple empirical rate laws 23512.3 The van’t Hoff method 239
Key ideas and equations 243
13 Integrated Rate Laws 24413.1 First-order reactions 24413.2 Reactions of other orders 25513.3 Two-reactant reactions 26213.4 Reversible elementary reactions 26413.5 Fluorescence kinetics 267
Key ideas and equations 270
14 Complex reactions 27414.1 Two-step mechanisms 27414.2 Chain reactions 27814.3 Deriving rate laws of complex mechanisms 28014.4 Equilibria in complex reactions 283
Key ideas and equations 285

P1: SFK Trim: 247mm × 174mm Top: 14.586mm Gutter: 23.198mm
CUUK1808-FM CUUK1808/Roussel 978 1 107 00678 2 October 31, 2011 7:53
x Contents
15 Enzyme kinetics 28715.1 Properties of enzymes 28715.2 The Michaelis–Menten mechanism 28815.3 Enzyme inhibition 29815.4 Deriving rate laws for enzyme mechanisms 310
Key ideas and equations 310
16 Techniques for studying fast reactions 31416.1 Flow methods 31416.2 Flash photolysis 31716.3 Relaxation methods 320
Key ideas and equations 329
17 Factors that affect the rate constant 33017.1 A simple picture of elementary reactions 33017.2 The Arrhenius equation 33417.3 Transition-state theory 33917.4 Ionic strength 351
Key ideas and equations 355
18 Diffusion and reactions in solution 35918.1 Diffusion 35918.2 A peculiar theory for diffusion coefficients in solution 36218.3 Bimolecular reactions in solution 364
Key ideas and equations 374
Appendix A Standard thermodynamic properties at 298.15 K and 1 bar 375A.1 Enthalpy, free energy and heat capacity data 375A.2 Standard entropies 378Appendix B Standard reduction potentials at 298.15 K 379Appendix C Physical properties of water 380Appendix D The SI system of units 381D.1 Calculations in SI units 382Appendix E Universal constants and conversion factors 384Appendix F Periodic table of the elements, with molar masses 386Appendix G Selected isotopic masses and abundances 387Appendix H Properties of exponentials and logarithmic functions 388Appendix I Review of integral calculus 389I.1 Table of integrals 391Appendix J End-of-term review problems 392Appendix K Answers to exercises 408Index 436

P1: SFK Trim: 247mm × 174mm Top: 14.586mm Gutter: 23.198mm
CUUK1808-FM CUUK1808/Roussel 978 1 107 00678 2 October 31, 2011 7:53
Preface
To the student
I wrote this book for you.When I came to the University of Lethbridge in 1995, I started teaching physical
chemistry to a mixed class of chemistry and biochemistry students. I have been teachingversions of this course ever since. My first year here, I picked a book that I liked. Boy, wasthat a mistake! First of all, the book contained almost no examples that appealed to thebiochemists, who were the majority of the students in the class. Second, it was filled withmathematical derivations, which I found very satisfying, but which sometimes obscuredthe concepts of physical chemistry for the students.
Having made this mistake, I started looking around for other textbooks. The ones that Iliked the best, Barrow’s Physical Chemistry for the Life Sciences and Morris’s A Biologist’sPhysical Chemistry, were out of print at the time. We used a few different textbooks overthe years, and some of them were very good books, but my students were never completelyhappy, and so I wasn’t happy. In some cases, the books contained too much math andnot enough insight. In others, too many equations were presented without derivation orexplanation, which undermined the students’ understanding of the material. I therefore setabout writing a book for my students, and therefore for the broader community of lifescience students who need a term of physical chemistry. Given my experience with othertextbooks, I had a few criteria in mind:
� I wanted it to be a book that students could read and understand, and not just one theywould open up when the professor told them to solve problems 1, 2 and 4 from Chapter 8.As a corollary to that, and adapting a phrase from Canadian history, I thought thatwe should use calculus if necessary, but not necessarily calculus. A lot of the theoryof thermodynamics, in particular, is very elegantly phrased in terms of multi-variablecalculus, but unless you have a couple of years of university-level calculus behind you,it’s sometimes hard to appreciate what this beautiful theory is telling you. We do needsome calculus in physical chemistry, but in a first course, we don’t need nearly as muchas you find in many physical chemistry books.
xi

P1: SFK Trim: 247mm × 174mm Top: 14.586mm Gutter: 23.198mm
CUUK1808-FM CUUK1808/Roussel 978 1 107 00678 2 October 31, 2011 7:53
xii Preface
� I wanted to derive as many of the equations as possible, because I do think there is valuein knowing where an equation comes from, even if you can’t necessarily reproduce everystep of the derivation yourself.
� I wanted the book to be relevant to life science students since I had so many of themin my class. Now I’m one of those people who think that scientists should be broadlyinterested in science, so you will find lots of examples and problems in the book thathave nothing to do with the life sciences. Some of them, particularly those that comefrom other areas of the chemical sciences, were chosen because they provide simpleillustrations of key concepts. Ultimately, it’s all about learning the concepts so that youcan apply them to your studies of living systems, and when it’s easier to learn a conceptusing an uncomplicated example from, say, organic chemistry, then that’s what you’regoing to get. Others were chosen because I think they’re cool, and judging from theclassroom discussions we’ve had over the years, so do my students. But you will alsofind many, many examples and problems directly inspired by the life sciences.
� I sometimes tell my students that an education in science involves learning a progressivelymore sophisticated set of lies, until finally the lies are so good that you can’t tell themapart from reality. In lower-level courses, we tell students a lot of lies. I usually try totell my students when I’m lying to them, and I’ve tried to do the same in this book, onthe basis that it’s important to know how far you can trust a certain equation or theory.
� Physical chemistry is an experimental science, so I wanted that to be reflected in thebook. I try whenever possible to talk about experimental methods. I use as much realdata as possible in the examples and problems. I also spend a lot more time and spacethan is customary discussing the analysis of data, particularly in the kinetics chapters.The ability to critically look at data is, I hope, something you will be able to use beyondthis course.
� I think that students should have lots of opportunities to test their knowledge. I also thinkthat these opportunities have to be at least a little structured. I’ve done a couple of thingsto help you with this:(1) The exercises are not concentrated at the ends of the chapters. Rather, I have exercises
spread throughout the book, in short exercise groups, as well as some end-of-chapterproblems. I’ll come back to that in a minute.
(2) I give answers to every single problem at the back of the book. You shouldn’t needto wonder if you solved the problem correctly or not.
Drafts of this book have been used here at the University of Lethbridge for some years,so it’s been thoroughly field-tested on students just like you. Hopefully, you will find, asthey have, that while physical chemistry is a difficult subject, it is one you can master witha little effort. You may even discover that you enjoy it.
Studying physical chemistry
Most of the students who get in trouble in physical chemistry just don’t keep up with thematerial. It’s not a subject where cramming is an effective study strategy, so you really need

P1: SFK Trim: 247mm × 174mm Top: 14.586mm Gutter: 23.198mm
CUUK1808-FM CUUK1808/Roussel 978 1 107 00678 2 October 31, 2011 7:53
Preface xiii
to set some time aside every week to read the book and to solve some problems. Reading aphysical chemistry book is something you do with a pad of paper, a pencil and a calculator,because you usually need to work out some of the steps in the derivations or in the examplesin order to make sure you understand them properly. Beyond that, I have placed exercisegroups after most sections. The idea is that you can verify your learning right away with ahandful of questions that require the material in the section you have just read. You shouldbe doing those problems as you go, i.e. you should sit down to solve some problems at leastonce a week, and maybe more often if you can manage it. Is this a lot of work? You bet!But it will make it easier for you to study for the tests, and it should improve your grade.And, let’s face it, it’s a lot more fun to be successful in a course than not.
When test time comes around, have a look at the ends of the chapters. I’ve put aselection of problems there, too, so that you can test your understanding of a larger slice ofthe material.
Finally, at the end of term, when you’re preparing for the final exam, I’ve created a longset of questions to help you review all the material in the book. You may not cover everypage of the book in your course, so you may see some problems there that aren’t relevantto you. Hopefully by this point you’ll be able to recognize these, or your instructor mayhelp you pick through this selection of problems.
You should, I hope, have all the resources at hand that you need to study physicalchemistry. Good luck!
To the instructor
This book was designed for a single-term course in physical chemistry for life sciencestudents (although I use it in a mixed class of biochemists and chemists). I assume thatstudents have acquired the standard background of first-year science courses: two termsof general chemistry, one term of calculus and one term of physics. Particularly when itcomes to mathematics, I try to help the students along when we draw on this background,but you may need to fill in some of the blanks if your students come to this course withoutsome of these prerequisites.
Because this is a book intended to be used in a single-term course, some choices hadto be made in terms of the topics covered. Quite apart from the time constraints, I alsowanted to keep the production costs down, which implies some restraint in terms of topiccoverage. This book focuses particularly on thermodynamics and kinetics, because theseare the areas of most direct relevance to life science students. I have included a little bit ofquantum mechanics and spectroscopy to support the other two topics, although the bookwas written so that you can bypass this material. I would, however, suggest that you includeSection 3.2 on the Boltzmann distribution if you can. This was a late addition to the book,but after I wrote it, I found that I could explain many topics in the rest of the book muchmore straightforwardly.
Despite my overall attempt to limit the size of the book, I have tried to maintain someflexibility in the sequences you can take through the book. Accordingly, there is a bit more

P1: SFK Trim: 247mm × 174mm Top: 14.586mm Gutter: 23.198mm
CUUK1808-FM CUUK1808/Roussel 978 1 107 00678 2 October 31, 2011 7:53
xiv Preface
material in this book than you could cover in one term. In my own class, we cover almostall of Parts Two and Three (thermodynamics and kinetics) in a standard three-credit hour(3 hours per week times 13 weeks) course.
A little while ago, I decided to change all the notations in this book to those recommendedin the IUPAC Green Book (Quantities, Units and Symbols in Physical Chemistry). I cameto this decision after a long period of using a combination of notations commonly usedin other textbooks and a few I had invented myself. There are certainly advantages tousing one’s own notations, but eventually I decided that the proliferation of non-standardnotations by textbook authors was doing more harm than good. I think we’ve all had theexperience of reading books or scientific papers where we had to keep flipping back andforth to figure out what x or y represented. While some of the IUPAC notations are, in myopinion, not particularly elegant, they have the advantage of being standard for the field.
Contacting me
If you have comments or suggestions about this book, feel free to contact me by email:[email protected]. I would be happy to hear from both students and instructors. I would beparticularly interested to hear from instructors what sections you included or excluded inyour course, and whether there is any material that you really think I should add in a futureedition, should I ever be asked to write one.
Acknowledgments
I would like to thank all of the Chemistry 2710, 2720 and 2740 students who have helpedme work through the various versions of this book. Your questions and comments have hada great influence both on this text and on my own thinking about some of the problemsraised during the study of physical chemistry.
I also must thank my wife Catharine and son Liam for allowing me the time to completethis project. Your support and understanding mean everything to me, always.

P1: SFK Trim: 247mm × 174mm Top: 14.586mm Gutter: 23.198mm
CUUK1808-01 CUUK1808/Roussel 978 1 107 00678 2 October 29, 2011 12:33
1
Orientation: What is physical chemistry about?
Chemistry is traditionally divided into a small number of subfields, namely organic, inor-ganic, analytical and physical chemistry. It’s fairly easy to say what the first three are about,but it’s much harder to define physical chemistry. The problem is that physical chemistryis all of the following simultaneously:
� A discipline in its own right, with its own set of problems and techniques;� The source of the basic theory that underlies all of the chemical sciences;� A provider of experimental methods used across the chemical sciences.
Note that “chemical sciences” includes biochemistry and materials science, among otherfields that depend on physical chemistry for at least some of their theory and methods.Physical chemistry’s large mandate means that it’s difficult to put a finger on what it isexactly. It’s a bit like chemistry itself that way: every time you come up with a definition,you immediately think of half a dozen things done under that heading that don’t fit.
Rather than trying to give a simple, neat definition of physical chemistry, I’m going totell you about the big theories that make up physical chemistry. Hopefully, this will giveyou an idea of what physical chemistry is about, even if we can’t wrap it up in a neatpackage as we can with the other subfields of chemistry.
Most physical chemists would tell you that physical chemistry has three major subdivi-sions: quantum mechanics, thermodynamics and kinetics (Figure 1.1). Quantum mechan-ics is the study of the properties of matter at the atomic level. In quantum mechanics, wetalk about the forces that hold atoms and molecules together, and about the interaction ofmatter with light (spectroscopy), among other things. Thermodynamics is the study ofmatter from the other extreme: in thermodynamics, we don’t worry about the microscopicdetails, we just deal with matter as we normally perceive it in terms of variables like tem-perature, pressure and volume. Chemical thermodynamics concerns itself mainly with theenergetics of reactions, which sometimes allows us to say something about which reactionsare possible under given conditions. Finally, kinetics is the study of the rate of reactions. Itturns out that thermodynamics doesn’t tell us anything about how fast a reaction will occur,so we need a separate set of theories to treat this important issue.
Figure 1.1 also shows some of the connections between the three major theoretical pillarsof physical chemistry. Statistical thermodynamics allows us to calculate thermodynamic
1

P1: SFK Trim: 247mm × 174mm Top: 14.586mm Gutter: 23.198mm
CUUK1808-01 CUUK1808/Roussel 978 1 107 00678 2 October 29, 2011 12:33
2 Orientation: What is physical chemistry about?
EquilibriumDynamic
TheoryTransition-State
KineticsThermodynamics
QuantumMechanics
Stat
istic
al T
herm
odyn
amic
s
Reaction D
ynamics
Thermodynamics
Non-equilibrium
Figure 1.1 The major theories of physical chemistry and their relationships. Note that the figure onlyshows some of the connections between quantum mechanics, thermodynamics and kinetics.
properties from the quantum properties of matter. Reaction dynamics similarly lets uscalculate rates of reaction from quantum mechanical principles. The classical theory ofdynamic equilibrium connects kinetics to equilibrium and thus to a whole body of knowl-edge in thermodynamics. Transition-state theory is a theory of rates of reaction that restson a foundation of thermodynamic reasoning. Non-equilibrium thermodynamics allowsus to understand both the energetics and kinetics of reactions in a unified framework. Theseare just a few of the connections we could put into this diagram.
You will note the emphasis on theories. This is perhaps one of the defining characteristicsof physical chemistry: Physical chemists like to have a big theoretical umbrella that coversknowledge in the discipline. This is not to say that physical chemists aren’t concernedwith experiments. Most physical chemists are, in fact, experimentalists. In my experiencethough, almost all physical chemists ultimately want to connect their measurements tosome deeper principles. This is certainly a common attitude among scientists, but perhapsa more intensely felt one among physical chemists than might be the case in other areas ofchemistry.
Given the complexity implied by Figure 1.1, how can we proceed to learn physicalchemistry? Fortunately, the major theories are coherent entities that can be studied one ata time. Because of the connections between the theories, a knowledge of one will enhanceour appreciation of the others, but we can still study kinetics, for example, as a thing initself. In this book, we will study all three of the major theories, as well as some of thebridges between them. The intention is to provide you with a core of chemical theory thatcan be applied to a wide variety of problems in the chemical sciences.

P1: SFK Trim: 247mm × 174mm Top: 14.586mm Gutter: 23.198mm
CUUK1808-01 CUUK1808/Roussel 978 1 107 00678 2 October 29, 2011 12:33
Orientation: What is physical chemistry about? 3
A note on graph axis labels and table headings
We can only graph pure numbers. We could put numbers with units in a table, but to avoidrepeating the units, we typically just put them in the table heading, leaving just numbers inthe table itself. Throughout this text, you will see graph axis labels and table headings thatlook like “λ/nm.” The logic behind this notation is as follows: λ is a physical observablethat has both a value and units. The pure number in the table or graph is what you get bydividing out the units of λ, in this case nm.
This way of labeling axes and tables may not seem like a huge improvement over justwriting “λ (nm).” The advantage appears when you have numbers that all share a commonmultiple of a power of 10 that you want to avoid writing down over and over again. Forexample, molar absorption coefficients are often a multiple of 105 L mol−1cm−1. If I’mtyping a table of these coefficients, I might not want to repeat ‘×105’ for every entry. Iwould then label the table heading as “ε/105 L mol−1cm−1,” meaning that the number inthe table is what you get when you divide ε by 105 L mol−1cm−1. For example, if one ofthe numbers in the table is 1.02, then that means that ε/105 L mol−1cm−1 = 1.02, or thatε = 1.02 × 10⁵ L mol−1cm−1. Once you get used to this way of writing table headings, youwill find that it’s much clearer than any of the alternatives you routinely run across.

P1: SFK Trim: 247mm × 174mm Top: 14.586mm Gutter: 23.198mm
CUUK1808-01 CUUK1808/Roussel 978 1 107 00678 2 October 31, 2011 14:59

P1: SFK Trim: 247mm × 174mm Top: 14.586mm Gutter: 23.198mm
CUUK1808-02 CUUK1808/Roussel 978 1 107 00678 2 October 29, 2011 12:38
Part One
Quantum mechanics and spectroscopy

P1: SFK Trim: 247mm × 174mm Top: 14.586mm Gutter: 23.198mm
CUUK1808-02 CUUK1808/Roussel 978 1 107 00678 2 October 29, 2011 12:38

P1: SFK Trim: 247mm × 174mm Top: 14.586mm Gutter: 23.198mm
CUUK1808-02 CUUK1808/Roussel 978 1 107 00678 2 October 29, 2011 12:38
2
A quick tour of quantum mechanical ideas
The objective of this chapter is to go over a few of the basic concepts of quantum mechanicsin preparation for a discussion of spectroscopy, which is in many ways the business endof quantum mechanics, at least for chemical scientists. We will also need a few quantummechanical ideas from time to time in our study of thermodynamics and of kinetics.
Why should we learn quantum mechanics at all? Atoms and molecules are small, andtheir constituent parts, electrons, protons and neutrons, are even smaller. Early in thetwentieth century, we learned that small things don’t obey the laws of classical mechanics.A different kind of mechanics, quantum mechanics, is required to understand chemistryon a fundamental level. In fact, we need different mechanical theories to treat extremesof both size and speed. Figure 2.1 summarizes the situation. There isn’t a sharp cut-offbetween the various sectors of this diagram. Also note that some of the theories are moregeneral than others. We could in principle use quantum mechanics or general relativity topredict the trajectories of tennis balls, but it just isn’t worth the effort, given that classicalmechanics works perfectly well in this range of masses and speeds. On the other hand,classical mechanics doesn’t give very good results for things that are either extremelylarge, or small, or fast.
Like it or not, to discuss phenomena on an atomic scale, we need quantum mechanics.Ordinary (non-relativistic) quantum mechanics is generally adequate, although electronvelocities in heavy atoms sometimes reach relativistic speeds (approaching the speed oflight, c), requiring relativistic quantum mechanics. We can get away with using classicalmechanics to treat large-scale motions of molecules (e.g. motions of domains of proteins).However, many molecular phenomena will remain mysterious to us if we don’t arm our-selves with at least a little bit of quantum mechanical theory.
2.1 Light
From the seventeenth to the nineteenth century, there were two competing theories onthe nature of light. Some evidence (diffraction, refraction, etc.) suggested that light was awave phenomenon. On the other hand, a particle theory was attractive to many workersdue to the linear propagation of light rays. Although the wave theory of light was more
7

P1: SFK Trim: 247mm × 174mm Top: 14.586mm Gutter: 23.198mm
CUUK1808-02 CUUK1808/Roussel 978 1 107 00678 2 October 29, 2011 12:38
8 A quick tour of quantum mechanical ideas
QuantumMechanics
Relativistic
MechanicsQuantum
ClassicalMechanics
SpecialRelativity
0 cSpeed
Mas
s
General Relativity
Figure 2.1 Sketch of the domains of validity of different mechanical theories (not to scale). The speedof light (c) sets an upper limit on the speeds that can be reached by material objects. Relativistictheories are required for objects whose speeds are close to the speed of light. Classical mechanics isappropriate to objects of moderate size moving at reasonable speeds. Quantum mechanics is requiredto treat phenomena on an atomic scale.
broadly successful in this period, there was no clear resolution of the matter until the1860s.
James Clerk Maxwell’s contributions to physics are among the most important andbeautiful of the last century. His crowning achievement was perhaps the unification of thelaws of electricity and magnetism into a set of consistent equations which together describeall electrical and magnetic phenomena. As he studied these equations, he made a startlingdiscovery: the equations suggested the possibility of electromagnetic waves. Furthermore,the wave speed, which could be computed from the equations, was extremely close to thebest estimate then available of the speed of light. Very soon, everyone became convincedthat a final explanation of the nature of light had been discovered: light is an electromagneticwave, i.e. a traveling wave of oscillating electric and magnetic fields. Figure 2.2 shows aschematic drawing of an electromagnetic wave.
If light is a wave phenomenon, then it obeys the usual laws of wave dynamics. Forinstance, its frequency (ν) and wavelength (λ) are related by
c = λν (2.1)
where c is the wave speed, in this case the speed of light. The SI unit of frequency is thehertz (Hz). One hertz is one cycle per second.

P1: SFK Trim: 247mm × 174mm Top: 14.586mm Gutter: 23.198mm
CUUK1808-02 CUUK1808/Roussel 978 1 107 00678 2 October 29, 2011 12:38
2.1 Light 9
Figure 2.2 Schematic diagram of an electromagnetic wave. The wave is made up of oscillating electricand magnetic fields, represented here by vectors. The vertical vectors (say) represent the electric fieldat different points along the wave propagation axis, while the horizontal vectors represent the magneticfield. The direction of propagation of the wave is indicated by the large arrow. The wave amplitude isthe height of the wave (measured in electric field units). The wavelength is the distance between twosuccessive maxima. The frequency is the number of cycles of the wave observed at a fixed positionin space divided by the observation time.
Example 2.1 Wavelength and frequency The shortest wavelength of light visible to usis approximately 400 nm. The corresponding frequency is
ν = c
λ= 2.997 924 58 × 108 m s−1
400 × 10−9 m= 7.49 × 10¹⁴ Hz.
Instead of the wavelength or frequency, we sometimes use the wavenumber ν to describelight waves. The wavenumber is just the inverse of the wavelength, so ν = λ−1. If thewavelength is the length of one wave, the wavenumber is the number of waves per unitlength. Wavenumbers are mostly used in spectroscopy, which we will study in the nextchapter, and are usually given in reciprocal centimeters (cm−1). This unit is so commonlyused that spectroscopists often read values like 1000 cm−1 as “one thousand wavenumbers,”although this is a bad habit which should be discouraged.
Example 2.2 Wavelength and wavenumbers Wavenumbers are most commonly encoun-tered in infrared (IR) spectroscopy. The infrared part of the electromagnetic spectrum rangesfrom about 750 nm to 1 mm. Let us convert this into a wavenumber range. Let’s start withthe lower end of the wavelength range. That wavelength, converted to cm, is
(750 nm)(10−9 m nm−1)
10−2 m cm−1= 7.5 × 10⁻⁵ cm

P1: SFK Trim: 247mm × 174mm Top: 14.586mm Gutter: 23.198mm
CUUK1808-02 CUUK1808/Roussel 978 1 107 00678 2 October 29, 2011 12:38
10 A quick tour of quantum mechanical ideas
This corresponds to a wavenumber of (7.5 × 10⁻⁵ cm)−1 ≈ 13 000 cm−1. If we do the samecalculation for the other end of the infrared range, we get 10 cm−1, so the infrared rangesfrom 10 to 13 000 cm−1.
Maxwell’s electromagnetic theory of light was thought for a few decades to answer allquestions about the nature and behavior of light. However, as so often happens in science,an anomaly cropped up. The photoelectric effect, the ejection of electrons from a metalsurface when irradiated with light of a sufficiently high frequency, resisted explanation byMaxwell’s theory. In a nutshell, the problem was that the energy of a classical electromag-netic wave should be related to its amplitude. Cranking up the intensity should eventuallyprovide enough energy for any desired process, including removing electrons from matter.The frequency shouldn’t have anything to do with it.
It was Einstein who provided the resolution of this puzzle in 1905: he postulated thatlight is made up of particles he called photons. Each photon has an energy related tothe frequency of the light by an equation originally proposed by Max Planck to explainblackbody radiation (wherein lies a whole other tale):
E = hν (2.2)
where h is Planck’s constant. This innocent-looking equation revolutionized physics; it linksthe energy of a particle to a wave property, the frequency ν. Einstein had thus provided acompletely original and unexpected solution to the old debate about the nature of light: lightis both a particle and a wave. Light propagates in space like a wave, but in its interactionswith matter, light behaves as if it were made of particles which are absorbed as individualunits. This ability of light to behave either like a particle or like a wave, depending on thesituation, is called duality.
This solves the puzzle of the photoelectric effect: assuming that only one photon isabsorbed at a time (an idea known as the law of photochemical equivalence, to which weshall shortly return), then an individual photon either does or does not have enough energyto eject an electron from a metal surface. Since the energy of a photon is proportional toits frequency, it is easy to see that the frequency must be sufficiently high in order to causea photoelectric effect. In the photon theory, increasing the intensity of a light beam onlyincreases the number of photons delivered by the beam per unit time, and not the energiesof the photons.
Example 2.3 Photon energy We calculated earlier that the highest frequency of visiblelight is approximately 7.49 × 10¹⁴ Hz (Example 2.1). The energy of a single photon withthis frequency is
E = hν = (6.626 0688 × 10−34 J Hz−1)(7.49 × 10¹⁴ Hz) = 4.96 × 10⁻¹⁹ J
The energy of a mole of photons of this frequency is
E = (4.96 × 10⁻¹⁹ J)(6.022 1420 × 1023 mol−1) = 299 kJ mol−1

P1: SFK Trim: 247mm × 174mm Top: 14.586mm Gutter: 23.198mm
CUUK1808-02 CUUK1808/Roussel 978 1 107 00678 2 October 29, 2011 12:38
2.1 Light 11
Figure 2.3 Electromagnetic spectrum. The full spectrum is shown on the left, plotted on a logarithmicscale. The visible part of the spectrum (marked by the heavy dash under the word visible) representsonly a tiny fraction of the range of wavelengths commonly observed in the natural environment. Onthe right, we see a blowup of the visible part of the spectrum. The labels (γ -ray, X-ray, etc.) onlyname an approximate region of the spectrum. The color labels of the visible spectrum are particularlyunreliable as there is wide variation in color perception among people.
It turns out that this energy is similar to chemical reaction energies. This observation is ofconsiderable importance in photochemistry and photobiology.
Equations (2.1) and (2.2) can be combined to give a relationship between photon energyand wavelength, or, since the wavenumber is the reciprocal of the wavelength, betweenenergy and wavenumber:
E = hc
λ= hcν (2.3)
While we can only see electromagnetic radiation in a very restricted range, there isneither an upper nor a lower limit to the possible wavelengths of light. Figure 2.3 showsthe electromagnetic spectrum. The labels are not to be taken too seriously; there is noexact dividing line between, for instance, γ -rays and X-rays. However, these labels areconvenient identifiers of the spectral region to which a given radiation belongs.
Einstein is of course most famous for his work on relativity. One of the central equationsof relativity theory is
E2 = c2p2 + m20c
4 (2.4)
where E is the energy of a particle, p is its momentum and m0 is the rest mass (the massat zero velocity) of the particle. (In relativity, the mass varies with speed.) If we take thecase of a particle at rest (p = 0), we recover the most famous version of this equation:E = m0c
2. Photons represent the opposite extreme. They have a rest mass of zero, so forphotons
E = cp (2.5)

P1: SFK Trim: 247mm × 174mm Top: 14.586mm Gutter: 23.198mm
CUUK1808-02 CUUK1808/Roussel 978 1 107 00678 2 October 29, 2011 12:38
12 A quick tour of quantum mechanical ideas
In other words, a photon has a momentum proportional to its energy. This momentum canbe related to the wavelength by
E = cp = hc/λ
∴ p = h/λ (2.6)
Before we proceed to some examples, it is worth recalling that the SI unit of mass is thekilogram, not the gram. Thus, if we consistently work in SI units, the units of momentumobtained from Equation (2.6) will be kg m s−1.
Example 2.4 Momentum of a mole of photons What is the momentum of a mole of400 nm photons?
p = 6.626 0688 × 10−34 J Hz−1
400 × 10−9 m= 1.66 × 10⁻²⁷ kg m s−1
per photon or
(1.66 × 10⁻²⁷ kg m s−1)(6.022 1420 × 1023) = 9.98 × 10⁻⁴ kg m s−1
for a mole of photons.
Example 2.5 Photon pressure and solar sailing While the momentum of a photon isquite small, the Sun just keeps producing photons so that, away from a planet’s gravitationalfield, this is sufficient to accelerate a spacecraft equipped with a large sail, i.e. a thin sheetof reflective material, to respectable speeds. Solar sailing is made possible by the near-vacuum conditions present in interplanetary space (which minimize frictional losses) andby the microgravity environment (which makes it possible to deploy very large, thin sails).Photon pressure has been used for attitude control on a number of spacecraft. The firstspacecraft to actually be propelled by a solar sail is the Japanese craft IKAROS. IKAROSis a 315 kg craft carrying out a variety of science experiments. It has deployed a squaresolar sail with a 20 m diagonal, corresponding to an area of 200 m2. As of this writing,IKAROS is near Venus, where the solar flux is1 φE = 2563 J m−2s−1. This is the amountof electromagnetic radiation from the Sun that would be received on a one-square-metersurface every second near the orbit of Venus. Equation 2.5 allows us to transform thisenergy flux into a momentum flux:
φp = φE
c= 2563 J m−2s−1
2.997 924 58 × 108 m s−1= 8.549 × 10⁻⁶ (kg m s−1)m−2s−1
By multiplying by the surface area of the sail, we get the momentum of the photonspassing through that area every second. The maximum push is provided when the sail isperpendicular to the solar flux. In this case, the photons are reflected straight back so the
1 CRC Handbook of Chemistry and Physics, 66th edn.; Boca Raton: CRC Press, 1985, p. F-129.

P1: SFK Trim: 247mm × 174mm Top: 14.586mm Gutter: 23.198mm
CUUK1808-02 CUUK1808/Roussel 978 1 107 00678 2 October 29, 2011 12:38
2.2 Wave properties of matter 13
change in momentum of the spacecraft is twice the initial momentum of the photons:
�pmax/�t = 2(8.549 × 10⁻⁶ (kg m s−1)m−2s−1)(200 m2)
= 3.420 × 10⁻³ kg m s−2
Since p = mv and m is fixed, �p = m�v, so �p/�t = m�v/�t = ma = F , where a isthe acceleration and F is the force. The spacecraft therefore experiences a maximum forceof 3.420 mN. The maximum acceleration of IKAROS’s 315 kg is therefore a = F/m =1.09 × 10⁻⁵ m s−2. This is really tiny, but remember that this acceleration acts all thetime, without the need to find fuel. To put this number into perspective, consider that ifthis acceleration acted constantly for one year, IKAROS could reach a speed of aboutv = at ≈ 340 m s−1 due solely to the photon pressure. Provided you have a bit of time,which you do with unmanned probes like IKAROS, this is not a bad way to get around thesolar system.
Exercise group 2.1
(1) In an ordinary incandescent light bulb, approximately 35% of the energy used isconverted to photons. The rest is lost in the form of heat. Assuming that the averagephoton has a wavelength of 580 nm (about the middle of the visible range), roughlyhow many photons are produced per hour by a 100 W light bulb? Express your answerin moles.
(2) When 57Co decays, it forms an excited 57Fe nucleus (mass 9.45 × 10⁻²⁶ kg) which thenreaches its ground state by emitting a γ -ray photon of energy 2.31 × 10⁻¹⁵ J. Whenthis happens, because of conservation of momentum, the iron nucleus must recoil, i.e.acquire a momentum equal and opposite to that of the emitted particle, much like acanon that recoils after firing. Calculate the momentum of the emitted photon. Thencalculate the kinetic energy acquired by the iron nucleus as a result of this process,assuming that the nucleus is initially at rest.
(3) In photochemical reactions, light causes chemical reactions, often by breaking bonds.A carbon–carbon single bond takes (on average) 350 kJ/mol to break. Calculate theenergy, frequency and wavelength of a photon capable of breaking a carbon–carbonbond. To what spectral region does such a photon belong?
2.2 Wave properties of matter
Einstein’s work implied that light had a dual nature: it is a wave, and it is made up ofparticles. Whether light shows us its wave or particle properties depends on the experimentperformed. In his 1924 Ph.D. thesis, Louis de Broglie completed Einstein’s argument: sincethe theory of relativity implies that matter and energy are interconvertible, then if light (aform of energy) is both a particle and a wave, the same must be true for particles of matter.Indeed, the very same equations must apply. Specifically, the wavelength of a particle of

P1: SFK Trim: 247mm × 174mm Top: 14.586mm Gutter: 23.198mm
CUUK1808-02 CUUK1808/Roussel 978 1 107 00678 2 October 29, 2011 12:38
14 A quick tour of quantum mechanical ideas
momentum p must be given by Equation (2.6):
λ = h/p
whether the particle is massless (like a photon) or not. De Broglie’s hypothesis was verysoon confirmed by the observation of a wave-like property of electrons (diffraction) byDavisson and Germer. The de Broglie equation is the foundation of the old quantum theory,a simple theory that can still be very useful, provided we’re careful not to ask too muchof it.
Example 2.6 Thermal wavelength of an electron At 298 K, the average kinetic energyof a particle in a gas is 6 × 10⁻²¹ J. What is the wavelength of an electron of this energy?
We can calculate the speed from the kinetic energy: K = 12mv2 so
v =√
2K
m=√
2(6 × 10⁻²¹ J)
9.109 3819 × 10−31 kg= 1.15 × 10⁵ m s−1
∴ p = mv = (9.109 3819 × 10−31 kg)(1.15 × 10⁵ m s−1)
= 1.05 × 10⁻²⁵ kg m s−1
∴ λ = h
p= 6.626 068 8 × 10⁻³⁴ J Hz−1
1.05 × 10⁻²⁵ kg m s−1= 6 nm
This wavelength is called the thermal wavelength because it is the wavelength of anaverage electron in thermal equilibrium near room temperature. On a molecular scale, thisis a large distance. For instance, 6 nm would be the approximate length of a chain of 39carbon atoms. That said, this might be a good wavelength for the operation of an electronmicroscope, a device in which the wave properties of electrons are used to image smallfeatures of (for instance) biological samples on scales that are beyond the resolving powerof optical microscopes.
Example 2.7 Thermal wavelength of a neutron Let’s now calculate the thermal wave-length of a neutron at 298 K.
v =√
2K
m=√
2(6 × 10⁻²¹ J)
1.674 927 16 × 10−27 kg= 2.68 × 10³ m s−1
∴ p = mv = (1.674 927 16 × 10−27 kg)(2.68 × 10³ m s−1)
= 4.48 × 10⁻²⁴ kg m s−1
∴ λ = h
p= 6.626 068 8 × 10⁻³⁴ J Hz−1
4.48 × 10⁻²⁴ kg m s−1= 1.5 A
This is much more closely comparable to atomic dimensions. This observation is the basisof neutron diffraction, a technique that can be used to determine the structures of moleculesin solid samples, among other applications.

P1: SFK Trim: 247mm × 174mm Top: 14.586mm Gutter: 23.198mm
CUUK1808-02 CUUK1808/Roussel 978 1 107 00678 2 October 29, 2011 12:38
2.3 Probability waves 15
Example 2.8 Wavelength of your professor Just for fun, let’s calculate de Broglie wave-length of a 75 kg person walking at a speed of 1 m s−1.
The momentum of the person is
p = mv = 75 kg m s−1
The de Broglie wavelength is therefore
λ = h/p = 8.8 × 10−36 m
This is tiny. To put this number in perspective, the radii of some of the smallest things weknow, neutrons and protons are around 10−15 m.
These last examples show us why we need quantum mechanics to treat atoms andmolecules, but not to treat the motion of ordinary objects: the de Broglie wavelengths ofthe constituents of atoms and molecules (electrons and nuclei) tend to be large comparedto atomic dimensions. The wave properties of these particles therefore cannot be neglectedif we hope to describe the behavior of matter on an atomic scale. On the other hand, thede Broglie wavelengths of everyday objects are tiny so that the wave properties of largepieces of matter are negligible. Note that quantum mechanics should apply equally wellto large objects as it does to the very small; it’s just that the ways in which quantummechanics differs from classical mechanics become less and less easily observable asobjects grow larger so that it’s generally not worth the bother once objects exceed a certainsize. There is no sharp cutoff, but a gradual transition from quantum to classical behavior.Biopolymers such as proteins and DNA, for instance, are sufficiently large that some of theirmotions, especially those that involve a large number of atoms, can be described relativelyaccurately by classical mechanics, but many details of their structure and function can onlybe understood using quantum mechanics.
Exercise group 2.2
(1) What is the wavelength associated with a neutron whose speed is 8000 m s−1?(2) At 10 K, the molecules in a gas have an average kinetic energy of 2 × 10⁻²² J. Would
quantum mechanical effects be important to understand the motion of helium atoms atthis temperature?
2.3 Probability waves
Sound is a pressure wave, meaning that regions of higher and lower pressure propagatethrough space. Light, as we have seen, is an electromagnetic wave. But what exactly is it thatis propagating through space in a matter wave? The surprising answer to this question wasprovided by Max Born: the wave associated with a particle is a probability wave. This makesquantum mechanics very different from classical mechanics; in classical mechanics, our

P1: SFK Trim: 247mm × 174mm Top: 14.586mm Gutter: 23.198mm
CUUK1808-02 CUUK1808/Roussel 978 1 107 00678 2 October 29, 2011 12:38
16 A quick tour of quantum mechanical ideas
knowledge of a system is only limited by our measuring instruments. Quantum mechanics,on the other hand, is intrinsically probabilistic. We will be able to assign probabilities thata particle is in one region or another, but we won’t be able to assign precise coordinates toa particle.
We now need a little bit of language from probability theory. In quantum mechanics,we will need to describe how probability varies with position in space. However, we can’ttalk about the probability that a particle is at some precise coordinate x, for two reasons:first, this probability is zero because the true value of the particle position will always differfrom x if we look at enough decimal place of the two numbers; second, limitations in theprecision of our measuring instruments mean that there will always be some uncertaintyin the position. The best we can do is to ask what is the probability that the object is atx plus or minus �x. In probability theory, we deal with these problems by introducing aprobability density p(x) whose value gives us the amount of probability per unit length.More formally, p(x) dx is the probability that a particular measurement of the position willfall between x and x + dx.
In quantum mechanics, a particle has a wavefunction whose square is the probabilitydensity for the location of the particle. The absolute value of the wavefunction will thereforebe large in regions where the particle is most likely to be found.
The fact that particles have wave properties has interesting consequences. Waves arehard to confine. Think about your neighbor’s loud party. You can close all your windows anddoors, and still the sound waves propagate through your walls. You have to put a lot of insu-lation between you and that party before you reach the point where you can’t hear the noiseanymore. The same thing is true of particles; their wavefunctions can propagate throughbarriers that, if we were in the domain of classical particles, would be impenetrable. Thepropagation of the wavefunction through a barrier means that there is a probability thatthe particle can spontaneously appear on the other side, which indeed does happen. Thisphenomenon is known as tunneling. Thus, electrons can sometimes tunnel through insu-lating materials, creating a tunneling current, i.e. a current that shows up on the other sideof an insulator from the one where the electrons were originally circulating. Tunneling isexploited in a number of modern devices, ranging from flash memory to some types ofelectron microscopes.
2.4 Quantization of energy
Using just the principles we have seen so far, we will study a very simple (but oftensurprisingly useful) model, that of a particle in a one-dimensional box. This will enable usto draw out some key features of quantum mechanics and of its consequences for molecularscience.
A box is simply a container with hard walls from which a particle cannot escape. Ourbox will be considered to be perfect so that no tunneling can occur. A quantum mechanicalparticle has an associated wave, and waves interfere with themselves when they cross. Our

P1: SFK Trim: 247mm × 174mm Top: 14.586mm Gutter: 23.198mm
CUUK1808-02 CUUK1808/Roussel 978 1 107 00678 2 October 29, 2011 12:38
2.4 Quantization of energy 17
−1.5
−1
−0.5
0
0.5
1
1.5
0 L/2 L
Wav
efun
ctio
n
n = 1n = 2
Figure 2.4 Ground state (n = 0) and first excited state (n = 1) wavefunctions for the particle in a box.
perfect box must reflect the wave at its boundary, which is what we mean when we say thatwe can’t have tunneling. If the wave has an arbitrary wavelength, each pass through thebox will have a different phase (different positions for its maxima and minima), and it willdestructively interfere with itself, i.e. cancel itself out. The wavelength should therefore besuch that the wave, on reflection from one end of the box, has the same shape as the wavebefore reflection. A little thought reveals that there must be an integer (whole) number ofhalf-waves in the box, i.e.
L = nλ/2
or
λ = 2L/n
where n is an integer. This relation is called a quantization condition. A quantizationcondition requires a property of a particle (in this case the wavelength) to be related to theintegers by an algebraic relationship. The integer n is called a quantum number. The firsttwo wavefunctions are shown in Figure 2.4.
The wavelength of the particle is related to the size of its momentum by
p = h/λ = nh
2L
so the momentum is also quantized. The speed can be computed from the momentum:
v = p/m = nh
2mL

P1: SFK Trim: 247mm × 174mm Top: 14.586mm Gutter: 23.198mm
CUUK1808-02 CUUK1808/Roussel 978 1 107 00678 2 October 29, 2011 12:38
18 A quick tour of quantum mechanical ideas
Finally, the (kinetic) energy is
En = 1
2mv2 = n2h2
8mL2(2.7)
The energy, too, is quantized.The sign of n has no physical meaning in this problem since it is just the number of
half-waves that fit in the box. You will note in fact that the energy doesn’t depend on thesign of the quantum number. We therefore can restrict our attention to the positive integers.Could n be zero? If it were, we would have no half-waves in the box, i.e. the wavefunctionwould be zero everywhere. However, this would mean that the probability of finding theparticle in the box would be zero, or to put it another way, that there was no particle inthe box at all. If there is a particle in the box, n therefore cannot be zero. Consequently,the smallest possible value of n is 1.
If n must be at least 1, then the energy of a particle in a box must be at least E1 =h2/(8mL2). De Broglie’s wave–particle duality and the probabilistic interpretation of thewavefunction have forced us to a remarkable conclusion: not only can the energy only takeon certain discrete values, but there is a minimum value, called the zero-point energy,below which the energy cannot fall. In short, it is not possible for a quantum-mechanicalparticle to be completely stationary.
A system in its lowest energy level is said to be in its ground state. The next lowestenergy level is the first excited state. The energy level after that is the second excited state,and so on.
Example 2.9 Particle-in-a-box treatment of a chemical bond A chemical bond is aregion of space between two nuclei in which electrons are more likely to be found than not.Treating a bond as a box, let us calculate the minimum speed of an electron in a σ bond. Acarbon–carbon bond is approximately 1.5 A long. The minimum speed is
v = h
2mL= 6.6261 × 10⁻³⁴ J Hz−1
2(9.1095 × 10⁻³¹ kg)(1.5 × 10⁻¹⁰ m)= 2.4 × 10⁶ m s−1
This is of course an extremely crude model for a bond, but it does give us an idea of thesize of this minimum speed for electrons in typical molecular settings. These speeds arelarge, but not relativistic, which makes the theory much simpler than it would have beenotherwise.
Exercise group 2.3
(1) The professor-in-a-box problem: A 75 kg quantum mechanics professor has been lockedinto a short, narrow hallway of length 5 m. To pass the time, he decides to calculate theminimum kinetic energy that quantum mechanics requires him to have, assuming thathe can treat himself as a particle in a one-dimensional box. What value does he get? Isthis a large or a small kinetic energy?

P1: SFK Trim: 247mm × 174mm Top: 14.586mm Gutter: 23.198mm
CUUK1808-02 CUUK1808/Roussel 978 1 107 00678 2 October 29, 2011 12:38
2.5 A first look at spectroscopy 19
(2) Suppose that a proton is placed in a narrow box of length 1 cm at 25 ◦C. The averagekinetic energy of particles held at 298 K in one dimension is approximately 2 × 10⁻²¹ J.Compute the quantum number n of a proton in a box at this kinetic energy. Thencalculate the energy necessary for this particle to make a transition from your computedvalue of n to n + 1. Do you expect quantum mechanical effects to be important in thissystem? Hint: To calculate the transition energy, it will be convenient to derive a formulafirst, and only then to plug in the numbers.
2.5 A first look at spectroscopy
Spectroscopy is the study of the interaction of light with matter. In the next chapter, we willstudy spectroscopy in greater depth, but here, we will discuss just one type of interaction,namely absorption. Absorption of photons by matter obeys a couple of rules:
(1) Under normal circumstances, one photon is absorbed by one molecule, a rule knownas the Stark–Einstein law, or the law of photochemical equivalence. Two-photonprocesses are extremely unlikely at normal illumination levels, but are possible at thevery high light intensities that can be reached using some lasers. We will focus here onthe normal case in which the law of photochemical equivalence holds.
(2) The energy of the photon is completely converted into molecular energy, so this energymust correspond to the spacing between two energy levels of the molecule.
It is the latter rule that makes spectroscopy an invaluable tool: it gives us a direct probeof the energy levels of a molecule, which in turn are connected to its structure in ways thatwe will explore in more detail in the next chapter. Here, we will look at the absorptionspectroscopy of a particle in a box as a simple model for the spectroscopy of moleculeswith conjugated π bonds.
We will see in the next chapter that the energy of a molecule can be separated intovarious contributions. One of these is the electronic energy. You will have discussed atomicorbitals in your introductory chemistry course. Molecules also have orbitals. In princi-ple, these molecular orbitals extend over the entire molecule, although some orbitalsmay be strongly localized to a particular part of the molecule. In the case of conju-gated π bonds (whose Lewis structures appear as alternating single and double bonds“interchanged” by resonance), resonance creates long orbitals through which the elec-trons can move, i.e. a “box.” You can probably think of objections to treating conju-gated π bonds as a one-dimensional box, but this does turns out to be a reasonablemodel.
To discuss molecular orbitals, we need an additional principle which you will have seenin your introductory chemistry class, namely the Pauli exclusion principle, one versionof which states that no two electrons can occupy the same orbital. We are now ready toconsider the spectroscopy of molecules with conjugated π bonds.

P1: SFK Trim: 247mm × 174mm Top: 14.586mm Gutter: 23.198mm
CUUK1808-02 CUUK1808/Roussel 978 1 107 00678 2 October 29, 2011 12:38
20 A quick tour of quantum mechanical ideas
N
HC 52
.. +
HC 52
N
Figure 2.5 The 1,1′-diethyl-2,2′-dicarbocyanine ion. Cyanine dyes such as this one absorb strongly inthe visible range and thus are brightly colored compounds. Accordingly, they have traditionally beenused as dyes. This particular dye absorbs strongly at the red end of the spectrum, giving it a pleasantblue-green color.
Example 2.10 Spectroscopy of molecules with conjugated π bonds The 1,1′-diethyl-2,2′-dicarbocyanine ion (Figure 2.5) absorbs light at 708 nm. This dye has 10 π electronsin the conjugated π chain that extends from one nitrogen atom to the other (the lone pair ofelectrons on the nitrogen on the left plus the four pairs of π electrons in the double bonds),so these electrons fill five molecular orbitals in the molecule’s ground state, in accord withthe Pauli exclusion principle. Absorbing a photon with a wavelength of 708 nm causesone electron to be transferred from the highest occupied molecular orbital (HOMO) to thelowest unoccupied molecular orbital (LUMO). Treating the π orbitals as a one-dimensionalbox, this would be an n = 5 to n = 6 transition. The energy of the photon is
Ephoton = hc
λ= (6.626 068 8 × 10⁻³⁴ J Hz−1)(2.997 924 58 × 108 m s−1)
708 × 10−9 m= 2.81 × 10⁻¹⁹ J
The difference in energy between the HOMO and LUMO is
�E = E6 − E5 = 62h2
8mL2− 52h2
8mL2= 11h2
8mL2
Since our box contains electrons, m is the mass of an electron. If we equate the energyof the photon to this energy difference, the only unknown is therefore the length of thebox:
L2 = 11h2
8mEphoton= 11(6.626 068 8 × 10⁻³⁴ J Hz−1)2
8(9.109 381 9 × 10⁻³¹ kg)(2.81 × 10⁻¹⁹ J)
= 2.36 × 10⁻¹⁸ m2
∴ L = 1.54 × 10⁻⁹ m
There are eight bonds in the conjugated π chain. Assuming the electrons are confined to thisbox, the length of one bond would be 1.54 nm/8 = 0.192 nm. Conjugated carbon–carbonbonds are usually about 0.14 nm long. Our estimate of the bond length is too large byabout 37%, which isn’t bad considering how simple a model we took for the molecularorbitals.

P1: SFK Trim: 247mm × 174mm Top: 14.586mm Gutter: 23.198mm
CUUK1808-02 CUUK1808/Roussel 978 1 107 00678 2 October 29, 2011 12:38
2.5 A first look at spectroscopy 21
Exercise group 2.4
(1) You may recall from your introductory chemistry course that the energy levels of ahydrogen atom satisfy the equation En = −RH/n2, where n is the principal quantumnumber, and RH is Rydberg’s constant. Rydberg’s constant is often given in wavenum-bers: RH = 109 677.581 cm−1. Calculate the wavelength of a photon that could cause atransition from the ground state (n = 1) to the first excited state (n = 2) of a hydrogenatom.
(2) We will see in the next chapter that the vibrational energy levels of a molecule arewell approximated by Ev = hν0
(v + 1
2
), where ν0 is a constant characteristic of the
vibration, and v is a quantum number that can take any of the values 0, 1, 2, . . .
(a) What is the vibrational zero-point energy?(b) Develop a general expression for the energies of the photons that could be absorbed
in terms of �v, the change in the vibrational quantum number of the molecule.(c) The lowest energy vibrational transition of a certain molecule is observed at
1200 cm−1. What is the value of ν0?(d) Where should we look for the next-lowest energy transition?
Key ideas and equations
� For electromagnetic waves: c = λν, E = hν = hc/λ = hcν� For both photons and particles of matter: p = h/λ� Molecular energy is quantized, and there is a minimum molecular energy called the
zero-point energy.� For a particle in a box: En = n2h2/(8mL2)� In absorption spectroscopy, a single photon provides the energy for a molecule to transi-
tion from one allowed energy level to another.
Review exercise group 2.5
(1) What is the condition for a molecule to absorb photons of a particular wavelength?(2) Most microwave ovens operate at a frequency of 2.45 GHz. Calculate the corresponding
photon energy, wavelength and wavenumber.(3) 177Au is an unstable isotope that decays by emitting an α particle (a helium nucleus)
with a kinetic energy of 6.115 MeV. What is the wavelength of this α particle? Themass of an α particle is 6.644 6562 × 10−27 kg. Do you expect quantum effects to beimportant for an α particle with this energy?
(4) The particle-on-a-ring model is a simple variation on the particle-in-a-box model; weimagine that a particle is confined to a ring of radius r:(a) The main difference between the two models is the quantization condition. A ring
doesn’t have edges. What would be the correct quantization condition on a ring?

P1: SFK Trim: 247mm × 174mm Top: 14.586mm Gutter: 23.198mm
CUUK1808-02 CUUK1808/Roussel 978 1 107 00678 2 October 29, 2011 12:38
22 A quick tour of quantum mechanical ideas
(b) Derive an equation for the energy levels of a particle on a ring.(c) Unlike the particle-in-a-box problem, n = 0 is an allowed value of the quantum
number for the particle on a ring. (This is associated with the fact that a ring doesn’thave edges, which makes it possible to have a wavefunction which is just constantover the ring.) Also, the positive and negative values of n correspond to differentstates with the same energy. We say that the states for n > 0 are degenerate, aconcept to which we will return in the next chapter. If we imagine the ring as beingperpendicular to the z axis, then positive values of n correspond to counterclockwisecirculation around the z axis, while negative values of n correspond to clockwisecirculation. Correspondingly, the angular momentum (which you may recall fromyour first-year physics course) is a vector pointing along the z axis for positive n andalong the negative z axis for negative n. The z component of the angular momentumvector (the x and y components are zero) is given by Lz = rp. Work out a formulafor the angular momentum. You will find that your formula is consistent with therotation directions mentioned above if you allow both positive and negative valuesof n.
(d) We can treat the π electrons in benzene approximately as particles on a ring. Sketchthe energy level diagram for the lowest few particle-on-a-ring energy levels, andplace the π electrons in the ground-state configuration. Identify the HOMO andthe LUMO.
(e) The HOMO to LUMO transition in benzene is observed near 178 nm. What ringradius does this imply?
(f) If we take the radius as being the distance from the center of the ring to one of theatoms, what is the bond length?Hint: Draw a regular hexagon, and look at a “slice” bounded by an edge and by thetwo rays from the center to the ends of the edge. How is the edge length related tothe length of the rays (radius)?

P1: SFK Trim: 247mm × 174mm Top: 14.586mm Gutter: 23.198mm
CUUK1808-03 CUUK1808/Roussel 978 1 107 00678 2 October 29, 2011 12:52
3
Spectroscopy
As mentioned in the last chapter, spectroscopy is the study of the interaction of light withmatter. We also saw an example of inferring a molecular property (a bond length) fromspectroscopic data. In fact, spectroscopy is the principal experimental approach allowingus to study molecules. Our program in this chapter will be to learn about a selected fewspectroscopic techniques and what they tell us about molecules. Instructors in your othercourses in chemistry and biochemistry will introduce you to additional techniques as youneed them. What I hope you will take away from this chapter is that there are a few basicprinciples that govern spectroscopy which, once mastered, can be applied to all spectroscopyexperiments.
3.1 Molecular energy
The particles in a molecule are in constant motion:
� The electrons buzz around their orbitals.� The bonds vibrate, which is to say that the atoms move back-and-forth repeatedly like
balls connected by springs.� The whole molecule rotates.� In gases and, to a lesser extent, in liquids, the molecules translate, which is to say that
they move through space.
Each of these motions has energy associated with it. These motions are not completelyindependent, but it turns out that we can treat them as if they are for many purposes. Wecan therefore write the energy of a single molecule as
E = Eelec + Evib + Erot + Etrans
where Eelec is the electronic energy (the energy associated with the electrons), Evib is thevibrational energy, Erot is the rotational energy and Etrans is the translational energy. Eachof these types of energy has its own energy levels and, as it turns out, these energy levelstypically have very distinctive spacings, and so each (except for translational energy, asdiscussed below) is associated with its own spectroscopy.
23

P1: SFK Trim: 247mm × 174mm Top: 14.586mm Gutter: 23.198mm
CUUK1808-03 CUUK1808/Roussel 978 1 107 00678 2 October 29, 2011 12:52
24 Spectroscopy
Let’s start by considering the translational energy levels. These might be of interest in agas. We usually study the spectroscopy of gases in cylindrical sample cells that are at least10 cm long. Say we have a cell that is this long, and consider the translational energy levelsof a nitrogen molecule in this cell, which will be given by the particle-in-a-box equation(2.7). (We could generalize this argument to three dimensions, but we would conclude muchthe same thing.) Some simple arguments from statistical mechanics show that the averagekinetic energy of a gas molecule in one dimension is 1
2kBT , where kB is Boltzmann’sconstant (to which we will return shortly). At, say, 20 ◦C, the average kinetic energy worksout to 2.02 × 10⁻²¹ J. Suppose that we have a molecule with this much energy. What wouldbe its quantum number, n? The molar mass of a nitrogen molecule is 28.02 g mol−1, or4.65 × 10−23 g = 4.65 × 10⁻²⁶ kg. (Don’t forget that the kilogram is the SI unit of mass,not the gram.) From the particle-in-a-box equation, we have
n =√
8mEn(L/h)
=√
8(4.65 × 10⁻²⁶ kg)(2.02 × 10⁻²¹ J)[(0.1 m)/(6.626 068 8 × 10⁻³⁴ J Hz−1)
]= 4.142 × 10⁹
Spectroscopy has to do with differences in energy. We might then ask how closely spacedthe energy levels are for this value of n:
�E = En+1 − En = h2
8mL2
[(n + 1)2 − n2
] = h2
8mL2(2n + 1)
For our values of n, m and L, we get �E = 9.77 × 10⁻³¹ J. This is an extraordinarily smalldifference in energy, both relative to the average energy of nitrogen molecules, and in termsof the energies of photons (Figure 2.3). Accordingly, no practical spectroscopy experimentcould be designed to study the translational energy levels of molecules.
For the other types of molecular energy, the energy levels are in fact sufficiently spacedfor spectroscopy. The spacings between energy levels obey the following relationships toeach other and to the spectral regions where they are typically observed:
Level spacings: electronic > vibrational > rotational⇓ ⇓ ⇓
Spectral region: ultraviolet/visible infrared microwave
It is important to understand that these relationships do not imply that only one type oftransition occurs in each of these regions. For example, if the photons in a spectroscopyexperiment have enough energy to cause a vibrational transition, they will normally causerotational transitions at the same time. In this case, we would have Ephoton = �Evib + �Erot.Thus you should think of the correspondences in the boxes above as establishing how muchenergy is required to cause a certain type of transition, with the understanding that transitionsof lower energy can occur at the same time.

P1: SFK Trim: 247mm × 174mm Top: 14.586mm Gutter: 23.198mm
CUUK1808-03 CUUK1808/Roussel 978 1 107 00678 2 October 29, 2011 12:52
3.2 The Boltzmann distribution 25
3.2 The Boltzmann distribution
At any given temperature above absolute zero, not all molecules in a sample will be in theirground states. One of the issues that will be important to our understanding of molecularspectroscopy will be the proportion of molecules that can be expected to occupy a givenenergy level prior to excitation with a light source. The answer to this question is providedby the Boltzmann distribution. Deriving the Boltzmann distribution would take moretime and space than we can devote to this topic, so we’ll just have to take it as a given. Itturns out that there are two factors to consider: the energy of a level, and its degeneracy.The degeneracy is the number of different sets of quantum numbers that give the sameenergy. You would have run into this concept in your introductory chemistry course whenthe energy levels of atoms were discussed, where you would have learned that there are,for example, three 2p orbitals, and that all three are equal in energy in free atoms. Thedegeneracy of, for example, a boron atom in its ground state (1s22s22p1) is therefore three.
The Boltzmann distribution is given by the following equation:
P (Ei) = gi exp
(− Ei
kBT
)/q (3.1)
where P (Ei) is the probability that a molecule has energy Ei , gi is the degeneracy of theenergy level, kB is Boltzmann’s constant and T is the absolute temperature. Boltzmann’sconstant turns out to just be the ideal gas constant expressed on a per-molecule instead ofa per-mole basis. In other words, R = kBL, where L is Avogadro’s constant.
The constant q appearing in the Boltzmann distribution is the normalization constant forthe distribution. In other words, it is chosen so that
∑i P (Ei) = 1, where the sum is taken
over the energy levels of the molecule. It is not too hard to see that q must be given by thefollowing formula:
q =∑
i
gi exp
(− Ei
kBT
)(3.2)
q is called the molecular partition function and turns out to have a very important roleto play in statistical mechanics. To give you just a taste of the importance of the partitionfunction, consider
∂q
∂T=∑
i
Ei
kBT 2gi exp
(− Ei
kBT
).
∴ kBT 2 ∂q
∂T=∑
i
Eigi exp
(− Ei
kBT
)
∴ kBT 2
q
∂q
∂T=∑
i
Ei
(gie
−Ei/(kBT )
q
)=∑
i
EiP (Ei)
The symbol ∂ indicates a partial derivative, which is a derivative taken holding othervariables constant. We use a partial derivative here because q depends on more than

P1: SFK Trim: 247mm × 174mm Top: 14.586mm Gutter: 23.198mm
CUUK1808-03 CUUK1808/Roussel 978 1 107 00678 2 October 29, 2011 12:52
26 Spectroscopy
one variable. This may not be immediately obvious. However, if you look back atEquation (2.7) for the energy levels of a particle in a box, you will note that these dependon L. You can imagine that the three-dimensional generalization of this problem mightinvolve the volume V , and you would be right: in general, q depends on T and V . Thekey thing to notice here is the final equation; from basic statistical theory, we know that∑
i EiP (Ei) is the average energy, in this case averaged over a large number of molecules.We denote the average by 〈E〉, so we have
〈E〉 = kBT 2
q
∂q
∂T(3.3)
This average energy can in turn be associated with a thermodynamic quantity called theinternal energy. It will turn out that all thermodynamic quantities can be calculated fromthe partition function.
Example 3.1 Boltzmann distribution and probabilities Suppose that we have a verysimple system with just two energy levels:
i gi Ei/J1 1 02 3 4 × 10⁻²¹
The molecular partition function is
q = g1 exp
(− E1
kBT
)+ g2 exp
(− E2
kBT
)
= 1 + 3 exp
(− 4 × 10⁻²¹ J
(1.380 650 3 × 10⁻²³ J K−1)T
)
= 1 + 3 exp
(−290 K
T
)(3.4)
We can now write down the probability of finding a randomly chosen molecule in each ofthe two levels:
P (E1) = g1 exp
(− E1
kBT
)/q = (1 + 3 exp (−290 K/T ))−1
P (E2) = g2 exp
(− E2
kBT
)/q = 3e−290 K/T
1 + 3 exp (−290 K/T )(3.5)
These probabilities are plotted against temperature in Figure 3.1. At very low temperatures,P (E2) → 0 and only level 1 is occupied. This would generalize to systems with more energylevels; as the temperature is lowered toward zero, higher-energy states become less and lessprobable, until we reach a situation where only the ground state is appreciably occupied.At high temperatures, on the other hand, we see that the probabilities approach the values

P1: SFK Trim: 247mm × 174mm Top: 14.586mm Gutter: 23.198mm
CUUK1808-03 CUUK1808/Roussel 978 1 107 00678 2 October 29, 2011 12:52
3.2 The Boltzmann distribution 27
0
0.25
0.5
0.75
1
100 101 102 103 104 105
P(E
i)
T/K
P(E1)P(E2)
Figure 3.1 Probabilities of the two energy levels from Example 3.1 as a function of temperature. Notethe logarithmic scale of the temperature axis.
P (E1) = 14 and P (E2) = 3
4 . These probabilities are in direct proportion to the degeneracies.Again, this generalizes to an arbitrary number of states: at very high temperatures, all statesare equally probable, so the probability of occupying an energy level is proportional to thenumber of states of which the energy level consists, i.e. to its degeneracy.
To understand the partition function and what it tells us about a system, let’s think a littleabout the Boltzmann factor exp [−Ei/(kBT )]. For convenience, imagine that the groundstate has zero energy. We can always arrange for this to be true because the place where weput our zero on an energy scale is arbitrary. Only differences in energy matter in practice. IfEi kBT , then the Boltzmann factor is about 1. The partition function therefore containsa term for this energy level approximately equal to gi , the degeneracy of the level. On theother hand, if Ei � kBT , the Boltzmann factor is approximately 0. If we exclude the casewhere some of the energies are similar to kBT , we get the following:
q ≈∑
{i|Ei<kBT }gi
In words, this equation says that the partition function counts up the total number of stateswhose energies are less than kBT . If we consider the case where some of the energiesare similar to kBT , we can interpret the partition function similarly, but the number hasto be interpreted as a rough indication of the number of accessible states with energiessimilar to or less than kBT rather than as an actual count. If you want an example, lookback at the molecular partition function (3.4) from Example 3.1: at low temperatures,q ≈ 1, corresponding to the nondegenerate ground state, while at higher temperatures,q → 4, since all four states (ground state and degenerate excited state) will eventually be

P1: SFK Trim: 247mm × 174mm Top: 14.586mm Gutter: 23.198mm
CUUK1808-03 CUUK1808/Roussel 978 1 107 00678 2 October 29, 2011 12:52
28 Spectroscopy
accessible. In between, we get values between 1 and 4, which tells us that there is onelow-lying state (the ground state), as well as some states for which Ei ∼ kBT .
The Boltzmann distribution is often used to compare the populations of two energylevels. From Equation (3.1), we have
P (E2)
P (E1)=
g1 exp(− E1
kBT
)/q
g2 exp(− E2
kBT
)/q
= g1
g2exp
(− �E
kBT
)
where �E = E2 − E1. Let’s apply this formula to the relative populations of typical groundand excited states of molecules at room temperature.
Example 3.2 Relative population of an excited electronic state We have just seen thattypical electronic transitions are observed in the UV/visible range. (UV is an abbrevia-tion for ultraviolet.) Let’s take a wavelength in that range, say 400 nm, and see what thecorresponding energy level spacing implies about the relative populations of the groundand excited state. We first calculate the photon energy, which is the difference in energybetween the two electronic states:
�E = hc
λ= (6.626 068 8 × 10⁻³⁴ J Hz−1)(2.997 924 58 × 108 m s−1)
400 × 10−9 m= 4.97 × 10⁻¹⁹ J
Assuming that the two electronic states are non-degenerate (i.e. that g1 = g2 = 1), therelative populations of two states separated by an energy gap of this size at 20 ◦C is
P (E2)
P (E1)= exp
(−�E
kBT
)= exp
( −4.97 × 10⁻¹⁹ J
(1.380 650 3 × 10⁻²³ J K−1)(293.15 K)
)= 5.16 × 10−54
This is a really tiny number, which tells us that, really, only the ground state is occupied atroom temperature. Note that assuming a higher degeneracy for the excited state than for theground state would not have altered this conclusion, given the tiny value of the Boltzmannfactor.
We can repeat this calculation for typical vibrational (infrared, IR) and rotational(microwave) energy level spacings. We find the following:
UV/visible: only ground state occupiedInfrared: ground state mainly occupiedMicrowave: many states occupied
Knowing this will simplify the interpretation of electronic and vibrational spectra; onlytransitions starting in the ground state are likely to be observed in typical room-temperatureexperiments. On the other hand, in experiments where rotational transitions can be observed,
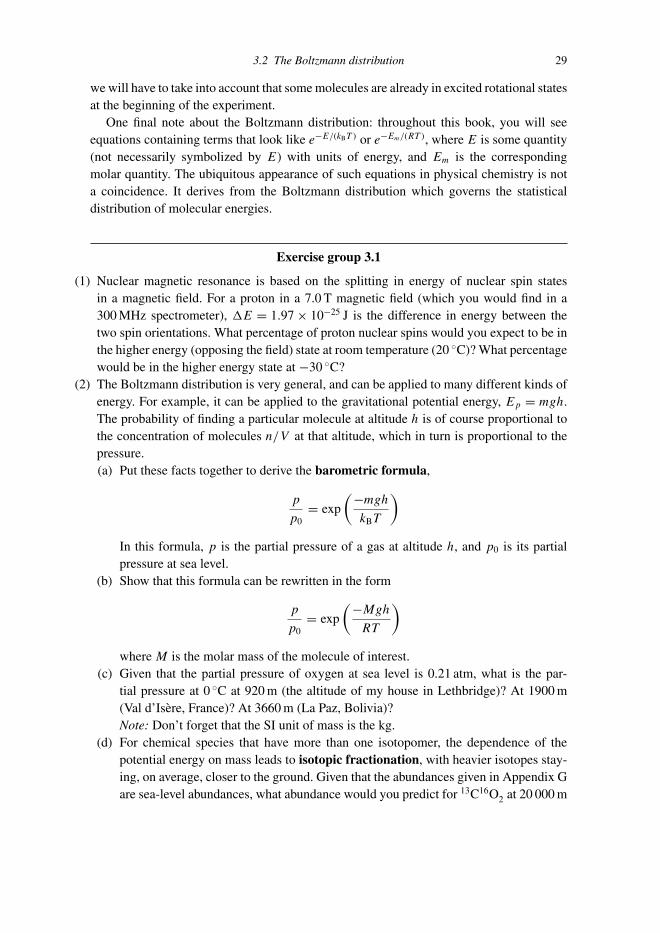
P1: SFK Trim: 247mm × 174mm Top: 14.586mm Gutter: 23.198mm
CUUK1808-03 CUUK1808/Roussel 978 1 107 00678 2 October 29, 2011 12:52
3.2 The Boltzmann distribution 29
we will have to take into account that some molecules are already in excited rotational statesat the beginning of the experiment.
One final note about the Boltzmann distribution: throughout this book, you will seeequations containing terms that look like e−E/(kBT ) or e−Em/(RT ), where E is some quantity(not necessarily symbolized by E) with units of energy, and Em is the correspondingmolar quantity. The ubiquitous appearance of such equations in physical chemistry is nota coincidence. It derives from the Boltzmann distribution which governs the statisticaldistribution of molecular energies.
Exercise group 3.1
(1) Nuclear magnetic resonance is based on the splitting in energy of nuclear spin statesin a magnetic field. For a proton in a 7.0 T magnetic field (which you would find in a300 MHz spectrometer), �E = 1.97 × 10⁻²⁵ J is the difference in energy between thetwo spin orientations. What percentage of proton nuclear spins would you expect to be inthe higher energy (opposing the field) state at room temperature (20 ◦C)? What percentagewould be in the higher energy state at −30 ◦C?
(2) The Boltzmann distribution is very general, and can be applied to many different kinds ofenergy. For example, it can be applied to the gravitational potential energy, Ep = mgh.The probability of finding a particular molecule at altitude h is of course proportional tothe concentration of molecules n/V at that altitude, which in turn is proportional to thepressure.(a) Put these facts together to derive the barometric formula,
p
p0= exp
(−mgh
kBT
)
In this formula, p is the partial pressure of a gas at altitude h, and p0 is its partialpressure at sea level.
(b) Show that this formula can be rewritten in the form
p
p0= exp
(−Mgh
RT
)
where M is the molar mass of the molecule of interest.(c) Given that the partial pressure of oxygen at sea level is 0.21 atm, what is the par-
tial pressure at 0 ◦C at 920 m (the altitude of my house in Lethbridge)? At 1900 m(Val d’Isere, France)? At 3660 m (La Paz, Bolivia)?Note: Don’t forget that the SI unit of mass is the kg.
(d) For chemical species that have more than one isotopomer, the dependence of thepotential energy on mass leads to isotopic fractionation, with heavier isotopes stay-ing, on average, closer to the ground. Given that the abundances given in Appendix Gare sea-level abundances, what abundance would you predict for 13C16O2 at 20 000 m

P1: SFK Trim: 247mm × 174mm Top: 14.586mm Gutter: 23.198mm
CUUK1808-03 CUUK1808/Roussel 978 1 107 00678 2 October 29, 2011 12:52
30 Spectroscopy
1
b2a2
2c 2d
C
B
CB
B
A
A D
A
D
A
D
DA
D
B C B C
C
Figure 3.2 The conformations of a small peptide on a square lattice. The dark circles representhydrophobic residues, while the light circles represent hydrophilic residues.
(possibly the highest altitude from which viable bacteria have been recovered1)?Assume a uniform temperature of 0 ◦C.
(3) Protein folding is largely driven by the burial of hydrophobic amino acid residues (whatis left of the amino acid after the condensation reaction that makes a peptide bond)inside the protein, away from the solvent. A contact between a hydrophobic residue anda water molecule reduces the opportunities for the water to form hydrogen bonds orother energetically favorable contacts. There is therefore an energetic cost to a water–hydrophobic contact. Similarly, there is an energetic cost to a hydrophobic–hydrophiliccontact because the hydrophilic group loses opportunities for more favorable contactswith other polar groups (including the solvent). Flipping these statement on their heads,hydrophobic–hydrophobic contacts in a protein, which reduce the number of hydrophobic–water and hydrophobic–hydrophilic contacts, are energetically favorable. One very simplemodel for protein folding treats residues as beads connected by bonds of unit lengthplaced on a simple lattice.2 Consider, for example, a small peptide consisting of justfour residues (Figure 3.2). We represent hydrophobic residues by dark circles, while lightcircles represent hydrophilic residues. The bonds between residues are placed along edgesof the lattice, and the amino acid residues are placed on lattice points. We only count
1 D. W. Griffin, Aerobiologia 24, 19 (2008). 2 K. A. Dill et al., Protein Sci. 4, 561 (1995).

P1: SFK Trim: 247mm × 174mm Top: 14.586mm Gutter: 23.198mm
CUUK1808-03 CUUK1808/Roussel 978 1 107 00678 2 October 29, 2011 12:52
3.3 Classes of spectroscopy experiments 31
unique conformations, and would leave out any conformations that are just rotations ofany we have listed. You should be able to convince yourself that there are just five distinctconformations of the peptide on the lattice, illustrated in Figure 3.2. You might object thatconformations 2b and 2c look the same. Because the two ends of a protein are different –there is an amino group at one end of the protein and a carboxy group at the other – wecan tell residues A and D apart, even if they are derived from the same amino acid, and so2b (bent at B, which is nearest to A) and 2c (bent at C, which is nearest to D) are actuallydifferent.
Suppose that the energetic payoff for a hydrophobic–hydrophobic contact is −ε. Con-formation 1, the folded conformation, has one such contact, so its energy is E1 = −ε.Conformations 2a − d have no hydrophobic–hydrophobic contacts, so they are degeneratewith energy E2 = 0. The latter conformations are unfolded or, as they say in biochemistry,denatured.(a) Write an equation for the probability that the protein is in the denatured state.(b) A thermal denaturation curve shows the percentage of a protein in the unfolded state
as a function of temperature. In this case, we don’t know the value of ε, so definethe reduced temperature θ = kBT/ε, and draw the thermal denaturation curve asa function of θ . Note that these curves generally look best when plotted against alogarithmic temperature axis.
(c) At what reduced temperature does denaturation start to occur?(d) What is the minimum percentage of folded protein?
3.3 Classes of spectroscopy experiments
We can roughly divide spectroscopy experiments into three classes:
Absorption methods: In an absorption experiment, we measure the amount of lightabsorbed by a sample as a function of wavelength.
Emission methods: In emission spectroscopy, we measure the amount of light emitted bya sample, typically after the sample has been energized in some way (with photons,heat, electricity, etc.).
Scattering methods: Scattering experiments involve the study of photons that havecollided with molecules in the sample and been deflected, possibly with some loss orgain of energy.
In any given energy range, we can carry out all three types of experiments. For example,UV/visible spectroscopy usually refers to an absorption experiment. Fluorescence is anemission phenomenon in which molecules first absorb photons, lose some of the energythey absorbed, and then re-emit photons of lower energy in the UV/visible range. UV/visiblescattering spectroscopy is used as a medical diagnostic test to detect pathologies suchas cancers. Each type of spectroscopy gives us different information about the materialstudied.

P1: SFK Trim: 247mm × 174mm Top: 14.586mm Gutter: 23.198mm
CUUK1808-03 CUUK1808/Roussel 978 1 107 00678 2 October 29, 2011 12:52
32 Spectroscopy
Sample DetectorMonochromatorSource
Figure 3.3 Block diagram of a single-beam spectrometer.
3.4 Absorption spectroscopy
3.4.1 Absorption spectrometers
A simple absorption experiment is diagrammed in Figure 3.3. The light produced bya source (e.g. a lamp) first passes through a monochromator, which is a device thatselects one wavelength of light. Most commonly, a monochromator would be a diffractiongrating, and different wavelengths are selected by rotating the grating. The monochro-matic light passes through the sample, and the transmitted light is detected. If the sampleabsorbs light at a given wavelength, then fewer photons reach the detector than wouldotherwise be the case. A spectrometer of this design would be called a single-beam spec-trometer. Single-beam spectrometers are simple, so they are inexpensive and relativelysturdy.
There are two basic types of experiments that can be carried out by a single-beamabsorption spectrometer. The simplest type of experiment involves just taking readingsat a fixed wavelength. This can be useful in quantifying the amount of substance in asolution, as we will see shortly. The second type of experiment is the measurement of thelight intensity as the wavelength is varied. A graph of intensity vs. wavelength is called aspectrum.
The problem with single-beam spectrometers is that changes in the signal observed atthe detector can have a number of causes. We’re interested in absorption of photons bythe sample. However, the intensity of the source depends on wavelength, and the detectorusually responds more strongly to some wavelengths than to others. Moreover, in solution,the solvent may have an absorption spectrum of its own, which may not be of great interestto us. The solution to these problems is to acquire the spectrum of a blank, which is asample cuvette identical to the one to be used for the sample, but filled with the pure solvent.The spectrum of the blank is then subtracted from the sample spectrum, which in principlegives us the spectrum of the solute(s). The subtraction is typically done automatically bythe spectrometer control software.
Another way to solve the problems outlined above is to use a dual-beam spectrometer(Figure 3.4). In a dual-beam spectrometer, the monochromated light is split into two beamsof equal intensity using a beam splitter. One beam passes through the sample, while the otherpasses through the blank. The signals from the two detectors are subtracted in hardware bya comparator circuit, and the difference signal is output. Dual-beam spectrometers have oneimportant advantage over single-beam machines: variations in source intensity with timeare automatically compensated for. In some designs, rotating mirrors or other mechanical

P1: SFK Trim: 247mm × 174mm Top: 14.586mm Gutter: 23.198mm
CUUK1808-03 CUUK1808/Roussel 978 1 107 00678 2 October 29, 2011 12:52
3.4 Absorption spectroscopy 33
Comparator
Beamsplitter
Mirror
MonochromatorSource
DetectorBlank
DetectorSample
Figure 3.4 Dual-beam spectrometer.
Diodearray
Diffractiongrating
Source Sample
Figure 3.5 The diode array spectrometer.
devices are used to alternately send the transmitted signals from the blank and sample toa single detector. In this case, the subtraction is made between signals that arrive at thedetector at different times. It is then not necessary to have two identical detectors, andtherefore problems having to do with a relative drift in the responses of the detectors asthey age are avoided.
Both single- and dual-beam spectrometers have been around for a long time. A morerecent technology is the diode array spectrometer (Figure 3.5), which can be thought ofas many single-beam spectrometers working in parallel. In a diode array spectrometer,polychromatic radiation (light containing a range of wavelengths) is sent through thesample. A diffraction grating then separates the transmitted light into its components,which are directed onto a diode array detector. A diode array is the same technology youwould find in a digital camera, namely an array of detectors that can be read individually bya computer. Different wavelengths are sent to different parts of the diode array. The entirespectrum is acquired at once, so diode array spectrometers are extremely fast. Moreover,they don’t have any moving parts and they tend to be small and sturdy. Typical units fit inthe palm of your hand. This makes them ideal for field work, and also for integration intoother instruments such as liquid chromatographs.

P1: SFK Trim: 247mm × 174mm Top: 14.586mm Gutter: 23.198mm
CUUK1808-03 CUUK1808/Roussel 978 1 107 00678 2 October 29, 2011 12:52
34 Spectroscopy
–0.05
0
0.05
0.1
0.15
0.2
0.25
0.3
0.35
0.4
2600 2700 2800 2900 3000 3100
A
ν~/cm–1
Figure 3.6 Part of the gas-phase infrared spectrum of HCl. This part of the spectrum corresponds tothe v = 0 to v = 1 vibrational transition, with associated rotational transitions. This spectrum wasacquired on a Fourier transform instrument, which works on a different principle than the absorptionspectrometers discussed here, although the interpretation of the spectrum is not affected. Thanks toKris Fischer for help in acquiring this spectrum.
3.4.2 Absorption spectra
Let’s briefly review what happens in an absorption spectroscopy experiment. Photons passthrough a sample, and if their energy matches the spacing between two energy levels of themolecule, they may then be absorbed. There are additional conditions for absorption calledselection rules so that not every possible absorption is observed, but for now, we just need tofocus on the energetics of the absorption process. Since molecules have distinct electronic,vibrational and rotational energy levels, molecular spectra should consist of a set of narrowabsorption lines. In the gas phase, this is exactly what we observe. For example, have alook at Figure 3.6, which shows part of the gas-phase IR spectrum of HCl. We will interpretthis spectrum in more detail shortly, but for now just notice the narrow lines. These narrowlines are not a feature only of IR spectra. For small molecules, we would see similarlynarrow lines in a high-resolution gas-phase UV/visible spectrum, or in any other gas-phasespectroscopy experiment with equipment of appropriate resolution.
In solution though, it’s a different story. The energy levels of a molecule depend on itsgeometry. In solution, frequent collisions between molecules compress and bend bonds. Asa result, at any given time, the collection of molecules present in solution all have slightly

P1: SFK Trim: 247mm × 174mm Top: 14.586mm Gutter: 23.198mm
CUUK1808-03 CUUK1808/Roussel 978 1 107 00678 2 October 29, 2011 12:52
3.4 Absorption spectroscopy 35
0
0.05
0.1
0.15
0.2
0.25
0.3
0.35
300 400 500 600 700 800
A
λ/nm
Figure 3.7 UV/visible spectrum of KMnO4 dissolved in water.
different energy levels. The result is that the nice spectral lines typically observed in thegas phase are replaced by broad bands. Figure 3.7 shows the UV/visible spectrum of asolution of potassium permanganate in water. The difference between this spectrum andthe gas-phase spectrum of HCl is obvious to the eye, and it’s not just a question of theresolution of the instrument.
3.4.3 Vibrational spectroscopy
As previously noted, an IR spectrum involves a combination of vibrational and (lower-energy) rotational transitions. You will also recall that, typically, only the vibrationalground state is occupied, but that many rotational states can be occupied at room tempera-ture. Conventionally, the vibrational quantum numbers are denoted v, while the rotationalquantum numbers are denoted J . Both are numbered starting from zero. For the spectrumof HCl shown in Figure 3.6, we are observing a single vibrational transition, from v = 0 tov = 1, with accompanying rotational transitions. The spectrum has a rough mirror-imagesymmetry. The lines in the left half of the spectrum, at lower wavenumbers (transition ener-gies) correspond to transitions in which the rotational quantum number decreases, whilethe lines in the right half of the spectrum correspond to transitions in which the rotationalquantum number increases. It turns out to be possible to relate the rotational fine structureto the bond length. However, this is only feasible for small molecules in the gas phase, sothis topic is of limited interest to biochemists and we will omit it.
It is however useful to know a little bit of vibrational spectroscopy. For the purpose ofanalyzing the vibrational spectrum, we can treat molecules as being made of balls (atoms)and springs (bonds), a description known as the harmonic oscillator approximation. The

P1: SFK Trim: 247mm × 174mm Top: 14.586mm Gutter: 23.198mm
CUUK1808-03 CUUK1808/Roussel 978 1 107 00678 2 October 29, 2011 12:52
36 Spectroscopy
vibrational energy levels of a harmonic oscillator are given by
Ev = hν0
(v + 1
2
)(3.6)
where ν0 is a constant known as the natural frequency. Stiffer chemical bonds or, in general,vibrational motions (on which more below) correspond to higher natural frequencies. Noteonce again the phenomenon of zero-point energy: there is a minimum vibrational energyof 1
2hν0. More importantly, from the point of view of analyzing the spectrum, the energylevels of a harmonic oscillator are equally spaced by hν0. In a real molecule, this will onlyapproximately be true, but it does tell us where to look for additional lines in the spectrum;given that the v = 0 to v = 1 spectrum is centered near 2900 cm−1, then the v = 0 tov = 2 spectrum should be centered near 2 × 2900 cm−1 = 5800 cm−1, the v = 0 to v = 3spectrum should be found near 3 × 2900 cm−1 = 8700 cm−1, and so on. If we examinethe spectrum of HCl over a very wide range of wavenumbers, we indeed find spectra thatlook qualitatively like the one shown in Figure 3.6 in the expected regions, and nothing inbetween. This is how we know that the assignment of this vibrational band to the v = 0 tov = 1 transition is correct.
You may have noticed that each line in the spectrum has a twin: a tall line is accom-panied by a shorter copy at slightly lower wavenumber. This is because chlorine has twostable isotopes: 35Cl (abundance 76%) and 37Cl (abundance 24%). The taller lines aretherefore associated with the H35Cl isotopomer, and the shorter lines with the H37Cl iso-topomer. The shift in wavenumber between the two isotopes can be rationalized basedon the difference in mass; all other things being equal, heavier species should vibratemore slowly, i.e. have smaller natural frequencies. Given the difference in natural fre-quency, when analyzing the spectrum, we need to analyze the data for the two isotopomersseparately.
There turns out to be a selection rule for asymmetric molecules that forbids a purevibrational transition, i.e. one with �J = 0. The central lines in the spectrum for eachisotopomers thus correspond to the rotational transitions �J = ±1. The average of thesetwo lines would be equivalent to a pure vibrational transition, with �E = hν0.
Example 3.3 Determining the natural frequency The center of the spectrum containsthe following lines:
ν/cm−1 A
2863.3 0.122865.3 0.222904.4 0.122906.5 0.22
The two lines at slightly lower wavenumbers with the lower absorbances belong to H37Cl,while the two other lines belong to H35Cl. I will show calculations for H35Cl, and leave theanalysis of H37Cl to an exercise.

P1: SFK Trim: 247mm × 174mm Top: 14.586mm Gutter: 23.198mm
CUUK1808-03 CUUK1808/Roussel 978 1 107 00678 2 October 29, 2011 12:52
3.4 Absorption spectroscopy 37
The average of the two central lines gives ν0, the natural frequency expressed as awavenumber:
ν0 = 1
2
(2865.3 + 2906.5 cm−1
) = 2885.9 cm−1
Given the relationship between wavelength and frequency (Equation 2.1) and the fact thatwavenumber is just the reciprocal of wavelength, we have
ν0 = cν0 = (2.997 924 58 × 108 m s−1)(2885.9 cm−1)(100 cm m−1)
= 8.6517 × 10¹³ Hz
In molecules with more than two atoms, there are several ways in which a moleculecan vibrate, which we call vibrational modes. A water molecule, for example, has threedifferent vibrational modes, which can be described as follows:
(1) The bond angle can vibrate, i.e. the angle will alternately expand and contract aroundits equilibrium value.
(2) The molecule can undergo a symmetric stretch in which the two bonds stretch andcontract together.
(3) The molecule can undergo an antisymmetric stretch in which one bond stretches whilethe other contracts, followed by a reversal in which the bond that was stretchingcontracts, and vice versa.
Each of these modes would have its own vibrational frequency.In general, we can calculate the number of vibrational modes of a molecule as follows.
Each atom in a molecule can move in three different ways (corresponding to the threeCartesian axes in space), so a molecule has a total of 3N modes of motion. Three of thosemodes correspond to translational motion of the whole molecule. A molecule also hasrotational modes. A non-linear molecule has three rotational modes, again correspondingto the three Cartesian axes. A linear molecule, however, only has two rotational modes;if we pick a coordinate system with the molecule lined up along the z axis, there arerotational modes associated with rotation around the x and y axes, but turning the moleculearound the z axis doesn’t actually move anything. The number of modes of motion thatare not translational or rotational are the vibrational modes. Thus, we have the followingformulas:
Number of vibrational modes ={
3N − 6 (non-linear molecules)3N − 5 (linear molecules)
Not all of these vibrational modes will show up in an infrared absorption experiment,because of an additional selection rule: Vibrational absorption is only possible if the dipolemoment of the molecule changes during vibration. The dipole moment p is a vectorialquantity, calculated by
p =∑
i
qiri

P1: SFK Trim: 247mm × 174mm Top: 14.586mm Gutter: 23.198mm
CUUK1808-03 CUUK1808/Roussel 978 1 107 00678 2 October 29, 2011 12:52
38 Spectroscopy
where qi is the charge of atom i and ri is its position vector. The sum is taken over all atoms.The dipole moment is a time-dependent quantity since atoms move as a result of molecularvibration. In some cases, a particular vibrational mode has no effect on the dipole moment.For example, oxygen and nitrogen have zero dipole moments, and their vibration does notchange that. Accordingly, these molecules do not absorb in the infrared. For heteronucleardiatomics like HCl, vibration changes the distance between the atoms and thus the dipolemoment. Accordingly, HCl does have a vibrational spectrum. In polyatomic molecules, wehave to look at each vibrational mode. Some will satisfy the selection rule and be IR active,while others will not. All three vibrational modes of water, for example, are IR active.
If we turn our attention to carbon dioxide for a moment, we see that it should have3(3) − 5 = 4 vibrational modes. These modes are a symmetric stretch, an antisymmetricstretch, and two degenerate bending modes. Why two bends? Imagine lining up the moleculealong the z axis. It can be bent in the xz plane, and in the yz plane. Of these modes, thesymmetric stretch is IR inactive, while the other three modes are IR active. The three activemodes make CO2 a greenhouse gas. Of course, so is water, and there is a lot more of thatin the atmosphere than there is of carbon dioxide. Why then do we worry so much aboutcarbon dioxide? There are several reasons. First and foremost, by adding a lot of carbondioxide to the atmosphere, we are disturbing the equilibrium between solar energy reachingthe planet, infrared emission from the surface and the greenhouse effect. Even a relativelysmall disturbance to this equilibrium will have significant effects over time, particularlysince warming tends to feed on itself; a small amount of warming due to increased carbondioxide will lead to more water vapor in the air, which will magnify the initial greenhouseeffect of the carbon dioxide itself. Melting of the arctic permafrost will allow additionalcarbon dioxide to reach the atmosphere due to the decomposition of previously frozenorganic matter. These are just a couple of the many complex feedbacks that will resultin global warming. There are mitigating effects as well (e.g. increased cloud cover, whichreflects some of the Sun’s light back into space), but on the whole, the forecast is for warmerweather. The other reason that carbon dioxide is so important is that it absorbs stronglyin a wavenumber range where water doesn’t absorb, specifically in a band from 2250 to2400 cm−1. It therefore plugs a hole in the planet’s emission spectrum where quite a bit ofradiation would otherwise be lost to space.
Exercise group 3.2
(1) The central lines in the rotation–vibration spectrum of H37Cl are at 2863.3 and2904.4 cm−1. Determine the natural frequency of H37Cl.
(2) How many normal modes of vibration would a methane molecule have?(3) The normal modes of HCN can be roughly described as follows:
� H–C stretching� C–N stretching� two degenerate bending modes(a) Which of these modes would you expect to be IR active?

P1: SFK Trim: 247mm × 174mm Top: 14.586mm Gutter: 23.198mm
CUUK1808-03 CUUK1808/Roussel 978 1 107 00678 2 October 29, 2011 12:52
3.4 Absorption spectroscopy 39
(b) The bending modes have a fundamental frequency (in wavenumber equivalents) of946 cm−1. What is the ratio of HCN molecules in the first excited state relative to theground state for this mode of motion at 20 ◦C?
3.4.4 Electronic spectra
Electronic (UV/visible) spectroscopy will involve a combination of electronic, vibrationaland rotational transitions. Because we will typically carry out these experiments in solution,the vibrational bands are often widened to the point where even the vibrational structureis lost. Rotational structure is never observed in solution-phase UV/visible spectroscopy.First and foremost, UV/visible spectra give us information about the spacing betweenelectronic energy levels. In the spectrum of KMnO4, for example (Figure 3.7), we seetwo transitions from the ground electronic state, one with maximum intensity at 311 nm,and the other with maximum intensity at 526 nm. (We typically use the point of maximumintensity to characterize UV/visible bands, even though this involves a mixture of electronicand vibrational excitation.) These wavelengths can be converted to electronic energy levelspacings between the ground state and two of the electronic excited states. We can thus startto build the energy level diagram of the permanganate ion. (Potassium ions don’t absorb inthe UV/visible range.)
Example 3.4 Electronic energy levels of the permanganate ion Energy levels ofmolecules are given in many different kinds of units, depending on the application. Often,electronic energy levels are given in electron-volts (eV), a convenient unit when dealingwith phenomena on the molecular scale. Our two transition energies for the permanganateion are
E1 = hc
λ= (6.626 068 8 × 10⁻³⁴ J Hz−1)(2.997 924 58 × 108 m s−1)
526 × 10−9 m= 3.78 × 10⁻¹⁹ J
≡ 3.78 × 10⁻¹⁹ J
1.602 176 46 × 10−19 J eV−1= 2.36 eV
E2 = hc
λ= (6.626 068 8 × 10⁻³⁴ J Hz−1)(2.997 924 58 × 108 m s−1)
311 × 10−9 m= 6.39 × 10⁻¹⁹ J
≡ 6.39 × 10⁻¹⁹ J
1.602 176 46 × 10−19 J eV−1= 3.99 eV
There is therefore one excited state about 2.36 eV above the ground state, and another3.99 eV above ground. Note that we can’t be sure that there aren’t other electronic energylevels in this energy range that we haven’t observed. For example, if two electronic states arevery close in energy, we wouldn’t be able to tell them apart. Moreover, there are selectionrules for electronic spectroscopy that might make some states inaccessible in a simpleabsorption experiment.

P1: SFK Trim: 247mm × 174mm Top: 14.586mm Gutter: 23.198mm
CUUK1808-03 CUUK1808/Roussel 978 1 107 00678 2 October 29, 2011 12:52
40 Spectroscopy
v =3
state
v=0
v =0
stateVibrational
Ground
Exc
ited
v =1
v =2
Electronic
Figure 3.8 Sketch of the electronic/vibrational energy level of the permanganate ion, with somepossible transitions shown.
In many cases, solution UV/visible bands are broadened to the point where vibrationaltransitions are completely obscured. In others, KMnO4 being an example, we can see vibra-tional structure in the UV/visible spectrum. These combined vibrational and electronic orvibronic transitions are particularly clearly resolved in the lower-energy band of the spec-trum of KMnO4, allowing us to recover the vibrational frequency of one of the vibrationalmodes of the permanganate ion. To understand what happens in this experiment, considerFigure 3.8, which sketches the relevant energy levels. Note that, at room temperature, allof the molecules should be starting out in the ground electronic and vibrational state, asshown in the figure. Since the vibrational energy levels of a given electronic state areroughly equally spaced, the difference between two adjacent transition energies (the arrowsin Figure 3.8, corresponding to the vibrational bands in the spectrum) is the vibrationalenergy level spacing of the excited state.
Example 3.5 Natural vibrational frequency in permanganate The following are thewavelengths of the vibrational bands associated with the transition to the 2.36 eV excitedelectronic state: 507, 526, 546 and 566 nm. Converted to energies, these transitions occurat 3.92 × 10⁻¹⁹, 3.78 × 10⁻¹⁹, 3.64 × 10⁻¹⁹ and 3.51 × 10⁻¹⁹ J. The differences betweenthese transition energies should give us the vibrational spacing. Subtracting adjacent termsin this set of transition energies, we get 1.4 × 10⁻²⁰, 1.4 × 10⁻²⁰ and 1.3 × 10⁻²⁰ J. Theaverage vibrational spacing is therefore 1.36 × 10⁻²⁰ J. Note that I kept extra digits in mycalculator through the course of this calculation, and used the standard deviation from themean (7 × 10⁻²² J) to determine the number of significant figures in the final answer.
From the relationship between the energy level spacing for a harmonic oscillator andthe natural frequency, we have
ν0 = 1.36 × 10⁻²⁰ J
6.626 068 8 × 10⁻³⁴ J Hz−1= 2.05 × 10¹³ Hz.
The vibrational selection rules for vibronic transitions are different from those for purevibrational (or rotation–vibration) transitions. The result is that vibrational transitions that

P1: SFK Trim: 247mm × 174mm Top: 14.586mm Gutter: 23.198mm
CUUK1808-03 CUUK1808/Roussel 978 1 107 00678 2 October 29, 2011 12:52
3.4 Absorption spectroscopy 41
would be forbidden in vibrational spectroscopy are often observed in UV/visible spectra.Again, KMnO4 provides a good example. The permanganate anion has 3(5) − 6 = 9 vibra-tional modes. It turns out that the vibrational mode observed in the UV/visible spectrumis the symmetric stretch of the tetrahedral MnO−
4 anion, an IR inactive mode. UV/visiblespectroscopy is not the only spectroscopy that allows us to study IR-forbidden vibrationaltransitions; these may also show up in fluorescence spectra (on which more below) and inRaman spectra (a scattering method we will not study), among other spectroscopies. Whatthis shows us is that various spectroscopies offer complementary information, so if youwant to study the structure of a molecule, you often have to pull together information fromseveral spectroscopic techniques.
3.4.5 Beer–Lambert law
We now turn to the quantitation of the amount of light absorbed by samples. The absorptionof a single photon is a probabilistic event: in order to be absorbed, it has to meet a moleculewith the correct energy level spacing. As a photon passes through a thin slice of the sampleof thickness dx, there is some probability p dx that this will occur and that the photonwill be absorbed. Here, p is the probability of absorption per unit length. If we have alot of photons, then we can convert this probability for a single photon into a number ofphotons absorbed: the number of photons will change by dn = −np dx or, since the numberof photons is proportional to the intensity of the light, dI = −Ip dx. We can solve thisequation for I (x), where x is the distance traveled through the medium, by separation ofvariables. First, rearrange to put all terms that depend on I on one side of the equation,and all terms that depend on x on the other:
dI
I= −p dx
Note that the quantity on the left-hand side is the fractional change in intensity over adistance dx. Now we integrate both sides of this equation to add up the fractional changesin intensity: ∫ I (x)
I0
dI ′
I ′ = −p
∫ x
0dx ′
The primed variables are just there to distinguish the variables inside the integrals fromthose appearing in the limits of integration. The limits of integration correspond to anintensity of I0 as the beam enters the medium at x = 0, and to an intensity I (x) at a depthx. Evaluating the integrals, we get
ln I ′∣∣I (x)I0
= −p x ′∣∣x0
∴ ln I (x) − ln I0 = ln
(I (x)
I0
)= −p(x − 0) = −px
∴ px = − ln
(I (x)
I0
)= ln
(I0
I (x)
)

P1: SFK Trim: 247mm × 174mm Top: 14.586mm Gutter: 23.198mm
CUUK1808-03 CUUK1808/Roussel 978 1 107 00678 2 October 29, 2011 12:52
42 Spectroscopy
(If you have trouble following the manipulations of the logarithms here, review the rulesin Appendix H.) In a spectroscopy experiment, we measure the intensity of light that istransmitted through the sample. If the path length through the sample is �, this would beI (�):
p� = ln
(I0
I (�)
)
Moreover, we usually compare this intensity to that of the incident radiation, I0. You cansee that the equation we have arrived at contains the ratio I0/I (�), which is very convenient.By convention, the absorbance is defined as
Aλ = log10
(I0
I (�)
)= ln
(I0
I (�)
)/ ln 10 (3.7)
where the subscript λ indicates that the absorbance is measured at a particular wavelength.Thus we have
Aλ = p�/ ln 10
As for the constant p, recall that it gives the probability per unit length that a photon isabsorbed. This quantity must be proportional to the concentration of the absorbing species:If we double the concentration, we double the probability that a photon will encountera molecule. Thus, p = qc, where c is the concentration of absorbers, and q is anotherconstant. If combine q with the logarithm, we get
Aλ = ελc�
This equation is known as the Beer–Lambert law. The constant ελ is called the molarabsorption coefficient. Path lengths are usually measured in cm and concentrations inmol L−1, so ελ has units of L mol−1cm−1 since A is dimensionless. Note that the molarabsorption coefficient depends on wavelength, although it is common for people to reportjust one value, namely the value at the wavelength of maximum absorbance. Another com-mon practice is to report specific absorption coefficients rather than the molar coefficients,the difference between the two being that the specific coefficient relates to concentrations ing L−1 rather than in mol L−1. Finally note that spectroscopic studies in which we specificallymeasure or apply the relationship between absorbance and concentration are sometimesdescribed as spectrophotometry, and the instrument used for this purpose would thenbe referred to as a spectrophotometer. In practice, almost any spectrometer can be usedas a spectrophotometer, although you may occasionally run into pure spectrophotome-ters, i.e. machines that record data at a single wavelength selected ahead of time by theexperimentalist.
Example 3.6 Absorbance and the molar absorption coefficient Ferredoxin is a redoxenzyme found in a variety of organisms. Ferredoxin extracted from spinach has an absorp-tion maximum at 485 nm with a molar absorption coefficient of 1.2 × 10⁴ L mol−1cm−1.What absorbance would you predict at 485 nm for a 60 μmol L−1 solution in a standard

P1: SFK Trim: 247mm × 174mm Top: 14.586mm Gutter: 23.198mm
CUUK1808-03 CUUK1808/Roussel 978 1 107 00678 2 October 29, 2011 12:52
3.4 Absorption spectroscopy 43
cuvette with a 1 cm path length, and what fraction of the photons of this wavelength passingthrough the sample would be absorbed?
The first part is a straightforward application of the Beer–Lambert law:
A485 = ε485c� = (1.2 × 10⁴ L mol−1cm−1)(60 × 10−6 mol L−1)(1 cm) = 0.72
The absorbance is defined by Equation (3.7):
log10
(I0
I (�)
)= 0.72
∴ I0
I (�)= 100.72 = 5.25
∴ I (�)
I0= 1
5.25= 0.191
About 19% of the photons would get through, so 100 − 19% = 81% would be absorbed.
What if there is more than one substance absorbing at a given wavelength? If you lookback to our derivation of the Beer–Lambert law, you will see that this would affect thephoton absorption probability p. There would be some probability of absorption by eachspecies absorbing at the wavelength of interest. Thus, we would get
Aλ = �∑
i
ελ,ici (3.8)
where the sum is taken over all species that absorb at wavelength λ. We can play allkinds of tricks with this equation. The following example shows how measurements of theabsorbance at different wavelengths can be used to calculate concentrations of mixtures ifwe know the molar absorption coefficients of the components.
Example 3.7 Concentrations of mixtures from spectroscopic measurements The molarabsorption coefficients at 414 and 425 nm of the oxidized and reduced forms of cytochromeb5 from Tetrahymena pyriformis are as follows:3
ελ/105 L mol−1cm−1
414 nm 425 nmOxidized 1.403 0.593Reduced 0.949 2.215
During a purification procedure, a spectrum of a solution containing cytochrome b5 isobtained, and the following absorbances are determined in a standard 1 cm cuvette: A414 =0.25 and A425 = 0.18. We would like to know if the enzyme is mostly in the oxidized ormostly in the reduced form, as this might affect further purification steps. To determine the
3 Inferred from the data in H. Fukushima, S. Umeki, T. Watanabe and Y. Nozawa, Biochem. Biophys. Res. Commun. 105, 502(1982).

P1: SFK Trim: 247mm × 174mm Top: 14.586mm Gutter: 23.198mm
CUUK1808-03 CUUK1808/Roussel 978 1 107 00678 2 October 29, 2011 12:52
44 Spectroscopy
concentrations of the two forms, we use Equation (3.8) at each of the two wavelengths:
A414 = 0.25 = ε414,ox�[ox] + ε414,red�[red]
= (1.403 × 10⁵ L mol−1)[ox] + (9.49 × 10⁴ L mol−1)[red]
A425 = 0.18 = ε425,ox�[ox] + ε425,red�[red]
= (5.93 × 10⁴ L mol−1)[ox] + (2.215 × 10⁵ L mol−1)[red]
These are two equations in the two unknowns [ox] and [red]. If we solve these two equations,we get
[ox] = 1.5 × 10⁻⁶ mol L−1,
[red] = 4.1 × 10⁻⁷ mol L−1.
A quick note on solving equations: you can solve these equations by hand using techniquesyou would have learned in high school. However, most of us now have powerful calculatorsthat can solve these problems for us, if only we learn to use them properly. I stronglysuggest that you spend a bit of time with your calculator’s manual to learn to use it as atool to solve equations. In the long run, this will save you a lot of time, particularly sincesolving equations in multiple unknowns is an error-prone process.
Getting back to our problem, we see that this sample is mostly in the oxidized form,although some is still in the reduced form. If, for example, the next purification steprequired the protein to be in the oxidized form, we could add an oxidizing agent to shift theremaining reduced protein to the oxidized form, and we could check if we have succeededby taking another spectrum and repeating this calculation. We might also want to knowthe total concentration of cytochrome b5, which is just the sum of these two values, so1.9 × 10−6 mol L−1.
Exercise group 3.3
(1) Spectrophotometry is often used to follow chemical reactions in time. Because instru-ment response can become non-linear at higher absorbances, it’s often a good ideato keep the absorbance below 1. Suppose that you are studying an enzyme that con-verts NADH to its reduced form, NAD+. NADH has a molar absorption coefficient of6220 L mol−1cm−1 at 339 nm, while NAD+ doesn’t absorb at this wavelength. What isthe maximum concentration of NADH you should use in order to keep the absorbanceat 339 nm below 1 in a 1 cm cuvette?
(2) In protein science, instead of giving the molar absorption coefficient, the absorbanceof a 1% (by weight) solution is sometimes given. This quantity, denoted A1%, is aparticularly useful way to give the absorptivity when the molar mass of the protein isnot known. If we do know the molar mass, then we can determine the molar absorptioncoefficient from A1%.

P1: SFK Trim: 247mm × 174mm Top: 14.586mm Gutter: 23.198mm
CUUK1808-03 CUUK1808/Roussel 978 1 107 00678 2 October 29, 2011 12:52
3.4 Absorption spectroscopy 45
(a) The molar mass of alkaline phosphatase from calf intestine is 140 000 g mol−1. (Abiochemist would say either 140 000 Da or 140 kDa. The dalton (Da) is equal toa gram per mole.) Calculate the concentration (in mol L−1) of a 1% solution ofalkaline phosphatase in water at 25 ◦C.Hint: Assume we have 1 L of water to which enough alkaline phosphatase has beenadded to make a 1% solution.
(b) A1% always refers to the absorbance in a cell with a path length of 1 cm. Forcalf-intestine alkaline phosphatase,4 A1%
278 nm = 7.6. Calculate the molar absorptioncoefficient.
(3) When we want to determine the molar absorption coefficient accurately, we typicallymeasure the absorbance at several concentrations, then plot the results to verify thatthe Beer–Lambert law is satisfied. If it is, we should get a straight line passing throughthe origin. This is not always the case. On occasion, we encounter a substance whoseA vs. c curve at fixed wavelength is curved.(a) Suppose that we blindly calculated the molar absorption coefficient by ε = A/(c�)
at each concentration in a case where the A vs c relationship is non-linear. Whatwould we see in the results? Would the ε values calculated by this method beuseful?
(b) Kageyama has developed a method for determining the concentration of uricacid in blood and urine.5 The method involves a series of chemical reac-tions that quantitatively convert uric acid to a yellow product (3,5-diacetyl-1,4-dihydrolutidine). The absorbance at 410 nm is then recorded. He recorded the fol-lowing data, where [U] represents the concentration of uric acid in the calibrationsample:
[U]/mg L−1 50 100 150 200A410 0.14 0.271 0.406 0.545
If you plot these data, you will see that they fit a straight line through the originbeautifully.(i) The absorbance is due to the yellow product. Assuming 1:1 conversion of
uric acid to the yellow product, calculate the concentration of yellow prod-uct, in mol L−1, in each of the samples. The molar mass of uric acid is168.110 g mol−1.
(ii) If you plot A410 vs the concentration of yellow product, the slope should beε�. As usual, � = 1 cm. Get the slope of the graph by linear regression, andreport the molar absorption coefficient.Note: This will not be the last time we need to do a regression in this course.You should learn how to use your calculator to do regressions.
4 M. Fosset, D. Chappelet-Tordo and M. Lazdunski, Biochemistry 13, 1783 (1974).5 N. Kageyama, Clin. Chim. Acta 31, 421 (1971).

P1: SFK Trim: 247mm × 174mm Top: 14.586mm Gutter: 23.198mm
CUUK1808-03 CUUK1808/Roussel 978 1 107 00678 2 October 29, 2011 12:52
46 Spectroscopy
(4) Chlorophyll a and b have overlapping spectra. Their specific absorption coefficients at643 and 660 nm in diethyl ether solution are as follows:
ελ/L g−1cm−1
643 nm 660 nmChlorophyll a 16.3 102Chlorophyll b 57.5 4.50
(a) A sample obtained from 0.104 g of a plant leaf extracted using 100 mL of etherand then diluted fivefold gave the following data: A643 = 0.203 and A660 = 0.625.Determine the concentrations of chlorophyll a and b in the samples analyzed, thencalculate the masses of the two chlorophylls in the original sample, and finallyreport the mass of each chlorophyll per unit mass of leaf in mg g−1. The latterstep normalizes the data to the amount of leaf material present. This facilitatescomparisons between samples.
(b) Convert the specific absorption coefficients to molar absorption coefficients. Themolar mass of chlorophyll a is 893.50 g mol−1, while the molar mass of chlorophyllb is 907.49 g mol−1.
3.5 Fluorescence
Consider a molecule that has been excited by absorption of a UV photon. As we havepreviously seen, this is an amount of energy normally associated with electronic transitions.Moreover, electronic excitation is usually accompanied by vibrational excitation. Whathappens to the energy gained by the molecule in the absorption process? Conceivably,some or all of it could be immediately re-emitted as a UV photon. Commonly, however,the vibrational excitation is dissipated first. This can happen by a number of mechanisms:redistribution to other vibrational modes, emission of an infrared photon or transfer toother molecules during collisions. Whichever of these mechanisms happens to take awaythe vibrational energy, the net effect is the same: the molecule ends up in the vibrationalground state of an electronically excited state. It may then go back to the ground electronicstate by emitting a photon, which will necessarily be lower in energy than the photon itoriginally absorbed. This emission process is called fluorescence. An energy level diagramshowing one possible set of transitions for a fluorescent molecule is shown in Figure 3.9.
Fluorescence spectrometers (Figure 3.10) contain essentially the same parts as absorp-tion spectrometers (Figure 3.3), but these parts are arranged differently. Fluorescent emis-sion is isotropic, meaning that the photons are emitted in every direction. That being thecase, in order to avoid interference from the light transmitted through the sample, weplace the detector in a fluorescence experiment at 90◦ to the incident beam. Furthermore,we need two monochromators in a fluorescence spectrometer, one for the exciting radia-tion, and one for the fluorescent emission. In some fluorescence spectrometers, both theexcitation and emission wavelengths can be scanned. Scanning the excitation wavelength

P1: SFK Trim: 247mm × 174mm Top: 14.586mm Gutter: 23.198mm
CUUK1808-03 CUUK1808/Roussel 978 1 107 00678 2 October 29, 2011 12:52
3.5 Fluorescence 47
Absorption
states
Groundelectronicstate
Excitedelectronic
Fluorescence
}
}state
Vibrational
Figure 3.9 Energy level diagram for a fluorescent molecule. Absorption takes us from the groundelectronic and vibrational state to an excited state which, in general, will be both electronicallyand vibrationally excited. The wavy arrow indicates vibrational de-excitation. Fluorescence is thesubsequent emission process. It takes the molecule back to the ground electronic state, but may leavethe molecule vibrationally excited, as shown.
Excitationmonochromator
monochromatorEmission
Source
Sample
Detector
Figure 3.10 Block diagram of a fluorescence spectrometer.
generates a spectrum that is essentially identical to the absorption spectrum, provided anappropriate emission wavelength is selected for observation. A true fluorescence spectrumobtained by scanning the emission wavelength is shifted to longer wavelengths (lowerenergies) and is often roughly a mirror image of the absorption spectrum. Why? In theabsorption process, the molecule goes from the ground-electronic/ground-vibrational stateto an excited-electronic/excited-vibrational state corresponding to any one of the possi-ble values of the vibrational quantum number v. In the fluorescent emission process, the

P1: SFK Trim: 247mm × 174mm Top: 14.586mm Gutter: 23.198mm
CUUK1808-03 CUUK1808/Roussel 978 1 107 00678 2 October 29, 2011 12:52
48 Spectroscopy
molecule starts out in the excited-electronic/ground-vibrational state and goes to a ground-electronic/excited-vibrational state, also corresponding to any one of the possible valuesof v. Provided the vibrational levels of the ground and excited electronic states are similar,this produces a mirror-image spectrum. If the fluorescence spectrum turns out not to looklike a mirror-image of the absorption spectrum, we then know that the excited state has adifferent set of vibrational levels than the ground state, which would imply a significantlydifferent excited-state geometry. In other words, the absorption and fluorescence spectratogether give us structural information about the electronically excited state.
Some of the most important applications of fluorescence use the fact that emission occursat a longer wavelength than excitation. In imaging applications, we can, for instance, taga cellular component with a fluorescent marker, and then filter out both the scatteredexciting radiation and other light emanating from the cell (e.g. fluorescence from othersources at different wavelengths), allowing us to see where in the cell a tagged moleculelocalizes, or perhaps to track its movements through the cell. These techniques havebecome particularly powerful due to the discovery of green fluorescent protein (GFP) andthe development of other-colored fluorescent proteins (yellow fluorescent protein, YFP;enhanced blue fluorescent protein, EBFP; enhanced cyan fluorescent protein, ECFP, etc.).Because of the modularity of protein structure, it is often possible to add a sequence forone of these fluorescent proteins to the end of a gene and to get an expressed protein thatboth fulfills its original function and is fluorescent in a desired spectral range. The originalisolation of GFP from a jellyfish by Osamu Shimomura and subsequent contributions to thedevelopment of fluorescent proteins into a versatile imaging technology by Martin Chalfieand Roger Tsien were recognized by the award of the 2008 Nobel Prize in Chemistry tothese three scientists.
3.5.1 Fluorescence quenching and energy transfer
The part of a molecule responsible for fluorescence is often relatively simple. For example,the amino acids tryptophan, tyrosine and phenylalanine are fluorescent. In GFP on theother hand, a triplet of amino acids is responsible for fluorescence. A chemical group thatis responsible for fluorescence is called a fluorophore. In general, a chemical group that isresponsible for the color of a substance, whether because it absorbs visible light or becauseit fluoresces, is called a chromophore.
Now imagine that we put a fluorophore and a chromophore in close proximity toeach other, and furthermore that the emission spectrum of the fluorophore overlaps theabsorption spectrum of the chromophore. If we excite the fluorophore at a wavelengthwhere it absorbs, it will undergo vibrational deexcitation as usual, but after that, it maytransfer its energy to the chromophore rather than fluorescing. This process is called Forsterresonant energy transfer, or FRET for short. As a result of the FRET effect, we wouldobserve reduced fluorescence from the fluorophore, and we would say that its fluorescencehas been quenched. The chromophore is then known as a fluorescence quencher, or simplyas a quencher. The fluorophore can also be described as a donor and the chromophore as an

P1: SFK Trim: 247mm × 174mm Top: 14.586mm Gutter: 23.198mm
CUUK1808-03 CUUK1808/Roussel 978 1 107 00678 2 October 29, 2011 12:52
3.5 Fluorescence 49
acceptor in this process. Which terminology we use depends on what we want to emphasize,particularly since there are other mechanisms that lead to fluorescence quenching. We willconcentrate here on FRET.
In one common variation on the FRET theme, the acceptor is also fluorescent. Afterreceiving the energy of the donor, the acceptor would go through vibrational de-excitation,and then fluoresce at a longer wavelength than the donor would have. We can thereforedetect the energy transfer as fluorescence of the acceptor.
The efficiency of FRET will depend on several factors:
(1) The overlap between the emission (fluorescence) spectrum of the donor and the absorp-tion spectrum of the acceptor. The larger this overlap, i.e. the more similar the emissionspectrum of one is to the absorption spectrum of the other, the more efficient the energytransfer process.
(2) If the donor and acceptor chromophores are in separate molecules, then the efficiencyof transfer is proportional to the concentration of the acceptor.
(3) The distance between the donor and acceptor. The closer to each other the two are, themore efficient the energy transfer process is. In some cases, we can position a donor andan acceptor on the same molecule. In other cases, we might use the distance dependenceof FRET to study the formation of a complex between the molecules containing thedonor and acceptor. Either way, we can use FRET to measure the distance between thedonor and acceptor, i.e. it can be applied as a molecular ruler.
FRET efficiency is defined as follows:
ηFRET = 1 − If,DA
If,D
where If,D is the fluorescence intensity of the donor in the absence of the acceptor, and If,DA
is the fluorescence intensity of the donor in the presence of the acceptor. A FRET efficiencyof 0 means that none of the excitation is transferred to the acceptor, while a FRET efficiencyof 1 means that all of the donor’s excitation is transferred to the acceptor. Alternatively, inthe variation where the acceptor is fluorescent, the efficiency can be defined as
ηFRET = If,AD
If,D
where If,AD is the fluorescence intensity of the acceptor due to resonant energy transferfrom the donor.
The fluorescence intensity is often reported as a quantum yield, usually denoted bythe symbol φ. The fluorescence quantum yield is the fraction of absorbed photons that areeventually fluoresced. This can be obtained either by comparison with a well-characterizedfluorescent standard, or by careful accounting of the photons absorbed and emitted. Bothof these are difficult to do correctly. These problems are often circumvented by measuringthe FRET efficiency using kinetic methods, which we will study in a later chapter of thisbook.

P1: SFK Trim: 247mm × 174mm Top: 14.586mm Gutter: 23.198mm
CUUK1808-03 CUUK1808/Roussel 978 1 107 00678 2 October 29, 2011 12:52
50 Spectroscopy
0
0.2
0.4
0.6
0.8
1
0 0.5 1 1.5 2
η FR
ET
R/R0
Figure 3.11 FRET efficiency as a function of R/R0.
The FRET efficiency turns out to depend on distance between the donor and acceptor asfollows:
ηFRET = 1
1 + (R/R0)6(3.9)
where R is the distance between the two, and R0 is a constant that depends on the particulardonor/acceptor pair we are using. The efficiency is plotted as a function of R/R0 inFigure 3.11. Given R0 and a measurement of the efficiency, we can calculate the distancebetween the donor and acceptor, subject to some caveats. When R R0, the efficiencyapproaches 100%, i.e. the donor’s excitation is always transferred to the acceptor. Forvalues of R � R0, the efficiency of energy transfer tends to zero. FRET will give us themost information about distance when R is of a similar size to R0, i.e. where the efficiencydepends most sensitively on the distance. Designing a FRET experiment therefore requirescareful selection of a donor/acceptor pair based on an initial structural hypothesis regardingthe likely distance between the two chromophores.
Example 3.8 Distance between A and P sites of the ribosome During protein translation,a tRNA (transfer RNA) carrying the next amino acid to be added to the protein enters theribosome’s A (aminoacyl) site. A peptide bond is formed to the amino acid carried by thetRNA in the P (peptidyl) site, at the same time breaking the bond between the P site tRNAand the nascent protein. Then the two tRNAs are pushed along, with the one in the A sitemoving to the P site, and the one in the P site moving to the E (exit) site. In a classicstudy, Johnson and coworkers6 made a short mRNA sequence AUGUn, with n = 4 or 5.AUG is the start codon, and simultaneously incorporates N -formylmethionine (fMet) asthe first amino acid in the protein in bacteria. UUU encodes phenylalanine (Phe). They
6 A. E. Johnson et al., J. Mol. Biol. 156, 113 (1982).

P1: SFK Trim: 247mm × 174mm Top: 14.586mm Gutter: 23.198mm
CUUK1808-03 CUUK1808/Roussel 978 1 107 00678 2 October 29, 2011 12:52
3.5 Fluorescence 51
labeled the tRNA for fMet with the fluorescent dye AEDANS (donor), and the tRNA forPhe with fluorescein (acceptor). They measured R0 for this donor-acceptor pair, and foundit to average about 31 A. The mRNA, donor, acceptor and ribosomes were then incubatedtogether. This should allow the formation of a complex with tRNAfMet in the P site andtRNAPhe in the A site. In one set of experiments, the quantum yield of the donor, φf,D, wasfound to be 0.158, while the quantum yield of the donor in the presence of the acceptor,φf,DA, was 0.054. We can use these data to determine the distance between the tRNAs inthe A and P sites. First, we compute the FRET efficiency:
ηFRET = 1 − φf,DA
φf,D= 1 − 0.054
0.158= 0.66
Note that we used the quantum yield as a measure of fluorescence intensity. Now, from therelationship between efficiency and distance, we have(
R
R0
)6
= 1
ηFRET− 1 = 0.52
∴ R
R0= (0.52)1/6 = 0.90
∴ R = 0.90R0 = 0.90(31 A) = 28 A
Exercise group 3.4
(1) FRET was a key technique in early studies of the structure of actin. The active form,F-actin, is a polymer made using ATP as an energy source. Actin therefore has a bindingsite for ATP. The FRET studies were greatly aided by the use of fluorescent analogsof ATP, one of which is ε-ATP. In one set of experiments, the fluorescence of ε-ATPbound to actin was compared to the fluorescence of ε-ATP bound to an actin in whichone of actin’s amino acids, lysine-61, has been labeled with the fluorescent dye FITC(fluorescein-5-isothiocyanate).7
(a) What is the donor and what is the acceptor in this experiment?(b) The fluorescence of ε-ATP bound to actin with FITC-labeled Lys-61 is 21% of the
fluorescence of ε-ATP bound to unlabeled actin. For these dyes, R0 = 4.74 nm.What is the distance between the ATP binding site and lysine-61?
(2) Suppose that you want to measure a distance between two domains of a protein. Basedon some modeling, you believe this distance to be in the range 40–60 A. The proteinhas a tryptophan in one of the two domains and, fortuitously, no other tryptophans. Youtherefore decide to use FRET, with tryptophan as the donor, to measure the distancebetween the two domains. To do this, you will need to introduce a fluorescent dyeby chemical modification of the other domain. After thinking about the chemistry,
7 M. Miki, C. G. dos Remedios and J. A. Barden, Eur. J. Biochem. 168, 339 (1987).

P1: SFK Trim: 247mm × 174mm Top: 14.586mm Gutter: 23.198mm
CUUK1808-03 CUUK1808/Roussel 978 1 107 00678 2 October 29, 2011 12:52
52 Spectroscopy
you decide that you might be able to insert any of the following dyes into the seconddomain:
Acceptor R0/ANitrobenzoyl 16Anthroyl 25DPH 40
Which dye(s) could you use, and why?(3) FRET can be used to detect and quantify conformational changes in proteins. For
example, human apolipoprotein E3 (apoE3) undergoes a conformational change whenit binds to a lipid. This protein is made of four helices, one of which contains fourtryptophans, while another contains the protein’s only cysteine. Tryptophan is fluo-rescent, and cysteine can easily be chemically modified. In one study, a cysteine wastagged with the acceptor AEDANS.8 The value of R0 was found to be about 23 A fora tryptophan/AEDANS dye pair. For the labeled protein by itself, the FRET efficiencywas 49%. When a lipid was added, the efficiency decreased to 2.7%.(a) What are the average distances between the tryptophans and the labeled cysteine
in the two cases?(b) What is the likely interpretation of these data?
Key ideas and equations
� Electronic energy levels are much more widely spaced than vibrational energy levels,which are in turn more widely spaced than rotational levels, leading to the appearanceof lines or bands associated with transitions between these levels in different spectralregions.
� P (Ei) = giexp(−Ei/(kBT ))/q, with q =∑i giexp(−Ei/(kBT )); orP (Ej )
P (Ei)=
gj
gi
exp(−�E/(kBT ))
� The molecular partition function gives us a rough count of the number of states availableto a quantum system at temperature T .
� Vibrational energies are approximated by Ev = hν0(v + 1
2
). The natural frequency ν0
measures the stiffness of a vibrational mode.� A linear molecule has 3N − 5 vibrational modes, while a non-linear molecule has 3N − 6
vibrational modes. Only modes whose corresponding motions change the dipole momentof the molecule are IR active.
� Aλ = ελc� or, in general, Aλ = �∑
i ελ,ici .
� ηFRET = 1 − If,DA
If,D= If,AD
If,D= 1
1 + (R/R0)6.
8 C. A. Fisher and R. O. Ryan, J. Lipid Res. 40, 93 (1999).

P1: SFK Trim: 247mm × 174mm Top: 14.586mm Gutter: 23.198mm
CUUK1808-03 CUUK1808/Roussel 978 1 107 00678 2 October 29, 2011 12:52
3.5 Fluorescence 53
Suggested reading
One of the most thankless and yet essential jobs in science is the collection and organizationof data. In a remarkable series of papers spanning more than a decade, Donald Kirschenbaumpainstakingly collected absorption coefficients for proteins from the literature:
Donald M. Kirschenbaum, Int. J. Protein Res. 3, 109, 157, 237, 329 (1971).—— Int. J. Pept. Protein Res. 4, 63, 125 (1972); 5, 49 (1973); 13, 479 (1979).—— Anal. Biochem. 55, 166 (1973); 56, 237 (1973); 64, 186 (1975); 68, 465 (1975); 80,
193 (1977); 81, 220 (1977); 82, 83 (1977); 87, 223 (1978); 90, 309 (1978).—— Int. J. Biochem. 11, 487 (1980); 13, 621 (1981).—— J. Quant. Spectrosc. Radiat. Transfer 27, 23, 39 (1982).—— Appl. Biochem. Biotechnol. 7, 475 (1982); 9, 187 (1984); 11, 287 (1985).
To say that this was a huge job is an understatement. To my knowledge, Kirschenbaum’sdatabase of molar absorptivities has never been computerized, nor has anyone continuedthis very important work. The papers cited above therefore remain an invaluable resourceto biochemists.
Section 3.2 contains your first glance at statistical mechanics. Some of the ideas fromthis section will return throughout this book. If you want to get a more systematic treatment,with an emphasis on the connection of statistical mechanics to thermodynamics, there is anice little book in the Oxford Chemistry Primers series you might want to get:
Andrew Maczek, Statistical Thermodynamics; Oxford University Press, Oxford, 1998.
To learn the basic ideas behind FRET, I would recommend two older, but very readablereview papers:
Lubert Stryer, Annu. Rev. Biochem. 47, 819 (1978).Pengguang Wu and Ludwig Brand, Anal. Biochem. 218, 1 (1994).
Among other things, Wu and Brand’s paper contains a table of R0 values for commondonor–acceptor pairs.
Review exercise group 3.5
(1) The natural vibrational frequency of oxygen, expressed as a wavenumber, is1580.19 cm−1.(a) This frequency was not measured by IR spectroscopy. Why not? What other
technique could have been used?(b) At what approximate temperature would you expect the population of the first
excited vibrational state to become significant?Hint: Think about the molecular partition function.
(2) The essentials of laser operation can be described using a diagram with three energylevels (Figure 3.12). The material which is to provide the laser emission is placed in acavity whose length is a multiple of half the wavelength corresponding to the energylevel spacing between energy levels 1 and 2. The ends of the cavity are mirrors, and one

P1: SFK Trim: 247mm × 174mm Top: 14.586mm Gutter: 23.198mm
CUUK1808-03 CUUK1808/Roussel 978 1 107 00678 2 October 29, 2011 12:52
54 Spectroscopy
3
non-radiative transitions
Stimulatedemission
h ν
"Pum
ping
"
1
2
Radiative and/or
Figure 3.12 Three-level diagram for a laser. Molecules are excited (“pumped”) to energy level 3 fromwhich they are rapidly deexcited to energy level 2 by some combination of processes (collisionalde-excitation, emission of photons, etc.). Some molecules will randomly decay to the ground state,emitting a photon. Stimulated emission occurs when a photon’s electromagnetic field induces theemission of an additional photon from an excited molecule.
mirror will have a small hole in it. Photons of the appropriate wavelength can thereforeform a standing wave in the laser cavity, like the wavefunction for the particle in a boxwe encountered earlier, but some photons will leak out through the hole. Molecules areexcited to energy level 3 from which they are rapidly deexcited to energy level 2. Theinitial excitation, called “pumping,” can be obtained using a light source of appropriatewavelength, or an electrical discharge, or by any of a number of other means. Asphotons travel between the two mirrors, their oscillating electromagnetic fields exertforces on the excited molecules which can induce them to emit radiation. This is calledstimulated emission. The standing wave therefore tends to build in intensity until theradiation lost through the hole (the business end of the laser) balances the stimulatedemission.(a) Suppose that we have a red laser which emits light with a wavelength of 700 nm.
What energy level spacing does this imply for which two levels?(b) Some authors define temperature using the Boltzmann equation. In other words,
they define T such that Equation (3.1) gives the distribution of molecular popula-tions. In lasers, because of the pumping, a population inversion is achieved suchthat the number of molecules in energy level 2 is larger than the population ofenergy level 1. Suppose that for our laser, N2/N1 = 10. What is the temperatureof the lasing medium? What is strange about your answer?
(3) Under given conditions, fluorescence intensities are proportional to concentration.We would therefore define a molar emission coefficient analogously to the molarabsorption coefficient: Iλ = εF
λ c�. Explain why we cannot, however, give a singleemission coefficient valid across a range of experiments as we can for the molarabsorption coefficient.

P1: SFK Trim: 247mm × 174mm Top: 14.586mm Gutter: 23.198mm
CUUK1808-04 CUUK1808/Roussel 978 1 107 00678 2 October 29, 2011 13:2
Part Two
Thermodynamics

P1: SFK Trim: 247mm × 174mm Top: 14.586mm Gutter: 23.198mm
CUUK1808-04 CUUK1808/Roussel 978 1 107 00678 2 October 29, 2011 13:2

P1: SFK Trim: 247mm × 174mm Top: 14.586mm Gutter: 23.198mm
CUUK1808-04 CUUK1808/Roussel 978 1 107 00678 2 October 29, 2011 13:2
4
Thermodynamics preliminaries
Thermodynamics is one of the most useful pieces of science you’ll ever learn. Given a littleknowledge of thermodynamics, one can explain and understand a broad range of naturalphenomena and technological applications. In this book for instance, we will touch onenergy use in living organisms, energy production by fuel-burning engines and spontaneityof chemical processes. This list of topics hardly scratches the surface of the phenomenathat can be understood using thermodynamics.
When chemists say “thermodynamics,” they usually mean “equilibrium thermodynam-ics,” also known as “classical thermodynamics.” This is a theory that emphasizes trans-formations between equilibrium states. This is important because it is difficult to evendefine some important quantities like temperature for systems that are out of equilibrium.However, it does mean that we have to be careful how we apply the theory, which requiresa certain precision of thought, language and notation. The issues dealt with in the restof this chapter may seem pedantic or trivial to you, but they are critical prerequisites tounderstanding anything else in thermodynamics.
4.1 The domain of classical thermodynamics
Classical thermodynamics is a theory of equilibrium states and of transformations betweenthese states. What do we mean by equilibrium? A system is in equilibrium if its state, underthe given conditions, does not change with time. This may seem like an obvious definition,but in thermodynamics, even “state” has a technical meaning: the state of a system is thecollection of all its observable properties (pressure, volume, chemical composition, etc.).Note that the only observable properties we are concerned with in classical thermodynamicsare those we can measure with ordinary lab instruments – which we call macroscopicproperties – and not properties at the atomic or molecular level.
Another limitation of classical equilibrium thermodynamics is that it strictly only appliesto closed systems, i.e. to systems whose boundaries are impermeable to the flow of matter.This is often an idealization. For example, a beaker containing an aqueous solution is nota closed system since there is a continual exchange of water molecules between the liquidphase and the atmosphere. However, if you are studying a reaction that occurs in solution
57

P1: SFK Trim: 247mm × 174mm Top: 14.586mm Gutter: 23.198mm
CUUK1808-04 CUUK1808/Roussel 978 1 107 00678 2 October 29, 2011 13:2
58 Thermodynamics preliminaries
and your experiment doesn’t last too long, it might be a good approximation to pretend thatthe beaker is a closed system.
4.2 Temperature, heat and thermometers
Words that have very precise meanings in science can sometimes mean something subtlydifferent in everyday language. Worse yet, commonly used phrases can sometimes give thewrong impression about a concept. You may be surprised to see a section on temperature,heat and thermometers in this book since you probably think you know what these conceptsmean. Perhaps you do, but in my experience, students often have trouble clearly distin-guishing between heat and temperature. Anecdotally, I’ve heard of one graduate studentwho failed a Ph.D. comprehensive exam because he didn’t know the difference betweenthese two concepts. For all I know, this is just a graduate school urban legend, but just tobe safe, let’s make sure that you know what heat and temperature are before we move on.
Heat has a funny, negative definition: it’s not work. You will have run across the conceptof work in your elementary physics courses. In general, work is force multiplied by distance.This definition of work includes some special cases in which force and distance do notappear explicitly, such as electrical work (charge times electrical potential difference),where we are in fact calculating the work done pushing charges around. Formally, heatis an interaction between systems (or between a system and its surroundings) that causesthe state of a system to change, but that isn’t work. Heat transfer only requires contact(sometimes indirect) between two systems. We’re already familiar with this fact from oureveryday lives, although you may not have thought of it quite this way before; if you wantto heat up some water, you put it in a pot, put the pot on the stove and turn the stove on.The stove is clearly doing something to the pot and water since you can observe variouschanges in the state of this system, but it’s not work since there isn’t any pushing involved.
One of the tricky things about heat is that the language we use to describe what happensduring heat transfer sometimes suggests that it’s some kind of fluid contained in a body(“heat flow,” “heat capacity”). The idea of heat as a fluid, the caloric theory, was thedominant theory of heat in the eighteenth century, but turns out to be an incorrect picture,as we will see in Chapter 5. We are nevertheless stuck with this language, which has clearlyoutlived its usefulness, but just won’t go away. The important thing is to remember thatheat is an interaction between systems, and not some kind of substance that is stored in abody.
It is very easy to write down definitions of temperature that sound good, but mean little.Temperature is a primitive concept, like space or time. The best we can do is to try toexplain what we mean in simple language: temperature is a numerical label (e.g. 4 ◦C) for“hotness.” To put it another way, using my sense of touch, I can order objects made fromthe same material by hotness. (Our perception of hotness is not infallible and is affectedby the material of which an object is made, among other factors. I do not claim that wecan design thermometers on this principle, only that we would reject temperature scalesthat grossly violated our innate sense of hotness.) Having done this, we will insist that our

P1: SFK Trim: 247mm × 174mm Top: 14.586mm Gutter: 23.198mm
CUUK1808-04 CUUK1808/Roussel 978 1 107 00678 2 October 29, 2011 13:2
4.3 Sign convention 59
temperature scales order the objects the same way, assigning lower temperatures to coolerobjects, and higher temperatures to warmer objects. There are of course other definitionsof temperature, the best of which probably come from statistical mechanics, specificallyfrom the factor of T appearing in the Boltzmann distribution (Section 3.2). All we reallywant, however, is to avoid making mental errors when discussing heat and temperature, sothis simple definition of temperature as a numerical label for hotness is enough. We can infact now nicely distinguish between heat and temperature:
Heat is an interaction between systems.Temperature is a property of a system.
A thermometer is simply a device for assigning temperatures to objects. So how dothermometers work? Suppose we have a system in which one easily measured observableincreases monotonically with temperature. Then we could label the temperatures by thevalues of that observable or, if these values are inconvenient, we could apply some trans-formation to them to give us a practical temperature scale. A simple example of such aproperty is volume. For most materials, the volume increases with temperature. This is thebasis for the familiar mercury and alcohol thermometers.
When we place objects in contact that have different temperatures, their states change. Inother words, heat is transferred between them. This process does not continue indefinitely.Eventually, the two bodies come to the same temperature in a state of thermal equilibrium.Thermometry is based on this principle: if we place a thermometer in thermal contact withanother body, it will eventually come to equilibrium with it. At this point, we may readthe thermometer to discover the final equilibrium temperature of the composite system thatincludes both the body under study and the thermometer. Note that the state of the firstbody, in particular its temperature, has been changed by contact with the thermometer,since heat had to flow between the body and thermometer in order to establish equilibrium.It is impossible to measure the temperature of a body without changing it. However, if ourthermometer is sufficiently small and of an intelligent design, this effect can be minimized.
4.3 Sign convention
For many thermodynamic quantities such as work it will be necessary to distinguish care-fully between positive and negative values. The signs are arbitrary, but a well-chosen andconsistently applied sign convention makes the discussion of thermodynamic changes muchsimpler. The modern convention is as follows:
Anything that goes into a system is counted as positive;anything that comes out is negative.
All quantities are expressed relative to the system under consideration, not relative to thesurroundings, although we will sometimes reverse our perspective and treat the surroundings

P1: SFK Trim: 247mm × 174mm Top: 14.586mm Gutter: 23.198mm
CUUK1808-04 CUUK1808/Roussel 978 1 107 00678 2 October 29, 2011 13:2
60 Thermodynamics preliminaries
as a system. Thus, work done on a system is positive, work extracted from a system isnegative; heat transferred into a system is positive, heat transferred out is negative and so on.
Note that the sign convention will require you to clearly identify the system wheneveryou are working on a thermodynamics problem. In some cases, the system will be obvious.In others, you will have to clearly state what belongs to the system and what belongs to thesurroundings.
Some older books (and research papers) use a different convention. Work is singled outfor special treatment because the theory was originally devised to treat steam engines andsimilar devices. In this older convention, work done by the system is positive. Even thoughwe will never use this convention, it’s good to know about it in case you ever run acrossone of these older works. If you do, you will notice that some formulas relating to workdiffer in sign from those you will see here.
4.4 Molar, specific and “total” quantities
Many of the quantities in thermodynamics are extensive, which means that, all otherthings being equal, they increase with the size of the system. For extensive quantities, wesometimes want to talk about the total for a particular system. Often though, we prefer towork in terms of the molar quantity (i.e. the amount per mole), or of the specific quantity(amount per unit mass).
Notation: If X is an extensive quantity, then Xm is the corresponding molar quantity, andx is the corresponding specific quantity.
For instance, a system might contain a gas that occupies a certain total volume V . Onthe other hand, we might also talk about the molar volume Vm of the gas, i.e. the volumeoccupied by one mole of the gas. Because the molar mass relates number and mass, we caneasily convert this figure to a specific volume, symbolized v. In fact, we have the relationshipV = nVm = mv (here, mass times specific volume, not mass times velocity). Accordingly,we could write every formula relating extensive properties in at least three versions, onefor the molar quantities one for the specific quantities and one for the total. Generally,these formulas look nearly identical, give or take some ms and ns and the typographicalembellishments described above. In this book, I will generally write formulas for the totalquantities, letting it be understood that we can divide the formulas by m or n to obtain thecorresponding formulas for the specific and molar quantities, except when the distinctionis important. When handling data, I try to be consistent and to use the appropriate notation.I find that a little care exerted at this level often reduces confusion as to what variousquantities refer to. It also helps with unit analysis: if I think I’m calculating Vm, the unitshad better work out to units of volume per mole.
Example 4.1 Molar and specific volumes in the ideal gas law The ideal gas law can berewritten in terms of the molar volume as follows:
pVm = RT

P1: SFK Trim: 247mm × 174mm Top: 14.586mm Gutter: 23.198mm
CUUK1808-04 CUUK1808/Roussel 978 1 107 00678 2 October 29, 2011 13:2
4.4 Molar, specific and “total” quantities 61
If we divide both sides by the molar mass of the gas, we get
pv = RT/M
Example 4.2 Converting between molar and specific quantities The molar heat capacity(Cp,m) of lead is 26.4 J K−1mol−1. To calculate the specific heat capacity, we use the molarmass:
cp = 26.4 J K−1mol−1
207.2 g mol−1= 0.127 J K−1g−1
Key ideas and equations
� Anything that goes into a system is counted as positive, anything coming out is countedas negative.
Suggested reading
Thermometry is a surprisingly complicated business. For instance, you may never havethought about the fact that a mercury-in-glass thermometer will give different readingsdepending on the temperature of the stem, and not just the bulb where we think themeasurement occurs, because the glass also expands with temperature. The channel intowhich the mercury expands therefore has a different diameter depending on the temperatureof the stem. Then there’s the whole issue of calibration. The best starting point for readingabout temperature and thermometers, if this topic catches your fancy, is the web site of theInternational Temperature Scale of 1990: http://www.its-90.com.

P1: SFK Trim: 247mm × 174mm Top: 14.586mm Gutter: 23.198mm
CUUK1808-05 CUUK1808/Roussel 978 1 107 00678 2 October 29, 2011 17:22
5
The First Law of Thermodynamics
The First Law is about the inter-relationships between a few key quantities: energy, work andheat. These concepts are central to such disparate fields of study as chemistry, engineeringand physiology, to name just a few.
In a nutshell, the first law asserts that energy is conserved. It therefore allows us to dosome simple bookkeeping on energy transfers and thus to determine how much energy asystem has used or stored. Although this may not sound very exciting, it is remarkablyuseful.
5.1 Differentials
Thermodynamics can’t be studied without learning some new mathematics. Central amongthe mathematical tools of thermodynamics are differentials. Differentials are tiny (infinites-imal) increments. They are useful for describing how a change in one quantity is related toa change in another.
There are two kinds of differentials. The first, which are somewhat more straightforwardto understand, are exact differentials. Exact differentials represent small changes in aproperty of a system. In thermodynamics, a measurable property is called a state variable.A function that only depends on state variables is called a state function. Since statefunctions only depend on the state variables, they also are properties of a system and thushave exact differentials. You have seen exact differentials before, in your calculus course.The differential appearing in an ordinary integral such as∫ x2
x1
f (x) dx
is always an exact differential. In particular, if dx is an exact differential,∫ x2
x1
dx = x2 − x1 = �x
Only the endpoints matter, and not the way in which x was changed. It doesn’t matterif x was changed slowly or quickly, or even if it increased and decreased again before
62

P1: SFK Trim: 247mm × 174mm Top: 14.586mm Gutter: 23.198mm
CUUK1808-05 CUUK1808/Roussel 978 1 107 00678 2 October 29, 2011 17:22
5.1 Differentials 63
stopping at its final value, only where it started and where it ended up. We say that x ispath independent. The following three-way correspondence follows:
x is a state variableor function
⇐⇒ dx is an exactdifferential
⇐⇒ �x is pathindependent
Examples of state variables include pressure, volume and temperature, to name just afew.
The other case, that of inexact differentials, is best understood by example. We willoften have occasion to talk about dw, the amount of work done when some state variable(for instance, the volume) is changed by a small amount. However, dw is not like dV ; sincework is not a state variable (no system is characterized by the amount of work it “has”),it doesn’t make sense to talk about the “change in work.” Rather, when we integrate dw,we will be adding up the small amounts of work done along some path (P) to compute thetotal work done w. Symbolically, ∫
Pdw = w
In this case, it may matter how we do the work. Some forces, like gravitation, are conser-vative. Work done by or against a conservative force is path independent. However, manyforces are non-conservative. For non-conservative forces, it is easy to devise paths thatmake the same changes in a system (i.e. have the same initial and final states) but for whichcompletely different amounts of work are done. We will see an example of this in the nextsection. We say that w is a path function, and that dw is an inexact differential. For inexactdifferentials, we therefore have
x describesa process
⇐⇒ dx is an inexactdifferential
⇐⇒ x is path dependent
Exercise group 5.1
(1) Suppose that F is a state function, and consider the following process:
(p1, V1)�F1=−1.41 u−−−−−−−→ (p1, V2)
�F4
�⏐⏐ ⏐⏐��F2=2.25 u
(p3, V1)�F3=−3.09 u←−−−−−−− (p3, V2)
What is �F4? Note that “u” represents the units of F , whatever they are.Hint: Imagine starting at (p1, V1) and following the arrows around. How has the statechanged? What does this imply about the net change in F ?

P1: SFK Trim: 247mm × 174mm Top: 14.586mm Gutter: 23.198mm
CUUK1808-05 CUUK1808/Roussel 978 1 107 00678 2 October 29, 2011 17:22
64 The First Law of Thermodynamics
ext
exx
F
Figure 5.1 Geometry of a piston system used to derive the equation for pressure–volume work. If thecylinder has cross-sectional area A, the volume is V = A(xe − x), where xe is the position of the endof the cylinder. Accordingly, dV = −A dx (area multiplied by change in height) or dx = −dV/A.The external force Fext results in an external pressure on the piston of pext = Fext/A or Fext = pextA.Therefore, the differential of work dw = Fext dx = −pext dV .
5.2 Pressure–volume work
The essence of the First Law is the equivalence of heat and work. The type of work that willmost concern us in this book is pressure–volume work. This is just ordinary mechanicalwork, but we will write the equations in a form particularly suited to thermodynamics.Suppose that we have a gas in a piston either being compressed by or expanding against anexternal force Fext directed perpendicular to the surface of the piston (Figure 5.1). Recallthat mechanical work is defined as a force times the distance over which that force isapplied, so the work done on or by the system (the gas) during a small displacement dx is
dw = Fext dx
We’ll worry about adding up the dws (integrating) later.Now suppose that the force is distributed over an area A so that we actually measure
not force, but pressure p. Recall that F = pA. Furthermore, a small change dV in thevolume V is related to a small change dx in the position of the piston by dx = −dV/A
(see Figure 5.1). The negative sign accounts for the fact that if the force (which pushesin) and displacement are in the same direction, the volume decreases. We arrive at thefundamental relationship
dw = −pext dV (5.1)
If we want the total work, we just integrate this equation:
w =∫P
dw = −∫P
pext dV (5.2)

P1: SFK Trim: 247mm × 174mm Top: 14.586mm Gutter: 23.198mm
CUUK1808-05 CUUK1808/Roussel 978 1 107 00678 2 October 29, 2011 17:22
5.2 Pressure–volume work 65
along whatever path P is followed during the process, i.e. how pext changes during theprocess.
The negative sign in Equation (5.1) is important: since pressures are always positive,the work will always have the opposite sign to the change in volume. Thus, during a com-pression, the volume decreases and the work is positive. According to our sign conventionand in accord with common sense, this means that during a compression work is done onthe system. Conversely, an expansion represents a volume increase and negative work, i.e.work done by the system.
Example 5.1 Work at constant pressure Suppose that the external pressure is constantduring a process. Then
w = −pext
∫ V2
V1
dV = −pext(V2 − V1) = −pext �V
One special case of this formula deserves mention. Suppose that a gas expands against avacuum. This means that the external pressure is zero. Then w = 0.
There are some special types of processes (i.e. special paths) that we use all the time inthermodynamics, either because they are theoretically significant, or because they describe(or approximate) some conditions we encounter in real processes. An isothermal processis one in which the temperature is constant. A reversible process is one in which thesystem stays in equilibrium with its surroundings at all times. During the expansion ofa gas, reversibility would imply that the external and internal pressures are equal duringthe entire path. This is not something we can really do; if the pressure is the same onboth sides of the piston, there is no net force, and the piston doesn’t move. In a real(irreversible) expansion, we would have to make the external pressure lower than the internalpressure.
If we can’t really do a reversible expansion, why do we care about this kind of process?Consider Figure 5.2, which shows three different paths for an isothermal expansion fromV1 to V2. The solid curve is the pV isotherm, i.e. the line along which T is a constantat equilibrium. For an ideal gas, this would be the curve pV = constant. The reversibleexpansion corresponds to following this curve. According to Equation (5.2), the work doneduring this expansion is just the area under this curve between V1 and V2 (because pext = p
in a reversible process), give or take the sign, which will be negative since the system isdoing useful work during an expansion. In a real process, we would have to make pext
smaller than p. We could just go directly to the final pressure (the long-dashed line in thefigure). The work done would then be (again, ignoring the sign) the area of the rectangleunder the long-dashed line. Of course, we could reduce the pressure in steps. The short-dashed line in the figure shows what would happen if we reduced the pressure in three equalsteps. The work done in this case would be the area under the “staircase”. You can see thattaking more steps gives us an amount of work between the reversible work and the resultfor a single pressure reduction. You should also be able to see that, no matter how many

P1: SFK Trim: 247mm × 174mm Top: 14.586mm Gutter: 23.198mm
CUUK1808-05 CUUK1808/Roussel 978 1 107 00678 2 October 29, 2011 17:22
66 The First Law of Thermodynamics
V1 V2
p
V
Figure 5.2 Expansion of a gas. The solid curve is the pV isotherm.
pressure-reduction steps we use, we can’t produce more work than the reversible processwould, we can only approach this limit. This is why reversible processes are important:
A reversible process maximizes the work done by a system.
We can approach reversibility by taking lots of small steps, and we know that the reversiblework done by a system is a maximum (i.e. w is maximally negative along a reversible path),so we now have an upper bound on what a machine can accomplish. Note that we haven’tfor the moment proven this to be a general principle, only observed that it is true for theexpansion of a gas. We can do better, and will return to this important principle later in thecourse.
Example 5.2 Reversible, isothermal expansion of an ideal gas Let’s calculate the workdone during the isothermal, reversible expansion of an ideal gas. Because the process isreversible, pext = p, the pressure of the gas in the piston. Therefore,
w = −∫ V2
V1
p dV
To evaluate the integral, we need to write p as a function of V . Because this is an ideal gas,p = nRT/V . Furthermore, this is an isothermal expansion so T is constant:
w = −nRT
∫ V2
V1
dV
V= −nRT ln
V2
V1= nRT ln
V1
V2

P1: SFK Trim: 247mm × 174mm Top: 14.586mm Gutter: 23.198mm
CUUK1808-05 CUUK1808/Roussel 978 1 107 00678 2 October 29, 2011 17:22
5.2 Pressure–volume work 67
In the exercises that follow, you may need to do some slightly harder integrals. If youneed a little review, have a look at Appendix I.
Exercise group 5.2
(1) Calculate the work done when a gas expands from a volume of 1 L to 10 L againsta constant external pressure of 1 atm. (Hint and caution: the answer should be in SIunits.)
(2) Calculate the work done on or by the gas when 8 mol of nitrogen is compressedisothermally and reversibly at 300 ◦C from an initial volume of 1 L to a final volume of30 mL. Assume that nitrogen behaves as an ideal gas. Explain the meaning of the signof your answer.
(3) 18 mol of nitrogen are held at a pressure of 1.08 atm and a temperature of 20 ◦C. Theexternal pressure is changed very suddenly to 0.35 atm and is held constant during theexpansion. The gas is in good thermal contact with its surroundings, whose temperatureis a constant 20 ◦C so that by the end of the expansion, the temperature of the gas hasreturned to equilibrium with the surroundings.(a) Treat nitrogen as an ideal gas and calculate the work done during the expansion.
Explain the meaning of the sign of the work.(b) Suppose that the work done on or by the gas results from the raising or lowering
of a 2.3 kg mass. The work done when a mass is raised is w = mgh where h is theheight to which the mass is raised (negative if lowered). How far does the masshave to move, and in what direction?
(4) 0.10 mol of an ideal gas is expanded isothermally at 50 ◦C from an initial volume of1.4 L to a final volume of 3.2 L. Calculate the work done along each of the followingpaths: (a) reversible, (b) pressure dropped suddenly to the final pressure, (c) a two-stepprocess with two equal pressure drops.
(5) The ideal gas law is only valid for most gases at very low temperatures. Real gases aremore accurately described by the van der Waals equation:
(p + n2a
V 2
)(V − nb) = nRT
where a and b are constants specific to a particular gas, R is the ideal gas constant, p
is the pressure, V the volume, and n the number of moles.(a) Derive an equation for the work done during a reversible, isothermal expansion of
a van der Waals gas.(b) For nitrogen, a = 0.141 Pa m6 mol−2 and b = 3.91 × 10⁻⁵ m3 mol−1. Calculate
the work done when 1 kmol of nitrogen is expanded reversibly and isothermally ata temperature of 300 K from 1 to 3 m3.
(c) Compare the answer obtained in question 5b to what you would have calculatedfrom the ideal gas equation. Was the extra work worth the effort?

P1: SFK Trim: 247mm × 174mm Top: 14.586mm Gutter: 23.198mm
CUUK1808-05 CUUK1808/Roussel 978 1 107 00678 2 October 29, 2011 17:22
68 The First Law of Thermodynamics
(6) Solids and liquids are often said to be incompressible, which means that changing thepressure does not change their volumes. Because of this, we tend to ignore the effect ofpressure on solids and liquids when solving thermodynamic problems. However, solidsand liquids are not really incompressible. For copper, for instance, the relationshipbetween pressure and molar volume at constant temperature is
p = 1
κT
ln
(V ◦
m
Vm
)+ p◦
where κT , V ◦m and p◦ are constants with the values
κT = 7.25 × 10⁻¹² Pa−1
V ◦m = 7.093 × 10⁻⁶ m3 mol−1
p◦ = 101 325 Pa
Calculate the work done per mole when copper is compressed reversibly and isother-mally from an initial pressure of 1 atm to a final pressure of 1000 atm. This is roughlyequivalent to the pressure change that a piece of copper would experience if it wasdropped from the ocean’s surface to the bottom of the Marianas trench, the deepestocean trench on Earth. Based on your calculation, do you think that ignoring pressure–volume terms (such as the work) is justifiable for solids?Hint: You may need an integral from the table in Appendix I.1.
5.3 The First Law of Thermodynamics
The internal energy U of a system is the total energy, excluding kinetic energy, associatedwith the motion of the center of mass or with rotation around the center of mass, as wellas the potential energy due to the position of the body in space (e.g. gravitational potentialenergy). The internal energy is therefore the energy stored in the atoms and molecules of apiece of matter, including the energy associated with the intermolecular forces.
The first law of thermodynamics can be viewed as an extension of classical mechanicalresults on the conservation of energy. It states that there are two ways to change the internalenergy of a system and that these two ways are equivalent: work (w) can be done on thesystem or heat (q) can flow into it. Thus the change in internal energy can be written
�U = q + w (5.3)
A perpetual motion machine of the first kind is a machine that indefinitely sustains someexternal energy-using process without external input of energy. The first law forbids suchmachines; if energy goes out of the system without being replenished from an externalsource, the internal energy decreases. This process cannot go on indefinitely.
We now come to an important fact:
The internal energy is a state function.

P1: SFK Trim: 247mm × 174mm Top: 14.586mm Gutter: 23.198mm
CUUK1808-05 CUUK1808/Roussel 978 1 107 00678 2 October 29, 2011 17:22
5.4 Calculus of differentials 69
We know this because the internal energy has been defined to exclude external influencesso that its value can only depend on the state of the system. On the other hand, as we haveseen in Section 5.2, the work is a path function. Since �U = q + w, the influence of thepath on w must somehow cancel out when we add it to q to give us the change in the statefunction U . It follows that the heat must also be a path function.
Work and heat are path functions.
In fact, these two quantities are the only path functions we will routinely see in this course.It is often useful to write the first law in differential form:
dU = dq + dw (5.4)
The only hiccup is that we must be clear about what the differentials mean: dU , being thedifferential of a state function, is an exact differential and we can integrate it to get thechange in internal energy:∫ final state
initial statedU = Ufinal − Uinitial = �U
On the other hand, dq and dw, being differentials of path functions, are inexact differentials.They can only be integrated for a given path to give the total heat and work:
q =∫P
dq and w =∫P
dw
Exercise group 5.3
(1) An induction coil is a device that, when placed in a changing magnetic field, generateselectricity. Reasonably large time-varying magnetic fields are produced by high-voltagepower lines. Some years ago, a farmer whose property was crossed by high-voltagelines placed a large induction coil under the lines and supplied his farm with electricityfrom it. He was found guilty of theft. What was he stealing and from whom? Explain(briefly) the scientific basis of the case.
5.4 Calculus of differentials
Equations written in terms of differentials are just shorthand versions of differential equa-tions (equations relating derivatives). For instance, dx = α dy is short for
dx
dz= α
dy
dz
where z is some progress variable (time, amount of reactant used, etc.). We use the differen-tial notation when the identity of z doesn’t matter. The differential relationship dx = α dy
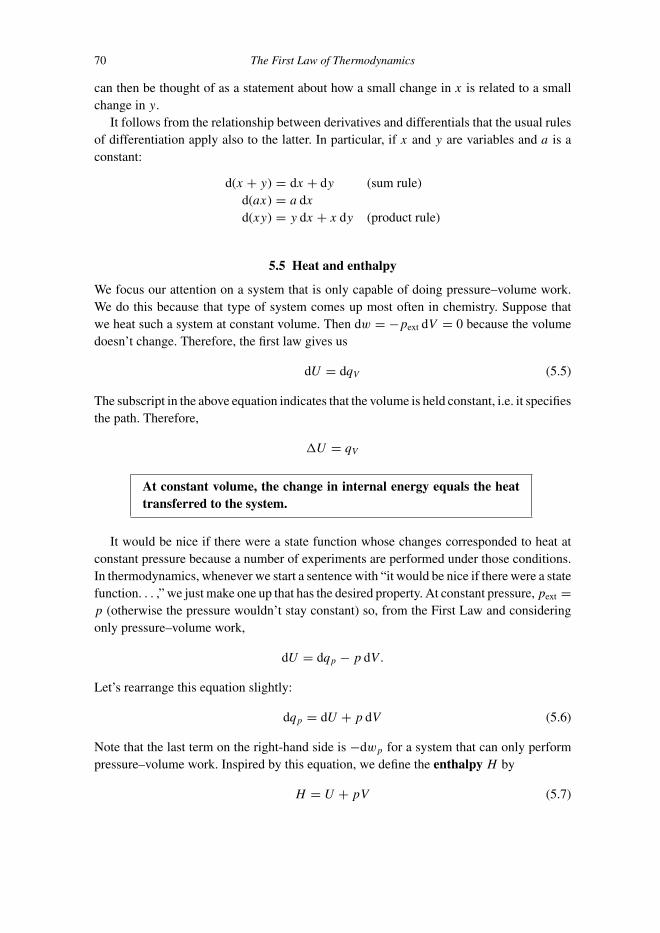
P1: SFK Trim: 247mm × 174mm Top: 14.586mm Gutter: 23.198mm
CUUK1808-05 CUUK1808/Roussel 978 1 107 00678 2 October 29, 2011 17:22
70 The First Law of Thermodynamics
can then be thought of as a statement about how a small change in x is related to a smallchange in y.
It follows from the relationship between derivatives and differentials that the usual rulesof differentiation apply also to the latter. In particular, if x and y are variables and a is aconstant:
d(x + y) = dx + dy (sum rule)d(ax) = a dx
d(xy) = y dx + x dy (product rule)
5.5 Heat and enthalpy
We focus our attention on a system that is only capable of doing pressure–volume work.We do this because that type of system comes up most often in chemistry. Suppose thatwe heat such a system at constant volume. Then dw = −pext dV = 0 because the volumedoesn’t change. Therefore, the first law gives us
dU = dqV (5.5)
The subscript in the above equation indicates that the volume is held constant, i.e. it specifiesthe path. Therefore,
�U = qV
At constant volume, the change in internal energy equals the heattransferred to the system.
It would be nice if there were a state function whose changes corresponded to heat atconstant pressure because a number of experiments are performed under those conditions.In thermodynamics, whenever we start a sentence with “it would be nice if there were a statefunction. . . ,” we just make one up that has the desired property. At constant pressure, pext =p (otherwise the pressure wouldn’t stay constant) so, from the First Law and consideringonly pressure–volume work,
dU = dqp − p dV.
Let’s rearrange this equation slightly:
dqp = dU + p dV (5.6)
Note that the last term on the right-hand side is −dwp for a system that can only performpressure–volume work. Inspired by this equation, we define the enthalpy H by
H = U + pV (5.7)

P1: SFK Trim: 247mm × 174mm Top: 14.586mm Gutter: 23.198mm
CUUK1808-05 CUUK1808/Roussel 978 1 107 00678 2 October 29, 2011 17:22
5.6 Heat capacity 71
H is a state function because it is the sum of U , which is a state function, and of the productof p with V , each of which is a state variable. Differentiating this expression, we get
dH = dU + p dV + V dp
At constant pressure, the last term is zero. Considering also Equation (5.6), we concludethat
dH = dqp =⇒ �H = qp (5.8)
This is exactly what we were looking for:
At constant pressure, the enthalpy change equals the heat trans-ferred to the system.
When a system is composed only of solids and liquids (called condensed phases),an important simplification is possible: since solids and liquids are incompressible andsince they are relatively dense, �(pV ) is always very small for processes involving onlycondensed phases provided �p isn’t huge. It then follows that �H ≈ �U .
5.6 Heat capacity
You might guess that the larger the temperature change, the larger the amount of heattransferred to (or from) a body. That is essentially correct. Under most conditions, the heattransferred is almost exactly proportional to the temperature change. In other words,
q ∝ �T
Heat is a path function so we need to specify the path carefully. If we do that, the amountof heat required to cause a given temperature change is very reproducible. At constantvolume,
qV = CV �T
and at constant pressure,
qp = Cp�T
Again note that the notation qX indicates that X is held constant during the process. CV andCp are the heat capacities of the system, respectively at constant volume and at constantpressure. In general, these two heat capacities are different.
The above equations are valid provided the relevant heat capacity is approximatelyconstant, which it is for most substances when the change in temperature is not too large.When the heat capacity is not constant, we must rewrite these equations in differential form:
dqX = CX dT (5.9)

P1: SFK Trim: 247mm × 174mm Top: 14.586mm Gutter: 23.198mm
CUUK1808-05 CUUK1808/Roussel 978 1 107 00678 2 October 29, 2011 17:22
72 The First Law of Thermodynamics
or
CX = dq
dT
∣∣∣∣X
(5.10)
where the bar and subscript indicate that X is being held constant. We use the bar ratherthan just a simple subscript (as we did with q, for instance) because holding X constanthere applies to the operation of taking the derivative, and not to some particular symbolwithin the derivative. In other words, we want to know how q changes when we change T
while holding X constant. In chemical thermodynamics, X will typically be either V or p.Equation (5.10) tells us how to measure (for instance) CV : we measure the total heat
added as a sample is heated at constant volume. This gives us a curve q(T ). If we take thederivative of this curve, we get the heat capacity as a function of T .
Now recall that dU and dqV are related by Equation (5.5). If we make this substitutionin the appropriate instance of Equation (5.10), we get
CV = ∂U
∂T
∣∣∣∣V
(5.11)
The derivative in Equation (5.11) is a partial derivative because U is a function of twovariables: T (the variable with respect to which we are differentiating) and V (the variablewe are holding constant). The reason that we use a partial derivative here and not in Equation(5.10) again has to do with the distinction between state and path functions. Since the heatadded depends on the path, q is not a function of the state variables. It can be thought of asa function of T only in the context of a particular experiment over a well-defined path.
Similarly, using Equation (5.8) we get
Cp = ∂H
∂T
∣∣∣∣p
(5.12)
A nice way to think of partial derivatives is that they describe experiments. You haveno doubt been told that in good experiments, you vary just one thing at a time. CV wouldbe the slope of a graph of U vs. T in an experiment in which you hold V constant. If theenergy depended on other variables (e.g. external magnetic field strength, a key variable inthe thermodynamics of magnetic systems), you would hold those constant, too.
We noted earlier that �H ≈ �U for processes involving only solids or liquids. It followsthat Cp and CV are also approximately equal to each other for solids or liquids, but notfor gases. Assuming that a gas obeys the ideal gas law, however, we can easily derive arelationship between Cp,m and CV,m. Since H = U + pV , we have
Cp,m = ∂Hm
∂T
∣∣∣∣p
= ∂Um
∂T
∣∣∣∣p
+ ∂(pVm)
∂T
∣∣∣∣p
(5.13)
For an ideal gas, pVm = RT , so the last derivative is just R. The problem is to evaluate∂Um/∂T |p. There is some theory which we won’t cover that would let us do this rigorously.We’ll settle for a handwave here, although one that brings out an important fact. An ideal gasis, by definition, one whose particles don’t interact, i.e. there are no forces acting between

P1: SFK Trim: 247mm × 174mm Top: 14.586mm Gutter: 23.198mm
CUUK1808-05 CUUK1808/Roussel 978 1 107 00678 2 October 29, 2011 17:22
5.6 Heat capacity 73
particles in an ideal gas. If there are no forces between the particles, then it hardly mattershow close together they are. The internal energy of an ideal gas therefore can’t depend onthe volume. The equation of state for a fixed quantity of an ideal gas can be used to writeany one of the variables (p, V, T ) in terms of the other two. We can therefore think ofthe internal energy as being a function of volume and temperature, and then conclude thefollowing useful fact:
The internal energy of an ideal gas only depends on the temperature.
Mathematically, we are saying that for an ideal gas, Um = Um(T ). Changing variables from(V, T ) to (p, T ) won’t change the form of this equation, so ∂Um/∂T |p = ∂Um/∂T |V =CV,m. Putting all the pieces together in Equation (5.13), we get
Cp,m = CV,m + R
In a lot of problems, we will be able to treat the heat capacity as constant, whichsimplifies the mathematics a lot. The only thing to watch for is that we are often (but notalways) given the molar (or specific) rather than the total heat capacity. This is so commonthat we often just say “heat capacity” when we mean “molar heat capacity,” so you reallyhave to watch the units of any “heat capacities” given to you.
Example 5.3 Warming an engine An automobile engine has a constant-pressure heatcapacity of 250 kJ K−1. If the engine is initially in equilibrium with its surroundings on aday where the air temperature is 10 ◦C, how much heat is required to warm the engine toits operating temperature of 110 ◦C?
The calculation is a straightforward one. First, we need �T in kelvins. However, sincethe size of a kelvin is exactly the same as the size of a degree Celsius, we can calculate �T
directly from the data:
�T = 110 − 10 ◦C = 100 K
Note that this only works because we are taking a difference in temperatures. In any othercase, we need to work in kelvins.
To finish the problem, we just multiply the heat capacity of the engine by �T :
q = Cp�T = 25 MJ
Example 5.4 Warming graphite The constant-pressure molar heat capacity of graphiteis 8.527 J K−1mol−1. How much heat is required to raise the temperature of 1 kg a block ofgraphite from 20 to 95 ◦C?
Here, we are given the molar heat capacity rather than the total heat capacity of thesample. Once we have realized this, the calculations are as straightforward as in the lastexample. 1 kg of graphite corresponds to 83 mol. The heat required is
q = nCp,m�T = (83 mol)(8.527 J K−1mol−1)(75 K) = 53 kJ
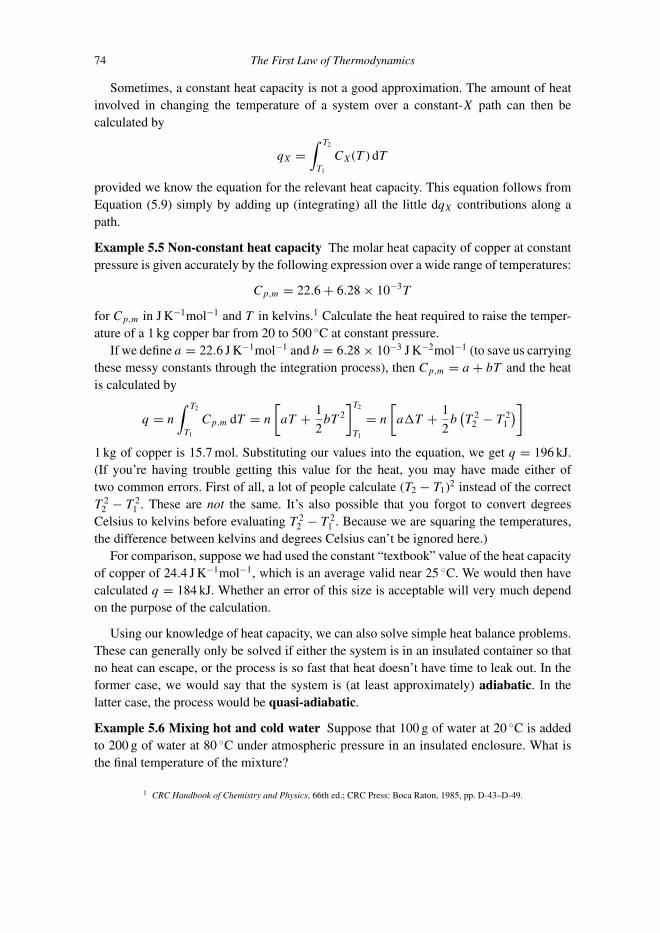
P1: SFK Trim: 247mm × 174mm Top: 14.586mm Gutter: 23.198mm
CUUK1808-05 CUUK1808/Roussel 978 1 107 00678 2 October 29, 2011 17:22
74 The First Law of Thermodynamics
Sometimes, a constant heat capacity is not a good approximation. The amount of heatinvolved in changing the temperature of a system over a constant-X path can then becalculated by
qX =∫ T2
T1
CX(T ) dT
provided we know the equation for the relevant heat capacity. This equation follows fromEquation (5.9) simply by adding up (integrating) all the little dqX contributions along apath.
Example 5.5 Non-constant heat capacity The molar heat capacity of copper at constantpressure is given accurately by the following expression over a wide range of temperatures:
Cp,m = 22.6 + 6.28 × 10⁻³T
for Cp,m in J K−1mol−1 and T in kelvins.1 Calculate the heat required to raise the temper-ature of a 1 kg copper bar from 20 to 500 ◦C at constant pressure.
If we define a = 22.6 J K−1mol−1 and b = 6.28 × 10⁻³ J K−2mol−1 (to save us carryingthese messy constants through the integration process), then Cp,m = a + bT and the heatis calculated by
q = n
∫ T2
T1
Cp,m dT = n
[aT + 1
2bT 2
]T2
T1
= n
[a�T + 1
2b(T 2
2 − T 21
)]
1 kg of copper is 15.7 mol. Substituting our values into the equation, we get q = 196 kJ.(If you’re having trouble getting this value for the heat, you may have made either oftwo common errors. First of all, a lot of people calculate (T2 − T1)2 instead of the correctT 2
2 − T 21 . These are not the same. It’s also possible that you forgot to convert degrees
Celsius to kelvins before evaluating T 22 − T 2
1 . Because we are squaring the temperatures,the difference between kelvins and degrees Celsius can’t be ignored here.)
For comparison, suppose we had used the constant “textbook” value of the heat capacityof copper of 24.4 J K−1mol−1, which is an average valid near 25 ◦C. We would then havecalculated q = 184 kJ. Whether an error of this size is acceptable will very much dependon the purpose of the calculation.
Using our knowledge of heat capacity, we can also solve simple heat balance problems.These can generally only be solved if either the system is in an insulated container so thatno heat can escape, or the process is so fast that heat doesn’t have time to leak out. In theformer case, we would say that the system is (at least approximately) adiabatic. In thelatter case, the process would be quasi-adiabatic.
Example 5.6 Mixing hot and cold water Suppose that 100 g of water at 20 ◦C is addedto 200 g of water at 80 ◦C under atmospheric pressure in an insulated enclosure. What isthe final temperature of the mixture?
1 CRC Handbook of Chemistry and Physics, 66th ed.; CRC Press: Boca Raton, 1985, pp. D-43–D-49.

P1: SFK Trim: 247mm × 174mm Top: 14.586mm Gutter: 23.198mm
CUUK1808-05 CUUK1808/Roussel 978 1 107 00678 2 October 29, 2011 17:22
5.6 Heat capacity 75
To solve this problem, note that no heat flows out of this system since it is enclosed inan adiabatic container. Therefore q = 0 for the system consisting of the two samples ofwater. We treat each sample of water as if it were an independent entity. At equilibrium,both samples will reach the same temperature Tf . We know the initial temperatures. Wewrite a heat balance equation:
q = 0 = m1cp(Tf − T1) + m2cp(Tf − T2)
In this case, the two substances mixed are both water and have the same value of the specificheat capacity cp. We can therefore simplify this equation:
m1(Tf − T1) + m2(Tf − T2) = 0
Putting in our numbers, we get
100(Tf − 20) + 200(Tf − 80) = 0 =⇒ Tf = 60 ◦C
Exercise group 5.4
(1) A 200 W heating element is submerged in ten L of water in an insulated bottle whosecontents, initially at 25 ◦C, are held at constant pressure. How long does it take for thewater to boil? Assume that the boiling point is 100 ◦C.
(2) A 1 kg piece of iron is placed in 1 kg of water in a sealed, adiabatic container. Thewater temperature is initially 20 ◦C. The final equilibrium temperature of the system is80 ◦C. What was the initial temperature of the iron?
(3) The constant pressure heat capacity of the metal indium is given by the equation
Cp,m = 24.3 + 0.0105T
where T is in kelvins and Cp,m is in J K−1mol−1.(a) Calculate the amount of heat required to raise the temperature of a 12 g piece of
indium from 50 to 100 ◦C.(b) How large an error would result from using a (constant) average value of
28.0 J K−1mol−1?(4) X rays can be generated by firing high-energy electrons into a metal target. Only a
small fraction of the kinetic energy of the electrons is converted to X rays however.Most of the energy is transformed into heat.(a) Suppose that electrons, each with a kinetic energy of 2.5 × 10⁻¹⁴ J, are fired
into a copper anode of volume 85 cm3 (volume measured at 25 ◦C) at a rateof 2.5 × 10¹⁷ electrons−1s. The anode is hollow and contains 30 cm3 of water(measured at 25 ◦C). The anode and water are in good thermal contact. If all thekinetic energy were transformed to heat and assuming that none of the heat is lostto the surroundings, how long would it take for the anode’s temperature to increaseto 100 ◦C from 25? The density of copper at 25 ◦C is 7.11 g cm−3 and its specificheat capacity is 0.38 J K−1g−1.

P1: SFK Trim: 247mm × 174mm Top: 14.586mm Gutter: 23.198mm
CUUK1808-05 CUUK1808/Roussel 978 1 107 00678 2 October 29, 2011 17:22
76 The First Law of Thermodynamics
(b) To avoid excessive heating of the anode, the water it contains is constantly replacedby cool water. Suppose that water with an initial temperature of 4 ◦C flows throughthe anode at a rate of 6 L min−1. Assuming perfect mixing of the water in theanode and perfectly efficient heat transfer between the copper and water, whatsteady temperature would the anode reach?Hint: How much heat must be removed to hold the temperature steady?Note: The temperature you will calculate here is a lower bound since neither mixingnor heat transfer will be perfectly efficient in the real system.
5.6.1 Heat capacity from statistical thermodynamics
In statistical thermodynamics, we combine equations from statistical mechanics, like theBoltzmann distribution, with equations from thermodynamics in order to predict or ratio-nalize the values of thermodynamic quantities. Here, we will show how the heat capacityis related to the partition function of a system.
In Section 3.2, we found that the average energy of a system made of identicalmolecules was related to the molecular partition function by Equation (3.3). The inter-nal energy, on the other hand is the energy stored in a system, and thus in the moleculesthat make up that system. This will typically include terms due to intermolecular forces,and not just to the energy levels of the isolated molecules. However, if we can ignoreintermolecular forces, as in an ideal gas, or if we only want to consider the part ofthe energy stored by a particular type of molecule, then we can associate the averageenergy with the internal energy by U = N〈E〉, where N is the number of molecules,or, on a molar basis, Um = L〈E〉, where L is Avogadro’s number. Now, given Equa-tion (5.11), we can calculate the constant-volume heat capacity from the internal energy.Knowing the partition function of a system therefore gives us its constant-volume heatcapacity, just by taking a couple of derivatives with respect to temperature. This will giveus some insight into the molecular meaning of the heat capacity, as the following exampledemonstrates.
Example 5.7 Heat capacity of a two-level system In Example 3.1, we determined themolecular partition function of a molecule with the following energy levels:
i gi Ei/J
1 1 02 3 4 × 10⁻²¹
The partition function was
q = 1 + 3e−290 K/T (3.4)

P1: SFK Trim: 247mm × 174mm Top: 14.586mm Gutter: 23.198mm
CUUK1808-05 CUUK1808/Roussel 978 1 107 00678 2 October 29, 2011 17:22
5.6 Heat capacity 77
0
0.2
0.4
0.6
0.8
1
1.2
1.4
1.6
1.8
2
1 10 100 1000 10000 100000 0
2
4
6
8
10
12
Um
/kJ
mol
−1
CV,
m/J
K−1
mol
−1
T/K
UmCV,m
Figure 5.3 Molar internal energy and heat capacity of a system made up of molecules with two energylevels.
Applying Equation (3.3) and the correspondence between average molecular energy andinternal energy, we get
Um = LkBT 2
q
∂q
∂T
∣∣∣∣V
= RT 2
q
∂q
∂T
∣∣∣∣V
= 3R(290 K) exp (−290 K/T )
1 + 3 exp (−290 K/T )= (7.23 kJ/mol) exp (−290 K/T )
1 + 3 exp (−290 K/T ). (3.14)
The molar heat capacity is therefore
CV,m = ∂Um
∂T
∣∣∣∣V
= (2.09 × 10⁶ J K mol−1) exp (−290 K/T )
T 2 (1 + 3 exp (−290 K/T ))2 .
The molar internal energy and heat capacity are plotted in Figure 5.3.To understand Figure 5.3, compare it to Figure 3.1. Consider first the internal energy.
At low temperatures, only the ground state is occupied, so the average energy is the energyof the ground state, in this case zero. As the occupation of the excited state starts tobecome significant, the internal energy starts to grow because the average energy nowincludes some molecules in the excited state. Eventually, this curve levels off as the pop-ulations of the two levels approach their asymptotic ratio of one ground-state molecule tothree excited-state molecules. In fact, the internal energy tends to 3
4LE2 = 1.8 kJ mol−1.Finally note that because the ground state has zero energy, the molar internal energy(Equation 3.14) is directly proportional to the probability of occupying the excited state(Equation 3.5).

P1: SFK Trim: 247mm × 174mm Top: 14.586mm Gutter: 23.198mm
CUUK1808-05 CUUK1808/Roussel 978 1 107 00678 2 October 29, 2011 17:22
78 The First Law of Thermodynamics
What about the heat capacity? At very low temperatures, the internal energy increasesvery slowly as we increase T because almost all the molecules are stuck in the groundstate. The only way this simple system can store energy is by promoting moleculesfrom the ground to the excited state. At very low temperatures, the probability that amolecule will access the excited state is low, so the heat capacity, which measures thisability to store energy, is correspondingly small. As we approach the temperature where theexcited state become significant, there is a rapid increase in the probability that a moleculewill reach the excited state as we increase T , so the heat capacity starts to rise. The heatcapacity is largest where the probability of occupation of the excited state changes mostrapidly. Beyond that point, the heat capacity starts to drop because the probability of occu-pation of the excited state is starting to level off. Eventually, increasing T makes only anegligible difference to the probability of occupying the excited state, and the system is nolonger able to store additional energy, at least not while maintaining thermal equilibrium.The heat capacity therefore drops to zero.
Exercise group 5.5
(1) In Exercise group 3.1, problem 3, we considered a simple protein folding problem withthe following energy levels:
i gi Ei
1 1 −ε
2 4 0
Plot the molar heat capacity of this model protein, in units of R, vs. the reducedtemperature θ = kBT /ε.
5.7 Phase transitions
Phase transitions represent another easily reproducible set of heating or cooling events.During a phase transition, heat can flow into or out of the system without a change intemperature. The heat evolved in such a process is called the latent heat. On a practicallevel, latent heat is easy to work with since it’s just a certain amount of heat per unit ofmaterial (mass or moles) that has undergone the phase transition.
Example 5.8 Melting a solid Solid cyanamide (H2NCN) has a heat capacity of78.2 J K−1mol−1. It melts at 318.71 K and its enthalpy of fusion (melting) is 7.272 kJ mol−1.Suppose that we want to melt a 14.3 g sample of cyanamide initially at room temperature(20 ◦C). How much heat would that take?
We first have to calculate how much heat it will take to bring the cyanamide fromroom temperature to the melting point. There are a few data conversions to carry out

P1: SFK Trim: 247mm × 174mm Top: 14.586mm Gutter: 23.198mm
CUUK1808-05 CUUK1808/Roussel 978 1 107 00678 2 October 29, 2011 17:22
5.7 Phase transitions 79
first:
nH2NCN = 14.3 g
42.041 g mol−1= 0.340 mol
Ti = 20 + 273.15 K = 293 K
∴ q1 = nH2NCNCp,m�T
= (0.340 mol)(78.2 J K−1mol−1)(318.71 − 293 K) = 680 J
The heat required to melt the sample once it has reached the melting point is just
q2 = nH2NCN�fusHm = (0.340 mol)(7.272 kJ/mol) = 2.47 kJ
Note that q1 and q2 are not expressed in the same units. We will have to be careful aboutthat when adding them up:
q = q1 + q2 = 0.680 + 2.47 kJ = 3.15 kJ
The phase transition temperature depends on the pressure, although this dependence isa weak one for phase transitions involving only condensed phases. The two phases thatparticipate in a phase transition can coexist at the phase transition temperature. In otherwords, the two phases are in equilibrium at that temperature. Taking melting as an example,at the melting (a.k.a. fusion) temperature, the solid and liquid can coexist. If we add a littleheat, some of the solid melts, and if we remove a little heat, some of the liquid freezes.
Contrary to popular belief, freezing only exceptionally begins when the system reachesthe freezing point. The temperature normally falls somewhat below the freezing pointbefore freezing starts. This is called supercooling and it is an example of the creationof a metastable state, an unstable state that can persist for a long time if undisturbed.Once freezing has started, the heat released by freezing quickly returns the system toits equilibrium freezing temperature. The ice acts as a template for further freezing andsupercooling is no longer possible. Ice is said to nucleate freezing. Similarly, steam canbe supercooled because condensation is also a process that requires nucleation, this timeof water droplets.
Supercooling turns out to be important for understanding frost damage to living tissues.Body fluids can supercool substantially before they freeze. In laboratory experiments,human blood can supercool by 10 degrees or more before it starts to freeze. The degree ofsupercooling when the blood is still inside the subject is less, but may still be as much asfive or six degrees. Because it is in a metastable state, a supercooled liquid freezes quickly,often forming sharp crystals. If this happens in the bloodstream, these sharp crystals willpuncture blood vessels, causing hemorrhages. This is one of the things that kills frost-damaged organisms, and also makes it difficult to preserve organs for transplantation byfreezing them. There are two possible solutions to this problem. The first is to avoid freezingaltogether. This can be done by using antifreeze compounds, some of which work on theprinciple of freezing-point depression (Section 8.6). Many species of arthropods use thisstrategy, maintaining high concentrations of glycerol in their body fluids. Arctic fishes alsoavoid freezing, but using a different bit of physical chemistry. They have antifreeze proteins

P1: SFK Trim: 247mm × 174mm Top: 14.586mm Gutter: 23.198mm
CUUK1808-05 CUUK1808/Roussel 978 1 107 00678 2 October 29, 2011 17:22
80 The First Law of Thermodynamics
that bind efficiently to ice microcrystals, thus preventing these from becoming nucleationcenters. In other words, these proteins maintain a metastable state by interfering with theice nucleation process.
The second solution to the problem of frost damage is radically different. Some organ-isms, notably the wood frog Rana sylvatica, have ice- nucleating proteins. As their namesuggests, these proteins act as nucleation centers, preventing substantial supercooling. Theythus cause water to slowly freeze out of the frog’s tissues, including its bloodstream, attemperatures near the equilibrium freezing temperature of frog blood. Ice crystals formedin this way can follow the blood vessels, causing minimal damage, and allowing the frogto, quite literally, hop away after it has been thawed from being frozen solid.
Supercooling is not the only way to create a metastable state. Liquids can be super-heated. Interestingly, it is not possible to superheat a solid. The difference again has to dowith nucleation; bubble formation requires nucleation, but creating a liquid phase from asolid does not. Superheated liquids can be dangerous since they will eventually begin to boilviolently, throwing hot liquid and vapor about. This is why we generally use boiling chips(a.k.a. anti-bumping granules) when heating liquids in a laboratory. As a rule, this is muchless likely to be a problem at home because the surfaces of household pots are generallysufficiently irregular to nucleate bubble formation so that boiling starts at or very near thenormal boiling point. However, superheating is sometimes observed when heating a liquid(water, coffee) in a smooth container (mug, glass measuring cup, etc.) in a microwave oven.A surprising demonstration of superheating and of nucleation-induced boiling can be madeby adding a drop of cold water to a cup of coffee heated in a microwave oven. If the coffeeexceeded its boiling point, the warm water actually causes it to boil. (Be careful if you wantto try this. Only fill the mug 1
3 full. Note that it’s possible that the liquid will boil if youbump the mug. Moreover, boiling may be explosive. Again, be careful.) The solubility ofgases tends to decrease with increasing temperature, so the dissolved gases in the drop ofcold water come out of solution, then becoming nucleation centers for the solvent vaporand thus initiating boiling.
Example 5.9 (2) [Freezing of supercooled water]One mole of water is supercooled to−10 ◦C, then adiabatically isolated and held at constant pressure. A disturbance (bumping,dust, etc.) causes the water to freeze. Freezing releases heat, which causes the temperatureto increase. We want to know the equilibrium composition of the system (quantities ofwater and ice) and its final temperature.
Since the system is adiabatic, q = 0. The heat consists of two offsetting terms: thereis a negative contribution from the freezing process and a positive contribution from thetemperature rise.
There are two possibilities:
(1) The heat liberated by freezing is sufficient to warm the system to the normal freezingpoint. We obtain a mixture of ice and water at 0 ◦C.
(2) The heat liberated by freezing all of the ice is less than is necessary to raise thetemperature to the normal freezing point. We obtain a solid piece of ice at sometemperature below zero.

P1: SFK Trim: 247mm × 174mm Top: 14.586mm Gutter: 23.198mm
CUUK1808-05 CUUK1808/Roussel 978 1 107 00678 2 October 29, 2011 17:22
5.7 Phase transitions 81
Our first task is therefore to determine which of these two possibilities is the correct one.The enthalpy change on freezing is −6.007 kJ mol−1 and the heat capacity of liquid wateris 75.40 J K−1mol−1. Therefore, the amount of heat required to raise the temperature of onemole of water from −10 ◦C to 0 ◦C is Cp�T = 754 J. The heat capacity of the water is notsufficient to absorb all of the heat available from freezing without exceeding the meltingtemperature, so the first of the two possibilities is the correct one: Some of the water willfreeze, but not all of it. We now have one crucial datum: Tfinal = 0 ◦C.
The direct computation of the heat for simultaneous freezing and warming is difficult.Instead, using the fact that qp = �H and that H is a state function, we construct a differentpath for which the calculation is easy: Imagine that we first warm the liquid water to 0 ◦Cand then freeze just the right amount to liberate the heat required to balance the heat we“borrowed” to warm the water:
q = 0 = ntotalCp,m(H2O, l)�T + nfrozen�freezingHm
Plugging in the data for this problem, we calculate
nfrozen = 0.13 mol
The rest of the water (0.87 mol) remains liquid.
Exercise group 5.6
(1) One mole of ice at 0 ◦C is put in contact with one mole of steam at 100 ◦C in an adiabaticenclosure. The pressure is held constant at one atmosphere. What is the final compositionand temperature of the system?
(2) Suppose that you pick up a bottle of water at the supermarket on a hot day where theambient temperature is 32 ◦C. By the time you get home, you would like to have a drink,but the water has reached ambient temperature. You pour 325 g of water into a large plasticcup with a negligible heat capacity. The ice in your freezer is at a temperature of −5 ◦C.How much ice should you add if you want the temperature to equilibrate at 4 ◦C?
(3) The makers of a new metal alloy wish to determine its thermal properties. In particular,they would like to know the specific heat capacity of the solid and the melting temperature.They proceed as follows:� A 518.04 g sample is heated to 100.0 ◦C and is then transferred to an insulated water-
filled calorimeter with a heat capacity of 8403 J K−1 (including the water) at an initialtemperature of 22.04 ◦C. The equilibrium temperature is 24.33 ◦C.
� A sample is heated beyond its melting point and the temperature is measured as afunction of time as it cools. The results are shown in Figure 5.4.
Determine the specific heat capacity of the solid and melting temperature.(4) A condenser is a device that puts a vapor in thermal contact with a substance (often
water) that can absorb heat and therefore cause the vapor to condense. The heat-absorbingsubstance is usually held at constant temperature by being constantly resupplied froma reservoir held at a constant temperature. In the simplest case, we simply flow tap

P1: SFK Trim: 247mm × 174mm Top: 14.586mm Gutter: 23.198mm
CUUK1808-05 CUUK1808/Roussel 978 1 107 00678 2 October 29, 2011 17:22
82 The First Law of Thermodynamics
t1000
1100
1200
1300
1400
1500
T/K
Figure 5.4 Freezing curve for an alloy, showing the temperature as a function of time.
water through the condenser. Ethanol boils at 78.5 ◦C and its enthalpy of vaporization is40.476 kJ mol−1. The density of ethanol is 0.79 g mL−1.(a) In a small still, 1 L of liquid ethanol is produced per hour. The condenser is of the
usual water-flow type and the ethanol is not cooled appreciably below its boiling pointbefore entering the collection vessel. How much heat is gained by the water flowingthrough the condenser in an hour?
(b) Tap water enters the condenser at a temperature of 10 ◦C and flows through thecondenser at a rate of 40 L h−1. The density of water is approximately constant and is0.999 g mL−1. At what temperature is the water leaving the condenser?
5.8 Standard states and enthalpies of formation
We can measure the enthalpy change of a system during a process by measuring heattransfer at constant pressure, and the change in internal energy by measuring heat transferat constant volume. We can also convert enthalpies into internal energies and vice versausing Equation (5.7). (We will study this conversion in more detail in Section 5.9.) It is animportant observation that the total internal energy of a system can’t be measured usingthermochemical methods. The only things we can measure are changes in the internalenergy during processes. The same goes for any quantity that, like enthalpy, is derived fromthe internal energy.
Since, through a combination of measurements and calculations, we can determinechanges in enthalpy, we might be tempted to go forth and produce great tables of enthalpiesof reaction for every reaction in which we might be interested under a range of differentexperimental conditions. This turns out to be neither necessary nor desirable for mostpurposes.
It first makes sense to choose standard reporting conditions such that results fromdifferent laboratories can be compared. Most recent tables of thermodynamic data refer to astandard state that is defined as a pressure of one bar (100 000 Pa) and a temperature of 25 ◦Cfor all components. (Until recently, the standard pressure was one atmosphere (101 325 Pa)and many tables you will encounter were prepared for that pressure. Moreover, the normalboiling (or melting) point of a substance is still generally defined to be the boiling (melting)
P1: SFK Trim: 247mm × 174mm Top: 14.586mm Gutter: 23.198mm
CUUK1808-05 CUUK1808/Roussel 978 1 107 00678 2 October 29, 2011 17:22
5.8 Standard states and enthalpies of formation 83
point at 1 atm. This is particularly important for boiling points, which vary significantlywith pressure.) There are other aspects to the definition of a standard state, but for themoment these will suffice. Data obtained under other conditions are generally corrected tothe standard conditions before reporting. Quantities measured in or corrected to the standardstate are denoted by a superscripted circle, e.g. �H ◦. Tables of thermodynamic data aresometimes produced for other conditions, but in those cases the conditions always needto be specified. Data produced by biochemists should be particularly carefully scrutinizedbecause they often use a slightly different standard state, described in detail later in thisbook.
One of the reasons that we try to work with state functions, rather than the more directlyaccessible path functions heat and work, is that state functions are path independent. Theimportance of this property cannot be overemphasized. It means, among other things, thatwe can break processes up in our imaginations into steps that may never have happened,but that result in equivalent changes in the system being studied. This leads to an importantsimplification in the collection and use of thermodynamic data: the standard enthalpyof formation (�f H 0) of a chemical compound is defined as the enthalpy change for theprocess of assembling that compound from its elements in their most stable forms understandard conditions. For instance, the standard enthalpy of formation of methane is thechange in enthalpy during the reaction
C(s) + 2H2(g) → CH4(g)
In this reaction, C(s) would be the most stable form of the element at 25 ◦C, i.e. graphite. Itfollows from this definition that the enthalpy of formation of any element in its most stableform is zero. For instance, �f H ◦ = 0 for O2(g), but not for O3(g).
There is one exception to the rule that the element in its most stable form is assigneda standard free energy of formation of zero, namely phosphorus. The form we currentlybelieve to be the most stable form, black phosphorus, is difficult to make in pure form. Itwas therefore decided to use white phosphorus as the reference form of this element. Thisexception to our general rule underlines the arbitrary nature of the enthalpy of formationconvention.
Solvated ions pose an additional problem: we can’t make a solution containing a sin-gle type of ion because we make solutions by dissolving neutral ionic compounds in asolvent. We therefore can’t measure an enthalpy of formation for a single ion. To put itanother way, the partition of the enthalpy of formation of an ion/counterion pair betweenthe two ions is arbitrary. We would still like to have single-ion enthalpies of formationto avoid the need for our tables to contain enthalpies of formation for every possibleionic compound as a solute. The convention adopted is to arbitrarily fix the enthalpy offormation of the hydrogen ion (H+) to zero. We can then build up tables of enthalpiesof formation for ionic compounds by starting with acids, and working our way out fromthere.
We can write a formation reaction for an aqueous ion by adding enough hydrogen ionsto balance for charge, and then adding enough H2 to balance the hydrogen atoms. For

P1: SFK Trim: 247mm × 174mm Top: 14.586mm Gutter: 23.198mm
CUUK1808-05 CUUK1808/Roussel 978 1 107 00678 2 October 29, 2011 17:22
84 The First Law of Thermodynamics
Σ
rH 0
Δ f H0(reactants)−Σ
ProductsReactants
Elements
Δ f H0(products)
Δ
Figure 5.5 Calculation of �rH◦ for an arbitrary reaction from �f H ◦ data. Rearranging the reactants
into their elements is the reverse of the corresponding formation reactions, so the change in enthalpy forthis step is −∑�f H ◦(reactants) (taking into account the stoichiometric coefficients of the reactants).Rearranging the elements into the products involves a change in enthalpy of
∑�f H ◦ (products).
These two terms are added to give the enthalpy of reaction, �rH◦.
instance, the formation reaction of a nitrate ion would be
1
2N2(g) + 3
2O2(g) + 1
2H2(g) → NO−
3(aq) + H+(aq)
(Note the use of fractional coefficients in this formation reaction. Formation reactions mustalways be written with a stoichiometric coefficient of 1 in front of the compound or ionbeing made.) This reaction is the formation reaction for aqueous HNO3. However, since wefixed �f H ◦(H+, aq) to be zero, the enthalpy change in this reaction is equal to the enthalpyof formation of the nitrate ion.
Suppose that we have a table of standard enthalpies of formation and we want to knowthe standard enthalpy change for a balanced reaction A → B. We obtain this quantity bythe following conceptual decomposition:
(1) Break down A into its elements. The standard enthalpy change for this process is−�f H ◦(A) because this step is the reverse of the formation reaction.
(2) Reassemble the elements of A into B. We know this can be done because the reactionis stoichiometrically balanced. The standard enthalpy change here is �f H ◦(B).
(3) Put together, the two processes above accomplish the same change as the overallreaction A → B, so �rH
◦m = �f H ◦(B) − �f H ◦(A).
In general, we add the standard enthalpies of formation of the products and subtract theenthalpies of formation of the reactants to get the standard enthalpy change of a reaction, asillustrated in Figure 5.5. Note the use of the subscript r to denote an enthalpy of reaction.
We should pause here to discuss notation. There is a logic to the IUPAC notation forchanges in state functions which may not be immediately obvious, but which actuallymakes good physical sense. Recall that H (for example) is a state function, i.e. a propertyof a system. During a process, H may change, but it remains a property of a system. Whenwe write �rH , we are denoting the change in the value of H for a system during a chemicalreaction. The symbol � indicates a change, and the subscript says what that change is due

P1: SFK Trim: 247mm × 174mm Top: 14.586mm Gutter: 23.198mm
CUUK1808-05 CUUK1808/Roussel 978 1 107 00678 2 October 29, 2011 17:22
5.8 Standard states and enthalpies of formation 85
to. We should not put the subscript r on the H (as was formerly done) because H is aproperty of the system itself and not of a reaction or other process that may affect thatsystem. Subscripts indicating the type of change are therefore always attached to the �.
The same logic applies to enthalpies of formation: �f H ◦(A) is the (molar) change inenthalpy when a system consisting of an appropriate stoichiometric mixture of the elementsin their standard states reacts to form one mole of A in its standard state. The system, whichat all times contains the correct number of atoms of each kind to make a mole of A,undergoes a particular type of reaction, and �f H ◦(A) is the change in enthalpy of thesystem during this process. There are two additional points of note here:
(1) Because enthalpies of formation are nearly always given as molar enthalpies, we don’tusually bother with the subscript m, although it would be more accurate to write�f H ◦
m(A).(2) If we need to specify the state of A, for instance to distinguish two possible phases, we
simply add this information to the parenthesis. For example, we can have �f H ◦(H2O, l)for liquid water, or �f H ◦(H2O, g) for the vapor. We usually only include this infor-mation if there is any potential for ambiguity.
We say that a reaction is exothermic if the system produces heat as a result of thereaction (�rH
◦ < 0). Conversely, a reaction during which the system absorbs heat is saidto be endothermic (�rH
◦ > 0).Occasionally, one encounters tables of standard enthalpies of combustion, �cH
◦m. These
are standard enthalpies for the complete combustion of one mole of a substance by oxygen.Since these tables are given for combustion under standard conditions (1 bar and 25 ◦C),when water appears as a product, it is assumed to be in the liquid state rather than the vapor.In practical terms, the experiments from which these values are derived are usually carriedout in a bomb calorimeter, a device in which the heat generated by the combustion is rapidlydispersed, thus leading to the condensation of the water. Since only the beginning and endstates matter in thermodynamics, we don’t care that the water was initially generated asvapor, only that it returns to the liquid state before the experiment is over. Given the standardenthalpies of formation of a few key compounds (water, carbon dioxide), we can convertthe standard enthalpies of combustion to standard enthalpies of formation, or devise othercycles to compute the standard enthalpy changes during reactions.
Example 5.10 Enthalpy of formation from enthalpy of combustion The standardenthalpy of combustion of galactose (C6H12O6, an isomer of glucose) is −2804.54 kJ mol−1.What is the standard enthalpy of formation of galactose?
The phrase “enthalpy of combustion of galactose” refers to the enthalpy change in thereaction
C6H12O6(s) + 6O2(g) → 6H2O(l) + 6CO2(g)
For this reaction,
�cH◦m = 6�f H ◦(H2O, l) + 6�f H ◦(CO2) − 6�f H ◦(O2) − �f H ◦(galactose)

P1: SFK Trim: 247mm × 174mm Top: 14.586mm Gutter: 23.198mm
CUUK1808-05 CUUK1808/Roussel 978 1 107 00678 2 October 29, 2011 17:22
86 The First Law of Thermodynamics
Using the data from Appendix A.1, we can calculate �f H ◦(galactose):
�f H ◦(galactose) = 6�f H ◦(H2O, l) + 6�f H ◦(CO2) − �cH◦m
= −1271.50 kJ mol−1
Example 5.11 Reactions and heat balance What is the temperature change of the solutionwhen 1.5 g of magnesium chloride hexahydrate is dissolved in 100 g of water?
The first assumption in these problems (often unstated) is that the reaction occurs quicklyenough that the system can be treated as being quasi-adiabatic. Then we have
q = 0 = �rH◦ + Cp�T
We will calculate �rH◦, which will then allow us to get �T subject to an additional
assumption about the heat capacity of the system, discussed later.The process is
MgCl2 · 6H2O(s) → Mg2+(aq) + 2Cl−(aq) + 6H2O(l)
For this process,
�rH◦m = �f H ◦(Mg2+, aq) + 2�f H ◦(Cl−, aq) + 6�f H ◦(H2O, l)
− �f H ◦(MgCl2 · 6H2O, s)
= −17.1 kJ mol−1
The number of moles of magnesium chloride hexahydrate is
n = 1.5 g
203.33 g mol−1= 7.4 × 10⁻³ mol
Therefore �rH◦ = n�rH
◦m = −126 J. The reaction is exothermic, so 126 J of heat is
produced, which will go to heating the system (water+solutes). Technically, we need theheat capacity of the solution to complete this problem. However, our system is mostlywater, so we assume that the mass and heat capacity are similar to those of the solventwater. Note that the amount of water generated by the reaction (about 0.8 g) is negligibleconsidering the other approximations we are making, particularly with regard to the heatcapacity of the solution. Thus,
�T = −�rH◦
mcp
= 126 J
(100 g)(4.184 J K−1g−1)= 0.30 K
When we use the heat capacity of water as the heat capacity of a solution, we are livingin a state of sin. Why do we do this? There are a few reasons, some of them good ones, andsome of them not so good:
� Heat capacity data for solutions are not as readily available as heat capacities for puresubstances.

P1: SFK Trim: 247mm × 174mm Top: 14.586mm Gutter: 23.198mm
CUUK1808-05 CUUK1808/Roussel 978 1 107 00678 2 October 29, 2011 17:22
5.8 Standard states and enthalpies of formation 87
� The heat capacity of a solution depends in a complicated way on the concentration ofthe solute. For some solutes in some concentration ranges, the heat capacity can increasewith the addition of the solute, while the heat capacity decreases in other concentrationranges for the same solute.
� The purpose of the calculation influences how worried we should be about not knowingthe true heat capacity of the solution. Often, we just want to know if mixing A and B willgenerate enough heat to be dangerous. Having done the previous calculation, I wouldn’tworry about adding any amount of magnesium chloride to water. On the other hand, if thecalculation had resulted in a predicted �T of several tens of degrees, I might be carefulabout how I made the addition, particularly since local heating (near the site(s) where thesolute is entering solution) can be much higher than the average heating in a well-mixedsolution. In cases like this, I don’t care if my answer is only accurate to within 20 or 30%(which is pessimistic for the calculation in the example) since I’m not going to rely onevery significant figure of the calculation.
The heat capacity issue isn’t the only neglected factor in Example 5.11. Another impor-tant effect is that the enthalpy change depends on the concentration of solutes, particularlywhen these solutes are subject to strong intermolecular forces like the Coulomb forcebetween ions. These forces contribute to the energy of the system, and thus to the enthalpy.To interpret these effects, it is important to understand one additional aspect of the standardstate used in thermodynamics tables, namely that the thermodynamic data of solutes aregenerated by extrapolation to a state of infinite dilution in order to remove the dependenceon solute–solute forces. We can quantify the importance of solute–solute forces by mea-suring the heat of dilution. In Example 5.11, we made a 0.074 mol kg−1 (moles of solutedivided by kilograms of solvent) solution of magnesium chloride in water. Now imaginethat we diluted this solution with additional water. We could measure the heat released orabsorbed as we carried out this dilution. Eventually, the solution would be so dilute thatwe would, effectively, just be adding water to water, and no further heat would be released.This is the infinite dilution limit. The total heat released in going from 0.074 mol kg−1
to infinite dilution, called the integral heat of dilution, is equal in size and opposite insign to the amount by which our calculated heat would differ from the value we wouldactually expect to see in an experiment. Heats of dilution can vary tremendously in sizedepending on the ions involved and on the concentration, and they can even change sign fordifferent initial concentrations. In relatively dilute solutions such as the one contemplatedin Example 5.11, enthalpies of dilution are usually small (at most 10 kJ mol−1, and usuallymuch less than 1 kJ mol−1), but for more concentrated solutions, this effect can add up toseveral tens of kJ mol−1. Moreover, note the relatively small size of the enthalpy of reactionin the example above. In a case like this, the enthalpy of dilution could easily be similarin size to �rH
◦, so the temperature change we have calculated could be out by a substan-tial fraction. Again, whether or not this is a problem will depend on the purpose of thecalculation.

P1: SFK Trim: 247mm × 174mm Top: 14.586mm Gutter: 23.198mm
CUUK1808-05 CUUK1808/Roussel 978 1 107 00678 2 October 29, 2011 17:22
88 The First Law of Thermodynamics
Exercise group 5.7
(1) 1.5 mol of sodium chloride is put into an adiabatic container with 1 L of water. If thewater starts out at 298.15 K, what is the final temperature of the solution obtained?
(2) The standard enthalpy of combustion of liquid benzene is −3268 kJ mol−1. What is thestandard enthalpy of formation of benzene?
(3) Single-use instant cold packs contain water and ammonium nitrate, separated by amembrane. Squeezing the pack breaks the membrane. Dissolving ammonium nitrate inwater is an endothermic reaction which absorbs 25.69 kJ mol−1 of ammonium nitratedissolved.(a) What is the standard enthalpy of formation of the aqueous nitrate ion?(b) You have been given a contract to design an instant cold pack which will cool to
2 ◦C from an initial temperature of 20 ◦C and which is to contain 250 mL of water.Approximately how much ammonium nitrate should it contain? Assume that theheat capacity of the solution is approximately equal to that of water.
(4) A typical person at rest in a warm room emits heat at a rate of about 100 W. This is areasonable measurement of a person’s resting metabolic rate.(a) Suppose that most of the heat originates from oxidizing glucose to carbon dioxide
and water. How much glucose (in moles) would this person oxidize per minute?Note: Biological oxidations occur in solution phase.
(b) How many moles of oxygen would be required?(c) An average breath brings in about 0.5 L of air containing 21% oxygen. About 25%
of the oxygen taken into the lungs is absorbed into the bloodstream. How manybreaths per minute would be required by a person at rest to maintain their restingmetabolic rate? Assume that the air has a temperature of 20 ◦C and a pressure of1 atm.
(d) How much work is done by the chest muscles each minute expanding the lungs by0.5 L per breath against a constant external pressure of 1 atm?
5.8.1 Adding chemical reactions
Since the change in enthalpy does not depend on the path taken, when a reaction can bebroken down into steps for which we know the individual changes in enthalpy, �rH
◦ forthe overall process can be obtained by adding the enthalpy changes of the steps. We nowillustrate the application of this principle by a few examples.
Example 5.12 Calculation of reaction enthalpies from combustion enthalpies Thecombustion enthalpies of α-d-glucose and of β-d-glucose are, respectively, �cH
◦m(α) =
−2801.5 and �cH◦m(β) = −2807.8 kJ mol−1. Calculate the enthalpy change during the
isomerization of α to β-d-glucose.

P1: SFK Trim: 247mm × 174mm Top: 14.586mm Gutter: 23.198mm
CUUK1808-05 CUUK1808/Roussel 978 1 107 00678 2 October 29, 2011 17:22
5.8 Standard states and enthalpies of formation 89
Both compounds have the molecular formula C6H12O6. The combustion reactions are
α-d-glucose + 6O2 → 6H2O + 6CO2
and
β-d-glucose + 6O2 → 6H2O + 6CO2
The isomerization reaction is
α-d-glucose → β-d-glucose.
If we add the first reaction to the reverse of the second, we get the isomerization reaction.Accordingly,
�isomerH◦m = �cH
◦m(α) − �cH
◦m(β) = 6.3 kJ mol−1.
Example 5.13 Changing the state of water in a reaction The enthalpy of combustion ofhydrazine (N2H4(l)) to water vapor and nitrogen gas is −534 kJ mol−1. However, standardenthalpies of combustion are normally given for a reaction yielding liquid water as aproduct. Compute the standard enthalpy of combustion for hydrazine.
The combustion reaction for which we have data is
N2H4(l) + O2(g) → 2H2O(g) + N2(g)
The vaporization reaction is H2O(l) → H2O(g). We can get the molar enthalpy of vapor-ization of water at 25 ◦C in one of two ways: Appendix C gives the specific enthalpy ofvaporization as 2443 J g−1, which can be converted to 44.02 kJ mol−1 using the molar mass;alternatively, we can calculate it as a difference of enthalpies of formation for the vaporand liquid state of water from the data of Appendix A.1. This gives 44.004 kJ mol−1. Thesmall difference between the two values is due to the limited number of significant figuresin Appendix C. Given the precision of the hydrazine combustion data, this difference won’tmake any difference to the final result.
We want to turn the vaporization reaction around and double it up to cancel thegaseous water in the hydrazine combustion reaction, i.e. 2H2O(g) → 2H2O(l) with �H ◦
m =−2(44.004 kJ mol−1) = −88.008 kJ mol−1. Accordingly, the standard enthalpy of combus-tion of hydrazine is −534 + (−88.008) kJ mol−1 = −622 kJ mol−1.
Exercise group 5.8
(1) The following reactions occur in the gas phase:
CH3NO2(g) + HNO3(g) → 2NO2(g) + CH3OH(g) �r(1)H◦m = 66.48 kJ mol−1
CH3NO2(g) + HCl(g) → NOCl(g) + CH3OH(g) �r(2)H◦m = 8.95 kJ mol−1
When NO2 and hydrogen chloride react in the gas phase, the products are HNO3 andNOCl. What is the enthalpy change in this reaction?

P1: SFK Trim: 247mm × 174mm Top: 14.586mm Gutter: 23.198mm
CUUK1808-05 CUUK1808/Roussel 978 1 107 00678 2 October 29, 2011 17:22
90 The First Law of Thermodynamics
(2) Given the following data
Cl−(g) + SO2(g) → Cl−(g) · SO2(g), �r(1)H◦m = 91 kJ mol−1
Cl−(g) · SO2(g) + SO2(g) → Cl−(g) · 2SO2(g), �r(2)H◦m = 51.5 kJ mol−1
Cl−(g) · 2SO2(g) + SO2(g) → Cl−(g) · 3SO2(g), �r(3)H◦m = 41.8 kJ mol−1
Cl−(g) · 3SO2(g) + SO2(g) → Cl−(g) · 4SO2(g), �r(4)H◦m = 36 kJ mol−1
what is the enthalpy change for the complete dissociation of Cl−(g) · 4SO2(g) into Cl−(g)
and SO2(g)?
5.9 More on the relationship between internal energy and enthalpy
If we know �H , then in principle we can calculate �U , or vice versa:
�H = �U + �(pV )
To do this, we need to know how the product pV has changed during a process. If theprocess involves only solids or liquids, which we call condensed phases, then pV is verysmall and consequently its change is insignificant, as we will see in the following example.
Example 5.14 Difference between �U and �H for the melting of ice Suppose that wewant to calculate �U ◦
m for the melting of ice at 0 ◦C and 1 atm = 101 325 Pa. We’re going tomind our significant digits carefully during this calculation. Note the table of properties ofwater in appendix C. The molar enthalpy of fusion of ice at 0 ◦C and 1 atm is 6007 J mol−1.At constant pressure, �U ◦
m = �H ◦m − p �V ◦
m. Appendix C gives data for water and iceat the standard pressure of 1 bar. For the purpose of this calculation, which only involvescondensed phases, the difference between 1 bar and 1 atm is negligible. The molar volumesare computed from the densities and molar masses:
V ◦m(ice) = 18.02 g mol−1
0.915 g cm−3= 19.7 cm3 mol−1
We want this quantity in SI units:
V ◦m(ice) = (19.7 cm3 mol−1)
(1 m
100 cm
)3
= 1.97 × 10⁻⁵ m3 mol−1
Similarly, for liquid water at 0 ◦C:
V ◦m(water) = 18.02 g mol−1
0.9999 g cm−3
(1 m
100 cm
)3
= 1.802 × 10⁻⁵ m3 mol−1
We can now compute the change in the internal energy:
�U ◦m = 6007 J mol−1 − (101 325 Pa)(1.802 − 1.97) × 10−5m3 mol−1
= 6007 J mol−1 − (101 325 Pa)(−0.17 × 10⁻⁵m3 mol−1)
= 6007 J mol−1 + 0.17 J mol−1 = 6007 J mol−1

P1: SFK Trim: 247mm × 174mm Top: 14.586mm Gutter: 23.198mm
CUUK1808-05 CUUK1808/Roussel 978 1 107 00678 2 October 29, 2011 17:22
5.9 Internal energy and enthalpy 91
Note that, within the significant figures of this problem, the p�V ◦m term doesn’t make any
difference. Many chemical processes have enthalpy changes that are known only to a fewtens or hundreds of a J mol−1 (hundredths or tenths of a kJ mol−1), or even just to the nearestkJ mol−1, rather than to the nearest J mol−1 as in this case. The difference between �H and�U for reactions involving only condensed phases would be even farther removed fromthe significant figures in these cases.
It is only when processes involve gases that we need to worry about the pV differencebetween �H and �U . In the case of a reaction involving gases, we can approximatethe value of pV by nRT . If, as will usually be the case, we are interested in changesoccurring under standard conditions, T = 298.15 K is constant and the number of molesof gas in the system is the only thing that might change during the reaction. Therefore�r (pV ) ≈ RT �rngas, where �rngas is the change in the number of moles of gas duringthe reaction. The relationship between �rH and �rU is therefore
�rH ≈ �rU + RT �rngas
or, if we divide by the number of moles of a reactant,
�rHm ≈ �rUm + RT �rνgas (5.15)
Since we divided the change in the number of moles of gas by the number of moles ofa reactant, the quantity �rνgas is the difference between the stoichiometric coefficients ofgas-phase reactants and products.
Example 5.15 Conversion between enthalpies and internal energies of reaction Whatis �rU
◦m for the reaction H2(g) + 1
2 O2(g) → H2O(g)?This is the formation reaction for gaseous water so �rH
◦m = �f H ◦(H2O, g) =
−241.826 kJ mol−1. For this reaction �rνgas is 1 − (1 + 12
) = − 12 . Therefore
�rU◦m ≈ �rH
◦m − RT �rνgas
= −241.826 kJ mol−1
− (8.314 472 × 10−3 kJ K−1mol−1)(298.15 K)
(−1
2
)= −240.587 kJ mol−1
The transformation between energies and enthalpies most often comes up in calorimetrybecause a constant-volume (“bomb”) calorimeter is the most convenient way to obtainthe required data. Figure 5.6 shows the major parts of a typical bomb calorimeter. Thecalorimeter has three major parts, the calorimeter jacket, which is just an insulated enclosure,the bucket, and the bomb. The bucket is filled with a known and carefully measured amountof water. A thermometer (not shown) measures the temperature of the water, which ismechanically stirred during the experiment to ensure rapid equilibration. The bomb is asealed vessel which is filled with a high pressure of oxygen to ensure complete combustionof the sample. The bomb and bucket are both made of metal and touch each other. The

P1: SFK Trim: 247mm × 174mm Top: 14.586mm Gutter: 23.198mm
CUUK1808-05 CUUK1808/Roussel 978 1 107 00678 2 October 29, 2011 17:22
92 The First Law of Thermodynamics
bucket
To current source
bomb
Calorimeter jacket
Water−filled
Insulator
SampleFuse wire
Figure 5.6 Schematic diagram of a bomb calorimeter. The complete apparatus is shown above, whilethe drawing below shows a blowup of the sample cup and related parts.
bucket sits on top of some insulating posts, both to prevent electrification of the jacket, andto increase the thermal insulation of the bucket by minimizing the contact area with thejacket. The current source is connected to the bucket and to an electrode which is insulatedfrom the bomb. Thus, there is a current path through the fuse wire, a thin wire made ofa material (often a magnesium alloy) that burns quickly and completely in air. The fuse
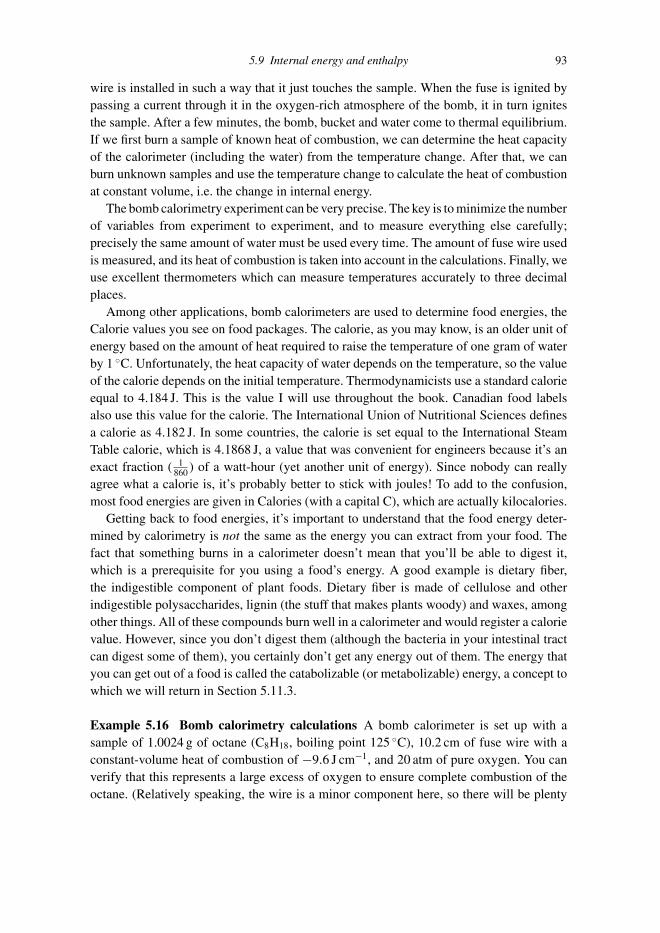
P1: SFK Trim: 247mm × 174mm Top: 14.586mm Gutter: 23.198mm
CUUK1808-05 CUUK1808/Roussel 978 1 107 00678 2 October 29, 2011 17:22
5.9 Internal energy and enthalpy 93
wire is installed in such a way that it just touches the sample. When the fuse is ignited bypassing a current through it in the oxygen-rich atmosphere of the bomb, it in turn ignitesthe sample. After a few minutes, the bomb, bucket and water come to thermal equilibrium.If we first burn a sample of known heat of combustion, we can determine the heat capacityof the calorimeter (including the water) from the temperature change. After that, we canburn unknown samples and use the temperature change to calculate the heat of combustionat constant volume, i.e. the change in internal energy.
The bomb calorimetry experiment can be very precise. The key is to minimize the numberof variables from experiment to experiment, and to measure everything else carefully;precisely the same amount of water must be used every time. The amount of fuse wire usedis measured, and its heat of combustion is taken into account in the calculations. Finally, weuse excellent thermometers which can measure temperatures accurately to three decimalplaces.
Among other applications, bomb calorimeters are used to determine food energies, theCalorie values you see on food packages. The calorie, as you may know, is an older unit ofenergy based on the amount of heat required to raise the temperature of one gram of waterby 1 ◦C. Unfortunately, the heat capacity of water depends on the temperature, so the valueof the calorie depends on the initial temperature. Thermodynamicists use a standard calorieequal to 4.184 J. This is the value I will use throughout the book. Canadian food labelsalso use this value for the calorie. The International Union of Nutritional Sciences definesa calorie as 4.182 J. In some countries, the calorie is set equal to the International SteamTable calorie, which is 4.1868 J, a value that was convenient for engineers because it’s anexact fraction ( 1
860 ) of a watt-hour (yet another unit of energy). Since nobody can reallyagree what a calorie is, it’s probably better to stick with joules! To add to the confusion,most food energies are given in Calories (with a capital C), which are actually kilocalories.
Getting back to food energies, it’s important to understand that the food energy deter-mined by calorimetry is not the same as the energy you can extract from your food. Thefact that something burns in a calorimeter doesn’t mean that you’ll be able to digest it,which is a prerequisite for you using a food’s energy. A good example is dietary fiber,the indigestible component of plant foods. Dietary fiber is made of cellulose and otherindigestible polysaccharides, lignin (the stuff that makes plants woody) and waxes, amongother things. All of these compounds burn well in a calorimeter and would register a calorievalue. However, since you don’t digest them (although the bacteria in your intestinal tractcan digest some of them), you certainly don’t get any energy out of them. The energy thatyou can get out of a food is called the catabolizable (or metabolizable) energy, a concept towhich we will return in Section 5.11.3.
Example 5.16 Bomb calorimetry calculations A bomb calorimeter is set up with asample of 1.0024 g of octane (C8H18, boiling point 125 ◦C), 10.2 cm of fuse wire with aconstant-volume heat of combustion of −9.6 J cm−1, and 20 atm of pure oxygen. You canverify that this represents a large excess of oxygen to ensure complete combustion of theoctane. (Relatively speaking, the wire is a minor component here, so there will be plenty

P1: SFK Trim: 247mm × 174mm Top: 14.586mm Gutter: 23.198mm
CUUK1808-05 CUUK1808/Roussel 978 1 107 00678 2 October 29, 2011 17:22
94 The First Law of Thermodynamics
of oxygen to burn it, too.) The calorimeter has a heat capacity (previously measured) of12.04 kJ K−1. The octane is ignited and the temperature rises from 294.281 to 298.268 K.What is the enthalpy of formation of octane?
We can straightforwardly calculate the heat liberated by the two reactions (combustionof the octane and fuse wire) from the temperature rise. Note that because the reaction iscarried out at constant volume and the calorimeter is an (approximately) adiabatic device,
�cU = −CV �T = −(12.04 kJ K−1)(298.268 − 294.281 K)
= −(12.04 kJ K−1)(3.987 K) = −48.00 kJ
Of this amount, the following is due to the fuse wire:
�cU (fuse) = (10.2 cm)(−9.6 J cm−1) = −98 J ≡ −0.098 kJ
The heat due to the combustion of octane is therefore
�cU (C8H18) = −48.00 − (−0.098) kJ = −47.91 kJ
We also know the number of moles of octane because we know the mass used: noctane =1.0024 g/114.230 g mol−1 = 8.7753 × 10⁻³mol. We can then work out the change in inter-nal energy per mole of octane burned:
�cU◦m = −47.91 kJ/8.7753 × 10−3mol = −5459 kJ mol−1
Note that this is, for all intents and purposes, a standard internal energy of combustionsince the initial and final temperatures are both close to 298 K.
The standard enthalpy change for the reaction is obtained by �cH◦m = �cU
◦m +
RT �cνgas. We now need a balanced reaction:
C8H18(l) + 25
2O2(g) → 8CO2(g) + 9H2O(l)
How do we know that the octane and water should be liquid? The initial temperature is wellbelow the boiling point of octane and the final temperature is well below the boiling pointof water. This detail is important because we need to know the states of the compounds tocalculate �cνgas. The latter quantity only depends on the stoichiometric coefficients of thegases, in this case oxygen and carbon dioxide, and works out to �cνgas = 8 − 25
2 = − 92 .
Therefore, the standard enthalpy of combustion of octane is
�cH◦m = −5459 kJ mol−1 + (8.314 472 × 10−3 kJ K−1mol−1)(298.15 K)
(−9
2
)= −5470 kJ mol−1

P1: SFK Trim: 247mm × 174mm Top: 14.586mm Gutter: 23.198mm
CUUK1808-05 CUUK1808/Roussel 978 1 107 00678 2 October 29, 2011 17:22
5.9 Internal energy and enthalpy 95
We want the standard enthalpy of formation. From the reaction, we have
�cH◦m = 8�f H ◦
CO2+ 9�f H ◦
H2O(l)− �f H ◦(C8H18, l)
∴ �f H ◦(C8H18, l) = 8�f H ◦CO2
+ 9�f H ◦H2O(l)
− �cH◦m
= 8(−393.51) + 9(−285.83) − (−5470) kJ mol−1
= −250 kJ mol−1
Note that the precision of this calculation was limited by the precision in our measurementof �T . However, just getting a better thermometer would not, in this case, get us a moreaccurate number. Bomb calorimeters have some intrinsic limitations, largely associatedwith the fact that they are not perfectly insulated, and thus that there is a constant heatleak between the calorimeter and lab during the experiment. There are, however, othercalorimeter designs for which this is not a problem.
Exercise group 5.9
(1) (a) Compute the standard enthalpy of combustion of acetylene (ethyne) to carbondioxide and liquid water.
(b) Compute the standard change in internal energy during the combustion of acety-lene. Treat all gases as ideal.
(2) Carbohydrates have the empirical formula CH2O. Show that for the combustion ofcarbohydrates, �cU ≈ �cH . Hint: The temperature in a calorimeter seldom rises veryfar above room temperature. At these temperatures, carbohydrates are solids and wateris liquid.
(3) Catalytic hydrogenation converts unsaturated hydrocarbons into saturated hydrocar-bons by reaction with hydrogen gas. How much heat is produced or absorbed per moleof ethene (C2H4(g)) hydrogenated to ethane (C2H6(g)) in a constant-volume reactor at298.15 K? Indicate clearly whether heat is absorbed or produced.
(4) Formaldehyde (methanal, CH2O) is a gas at room temperature. It has a standard enthalpyof combustion of −570.78 kJ mol−1.(a) What is the standard enthalpy of formation of this compound?(b) Calculate the heat generated by the combustion of 1.0045 g of formaldehyde in a
bomb calorimeter assuming that the temperature stays near 25 ◦C.(5) It is very important that the amount of sample used in a bomb calorimeter be limited
since the heat from the reaction warms the oxygen, which increases the pressure in thebomb. Suppose that we want to use a bomb calorimeter to measure the combustionenergy of coal. A typical value for this combustion energy is −25 kJ g−1. If the manu-facturer recommends that the temperature rise in the calorimeter be limited to 6 K andthe constant-volume heat capacity of the device is 10 kJ K−1, what is the maximumpermissible sample size?
(6) (a) During the calibration of a constant-volume calorimeter, a 1.0095 g sample ofbenzoic acid (C6H5COOH) is burned completely in an excess of oxygen. The

P1: SFK Trim: 247mm × 174mm Top: 14.586mm Gutter: 23.198mm
CUUK1808-05 CUUK1808/Roussel 978 1 107 00678 2 October 29, 2011 17:22
96 The First Law of Thermodynamics
experiment also used 9.8 cm of fuse wire with a (constant-volume) heat of combus-tion of −9.6 J cm−1. The temperature rises by 2.579 ◦C. What is the heat capacityof the calorimeter? The change in molar internal energy on combustion of benzoicacid is −3225.7 kJ mol−1.
(b) A 1.1243 g sample of solid sucrose (C12H22O11) is then burned in the samecalorimeter with 10.1 cm of fuse wire. The temperature rises by 1.805 ◦C. What isthe molar energy of combustion of sucrose?
(c) Using the result from question 6 and the standard enthalpies of formation of carbondioxide and water from Appendix A.1, calculate the standard enthalpy of formationof sucrose. Compare your result with the value given in Appendix A.1.
(7) The bombardier beetle defends itself by spraying a quinone solution at its attackers.Quinone is a noxious substance that repels most of its potential predators. The spray isforcibly expelled because the reaction that forms the quinone
C6H4(OH)2(aq) + H2O2(aq) → C6H4O2(aq) + 2H2O(l)
hydroquinone quinone
is highly exothermic and actually causes the solvent (water) to boil.(a) Given
C6H4(OH)2(aq) → C6H4O2(aq) + H2(g) �r(1)H◦m = 177 kJ mol−1
H2O2(aq) → H2O(l) + 12 O2(g) �r(2)H
◦m = −94.6 kJ mol−1
calculate the standard enthalpy change for the reaction of hydroquinone withhydrogen peroxide.
(b) Insects are poikilothermic, i.e. they don’t generate heat internally and their bodytemperature is thus roughly the same as the ambient temperature at any given time.Making the dubious assumptions that the enthalpy of reaction is roughly constantwith respect to temperature and that the presence of solutes has little effect onthe properties of water, what are the minimum concentrations of hydroquinoneand of hydrogen peroxide required to bring the solvent to a boil from an ambienttemperature of 18 ◦C?Hint: How many moles of the reactants does it take to bring 1 L of water to a boil?
(c) Calculate the standard change in internal energy for the decomposition of hydro-quinone to hydrogen and quinone.
5.10 The dependence of energy and enthalpy changes on temperature
Not all reactions are carried out at the standard thermodynamic temperature of 25 ◦C, soit is important to be able to adjust data from one temperature to another. To adjust anenergy or enthalpy change for temperature, we use the fact that both internal energy andenthalpy are state functions. This means that it doesn’t matter which path we take, only whatthe beginning and end points of the process are. Suppose that we want to use a standard

P1: SFK Trim: 247mm × 174mm Top: 14.586mm Gutter: 23.198mm
CUUK1808-05 CUUK1808/Roussel 978 1 107 00678 2 October 29, 2011 17:22
5.10 Energy, enthalpy and temperature 97
Reactants at temperature T Products at temperature T
2Products at 298KReactants at 298K
overall
1 3
Figure 5.7 A thermodynamic cycle used to evaluate the change in a state function at an arbitrarytemperature T from data given at 298 K. The overall change is the sum of the changes in steps 1–3.
thermodynamic table to compute the enthalpy change for a given reaction at a differenttemperature than 298 K. To be definite, imagine that the target temperature, T , is higherthan 298 K, although this doesn’t matter to the overall logic of what we are going to do.We would then break up the process as follows (Figure 5.7):
(1) Imagine that we are starting with reactants at the target temperature T . Using the heatcapacities of the reactants, we compute the heat removed in cooling them from T to298 K.
(2) Calculate �rH at 298 K using the tables.(3) Calculate the heat added to bring the products from 298 K to T .
The overall enthalpy change is the sum of the enthalpy changes in steps 1–3.
Example 5.17 Calculating an enthalpy of reaction at a non-standard tempera-ture Calculate the enthalpy change during the reaction
SO2(g) + 1
2O2(g) → SO3(g)
at 300 ◦C.
(1) Imagine that we have a stoichiometric mixture of SO2 and O2 at 300 ◦C. We calculatethe heat evolved in cooling this mixture to 298 K:
�(1)Hm =(
Cp,m(SO2) + 1
2Cp,m(O2)
)�T
=(
39.8 + 1
2(29.35) J K−1mol−1
)(25 − 300 ◦C)
= −15.0 kJ mol−1
(2) Use the enthalpies of formation to compute �rH◦m at 298 K:
�(2)Hm = �f H ◦(SO3) − �f H ◦(SO2) − 1
2�f H ◦(O2)
= −395.7 − (−296.81) kJ mol−1 = −98.9 kJ mol−1

P1: SFK Trim: 247mm × 174mm Top: 14.586mm Gutter: 23.198mm
CUUK1808-05 CUUK1808/Roussel 978 1 107 00678 2 October 29, 2011 17:22
98 The First Law of Thermodynamics
(3) Now imagine heating the product back up to 300 ◦C:
�(3)Hm = Cp,m(SO3)�T
= (50.67 J K−1mol−1)(300 − 25 ◦C) = 13.9 kJ mol−1
Therefore,
�rHm = −15.0 + (−98.9) + 13.9 kJ mol−1 = −100.0 kJ mol−1
As you can see from the previous example, the enthalpy of reaction will often vary verylittle with temperature. The two correction terms (cooling reactants and warming products)will always have opposite signs and will often be similar in size. Exceptions will be foundwhen the reactants and products are very different in nature (e.g. are in different phases ofmatter). Even then, unless we are looking at very large differences in temperature or aremaking very precise measurements, we can often treat the enthalpy of reaction as beingroughly constant.
Exercise group 5.10
(1) Calculate the enthalpy of combustion of propane (C3H8(g)) at 500 ◦C.(2) A thermodynamicist finds that the enthalpy of formation of ozone (O3(g)) at 500 ◦C is
140 kJ mol−1. What is the value of the enthalpy of formation at 298 K? The molar heatcapacity of ozone is 39.2 J K−1mol−1.
(3) When water is supercooled, it starts to freeze at a temperature below zero. What is theenthalpy of freezing of water at −10 ◦C?
(4) Compare the enthalpy of combustion of glucose at 25 ◦C to the enthalpy of combustionat 37 ◦C. In your opinion, is the difference sufficiently small to ignore in metaboliccalculations?
(5) Industry sometimes uses flow-through reactors, which are basically tubes through whichthe reactants are pushed and in which they react. The temperature in a flow-throughreactor can be made different at the two ends simply by heating one end or cooling theother, or both. Suppose that benzene is hydrogenated to form cyclohexane in a flow-through reactor. The reactants benzene and hydrogen enter the reactor at a temperatureof 550 K (well above the boiling point of benzene) and the product cyclohexane exitsthe reactor at 1290 K (again, well above the b.p. of C6H12). The pressure is constantthroughout. How much heat is liberated per mole of benzene hydrogenated under theseconditions?
5.11 Measuring the energy requirements of living organisms
Here’s a simple question: how much energy does a given organism use per day? While it’s asimple question, figuring out how to answer it takes a bit of thought. There are a number ofways we can measure an organism’s energy requirements, some of which we will discuss

P1: SFK Trim: 247mm × 174mm Top: 14.586mm Gutter: 23.198mm
CUUK1808-05 CUUK1808/Roussel 978 1 107 00678 2 October 29, 2011 17:22
5.11 Metabolic energy requirements 99
here. All of these methods (and others we won’t consider here) are based on ideas andprinciples studied in this chapter.
5.11.1 Nutritional balance
Suppose that we want to measure the energetic requirements of an animal averaged overa period of several days or weeks. We define the whole animal, including its symbioticmicro-organisms, as our system. A very straightforward application of the First Law thentells us that the difference in energy between inputs (food) and outputs (waste) is the amountof energy used or stored by the animal. If we also know the difference in weight betweenthe beginning and end of the experiment and the energy content of the storage compound(commonly fat), we can determine how much energy was actually used by the organism.
Here is an example, constructed from the data of Max Kleiber:2 A cow eats 5.27 kgof hay per day. The heat of combustion (at constant volume) of hay is 4.20 Mcal kg−1.The heat of combustion of the feces was evaluated by bomb calorimetry and found toaverage 7.25 Mcal day−1. Similarly, her evaporated urine had a heat of combustion of1.43 Mcal day−1. She also produced an average of 191 L of methane (at 25 ◦C and 1 atm)per day. During the period of the experiment, she didn’t gain any weight and didn’t lactate.
We have most of the information we need to compute the cow’s metabolic requirements.The heats of combustion tell us how much energy is available by burning various substancesas fuels. Since metabolism involves a set of reactions equivalent to combustion, and sinceheat measured at constant volume is a change in internal energy, calorimetric heats ofcombustion are direct measurements of the energy content of foods and wastes. One ofthe missing pieces is the change in internal energy during the combustion of methane. Abalanced equation for the combustion of methane is
CH4(g) + 2O2(g) → CO2(g) + 2H2O(l)
The standard enthalpy of combustion of methane calculated from the enthalpies of formationis −890.36 kJ mol−1. From Equation (5.15),
�cUm(CH4) = �cHm(CH4) − RT �cνgas
= −890.36 kJ mol−1 − (8.314 472 × 10−3 kJ K−1mol−1)(298.15 K)(−2)
= −885.40 kJ mol−1
The number of moles of methane is determined from the volume by the ideal gas law:
nCH4 = pV
RT= (101 325 Pa)(191 × 10−3 m3)
(8.314 472 J K−1mol−1)(298K)= 7.81 mol
We therefore have
�cU (CH4) = (−885.40 kJ mol−1)(7.81 mol) = −6.91 MJ
2 Max Kleiber, The Fire of Life; Wiley: New York, 1961, pp. 251–265.

P1: SFK Trim: 247mm × 174mm Top: 14.586mm Gutter: 23.198mm
CUUK1808-05 CUUK1808/Roussel 978 1 107 00678 2 October 29, 2011 17:22
100 The First Law of Thermodynamics
We now need to do a bunch of unit conversions and to put the whole thing together.First, the cow took in 5.27 kg of hay with a total energy content of
Energy in = (5.27 kg day−1)(4.20 Mcal kg−1)(4.184 J cal−1) = 92.6 MJ day−1
On the other side of the ledger, the cow excreted energy-containing compounds in her fecesand urine, and as methane. Converting the relevant energies to MJ, we get
Energy out = 30.3 + 5.98 + 6.91 MJ = 43.2 MJ
The metabolic requirements of this particular cow are therefore
Metabolic requirements = Energy in − Energy out = 49.4 MJ day−1
Installing gas-flow meters on animals; collecting, drying and weighing feces and urine;and subjecting these materials to calorimetric measurements are all procedures that requiresignificant dedication, especially since day-to-day variability will require the data to becollected and averaged over a period of days or weeks. Both because of these difficultiesand because more convenient methods are now available, the nutritional balance method isnow rarely used for basic physiological studies.
5.11.2 Direct calorimetry
According to the First Law, all of the energy used by an organism will either show up as heator as work. If an organism does no work, everything will show up as heat. As a result, wecan measure the resting energetic requirements of animals or the normal metabolic activityof plants or micro-organisms by simply measuring their heat production. There are manypossible calorimeter configurations. Here, we’ll study just one, a classic design inventedby Lavoisier and Laplace.
The Lavoisier–Laplace apparatus is sketched in Figure 5.8. Suppose we place a smallanimal in an enclosure in good thermal contact with a reserve of ice. Air is allowed to flowin and out. The system (ice+animal) is insulated. There is a provision for collecting andmeasuring the melt water. Since this is approximately an adiabatic system, all of the heatfor melting the ice came from the animal and, therefore, is a direct measure of its metabolicactivity, give or take any heat lost as a result of gas exchange.
For example, suppose a guinea pig is placed in such a calorimeter. In 10 hours, 370 g ofice melts.3 The calculation of the guinea pig’s metabolic energy use is then straightforward;since the animal is being held at constant pressure, we are measuring an enthalpy change.However, the system (ice+animal) is largely composed of solids and liquids so that thechange in enthalpy is approximately the same as the change in internal energy. The heat offusion of ice at 0 ◦C and 1 atm is 6.007 kJ mol−1. Therefore, the heat required to melt 370 gof ice is
q = (370 g)(6.007 kJ mol−1)
18.02 g mol−1 = 123 kJ
3 These are the data of Lavoisier and Laplace, reported by Max Kleiber, The Fire of Life; Wiley: New York, 1961, p. 118.

P1: SFK Trim: 247mm × 174mm Top: 14.586mm Gutter: 23.198mm
CUUK1808-05 CUUK1808/Roussel 978 1 107 00678 2 October 29, 2011 17:22
5.11 Metabolic energy requirements 101
enclosureAnimal
IceInsulation
Figure 5.8 Schematic diagram of a Lavoisier-Laplace calorimeter. The animal enclosure is surroundedby an ice jacket which is in turn surrounded, as completely as possible, by insulation. The opening atthe top is used to provide the animal with fresh air. The heat generated by the animal melts some ofthe ice which drips out of the bottom of the apparatus, where it is collected for later measurement.
This energy is provided by the metabolic activity of the animal so that
Metabolic requirements = q/t = 123 kJ/10 h = 12.3 kJ h−1
≡ 3.43 W
≡ 296 kJ day−1
Direct whole-organism calorimetry has some significant drawbacks:
(1) Because there must be good thermal contact between the organism’s enclosure and theice reservoir, the former will generally be cool. Temperature has profound effects onthe metabolism of living organisms.
(2) The heat production by ectotherms (“cold-blooded” animals), plants and micro-organisms, particularly at temperatures near the freezing point of water, is too smallto be measured by an ice calorimeter. Calorimeters based on different principles canbe designed to overcome both this and the previous problem, but these are generallymuch more complicated and thus much more expensive.
(3) Calorimetry is generally considered an impractical way to measure the energeticrequirements of anything much larger than a guinea pig because of the size of theapparatus required. However, larger whole-body calorimeters have occasionally beenbuilt.

P1: SFK Trim: 247mm × 174mm Top: 14.586mm Gutter: 23.198mm
CUUK1808-05 CUUK1808/Roussel 978 1 107 00678 2 October 29, 2011 17:22
102 The First Law of Thermodynamics
Table 5.1 Physiological and biochemical data requiredthe indirect calorimetry calculations
Quantity Value
Nitrogen content of protein 17% (by weight)Catabolizable energy from protein 4.5 kcal g−1
O2 needed to catabolize protein 0.0395 mol g−1
CO2 from protein catabolysis 0.0320 mol g−1
Catabolizable energy from fat 9.5 kcal g−1
O2 needed to catabolize fat 0.0900 mol g−1
CO2 from fat catabolysis 0.0636 mol g−1
Catabolizable energy from carbohydrates 4.0 kcal g−1
O2 needed to catabolize carbohydrates 0.0370 mol g−1
CO2 from carbohydrate catabolysis 0.0370 mol g−1
5.11.3 Indirect calorimetry
Indirect calorimetry isn’t calorimetry at all; in fact it’s much more closely related inspirit to the nutritional balance method than to calorimetric methods. The idea here isto use a little biochemical knowledge along with measurements of the gas exchange and(sometimes) of urinary composition to calculate the amount of energy-storage compounds(carbohydrates, fat, etc.) used, and thus the amount of energy the organism used during theexperiment.
In order to do the required calculations, we will require an additional concept, namelythat of catabolizable energy (sometimes called metabolizable energy). Recall that inthe nutritional balance method, we had to know the energy content of both foods andexcreta. The reason is that not everything can be used as a fuel in the body. Similarly, whenconverting certain reserve compounds to work or heat, cells reject certain waste compounds.The catabolizable energy of an energy-storage compound is the average amount of energythat can be extracted from that compound, taking into account the wastes generated. For fatand carbohydrates, the catabolizable energy is virtually the same as the combustion energy.However, the catabolizable energy of protein is much lower than its combustion energybecause of the generation of nitrogenous waste.
It is easiest to explain this method by an example: Suppose that an experimental subjectclears his bladder, then engages in an hour of exercise. During that hour, he uses 3.1 molof O2 and produces 2.7 mol of CO2. At the end, he again urinates. This urine samplecontains 2.0 g of urea ((NH2)2CO), the principal nitrogenous waste produced by mammals.As previously, we want to know how much energy the subject used during this period.Several bits of calorimetric and physiological data are needed to solve this problem, all ofwhich are given in Table 5.1.
Given the amount of urea produced by the subject during the experiment, we cancalculate the amount of protein catabolized and thence the amount of oxygen and carbon

P1: SFK Trim: 247mm × 174mm Top: 14.586mm Gutter: 23.198mm
CUUK1808-05 CUUK1808/Roussel 978 1 107 00678 2 October 29, 2011 17:22
5.11 Metabolic energy requirements 103
dioxide used and produced, respectively, in protein metabolism:
nurea = 2.0 g/60.056 g mol−1 = 0.033 molmN = 2(0.033 mol)(14.0067 g mol−1) = 0.92 gmprotein = 0.92 g/17% = 5.4 gO2 consumed by protein catabolysis = (5.4 g)(0.0395 mol g−1) = 0.21 molCO2 produced by protein catabolysis = (5.4 g)(0.0320 mol g−1) = 0.17 mol
This leaves 2.9 mol O2 consumption and 2.5 mol CO2 production to be accounted for. Thesegases were involved in carbohydrate and fat metabolism, so
2.9 = 0.0900mfat + 0.0370mcarb
2.5 = 0.0636mfat + 0.0370mcarb
Solving these equations simultaneously, we get
mfat = 15 g
mcarb = 42 g
We can now add together the contributions of protein, fat and carbohydrates, using thecaloric equivalents of the different energy-storage compounds from Table 5.1, to obtain theenergy used by the subject during the experiment:
Energy used = Energy from protein + Energy from fat + Energy from carbs
= (4.5 kcal g−1)(5.4 g) + (9.5 kcal g−1)(15 g) + (4.0 kcal g−1)(42 g)
= 335 kcal ≡ 1.40 MJ
Indirect calorimetry is probably the most accurate way we have of measuring energyuse. The principal disadvantage of indirect calorimetry is related to the requirement thatgas flow and composition must be measured. This means that the experiment must either beperformed in a closed chamber (convenient for small animals, plants and micro-organisms)or (with larger land mammals) that tubes must be connected to the subject’s airway. Eitherway, the range of activities that can be studied in this way is restricted, although portablegas analyzers have been devised.
Exercise group 5.11
(1) How much protein did you metabolize in a day if you excrete 7.0 g of urea during thatperiod? How much energy did you derive from protein metabolism in this time?
(2) A person whose normal metabolic requirements are of about 3000 kcal day−1 goes ona hunger strike.(a) Assuming that most of the weight loss is initially from fat consumption, how long
would it take this person to lose 10 kg?
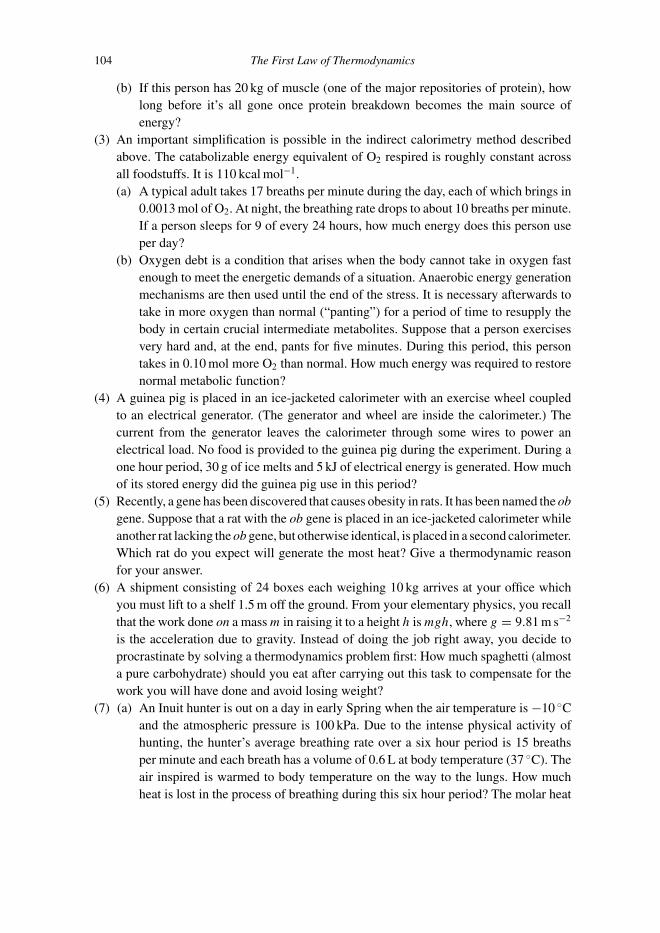
P1: SFK Trim: 247mm × 174mm Top: 14.586mm Gutter: 23.198mm
CUUK1808-05 CUUK1808/Roussel 978 1 107 00678 2 October 29, 2011 17:22
104 The First Law of Thermodynamics
(b) If this person has 20 kg of muscle (one of the major repositories of protein), howlong before it’s all gone once protein breakdown becomes the main source ofenergy?
(3) An important simplification is possible in the indirect calorimetry method describedabove. The catabolizable energy equivalent of O2 respired is roughly constant acrossall foodstuffs. It is 110 kcal mol−1.(a) A typical adult takes 17 breaths per minute during the day, each of which brings in
0.0013 mol of O2. At night, the breathing rate drops to about 10 breaths per minute.If a person sleeps for 9 of every 24 hours, how much energy does this person useper day?
(b) Oxygen debt is a condition that arises when the body cannot take in oxygen fastenough to meet the energetic demands of a situation. Anaerobic energy generationmechanisms are then used until the end of the stress. It is necessary afterwards totake in more oxygen than normal (“panting”) for a period of time to resupply thebody in certain crucial intermediate metabolites. Suppose that a person exercisesvery hard and, at the end, pants for five minutes. During this period, this persontakes in 0.10 mol more O2 than normal. How much energy was required to restorenormal metabolic function?
(4) A guinea pig is placed in an ice-jacketed calorimeter with an exercise wheel coupledto an electrical generator. (The generator and wheel are inside the calorimeter.) Thecurrent from the generator leaves the calorimeter through some wires to power anelectrical load. No food is provided to the guinea pig during the experiment. During aone hour period, 30 g of ice melts and 5 kJ of electrical energy is generated. How muchof its stored energy did the guinea pig use in this period?
(5) Recently, a gene has been discovered that causes obesity in rats. It has been named the obgene. Suppose that a rat with the ob gene is placed in an ice-jacketed calorimeter whileanother rat lacking the ob gene, but otherwise identical, is placed in a second calorimeter.Which rat do you expect will generate the most heat? Give a thermodynamic reasonfor your answer.
(6) A shipment consisting of 24 boxes each weighing 10 kg arrives at your office whichyou must lift to a shelf 1.5 m off the ground. From your elementary physics, you recallthat the work done on a mass m in raising it to a height h is mgh, where g = 9.81 m s−2
is the acceleration due to gravity. Instead of doing the job right away, you decide toprocrastinate by solving a thermodynamics problem first: How much spaghetti (almosta pure carbohydrate) should you eat after carrying out this task to compensate for thework you will have done and avoid losing weight?
(7) (a) An Inuit hunter is out on a day in early Spring when the air temperature is −10 ◦Cand the atmospheric pressure is 100 kPa. Due to the intense physical activity ofhunting, the hunter’s average breathing rate over a six hour period is 15 breathsper minute and each breath has a volume of 0.6 L at body temperature (37 ◦C). Theair inspired is warmed to body temperature on the way to the lungs. How muchheat is lost in the process of breathing during this six hour period? The molar heat

P1: SFK Trim: 247mm × 174mm Top: 14.586mm Gutter: 23.198mm
CUUK1808-05 CUUK1808/Roussel 978 1 107 00678 2 October 29, 2011 17:22
5.11 Metabolic energy requirements 105
capacity of air at constant pressure is approximately 29 J K−1mol−1. Note that airmay be treated as an ideal gas.
(b) Seal blubber is almost pure fat. How much seal blubber does the hunter have to eatto offset the energy loss from breathing during the six hours of hunting?
(8) A typical adult male human must consume food with an energy equivalent of about3000 kcal day−1 to maintain a constant weight. Assume that the food energy is com-pletely converted to heat and, furthermore, that the heat is generated at a con-stant rate during the day. The human body is mostly water (specific heat capacity4.184 kJ K−1kg−1). If the body were perfectly insulated, how long would it take beforea 70 kg adult male reached the normal boiling point of water from an initial temperatureof 37 ◦C?
(9) A pint of beer delivers approximately 196 kcal of metabolizable energy. This figureassumes that the beer is served warm. Cold beer must also be warmed to body tem-perature (37 ◦ C) and this requires an expenditure of metabolic energy. Calculate themetabolizable energy (in kcal) available from a pint of beer served at 4 ◦C. Treat thebeer as if its thermal properties were identical to those of water. The density of beer istypically just slightly higher than that of water (about 1 g mL−1) and a pint is 568 mL.
Key ideas and equations
� A state variable or function has an exact differential and is path independent.� A path function has an inexact differential and is path dependent.� dw = −pext dV� During a reversible process, the system and surroundings are constantly in equilibrium.� First Law of Thermodynamics: dU = dq + dw; U is a state function.� H = U + pV� Heat at constant volume is �U ; heat at constant pressure is �H .
� CV = ∂U
∂T
∣∣∣∣V
and Cp = ∂H
∂T
∣∣∣∣p
� Definition of and calculations involving enthalpies of formation.� Setting up heat balance problems.� �rHm = �rUm + RT �rνgas� How to calculate enthalpy at different temperatures using thermodynamic cycles.
Suggested reading
Calculating the work done during a process is a surprisingly complex problem in general,so I was careful about the cases I considered in Section 5.2. If you want to delve into thesecomplexities, which may be relevant in physiological studies for example, I would startwith the following paper:
Daniel Kivelson and Irwin Oppenheim, J. Chem. Ed. 43, 233 (1966).

P1: SFK Trim: 247mm × 174mm Top: 14.586mm Gutter: 23.198mm
CUUK1808-05 CUUK1808/Roussel 978 1 107 00678 2 October 29, 2011 17:22
106 The First Law of Thermodynamics
There are many excellent books on animal physiology. I have found the followingparticularly useful:
Roger Eckert, David Randall and George Augustine, Animal Physiology: Mechanisms andAdaptations, 3rd edn.; Freeman: New York, 1988.
For detailed data, experimental protocols and sample calculations on classical physio-logical measurements, I suggest two old, but still very interesting books:
Max Kleiber, The Fire of Life: An Introduction to Animal Energetics; Wiley: New York,1961.
C. Frank Consolazio, Robert E. Johnson and Louis J. Pecora, Physiological Measurementsof Metabolic Functions in Man; McGraw-Hill: New York, 1963.
There’s more to the story of how Rana sylvatica survives freezing than I have explainedhere. If you want to know more about this, I highly recommend the following articles byKenneth and Janet Storey:
Kenneth B. Storey and Janet M. Storey, Annu. Rev. Physiol. 54, 619 (1992);The Sciences 39(3), 33 (1999).
Review exercise group 5.12
(1) Name the thermodynamic quantity corresponding to each of these symbols:(a) �cUm
(b) CV
(c) �rh
(2) The bomb calorimetry experiment is generally carried out in two steps: (i) burn asample of known heat of combustion, and (ii) burn an unknown sample.(a) What do you actually measure in a calorimetry experiment?(b) What is the purpose of step (2i)?(c) What quantity can you calculate after step (2ii)?
(3) When scientific papers are submitted to scientific journals, they are sent for peerreview, i.e. they are sent to experts in the field for an opinion regarding their correctnessand novelty. A little while ago, I reviewed a paper in which the following passageappeared:
A part of the biochemical energy becomes heat:
�q = η�U, (5.16)
where �q is the change in heat, and η is the efficiency of the energy conversion between �U
and �q.
What is wrong with this statement?(4) A 200 g block of steel initially at 100.0 ◦C is placed in an adiabatic container held at
constant pressure with 200 g of liquid water initially at 22.0 ◦C. The final temperatureof the system is 30.3 ◦C. What is the specific heat capacity of this sample of steel?

P1: SFK Trim: 247mm × 174mm Top: 14.586mm Gutter: 23.198mm
CUUK1808-05 CUUK1808/Roussel 978 1 107 00678 2 October 29, 2011 17:22
5.11 Metabolic energy requirements 107
(5) (a) A 350 g block of silicon is brought from 20 ◦C to its melting point, 1693 K. Howmuch heat does this require?
(b) Do you expect the value calculated in part 5a to be reasonably accurate? Why orwhy not? If you wanted to do better, what data would you need? How would thecalculation differ from that carried out in question 5a?
(6) Suppose that 25 g of sodium hydroxide is dissolved in 200 mL of water at 25 ◦C.What is the temperature change? According to your calculation, would any specialprecautions be necessary in preparing this solution?
(7) Suppose that an industrial process generates heat by burning methane in a constant-volume chamber at 1200 K.(a) Calculate the enthalpy of combustion of methane at 1200 K.(b) Were there any doubtful approximations made in the above calculation?(c) Calculate the heat released per mole by the combustion of methane at 1200 K
under constant-volume conditions.(8) Various devices are used to trap, cool and condense steam. One way to condense
steam is to bubble it through liquid water. Suppose that 8 g of steam initially at 115 ◦Cis bubbled into 300 g of water initially at 20 ◦C. All the steam disappears beforereaching the surface of the water. Assuming that the vessel in which this occurs iswell insulated, what is the final temperature of the water?
(9) During the reversible adiabatic expansion of an ideal gas, the pressure and volumeare related by pV γ = a where γ = Cp,m/CV,m, and a is a constant determined bythe initial pressure and volume. For gases, CV,m ≈ Cp,m − R, so γ can easily becalculated from the constant-pressure heat capacity. Calculate the work done duringa reversible adiabatic expansion of 1.85 mol of nitrogen gas from an initial pressureand temperature of 0.94 bar and 225 ◦C, to a final pressure of 18 mbar. Treat nitrogenas an ideal gas.
(10) 80 mL of 0.50 mol L−1 HCl solution is mixed with 45 mL of 0.85 mol L−1 NaOHsolution. Both solutions have initial temperatures of 22 ◦C. What is the maximumtemperature that the mixture reaches?Note: Make a reasonable assumption about the solution densities.
(11) At 18 ◦C, the enthalpy of reaction for
C(graphite) + CO2(g) → 2CO(g)
is 175.52 kJ mol−1. The molar heat capacity of carbon monoxide is 29.12 J K−1mol−1.Accurately calculate the standard enthalpy of formation of carbon monoxide (at25 ◦C).
(12) When 10 g of sodium nitrate (NaNO3(s), molar mass 84.99 g mol−1) is dissolved in200 g of water, it completely dissociates and the temperature of the water drops by2.9 ◦C. When 10 g of nitric acid (HNO3(l), molar mass 63.01 g mol−1) is dissolved in200 g of water, 93% of the acid dissociates to nitrate and an aqueous proton and thetemperature of the water increases by 5.9 ◦C. The enthalpy of formation of nitric acidis known from other experiments to be −174.1 kJ mol−1. Assume that the dissociation
P1: SFK Trim: 247mm × 174mm Top: 14.586mm Gutter: 23.198mm
CUUK1808-05 CUUK1808/Roussel 978 1 107 00678 2 October 29, 2011 17:22
108 The First Law of Thermodynamics
of the acid is responsible for most of the temperature rise in the latter case. What arethe enthalpies of formation of sodium nitrate and of the nitrate anion?
(13) The MONJU experimental nuclear reactor4 in Japan produces heat at a rate of 714 MW.Liquid sodium is used as a coolant. It flows into the reactor at a temperature of 397 ◦Cand flows out at a temperature of 529 ◦C. The molar heat capacity of liquid sodiumin this temperature range is 29.26 J K−1mol−1. What flow rate of sodium through thereactor is required to carry away the heat produced by the nuclear reaction given thedesired inlet and outlet temperatures? Express your answer in t h−1.
(14) Under some conditions, ice crystals sublime rather than melt. If the enthalpies offusion and of vaporization of water are, respectively, 6.01 and 44.9 kJ mol−1 at 0 ◦C,what is the enthalpy of sublimation at this temperature?
4 This reactor has a very well organized and very informative web site: http://www.jnc.go.jp/zmonju/mjweb/welcome.htm.
P1: SFK Trim: 247mm × 174mm Top: 14.586mm Gutter: 23.198mm
CUUK1808-06 CUUK1808/Roussel 978 1 107 00678 2 October 29, 2011 13:29
6
The Second Law of Thermodynamics
The First Law of Thermodynamics tells us that energy is conserved. The Second Law,which was originally formulated to help us understand steam engines, tells us that heatcan’t be converted into work with 100% efficiency. Our study of the second law will leadus to define a new state function known as the entropy. In turn, the entropy will turn out tobe pivotal to our understanding of what drives chemical reactions.
6.1 The Second Law of Thermodynamics
There are many different statements of the Second Law. My favorite, because it seems toconvey most clearly the meaning of this law, is due to Kelvin:
It is impossible for a system to undergo a cyclic process whose sole effects are the flow of an amountof heat from the surroundings to the system and the performance of an equal amount of work on thesurroundings.
In more modern language, we might say that it is impossible to continuously convert heatcompletely into work. The Second Law limits the efficiency of heat engines, machinesthat convert heat into work. Just as the First Law makes a certain kind of perpetual motionmachine impossible, the second law makes it impossible to build a so-called perpetualmotion machine of the second kind, namely one that produces work from heat with perfectefficiency.
There are literally dozens of statements of the Second Law, each of which can beshown to be logically equivalent to Kelvin’s. In Section 6.4, we will encounter a modernmathematical statement that is extremely general and is thus well-suited to problems thathave nothing to do with heat engines. However, all statements of the Second Law have twothings in common:
(1) The processes that the Second Law forbids are allowed by the First Law; for instance,the perfect conversion of heat into work does not violate the First Law, which onlystipulates the conservation of the total energy.
(2) The reverse of a process forbidden by the Second Law is always allowed. For instance,work can be dissipated to heat with 100% “efficiency.” My father-in-law, Walter Oktaba,
109

P1: SFK Trim: 247mm × 174mm Top: 14.586mm Gutter: 23.198mm
CUUK1808-06 CUUK1808/Roussel 978 1 107 00678 2 October 29, 2011 13:29
110 The Second Law
a retired electrical power engineer, likes to say that heat is “the most degraded form ofenergy.” What he is saying is that it is easy to turn other forms of energy into heat –it even happens when we don’t want it to – but that we face fundamental Second-Lawlimitations when trying to go in the reverse direction.
The latter point implies that the Second Law is different in nature from the First Lawand, indeed, from all of the laws of mechanics: it is asymmetric in time. Consider, forinstance, an electric heater, a device that converts electrical work to heat with nearly perfectefficiency. If we had a heat-sensitive camera, we could film this process. If we then ranthe film backwards, we would observe a process that, according to the Second Law, cannever occur, namely the return of the heat to the heater and its conversion to electricity withperfect efficiency. Classical mechanics on the other hand is completely reversible: if wefilmed, say, some gas particles flying around a container, and then ran the film backwards,we would observe perfectly reasonable particle trajectories. The First Law is also time-reversible: energy could equally well be conserved by the melting of an ice cube in yourhand as it could by the warming of your hand as water froze in it. However, the latterprocess never occurs and we will see that the Second Law forbids it. Because it tells uswhich processes, among all those allowed by mechanics and by the First Law, can andcan’t be expected to happen, the Second Law has often been said to define an “arrow oftime.”
The example of running particle trajectories backwards is an interesting one since itbrings out an important aspect of the Second Law. Suppose that we filmed a gas beingforced out of a nozzle under pressure. The reverse process, the return of the gas moleculesto the nozzle against the pressure gradient, does not violate any of the laws of mechanics.If you only knew Newton’s laws of motion, you would never suspect that the film wasrunning backwards. However, we know it would never happen because the probability ofall the molecules in the gas traveling in just the right direction to make this happen isunimaginably small. As we will see later, the Second Law is essentially statistical in nature.Processes forbidden by the Second Law are not impossible in the strict sense of the word,but are so incredibly unlikely that they might as well be treated as impossibilities.
6.2 Intensive and extensive properties
Some properties of a system, like mass, volume, energy and enthalpy, depend on how largea system is. All other things being equal, if we double the size of a system, the values ofthese properties double too. We say that such quantities are extensive.
Intensive properties, on the other hand, are those whose values are independent of thesize of the system. These include temperature and pressure. Doubling the size of a systemwhile holding the density constant would have no effect on the pressure, for instance.
If you’re having trouble figuring out what the difference is, imagine the followingexperiment: Take two identical copies of your system separated by a removable wall. Nowremove the wall and ask yourself what the value of a given property for the two copies put

P1: SFK Trim: 247mm × 174mm Top: 14.586mm Gutter: 23.198mm
CUUK1808-06 CUUK1808/Roussel 978 1 107 00678 2 October 29, 2011 13:29
6.3 Reversible processes and entropy 111
together is. If a property is twice as large as in the original system, then it’s extensive. If ithasn’t changed, it’s intensive.
6.3 Reversible processes and entropy
A modern statement of the Second Law requires the definition of a state function called theentropy. Defining the entropy rigorously requires a detailed consideration of heat engines,the subject of Section 6.8. Since heat engines are not particularly important in biochemistry,to do so would be a distraction at this point. Rather, I will only show that the existence ofsuch a state function is plausible.
We need to reconsider reversible processes, which we first encountered in Section 5.2.Recall that a reversible process is one during which the system is constantly at equilibrium.During reversible pressure–volume work for instance, pext = p so that
dwrev = −p dV
Since there is no pressure difference driving the change, it could go either way with only aninfinitesimal change in pressure in one direction or the other, hence the name “reversible.”
Note that dwrev is of the form of an intensive state variable (p) multiplied by an exactdifferential of an extensive state function (−dV , the differential of the extensive statefunction −V ).
What about reversible heating? The variable that determines whether or not two systemsare in thermal equilibrium is the temperature. Thus, during a reversible heating process,Text = T . Since T plays the same role for heat as p does for work, being an intensive statevariable whose gradient determines the direction in which heat will flow, we would like towrite
dqrev = T dS,
where S is a extensive state function. It turns out that this is exactly what we need to do:The entropy S is a state function such that
�S =∫
rev. path
dq
T(6.1)
or, in differential form,
dS = dqrev
T(6.2)
We will see very shortly that S is deeply connected to the Second Law. In the meantime,let’s learn how to calculate changes in entropy. The main problem we will face will be tofind reversible paths over which to evaluate the integral in Equation 6.1.
Example 6.1 Entropy of heating at constant pressure Reversible heat transfer meansthat the heat is provided from one body at temperature T to another body at the sametemperature. We will see just a bit later how we can at least imagine doing this. For now,

P1: SFK Trim: 247mm × 174mm Top: 14.586mm Gutter: 23.198mm
CUUK1808-06 CUUK1808/Roussel 978 1 107 00678 2 October 29, 2011 13:29
112 The Second Law
just note that, whether it is provided reversibly or not, we can calculate the heat in theabsence of phase transitions from the heat capacity. Specifically, dqrev = Cp dT . If Cp isconstant over the temperature range of interest,
�S =∫ T2
T1
Cp dT
T= Cp ln
(T2
T1
)
Note that �S > 0 if T2 > T1.
Example 6.2 Entropy of expansion What is the change in entropy for the isothermalexpansion of an ideal gas? In this example, the issue of calculating the reversible heat is abit trickier.
Note that the description of the process (isothermal expansion) isn’t enough to determinethe heat or work, since the path is incompletely specified. However, it is enough to computethe entropy change. Initially, we have a certain amount of gas at a certain temperature,pressure and volume. The final state is the same amount of gas at the same temperature, butat a higher volume and thus, by the ideal gas law, at a lower pressure. Because the processis isothermal,
�S =∫
dqrev
T= 1
T
∫dqrev = qrev
T
To compute the entropy, we must use a reversible path. Specifically, the correct reversiblepath in this case is a reversible, isothermal expansion of an ideal gas. As we saw onpage 73, the internal energy of an ideal gas only depends on T . For an isothermal processon an ideal gas, �U = 0. Therefore,
qrev = −wrev
wrev = −∫ V2
V1
p dV = −nRT
∫ V2
V1
dV
V= −nRT ln
V2
V1
We conclude that
�S = nR lnV2
V1
Exercise group 6.1
(1) What is the entropy change during a reversible, adiabatic process?(2) What is the entropy change during a reversible, isothermal process?(3) The enthalpy of vaporization of helium at its normal boiling point of 4.22 K is
84 J mol−1. What is the entropy of vaporization of helium at constant pressure?(4) Calculate the change in entropy of a 50 g sample of potassium bromide that is heated
from 12 to 53 ◦C.(5) The standard enthalpies of formation of liquid and gaseous TiCl4 are, respectively,
−804.16 and −763.2 kJ mol−1. TiCl4 boils at 408 K. The heat capacities of the two

P1: SFK Trim: 247mm × 174mm Top: 14.586mm Gutter: 23.198mm
CUUK1808-06 CUUK1808/Roussel 978 1 107 00678 2 October 29, 2011 13:29
6.4 The Second Law and entropy 113
phases can both be expressed in the form
Cp,m = A + BT + CT 2 + DT 3 + E/T 2
where Cp,m is in J K−1mol−1 and T is in kelvins. For the liquid, A = 143.048,B = 7.600 362 × 10−3, C = 1.530 575 × 10−6, D = −5.383 76 × 10−10 and E =−20 638. For the vapor, A = 106.8573, B = 1.049 482 × 10−3, C = −2.843 × 10⁻⁷,D = 2.4257 × 10⁻¹¹ and E = −1 043 516.(a) Calculate the enthalpy of vaporization at the boiling point.(b) Calculate the entropy of vaporization at the boiling point.
6.4 The Second Law of Thermodynamics and entropy
In terms of entropy, the Second Law can be very simply stated:
The entropy of an adiabatic system never decreases.
Since we certainly believe that the Universe is adiabatic – with what could the Universe bein thermal contact? – it is often said that the entropy of the Universe increases. This is aconsequence of the more general statement above.
Processes with a positive �Suniverse will be said to be thermodynamically allowed.Many books use the word “spontaneous” for “thermodynamically allowed.” The trouble isthat, in everyday language, “spontaneous” implies that a process will happen, when all thatthermodynamics tells us is whether it could happen. Some things that could happen don’t,for reasons that have to do with kinetics rather than thermodynamics. I therefore try to onlyuse “spontaneous” for things that are known to occur spontaneously according to our usualunderstanding of this word.
In this section, examples of the increase in entropy during thermodynamically allowed(and actually spontaneous) processes will be studied.
Example 6.3 Spontaneous heatflow We already know that heat flows spontaneously fromhotter to colder bodies. The Second Law should of course agree with this observation.
Suppose that we have two bodies, one at temperature T1 and the other at temperature T2.An amount of heat |q| flows from the first to the second. This amount of heat is supposedto be so small that the temperatures of the two bodies are not sensibly affected by the flow.If we want to consider larger heat flows, we would only have to make minor adjustmentsto the mathematics below, but the principle would be the same.
In order to compute the change in entropy, we have to invent a reversible path, becausethat’s how entropy is defined. We need some way to move heat from body 1 to body 2 suchthat heat flows out of body 1 into a body at temperature T1, and into body 2 from a body attemperature T2. This requires a third body whose temperature can be adjusted and whichwill ferry the heat from body 1 to body 2. Specifically, we imagine a heat exchanger whosetemperature can be adjusted adiabatically. (An ideal gas will do nicely, since an adiabatic

P1: SFK Trim: 247mm × 174mm Top: 14.586mm Gutter: 23.198mm
CUUK1808-06 CUUK1808/Roussel 978 1 107 00678 2 October 29, 2011 13:29
114 The Second Law
|q|
|q|
1 T2
T2
T2
T2
T2
T
TT
T
T2
2T
Ti
1
T
T11T
1
11
Figure 6.1 A reversible path for transferring heat from one body to another. A heat exchanger(shaded), starting from an arbitrary temperature Ti , is brought to temperature T1 by a reversibleadiabatic process. Heat |q| is reversibly transferred from body 1 to the heat exchanger, reversibilitybeing ensured by having body 1 and the exchanger at the same temperature. The heat exchanger isthen brought to temperature T2 by a second reversible adiabatic process. Finally, heat |q| is transferredreversibly to body 2. If the amount of heat transferred is such as to result in a significant change inthe temperatures of either or both of bodies 1 and 2, we could simply operate this process in a cycle,each time transferring a small amount of heat dq, resulting in infinitesimally small changes in thetemperatures of the two bodies at each step.
compression of an ideal gas increases its temperature and adiabatic expansion decreasesit.) The strategy is illustrated in Figure 6.1. We start by performing a reversible adiabaticprocess to bring the heat exchanger to T1. We then allow |q| to flow out of the first bodyreversibly at T1 into the heat exchanger. We perform a second reversible adiabatic processon the heat exchanger to bring it to T2. The heat extracted from the first body is allowed toflow reversibly into the second. The only non-zero contributions to the change in entropy

P1: SFK Trim: 247mm × 174mm Top: 14.586mm Gutter: 23.198mm
CUUK1808-06 CUUK1808/Roussel 978 1 107 00678 2 October 29, 2011 13:29
6.4 The Second Law and entropy 115
are from the two heat flow steps:
�Suniverse =∫
dq
T1+∫
dq
T2= −|q|
T1+ |q|
T2
The two terms in this equation correspond to the change in entropy of the first body and tothe change in entropy of the second body. We don’t count the change in entropy of the heatexchanger because it’s just an imaginary device needed to make the path reversible; it’s notpart of the physical universe.
From the last equation, we can read off our result: the change in entropy of the universeis positive if and only if T1 > T2. In other words, �Suniverse is positive when heat flows fromhotter to colder bodies.
Example 6.4 The melting of ice at room temperature We again use our heat exchangertrick. This time, we want to remove heat from the room (assumed to be large enough torelease it isothermally) at 25 ◦C and dump it into the ice at 0 ◦C (the melting temperature).The ice–water system will remain at this temperature as long as we don’t melt all of theice. The heat of fusion of ice at 0 ◦C (273 K) and 1 atm is 6.007 kJ mol−1. We then have
�fusSm = 6.007 kJ mol−1
273.15 K= 21.99 J K−1mol−1
�Sroom,m = −6.007 kJ mol−1
298 K= −20.16 J K−1mol−1
∴ �Suniverse,m = �fusSm + �Sroom,m = 1.83 J K−1mol−1 > 0
in accord with our everyday experience that this process is spontaneous.
Exercise group 6.2
(1) Using your knowledge of thermodynamics, prove that steam at 100 ◦C will condensein a room at 20 ◦C.
(2) Prove, by a calculation based on thermodynamic principles, that a glass of water initiallyat 20 ◦C with a heat capacity of 1200 J K−1 in a room at 20 ◦C cannot spontaneouslyextract heat from the room and warm itself to 50 ◦C.
(3) An ideal gas is compressed isothermally from V1 to V2. Is the change in entropy positive,negative or zero? What about the change in internal energy?
(4) 20 g of iron metal at 85 ◦C is placed in an insulated container with 80 g of water at 4 ◦C.(a) Calculate the final temperature of the system.(b) Calculate the entropy change for the iron–water system. Is the result in accord with
the second law of thermodynamics?(5) At constant temperature and pressure, the reaction
Na(s) + H2O(l) → Na+(aq) + OH−
(aq) + 1
2H2(g)

P1: SFK Trim: 247mm × 174mm Top: 14.586mm Gutter: 23.198mm
CUUK1808-06 CUUK1808/Roussel 978 1 107 00678 2 October 29, 2011 13:29
116 The Second Law
is spontaneous and exothermic. For simplicity, suppose that the reaction is carried outin an adiabatic container. What can you say (rigorously) about size and/or sign of theentropy change for the reaction?Hint: Break up the entropy change into a part that is due to the reaction itself, and apart that is associated with the heating.
6.4.1 Entropy of mixing
Any spontaneous process, whether or not it involves heat flow, should lead to a positivechange in entropy. A particularly important example, and one that requires a sneaky methodof attack, is the entropy change on mixing two gases.
Suppose that two different ideal gases are separated from one another by a removablebarrier. Each gas is held at identical temperatures and pressures T and p. The first is in acompartment of volume V1 and the other in a compartment of volume V2. Then, the wall issuddenly removed. We have a pretty good idea what will happen: the two gases will diffuseand mix. Does the Second Law predict this behavior?
Ideal gases are made up of non-interacting particles. Therefore, the two gases in oursystem are completely insensible to each other. Thus we should ask ourselves what effectremoving the barrier has on each gas, as if the other weren’t there. The answer to thatquestion is that, after the system comes to equilibrium, the partial pressure of each gaswill have decreased, the temperature remaining constant and the volume increasing. Thus,each gas undergoes an isothermal expansion. To compute the entropy change, we need tocalculate the entropy change during the reversible isothermal expansion of an ideal gas. Wehave already made this calculation, in Example 6.2. The result was
�S = nR lnVf
Vi
In the case of our mixing problem, gas 1 expands from V1 to V1 + V2 and gas 2 expandsfrom V2 to V1 + V2:
�mixS = R
(n1 ln
V1 + V2
V1+ n2 ln
V1 + V2
V2
)(6.3)
We have proven what we set out to prove: since the arguments of the logarithm are bothgreater than unity, the logarithms are positive, so �mixS is positive. Once again, the SecondLaw agrees with our intuition about what should happen. The reverse process, spontaneousunmixing, would have a negative entropy change, so it is not thermodynamically allowed.
Note that we haven’t used the fact that the pressures of the two gases are initiallythe same. Thus, Equation (6.3) is correct even when the two gases start out at differentpressures.
The entropy of mixing is usually written in a slightly different form for the special casewhere the two gases are initially at the same pressure. For this case, it shouldn’t take much

P1: SFK Trim: 247mm × 174mm Top: 14.586mm Gutter: 23.198mm
CUUK1808-06 CUUK1808/Roussel 978 1 107 00678 2 October 29, 2011 13:29
6.4 The Second Law and entropy 117
effort to convince yourself using the ideal gas law that the mole fraction of gas 1 is
X1 = n1
n1 + n2= V1
V1 + V2
and that a similar expression holds for the second gas. Therefore,
�mixS = −nR (X1 ln X1 + X2 ln X2) (6.4)
where n = n1 + n2 is the total number of moles of gas. If we divide both sides by n, weget the molar entropy of mixing:
�mixSm = −R (X1 ln X1 + X2 ln X2)
This calculation leads us to Gibbs’s paradox: the entropy of mixing does not depend onthe identities of the gas molecules. However, in one special case, the entropy of mixing iszero; If the two gases are the same, then the “before” and “after” states of the system areidentical and, because entropy is a state function, �S = 0. Imagine that we could “morph”one gas into another, slowly changing the properties of one until they were identical to theproperties of the other. The thermodynamic arguments we have just seen predict that theentropy of mixing would be constant, regardless of how similar the two gases were, right upto the point where we actually made them identical, at which point the entropy of mixingwould discontinuously drop down to zero. This is Gibbs’s paradox. The resolution of thisparadox requires the recognition that one always has either one case or the other; becauseof the particulate nature of matter, it is impossible to slowly morph one atom or isotope intoanother. Two gases are either identical (in which case �S = 0) or they are not (in whichcase Equation (6.4) applies).
Example 6.5 Entropy of mixing Suppose that two 2 L flasks are connected by a stopcock.One flask contains neon at a pressure of 50 kPa. The other contains nitrogen at a pressureof 90 kPa. Both are held at 19 ◦C. The stopcock is opened. Since the two gases are initiallyat different pressures, we must use Equation (6.3) to calculate the entropy of mixing.
nNe = pV
RT= (50 × 103 Pa)(2 × 10⁻³ m3)
(8.314 472 J K−1mol−1)(292 K)= 0.041 mol
The other flask contains
nN2 = pV
RT= (90 × 103 Pa)(2 × 10⁻³ m3)
(8.314 472 J K−1mol−1)(292 K)= 0.074 mol
The entropy of mixing is therefore
�mixS = (8.314 472 J K−1mol−1)
[(0.041 mol) ln
(2 + 2 L
2 L
)
+ (0.074 mol) ln
(2 + 2 L
2 L
)]= 0.66 J K−1

P1: SFK Trim: 247mm × 174mm Top: 14.586mm Gutter: 23.198mm
CUUK1808-06 CUUK1808/Roussel 978 1 107 00678 2 October 29, 2011 13:29
118 The Second Law
Exercise group 6.3
(1) Some substances don’t mix. While the above derivation is not completely general, theentropy of mixing is always positive. So why don’t (for instance) oil and water mix?
(2) Note that the sum of the mole fractions of all the components of a system must equal 1.Therefore, for a two-component system, X2 = 1 − X1. Find the mole fractions X1 andX2 that maximize the entropy of mixing.
6.5 A microscopic picture of entropy
The problem with entropy is that it’s difficult to build a mental picture of what it measuresfrom the thermodynamic definition alone. The other key concepts in thermodynamics(energy, heat, work) are more familiar to us and can be related to everyday experience.Entropy isn’t like that. In this section, we will develop the molecular theory of entropy.The emphasis will be on insight rather than rigor.
In thermodynamics, we specify the macroscopic state of a system by the values of thesystem’s state variables or state functions. This macroscopic state, however, is compatiblewith many microscopic states (microstates for short), i.e. with many different arrangementsof the molecules and of their energy. As a simple example, consider the vibrational energyof a gas of harmonic oscillators (a simple model for molecular vibrations; Section 3.4.3).Because of the equal spacing of harmonic oscillator energy levels, we can think of thevibrational energy as being stored in units of hν0, the spacing between the energy levels.A total of k units of excess vibrational energy (beyond the zero-point energy) could bespread over the molecules in any of a number of ways. For the sake of argument, supposethat k < N , the number of molecules. There could be k molecules with one unit of excessvibrational energy each. Alternatively, there could be k − 1 molecules with one unit each,and one with two. At the other extreme, all k units could be piled into one molecule. Eachof the possible ways to distribute the energy is a microstate.
We will consider a system with fixed values of N , U and V . The Boltzmann distribution(Section 3.2) is very general. In particular, it can be applied to the total energy of asystem. For a system of fixed internal energy U , because each of the microstates hasthe same energy, then each microstate has the same probability. Let � be the numberof distinguishable microstates corresponding to the macroscopic state (N,U, V ). To putit another way, the single energy level U of the system has degeneracy �. Now recallthat the partition function counts the number of states accessible to a system. Thus, fora system at fixed (N,U, V ), the partition function for the system as a whole has thevalue �.
Many of the equations we have derived thus far for the molecular partition functionapply equally well to the partition function of a system, which we denote by Q. We willnow derive an equation for the connection between the entropy and the system partitionfunction.

P1: SFK Trim: 247mm × 174mm Top: 14.586mm Gutter: 23.198mm
CUUK1808-06 CUUK1808/Roussel 978 1 107 00678 2 October 29, 2011 13:29
6.5 A microscopic picture of entropy 119
From the thermodynamic definition of entropy, we have dS = dqrev/T = CV dT/T
since we consider a system at constant volume. We can calculate the entropy by integratingthis equation. If we also substitute for CV using Equation (5.11), we get
S = S(0) +∫ T
0
1
T
∂U
∂T
∣∣∣∣V,N
dT (6.5)
The integral on the right-hand side can be evaluated by integration by parts. We get
S = S(0) + U (T ) − U (0)
T+∫ T
0
U
T 2dT
The internal energy at 0 K, U (0), is just the zero-point energy of the system. The value ofthis energy is arbitrary as we can always redefine the zero of our energy scale such thatU (0) = 0. We will therefore drop this term from our equation.
Noting that the average energy of the system is just the internal energy, and usingEquation (3.3), which relates the average energy to the partition function Q, we get
U = kBT 2
Q
∂Q
∂T
∣∣∣∣V,N
= kBT 2 ∂ ln Q
∂T
∣∣∣∣V,N
If you can’t quite see how I got the last equality in this equation, apply the chain rule to theresult. Substituting this expression into the integral in Equation (6.5), we have
S = S(0) + U
T+ kB
∫ T
0
∂ ln Q
∂T
∣∣∣∣V,N
dT
= S(0) + U
T+ kB ln Q − kB ln Q(0)
We can combine S(0) − kB ln Q(0) into a single constant. We will see later that this constantcan arbitrarily be set to zero, and that S(0) = kB ln Q(0) is a sensible choice consistent withthe equation we are about to derive. This leaves us with
S = U
T+ kB ln Q (6.6)
Now we will take a shortcut in order not to get too bogged down in mathematical details.Our derivation so far treats Q as a function of (N, T , V ). (Note the derivatives with respectto T , in particular in the statistical definition of the internal energy.) If that is the case wewant to treat, then Equation (6.6) gives us the entropy, provided we have the appropriatepartition function (Equation (3.2) with the energies interpreted as allowed energies of thesystem of N molecules). However, we started out talking about a system with constant(N,U, V ). We can approach such a system from one with fixed (N, T , V ) by imaginingthat the spacing between the energy levels is much larger than kBT and that the latterquantity is such that it falls somewhere in the gap between two energy levels. In sucha range of temperatures, Q is roughly constant, so U is roughly constant (which is thecondition we want to impose) and much smaller than kBT . The energy becomes exactlyconstant as the energy level spacing and kBT go to infinity. If we divide our equation for the
P1: SFK Trim: 247mm × 174mm Top: 14.586mm Gutter: 23.198mm
CUUK1808-06 CUUK1808/Roussel 978 1 107 00678 2 October 29, 2011 13:29
120 The Second Law
entropy by kBT and take the limit as U/(kBT ) → 0, then recall that Q = � for a systemat constant U , we get Boltzmann’s equation:
S = kB ln � (6.7)
The entropy calculated by this equation is either called the Boltzmann or the statisticalentropy.
We can now provide a statistical interpretation of the entropy. When we specify themacroscopic state, we remain ignorant of the precise microscopic state the system occupies.Indeed, this microstate can change from moment to moment as molecules move around andexchange energy. The entropy is larger for systems with more microstates, so it measuresour degree of ignorance of the microstate.
The second law says that the entropy of an adiabatic system increases in a thermody-namically allowed process. According to the Boltzmann definition of entropy, this wouldmean that thermodynamically allowed processes favor an increase in the number of micro-scopic states available to an adiabatic system. Consequently, thermodynamically allowedprocesses result in a loss of information about adiabatic systems or, in general, about theUniverse. To put it another way, as the Universe evolves, there is a tendency for its energyto be spread over more and more microstates.
6.5.1 Vibrational entropy
Let’s treat an example to see the statistical entropy in action. Suppose that our systemconsists of just two identical molecules and that we focus on the part of the energy storedin a particular molecular vibration. Recall again that vibrational energy levels are roughlyequally spaced. Additionally, suppose that the total energy of the system is two units (inmultiples of hν0). How many different ways can the energy be shared between the twomolecules? Both units of energy can be stored in molecule A, both in molecule B, or one ineach of molecules A and B. Apparently then, � = 3, and the molar entropy of our systemis S = kB ln 3. This is the correct value for the statistical entropy if the two molecules arebound to a surface so that we can tell them apart. However, if the molecules can movearound, then we can’t really tell which is which. Accordingly, we should only count one ofthe two states in which both units of energy are stored in the same molecule. The entropyin that case would be S = kB ln 2.
Let’s generalize this example. Suppose that I have n units of energy shared among m
indistinguishable molecules. There’s a trick for figuring out how many different ways I canshare out m units of energy among n molecules. Imagine that we have n balls (the units ofenergy) arranged on a line with two fixed walls at the ends defining a “room” that containsall the balls, and m − 1 movable walls. The movable walls can divide the room into m
“cubicles,” each cubicle representing a molecule. Imagine that we start with an empty roomand insert the walls and balls randomly, one by one, into the room. How many differentarrangements of balls and walls are there? This will be the number of microstates. In total,we have n + m − 1 objects to arrange. For now, suppose that the balls are distinguishable

P1: SFK Trim: 247mm × 174mm Top: 14.586mm Gutter: 23.198mm
CUUK1808-06 CUUK1808/Roussel 978 1 107 00678 2 October 29, 2011 13:29
6.5 A microscopic picture of entropy 121
Figure 6.2 An experiment to study diffusive mixing of molecules on a surface. A wall separates twoparts of the surface. On the left, a single layer of molecules of species A (represented by open circles)has been adsorbed onto the surface, whose atoms are represented by darker gray circles. The rightside of the surface is covered with molecules of species B (light gray circles).
from each other, as are the walls (colored or numbered, say). We will place them from leftto right in the room by randomly picking one ball or wall, placing it, then going back topick another one, over and over again until they are all gone. There are n + m − 1 waysto pick the first object. That leaves us n + m − 2 objects to pick from the next time, thenn + m − 3 objects, and so on, until there is only one object left to place. There are therefore(n + m − 1)(n + m − 2)(n + m − 3) . . . (2)(1) = (n + m − 1)! different ways to order theobjects, assuming that each ball is distinguishable from the next, and similarly for the walls.However, they are not distinguishable. By a similar argument, the number of different waysof ordering the n balls is n!, so that many arrangements are indistinguishable because theydiffer only in the ordering of the balls, which we can’t actually tell apart. To make this clear:Picking ball 1, then ball 2 is the same as picking ball 2, then ball 1. Similarly, (m − 1)!arrangements differ only by the ordering of the walls. The total number of ways of sharingn units of energy among m molecules is therefore
�n,m = (n + m − 1)!
n!(m − 1)!
This number can be colossal, even for what we would consider to be tiny numbers ofmolecules. Suppose for example that n = 100 and m = 100. Then �n,m = 4.53 × 1058.
6.5.2 Configurational entropy of adsorbed molecules
Let’s consider another example, namely the diffusion of adsorbed molecules over a surface.Adsorbed molecules are simply molecules that have become stuck to a surface. Thesemolecules will generally only stick to certain sites, sometimes the atoms of the surface,sometimes the spaces between the atoms. They can hop from site to site or switch places withtheir neighbors, which results in diffusion, which we can picture as a random wandering ofthe molecules over the surface.
Now consider the experimental preparation shown in Figure 6.2. A wall separates twohalves of the surface. On each side, we have covered the surface with a single layer of adifferent adsorbate (the molecules stuck to the surface). Call the adsorbate on the left A

P1: SFK Trim: 247mm × 174mm Top: 14.586mm Gutter: 23.198mm
CUUK1808-06 CUUK1808/Roussel 978 1 107 00678 2 October 29, 2011 13:29
122 The Second Law
and that on the right B. The entropy of this original arrangement is S = kB ln 1 = 0 sincethere’s only one way to put one atom at each available site on each side. For simplicity,suppose that there are exactly N sites (and thus N atoms of A and B) on each side ofthe wall. At t = 0, we remove the wall. If the adsorbed atoms can trade places with theirneighbors (generally the case), then they will start to mix. If the forces between two Asor two Bs or between an A and a B are the same (not guaranteed), then we would expectthat the As and Bs would eventually be well mixed. What do we mean by that? We couldmean one of at least two things: (a) The probability of finding an atom of A or of B at anygiven site eventually tends to 1
2 (since there are equal numbers of atoms of A and B); (b) Ifwe take a portion of the surface that is large so that it contains many adsorption sites, thenthere should be about the same number of A and B molecules in this portion. The first ofthese ideas tells us how to calculate the entropy: there are 2N lattice sites. The number ofdifferent ways that I can put N atoms of A on 2N lattice sites is
� = (2N )!
N !N !
The rationale for this formula is as follows: I have 2N ways of choosing the site for thefirst atom, 2N − 1 remaining sites for the second atom, and so on. Multiplying these outI get (2N)(2N − 1) . . . (N + 1) = (2N )!/N!. However, the As are indistinguishable, so Ihave to divide by N !, the number of different ways I could order the N molecules of A,to account for the different orders in which I could populate the same sites. Once I havedecided where the As go, the Bs are placed in the remaining sites so there are no choicesleft to make. Using the statistical theory you may have learned in high school, this quantityis C(2N,N ), the number of different combinations of N objects chosen from a set of 2N
objects.If we plug � into the Boltzmann formula, we get an equation for the entropy. Unfor-
tunately, this equation is very hard to use because of the factorials. In any reasonableexperiment, N is large (of the order of a mole), and we simply can’t calculate factorials ofvery large numbers directly. The following formula, known as Stirling’s approximation, isuseful in these cases:
ln N ! ≈ N ln N − N
The entropy becomes
S = kB ln
((2N )!
N !N !
)≈ kB [ln(2N )! − 2 ln N !]
= kB [2N ln(2N ) − 2N − 2 (N ln N − N )]
= 2NkB ln2N
N= 2NkB ln 2
Note that 2N is the total number of atoms adsorbed on the surface. Expressing this numberin moles, we have n = 2N/L or 2N = nL. Since kB = R/L, the entropy can be rewrittenS = nR ln 2. As the entropy of the original (ordered) system was zero, the change in entropyon mixing the two adsorbates is �mixS = nR ln 2 − 0 = nR ln 2. Note that we get exactly

P1: SFK Trim: 247mm × 174mm Top: 14.586mm Gutter: 23.198mm
CUUK1808-06 CUUK1808/Roussel 978 1 107 00678 2 October 29, 2011 13:29
6.5 A microscopic picture of entropy 123
the same result from Equation 6.4 with X1 = X2 = 12 , despite the entirely different means
by which these results were obtained!We calculate the entropy of mixing by assuming that any given site is equally likely to be
occupied by an A or by a B. At first glance, this is vaguely unsettling; our second descriptionof what we meant by a well-mixed system suggests that the As and Bs should be spreadout evenly, and yet microscopic states in which all the As and Bs are neatly organized (e.g.the original configuration with all the As on the left) count in the total. These two ideas donot contradict each other because the configurations in which the As and Bs are well mixedby our second criterion are overwhelmingly more likely than those in which the As and Bsare segregated, again assuming that there are no significant differences in the interatomicforces acting on the two types of molecules. To see this, let’s ask ourselves how many of the� microscopic states place exactly Nl molecules of A on the left and the rest on the right.Again, we won’t have to worry about the Bs since they will simply be placed wherever wehaven’t put an A. There are
ωl = C(N,Nl) = N !
Nl!(N − Nl)!
ways of arranging Nl molecules of A on the N adsorption sites on the left. Similarly, theremaining N − Nl molecules of A can be placed in
ωr = C(N,N − Nl) = N !
Nl!(N − Nl)!
ways on the right. The total number of arrangements of N molecules of A such that Nl arethe on left and N − Nl are on the right is just the product of these two quantities:
ω(N,Nl) = N !2
Nl!2 (N − Nl)!2
How does this function behave? Figure 6.3 shows the number of configurations as afunction of Nl for N = 50. Note the logarithmic scale. Configurations with Nl ≈ 1
2N areoverwhelmingly more numerous, and so are overwhelmingly more likely to be observed.Table 6.1 shows the probability that the number of molecules of A on the left differsfrom the most probable value (N/2) by more than 1% as a function of N . Note howrapidly this probability decreases. One can imagine that, for a truly macroscopic systemcontaining a number of molecules of the order of Avogadro’s number, the probability ofsignificant fluctuations would be unmeasurably tiny. This is a good thing; a very similarstatistical argument could be applied to the mixing of gases. Accordingly, the probabilitythat we would ever encounter an unmixed pocket of air in the open atmosphere in whichthe oxygen content is either significantly higher or lower than average (for the altitude)is vanishingly small. The laws of mechanics allow for the possibility of the atmosphereunmixing itself into regions of high and low oxygen concentrations, but the probability ofobservation of such a state is just too small to even calculate.

P1: SFK Trim: 247mm × 174mm Top: 14.586mm Gutter: 23.198mm
CUUK1808-06 CUUK1808/Roussel 978 1 107 00678 2 October 29, 2011 13:29
124 The Second Law
Table 6.1 Probability of a 1% fluctuationfrom the mean in the number of particleson the left or right of the center line as afunction of the total number of particles N .
N Pr(∣∣N
2 − Nl
∣∣ > 1100
N
2
)100 0.7774
1000 0.587110 000 0.142420 000 0.036530 000 0.007535 000 0.0019
100
105
1010
1015
1020
1025
1030
0 5 10 15 20 25 30 35 40 45 50
ω(5
0,N
l)
Nl
Figure 6.3 Number of microscopic states with exactly Nl of the 50 atoms of A on the left half of a100-site surface. Note the logarithmic scale for the number of microstates.
6.5.3 Qualitative arguments about entropy
Given the qualitative definition that entropy measures the number of microstates availableto a system, we can often determine the sign of the entropy change in a reaction withoutdoing any calculations.
Example 6.6 The entropy change for the reaction
C(s) + 2S(s) → CS2(l)

P1: SFK Trim: 247mm × 174mm Top: 14.586mm Gutter: 23.198mm
CUUK1808-06 CUUK1808/Roussel 978 1 107 00678 2 October 29, 2011 13:29
6.5 A microscopic picture of entropy 125
is positive. The reason is straightforward: we are taking two orderly solids (very fewmicrostates) and converting them to a molecular liquid. Molecules in the liquid state havemuch more freedom of motion than atoms locked into solids, and so have more microstatesavailable to them. Accordingly, the entropy of the liquid product is higher than the entropyof the solid reactants.
Example 6.7 It is tempting to think that the entropy change for the dissociation of an ioniccrystal into its ions such as
MgF2(s) → Mg2+(aq) + 2F−
(aq)
is positive. After all, we break up a nice orderly crystal (not a lot of microstates) andturn it into free-moving ions (apparently, lots of microstates). However, there is anotherfactor to consider, namely the fact that the solvent molecules organize themselves aroundthe ions, producing a negative contribution to the entropy. Moreover, the ions in solutionretain some of their organization due to their mutual attractions and repulsions so thatthe entropy contribution from breaking up the solid lattice is not as large as might beexpected. It turns out that the loss of microstates of the solvent is the more importanteffect in the case of magnesium fluoride (and in many others, although not for all ioniccompounds) so that the entropy of the system actually decreases in this process. The punchline of this example is this: if you’re trying to predict the sign of the entropy change, youhave to make sure that you considered all contributions to the entropy of the system, andsometimes you have to be prepared to admit that you don’t know a priori what the signwill be.
In your previous courses in chemistry, you may have run across discussions of entropythat suggested that entropy was a measure of disorder or randomness. You may have noticedthat I have so far carefully avoided any language of the sort. Why? Because it’s misleading.In some cases we can relate the number of microstates available to a system to intuitivenotions of disorder. In many others, it’s not so clear, and trying to do so leads to errors,often because we haven’t taken all sources of “disorder” into account, as in the aboveexample, but sometimes for more subtle reasons. For example, suppose that I asked youto say whether a mole of helium or a mole of krypton has the higher entropy at 25 ◦C.You might reason that helium is much lighter, so at the same temperature, its atoms havea much higher average speed. You might then conclude that these fast-moving heliumatoms are more “disordered” than the slower-moving krypton atoms, and thus that heliumshould have the higher entropy. This argument is in fact wrong. Because of the dependenceof the translational energy levels on the mass of a particle (which we can get from theparticle-in-a-box model, Section 2.4), there are more translational microstates available toa heavy atom at a given temperature, so krypton actually has a higher entropy than helium.It’s much better in general to think in terms of microstates than disorder. The microstateapproach at least leads you to ask the right questions, even if you might not always knowhow to answer them.

P1: SFK Trim: 247mm × 174mm Top: 14.586mm Gutter: 23.198mm
CUUK1808-06 CUUK1808/Roussel 978 1 107 00678 2 October 29, 2011 13:29
126 The Second Law
Exercise group 6.4
(1) The entropy of money: Suppose that someone tells you that he has a total of 10¢ in hispocket. There are a few different combinations of coins that could add up to 10¢. If wethink of these different possibilities as microstates, we can calculate an entropy.(a) What is the entropy of 10¢? Give your answer in terms of kB .(b) Explain what the entropy calculated in question 1 measures.(c) If you were told that one of the coins was a 5¢ piece, would the entropy increase
or decrease? Why?(2) Does the entropy of the system increase or decrease during the reaction N2O4(g) →
2NO2(g)?(3) Do you expect �rS to be positive or negative for the reaction
Na(s) + 1
2Cl2(g) → NaCl(s)?
(4) When we adsorb gas onto a surface, we often express the amount adsorbed as apercentage of the surface sites occupied, which we call the percent coverage. Supposethat we have 10% coverage in one experiment, and 90% coverage in another. Howwould the entropy of the gas compare in the two experiments? In other words, in whichcase, if any, is the entropy higher?
(5) A protein is made up of a string of amino acids or, more precisely, of the residuesobtained as a result of the condensation reaction that makes a peptide bond. Two of thebonds along the “backbone” of a protein can rotate freely, as can some of the bonds inthe side chains. As a result, proteins can adopt many conformations. At physiologicaltemperatures, many proteins have a unique overall fold, called the native fold, whichincludes a small number of closely related conformations. For the sake of argument inthis question, assume that the native fold consists of just one conformation. Proteinscan be unfolded, resulting in more-or-less random conformations, by heating to hightemperatures.(a) In a series of investigations, Makhatadze and Privalov measured the entropy of
unfolding of proteins at 125 ◦C.1 All of these values tend to fall into a narrowrange, with an average of 52 J K−1(mol residues)−1. How many conformations perresidue does this value imply for the unfolded proteins?
(b) If the native fold corresponded to many conformations, what effect would this haveon the calculation of part 5?
6.6 Entropy and evolution
The idea that entropy is a measure of disorder has given it a certain popular appeal.Since entropy is a hard quantity to reason about, even for experienced scientists, this has
1 These investigations were summarized in G. I. Makhatadze and P. L. Privalov, Protein Sci. 5, 507 (1996).

P1: SFK Trim: 247mm × 174mm Top: 14.586mm Gutter: 23.198mm
CUUK1808-06 CUUK1808/Roussel 978 1 107 00678 2 October 29, 2011 13:29
6.6 Entropy and evolution 127
sometimes led to the circulation of fallacies. One of the more annoying ones has been therecurring argument that evolution somehow contradicts the Second Law.
Now it’s difficult to give a good version of a bad argument, but I will try to put theargument against evolution based on the Second Law in its best possible light. I apologizein advance for failing to do something that can’t be done, namely to make this argumenttruly plausible. With this caveat, here is my attempt to present the argument:
The Second Law of Thermodynamics says that disorder increases with time. Evolutionary theory, ifwe are to believe it, says that the complex life forms we see today evolved from simpler life forms.This is a clear contradiction to the Second Law, therefore evolution can’t have happened.
There are lots of problems with this argument. We could talk about the fact that theSecond Law applies to adiabatic systems, so that we have to consider living organismsand their surroundings, a point to which we will return below. We could question theuse of the equilibrium theory, which is where these particular ideas about entropy comefrom, to a biosphere that is very far from equilibrium. It turns out though that the higher-order refinements of non-equilibrium thermodynamics are not necessary to understand theintellectual error made in this argument against evolution. We could also point out thatdisorder is a meaningless concept, and that the Second Law says nothing about it. If wewant to rephrase the Second Law argument against evolution in terms of microstates, werun into a problem: What are the microstates we should consider? Evolution is a processof, at the very least, an ecosystem. How do we define, never mind count, the microstates ofan ecosystem? Even that wouldn’t be quite right because the entropy of the solar radiationreceived by the Earth is an important part of the equation. The “disorder” approach toentropy, or its more correct microstate formulation, doesn’t get us anywhere unless we cansay what microstates we should be counting and account for external inputs correctly.
Ultimately though, the real problem with this argument is the following: evolution is not aprocess in the sense we would normally use the term in physical science. It is something thathappens as a result of several other processes, most saliently the reproduction and death ofliving organisms. All of the processes carried out by living organisms result in a net increasein entropy. Let’s take the key process of reproduction for example. Reproduction requiresa lot of energy. That energy comes from metabolism, which generates a large amount ofhigh-entropy waste products. Simply put, life is a highly refined entropy generator. Theobjection raised against evolution on the basis of the Second Law therefore seems to rest ona faulty premise; living organisms, singly or as groups, increase the entropy of the Universe.There is therefore no decrease in entropy caused by evolution to explain away.
Another way to look at the error made by the people who advance the Second Law argu-ment against evolution is that they are trying to isolate one aspect of the temporal evolutionof the biosphere and to apply the Second Law to this one isolated aspect. Specifically, theywant to look at how species change with time as an isolated phenomenon. This is wrong.Even if we knew how to define the entropy change associated with biological evolution,there is no guarantee in physical theory that any one, arbitrary partition of the entropyof a complex system will necessarily increase with time. It is, again, the entropy of the
P1: SFK Trim: 247mm × 174mm Top: 14.586mm Gutter: 23.198mm
CUUK1808-06 CUUK1808/Roussel 978 1 107 00678 2 October 29, 2011 13:29
128 The Second Law
biosphere, along with key inputs such as solar radiation, that we need to consider. An anal-ogy would be to look at the transformations undergone by an ethylene molecule during themanufacture of polyethylene and to claim that the Second Law has been violated becausethe eventual product is more ordered than the starting material. We would reject such anargument because it leaves out the substantial energy input to the process, and concomitantincrease in entropy due to the dissipation of a portion of that energy. We should similarlyreject the one-dimensional view of the temporal evolution of the biosphere required by theSecond-Law argument against evolution. Biological evolution is something that happensas a byproduct of the normal day-to-day entropy-generating activities of living organisms.It can’t be separated out and asked to satisfy the Second Law all by itself.
6.7 The Third Law of Thermodynamics
The Second Law is closely associated with the Third Law of Thermodynamics:
The entropy change during an isothermal process between phases whose initial and final states aretrue thermodynamic equilibrium states approaches zero as the temperature approaches absolute zero.
This implies that the entropy of a regular crystalline solid approaches a universal constant(which we may as well call zero) as the temperature decreases to absolute zero. Note thatthis is in accord with our microscopic picture of entropy; there’s just one way to arrange theatoms in a perfect crystal (� = 1), so there is no entropy associated with the arrangementof the atoms in space. As we approach absolute zero, the energy of the system approachesthe zero-point energy, the absolute minimum possible. There is no excess energy to shareamong the atoms, and so no entropy associated with this sharing. Accordingly, a perfectcrystal at absolute zero would have just one microstate, and its entropy would be zero.This is not true for every material. Glasses for instance are not crystalline, and thus notdirectly subject to the Third Law. Also, some crystalline materials (notably CO) seem tohave a certain amount of irreducible disorder as the temperature is decreased. However,conceptually, the Third Law remains very useful since it defines an experimental zero pointfor entropy, namely the low-temperature entropy of a perfect crystal.
This property of entropy allows us to define absolute entropies, (unlike enthalpy wherewe have to tabulate differences from a reference state). Since the entropy of a perfect crystalat absolute zero is zero, if a substance forms a regular crystal at low temperature, we cancompute its entropy at any other temperature by adding the changes in entropy during theheating of the substance from zero to, for example, the standard temperature. Note that theabsolute entropies of normal substances are always positive since the entropy change onheating is positive and the lowest possible value, defined by the entropy of a perfect crystal,is zero. In the case that a substance does not form a perfect crystal at low temperatures,we can infer the absolute entropy from entropies of reaction, given the entropies of theother substances involved in a particular reaction. Entropies of reaction are obtained fromenthalpies and free energies of reaction, the latter being the topic of the next few chaptersof this book.

P1: SFK Trim: 247mm × 174mm Top: 14.586mm Gutter: 23.198mm
CUUK1808-06 CUUK1808/Roussel 978 1 107 00678 2 October 29, 2011 13:29
6.7 The Third Law of Thermodynamics 129
Note again that thermodynamic tables will contain absolute entropies, not entropies offormation.
The standard entropy of an element always has a positive value.
If we want to calculate the entropy change in a reaction from a table of standard entropies, wetherefore have to consider all reactants and products, including any elements participatingin the reaction.
As usual, ions in solution pose special problems. The difficulty is that we can’t measurethe entropy of a single ion since we always create them in ion/counterion pairs when wedissolve an ionic compound in a solvent. In this case, the absolute entropy of the aqueousproton is arbitrarily assigned to zero, and all the other entropies for aqueous ions are givenrelative to this reference substance. Consequently, the entropies of aqueous ions are actuallyrelative (not absolute) entropies, and some of them are negative.
You may be surprised that a well-studied science like thermodynamics still gives rise tosome controversies. In fact, there are several controversial questions in thermodynamics,one of which follows. The Third Law is often stated in an entirely different way than thestatement we discussed above:
It is not possible to lower the temperature of a system to absolute zero.
There have been many attempts over the years to prove one statement from the other, as wellas attempts to show that this version of the Third Law is a consequence of some combinationof the three Laws of Thermodynamics, but to my knowledge, no entirely satisfactory proofof the equivalence of the two statements of the Third Law has been obtained. We believe,based on a number of lines of evidence, that this statement of the Third Law is also correct.It is possible that it is in fact an independent law, i.e. a Fourth Law of Thermodynamics.
Example 6.8 Entropy of formation Although we have tables of absolute entropies, wecan calculate standard entropies of formation when required. Consider the standard entropyof formation of liquid water, for example. The formation reaction is
H2(g) + 1
2O2(g) → H2O(l)
We can look up the standard entropies of the reactants and products in the table in SectionA.2. For this reaction,
�f S◦ = S◦m(H2O) − S◦
m(H2) − 1
2S◦
m(O2)
= 69.95 − 130.680 − 1
2(205.152) J K−1mol−1 = −162.31 J K−1mol−1.
Example 6.9 Residual entropy CO molecules adopt more or less random orientations(oxygen to the left, oxygen to the right) in the crystal. Estimate the molar entropy of a COcrystal at low temperature.

P1: SFK Trim: 247mm × 174mm Top: 14.586mm Gutter: 23.198mm
CUUK1808-06 CUUK1808/Roussel 978 1 107 00678 2 October 29, 2011 13:29
130 The Second Law
At low temperatures, only the disorder of the CO molecules contributes to the entropy.The associated entropy is sometimes called the residual entropy since it’s the entropywe can’t account for by pure Third-Law behavior. Each CO molecule has two possibleorientations. The number of different ways of arranging the CO molecules is therefore
� = 2N
where N is the number of molecules in the crystal. The Boltzmann entropy is therefore
S = kB ln 2N = NkB ln 2
To convert the result to a molar basis, first note that the entropy per molecule is S/N =kB ln 2. Multiply both sides by Avogadro’s number. Since R = LkB , we get
Sm = R ln 2 = 5.76 J K−1mol−1
The measured residual entropy is slightly lower (about 5 J K−1mol−1), indicating that COisn’t fully disordered at low temperature, but nearly so.
If we want to calculate the absolute entropy of a substance at some temperature T givenits entropy at a reference temperature (usually 25 ◦C), all we have to do is to add the changesin entropy in going from the reference temperature to T . The following two examples showhow this is done.
Example 6.10 Absolute entropy as a function of temperature The entropy of goldat 298 K is 47.4 J K−1mol−1 and its specific heat capacity at constant pressure is25.42 J K−1mol−1. To compute the entropy of gold at (for instance) 273 K, we first calculatethe change in entropy during the process of cooling gold to this temperature from 298 K:
�S = (25.42 J K−1mol−1) ln
(273
298
)= −2.23 J K−1mol−1
The entropy at 273 K is therefore
S(273 K) = S(298 K) + �S = 45.2 J K−1mol−1
Example 6.11 Absolute entropy and phase changes Suppose that we want to calculatethe entropy of liquid sodium at 800 K. The entropy of sodium at 298 K is 51.30 J K−1mol−1.The melting temperature is 371 K and the latent heat of fusion is 2.6 kJ mol−1. We can usea constant heat capacity for the solid, which is only to be heated by 73 K, but not for theliquid whose temperature will rise several hundred degrees from the melting point to thetarget temperature. For liquid sodium,2
Cp,m(l) = 37.46 − 0.01915 T + 1.063 × 10⁻⁶ T 2
where the heat capacity is in J K−1mol−1 and T is in kelvins.
2 CRC Handbook of Chemistry and Physics, 66th edn; CRC Press: Boca Raton, 1985, pp. D-43–D-49.

P1: SFK Trim: 247mm × 174mm Top: 14.586mm Gutter: 23.198mm
CUUK1808-06 CUUK1808/Roussel 978 1 107 00678 2 October 29, 2011 13:29
6.7 The Third Law of Thermodynamics 131
We first deal with the increase in temperature from 298 K to the melting point. Since thesolid is assumed to have a constant heat capacity, this is straightforward:
�(1)Sm = (28.2 J K−1mol−1) ln
(371 K
298 K
)= 6.18 J K−1mol−1
A phase transition is a reversible isothermal process so
�(2)Sm = 2.6 kJ mol−1
371 K= 7.0 J K−1mol−1
To calculate the change in entropy of the liquid, we start from the differential formof the definition of entropy: dS = dqrev/T . For a heating process, dqrev = Cp dT so wehave
dSm = Cp,m
TdT = dT
(37.46
T− 0.01915 + 1.063 × 10⁻⁶T
)
∴ �(3)Sm =∫ 800
371dT
(37.46
T− 0.01915 + 1.063 × 10⁻⁶T
)
= [37.46 ln T − 0.01915T + 5.315 × 10⁻⁷T 2]800
371
= 37.46 ln
(800
371
)− 0.01915(800 − 371) + 5.315 × 10⁻⁷(8002 − 3712)
= 20.84 J K−1mol−1
The entropy at 800 K is therefore
Sm(800 K) = S◦m + �(1)Sm + �(2)Sm + �(3)Sm = 85.3 J K−1mol−1
Exercise group 6.5
(1) Calculate the entropy of nitrogen at 400 K.(2) The standard entropy of liquid methanol at 298.15 K is 126.8 J K−1mol−1 and its
heat capacity is 81.6 J K−1mol−1. Methanol boils at 337.8 K with an enthalpy ofvaporization at that temperature of 35.21 kJ mol−1. The heat capacity of the vaporis 43.89 J K−1mol−1. Calculate the entropy of methanol vapor at 800 K.
(3) The heat capacity of solid silver in J K−1mol−1 is given by the equation
Cp,m = 21.2 + 4.27 × 10⁻³T + 1.51 × 10⁵/T 2
where T is the temperature in kelvins. What is the change in entropy per mole of silverwhen this substance is heated from 298 K (room temperature) to its melting point,1234 K, at constant pressure? Compare this to the entropy change during the meltingprocess. The heat of fusion for silver is 11.95 kJ mol−1.
(4) When a carbonate solution is acidified, carbon dioxide is produced.

P1: SFK Trim: 247mm × 174mm Top: 14.586mm Gutter: 23.198mm
CUUK1808-06 CUUK1808/Roussel 978 1 107 00678 2 October 29, 2011 13:29
132 The Second Law
F
H
H
H
H
H
Figure 6.4 Fluorobenzene.
(a) Can we say anything about the sign of the entropy change without doing anycalculations?
(b) Calculate the entropy change for this reaction.(5) In crystals, flat aromatic molecules (e.g. benzene) typically stack up with the carbon
atoms of one ring directly above the carbon atoms of the ring below due to the interac-tions between their delocalized π orbitals. For small substituents that lie in the planeof the ring, like fluorine, there is often only a very small energy difference betweenlining up one fluorine above another, or having a fluorine atom lying above a hydrogenatom. The relative positions of the fluorine atoms in the different layers are thereforeessentially random. Calculate the residual molar entropy of fluorobenzene (illustratedin Figure 6.4).
6.8 Heat engines and the Carnot cycle
Entropy was discovered by Sadi Carnot, an engineer who was trying to understand steamengines and their fundamental limitations. Historically then, putting heat engines at the endof a chapter on entropy is backwards. However, we don’t really need to know about heatengines to study biochemistry. This section, and the next on refrigerators, are included toexpand your scientific culture given the pivotal importance of heat engines in the history ofthermodynamics.
We know, from Kelvin’s statement of the Second Law, that a heat engine must allowsome heat to flow through it in order to function. Suppose that the engine is in contact withtwo constant-temperature reservoirs, respectively at temperatures Th (high) and Tl (low).The engine contains a compressible fluid and operates in a reversible cycle. Working ina cycle is important because an engine that doesn’t eventually return to its original statecan’t run for very long: The state (e.g. the temperature and positions of the pistons) can’tkeep changing in the same direction without putting the engine into a state where it can nolonger perform work (too hot, all pistons out, etc.). Reversibility makes this a maximallyefficient engine. (We will prove this in Section 7.1.)
The Carnot engine cycle consists of four steps (Figure 6.5):
(1) The fluid starts the cycle at the higher temperature Th and reversibly draws a quantityof heat from the corresponding heat bath.
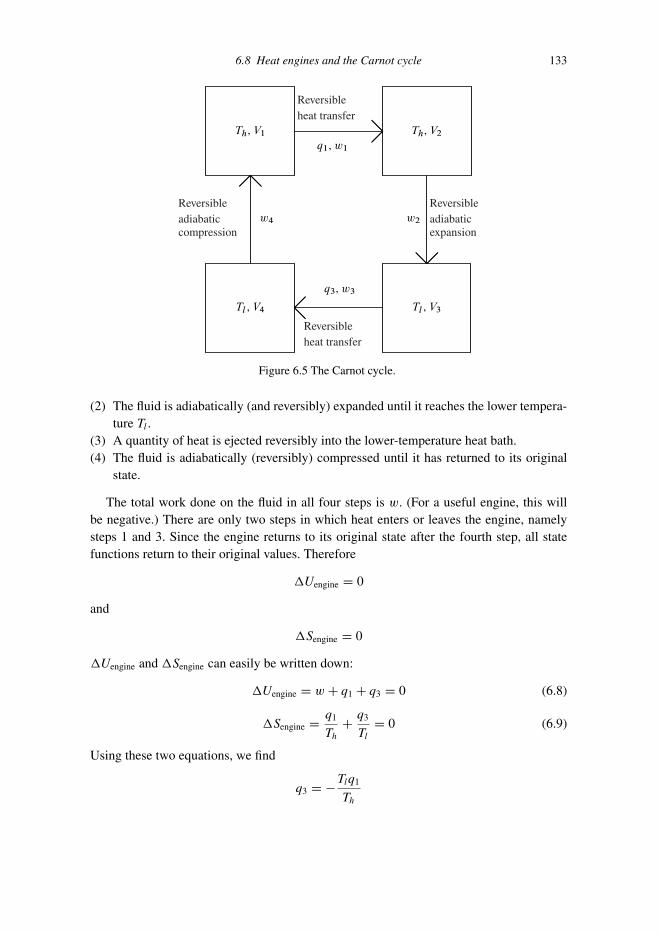
P1: SFK Trim: 247mm × 174mm Top: 14.586mm Gutter: 23.198mm
CUUK1808-06 CUUK1808/Roussel 978 1 107 00678 2 October 29, 2011 13:29
6.8 Heat engines and the Carnot cycle 133
Reversibleheat transfer
Reversibleheat transfer
Reversibleadiabaticcompression
Reversibleadiabaticexpansion
Figure 6.5 The Carnot cycle.
(2) The fluid is adiabatically (and reversibly) expanded until it reaches the lower tempera-ture Tl .
(3) A quantity of heat is ejected reversibly into the lower-temperature heat bath.(4) The fluid is adiabatically (reversibly) compressed until it has returned to its original
state.
The total work done on the fluid in all four steps is w. (For a useful engine, this willbe negative.) There are only two steps in which heat enters or leaves the engine, namelysteps 1 and 3. Since the engine returns to its original state after the fourth step, all statefunctions return to their original values. Therefore
�Uengine = 0
and
�Sengine = 0
�Uengine and �Sengine can easily be written down:
�Uengine = w + q1 + q3 = 0 (6.8)
�Sengine = q1
Th
+ q3
Tl
= 0 (6.9)
Using these two equations, we find
q3 = −Tlq1
Th

P1: SFK Trim: 247mm × 174mm Top: 14.586mm Gutter: 23.198mm
CUUK1808-06 CUUK1808/Roussel 978 1 107 00678 2 October 29, 2011 13:29
134 The Second Law
and
w = −q1
(Th − Tl
Th
)
The efficiency η of a heat engine is the amount of work obtained per unit heat extracted.The work obtained, remembering that all the symbols used so far are relative to the engine,is −w. The heat extracted is q1. We obtain η directly from the last equation:
η = − w
q1= Th − Tl
Th
= 1 − Tl
Th
(6.10)
Note that the efficiency is less than 100% unless Tl = 0 (or Th → ∞). Since the Third Lawsays that we can’t reach absolute zero, the efficiency of a Carnot engine is always less than100%, in accord with Kelvin’s statement.
It can be proven that, if the Second Law is correct, no heat engine can be more efficientthan a reversible Carnot engine. The proof is by contradiction: you assume the existenceof an engine that is more efficient than a Carnot engine working between the same twoheat reservoirs, and use it to operate a Carnot engine in reverse, moving heat from a coolbody to a warm one. In other words, the Carnot engine becomes a Carnot refrigerator. Youthen show that the two engines together violate the Second Law by producing work in acyclic process with no net heat transfer from the warmer to the colder body. If the SecondLaw is correct, it then follows that no engine operating between Th and Tl can be moreefficient than a reversible Carnot engine. The proof is not very difficult, but, like most ofthese things, it takes time and space to develop, so this outline will have to suffice.
Real engines won’t reach the maximum efficiency given by Equation (6.10) since theywon’t be working reversibly. Moreover, most engines don’t operate on the Carnot cycle.Analyses like the one we have just seen for the Carnot cycle can be carried out for otherreversible engine cycles, with analogous results. For real, irreversible engines, we typicallyfind that higher efficiencies are reached at higher ratios of Tl/Th, just as for a reversibleCarnot engine, but the exact relationship may be different from Equation (6.10).
Example 6.12 Robot tug-of-war Two robots which derive their power from heat enginesare pitted against each other in a tug-of-war. The first robot’s engine operates betweenthe temperatures of 200 and 400 K. Robot number 2 extracts work from an engine whoseworking temperatures are 700 and 900 K. Both robots consume the same fuel at the samerate. On thermodynamic grounds, which robot do you expect to win the contest?
For robot 1,
η1 = 1 − 200
400= 0.50
For robot 2,
η1 = 1 − 700
900= 0.22
Thus, robot 1 has a clear advantage.

P1: SFK Trim: 247mm × 174mm Top: 14.586mm Gutter: 23.198mm
CUUK1808-06 CUUK1808/Roussel 978 1 107 00678 2 October 29, 2011 13:29
6.8 Heat engines and the Carnot cycle 135
Example 6.13 The internal combustion engine Modern internal combustion engines arealso heat engines. They operate on a different cycle than the Carnot cycle, but for the sakeof this example, we will treat these engines as Carnot engines. Since many engine partsare now made of aluminum, the melting point of this metal (932 K) sets an upper limiton the combustion temperature. The exhaust temperature is generally around 400 K. Theefficiency of this engine can’t be any greater than
η = 1 − Tl
Th
= 1 − 400
932= 0.571
A typical modern car consumes 6 L (100 km)−1 at highway speeds. The enthalpy ofcombustion of gasoline is −34.7 MJ/L so the heat energy required to go 1 km is 2.1 MJ km−1.Since η = −w/q1, the maximum amount of work done per kilometer is
w = −(0.571)(3.5 MJ km−1) = −1.2 MJ km−1.
This is of course just the theoretical (Carnot) efficiency. The real efficiency is quite a bitlower, so a real engine actually produces substantially less than 1.2 MJ of work for everykilometer traveled, a greater amount of the heat obtained from combustion being wasted.
Exercise group 6.6
(1) A heat engine takes in heat at a rate of 10 MW and ejects heat at a rate of 8 MW.(a) How much work does it perform?(b) If the second quantity of heat is ejected at 400 K, what is the minimum upper
operating temperature of this engine?(2) An electrical generator is a type of heat engine. Suppose that a generator burns ethanol
at a rate of 10 L h−1. The generator’s combustion chamber runs at 450 ◦C and thetemperature of the exhaust manifold is 130 ◦C. What is the maximum electrical power(measured in W, i.e. in J s−1) that such a generator might produce? The density ofethanol is 790 g L−1 and its molar mass is 46.069 g mol−1.
(3) A coal-fired power plant is designed to produce 12 MW of electricity. (This is a smallunit that might be used to power a pulp-and-paper mill or other relatively energy-intensive factory.) The coal is used to heat steam to a temperature of 560 ◦C. Afterrunning through the turbines, the steam has been condensed and the liquid watercooled to 38 ◦C.(a) Calculate the minimum amount of heat that must be generated to produce the
desired amount of electricity.(b) Calculate the amount of heat required to bring 1 kg of liquid water from 38 ◦C up
to steam at 560 ◦C.(c) How fast must water be circulated through the heating unit to generate the required
amount of electricity?(d) The enthalpy of combustion of coal is 29 MJ kg−1. What is the minimum rate at
which coal must be burned to sustain the required level of power production?

P1: SFK Trim: 247mm × 174mm Top: 14.586mm Gutter: 23.198mm
CUUK1808-06 CUUK1808/Roussel 978 1 107 00678 2 October 29, 2011 13:29
136 The Second Law
(4) Cogeneration is a process in which a heat engine is used to drive an electrical generator,and the waste heat from the engine is used either in industrial processes, for the heatingof buildings, or for hot water.(a) TransAlta operates a natural gas cogeneration plant in Sarnia, Ontario that generates
440 MW of electrical power. This plant provides power to the electrical grid, andsteam to several local industries. The generating plant uses a combination ofgas turbines (analogous to jet engines, but configured to turn a generator ratherthan to produce thrust) and steam turbines, with the steam produced using the hotexhaust gases from the gas turbines. The cooled steam that emerges from the steamturbines is then distributed to the plant’s industrial customers. For the purpose ofthermodynamic analysis, we can treat the combination of gas and steam turbinesas one engine. Suppose that the gas turbines operate at 800 ◦C and that the steamexhausted from the steam turbines is at a temperature of 150 ◦C (typical valuesfor cogeneration plants). Calculate the amount of natural gas (in m3) that must beburned per day to sustain the electrical output of this cogeneration plant, assumingthat the generator is an ideal Carnot engine. The specific heat of combustion ofnatural gas is 37.0 kJ/m−3.
(b) At what minimum rate is heat ejected by the generator?(c) The outlet steam is used as a source of heat at various industrial sites, as mentioned
above. If this steam was not available, it would be necessary to generate heat for theindustrial plants some other way, perhaps by burning more natural gas. Assumingan ideal Carnot generator and no heat losses, how much natural gas is saved perday?
(d) A real steam turbine will function at a somewhat lower efficiency than that calcu-lated in question 4a. Is this as serious a problem for a cogeneration plant as it isfor a regular power plant which makes no use of the waste heat?
6.9 Refrigerators
A refrigerator is simply a heat engine running backward; instead of producing work fromthe transfer of heat it transfers heat under the action of work. Just as a reversible Carnotengine is the most efficient heat engine possible, a reversible Carnot refrigerator is the mostefficient refrigerator possible, i.e. the one that uses the least work to transfer a given amountof heat.
Ordinary household electric refrigerators operate on a Carnot cycle. The only differencebetween a real refrigerator and the one we are going to analyze is that a real refrigeratorcan’t operate reversibly. Imagine running the Carnot cycle (Figure 6.5) backward startingin the state (Tl, V4).
(1) A quantity of heat is ejected reversibly into the higher-temperature heat bath (the room).(2) The fluid is adiabatically and reversibly compressed until it reaches the higher temper-
ature Th (room temperature).

P1: SFK Trim: 247mm × 174mm Top: 14.586mm Gutter: 23.198mm
CUUK1808-06 CUUK1808/Roussel 978 1 107 00678 2 October 29, 2011 13:29
6.9 Refrigerators 137
(3) The fluid starts the cycle at the lower temperature Tl (the temperature of the refrigeratedcompartment) and reversibly draws a quantity of heat from the corresponding heat bath(the compartment).
(4) The fluid is adiabatically and reversibly expanded until it has returned to its originalstate.
The cycle steps were numbered in this funny way to maintain a correspondence between therefrigerator and the heat engine. Precisely the same equations apply as before. In particular,Equations (6.8) and (6.9) are still valid. However, η is the wrong measure of “efficiency”for a refrigerator. Instead, we want to know the amount of heat removed (q3) per unit workperformed (just w this time since work is done on the engine). This is called the coefficientof performance η∗. Using the energy- and entropy-balance equations, we get
w = q3
(Th
Tl
− 1
)(6.11)
so that
η∗ = q3
w= Tl
Th − Tl
Example 6.14 Work of refrigeration Refrigerators and freezers are insulated. However,their insulation isn’t perfect and, in any event, the door must occasionally be opened toretrieve or add items so that they are not truly adiabatic systems. Suppose that a freezer isdesigned to maintain a temperature of −5 ◦C in a room at 20 ◦C against an average heatleak of 100 W. A watt is a joule per second so this figure is just the amount of heat we needto remove per second. The coefficient of performance of the refrigerator is
η∗ = 268
293 − 268= 10.7
Since η∗ = q3/w, the minimum work required to combat the heat leak is
w = 100 W
10.7= 9.35 W
Note that this is the average power consumption for an ideal refrigerator operating under thegiven conditions. A real refrigerator cycles on and off so that its peak power consumption ismuch higher than this figure, but of course it consumes very little power while its compressoris off. Furthermore, a real refrigerator is less efficient than a reversible Carnot refrigeratorso even its average power consumption would be somewhat higher than calculated here.
Example 6.15 Heat generated by a refrigerator A refrigerator ejecting heat into a roomat 20 ◦C removes 200 kJ of heat from a 2 ◦C compartment in an hour. By how much does itheat the room?
The coefficient of performance of this refrigerator, assuming that it is an ideal Carnotrefrigerator, is
η∗ = 275 K
293 − 275 K= 15.3

P1: SFK Trim: 247mm × 174mm Top: 14.586mm Gutter: 23.198mm
CUUK1808-06 CUUK1808/Roussel 978 1 107 00678 2 October 29, 2011 13:29
138 The Second Law
The work performed to remove 200 kJ from the cold compartment is
w = q3
η∗ = 200 kJ
15.3= 13.1 kJ
The energy balance equation for the cycle says that
q1 + q3 + w = 0
∴ q1 = −(w + q3) = −213 kJ
This equation implies that the work done is also converted to heat and ejected into the roomduring the refrigeration cycle. In a real refrigerator, a larger amount of work would be doneto extract the same amount of heat, and therefore a larger amount of waste heat would beejected into the room.
Exercise group 6.7
(1) Most of the foods we eat are mostly water. Thus, refrigerating or freezing them isapproximately equivalent to refrigerating or freezing an equal mass of water. Supposethat an 8 kg turkey, initially at 20 ◦C, is placed in a large industrial freezer held at−5 ◦C. The freezer’s coils are on the roof of the building and it’s a nice warm day,with an exterior temperature of 15 ◦C. What is the minimum electrical work requiredto bring the turkey into equilibrium with the rest of the freezer’s contents? Assume thatthe freezer is sufficiently large that its temperature is not significantly affected by thepresence of the turkey.
(2) During a hot summer’s day, an air-conditioned apartment has a steady-state heat leak of2 MJ h−1 when the interior temperature is 25 ◦C and the external temperature is 35 ◦C.What is the minimum electrical work (in Watts, i.e. in J s−1) that the air conditioner isexpending?
6.10 Thermodynamics: the cynic’s view
We have now seen the three Laws of Thermodynamics and some of their consequences. Acynic might paraphrase these laws as follows:
(1) At best, you might break even.(2) You can’t break even, except at absolute zero.(3) You can’t get to absolute zero.
Some slight hope is offered by cosmological models in which the expansion of the Universeis eventually halted and reversed by gravity. In some of these models, the entropy of theUniverse actually decreases during the collapse, which would make things behave quitedifferently than they do now! Unfortunately, the best data currently available suggests that

P1: SFK Trim: 247mm × 174mm Top: 14.586mm Gutter: 23.198mm
CUUK1808-06 CUUK1808/Roussel 978 1 107 00678 2 October 29, 2011 13:29
6.10 Thermodynamics: the cynic’s view 139
gravity isn’t strong enough to halt the expansion, so it looks as though the cynics are rightagain.
Key ideas and equations
� dS = dqrev/T� Second Law of Thermodynamics:◦ It is impossible to continuously convert heat completely into work.◦ �S ≥ 0 for any thermodynamically allowed process of an adiabatic system.
� S = kB ln �. Entropy measures the number of microstates available to a system or,equivalently, our degree of ignorance of the microscopic state.
� The Third Law allows us to define an absolute entropy scale. We calculate the entropy ofreaction as a difference of standard entropies.
� For a heat engine, η = −w/qin = 1 − Tl/Th.� For a refrigerator, η∗ = qremoved/w = Tl/(Th − Tl).
Suggested reading
For a colorful qualitative discussion of the Second Law and its implications, see
P.W. Atkins, The Second Law; Scientific American Books: New York, 1984.
There is a nice overview of the importance of entropy in biological systems in thefollowing paper:
Jayant B. Udgaonkar, Resonance 6(9), 61–66 (2001).
The choices of the symbols U and S for the internal energy and entropy might seemsomewhat arbitrary. In fact, they are. These choices were made by Clausius in the courseof his investigations of thermodynamics in the mid-1800s (see also Figure 6.6). He startedto study energy and entropy before he had names for these concepts, and he picked lettersfor these quantities that weren’t being used for something else. Because of his influence,these symbols were retained. The story is told in the following paper:
Irmgard K. Howard, J. Chem. Ed. 78, 505–508 (2001).
Review exercise group 6.8
(1) Which of the quantities p, q, S and U are state functions?(2) Calculate the entropy of water vapor at 300 ◦C and 1 atm. The entropy of liquid water
at 0 ◦C and 1 atm is 63.2 J K−1mol−1.(3) Critique the following argument: The entropy change during a phase transition is
calculated by �S = �H/T . Since �H < 0 for the freezing of a liquid, �S < 0.According to the Second Law, processes for which �S < 0 can’t happen so freezingis never spontaneous.

P1: SFK Trim: 247mm × 174mm Top: 14.586mm Gutter: 23.198mm
CUUK1808-06 CUUK1808/Roussel 978 1 107 00678 2 October 29, 2011 13:29
140 The Second Law
Figure 6.6 Clausius-Strasse, Zurich. Rudolf Clausius who, among other contributions, was the orig-inator of the concept of entropy, was a Professor of Physics at the famous ETH (EigenossischeTechnische Hochschule, the Swiss Federal Institute of Technology) in Zurich from 1855 to 1867.There is now a street (“Strasse”) named in his honor on the campus of the ETH. Unfairly, this streetis a dead end.
(4) The entropy of vaporization of most substances at their normal boiling points is usuallybetween 85 and 95 J K−1mol−1. This observation is known as Trouton’s rule. There areexceptions to Trouton’s rule. Water for instance has a very high entropy of vaporizationat its boiling point: 108.951 J K−1mol−1. Why?
(5) (a) Use a qualitative argument to predict the sign of the entropy change associatedwith the combustion of ethanol at 25 ◦C.
(b) Calculate the standard entropy of combustion of ethanol. Hopefully your reasoningin question ea agrees with your answer to this question!
(c) Suppose that the reaction were carried out at 500 ◦C instead of 25 ◦C. Outline thecalculations you would have to carry out to obtain the entropy of combustion atthis temperature. Clearly list all thermodynamic data you would need.Note: Ethanol boils at 79 ◦C.

P1: SFK Trim: 247mm × 174mm Top: 14.586mm Gutter: 23.198mm
CUUK1808-07 CUUK1808/Roussel 978 1 107 00678 2 October 29, 2011 13:37
7
Free Energy
Determining whether or not a process is thermodynamically allowed based on entropy is alaborious process because we need to calculate the entropy change both of the system andof its surroundings. Fortunately, for commonly encountered experimental conditions, wecan simplify the calculations at the cost of defining two more state functions.
7.1 The Clausius inequality
Suppose that we are studying a real (irreversible) isothermal process in which both systemand surroundings are held at temperature T . In order to maintain the system at this tempera-ture, the surroundings must give up any heat absorbed by the system during any process thatoccurs. If dq is the heat absorbed by the system during an infinitesimal part of the process,the surroundings must lose the same amount of heat, i.e. the heat relative to the surroundingsis −dq. We can imagine removing the heat from the surroundings using a heat exchangerand reversibly putting it back into the system as described in Section 6.3. Because thesurroundings are assumed to be large enough to be able to exchange heat with the systemwithout any significant temperature change, this transfer of heat is reversible with respect tothe surroundings. The entropy change of the surroundings is then just −dq/T . The SecondLaw guarantees that the entropy change of the universe is non-negative, i.e. that
dS = dSsystem + dSsurroundings = dSsystem − dq
T≥ 0
or
dS ≥ dq
T(7.1)
This is the Clausius inequality. We dropped the subscript “system” because all quantitiesin the inequality are relative to the system. Every isothermal thermodynamically allowedprocess will satisfy this inequality.
We derived the Clausius inequality from the Second Law. We can also derive the SecondLaw from the Clausius inequality; if the system is adiabatic, then dq = 0 so �Ssystem ≥ 0.Since either can be used to prove the other, the Clausius inequality is just another form ofthe Second Law.
141

P1: SFK Trim: 247mm × 174mm Top: 14.586mm Gutter: 23.198mm
CUUK1808-07 CUUK1808/Roussel 978 1 107 00678 2 October 29, 2011 13:37
142 Free Energy
The Clausius inequality has an extremely interesting implication:
dS = dqrev
T≥ dq
T∴ dqrev ≥ dq
or qrev ≥ q
However, since �U = q + w and U is a state function, then for a reversible and anirreversible path that accomplish the same overall change, we must have
wrev ≤ w
Since work done by a system is negative, the maximum useful work is done by a reversibleprocess. A reversible path is necessarily infinitely slow so thermodynamics confirms theold adage that “haste makes waste.”
Exercise group 7.1
(1) Show that the entropy change for any system that undergoes an endothermic processis positive.
(2) Is the entropy change for a process undergoing an exothermic process positive ornegative?
(3) (a) Calculate the work done per mole when an ideal gas is expanded reversibly by afactor of 2 at 115 ◦C.
(b) A friend thinking of investing in a company which makes engines shows you thecompany’s prospectus. Analyzing the machine, you realize that it works by harness-ing the expansion of a gas. The machine’s operating temperature is approximatelyconstant at 115 ◦C and the gas doubles in volume during the power extraction phaseof operation. A quick calculation shows that the machine is claimed to produceabout 3.5 kJ mol−1 of work during the expansion. What advice would you giveyour friend? Give a brief thermodynamic rationale.
7.2 Free energy functions
Suppose that a process occurs at constant temperature and volume. Then, q = �U (Equa-tion 5.5). The Clausius inequality can then be rearranged to
�U − T �S ≤ 0
Again, this seems like an ideal opportunity to define a new state function. Let
A = U − T S
This is called the Helmholtz free energy, or sometimes the Helmholtz function. By differ-entiation, we get
dA = dU − T dS − S dT

P1: SFK Trim: 247mm × 174mm Top: 14.586mm Gutter: 23.198mm
CUUK1808-07 CUUK1808/Roussel 978 1 107 00678 2 October 29, 2011 13:37
7.2 Free energy functions 143
At constant temperature (dT = 0) this gives, after integration,
�A = �U − T �S
For a thermodynamically allowed process at constanttemperature and volume, �A < 0.
It should be emphasized that this derivation of the Helmholtz free energy makes itan accounting trick; we have turned questions about the entropy of the universe intoquestions about a state function of the system under special conditions (constant volumeand temperature).
Living organisms typically function under conditions that closely approximate constanttemperature and pressure, at least over time scales of a few hours. Under these conditions,q = �H (Equation 5.8) and Inequality (7.1) becomes
�G = �H − T �S ≤ 0 (7.2)
The state function G that satisfies this inequality under the stated conditions is the Gibbsfree energy
G = H − T S
Like the Helmholtz free energy, the Gibbs free energy provides us with an easy way todetermine the consequences of the Second Law for a special class of systems, namely thoseheld at constant temperature and pressure:
For a thermodynamically allowed process at constanttemperature and pressure, �G < 0.
Historically, the understanding that chemical reactions were driven by a balance ofenthalpic (heat) and entropic effects came late, with the work of Gibbs in fact. For a longtime, chemists believed that heat was the major driver of chemical reactions, i.e. that onlyexothermic reactions are thermodynamically allowed. This belief was sustained by the factthat most thermodynamically allowed reactions are in fact exothermic, the entropic termoften being relatively small. However, there are many examples of spontaneous endothermicchemical reactions, clear evidence that both heat and entropy are important in determiningwhat is and isn’t thermodynamically allowed.
Exercise group 7.2
(1) Calculate the change in Gibbs free energy of an ideal gas during an isothermal expansionfrom V1 to V2.Hint: The internal energy of an ideal gas only depends on its temperature.

P1: SFK Trim: 247mm × 174mm Top: 14.586mm Gutter: 23.198mm
CUUK1808-07 CUUK1808/Roussel 978 1 107 00678 2 October 29, 2011 13:37
144 Free Energy
7.3 Free energy as maximum work
Suppose that a system undergoes a thermodynamically allowed, isothermal process. Then,
dA = dU − T dS
We can evaluate dU along any path (since it’s a state function). Therefore
dU = dqrev + dwrev
From the definition of entropy, dqrev = T dS. Putting everything together, we get
dA = T dS + dwrev − T dS = dwrev
or, after integration,
�A = wrev
Since wrev ≤ w, a negative �A has a simple interpretation:
−�A is the maximum work that can be doneby an isothermal process.
We can apply a similar treatment to the Gibbs free energy:
dG = dH − T dS − S dT
but since
dH = dU + p dV + V dp
and using the expression for dU derived above, we get
dG = T dS + dwrev + p dV + V dp − T dS − S dT = dwrev + p dV + V dp − S dT
At constant temperature and pressure, we can drop the terms in dp and dT :
dG = dwrev + p dV
Now we split the work into two terms, namely the pressure–volume work which, underreversible conditions, is −p dV , and the rest, which we will call dw′
rev. This gives
dG = dw′rev
which integrates to
�G = w′rev.
For isothermal, constant pressure processes,−�G is the maximum non-pressure–volume work.

P1: SFK Trim: 247mm × 174mm Top: 14.586mm Gutter: 23.198mm
CUUK1808-07 CUUK1808/Roussel 978 1 107 00678 2 October 29, 2011 13:37
7.4 Standard states 145
Exercise group 7.3
(1) Derive a relationship between the change in Helmholtz and Gibbs free energies atconstant temperature. Use your relationship to show how the expansion work and thetwo types of free energy are related for a process occurring at constant pressure.
7.4 Standard states and tabulated values of the state functions
We noted in Section 5.8 that the standard state for a gas was a pressure of one bar (100 000 Pa)and that the standard temperature was 25 ◦C. Since the precise definition of the standardstate will now become much more important, we return to this subject.
In defining a standard state for solutes, we need to decide how we will measure con-centrations. Molarities are convenient and many thermodynamic tables are based on thisconcentration scale. However, for high-accuracy work, molarities present a problem: Thevolume of the solution is temperature dependent, so the same solution can have differentmolarities at different temperatures. Mole fractions and molalities (moles of solute perkilogram of solvent) are better behaved. Nevertheless, we will express concentrations ofsolutes with molarities. For dilute solutions, any concentration measure will do. Further-more, extensive tables of data based on a molarity scale are available so that this is perhapsthe most convenient concentration scale for most purposes.
The standard states for each possible state of matter are:
Solids: pure solid held at the standard temperature and pressure.Liquids: pure liquid held at the standard temperature and pressure.Gases: held at the standard temperature and pressure, and ideally behaving.Solutes: in a solution held at the standard temperature and pressure, at a concentration
of 1 mol L−1 (or 1 mol kg−1 for the molal standard), and ideally behaving.
The condition that a gas or solute be “ideally behaving” is imposed in order to assist inreproducibility of tabulated thermodynamic data. In practice, it means that dilute gasesand solutions are to be used for establishing thermodynamic properties. What preciselyis meant by “dilute” may vary from one gas to another or from one solute to another. Ingeneral, this requirement conflicts with the concentration and pressure specifications, whichimplies that tabulated thermodynamic data will normally be obtained by extrapolationfrom experimental data. For now, our working assumption will be that all substancesbehave ideally in the concentration and pressure ranges considered. We will study non-ideal behavior in Chapter 9.
The standard pressure was changed just a few decades ago from 1 atm to 1 bar. Youwill therefore still find many tables of thermodynamics data based on the atmosphere. Thedifference between a bar and an atmosphere is small, so this makes only a small, but notnegligible, difference to standard free energy data. Just be aware of this minor historicalhiccup, and see the suggested reading on page 154 for further information.

P1: SFK Trim: 247mm × 174mm Top: 14.586mm Gutter: 23.198mm
CUUK1808-07 CUUK1808/Roussel 978 1 107 00678 2 October 29, 2011 13:37
146 Free Energy
One of the side effects of our definition of solute standard states is that it producessolutions with very odd acid–base concentrations; the concentrations of both hydrogenand hydroxide ions is 1 M, but we know that neutralization would quickly take place insuch a solution. This isn’t a problem since the standard state is an abstraction intended togive us common conditions for data presentation. More seriously, it requires us to knowthe protonation states of all acids and bases, since each ion is treated individually as anentity whose standard concentration is 1 mol L−1. Biochemists, who don’t always haveall the necessary acid and base dissociation constants to sort out exactly what ions arein their solutions and at what concentrations, therefore generally modify their standardstate in the following manner: The standard state for all normal solutes is a 1 mol L−1
solution; in the standard state, the pH is 7 (which fixes the hydrogen and hydroxide ionconcentrations as well as the ratios of acids to their conjugate bases). Only the totalconcentration of any given ion is considered, irrespective of its protonation state. Forexample, the biochemists’ standard state for the phosphate ion is a pH 7 solution witha total phosphate concentration ([H3PO4] + [H2PO−
4 ] + [HPO2−4 ] + [PO3−
4 ]) of 1 mol L−1
(in the molar standard state convention, which is almost universally used in biochemistry).To distinguish the two quantities, standard free energies evaluated in the normal conventionare denoted G◦ while biochemists’ standard free energies are denoted G◦′.
The definition of the biochemists’ standard state has some interesting side-effects forbalancing reactions; since we don’t know the protonation states of the acids (only that theappropriate mixture is present for the pH), biochemists are often deliberately vague aboutwhich protonation state is involved in a reaction, and the reactions may sometimes appearnot to be balanced with respect to hydrogen ions. For example, they will write Pi for whatthey call “inorganic phosphate” rather than write one of PO3−
4 , HPO2−4 , etc. Again, the
idea is that the reaction occurs in a pH-appropriate mixture of phosphate species, so theirthermodynamic data averages over this mixture rather than giving us values for the reactioninvolving a specific ion.
Some tables of biochemical standard data define the reaction conditions further. Tech-nically, the chemists’ standard state and the simple biochemists’ standard state describedabove both refer to an infinitely dilute solution containing no other solutes. However,biomolecules often function only in solutions with a high ionic strength (high concentra-tions of charged solutes). Just as is the case for pH, some biochemical standard data are givenat an ionic strength corresponding to a physiologically realistic situation. Magnesium ionsare of particular importance to the function of a number of biomolecules. Some biochemicalstandard data accordingly also refer to a particular, near-physiological magnesium concen-tration, commonly pMg = 3, i.e. [Mg2+] = 10−3 mol L−1. The only way to tell for sure whatconditions the data refer to is to look at the caption of the table from which they were taken.
There is one additional thing to look out for in tables. The free energy, like the enthalpy,needs to be referred to some common zero, and precisely the same solution is adopted hereas for enthalpy: �f G◦, the standard free energy of formation from the elements (and thehydrogen ion, for ionic species) is tabulated.

P1: SFK Trim: 247mm × 174mm Top: 14.586mm Gutter: 23.198mm
CUUK1808-07 CUUK1808/Roussel 978 1 107 00678 2 October 29, 2011 13:37
7.4 Standard states 147
Example 7.1 Standard free energy change from tables Suppose that we want to computethe change in the Gibbs free energy for the reaction
C6H12O6(aq) + 6O2(aq) → 6CO2(aq) + 6H2O(l)
under standard conditions. This is just
�rG◦ = 6�f G◦(CO2, aq) + 6�f G◦(H2O, l)
− [�f G◦(C6H12O6, aq) + 6�f G◦(O2, aq)]
= 6(−386.05) + 6(−237.140) − [(−914.25) + 6(16.35)] kJ mol−1
= −2922.99 kJ mol−1
The negative sign tells us that this reaction would be thermodynamically allowed under stan-dard conditions (1 mol L−1 glucose, 1 mol L−1 dissolved oxygen and 1 mol L−1 dissolvedcarbon dioxide in pure water, an unrealizable state). Also, under standard conditions, wecan obtain up to 2923 kJ mol−1 of non-pV work from this reaction. This could be musclework for instance: The change in volume of a working muscle is minimal so essentially allthe work can be used to lift weights.
Example 7.2 Entropies from enthalpies and free energies Given a table of standardenthalpies and free energies of formation, we can compute the standard entropy changeduring a reaction. For the oxidation of glucose in solution (from the above example),�rH
◦ = −2858.94 kJ mol−1. Since �rG◦ = �rH
◦ − T �rS◦,
�rS◦ = (�rH
◦ − �rG◦) /T
= −2858.94 − (−2922.99) kJ mol−1
298.15 K= 214.8 J K−1mol−1
We can then infer absolute entropies if we know the entropies of all but one of the reactantsor products. Using the data from Appendix A.2 for instance, we see that we have allthe entropies, except for the entropy of CO2(aq). We can calculate the latter quantity asfollows:
�rS◦ = 6S◦(CO2, aq) + 6S◦(H2O, l) − [S◦(C6H12O6, aq) + 6S◦(O2, aq)
]∴ S◦(CO2, aq) = 1
6
[�rS
◦ − 6S◦(H2O, l) + S◦(C6H12O6, aq) + 6S◦(O2, aq)]
= 1
6
[214.8 − 6(69.95) + 264.01 + 6(110.88) J K−1mol−1]
= 120.7 J K−1mol−1

P1: SFK Trim: 247mm × 174mm Top: 14.586mm Gutter: 23.198mm
CUUK1808-07 CUUK1808/Roussel 978 1 107 00678 2 October 29, 2011 13:37
148 Free Energy
Exercise group 7.4
(1) Is the combustion of ethanol thermodynamically allowed under standard conditions?(2) (a) What is the standard entropy of vaporization of water at 298 K?
(b) Calculate the absolute entropy of water vapor under standard conditions.(3) What is the standard entropy change during the reaction
CO(g) + 1
2O2(g) → CO2(g)
at 700 K?(4) Differences in free energies for reactions are fixed by experimental data, but our decision
to assign the free energies of formation of certain substances to be zero is purelyarbitrary. Suppose that we had decided instead that the free energies of formation ofthe elements and of the aqueous hydrogen ion should each be 13 kJ mol−1. What wouldthe free energy of formation of the hydroxide ion then have to be?
7.5 Activity: expressing the dependence of Gibbs free energy on concentration
Suppose that we have a table of standard Gibbs free energies of formation but that we wantthe free energy of formation of a substance at a different pressure or concentration thanstandard. We can easily deal with one case, namely that of ideal gases, and will treat theothers by analogy.
Consider this two-step process:⎧⎨⎩
elementsin their
standard states
⎫⎬⎭ 1−→
⎧⎨⎩
Gaseous compoundin its
standard state
⎫⎬⎭ 2−→
⎧⎨⎩
Gaseous compoundat standard temperature
and pressure p
⎫⎬⎭
�Gm = �(1)Gm + �(2)Gm for this overall process would be the molar free energy offormation of the compound at pressure p from elements in their standard states. Let us callthis quantity �f Gm. (Note the absence of the superscripted naught.) �(1)Gm is just thestandard free energy of formation of the compound, �f G◦
m. �(2)Gm is the change in freeenergy when we adjust the pressure of the compound isothermally from p◦ to p.
To calculate �(2)Gm, we need to figure out how the free energy depends on p. Recall
G = H − T S.
Therefore
dG = dH − T dS − S dT
Also,
H = U + pV

P1: SFK Trim: 247mm × 174mm Top: 14.586mm Gutter: 23.198mm
CUUK1808-07 CUUK1808/Roussel 978 1 107 00678 2 October 29, 2011 13:37
7.5 Activity and Gibbs free energy 149
so that
dH = dU + p dV + V dp
By definition,
dU = dq + dw
If we take a reversible path and only pressure-volume work is possible,
dU = T dS − p dV
We now substitute this expression for dU into dH , and dH into dG to obtain
dG = V dp − S dT (7.3)
Equation (7.3) is a very important equation: it tells us how the Gibbs free energy dependson p and T . It is very general, and can be applied to any system.
For an isothermal process, dG = V dp. We can calculate �(2)Gm directly from thisequation:
�(2)Gm =∫ p
p◦dGm =
∫ p
p◦Vm dp = RT
∫ p
p◦
dp
p= RT ln
p
p◦
In this derivation, we used the ideal gas law in the form pVm = RT to eliminate Vm.We can now put the pieces together. The free energy of formation of an ideal gaseous
compound at pressure p is
�f Gm = �f G◦m + RT ln
p
p◦ (7.4)
The fraction p/p◦ measures how far from the standard state the gas is. We call this quantitythe activity a. When a gas is in the standard state, a = 1 and the logarithm in Equation (7.4)is zero. If a �= 1, the gas is out of the standard state, and we have the logarithmic correctionto the free energy of formation shown above. By analogy, for any substance, we write
�f Gm = �f G◦m + RT ln a (7.5)
The activity is a dimensionless quantity that gives the extent of the deviation from thestandard state.
For ideally behaving substances, the activity is defined as follows:
Solids: a = 1.Liquids: a = X, the mole fraction. The mole fraction is the number of moles of a
particular substance (in this case, a liquid, often the solvent) divided by the totalnumber of moles of all species in a system.
Gases: a = p/p◦ where p◦ is the standard pressure.Solutes: a = c/c◦ where c◦ is the standard concentration for that species. In the chemists’
standard state, this would be 1 mol L−1 if our standard state is defined on the molar-ity scale, and 1 mol kg−1 for the molality-scale standard state. In the biochemists’

P1: SFK Trim: 247mm × 174mm Top: 14.586mm Gutter: 23.198mm
CUUK1808-07 CUUK1808/Roussel 978 1 107 00678 2 October 29, 2011 13:37
150 Free Energy
standard state, the standard concentration would be 1 mol L−1 for most substances(with species differing only in their protonation state treated as one substance), but10−7 mol L−1 for hydrogen and hydroxide ions.
We have already seen why p/p◦ is a sensible definition for the activity of an ideal gas.Solids don’t have a property corresponding to concentration; they are either there or theyare not, which is why the activity of a pure solid is just 1. We will see later why the otherchoices are correct for dilute solutions.
For non-ideal substances, Equation (7.5) will remain valid, but we will have to modifyour definitions of the activities. This important topic will be discussed in Chapter 9.
To get the dependence of the free energy change during a reaction on the activities ofthe participating species, we simply add the free energies of formation of the products andsubtract the free energies of formation of reactants in the usual way. Using the logarithmmanipulation rules, we get, for any reaction,
�rGm = �rG◦m + RT ln
⎛⎜⎜⎜⎝∏
i ∈ products
ai
∏j ∈ reactants
aj
⎞⎟⎟⎟⎠ (7.6)
(The symbol∏
represents a product, in the same way that∑
represents a sum of terms.Thus,
∏Ni=1 xi = x1x2x3 . . . xN .) The quantity following the logarithm is the reaction
quotient, usually denoted Q:
�rGm = �rG◦m + RT ln Q (7.7)
Example 7.3 Calculating the free energy of reaction under non-standard condi-tions In Example 7.1 we computed the standard change in Gibbs free energy for thereaction
C6H12O6(aq) + 6O2(aq) → 6CO2(aq) + 6H2O(l)
Now suppose that we want to calculate the actual change in free energy when the con-centrations of glucose, oxygen and carbon dioxide are, respectively, 0.005, 0.001 and0.03 mol L−1 at 298 K. For this reaction,
Q = (aCO2 )6(XH2O)6
(aC6H12O6 )(aO2 )6
The activities of the solutes are easy to calculate. For example, aCO2 = [CO2]/c◦ =(0.03 mol L−1)/(1 mol L−1) = 0.03. We need the mole fraction of water to compute Q. Themole density of water at 298 K is 55.33 mol L−1. If there are no other solutes than those listed

P1: SFK Trim: 247mm × 174mm Top: 14.586mm Gutter: 23.198mm
CUUK1808-07 CUUK1808/Roussel 978 1 107 00678 2 October 29, 2011 13:37
7.5 Activity and Gibbs free energy 151
above, the total number of moles of all species in one liter of water is [H2O] + [C6H12O6] +[O2] + [CO2] = 55.33 + 0.005 + 0.001 + 0.03 mol L−1 = 55.37 mol L−1. Thus,
XH2O = 55.33 mol L−1
55.37 mol L−1 = 0.999
�rGm = �rG◦m + RT ln Q
= −2922.99 kJ mol−1
+ (8.314 472 × 10−3 kJ K−1mol−1)(298 K) ln(0.03)6(0.999)6
(0.005)(0.001)6
= −2859.31 kJ mol−1
Since the mole fraction of the solvent is usually very close to 1, we generally leave it out. Ifwe had done this here, we would have obtained −2859.30 kJ mol−1, a negligible differencefrom the value computed above.
Exercise group 7.5
(1) Consider the following reaction occurring in aqueous solution:
H2O(l) + A(aq) → P(aq).
Suppose that this reaction is not allowed under some particular conditions, but only just.In other words, suppose that the free energy change is just slightly positive. Holdingall other conditions constant, we add an inert salt to the solution. Can this make thereaction thermodynamically allowed? Why or why not?
(2) Is the reaction
2HgS(s) + Cl2(g) → Hg2Cl2(s) + 2S(s)
thermodynamically allowed if the pressure of chlorine gas is 2 bar and the temperatureis 25 ◦C?
(3) 20 mL of a 0.04 mol/L solution of lead (II) nitrate is mixed with 15 mL of a 0.003 mol/Lsolution of ammonium sulfate at 25 ◦C. Is a lead (II) sulfate precipitate formed?
(4) The overall reaction in an alkaline battery is
Zn(s) + 2MnO2(s) → ZnO(s) + Mn2O3(s).
(a) Calculate the maximum electrical work that an alkaline battery can perform perkilogram of zinc at 25 ◦C.
(b) If an alkaline battery initially contains 10 g of zinc and 15 g of manganese(IV) oxide, what is the maximum total electrical work that can be produced at25 ◦C?
(5) A fuel cell is a device that generates electricity from an oxidation reaction at constanttemperature and pressure (i.e. the net reaction is combustion but no flame or explosionis involved; this is similar to biological oxidations). Calculate the maximum electrical

P1: SFK Trim: 247mm × 174mm Top: 14.586mm Gutter: 23.198mm
CUUK1808-07 CUUK1808/Roussel 978 1 107 00678 2 October 29, 2011 13:37
152 Free Energy
work that can be obtained from the oxidation of 1 kg of hydrogen by gaseous oxygenin a hydrogen fuel cell under the following conditions: pH2 = 1 bar, pO2 = 0.2 bar andpure liquid water is produced at 298 K.
7.6 Adjusting �G to different temperatures
If we want to calculate �rG at a non-standard temperature, we typically just apply Equation(7.2), i.e. �rG = �rH − T �rS. We can use the methods described in previous chapters tofirst adjust �rH and �rS to the desired temperature. More commonly, however, we simplyassume that �rH and �rS are temperature independent. We can treat these two quantitiesas being independent of temperature over a significant range of temperatures, because theyboth depend on �Cp,m, the difference in heat capacities of reactants and products, whichis typically small, and certainly much smaller than �rS
◦ for most reactions. We are alsohelped by the fact that �rH
◦ and �rS◦ change in the same direction (either both increase
or both decrease, depending on the sign of �Cp,m) as we change the temperature, so thenegative sign in Equation (7.2) tends to result in some cancellation of the error we introduceby neglecting the temperature variation of these quantities.
Example 7.4 ATP hydrolysis at 37 ◦C Muscle contraction is powered by the hydrolysisof ATP:
ATP + H2O → ADP + Pi
where Pi represents any phosphate (PO3−4 , HPO2−
4 , etc.), as discussed on page 146. Amuscle is an isothermal free energy machine. It does not produce work from heat, but byharnessing the free energy change of a chemical reaction.
The standard Gibbs free energy change for this hydrolysis in a physiological biochemicalstandard state1 is �rG
◦′ = −32.49 kJ mol−1, and the standard enthalpy change is �rH◦′ =
−30.88 kJ mol−1. These data are at 298.15 K, but a muscle works at 37 ◦C, i.e. 310 K. Fromthe basic definition of G, we have
�rS◦′ = �rH
◦′ − �rG◦′
298.15 K= 5.40 J K−1mol−1
Neither �rH◦′ nor �rS
◦′ vary dramatically with temperature so their values at 310 K areapproximately the same as their values at 298 K. Thus
�rG◦310
′ = −30.88 kJ mol−1 − (310 K)(5.40 × 10⁻³ kJ K−1mol−1) = −32.55 kJ mol−1.
Note that this value isn’t terribly different from the value at 25 ◦C. Of course, 37 ◦C isn’tvery far removed from 25 ◦C, either.
The approximate physiological concentrations of phosphate, ATP and ADP are, respec-tively, 2 mmol L−1, 4 mmol L−1 and 0.3 mmol L−1.2 Thus, under physiological conditions,
1 T = 298.15 K, pH = 7, pMg = 3, I = 0.25 mol L−1. Data from Alberty and Goldberg, Biochemistry 31, 10610 (1992).2 Bernard L. Oser (Ed.), Hawk’s Physiological Chemistry, 14th ed.; McGraw-Hill: New York, 1965, pp. 217–218.

P1: SFK Trim: 247mm × 174mm Top: 14.586mm Gutter: 23.198mm
CUUK1808-07 CUUK1808/Roussel 978 1 107 00678 2 October 29, 2011 13:37
7.6 Adjusting �G to different temperatures 153
the change in free energy during hydrolysis is
�rGm = �rG◦310
′ + RT ln Q
= −32.55 kJ mol−1
+ (8.314 472 × 10−3 kJ K−1mol−1)(310 K) ln
((0.3 × 10⁻³)(2 × 10⁻³)
4 × 10⁻³
)= −55.25 kJ mol−1
This is the maximum amount of non-pressure–volume work available. Of course, musclesmainly do non-pV work, since their volume is relatively constant, being made primarilyof incompressible components. Therefore, this is the maximum work that can be done bymuscle, per mole of ATP hydrolyzed.
Note that in the last calculation of the example, we must use a standard free energy ofreaction adjusted to the temperature of the calculation. We can’t use �rG
◦ (or �rG◦′) from
25 ◦C and a different T in this equation.
Exercise group 7.6
(1) Calculate the maximum work available from the oxidation of glucose at 37 ◦C andsolute concentrations of 0.005 mol L−1 of glucose, 0.001 mol L−1 of dissolved oxygenand 0.03 mol L−1 of dissolved carbon dioxide. Compare your answer to the calculationof Example 7.3.
(2) (a) Based on thermodynamic considerations alone, can liquid boron trichloride bemade by reacting diborane (B2H6(g)) with chlorine gas if the pressures of the tworeactants are both 0.5 bar and the pressure of hydrogen gas is 0.03 bar at 25 ◦C?
(b) What if the reaction was run at −10 ◦C instead of 25 ◦C? Assume that �rH◦m and
�rS◦m are independent of temperature.
(3) Creatine phosphate is an alternative energy storage compound found in many cells.Just as in the case of ATP, considerable free energy can be released by the hydrolysisof creatine phosphate:
creatine phosphate + H2O → creatine + Pi
with a �rG◦′ of −37.7 kJ mol−1 at 310 K. Suppose that, in a certain muscle with a
volume of 1 L, the concentrations of creatine and creatine phosphate are both approx-imately 1 mmol L−1 and that the concentration of phosphate is 2 mmol L−1. What isthe maximum work that can be done by such a muscle if all the concentrations areheld constant by homeostatic mechanisms when the entire store of creatine phosphateis turned over once? How far would this amount of work lift a 1 kg mass?

P1: SFK Trim: 247mm × 174mm Top: 14.586mm Gutter: 23.198mm
CUUK1808-07 CUUK1808/Roussel 978 1 107 00678 2 October 29, 2011 13:37
154 Free Energy
Key ideas and equations
� Reversible processes are maximally efficient.� A = U − T S is the Helmholtz free energy.◦ �A < 0 for a thermodynamically allowed process at constant T and V .◦ −�A is the maximum work that can be done by a machine operating isothermally.
� G = H − T S is the Gibbs free energy.◦ �G < 0 for a thermodynamically allowed process at constant T and p.◦ −�G is the maximum non-pV work that can be done by a machine operating isother-
mally and at constant pressure.� Definition of standard state (1 bar, 25 ◦C, solutes at 1 mol L−1, everything behaving
ideally)◦ Biochemists’ standard state: lump together species that differ by protons, pH = 7
� �rGm = �rG◦m + RT ln Q
� Activities of ideal substances:
Phase a
Solid 1Liquid X
Gas p/p◦
Solute c/c◦
� To adjust �G to different temperatures, it is often adequate to treat �H and �S as beingindependent of temperature.
Suggested reading
For detailed explanations of the biochemists’ standard state, see
Robert A. Alberty, Biochim. Biophys. Acta 1207, 1 (1994).Robert A. Alberty, Biochem. Ed. 28, 12 (2000).
This paper includes a large table of thermodynamic data in the biochemists’ standardstate.
If you ever need to convert data from the old standard pressure of 1 atm to the newstandard pressure of 1 atm, see the following paper:
Richard S. Treptow, J. Chem. Ed. 76, 212 (1999).
Because the formation reactions for most compounds involve some gaseous elements, thisconversion can affect free energies of formation for compounds in any state of matter.
Review exercise group 7.7
(1) Many reactions involve water as a reactant or product. When treating such reactions,we generally ignore the activity of the water, i.e. set its value to unity. Why is it oftenreasonable to do this?

P1: SFK Trim: 247mm × 174mm Top: 14.586mm Gutter: 23.198mm
CUUK1808-07 CUUK1808/Roussel 978 1 107 00678 2 October 29, 2011 13:37
7.6 Adjusting �G to different temperatures 155
(2) What is wrong with the following statement?
�G gives the maximum work that a system can perform at constant temperature and pressure.
(3) For processes involving only solids or liquids, what is the relationship between �G
and �A?(4) A common dry cell (“battery”), also known as a Leclanche cell, has the following
overall reaction:
Zn(s) + 2NH+4(aq) + 2MnO2(s) → Zn2+
(aq) + 2NH3(aq) + H2O(l) + Mn2O3(s)
Suppose that a dry cell operating at 25 ◦C starts off with the following concentra-tions: [NH+
4 ] = 1.5 mol L−1, [Zn2+] = 0.03 mol L−1 and [NH3(aq)] = 0.12 mol L−1.The solid reactants zinc and manganese (IV) oxide are present in excess. The waterexists in a concentrated paste rather than as a free solution (hence the name “drycell”). For the sake of argument, assume that aH2O is constant and has the value 0.5.Calculate the maximum work that can be performed by this cell per mole of zincconsumed:(a) initially, and(b) when half the ammonium ion available has reacted.
(5) While ATP is the compound used to directly power most metabolic processes, it isnot a very good long-term energy storage compound because of its low stability. ATPis generally made from ADP by harnessing the energy obtained when sugars areoxidized. A muscle can therefore be considered to be powered, indirectly at least, bythe oxidation of sugars. A teaspoon of sucrose (ordinary table sugar) weighs about4 g. To what maximum height would the oxidation of a teaspoon of sugar allow anorganism working at 298 K to raise a 1 kg mass under standard conditions? The molarmass of sucrose is 342.299 g mol−1. Note that when this process occurs in a cell,aqueous oxygen and carbon dioxide are involved instead of the gaseous molecules.
(6) CODATA, the Committee on Data for Science and Technology, produces a table thatgives generally accepted values of thermodynamic properties for a broad range ofsubstances. Their table is a little different from the one in most textbooks. Here is anexcerpt from that table, with notations adjusted to match the ones used in this book:
Substance State�f H ◦ (298.15 K)
kJ mol−1
S◦m (298.15 K)
J K−1mol−1
H ◦m(298.15 K) − H ◦
m(0 K)
kJ mol−1
Al s 0 28.30 4.540Al3+ aq −538.4 −325H+ aq 0 0H2 g 0 130.680 8.468
(a) Calculate the standard free energy of formation of Al3+(aq).
(b) To which thermodynamic property of a substance is the last column of the tablerelated? Give the precise mathematical relationship.

P1: SFK Trim: 247mm × 174mm Top: 14.586mm Gutter: 23.198mm
CUUK1808-07 CUUK1808/Roussel 978 1 107 00678 2 October 29, 2011 13:37
156 Free Energy
(7) Industrially, methanol (CH3OH) is made by reaction of carbon monoxide with hydro-gen. The reaction is carried out at high temperatures in the presence of a catalyst.Suppose, however, that you wanted to carry out the reaction at 25 ◦C, the pressures ofCO and of H2 both being held constant at 0.5 bar. Is there any thermodynamic reasonwhy this could not be done?Note: Methanol boils at 65 ◦C.
(8) The equation
�rGm = �rG◦m + RT ln Q
is used to compute the Gibbs free energy of reaction under particular conditions. Theenthalpy change depends extremely weakly on the reaction conditions. Use this factto derive an equation relating the entropy change to the standard entropy change andto ln Q.
(9) While ATP is the principal short-term energy storage compound in living organisms,many other compounds are used for this purpose. Glucose-6-phosphate (G6P) is anintermediate in glucose metabolism, but it can be and sometimes is used as a sourceof work. Its hydrolysis reaction is
G6P + H2O → glucose + phosphate
For this reaction, �rG◦m
′ = −16.7 kJ mol−1 and �rH◦m
′ = −35.1 kJ mol−1 at 298 K.Suppose that the concentration of G6P in an organelle at 37 ◦C is 50 μmol L−1, theconcentration of glucose is 20 μmol L−1 and the total concentration of phosphatesis 2 mmol L−1. What is the maximum work available from this reaction per mole ofG6P?
(10) The following reactions have been used in voltaic cells (batteries):
2Na(s) + 5S(s) → Na2S5(s) �rG◦m = −401 kJ mol−1
VH(s) + NiOOH(s) → V(s) + Ni(OH)2(s) �rG◦m = −130 kJ mol−1
(a) What is the standard free energy of formation of Na2S5?(b) Battery designers don’t generally care about the amount of electrical work per
mole. What they really care about is the work per unit mass, heavy batterieshaving a number of obvious disadvantages. Assuming a stoichiometric mixtureof the reactants in each case, batteries based on which of the above reactions willstore the most energy for a given mass?
(c) The reactions shown above involve solid reactants and products only. This makesthe calculations required for the last question much more straightforward thanthey would otherwise be. Why? What additional complication(s) would arise ifsome of the reactants or products were solutes?
P1: SFK Trim: 247mm × 174mm Top: 14.586mm Gutter: 23.198mm
CUUK1808-08 CUUK1808/Roussel 978 1 107 00678 2 October 29, 2011 13:9
8
Chemical equilibrium and coupled reactions
Life is a far-from-equilibrium phenomenon, so one might reasonably question the utilityof equilibrium theory to biochemists. There are a few reasons why you should care aboutequilibrium. One is that we still do a lot of experiments in test tubes, and under thoseconditions, systems eventually go to equilibrium. Another reason is that some reactions,like acid–base reactions, equilibrate much faster than others, so they can be treated asbeing in equilibrium. There is another, more subtle reason: We saw earlier that reversibleprocesses, those in which the system is constantly in equilibrium, are the most efficientones possible. Equilibrium therefore sets a limit to the efficiency of chemical processes, anidea we will use when we discuss how one reaction can drive another forward.
8.1 What does �r Gm mean?
The molar free energy of reaction, �rGm, (as well as other � quantities in thermodynamics)is a funny quantity. We typically think of it as the difference in free energy between reactantsand products, since that’s how we calculate it. However, its meaning is a bit more subtlethan that. To make things specific, imagine that we have a reaction
reactants → P + some other products
in a system held at constant temperature and pressure. �rGm represents the change in freeenergy when we convert one molar equivalent of reactants to one mole of P under specifiedconditions (concentrations, pressures, etc.). In other words, the composition of the systemshould not change as our mole of P is made. However, if we carry out this conversion, we willchange the quantities of reactants and products, and thus the composition. There is a wayout of this apparent contradiction: Instead of making one mole of P, imagine that we convertsome very small fraction of the reactants to products. Let n be the number of moles of P atsome particular point in time. If we know the initial composition and the stoichiometry ofthe reaction, then we can calculate the number of moles of any component of the reactionif we know n. We can therefore think of G as a function of the one composition variablen. (This assumes there is only one reaction going on in our system. In general, we need
157

P1: SFK Trim: 247mm × 174mm Top: 14.586mm Gutter: 23.198mm
CUUK1808-08 CUUK1808/Roussel 978 1 107 00678 2 October 29, 2011 13:9
158 Equilibrium and coupled reactions
G
nn1 n2
Figure 8.1 Schematic showing how the free energy of a system, G, varies with the number of molesof a product, n. �rGm is the slope of the graph of G vs. n. This sketch shows two tangent lines at twodifferent values of n. At n = n1, the slope of the tangent is negative, so �rGm < 0, indicating thatthe reaction is thermodynamically allowed, i.e. that it will proceed to make more product (increasen) if kinetic factors don’t prevent it from proceeding. At n = n2, �rGm is positive, so the reversereaction, consuming products and decreasing n, is thermodynamically allowed.
as many variables as there are reactions.) Now suppose that, over some period of time, thereaction causes a change in n of �n, where �n is sufficiently small that it makes only anegligible difference to the overall composition of the system. We divide the change in thefree energy during this period of time, �rG, by the number of moles of P made, �n, to get�rGm:
�rGm = �rG
�n(8.1)
Since we converted only a very small fraction of the reactants to products, the reactionconditions didn’t change significantly during this operation. The quantities on the right ofthe equality are ordinary differences: �rG is the change in the total free energy of thesystem when �n moles of P were produced or, if you prefer, G(n + �n) − G(n). Now ifyou think back to your calculus course, you may recognize that if �n is small, then theright-hand side of Equation (8.1) is in fact a derivative of G with respect to n. In otherwords, the quantity we refer to as �rGm is actually
�rGm = dG(n)
dn
Figure 8.1 shows the relationship of G(n) and �rGm, which is actually the slope of thetangent line to G(n) at a particular n.

P1: SFK Trim: 247mm × 174mm Top: 14.586mm Gutter: 23.198mm
CUUK1808-08 CUUK1808/Roussel 978 1 107 00678 2 October 29, 2011 13:9
8.2 Free energy and equilibrium 159
8.2 Free energy and equilibrium
For thermodynamically allowed processes at constant pressure and temperature, �rGm <
0. This implies that the Gibbs free energy of a system held under these conditions willdecrease until it hits a minimum. Referring to Figure 8.1, we could start to the left of theequilibrium, where �rGm < 0, and move to increasing values of n (more product), untilwe hit the minimum of G, where �rGm = 0. If, on the other hand, the initial compositionwas such that we were to the right of the equilibrium, where �rGm > 0, then the reversereaction, consuming product, would be thermodynamically allowed, and the system wouldagain move toward the minimum in G. At the minimum, �rGm = 0, meaning that neitherthe forward nor the reverse process is thermodynamically favored. The system is then atequilibrium.
Equation (7.6) gives the dependence of �rGm on the reaction quotient Q. At equilibrium,�rGm = 0 so that
�rG◦m = −RT ln K (8.2)
or
K = exp(−�rG◦m/RT ) (8.3)
where K is the value of Q at equilibrium. Given that Q is a ratio of activities of productsand reactants, you will probably recognize K as the equilibrium constant which you haveencountered in previous chemistry courses.
There are a few things to note:
(1) The equilibrium constant is a ratio of activities. Activities are dimensionless, hence theequilibrium constant is dimensionless.
(2) �rG◦m depends on the standard state, so the value of the equilibrium constant also
depends on the standard state. This may seem a little strange because the standard stateis arbitrary. However, the equilibrium constant is constructed from activities whichthemselves depend on the standard state. The dependence of �rG
◦m and of the activities
on the standard state offset each other in such a way that any calculation of observablequantities from equilibrium relationships will yield identical results, regardless of thestandard state chosen, provided it is consistently used.
Example 8.1 Gas solubility For the process
O2(g) � O2(aq)
�rG◦m = �f G◦(aq) − �f G◦(g)
= 16.35 − 0 kJ mol−1 = 16.35 kJ mol−1

P1: SFK Trim: 247mm × 174mm Top: 14.586mm Gutter: 23.198mm
CUUK1808-08 CUUK1808/Roussel 978 1 107 00678 2 October 29, 2011 13:9
160 Equilibrium and coupled reactions
We can use this to compute the equilibrium constant for this process at 298 K:
K = exp(−�rG◦m/RT ) = exp
( −16.35 × 10³ J mol−1
(8.314 472 J K−1 mol−1)(298.15 K)
)= 1.37 × 10⁻³
The equilibrium constant for this process corresponds to the ratio
K = aaq/ag = [O2]/PO2
(give or take the standard concentration and standard pressure, both of which are 1 inappropriate units). This can be rearranged to the form
[O2] = KpO2
which is Henry’s law of gas solubility. Henry’s law is valid for dilute solutions. Note thatthe choice for the activity of a solute made on page 150 is required to make ideal solutiontheory consistent with Henry’s law. This is in fact why this choice was made.
The experimental value1 of the Henry’s law constant for oxygen is 1.26 × 10⁻³. Becauseof the exponential function that appears in Equation (8.3), small errors in the thermodynamicdata are amplified. The difference between the calculated and experimental equilibriumconstants is therefore not terribly disturbing. In fact, if we work backwards and calculate�f G◦(O2, aq) from the experimental Henry’s law constant, we get 16.55 kJ mol−1 which,considering the typical spread of values for measurements of this kind, is probably withinthe statistical uncertainty of this quantity.
The partial pressure of oxygen in air at sea level is about 21 kPa. The activity of oxygenwould be pO2/p
◦ = 21 kPa/100 kPa = 0.21. Using our calculated Henry’s law constant,we would calculate a dissolved oxygen concentration of
[O2] = (1.37 × 10⁻³)(0.21) = 2.9 × 10⁻⁴ mol L−1
at sea level.
Example 8.2 Solvent vapor pressure Suppose that we want to know the vapor pressureof a solution made by dissolving 0.2 mol of sodium chloride in 100 mL of water at 25 ◦C.Since sodium chloride is involatile, the vapor pressure of the solution is entirely due to theliquid–vapor equilibrium of water:
H2O(l) � H2O(g)
To determine the equilibrium constant for this process, we calculate �rG◦m:
�rG◦m = �f G◦
m(g) − �f G◦m(l)
= −228.582 − (−237.140) kJ mol−1 = 8.558 kJ mol−1
∴ K = exp
( −8.558 × 10³ J mol−1
(8.314 472 J K−1mol−1)(298.15 K)
)= 0.03167
.
1 J.C. Kotz and P. Treichel, Chemistry & Chemical Reactivity, 3rd edn; Harcourt Brace: Fort Worth, 1996; p. 664.

P1: SFK Trim: 247mm × 174mm Top: 14.586mm Gutter: 23.198mm
CUUK1808-08 CUUK1808/Roussel 978 1 107 00678 2 October 29, 2011 13:9
8.2 Free energy and equilibrium 161
The equilibrium constant for this process is K = ag/al = pH2O/(p◦XH2O), so we havepH2O = Kp◦XH2O, which is a form of Raoult’s law: for the pure solvent, XH2O = 1, so ifwe call the vapor pressure of the pure solvent p•
H2O, we get p•H2O = Kp◦. We can now use
this equation to eliminate K from our equation for the vapor pressure of the solution, andwe get
pH2O = p•H2OXH2O
which now looks like Raoult’s law as you may have seen it in your introductory chemistrycourse. Raoult’s law is known to be valid for dilute solutions. Again, it was necessary tochoose a = X for solvents on page 149 in order to make the dilute solution theory agreewith Raoult’s law.
We now need to calculate the mole fraction of water in this problem: the mole densityof water at 25 ◦C is 55.33 mol L−1 so the number of moles of water is
nH2O = (55.33 mol L−1)(0.100 L) = 5.53 mol
Since NaCl dissociates into its ions in solution,
XH2O = nH2O
nH2O + nNa+ + nCl−= 5.53
5.53 + 2(0.2)= 0.93
Thus
pH2O = (0.03167)(0.93) = 0.030 bar
Example 8.3 The solubility product Suppose that we want to calculate the solubilityproduct of silver sulfide at 25 ◦C. This is the equilibrium constant for the reaction
Ag2S(s) � 2Ag+(aq) + S2−
(aq)
All we have to do is calculate �rG◦m and then Ksp:
�rG◦m = 2�f G◦(Ag+, aq) + �f G◦(S2−, aq) − �f G◦(Ag2S)
= 2(77.11) + 79 − (−40.7) kJ mol−1 = 274 kJ mol−1
∴ Ksp = exp
( −274 × 103 J mol−1
(8.314 472 J K−1mol−1)(298.15 K)
)= 1.0 × 10−48
Example 8.4 Standard free energies of formation from solubility measurements Thesolubility of iron (III) hydroxide in water is 1.1 × 10⁻¹⁵ mol L−1 at 25 ◦C. If the standardfree energy of formation of Fe3+
(aq) is −4.6 kJ mol−1 and the free energy of formation of thehydroxide ion is −157.220 kJ mol−1, what is the standard free energy of formation of solidFe(OH)3?
First note that the solubility product is the equilibrium constant for the reaction
Fe(OH)3(s) � Fe3+(aq) + 3OH−
(aq)
We can use the solubility to compute the solubility product: at equilibrium, aFe3+ = 1.1 ×10⁻¹⁵. While it is tempting to say that aOH− = 3aFe3+ , we must consider the autoionization

P1: SFK Trim: 247mm × 174mm Top: 14.586mm Gutter: 23.198mm
CUUK1808-08 CUUK1808/Roussel 978 1 107 00678 2 October 29, 2011 13:9
162 Equilibrium and coupled reactions
of water which produces aOH− = 10−7 by itself. Since the amount of hydroxide generatedby the latter process is much, much greater than that generated by the dissociation of iron(III) hydroxide, we need not consider the simultaneous equilibria, the autoionization ofwater being by far the more important process. Therefore aOH− = 10−7,
Ksp = (aFe3+)(aOH−)3 = 1.1 × 10−36
The free energy change for the reaction is
�rG◦m = −RT ln Ksp = −(8.314 472 J K−1mol−1)(298.15 K) ln(1.1 × 10−36)
= 205 kJ mol−1
However
�rG◦m = �f G◦(Fe3+, aq) + 3�f G◦(OH−, aq) − �f G◦(Fe(OH)3)
∴ �f G◦(Fe(OH)3) = �f G◦(Fe3+, aq) + 3�f G◦(OH−, aq) − �rG◦m
= −4.6 + 3(−157.220) − 205 kJ mol−1 = −682 kJ mol−1.
Equilibrium problems often involve acids and bases. You will already be familiar withthe pH scale, but you were likely told that pH = − log10[H+]. This is wrong. First ofall, taking the logarithm of a dimensioned quantity ([H+] has units of mol L−1) is notmathematically sensible. [What are the units of log(mol L−1)?] Secondly, pH is usuallymeasured electrochemically (Chapter 10). Electrochemical measurements, as we will see,are equivalent to measuring the change in free energy, and the latter quantity is related toactivities, and not directly to concentrations. The correct definition of pH is
pH = − log10 aH+
Example 8.5 Acid dissociation constants are also equilibrium constants. For instance,for acetic acid, Ka is the equilibrium constant for the reaction
CH3COOH(aq) � CH3COO−(aq) + H+
(aq)
�rG◦m = �f G◦(CH3COO−, aq) − �f G◦(CH3COOH, aq)
= −369.31 − (−396.39) kJ mol−1 = 27.08 kJ mol−1
∴ Ka = exp
( −27.08 × 10³ J/mol
(8.314 472 J K−1mol−1)(298.15 K)
)= 1.80 × 10⁻⁵.
Given the dissociation constant, we can compute the pH of a solution of known formalconcentration. If for instance we have a 0.20 mol L−1 solution of acetic acid in water, weare saying that
aCH3COOH + aCH3COO− = 0.20
It is often the case in these problems that the autoionization of water is a negligible sourceof protons. If we make this assumption, which we can check later, the number of moles of

P1: SFK Trim: 247mm × 174mm Top: 14.586mm Gutter: 23.198mm
CUUK1808-08 CUUK1808/Roussel 978 1 107 00678 2 October 29, 2011 13:9
8.2 Free energy and equilibrium 163
protons in solution will be equal to the number of moles of CH3COO− so
Ka = 1.80 × 10−5 = a2H+
0.20 − aH+
After some rearrangement, this gives the quadratic equation
a2H+ + 1.80 × 10⁻⁵aH+ − 3.60 × 10−6 = 0
The physically reasonable solution of this quadratic equation is
aH+ = 1.89 × 10⁻³
Note that aH+ � 10−7, which confirms that we were justified in ignoring the autoionizationof water. The pH is therefore
pH = − log10 aH+ = 2.72
Exercise group 8.1
(1) Calculate the equilibrium constant (Kw) at 298.15 K for the autoionization of waterH2O → H+ + OH−.
(2) Predict the solubility of nickel (II) chloride in water at 25 ◦C. Comment on the magni-tude of the value computed.
(3) Calculate the pH of a solution with a formal concentration of 2 × 10⁻⁷ mol L−1 of thestrong acid HI at 25 ◦C.
(4) A sample of 25 g of sodium acetate (CH3COONa) is dissolved in 1 L of water at 25 ◦C.What is the pH of the solution? The base ionization constant (Kb) of acetate at thistemperature is 5.6 × 10⁻¹⁰.
(5) The ozone layer is approximately 20 km above sea level. At this altitude, the meantemperature is 210 K and the partial pressure of oxygen is 1.2 kPa.(a) Accurately calculate �rG
◦m for the reaction
2O3(g) → 3O2(g)
at 210 K, taking into account the temperature dependence of �rH◦m and �rS
◦m.
(b) Calculate �rG◦m for the above reaction at 210 K under the assumption that neither
�rH◦ nor �rS
◦ vary significantly with temperature. Is the result significantlydifferent?
(c) Calculate the equilibrium pressure of ozone under the conditions prevailing at analtitude of 20 km.
(d) The above calculation gives a value that is several orders of magnitude smallerthan the actual partial pressure of ozone at 20 km. Why?

P1: SFK Trim: 247mm × 174mm Top: 14.586mm Gutter: 23.198mm
CUUK1808-08 CUUK1808/Roussel 978 1 107 00678 2 October 29, 2011 13:9
164 Equilibrium and coupled reactions
8.3 Catalysts and equilibrium
A catalyst is a substance that speeds up a chemical reaction without being consumed by it.Enzymes are biological molecules, usually proteins, with catalytic activity. In this section,we will focus on enzymes, but what we will say applies equally to other types of catalysts.Indeed, the mechanism we will study is essentially the same one used to understand catalysisat surfaces, give or take some differences of interpretation of the symbols.
The simplest enzyme reaction mechanism is the Michaelis–Menten mechanism:
E + S1� C
2� E + P
where E is the enzyme, S is the substrate, C is the enzyme–substrate complex and P is theproduct.
Let’s analyze this mechanism stepwise. Under arbitrary conditions,
�r(1)Gm = �r(1)G◦m + RT ln
aC
aEaS
with
�r(1)G◦m = �f G◦(C) − �f G◦(E) − �f G◦(S)
for the first step, and
�r(2)Gm = �r(2)G◦m + RT ln
aEaP
aC
with
�r(2)G◦m = �f G◦(E) + �f G◦(P) − �f G◦(C)
for the second. The total free energy change when one equivalent of S is converted toone equivalent of P by the enzyme is the sum of the free energy changes of the twosteps:
�rGm = �r(1)Gm + �r(2)Gm = �f G◦(P) − �f G◦(S) + RT lnaP
aS
Note that the thermodynamic properties of E and C drop out. Also, since �f G◦(P) −�f G◦(S) is �rG
◦m for the reaction S → P, the equation for �rGm given above is just the
free energy change for the overall reaction. Perhaps we shouldn’t be surprised; since G isa state function, the path taken doesn’t matter. The net change in free energy must be thesame whether the enzyme was involved or not.
We conclude the following:
Catalysts do not affect the equilibrium ratio of products to reactants.
In speeding up a reaction, a catalyst must speed up both directions by the same factor.

P1: SFK Trim: 247mm × 174mm Top: 14.586mm Gutter: 23.198mm
CUUK1808-08 CUUK1808/Roussel 978 1 107 00678 2 October 29, 2011 13:9
8.4 Coupled reactions 165
Exercise group 8.2
(1) What is the equilibrium ratio of α- to β-lactose in the enzyme-catalyzed reaction
enzyme + β-lactose � complex � enzyme + α-lactose
at 25 ◦C?
8.4 Coupled reactions
Living organisms sometimes find it necessary to alter the position of equilibrium. Forinstance, in order to maintain reasonable internal supplies of nutrients, they must pumpthem in from the outside against the normal tendency of diffusion to equalize concentrations.If enzymes can’t accomplish these tasks, how are they achieved?
Suppose that a cell (or a chemical engineer) needs to make a particular compound, C,using the reaction
A + B1� C + M
but that under the conditions normally prevailing in the cell (or in an industrial reactor),�r(1)G > 0. If, however, the cell also has a supply of another substance, say X, that reactswith M:
X + M2� Y
then Le Chatelier’s principle tells us this will shift equilibrium 1 to the right because reaction2 removes M from the system. Approaching the matter from a different angle, we haveproduced a new overall reaction, namely
A + B + X � C + Y
with an overall free energy change �rG = �r(1)G + �r(2)G. If �r(2)G < −�r(1)G, then�rGm for the overall reaction is negative and the reaction can proceed to make the desiredproduct C. Reactions 1 and 2 are said to be coupled by M.
Note that M doesn’t appear in the eventual overall reaction. However, it is crucial that aspecies M exist that is a product of the unfavorable reaction and a reactant in the favorablereaction.
Example 8.6 Displacement of oxygen from titanium For the reaction
TiO2(s) + 2Cl2(g) � TiCl4(l) + O2(g)
�rG◦m = 152.3 kJ mol−1. Titanium (IV) chloride is an important precursor of titanium
metal so, in an industrial setting, we would want to maximize its yield. Since �rG◦m is large

P1: SFK Trim: 247mm × 174mm Top: 14.586mm Gutter: 23.198mm
CUUK1808-08 CUUK1808/Roussel 978 1 107 00678 2 October 29, 2011 13:9
166 Equilibrium and coupled reactions
and positive, this reaction will have a tiny equilibrium constant:
K = exp(−�rG◦m/RT ) = exp
( −152.3 × 10³ J mol−1
(8.314 472 J K−1 mol−1)(298.15 K)
)= 2.08 × 10⁻²⁷
In order to make this reaction more favorable, we need to couple it to another reaction thatwill remove a product. The trick used in titanium refining is to couple this reaction to theoxidation of graphite:
C(s) + O2(g) � CO2(g)
for which �rG◦m = −394.36 kJ mol−1. Thus, for the coupled reaction
TiO2(s) + 2Cl2(g) + C(s) � TiCl4(s) + CO2(g)
�rG◦m = −242.1 kJ mol−1. The equilibrium constant for the coupled reaction is then
K = exp(−�rG◦m/RT ) = exp
(242.1 × 10³ J mol−1
(8.314 472 J K−1 mol−1)(298.15 K)
)= 2.55 × 1042
Now that’s a big number!
It is tempting to think that this would also work if we had a thermodynamically allowedreaction that made one of the reactants with a negative overall free energy change forthe coupled process. For instance, we could try to add a reaction Z � B to our originalA + B � C + M. In ordinary chemical reactions, this doesn’t work because the amount ofB we can make is limited by stoichiometry, i.e. by the initial amount of Z. Typically, theequilibrium constant for an unfavorable reaction like reaction 1 will be extremely small,so making a limited amount of one of the reactants just won’t do us much good. To putit another way, having a large equilibrium constant for the reaction Z � B means that Zwill be stoichiometrically converted to B. If the equilibrium constant for reaction 1 is verysmall, only a very small amount of the A and B present, whatever their origin, will beconverted into products.
In biological systems, we do sometimes observe coupling through a reactant. Phospho-rylation reactions are an important class of reactions where this is commonly seen:
X + Pi → phospho-X + H2O
These are often very unfavorable (�rG◦ � 0) and are only made feasible by coupling
them to ATP hydrolysis, which has a significantly negative free energy change under theconditions that prevail in a cell:
ATP + H2O → ADP + Pi, �rG◦′ = −37.64 kJ mol−1 (8.4)
Note that water cannot be the coupling agent because the activity of water will be constantduring these reactions due to its abundance. Phosphate might be the coupling agent, except

P1: SFK Trim: 247mm × 174mm Top: 14.586mm Gutter: 23.198mm
CUUK1808-08 CUUK1808/Roussel 978 1 107 00678 2 October 29, 2011 13:9
8.4 Coupled reactions 167
that it’s a reactant of the phosphorylation reaction, and we just argued that in generalcoupling reactions in this manner doesn’t work. How then, are these reactions coupled?These reactions are always catalyzed by enzymes. A typical mechanism might be
E + ATP → [E · ATP][E · ATP] + X → [E · ATP · X]
[E · ATP · X] → [E · ADP · phospho-X][E · ADP · phospho-X] → [E · ADP] + phospho-X
[E · ADP] → E + ADP
Many details will depend on the reaction and enzyme (e.g. order of binding, dissociation),but generally the mechanism is at least roughly as shown here. In some cases, an intermediatephosphorylated enzyme is involved. Whatever the exact mechanistic details, note that theenzyme actually catalyzes the combined reaction, i.e. transfer of a phosphate group to Xfrom ATP, and not the two separate reactions involving Pi. In a case like this, thinking interms of coupling two simpler reactions is a convenience since the “overall reaction” is theonly reaction that actually happens.
Example 8.7 Glutamine synthetase In living cells, the amino acid glutamine[CONH2(CH2)2CHNH2COOH] is made from ammonium and glutamate [−CO2(CH2)2
CHNH2COOH] by the following reaction
NH+4 + glutamate → glutamine + H2O, K ′
1 = 0.003 (8.5)
Note that K ′1 is the equilibrium constant for this reaction in the biochemists’ standard state,
i.e. at pH 7 and 25 ◦C.Glutamine synthetase, the enzyme responsible for this reaction, has binding sites both
for the reactants and for ATP. The reaction that occurs in vivo is as follows:2
E + ATP → C1
C1 + glutamate → C2
C2 + NH+4 → C3 → C4 + glutamine
C4 → E + ADP + Pi
The overall reaction is simply
ATP + NH+4 + glutamate → ADP + Pi + glutamine (8.6)
We can think of this reaction as being a result of coupling reaction (8.5) with the hydrolysisof ATP (Equation 8.4). As in the case of phosphorylation reactions, the enzyme itselfcouples the two reactions. Note in this case, however, that the reaction does not involvethe transfer of a phosphate group to glutamate. Instead, the binding of ATP to the enzymeand the subsequent hydrolysis reaction change the conformation of the enzyme in waysthat favor the synthesis of glutamine. A simple way of describing this is that when the
2 This mechanism was adapted from H. S. Gill et al., Biochemistry 41, 9863 (2002), who studied a glutamine synthetase fromMycobacterium tuberculosis.

P1: SFK Trim: 247mm × 174mm Top: 14.586mm Gutter: 23.198mm
CUUK1808-08 CUUK1808/Roussel 978 1 107 00678 2 October 29, 2011 13:9
168 Equilibrium and coupled reactions
ATP “fires” it gives the other reaction a “kick” through the enzyme that pushes it towardthe product state. The final state (ADP, phosphate and glutamine, in this case) has a loweroverall free energy than the initial state (ATP, ammonium and glutamate), so once it’s done,although the reverse reaction is possible, it isn’t very likely.
A living cell exists out of equilibrium, so we can’t say exactly what concentration of theproduct glutamine will be formed under in vivo conditions. We can however fix a theoreticalmaximum: to synthesize glutamine by Reaction (8.6), the free energy change �rG cannotbe positive or the reaction would not occur. If �rG for the overall reaction is negative, thereis in some sense some “left over” free energy which could be used to drive the reactionfurther toward products. This means that the maximum ratio of products to reactants willbe reached when �rG = 0, i.e. when the reaction is at equilibrium.
The equilibrium constant for Reaction (8.5) is related to the activities of its reactantsand products by
K ′1 = 0.003 = (aglutamine)(aH2O)
(aglutamate)(aNH+4)
(8.7)
Similarly, for Equation (8.4),
K ′2 = exp(−�rG
◦m
′/RT ) = 3.93 × 106 = (aADP)(aPi)
(aATP)(aH2O)(8.8)
Multiplying Equations (8.7) and (8.8) together, we get the equilibrium constant for theoverall Reaction (8.6):
K = 1.18 × 104 = (aglutamine)(aADP)(aPi)
(aglutamate)(aNH+4)(aATP)
∣∣∣∣∣max
Typically in living cells, [ATP]/[ADP] ≈ 10, [Pi] ≈ 2 mmol L−1, and the ammonium con-centration is around 30 μmol L−1. It follows that the maximum ratio of glutamine to gluta-mate is approximately
(aglutamine)
(aglutamate)
∣∣∣∣max
≈ 1.18 × 10⁴ 10(30 × 10−6)
2 × 10−3= 1.8 × 10³
Exercise group 8.3
(1) Suppose that you want to make a compound C by the reaction
A → B + C, �rG◦ = 204 kJ mol−1 (0)
Your lab also has the supplies necessary for the following reactions:
X + C → P, �rG◦ = −509 kJ mol−1 (A)
Y + B → Q, �rG◦ = −50 kJ mol−1 (B)
W + Z → 2A, �rG◦ = −550 kJ mol−1 (C)

P1: SFK Trim: 247mm × 174mm Top: 14.586mm Gutter: 23.198mm
CUUK1808-08 CUUK1808/Roussel 978 1 107 00678 2 October 29, 2011 13:9
8.5 Active transport 169
(a) Provide a brief argument (possibly using a simple calculation) showing that theoriginal reaction (0) will not produce much C under reasonable experimentalconditions.
(b) Which of the supplementary reactions (A–C) could be used to increase the yieldof C relative to what you would get from reaction (0)? Outline your reasoning foreach reaction in a few words.
(2) The first step in glycolysis is the formation of glucose 6-phosphate from glucose:
glucose + Pi → glucose-6-phosphate + H2O
(a) Calculate the equilibrium ratio at 298 K of glucose 6-phosphate to glucose if thephosphate concentration is 2.5 mmol L−1.
Species �f G◦′/kJ mol−1
glucose −436.42glucose-6-phosphate −1325.00H2O −157.28Pi −1058.56
(b) If the phosphate ion is transferred from ATP, what is the equilibrium ratio ofglucose 6-phosphate to glucose? The in vivo concentrations of ATP and ADP are,respectively, 5 mmol L−1 and 0.5 mmol L−1 and the standard free energy changeof hydrolysis of ATP in the biochemical convention is −37.64 kJ mol−1.
(3) A key reaction in the synthesis of fats in living organisms is
glycerol + ATP → glycerol-1-phosphate + ADP
The ratio of ATP to ADP is held fixed at a value of 10 by homeostatic mechanisms. Themaximum ratio of glycerol-1-phosphate to glycerol observed is 770 at 25 ◦C. �rG
◦′
for ATP hydrolysis
ATP + H2O → ADP + Pi
is −37.64 kJ mol−1 at 25 ◦C. What is �rG◦′ for the phosphorylation of glycerol?
8.5 Active transport
Among the more biologically important examples of coupled reactions are active transportprocesses used to “pump” substrates and products in and out of cells or organelles. One ofthe most famous examples of active transport is the cotransport of sodium and potassiumions in red blood cells. Cells pump sodium out and potassium in, powering this process byhydrolyzing ATP. They do this for a number of reasons: they need potassium for certaininternal processes; they also couple the spontaneous inward sodium flow to other transportsystems.

P1: SFK Trim: 247mm × 174mm Top: 14.586mm Gutter: 23.198mm
CUUK1808-08 CUUK1808/Roussel 978 1 107 00678 2 October 29, 2011 13:9
170 Equilibrium and coupled reactions
Table 8.1 Some data relevant to erythrocytes and their transport properties.
Temperature in the human body 310 KPhysiological �rG
◦310
′ for ATP hydrolysis3 −32.55 kJ/mol[ATP] in erythrocytes 5 mmol/L[ADP] in erythrocytes 0.5 mmol/L[Pi] in erythrocytes 2.5 mmol/L[K+] in plasma 4 mmol/L[Na+] in plasma 145 mmol/L[K+] inside cell 140 mmol/L[Na+] inside cell 12 mmol/L
The ATP-powered cotransport of sodium and potassium is mediated by a transmembraneprotein. This protein can best be thought of as an ATPase (an enzyme that hydrolyzes ATP)that undergoes a set of conformational changes that affect its ability to bind sodium andpotassium, as well as the side of the membrane on which the bound ions are exposed. It isnot clear exactly how this transporter functions, but it suffices (for our purposes, at least)to know that it exists. It provides the mechanism whereby ATP hydrolysis is coupled to thetransport process.
Three sodium ions are transported out for every two potassium ions transported in, andone ATP molecule is hydrolyzed in the process. Additional data is provided in Table 8.1,for the special case of erythrocytes (red blood cells).
Let’s work out the algebra for a general case. This will let us ask later whether the3:2:1 ratio of sodium ions to potassium ions to ATP reflects some fundamental physicallimitation. The overall process is
νNa Na+(in) + νK K+
(out) + ATP + H2O → νNa Na+(out) + νK K+
(in) + ADP + Pi
where νNa and νK are the numbers of each of the cations transported per molecule of ATPhydrolyzed. The standard free energy change for this process is just the standard free energychange for ATP hydrolysis because the standard free energies of formation of the ions cancelout. (Potassium is potassium, whether it’s on one side of the membrane or the other.)
We can calculate �rGm under physiological conditions from the data in Table 8.1:
�rGm = �rG◦m + RT ln
([Na+
(out)]νNa [K+
(in)]νK [ADP][Pi]
[Na+(in)]
νNa [K+(out)]
νK [ATP]
)(8.9)
= −32.55 kJ mol−1 + (8.314 472 × 10−3 kJ K−1mol−1)(310 K) (8.10)
× ln
((145 × 10−3)3(140 × 10−3)2(0.5 × 10⁻³)(2.5 × 10⁻³)
(12 × 10−3)3(4 × 10⁻³)2(5 × 10⁻³)
)= −16.33 kJ mol−1
3 Computed from data in Alberty and Goldberg, Biochemistry 31, 10610 (1992). This value corresponds to physiologicalconditions, including appropriate values for the ionic strength and magnesium concentration, both of which have a significanteffect on the thermodynamics of this reaction.
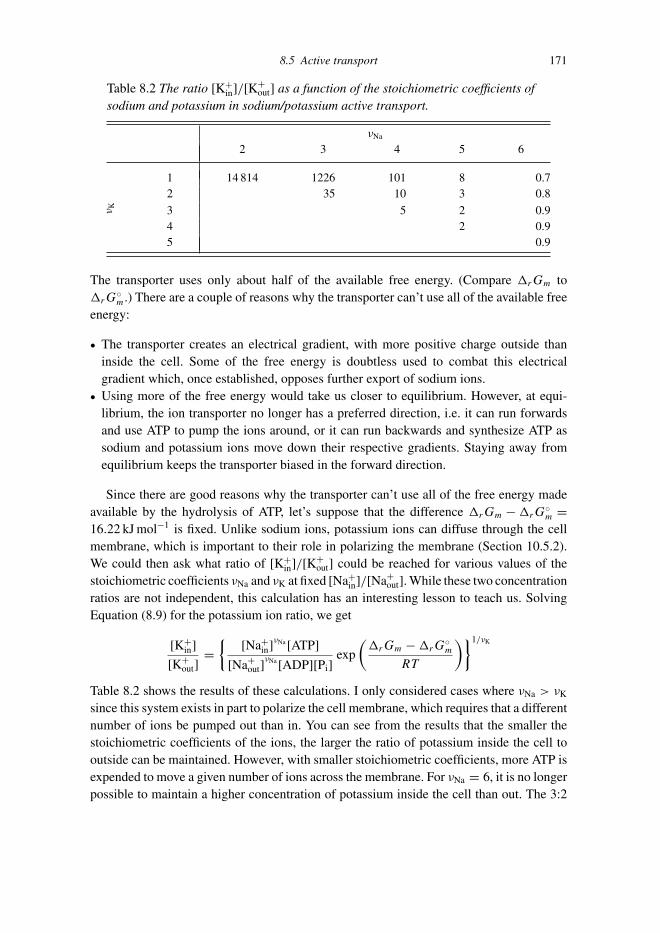
P1: SFK Trim: 247mm × 174mm Top: 14.586mm Gutter: 23.198mm
CUUK1808-08 CUUK1808/Roussel 978 1 107 00678 2 October 29, 2011 13:9
8.5 Active transport 171
Table 8.2 The ratio [K+in]/[K+
out] as a function of the stoichiometric coefficients ofsodium and potassium in sodium/potassium active transport.
νNa
2 3 4 5 6
1 14 814 1226 101 8 0.72 35 10 3 0.8
νK 3 5 2 0.9
4 2 0.95 0.9
The transporter uses only about half of the available free energy. (Compare �rGm to�rG
◦m.) There are a couple of reasons why the transporter can’t use all of the available free
energy:
� The transporter creates an electrical gradient, with more positive charge outside thaninside the cell. Some of the free energy is doubtless used to combat this electricalgradient which, once established, opposes further export of sodium ions.
� Using more of the free energy would take us closer to equilibrium. However, at equi-librium, the ion transporter no longer has a preferred direction, i.e. it can run forwardsand use ATP to pump the ions around, or it can run backwards and synthesize ATP assodium and potassium ions move down their respective gradients. Staying away fromequilibrium keeps the transporter biased in the forward direction.
Since there are good reasons why the transporter can’t use all of the free energy madeavailable by the hydrolysis of ATP, let’s suppose that the difference �rGm − �rG
◦m =
16.22 kJ mol−1 is fixed. Unlike sodium ions, potassium ions can diffuse through the cellmembrane, which is important to their role in polarizing the membrane (Section 10.5.2).We could then ask what ratio of [K+
in]/[K+out] could be reached for various values of the
stoichiometric coefficients νNa and νK at fixed [Na+in]/[Na+
out]. While these two concentrationratios are not independent, this calculation has an interesting lesson to teach us. SolvingEquation (8.9) for the potassium ion ratio, we get
[K+in]
[K+out]
={
[Na+in]νNa [ATP]
[Na+out]
νNa [ADP][Pi]exp
(�rGm − �rG
◦m
RT
)}1/νK
Table 8.2 shows the results of these calculations. I only considered cases where νNa > νK
since this system exists in part to polarize the cell membrane, which requires that a differentnumber of ions be pumped out than in. You can see from the results that the smaller thestoichiometric coefficients of the ions, the larger the ratio of potassium inside the cell tooutside can be maintained. However, with smaller stoichiometric coefficients, more ATP isexpended to move a given number of ions across the membrane. For νNa = 6, it is no longerpossible to maintain a higher concentration of potassium inside the cell than out. The 3:2

P1: SFK Trim: 247mm × 174mm Top: 14.586mm Gutter: 23.198mm
CUUK1808-08 CUUK1808/Roussel 978 1 107 00678 2 October 29, 2011 13:9
172 Equilibrium and coupled reactions
ratio may be the best compromise that can be reached between maintaining a high ratio ofpotassium inside to outside while economizing ATP.
Example 8.8 Transport coupled to substrate phosphorylation There are many variationson the theme of active transport. In some cases, a molecule is covalently modified duringthe transport process. For instance, in some organisms, glucose is actively transported intomitochondria while being phosphorylated by ATP. Glucose phosphorylation is the first stepin glycolysis so two purposes are being served by a single process. The two processescoupled here are ATP hydrolysis and simultaneous glucose transport and phosphorylation:
ATP + H2O → ADP + Pi �rG◦′ = −37.64 kJ mol−1
glucose(out) + Pi → glucose-6-phosphate(in) + H2O �rG◦′ = 21.16 kJ mol−1
(All data are given for the usual biochemists’ standard state at 25 ◦C.) Suppose that wewant to know the maximum ratio of glucose-6-phosphate inside the mitochondria to glucoseoutside at 25 ◦C if the ATP to ADP ratio is 100.
The overall reaction is
ATP + H2O + glucose(out) → ADP + glucose-6-phosphate(in)
with �rG◦′ = −16.48 kJ mol−1. The maximum ratio is obtained when all of the free energy
is used in transport. Then we have
Q = (aADP)(aG6P)
(aATP)(agluc)= exp
(16.48 × 10³ J mol−1
(8.314 472 J K−1mol−1)(298.15 K)
)= 771
∴ aG6P
agluc= 771
aATP
aADP= 771(100) = 7.71 × 10⁴
Exercise group 8.4
(1) Suppose that a glucose transporter in a cell is powered by ATP hydrolysis at 310 K.Two glucose molecules are transported into the cell for every ATP hydrolyzed. Theratio of ATP to ADP in the cell is 15 and the concentration of phosphate is 5 mmol L−1.If the extracellular glucose concentration is 3 mmol L−1, what is the maximum glucoseconcentration that can be obtained in the cell? Any additional data required can betaken from Table 8.1.
(2) The chemiosmotic theory of ATP synthesis suggests that mitochondria use the oxidationof carbohydrates and fats to operate a proton pump resulting in an internal pH of 7.0when the pH of the surrounding cytoplasm is 5.5. When these protons spontaneouslyflow back in across the mitochondrial membrane, their free energy is harnessed tosynthesize ATP. The concentrations of ATP, ADP and phosphates in the mitochondriaare 1, 1 and 2.5 mM, respectively. For the ATP synthesis reaction ADP + Pi → ATP +H2O, �rG
◦′ = 37.64 kJ mol−1 at 25 ◦C.(a) How much free energy is required to synthesize 1 mol of ATP in a mitochondrion
at 25 ◦C?

P1: SFK Trim: 247mm × 174mm Top: 14.586mm Gutter: 23.198mm
CUUK1808-08 CUUK1808/Roussel 978 1 107 00678 2 October 29, 2011 13:9
8.6 Temperature and equilibrium 173
(b) How much free energy is produced by moving 1 mol of protons into the mitochon-drion from the outside?
(c) What is the minimum number of protons that must cross the membrane to synthe-size one molecule of ATP?Note: Report the smallest sufficiently large whole number.
8.6 Temperature and equilibrium
We now seek to work out the temperature dependence of the equilibrium constant of areaction. First note that
ln K = −�rG◦m
RT
Therefore, for two different temperatures T1 and T2, we have
lnK1
K2= ln K1 − ln K2 = −�rG
◦1,m
RT1+ �rG
◦2,m
RT2
�rH◦m and �rS
◦m vary much more slowly with temperature than �rG
◦m, so provided the
temperatures T1 and T2 aren’t too different, we have
lnK1
K2= �rH
◦m − T2�rS
◦m
RT2− �rH
◦m − T1�rS
◦m
RT1
∴ lnK1
K2= �rH
◦m
R
(1
T2− 1
T1
)(8.11)
Note that this equation agrees with Le Chatelier’s principle: if the reaction is exothermic(�rH
◦m < 0), then the equilibrium constant decreases as the temperature increases. Con-
versely, if it is endothermic, the equilibrium constant increases with increasing temperature.
Example 8.9 pH of neutral water at 37 ◦C The autoionization constant for water is theequilibrium constant for the process
H2O(l) � H+(aq) + OH−
(aq)
At 25 ◦C, �rG◦m for this reaction is 79.92 kJ mol−1. The equilibrium constant is therefore
K298 = exp
( −79.92 × 10³ J mol−1
(8.314 472 J K−1mol−1)(298.15 K)
)= 9.97 × 10⁻¹⁵
(Note that this equilibrium constant is normally called Kw. We omit the w here to avoidexcessive subscripting.) To adjust this equilibrium constant to (for instance) 37 ◦C, we alsoneed the enthalpy of reaction, �rH
◦m = 55.815 kJ mol−1. Therefore
ln
(K310
K298
)= 55.815 × 10³ J mol−1
8.314 472 J K−1mol−1
(1
298.15 K− 1
310.15 K
)= 0.871
∴ K310 = (9.97 × 10⁻¹⁵) exp(0.871) = 2.38 × 10⁻¹⁴
This means that the pH of neutral water at body temperature (37 ◦C) is not 7 but 6.8.

P1: SFK Trim: 247mm × 174mm Top: 14.586mm Gutter: 23.198mm
CUUK1808-08 CUUK1808/Roussel 978 1 107 00678 2 October 29, 2011 13:9
174 Equilibrium and coupled reactions
Example 8.10 Boiling point and altitude The boiling point is the temperature at whichthe vapor pressure equals the atmospheric pressure; if the partial pressure were lower thanthe atmospheric pressure, bubbles couldn’t form because the atmosphere would crush themout of existence. If the partial pressure were significantly higher, an explosion would result.(This can happen when a liquid is superheated.) Since the atmospheric pressure varies withaltitude, it follows that the boiling temperature does too. Suppose that I wanted to calculatethe boiling point of water where I live in Lethbridge, Canada. The average atmosphericpressure here, approximately 920 m above sea level, is 90 kPa or 0.90 bar.
Boiling involves the phase transition
l → g
For this process, K = ag/al but al = X = 1 for a pure solvent and ag = p/p◦. If weexpress pressures in bars, ag = p (since p◦ = 1 bar) so that K = p.
Now we run into a slight bit of awkwardness. While the thermodynamic standardpressure is 1 bar, the so-called normal boiling point is still quoted at 1 atm = 1.013 25 bar.At this pressure, water boils at 100 ◦C. We therefore take K1 = 1.013 25 at T1 = 373.15 Kin Equation (8.11). We want to calculate the temperature T2 at which K2 = 0.90. Note thatit doesn’t matter whether we associate the normal boiling point with T1 and K1 or withT2 and K2, provided we are consistent. The enthalpy of vaporization at the normal boilingpoint is 40.66 kJ mol−1. Substituting all these quantities in Equation (8.11), we get
ln
(1.013 25
0.90
)= 40 660 J mol−1
8.314 472 J K−1mol−1
(1
T2− 1
373.15 K
)
∴ 1
T2= 2.704 × 10⁻³ K−1
∴ T2 = 369.81 K ≡ 96.7 ◦C
The fact that water boils at a lower temperature at higher altitudes than at sea levelhas observable consequences. For instance, the cooking times given on packages of pastaare appropriate to sea-level cooking since most of the population of North America livesmuch closer to sea level than I do. Since chemical reactions, including those responsiblefor cooking, speed up with increasing temperature, the estimated cooking times given onpackages of pasta are always too short for those of us who live more than a few hundredmeters above sea level. This issue affects any recipes (or laboratory procedures) that involveboiling, but not other methods of cooking.
Example 8.11 Boiling-point elevation You have probably studied freezing-point depres-sion and boiling-point elevation in your previous courses in chemistry. In short, solutestend to reduce the freezing point and to increase the boiling point. These phenomena canalso be understood via Equation (8.11).
We don’t cook pasta in pure water; we salt the water, which increases its boiling point.Does that make a significant difference to cooking times? A rough rule of thumb is thatwe want to make the cooking water roughly as salty as sea water, which contains about

P1: SFK Trim: 247mm × 174mm Top: 14.586mm Gutter: 23.198mm
CUUK1808-08 CUUK1808/Roussel 978 1 107 00678 2 October 29, 2011 13:9
8.6 Temperature and equilibrium 175
0.5 mol L−1 of salt. We will do the calculation for sea level, but we could easily do it foranother altitude by adjusting p. The basic reasoning is exactly as in the last example, exceptthat al = Xl . The mole density of water near 100 ◦C is 53.19 mol L−1. The mole fractionof the water is therefore
XH2O = nH2O/V
nH2O/V + [Na+] + [Cl−]= 53.19 mol L−1
53.19 + 2(0.5 mol L−1)= 0.982
Our process is l → g with equilibrium constant K = ag/al = p/XH2O. We know that purewater (XH2O = 1) boils at 100 ◦C at 1 atm, so we take T1 = 373.15 K and K1 = 1.013 25.At sea level, p = 1 atm, so K2 = 1.013 25/0.982 = 1.03 at the unknown T2. Proceedingas in the previous example, we have
ln
(1.013 25
1.03
)= 40 660 J mol−1
8.314 472 J K−1mol−1
(1
T2− 1
373.15 K
)
∴ 1
T2= 2.676 × 10⁻³ K−1
∴ T2 = 373.68 K ≡ 100.5 ◦C
This certainly isn’t enough of an increase in the boiling point to have much of an effect oncooking times. The real reason we add salt to water when we’re cooking starches (pasta,potatoes, rice) is of course for flavor.
There is another way to use Equation (8.11). Instead of (K1, T1), let’s write (K, T ).Rearranging the equation, we get
ln K = −�rH◦m
R
1
T+ c (8.12)
where c is a constant that depends on K2, T2 and �rH◦m. If we have values of the equilibrium
constant at several different temperatures, we can therefore get �rH◦m from the slope of the
graph of ln K vs. T −1. Specifically, the slope is −�rH◦m/R. This procedure is better than
using pairs of equilibrium constants with Equation (8.11) and averaging at the end becauseit uses all the data at once.
The slope of a graph is best obtained by linear regression, sometimes also known asleast-squares fitting. Fortunately, all modern scientific calculators, as well as spreadsheetprograms, provide linear regression routines, so this is something we can easily do.
Example 8.12 Partition coefficient and temperature The partition coefficient is theequilibrium constant for the transfer of a solute between two immiscible solvents. Forinstance, the hexane–water partition coefficient of nicotine refers to the equilibrium
nicotine(aq) � nicotine(hexane)
Partition coefficients between a hydrophobic solvent like hexane and water are often usedto assess the ease with which a solute is likely to penetrate a cell membrane, since the insideof a cell membrane is hydrophobic. The hexane–water partition coefficient of nicotine has

P1: SFK Trim: 247mm × 174mm Top: 14.586mm Gutter: 23.198mm
CUUK1808-08 CUUK1808/Roussel 978 1 107 00678 2 October 29, 2011 13:9
176 Equilibrium and coupled reactions
−1.6
−1.4
−1.2
−1.0
−0.8
−0.6
−0.4
−0.2
0.0
0.0034 0.0035 0.0036
lnK
T-1/K−1
Figure 8.2 Temperature variation of the hexane–water partition coefficient of nicotine (example 8.12).
been measured as a function of temperature:
T/◦C 5 10 15 20
K 0.26 0.41 0.58 0.70
We want to calculate both �rH◦m and �rG
◦m for this process.
To get �rH◦m, we plot ln K vs. T −1, remembering to convert T to kelvins before we
generate the plot. The graph is shown in Figure 8.2. It’s not exactly a great fit, although wedon’t have enough points to say for sure if this is just scatter or some kind of systematicexperimental error. We will assume the former. The slope of the graph is −5425 K and itsintercept is 18.22.
slope = −�rH◦m/R
∴ �rH◦m = −R(slope)
= −(8.314 472 J K−1mol−1)(−5425 K)
= 45.1 kJ mol−1
What about �rG◦m? We could calculate this from the partition coefficient at 25 ◦C.
However, 25 ◦C is outside of the experimental range, so we can’t just pick out the value ofK at this temperature from the data set. Rather, we use the equation of the line we just fitto estimate K at this temperature. Note that even if we had data at 25 ◦C, it might still be agood idea to use the equation of the line to estimate K at this temperature. Why? Our dataset displays significant scatter (Figure 8.2). That being the case, we could not be sure thatthe measurement at 25 ◦C was all that accurate. The line represents our best fit of the entiredata set, so our best estimate of K at any given temperature comes from the equation of theline.

P1: SFK Trim: 247mm × 174mm Top: 14.586mm Gutter: 23.198mm
CUUK1808-08 CUUK1808/Roussel 978 1 107 00678 2 October 29, 2011 13:9
8.6 Temperature and equilibrium 177
The equation of the line of best fit is
ln K = (−5425 K)1
T+ 18.22
∴ ln K(25 ◦C) = −5425 K
298.15 K+ 18.22 = 0.0185
∴ �rG◦m = −RT ln K
= −(8.314 472 J K−1mol−1)(298.15 K)(0.0185)
= −46 J mol−1
(Yes, that is J mol−1, not kJ mol−1 this time. It’s a very small �rG◦m.)
Exercise group 8.5
(1) The solubility of salts generally goes up with temperature. What does this tell us aboutthe thermodynamics of these processes?
(2) Calculate the vapor pressure of sodium metal at 50 ◦C.(3) In chemical laboratories, solvents are often boiled away by reducing the pressure in
the reaction vessel rather than by heating. This makes it possible to dry heat-sensitivecompounds. Calculate the pressure at which the following solvents boil at 298 K:(a) water (Tb = 373 K, �vapH
◦ = 45.02 kJ mol−1 at 298 K)(b) ethanol (Tb = 352 K, �vapH
◦ = 40.48 kJ mol−1 at 298 K)(c) benzene (Tb = 353 K, �vapH
◦ = 33.9 kJ mol−1 at 298 K)All other things being equal, which of these solvents would be easiest to remove bypumping?
(4) (a) Using the data in Appendix A.1, predict the normal boiling point of water.(b) What are the possible reasons that your answer might differ from the accepted
value of 100 ◦C?(5) Relate the formula
ln
(K2
K1
)= �rH
◦m
R
(1
T1− 1
T2
)
to Le Chatelier’s principle. Consider both endothermic and exothermic reactions.(6) (a) The equilibrium constant for dissolving hydrogen sulfide in water
H2S(g) � H2S(aq)
is 0.087 at 298.15 K. What is the standard free energy of formation of an aqueoushydrogen sulfide molecule?
(b) The slope of a graph of ln K vs. T −1 for the above solubility process is 2100 K.What is the standard enthalpy of formation of aqueous hydrogen sulfide?
(c) The standard entropy of gaseous H2S at 298.15 K is 205.77 J K−1mol−1. What isthe standard entropy of aqueous H2S?

P1: SFK Trim: 247mm × 174mm Top: 14.586mm Gutter: 23.198mm
CUUK1808-08 CUUK1808/Roussel 978 1 107 00678 2 October 29, 2011 13:9
178 Equilibrium and coupled reactions
(7) Calcium carbonate decomposes under certain conditions to calcium oxide and carbondioxide.(a) Is calcium carbonate stable with respect to calcium oxide and carbon dioxide at
25 ◦C under normal atmospheric conditions? The pressure of carbon dioxide innormal air is 3.3 × 10⁻⁴ bar.
(b) Calcium oxide is an enormously important industrial chemical used in steelproduction, in water treatment, and in the pulp and paper industry, among otherapplications. It has traditionally been produced by heating calcium carbonateto a high temperature. Assuming that the partial pressure of carbon dioxide is3.3 × 10−4 bar, what is the minimum temperature (in degrees Celsius) at whichthe decomposition reaction becomes thermodynamically allowed?Hint: Although the temperature you will calculate will seem high, an approxi-mation that we have used for temperatures near standard still gives very goodresults.
(8) Carbonated drinks are made by forcing carbon dioxide into an aqueous solution underhigh pressure. Typical soft drinks are made at 4 ◦C under a pressure of 120 kPa ofcarbon dioxide. Once the carbon dioxide is dissolved in the aqueous solution, someof it reacts with water to form H+ and HCO−
3 . (Carbonic acid itself is present in suchsmall concentrations that it is undetectable in aqueous solutions.)(a) Assuming there are no other acids present, calculate the pH of the solution formed
under the conditions given above.(b) Based on your calculations, why do you think that carbonated drinks are usually
made at 4 ◦C rather than at room temperature?(9) Consider the following equilibrium vapor pressure data for benzene:
T/◦C 3.0 35.3 72.6 80.1
p/mmHg 30 150 600 760
Determine the enthalpy of vaporization of benzene from these data.(10) Xanthine is an intermediate in purine metabolism.
OH
N
N
N
NHO
It is only slightly soluble, and so tends to precipitate out of solution at higher con-centrations, leading to urinary stones. (This is just one of the insoluble compoundsthat can be involved in the formation of stones.) The hydroxyl protons are ionizableso xanthine is a diprotic acid. Two processes are important in the solubilization of
P1: SFK Trim: 247mm × 174mm Top: 14.586mm Gutter: 23.198mm
CUUK1808-08 CUUK1808/Roussel 978 1 107 00678 2 October 29, 2011 13:9
8.6 Temperature and equilibrium 179
xanthine:
H2Xan(s)K1� H2Xan(aq)
H2Xan(aq)K2� H+
(aq) + HXan−(aq)
(The second proton is too weakly acidic to be physiologically relevant.)(a) The equilibrium constants have recently been measured.4 Their values at 298.15 K
are K1 = 1.29 × 10⁻⁴ and K2 = 2.95 × 10⁻⁸. What is the solubility of xanthinein aqueous solution at a fixed (buffered) pH of 6.5 (a typical pH for urine)?Hint: The solubility includes all forms of xanthine in solution.
(b) At 310.15 K, K1 = 2.04 × 10⁻⁴. The standard enthalpy of formation of solidxanthine is −379.6 kJ mol−1. Estimate the standard enthalpy of formation ofaqueous xanthine.
(c) Estimate the standard free energy of formation of solid xanthine.(d) Estimate the standard free energy of formation of aqueous xanthine (H2Xan(aq)).
8.6.1 Relative humidity and the dew point
Relative humidity is the fraction of the equilibrium vapor pressure of water in a sample ofair. Thus, when we say that the relative humidity is 50%, we mean that the partial pressureof water is 50% of its equilibrium value. Since the equilibrium vapor pressure varies withtemperature, the relative humidity does too. Accordingly, the relative humidity can changeduring the day even if the actual partial pressure of water in the atmosphere does notchange.
Example 8.13 Suppose that the relative humidity is 30% when the temperature is 25 ◦Con a still day. The equilibrium vapor pressure of water at this temperature is 0.03167 bar(Example 8.2). Thus, the partial pressure of water is 0.30(0.03167 bar) = 0.0095 bar. If thetemperature drops overnight to 10 ◦C, the relative humidity will have increased because theequilibrium vapor pressure of water has decreased. We can calculate the equilibrium vaporpressure; the enthalpy of vaporization at 25 ◦C is 44.004 kJ mol−1. Thus
ln
(K10
K25
)= 44 004 J mol−1
8.314 472 J K−1mol−1
(1
298.15 K− 1
283.15 K
)= −0.94
∴ K10 = 0.03167 exp(−0.94) = 0.0124
The equilibrium partial pressure is therefore 0.0124 bar at 10 ◦C. If the vapor pressure ofwater has not changed, the relative humidity is then
rel. humidity = 0.0095
0.0124× 100% = 77%
4 E. Konigsberger et al., J. Chem. Thermodyn. 33, 1 (2001).

P1: SFK Trim: 247mm × 174mm Top: 14.586mm Gutter: 23.198mm
CUUK1808-08 CUUK1808/Roussel 978 1 107 00678 2 October 29, 2011 13:9
180 Equilibrium and coupled reactions
It follows from these considerations that if the temperature goes on dropping, the rel-ative humidity will eventually reach 100%. This is the dew point. If the temperaturedrops slightly below the dew point, water will tend to condense on surfaces that effi-ciently nucleate condensation. To calculate the dew point, we work out the temperatureat which the current partial pressure of water in the air will equal the equilibrium vaporpressure.
Example 8.14 Carrying on with our previous example, the dew point would be reachedwhen K = 0.0095. Therefore
ln
(0.03167
0.0095
)= 44 004 J mol−1
8.314 472 J K−1mol−1
(1
Tdew− 1
298.15 K
)∴ Tdew = 279 K ≡ 6 ◦C
Exercise group 8.6
(1) Suppose that the partial pressure of water vapor in the air is 1.0 × 10⁻² bar. What isthe dew point, in degrees Celsius?
(2) Ice fog occurs when the condensation of water vapor into ice is thermodynamicallyallowed. Ice crystals then grow on surfaces that are good nucleators. If the partialpressure of water is 0.004 bar, below what temperature would you predict ice fog toform? Report your final answer in degrees Celsius. The vapor pressure of ice at 0 ◦C is6.025 × 10−3 bar.
Key ideas and equations
� �rG◦m = −RT ln K
� Important types of equilibria:◦ g � aq: Henry’s law◦ l � g: Raoult’s law and vapor pressure/boiling◦ Ionic compound solubility, equilibrium constant Ksp
◦ Acid dissociation, equilibrium constant Ka
◦ Base ionization, equilibrium constant Kb
� pH = − log10 aH+
� Catalysts do not affect the thermodynamics of a reaction, including the equilibrium ratioof products to reactants.
� Coupled reactions
� ln
(K1
K2
)= �rH
◦m
R
(1
T2− 1
T1
)
This can be rewritten in the form ln K = −�rH◦m
R
1
T+ C, so �rH
◦m can be recovered
from the slope of a graph of ln K vs. T −1.

P1: SFK Trim: 247mm × 174mm Top: 14.586mm Gutter: 23.198mm
CUUK1808-08 CUUK1808/Roussel 978 1 107 00678 2 October 29, 2011 13:9
8.6 Temperature and equilibrium 181
Review exercise group 8.7
(1) The solubility of gases in water generally decreases with increasing temperature.Explain this observation using thermodynamics.
(2) Suppose that you want to make compound C by the gas-phase reaction
A(g) + B(g) → C(g)
but the above reaction produces a very poor yield under normal conditions. How mightyou try to improve the yield of C? Describe at least two different methods.
(3) The maximum allowed occupational exposure to lead vapor is 0.05 mg m−3. Is it safeto keep a lead bar in a poorly ventilated laboratory at 25 ◦C? The molar mass of leadis 207.2 g mol−1.
(4) What is the solubility product of iron(II) sulfate at 350 K?(5) Suppose that the Earth had a much lighter atmosphere, generating a surface pressure
of 0.2 bar. Could liquid water exist on Earth at this pressure?(6) The solubility of cobalt (II) fluoride is 0.15 mol L−1 at 298 K. Estimate the free energy
of formation of solid cobalt (II) fluoride.(7) A 1.2 × 10⁻⁴ mol L−1 solution of NaOH is prepared. What is the pH of this solution
at 25 ◦C and at 60 ◦C?(8) The enthalpy of vaporization of toluene at its normal boiling point of 111 ◦C (at 1 atm)
is 33 kJ mol−1. Calculate the boiling point of toluene at an atmospheric pressure of0.90 bar.
(9) The acid dissociation constant of phosphoric acid is 7.5 × 10⁻³ at 25 ◦C. What is thestandard free energy of formation of the aqueous H3PO4 molecule?
(10) Ribonuclease has two conformations, only one of which is active. At 50 ◦C, theequilibrium concentrations of the active and inactive forms are, respectively, 9.97 ×10⁻⁴ and 2.57 × 10⁻⁶ mol L−1 in a solution with a total molarity of 1 mmol L−1. At100 ◦C, the equilibrium concentrations of the active and inactive forms are 8.6 × 10⁻⁴
and 1.4 × 10⁻⁴ mol L−1.(a) What is �rH
◦ for the process that converts the active form to its inactive confor-mation?
(b) What is the ratio of the active to the inactive form at 37 ◦C?(11) Hemoglobin Howick (HH) is a naturally occurring mutant form of hemoglobin. It
normally exists in solution as a dimer (two copies of the protein associated together),but can also form a tetramer:
2 dimer � tetramer
The equilibrium constant for this reaction is 3.3 × 10⁵ (standard state = 1 mol L−1)for deoxygenated HH. If a solution of 100 μmol L−1 of HH monomers is made, whatare the equilibrium concentrations of dimer and tetramer?

P1: SFK Trim: 247mm × 174mm Top: 14.586mm Gutter: 23.198mm
CUUK1808-08 CUUK1808/Roussel 978 1 107 00678 2 October 29, 2011 13:9
182 Equilibrium and coupled reactions
(12) The boiling point decreases at decreasing atmospheric pressure, but increases due tothe presence of solutes. Calculate the approximate concentration of sodium chloriderequired to raise the boiling point of water held at a pressure of 0.90 bar back to100 ◦C. What mass of salt would have to be dissolved in 1 L of water to reach thisconcentration?Note: The answer does not depend on the enthalpy or free energy of vaporization ofwater. Try to answer this question without these pieces of data, if you can.
(13) In glycolysis, glucose is metabolized in steps to produce ATP and pyruvate. Thereactions of glycolysis are as follows:
�rG◦′
kJ mol−1
(1) d-glucose + ATP → d-glucose-6-phosphate + ADP −16.7(2) d-glucose-6-phosphate → d-fructose-6-phosphate 1.7(3) d-fructose-6-phosphate + ATP →
d-fructose-1,6-diphosphate + ADP −14.2(4) d-fructose-1,6-diphosphate →
dihydroxyacetone phosphate + glyceraldehyde-3-phosphate 23.8(5) dihydroxyacetone phosphate → glyceraldehyde-3-phosphate 7.5(6) glyceraldehyde-3-phosphate + phosphate + NADox →
1,3-diphosphoglycerate + NADred + H+ 6.3(7) 1,3-diphosphoglycerate + ADP → 3-phosphoglycerate + ATP −18.8(8) 3-phosphoglycerate → 2-phosphoglycerate 4.6(9) 2-phosphoglycerate → 2-phosphoenolpyruvate + H2O 1.7
(10) 2-phosphoenolpyruvate + ADP → pyruvate + ATP −31.4
The pyruvate is further oxidized in the citric acid cycle.(a) What is the overall reaction for glycolysis? Also calculate the biochemists’ stan-
dard free energy change for the overall reaction.(b) If this reaction were carried out in isolation (i.e. in the absence of other reactions
involving the reactants and products, which is not the case in a living cell) in asolution in which [glucose] = 0.01, [pyruvate] = 6 × 10⁻⁵ [Pi] = 0.002, all inmol L−1, [NADox]/[NADred] = 0.25, and the pH is 7, what is the maximum ratioof ATP to ADP that could be obtained at 25 ◦C?
(14) The octanol–water partition coefficient of a compound is the equilibrium constant forthe process A(aq) � A(octanol). This partition coefficient correlates reasonably wellwith the tendency of a substance to enter cell membranes and thus to bioaccu-mulate. Bleaching pulp for the production of paper produces a number of envi-ronmentally undesirable compounds, including chlorinated cymenes. Tetrachloro-p-cymene (TCPC, illustrated below) has a molar mass of 274.1 g mol−1, a solubility

P1: SFK Trim: 247mm × 174mm Top: 14.586mm Gutter: 23.198mm
CUUK1808-08 CUUK1808/Roussel 978 1 107 00678 2 October 29, 2011 13:9
8.6 Temperature and equilibrium 183
in water of 0.15 g m−3, and an octanol–water partition coefficient of 6.8 × 10⁶ at25 ◦C.5
The high solubility of TCPC in hydrophobic phases such as octanol and cellmembranes poses a serious toxicological problem, but it also presents opportunitiesfor removal of this substance from aqueous waste. If 10.0 m3 of an aqueous solutioncontaining 0.98 g of TCPC is put in contact with 2.0 L of octanol, what mass of TCPCremains in the aqueous phase once the system has come to equilibrium?Note: To get a reasonable answer for this problem, you’ll have to keep a lot of digits(as many as possible) in intermediate steps of the calculation.
(15) It has recently been proposed that there are two different forms of the nitrate ion inaqueous solution, which have tentatively been named α-nitrate and β-nitrate.6 Theequilibrium constant for the interconversion
α-NO−3(aq) � β-NO−
3(aq)
has been measured at several temperatures over the range 10–70 ◦C. In particular,K = 0.122 in dilute sodium nitrate solution at 25 ◦C, and K = 0.132 at 30 ◦C. In thediscussion section of their paper, Simeon and coworkers argue that the reaction shownabove involves the breaking of a hydrogen bond between nitrate and water, i.e. thatthe reaction is something along the lines of
[NO3(H2O)n+1]− � [NO3(H2O)n]− + H2O
Calculate the standard entropy change for the reaction. Is the result consistent withthe breaking of a hydrogen bond as suggested by Simeon and coworkers?
(16) As the temperature of a kernel of popcorn increases, two things happen:� The starch and protein that make up most of the kernel cook.� The water heats up, increasing its vapor pressure.The increase in the vapor pressure of water eventually causes the kernel to explode.The cooked starch and protein dehydrate rapidly, making the popped corn crispy andfluffy.7 The explosive release of steam is what makes the popcorn jump, based onexactly the same physics as rocket propulsion. In essence, a popcorn kernel is a tinylittle rocket!
5 R. Lun et al., J. Chem. Eng. Data 42, 951 (1997).6 V. Simeon et al., Phys. Chem. Chem. Phys. 5, 2015 (2003).7 H. McGee, On Food and Cooking, Collier: New York, 1984, p 242. Incidentally, this book makes for excellent pleasure
reading.

P1: SFK Trim: 247mm × 174mm Top: 14.586mm Gutter: 23.198mm
CUUK1808-08 CUUK1808/Roussel 978 1 107 00678 2 October 29, 2011 13:9
184 Equilibrium and coupled reactions
(a) It is known that popcorn has to reach a temperature of at least 200 ◦C before itwill pop. Estimate the yielding pressure of a kernel of popcorn, assuming that thewater in the kernel behaves like pure water.
(b) Estimate the heat of vaporization of water at 200 ◦C.(c) Suppose that a 15 g serving of popcorn starts out at 20 ◦C. Popcorn is approxi-
mately 14% water (by mass). How much heat is required to bring all the moisturein the 15 g serving to 200 ◦C and then to evaporate it completely?
(d) Unlike most reactions involving solids, popcorn expands spectacularly when itexplodes. Suppose that you pop 20 mL (initial volume) of a variety that expandsby a factor of 40 when popped.8 How much expansion work does the popcorn doif the atmospheric pressure is 1 atm?
(e) Suppose that you wanted to calculate �U for the process of popping corn. Areheat or work effects more important? What additional data would you need toobtain a reasonably accurate estimate of �U for this process?
(17) (a) The Henry’s law constant for nitrogen in aqueous solution is 6.2 ×10⁻⁴ mol L−1bar−1 at 298.15 K. Determine the free energy of formation of theaqueous nitrogen molecule.
(b) The Henry’s law constant (kH) for aqueous nitrogen depends on temperatureaccording to
d(ln kH)
d(1/T )= 1300 K
Determine the enthalpy of formation of the aqueous nitrogen molecule.Hint: Look at Equation (8.11).
(c) Calculate the Henry’s law constant for nitrogen at 37 ◦C.(d) Scuba divers can dive down to a depth of 40 m using ordinary air. At this depth,
the diver experiences a pressure of about 5 bar. Predict the solubility of nitrogenin an aqueous solution (e.g. blood) at this pressure and at 37 ◦C.
(e) The volume of blood in a typical male adult human is about 5.7 L. Suppose that adiver makes a rapid ascent from 40 m to the surface. How much nitrogen comesout of solution? Assume that nitrogen behaves like an ideal gas and that thepressure at the surface is 1 bar, and express your answer in cubic centimeters.
(f) The sudden release of dissolved gases after a rapid ascent causes a syndromeknown as decompression sickness. In extreme cases, decompression sickness canbe fatal. Based on your calculation in the last part of this question, do you thinkthat a rapid ascent from 40 m could be dangerous? Explain briefly.
8 This expansion factor is at the low end of typical values. Source: www.popcorn.org. (I’m not making this up.)

P1: SFK Trim: 247mm × 174mm Top: 14.586mm Gutter: 23.198mm
CUUK1808-09 CUUK1808/Roussel 978 1 107 00678 2 October 29, 2011 13:16
9
Non-ideal behavior
We will start this chapter with a straightforward calculation, namely that of the solubilityof lead (II) iodide in water at 20 ◦C from the thermodynamic data in Appendix A.1. Fromthe free energies of formation, we first calculate the standard free energy change for thereaction
PbI2(s) → Pb2+(aq) + 2I−(aq)
at 25 ◦C: �rG◦298 = 45.89 kJ mol−1. The equilibrium constant for this reaction at 25 ◦C is
therefore K298 = 9.13 × 10⁻⁹. To find the equilibrium constant at 20 ◦C, we use Equation(8.11). This requires �rH
◦m, which we calculate from the standard enthalpies of formation,
yielding �rH◦m = 62.75 kJ mol−1. Thus, K293 = 5.93 × 10⁻⁹. According to the ideal solu-
tion theory we have been using, this equilibrium constant is related to the concentrationsby
K293 = [Pb2+]
c◦
([I−]
c◦
)2
Furthermore, if s = [Pb2+], then [I−] = 2s, where s is the solubility in mol L−1. Therefore
K293 = 4( s
c◦)3
.
Solving this equation for s, we get s293 = 1.14 × 10⁻³ mol L−1 or, using the molar massof PbI2 of 461.0 g mol−1, s293 = 0.526 g L−1. The experimental solubility at 20 ◦C is0.63 g L−1. Our calculation therefore gives too low a solubility, missing the correct valueby more than 15%. Why is this, if thermodynamics is supposed to be such an exact science?So far, we have assumed that all solutions behave ideally. They do not. We are going toneed a way to treat systems with non-ideal components. In this chapter, we will deal withone particularly important case in detail, namely that of electrolyte solutions, i.e. solutionscontaining ions. Because they contain charged particles which attract and repel, electrolytesolutions tend to deviate from ideal behavior at much lower concentrations than solutionsof uncharged molecules.
Before we do that, we need to develop some theory we can use to incorporate non-idealsubstances into thermodynamics.
185

P1: SFK Trim: 247mm × 174mm Top: 14.586mm Gutter: 23.198mm
CUUK1808-09 CUUK1808/Roussel 978 1 107 00678 2 October 29, 2011 13:16
186 Non-ideal behavior
9.1 Activity coefficients
We know how the activity depends on pressure, concentration or mole fraction for ideallybehaving substances and mixtures. All substances behave ideally when they are sufficientlydilute or, in the case of a solvent, when the solutes are sufficiently dilute. We therefore donot want to throw away what we have learned, but rather modify it for non-ideal systems.We do this by introducing an activity coefficient γi for each component of the system,which will multiply the ideal-substance activity expression in our corrected equations forthe activity. It is easiest to see what this means by example: suppose that component i is asolute in a solution. We will now write the activity as
ai = γi
ci
c◦
We recognize the activity of an ideal solute, ci/c◦, as a factor in this expression. Note that
since ai is dimensionless and the ratio ci/c◦ is also dimensionless, γi must itself have no
units. When ci is very small, the solution should behave ideally and thus γi → 1. As theconcentration increases and non-ideal effects become important, γi will start to deviatefrom unity. Depending on the substance and on the concentration range, γi may be greaterthan or less than unity, indicating, respectively, that the solute is either more or less activethan it would be at the same concentration if it behaved ideally. The same solute may in facthave an activity coefficient that is less than unity in some solutions and greater than unityin others. In general, the activity coefficient depends not only on the concentration of thesolute itself, but on the concentrations and identities of all other solutes in the solution and,for that matter, on the identity of the solvent. Thus, the activity coefficient of a potassiumion is different in a solution that only contains 1 mol L−1 of potassium chloride than it isin a solution that also contains 0.5 mol L−1 of sodium nitrate; the activity coefficient of apotassium ion in a 1 mol L−1 solution of potassium hydroxide in water would be differentthan the activity coefficient of the same ion in a 1 mol L−1 solution of KOH in ethanol andso on.
We could make similar comments about the activity coefficients of other phases ofmatter. Table 9.1 shows how the activity is constructed for a variety of substances and thelimits in which γi approaches unit magnitude. Note that in order to get ideal behavior, weshould also require other components (e.g. other solutes in solution) to be dilute; even atvery low concentrations of a solute i, γi may be very different from unity if there are othersolutes present at significant concentrations.
Ideal substances are ones in which intermolecular forces between molecules, excludinginteractions with the solvent, are negligible. With respect to the solvent, ideal behavioris obtained when the solutes are either present at extremely low concentrations such thatthey do not disrupt the overall solvent structure too much, or when the intermolecularforces between two solvent molecules are similar to the forces between solvent and solutemolecules. The activity coefficient therefore measures the extent to which intermolecularforces deviate from those that would act in an extremely dilute solution or mixture.

P1: SFK Trim: 247mm × 174mm Top: 14.586mm Gutter: 23.198mm
CUUK1808-09 CUUK1808/Roussel 978 1 107 00678 2 October 29, 2011 13:16
9.1 Activity coefficients 187
Table 9.1 Activities of some common substances.The final column of this table gives the limits inwhich we recover ideal behavior.
Substance type ai γi → 1 when
Gas γi
pi
p◦pi
p◦ → 0
Solvent γiXi Xi → 1
Solute γi
ci
c◦ci
c◦ → 0
Pure solid 1
If we want to measure an activity coefficient, what we need to do is to find a measur-able quantity that depends on this coefficient. For instance, suppose we want to measurethe activity coefficient of a solvent as a function of the concentration of a particular solute.We can use the vapor pressure of the solvent to measure its activity coefficient. Vaporpressure is related to the equilibrium l � g. For this process, at equilibrium, K = ag/al.Non-ideal behavior of gases is typically only observable at very high pressures. In mostsituations of interest in chemistry, it is therefore an excellent approximation to treat allgases as ideal. Certainly, vapor pressures are almost always small enough for the vapor tobehave ideally, so γg = 1. The equilibrium constant is known from experiments with thepure solvent: K = p•/p◦, where p• is the vapor pressure of the pure solvent. Therefore
p•
p◦ = p
p◦γlX
or
γl = p
p•X, (9.1)
where p is the vapor pressure and X is the mole fraction of the solvent. Measuring the vaporpressure as a function of mole fraction therefore tells us how the activity coefficient varieswith X for a certain type of solute. Note that Equation (9.1) involves a comparison betweenthe measured vapor pressure p and the vapor pressure we would predict from Raoult’s law(page 160), i.e. from ideal solution theory.
Example 9.1 Activity coefficient of water in a salt solution An aqueous solution contain-ing 1.641 mol kg−1 LiI, 7.384 mol kg−1 LiBr and 3.282 mol kg−1 LiCl has a vapor pressureof 2.27 kPa at 318.36 K. The vapor pressure of pure water at this temperature is 9.566 kPa.We want to calculate the activity coefficient of water in this solution.
We haven’t worked with molalities yet, although hopefully you have seen concentrationsexpressed in these units in your other courses. The molality is the number of moles ofsolute per kilogram of solvent. We’re going to use Equation (9.1) to calculate the activitycoefficient. We need the mole fraction of water. Imagine that we have a solution that contains

P1: SFK Trim: 247mm × 174mm Top: 14.586mm Gutter: 23.198mm
CUUK1808-09 CUUK1808/Roussel 978 1 107 00678 2 October 29, 2011 13:16
188 Non-ideal behavior
exactly 1 kg of water. This solution would also contain 1.641 mol of LiI, 7.384 mol of LiBrand 3.282 mol of LiCl. The mole fraction of water would therefore be calculated as follows:
nH2O = 1000 g
18.02 g mol−1 = 55.49 mol
XH2O = nH2O
nH2O + nLi+ + nI− + nBr− + nCl−
= nH2O
nH2O + 2nLiI + 2nLiBr + 2nLiCl
= 55.49 mol
55.49 + 2(1.641) + 2(7.384) + 2(3.282) mol= 0.6927
∴ γH2O = p
p•X= 2.27 kPa
(9.566 kPa)(0.6927)
= 0.343
This is a very non-ideal solution (γH2O is very different from unity).
Exercise group 9.1
(1) The freezing point of a 130.0 g kg−1 solution of ammonium chloride in water is−9.47 ◦C. What is the activity coefficient of water in this solution?
9.1.1 Physical interpretation of the activity coefficient
So far, an activity coefficient just measures the deviation from ideal behavior. It turns outhowever that the activity coefficient has a physical interpretation that is conceptually useful.To be specific, consider the case of a solute. The free energy of formation of a solute atconcentration ci can be written
�f Gm = �f G◦m + RT ln ai = �f G◦
m + RT ln(γi
ci
c◦)
= �f G◦m + RT ln
( ci
c◦)
+ RT ln γi
Now recall that the free energy is the reversible non-pV work. The free energy of formationwould be the reversible work required to create the solute in a solution at concentration ci
from the elements in their standard states. We can break down this work into three terms,corresponding to the three terms in the equation for �f Gm:
� �f G◦m is the work required to create the solute at standard concentration in an ideal
solution from the elements.� RT ln(ci/c
◦) is the work required to transfer the solute from an ideal solution at standardconcentration to an ideal solution at concentration ci . Recall that ideal solutions aredefined by a lack of solute–solute forces.

P1: SFK Trim: 247mm × 174mm Top: 14.586mm Gutter: 23.198mm
CUUK1808-09 CUUK1808/Roussel 978 1 107 00678 2 October 29, 2011 13:16
9.2 Electrolyte solutions 189
� RT ln γi is the work done against solute–solute forces in the transfer to a real solution.This work will clearly depend on the concentrations of all solutes in the solution.
We could repeat this analysis for any of the states of matter. The important point to noteis that RT ln γi has a clear physical interpretation as the extra work required to introducea substance into a particular environment, resulting from the intermolecular forces acting,excluding interactions with a solvent which are already accounted for in the standard freeenergy of formation.
9.2 Electrolyte solutions
An electrolyte is a compound that releases ions in solution. This category includes bothcompounds that dissociate completely when they dissolve (strong electrolytes), such asionic compounds, and those that dissociate only partially (weak electrolytes), such as weakacids. The reason that an electrolyte solution can’t generally be treated as ideal is thatthe energy contains significant electrostatic repulsion and attraction terms. These termscontribute to the internal energy and therefore, following the chain of definitions, to theenthalpy and free energy functions. Ideal solution theory does not take solute–solute forcesinto account. These forces will become more and more significant as the solution becomesmore concentrated. Also, since electrostatic potential energy depends on the product of thecharges involved, the corrections will be larger for solutions involving highly charged ions.
If we place charged particles in a solution, we do not obtain a random distribution ofsolutes. Rather, negative charges tend to stay closer to positive charges than they do to othernegatively charged solutes and vice versa. There are many molecules of solvent betweentwo typical ions of opposite charge. However, if we ignore the solvent molecules, thefollowing structure becomes apparent: we can think of each negative ion as being more orless surrounded by positive ions, each of which is also more or less surrounded by negativeions, and so on. Relative to any given ion, the solution has approximately the structureof an onion, with alternating shells of positive and negative charge. This arrangement ofions relative to any given ion is called an ionic atmosphere. Of course, due to diffusion,the precise positions of all the ions in solution are constantly changing, but as ions move,because of the electrostatic force, their ionic atmospheres tend to readjust. In a sense, anion drags along its ionic atmosphere as it moves through the solvent. Diffusion does mixthings up to some extent, and from time to time, two cations or two anions will meet, but ifyou could take snapshots of the environment of an ion in solution, you would find that itsnearest neighbors were oppositely charged most of the time.
The existence of ionic atmospheres means that an electrolyte solution is more organizedthan a non-electrolyte solution of similar total solute concentration. This in turn impliesthat, at moderate concentrations, removing an ion from a solution (through, e.g., a chemicalreaction) requires a rearrangement of the other ions to reform the ionic atmospheres ofthe remaining ions. The activity of an ion in a moderately concentrated solution, whichis a measure of its availability to participate in reactions, must therefore be lower than
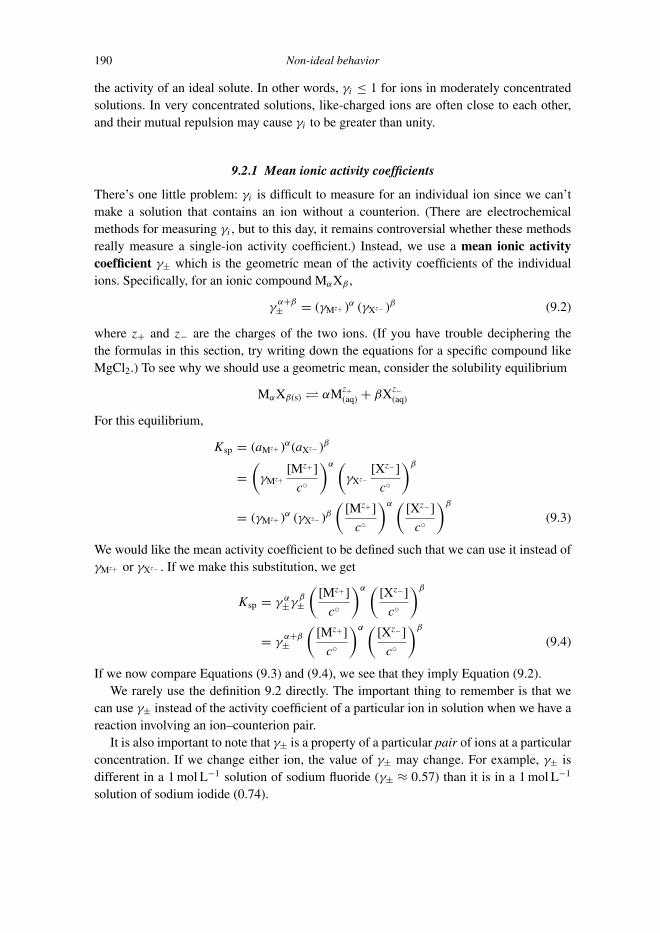
P1: SFK Trim: 247mm × 174mm Top: 14.586mm Gutter: 23.198mm
CUUK1808-09 CUUK1808/Roussel 978 1 107 00678 2 October 29, 2011 13:16
190 Non-ideal behavior
the activity of an ideal solute. In other words, γi ≤ 1 for ions in moderately concentratedsolutions. In very concentrated solutions, like-charged ions are often close to each other,and their mutual repulsion may cause γi to be greater than unity.
9.2.1 Mean ionic activity coefficients
There’s one little problem: γi is difficult to measure for an individual ion since we can’tmake a solution that contains an ion without a counterion. (There are electrochemicalmethods for measuring γi , but to this day, it remains controversial whether these methodsreally measure a single-ion activity coefficient.) Instead, we use a mean ionic activitycoefficient γ± which is the geometric mean of the activity coefficients of the individualions. Specifically, for an ionic compound MαXβ ,
γα+β± = (γMz+ )α (γXz− )β (9.2)
where z+ and z− are the charges of the two ions. (If you have trouble deciphering thethe formulas in this section, try writing down the equations for a specific compound likeMgCl2.) To see why we should use a geometric mean, consider the solubility equilibrium
MαXβ(s) � αMz+(aq) + βXz−
(aq)
For this equilibrium,
Ksp = (aMz+ )α(aXz− )β
=(
γMz+[Mz+]
c◦
)α (γXz−
[Xz−]
c◦
)β
= (γMz+ )α (γXz− )β(
[Mz+ ]
c◦
)α ( [Xz−]
c◦
)β
(9.3)
We would like the mean activity coefficient to be defined such that we can use it instead ofγMz+ or γXz− . If we make this substitution, we get
Ksp = γ α±γ
β±
([Mz+]
c◦
)α ( [Xz−]
c◦
)β
= γα+β±
([Mz+ ]
c◦
)α ( [Xz−]
c◦
)β
(9.4)
If we now compare Equations (9.3) and (9.4), we see that they imply Equation (9.2).We rarely use the definition 9.2 directly. The important thing to remember is that we
can use γ± instead of the activity coefficient of a particular ion in solution when we have areaction involving an ion–counterion pair.
It is also important to note that γ± is a property of a particular pair of ions at a particularconcentration. If we change either ion, the value of γ± may change. For example, γ± isdifferent in a 1 mol L−1 solution of sodium fluoride (γ± ≈ 0.57) than it is in a 1 mol L−1
solution of sodium iodide (0.74).

P1: SFK Trim: 247mm × 174mm Top: 14.586mm Gutter: 23.198mm
CUUK1808-09 CUUK1808/Roussel 978 1 107 00678 2 October 29, 2011 13:16
9.2 Electrolyte solutions 191
9.2.2 Ionic strength
We need another definition before we carry on. As you can imagine from the discussionso far, because highly charged ions are subject to stronger intermolecular forces than ionswith smaller charges, non-ideal effects will start to show up at lower concentrations for theformer than for the latter. Suppose, for example, that we have equimolar solutions of NaCland MgSO4. In the first solution, we have only singly charged ions so the potential energydue to ion–ion attractions and repulsions is proportional to the square of the elementarycharge. On the other hand, in the second solution, the ions are doubly charged so theelectrostatic energy terms are proportional to four times the square of the elementarycharge. We therefore expect the second solution to deviate much more significantly fromideality than the first. The ionic strength is a concentration measure that corrects for thefact that ions carrying larger charges experience larger intermolecular forces. It is definedas
Ic = 1
2
∑i
z2i ci (9.5)
where zi is the charge on ion i and ci is its molarity. The sum is taken over all ions in asolution, including any spectator ions. Spectator ions are often added to solutions to controlthe ionic strength since this turns out to be an important variable to hold constant in manyexperiments.
Example 9.2 The ionic strength of a 1 mol L−1 solution of sodium sulfate is
Ic = 1
2
(z2
Na+ [Na+] + z2SO2−
4[SO2−
4 ])
= 1
2
[(1)2(2 mol L−1) + (−2)2(1 mol L−1)
] = 3 mol L−1
9.2.3 Debye–Huckel theory
We will study here a theory for the activity coefficients of ions in dilute solutions known asthe Debye–Huckel limiting law. As the name implies, this theory appears as the low-ionic-strength limit of a more general theory which is, however, not that much more accuratethan the limiting law outside of the range where the limiting law applies. We will thereforefocus on the limiting law, although I will comment on more accurate theories later.
We won’t derive the Debye–Huckel limiting law. The derivation is long and, frankly,there are only one or two points in it that are really enlightening. The key ideas behindDebye–Huckel theory and its intellectual descendents can, however, be summarized. Recallthat RT ln γi is the work required to introduce a solute into a particular solution resultingfrom solute–solute forces. In the case of an electrolyte solution, the forces involved areelectrostatic forces. The technique used to calculate the work due to electrostatic forcesis to imagine that we initially create an uncharged solute, and then gradually charge it
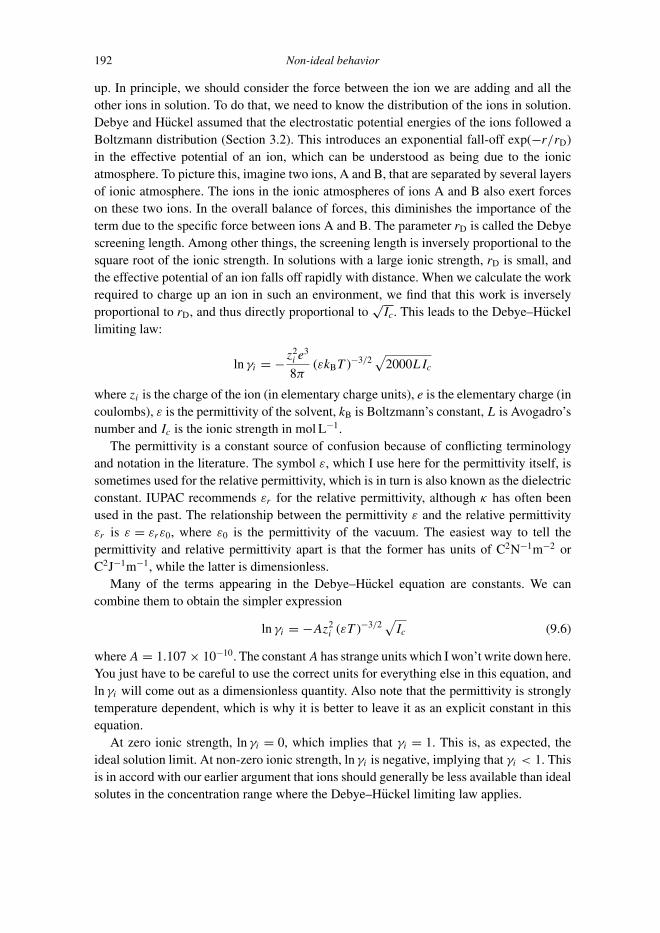
P1: SFK Trim: 247mm × 174mm Top: 14.586mm Gutter: 23.198mm
CUUK1808-09 CUUK1808/Roussel 978 1 107 00678 2 October 29, 2011 13:16
192 Non-ideal behavior
up. In principle, we should consider the force between the ion we are adding and all theother ions in solution. To do that, we need to know the distribution of the ions in solution.Debye and Huckel assumed that the electrostatic potential energies of the ions followed aBoltzmann distribution (Section 3.2). This introduces an exponential fall-off exp(−r/rD)in the effective potential of an ion, which can be understood as being due to the ionicatmosphere. To picture this, imagine two ions, A and B, that are separated by several layersof ionic atmosphere. The ions in the ionic atmospheres of ions A and B also exert forceson these two ions. In the overall balance of forces, this diminishes the importance of theterm due to the specific force between ions A and B. The parameter rD is called the Debyescreening length. Among other things, the screening length is inversely proportional to thesquare root of the ionic strength. In solutions with a large ionic strength, rD is small, andthe effective potential of an ion falls off rapidly with distance. When we calculate the workrequired to charge up an ion in such an environment, we find that this work is inverselyproportional to rD, and thus directly proportional to
√Ic. This leads to the Debye–Huckel
limiting law:
ln γi = −z2i e
3
8π(εkBT )−3/2
√2000LIc
where zi is the charge of the ion (in elementary charge units), e is the elementary charge (incoulombs), ε is the permittivity of the solvent, kB is Boltzmann’s constant, L is Avogadro’snumber and Ic is the ionic strength in mol L−1.
The permittivity is a constant source of confusion because of conflicting terminologyand notation in the literature. The symbol ε, which I use here for the permittivity itself, issometimes used for the relative permittivity, which is in turn is also known as the dielectricconstant. IUPAC recommends εr for the relative permittivity, although κ has often beenused in the past. The relationship between the permittivity ε and the relative permittivityεr is ε = εrε0, where ε0 is the permittivity of the vacuum. The easiest way to tell thepermittivity and relative permittivity apart is that the former has units of C2N−1m−2 orC2J−1m−1, while the latter is dimensionless.
Many of the terms appearing in the Debye–Huckel equation are constants. We cancombine them to obtain the simpler expression
ln γi = −Az2i (εT )−3/2
√Ic (9.6)
where A = 1.107 × 10⁻¹⁰. The constant A has strange units which I won’t write down here.You just have to be careful to use the correct units for everything else in this equation, andln γi will come out as a dimensionless quantity. Also note that the permittivity is stronglytemperature dependent, which is why it is better to leave it as an explicit constant in thisequation.
At zero ionic strength, ln γi = 0, which implies that γi = 1. This is, as expected, theideal solution limit. At non-zero ionic strength, ln γi is negative, implying that γi < 1. Thisis in accord with our earlier argument that ions should generally be less available than idealsolutes in the concentration range where the Debye–Huckel limiting law applies.

P1: SFK Trim: 247mm × 174mm Top: 14.586mm Gutter: 23.198mm
CUUK1808-09 CUUK1808/Roussel 978 1 107 00678 2 October 29, 2011 13:16
9.2 Electrolyte solutions 193
Debye–Huckel theory has been experimentally confirmed to work extremely well forvery dilute solutions. However, significant deviations are observed when the ionic strengthis greater than about 0.01 mol L−1. Thus, it gives us a good first approximation for dilutesolutions, but it cannot be applied in high-ionic-strength solutions.
Equation (9.6) will be useful when we are studying reactions in which there are com-binations of ions that cannot be thought of as a binary compound. In the opposite case,when ions appear in combinations that do correspond to a binary compound (H+ and F−,Pb2+ and 2I−, etc.), we prefer to use mean ionic activity coefficients for simplicity. Wepreviously worked out an equation for the mean ionic activity coefficient of the generalionic compound MαXβ . Taking a natural logarithm of Equation (9.2), we get
(α + β) ln γ± = α ln (γMz+ ) + β ln (γXz− )
If we now use Equation (9.6) for the activity coefficients of each ion and collect like terms,we get
(α + β) ln γ± = −A(εT )−3/2√
Ic
(αz2
+ + βz2−)
(9.7)
Since we must have charge neutrality,
αz+ + βz− = 0
If we use this equation to eliminate (e.g.) β from Equation (9.7), we get the following, aftera lot of rearrangements and simplifications:
ln γ± = Az+z−(εT )−3/2√
Ic (9.8)
Because the ions in an ion–counterion pair are oppositely charged, we see that ln γ± isnegative, as we expect.
In the following example, we calculate the mean ionic activity coefficient of an ionicsolute.
Example 9.3 For a solution of 5 mmol L−1 Fe(NO3)2 in water at 25 ◦C,
Ic = 1
2
((2)2(5) + (−1)2(10 mmol L−1)
) = 15 mmol L−1
This is just beyond the range of applicability of Debye–Huckel theory, so the meanactivity coefficient obtained will only be approximately correct. At 25 ◦C, the relativepermittivity of water is 78.37, so the permittivity is ε = εrε0 = 78.37(8.854 187 817 ×10−12 C2J−1m−1) = 6.939 × 10⁻¹⁰ C2J−1m−1.
ln γ± = (1.107 × 10⁻¹⁰)(2)(−1)[(6.939 × 10⁻¹⁰ C2N−1m−2)(298.15 K)
]−3/2
×√
15 × 10−3 mol L−1
= −0.288
∴ γ± = 0.750

P1: SFK Trim: 247mm × 174mm Top: 14.586mm Gutter: 23.198mm
CUUK1808-09 CUUK1808/Roussel 978 1 107 00678 2 October 29, 2011 13:16
194 Non-ideal behavior
Once we know how to calculate ionic activity coefficients, we can calculate quantitiesthat depend on the activity of an ion, as the following examples demonstrate.
Example 9.4 The solubility of barium sulfate in water at 298 K is 1.05 × 10⁻⁵ mol L−1.Solubility refers to the reaction
BaSO4(s) � Ba2+(aq) + SO2−
4(aq)
This means that the ionic strength is
Ic = 1
2[22(1.05 × 10⁻⁵) + (−2)2(1.05 × 10⁻⁵)] = 4.20 × 10⁻⁵ mol L−1
We can now compute γ± from the ionic strength:
ln γ± = (1.107 × 10⁻¹⁰)(2)(−2)[(6.939 × 10⁻¹⁰ C2N−1m−2)(298 K)
]−3/2
×√
4.20 × 10⁻⁵ mol L−1
= −0.0305
∴ γ± = 0.970
Knowing this, we can compute Ksp:
Ksp = γ 2±s2 = (0.970)2(1.05 × 10⁻⁵)2 = 1.04 × 10⁻¹⁰
This in turn allows us to compute the standard free energy change for this reaction:
�rG◦m = −RT ln Ksp = 57.0 kJ mol−1
If, in addition, we know the standard free energies of formation of the aqueous barium andsulfate ions, we can calculate the standard free energy of formation of solid barium sulfate:
�rG◦m = �f G◦(Ba2+, aq) + �f G◦(SO4
2−, aq) − �f G◦(BaSO4)
∴ �f G◦(BaSO4) = �f G◦(Ba2+, aq) + �f G◦(SO42−, aq) − �rG
◦m
= −560.7 + (−743.6) − 57.0 kJ/mol = −1361.3 kJ mol−1
This number is within 0.7 kJ mol−1 of the accepted value.
The fact that γi (or γ±) decreases with increasing ionic strength, at least for small tomoderate ionic strengths, is responsible for the salting in effect: the solubility of ioniccompounds tends to increase with increasing ionic strength, provided the ionic strength isnot too high.
Example 9.5 Suppose that we want to do an accurate calculation of the pH of a0.001 mol L−1 sodium hydroxide solution at 298 K. The ionic strength of this solutionis
Ic = 1
2
[(−1)2(0.001) + (1)2(0.001)
] = 0.001 mol L−1

P1: SFK Trim: 247mm × 174mm Top: 14.586mm Gutter: 23.198mm
CUUK1808-09 CUUK1808/Roussel 978 1 107 00678 2 October 29, 2011 13:16
9.2 Electrolyte solutions 195
The mean activity coefficient of the hydroxide ions is calculated by
ln γ± = (1.107 × 10⁻¹⁰)(1)(−1)[(6.939 × 10⁻¹⁰ C2N−1m−2)(298 K)
]−3/2
×√
0.001 mol L−1
= −0.0372
∴ γ± = 0.963
The activity of the hydroxide ions is therefore
aOH− = γ±cOH−/c◦ = 9.63 × 10⁻⁴
Using Kw = 10−14 = aH+aOH− we get aH+ = 1.038 × 10⁻¹¹ or a pH of 10.98. Because thepH scale is a logarithmic scale, the difference in pH from what we would calculate usingideal solution theory is not very large in this case.
Exercise group 9.2
(1) Taking non-ideal effects into account, what is the pH of a 0.0058 mol L−1 aqueoussolution of HCl at 25 ◦C?
(2) The solubility of barium fluoride in water at 25 ◦C is 6.8 × 10⁻³ mol L−1. Using Debye–Huckel theory, calculate the solubility product of this compound.
(3) Uric acid is a diprotic acid. The first acid dissociation constant of uric acid has beenmeasured as a function of temperature in a solution to which NaCl had been added tomaintain a constant ionic strength of 0.15 mol L−1:1
T/◦C 25 32 37 42Ka/10−6 5.50 6.17 6.46 7.41
The calculations used by the authors of this paper to obtain the equilibrium constantsgiven above assumed ideal behavior. Note that the dissociation of the second proton isnot relevant to us here.(a) Activity coefficients of ions vary weakly with temperature. Using this piece of
information, explain why we should be able to get �rH◦m accurately from these
data without considering corrections for non-ideal behavior.Hint: Think about using just two of the above points. What formula would youuse?
(b) Calculate �rH◦m using all the data.
(c) Once we get outside of the range of applicability of the Debye–Huckel limiting law,the mean ionic activity coefficients depend mostly on the charges of the ions and ontheir sizes. The size dependence is a little less strong than the charge dependence,although we always have to be careful with the hydrogen ion. Tables of mean ionic
1 Wang and Konigsberger, Thermochim. Acta 310, 237 (1998).

P1: SFK Trim: 247mm × 174mm Top: 14.586mm Gutter: 23.198mm
CUUK1808-09 CUUK1808/Roussel 978 1 107 00678 2 October 29, 2011 13:16
196 Non-ideal behavior
activity coefficients are available for many common acids, for instance in the CRCHandbook of Chemistry and Physics. We can approximate the mean ionic activitycoefficient of dissociated uric acid (i.e. of an H+/hydrogen urate ion pair) usingthe mean ionic activity coefficient of HNO3. The nitrate ion is a little smaller thanthe hydrogen urate ion, but the two are planar and have similar hydrogen-bondingpatterns in water. The mean activity coefficient of nitric acid has been measured andhas the value γ± = 0.773 at an ionic strength of 0.15 mol L−1 at 25 ◦C. Assumingthat uric acid itself behaves ideally, correct the measured value of Ka at 25 ◦C forthe non-ideal behavior of H+ and of the hydrogen urate ion.
(d) Calculate �rG◦m at 25 ◦C for the acid dissociation equilibrium.
(e) What value of �rG◦m would you have calculated if we had not taken the non-ideal
behavior of uric acid into account?
9.3 The solubility of ionic compounds in aqueous solution
The method for calculating the solubility of ionic compounds is best described by example.Suppose that we want to calculate the solubility of PbI2 in water at 293 K, just as we setout to do in the opening of this chapter. The reaction of interest is
PbI2(s) → Pb2+(aq) + 2I−(aq)
The equilibrium constant for this reaction is
Ksp = aPb2+ (aI− )2 =(
γ±[Pb2+]
c◦
)(γ±
[I−]
c◦
)2
= γ 3±
([Pb2+]
c◦
)([I−]
c◦
)2
= 4γ 3±( s
c◦)3
(9.9)
To get this equation, we used [Pb2+] = s and [I−] = 2s, where s is the solubility of the salt.We calculated Ksp at 20 ◦C on page 185 and found Ksp = 5.93 × 10⁻⁹.
If we want to calculate the solubility, we need to know γ±. However, this depends onthe ionic strength, which depends on the concentrations of lead and iodide ions, whichin turn depends on the solubility. Your first impression might be that we’re stuck. Theseequations can be solved by iteration, which is to say that you take a guess at the value ofγ± (e.g. γ± = 1), then use that to calculate s, then calculate the ionic strength and γ± froms, then repeat the process using the improved estimate of γ± until the answer converges tothe desired number of decimal places. This works well, and is still useful in some cases,but most of us have better technology at our disposal now, since most modern scientificcalculators have a numerical equation solver, as do most numerically oriented computerprograms, including spreadsheets like Excel. The trick is to reduce our equations to asingle equation in one unknown, preferably the solubility s, although in a spreadsheet youwouldn’t even have to do that. We start by writing the ionic strength in terms of s:
Ic = 1
2
[(2)2[Pb2+] + (−1)2[I−]
] = 1
2(4s + 2s) = 3s

P1: SFK Trim: 247mm × 174mm Top: 14.586mm Gutter: 23.198mm
CUUK1808-09 CUUK1808/Roussel 978 1 107 00678 2 October 29, 2011 13:16
9.3 The solubility of ionic compounds in aqueous solution 197
We can now express the mean ionic activity coefficient in terms of s: at 20 ◦C, the relativepermittivity of water is 80.18, so the permittivity is ε = εrε0 = 80.18(8.854 187 817 ×10−12 C2J−1m−1) = 7.099 × 10⁻¹⁰ C2J−1m−1. Thus,
γ± = exp
{(1.107 × 10⁻¹⁰)(2)(−1)[
(7.099 × 10⁻¹⁰ C2J−1m−1)(293.15 K)]3/2
√3s
}
= exp(−4.039√
s). (9.10)
We can isolate s from Equation (9.9):
s = 1.14 × 10⁻³ mol L−1
γ±. (9.11)
Now substitute Equation (9.10) into Equation (9.11) and rearrange to the form
s − 1.14 × 10⁻³ mol/L
exp(−4.025√
s)= 0
We now have an equation involving only the unknown s. It’s time to go to our calculator.The exact instructions will depend on the calculator model, but roughly you will have to dothe following: Enter the above equation in your equation solver. Your calculator will alsoneed an initial guess for s. In this case, we have a very good place to start: the ideal solutionvalue, which we get by setting γ± = 1, i.e. s = 1.14 × 10⁻³. If you now run the equationsolver, you will get s = 1.32 × 10⁻³ mol L−1, or 0.61 g L−1. This value is in excellentagreement with the experimental value of 0.63 g L−1.
Example 9.6 We can try to use the same reasoning to calculate the solubility of bariumcarbonate at 20 ◦C. The reaction is
BaCO3(s) → Ba2+(aq) + CO2−
3(aq)
You should verify the following data and equations for this reaction:
�rG◦298 = 49 kJ mol−1
�rH◦m = 3.2 kJ mol−1
K298 = 2.6 × 10⁻⁹
K293 = 2.5 × 10⁻⁹
Ic = 4s
s = 5.0 × 10⁻⁵/γ±γ± = exp(−9.328
√s)
If we solve these equations for s, we get s = 5.35 × 10⁻⁵ mol L−1. The experimental valueof the solubility is 1.0 × 10⁻⁴ mol L−1, so our final answer is off by a factor of almost 2.What went wrong? It’s not the Debye–Huckel theory, which works perfectly well in thisrange of ionic strengths. The problem is that we have neglected some important chemistry,

P1: SFK Trim: 247mm × 174mm Top: 14.586mm Gutter: 23.198mm
CUUK1808-09 CUUK1808/Roussel 978 1 107 00678 2 October 29, 2011 13:16
198 Non-ideal behavior
namely the reaction of the carbonate ion with water:
CO2−3(aq) + H2O(l) � HCO−
3(aq) + OH−(aq)
Since this reaction removes carbonate ions from solution, by Le Chatelier’s principle, thiswill increase the solubility of barium carbonate. If we do a (much more complex) calculationtaking this last reaction into account, we again get essentially quantitative agreement withthe experimental value.
Solubility problems are notorious for giving the wrong answer when solved naively, aswe did in the previous example. Aqueous chemistry is complicated, and ions often enterinto multiple equilibria, including acid–base equilibria like the one in our last example, andcomplex ion formation. The lesson is this: if you don’t get the chemistry right, it doesn’tmatter how sophisticated your theory of non-ideal solutions is, you’ll still get the wronganswer.
Exercise group 9.3
(1) Acetic acid (CH3COOH) has an acid dissociation constant of 1.75 × 10⁻⁵ at 298 K.(a) Calculate the pH of a 0.1 mol L−1 solution of acetic acid in water.(b) Calculate the concentration of acetate ions in this solution. Do a full Debye–Huckel
calculation.Hints: Treat the acetic acid as ideally behaving. The method is analogous to thatused to compute solubilities.
(2) The solubility product of silver iodide (AgI) is only 8 × 10⁻¹⁷ at 298 K. This is tiny,so it is not generally necessary to use Debye–Huckel theory to compute the solubilityof this compound. However, if other ions are present, they affect the ionic strength andso change the solubility. Compare the solubility of silver iodide in pure water to itssolubility in a 0.008 mol L−1 solution of sodium nitrate (NaNO3) in water.Notes: All sodium and nitrate salts are extremely soluble.
(3) The acid dissociation constant of hydrofluoric acid is 6.6 × 10⁻⁴ at 25 ◦C.(a) Calculate the standard free energy of formation of aqueous HF.(b) Using Debye–Huckel theory, calculate the concentrations of the H+ and F− ions
in a 0.10 mol L−1 aqueous solution of HF. Assume a unit activity coefficient formolecular HF.
(c) Calculate the pH of the above solution.
9.4 Beyond the limiting law
What do we do if Debye–Huckel theory isn’t good enough? After all, 0.01 mol L−1 is a verysmall ionic strength. The first thing that causes Debye–Huckel theory to break down is that,as the solution becomes more concentrated, we need to take into account the fact that ionsoccupy space. This introduces an extra factor of (1 + R/rD)−1 in the activity coefficient,
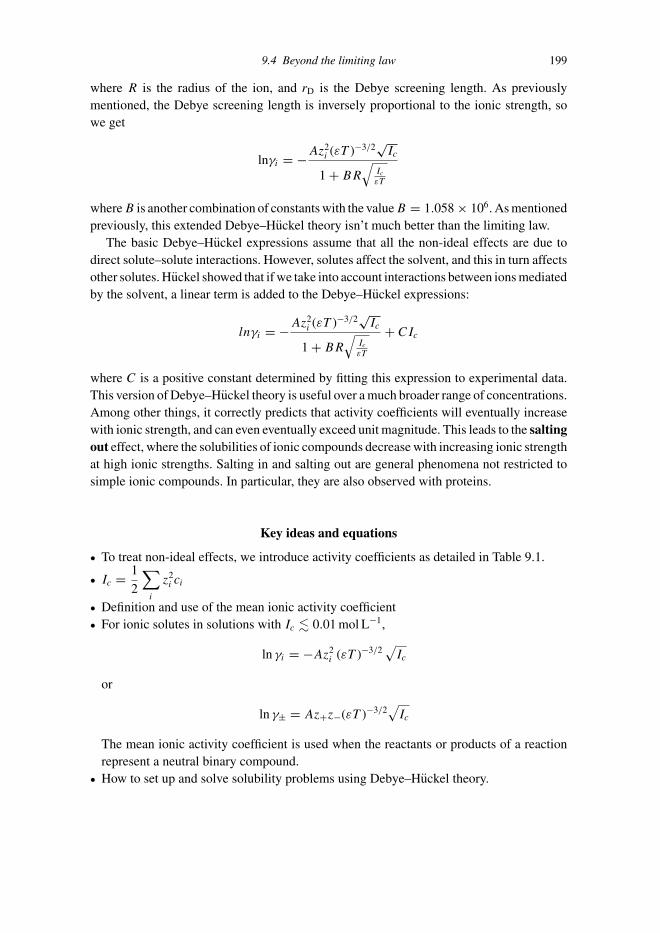
P1: SFK Trim: 247mm × 174mm Top: 14.586mm Gutter: 23.198mm
CUUK1808-09 CUUK1808/Roussel 978 1 107 00678 2 October 29, 2011 13:16
9.4 Beyond the limiting law 199
where R is the radius of the ion, and rD is the Debye screening length. As previouslymentioned, the Debye screening length is inversely proportional to the ionic strength, sowe get
lnγi = −Az2i (εT )−3/2
√Ic
1 + BR
√Ic
εT
where B is another combination of constants with the value B = 1.058 × 10⁶. As mentionedpreviously, this extended Debye–Huckel theory isn’t much better than the limiting law.
The basic Debye–Huckel expressions assume that all the non-ideal effects are due todirect solute–solute interactions. However, solutes affect the solvent, and this in turn affectsother solutes. Huckel showed that if we take into account interactions between ions mediatedby the solvent, a linear term is added to the Debye–Huckel expressions:
lnγi = −Az2i (εT )−3/2
√Ic
1 + BR
√Ic
εT
+ CIc
where C is a positive constant determined by fitting this expression to experimental data.This version of Debye–Huckel theory is useful over a much broader range of concentrations.Among other things, it correctly predicts that activity coefficients will eventually increasewith ionic strength, and can even eventually exceed unit magnitude. This leads to the saltingout effect, where the solubilities of ionic compounds decrease with increasing ionic strengthat high ionic strengths. Salting in and salting out are general phenomena not restricted tosimple ionic compounds. In particular, they are also observed with proteins.
Key ideas and equations
� To treat non-ideal effects, we introduce activity coefficients as detailed in Table 9.1.
� Ic = 1
2
∑i
z2i ci
� Definition and use of the mean ionic activity coefficient� For ionic solutes in solutions with Ic � 0.01 mol L−1,
ln γi = −Az2i (εT )−3/2
√Ic
or
ln γ± = Az+z−(εT )−3/2√
Ic
The mean ionic activity coefficient is used when the reactants or products of a reactionrepresent a neutral binary compound.
� How to set up and solve solubility problems using Debye–Huckel theory.

P1: SFK Trim: 247mm × 174mm Top: 14.586mm Gutter: 23.198mm
CUUK1808-09 CUUK1808/Roussel 978 1 107 00678 2 October 29, 2011 13:16
200 Non-ideal behavior
Suggested reading
Size matters. In crowded environments, such as the inside of a cell, non-ideal behaviorcorrelates to size of the molecule. The activity coefficients in these cases can be huge,with γi for large molecules in the cell often reaching values in excess of 10, and possi-bly as high as 102. These effects have been discussed by Minton in the following shortreview:
Alex P. Minton, J. Biol. Chem. 276, 10577 (2001).
Many molecules of biological interest are charged, including many biological macro-molecules. Modern refinements of Debye–Huckel theory have been reviewed by Pitzer:
Kenneth S. Pitzer, Acc. Chem. Res. 10, 371–377 (1977).
For a review of electrostatic effects on the free energy of biological macromolecules,although not one phrased in terms of activity coefficients, see:
Jianzhong Wu and Dimitrios Morikis, Fluid Phase Equilib. 241, 317–333 (2006).
Review exercise group 9.4
(1) Tris [short for tris(hydroxymethyl)aminomethane] is a base that is used to make buffersolutions, especially in biochemistry. A solution is made that contains 5.2 mmol L−1 oftris and 8.0 mmol L−1 of sodium chloride. The Kb of tris at 25 ◦C is 1.1 × 10⁻⁶.(a) What is the concentration of the acid form of tris in this solution at 25 ◦C? Use
Debye–Huckel theory to answer this question, and assume that the base has anactivity coefficient of unity.
(b) What is the pH of this solution?(2) The inside of a cell is sometimes described as a gel. The cytoplasm is crowded with
proteins and other macromolecules, which increases the viscosity of the solution andreduces the volume available for solutes. Crowding tends to result in large activitycoefficients for macromolecules. These effects can be simulated in vitro by dissolvingpolymers in a solvent along with the molecule(s) of interest. Minton has calculatedthe dependence of the activity coefficient on the molar mass of a spherical protein ina solution of the polymer dextran in which the dextran occupies 3% of the total vol-ume.2 For a 100 000 g mol−1 (biochemists would say dalton, abbreviated Da) protein,the activity coefficient in this particular solution is 2.7, while for a 200 000 g mol−1
protein, it is 4.2. Suppose that we have a protein of molar mass 100 000 g mol−1 thatassociates into a dimer with an equilibrium constant, measured in dilute solution, of5 × 105.
2 A. P. Minton, J. Biol. Chem. 276, 10577 (2001).

P1: SFK Trim: 247mm × 174mm Top: 14.586mm Gutter: 23.198mm
CUUK1808-09 CUUK1808/Roussel 978 1 107 00678 2 October 29, 2011 13:16
9.4 Beyond the limiting law 201
(a) Calculate the concentrations of the protein and of its dimer in an aqueous solutionwith a protein concentration of 0.203 g L−1, neglecting non-ideal effects.
(b) Calculate the concentrations of the protein and of its dimer in the dextran solutiondescribed above with 0.203 g L−1 of protein. Assume that the protein and its dimerare both roughly spherical so that you can use Minton’s estimates of the activitycoefficients.

P1: SFK Trim: 247mm × 174mm Top: 14.586mm Gutter: 23.198mm
CUUK1808-10 CUUK1808/Roussel 978 1 107 00678 2 October 29, 2011 13:19
10
Electrochemistry
I have to admit that I wasn’t fond of electrochemistry when I was a student. It has sincegrown on me. Looking back, I think that I was told too much in my first exposure to thesubject. Electrochemistry is a fussy science, with all kinds of complications that can makeit difficult to obtain reproducible data from experiments. If your professors tell you aboutall these complications up front, then it becomes difficult to appreciate the utility of thesubject. You just lose track of the big picture in a haze of contact potentials and transferencenumbers. That being said, it’s possible to go too far the other way and to leave out importantdetails you ought to know about when studying electrochemistry. I’m going to try to steera middle course, one that emphasizes that electrochemistry is one of the key ways to getthermodynamic data, but also one that points out some of the things you need to think aboutwhen you do electrochemistry. Hopefully, you’ll come through this experience with moreenthusiasm for electrochemistry than I had when I was in your place.
10.1 Free energy and electromotive force
In several of the problems in Chapter 7, we used the fact that the maximum electricalwork can be calculated from the Gibbs free energy, the latter representing the maximum(reversible) non-pV work. Electrochemical cells convert chemical into electrical energy,or vice versa. In this section, we will develop a relationship between free energy and theelectromotive force (emf), also known as the reversible voltage or electric potential, whichis the voltage generated by a cell under reversible conditions. This will lead us to thefundamental equation of electrochemistry.
We first note that measuring the electromotive force generated by a cell is easy; reversibil-ity implies equilibrium. If we use a calibrated voltage source and set it to oppose our cell,the electromotive force is just the voltage produced by the calibrated source when the twoare exactly balanced such that no current flows. In practice, especially for work requiringless precision, we measure the emf using a voltmeter. A voltmeter measures the currentpassing through a large resistance, so it’s not really making an equilibrium measurement.However, a good quality voltmeter uses a very large resistance, so the current is very small,which gives us a near-reversible measurement.
202

P1: SFK Trim: 247mm × 174mm Top: 14.586mm Gutter: 23.198mm
CUUK1808-10 CUUK1808/Roussel 978 1 107 00678 2 October 29, 2011 13:19
10.1 Free energy and electromotive force 203
The electrical work performed when a charge q moves through an electric potentialdifference E is
w = qE
Therefore, under reversible conditions (where E is the emf) at constant pressure andtemperature,
�G = wrev = qE
This is not the most convenient form of the relationship between �G and E. Chemistsnormally count units of matter in moles, and charge in electrical circuits is normally carriedby electrons. Therefore write
�G = −nFE (10.1)
where n is the number of moles of electrons and F is the charge of a mole of electrons, aquantity referred to as Faraday’s constant. The negative sign comes from the fact that q isnegative for electrons. Note that E = −�G/(nF ) is an intensive property, unlike G whichis an extensive property. When the electrons come from a chemical reaction, we can divideEquation (10.1) by the number of moles of product formed, and we get
�rGm = −νeFE
where νe is the number of electrons exchanged per reaction, i.e. the stoichiometric coefficientof the electrons in a redox reaction. We will see how to identify νe a little later. Right now,recall that thermodynamically allowed reactions are those for which �rGm < 0. Therefore,the emf E will be positive for a thermodynamically allowed process.
Since the electromotive force is directly proportional to �G, everything we know about�G can be transferred to this quantity. For instance,
�rGm = �rG◦m + RT ln Q = −νeFE
If we divide this equation by −νeF , we get
E = −�rG◦m
νeF− RT
νeFln Q
Define the standard emf E◦ by
E◦ = −�rG◦m
νeF
and conclude that
E = E◦ − RT
νeFln Q (10.2)
This is the Nernst equation, the central equation of electrochemistry. It tells us how theelectromotive force varies with the activities of the reactants and products of a reaction.

P1: SFK Trim: 247mm × 174mm Top: 14.586mm Gutter: 23.198mm
CUUK1808-10 CUUK1808/Roussel 978 1 107 00678 2 October 29, 2011 13:19
204 Electrochemistry
10.2 Reduction and oxidation
The reason that it is fruitful to talk of an electric potential or emf in relation to chemicalthermodynamics is that many reactions can be separated into two subreactions, called half-reactions, one in which electrons are used and one in which electrons are produced. Whena substance gains electrons we say that it is reduced (GER: gain of electrons = reduction).When a chemical species loses electrons, it is oxidized (LEO: loss of electrons = oxidation).A substance that can oxidize another is an oxidizing agent and one that can reduce anotheris a reducing agent. Because an oxidizing agent causes another substance to lose electrons,it must be accepting electrons itself and therefore be reduced. A mirror-image statementcan be written for reducing agents.
For example, consider the reaction of oxygen and iron to form rust, iron(III) oxide:
2Fe(s) + 3
2O2(g) → Fe2O3(s)
We can separate the overall reaction into the half-reactions
2Fe(s) + 3H2O(l) → Fe2O3(s) + 6H+(aq) + 6e−
and
3
2O2(g) + 6H+
(aq) + 6e− → 3H2O(l)
where e− represents an electron. Iron has been oxidized and oxygen has been reduced inthe process. The stoichiometric coefficient of the electrons which appears in the Nernstequation, νe, can be determined from the half-reactions. In this case, νe = 6.
You may wonder how the half-reactions given above for the oxidation of iron wereobtained. Especially in solution, balancing redox (reduction–oxidation) reactions can betricky. There are many methods available, of which one is presented here. The methodconsists of a set of steps you must carry out in the correct order:
(1) Identify the atoms other than oxygen and hydrogen participating in the reaction. Typ-ically, there are only a few. Separate the reaction into half-reactions based on thenon-oxygen and non-hydrogen atoms. The main rule of thumb here is that you haveto set it up so that eventually you will be able to balance the non-oxygen and non-hydrogen atoms. There are a few small exceptions to this rule, in reactions involvingmolecular oxygen and/or molecular hydrogen. In these cases, one of the half-reactionsmay involve O2 or H2.
(2) Balance each half-reaction for all atoms except O and H.(3) Balance each half-reaction for O by adding H2O(l) as appropriate.(4) Balance each half-reaction for H by adding H+
(aq) as appropriate. At this point, yourreactions should be balanced for all atoms, but not for charge. Check that they areproperly balanced for the atoms.

P1: SFK Trim: 247mm × 174mm Top: 14.586mm Gutter: 23.198mm
CUUK1808-10 CUUK1808/Roussel 978 1 107 00678 2 October 29, 2011 13:19
10.2 Reduction and oxidation 205
(5) Balance each half-reaction for charge by adding electrons as appropriate. At this point,one of the half-reactions should have electrons on the reactant side and the other on theproduct side. If this is not the case, something went wrong earlier. Go back and checkyour work.
(6) You now want to prepare to add the half-reactions. When you are done, you shouldn’thave any electrons left. If necessary, multiply one or both half-reactions by appropriatefactors such that the number of electrons in each half-reaction is the same. Thiscommon number of electrons is νe. Add the results. This reaction is balanced for acidicconditions.
(7) If the reaction occurs in neutral medium, there are (at least initially) no excess protonsin solution, so it is OK to have H+ as a product, but not as a reactant. If the reactionoccurs in basic medium, there shouldn’t be any H+ in the overall reaction. If you haveprotons on either side of a reaction in basic medium, or if you have protons on thereactant side of a reaction in neutral medium, add an equal number of OH−
(aq) to eachside of the reaction to “neutralize” excess H+, converting the latter to H2O(l).
Example 10.1 Balancing redox reactions in acid Acidified solutions of Na2Cr2O7 andof KBr are mixed. The two react, forming Br2 and Cr3+. We first focus on the bromine andchromium atoms, separating and balancing the half-reactions with respect to these atoms:
Cr2O2−7 → 2Cr3+
2Br− → Br2
We balance for oxygen by adding water molecules as appropriate:
Cr2O2−7 → 2Cr3+ + 7H2O
2Br− → Br2
We next balance for hydrogen by adding H+ ions:
Cr2O2−7 + 14H+ → 2Cr3+ + 7H2O
2Br− → Br2
Balance for charge by adding electrons:
Cr2O2−7 + 14H+ + 6e− → 2Cr3+ + 7H2O
2Br− → Br2 + 2e−
Finally, arrange for the electrons to cancel by multiplying the second half-reaction by 3(such that νe = 6), and add:
Cr2O2−7 + 14H+ + 6Br− → 2Cr3+ + 7H2O + 3Br2.
Since the reaction occurs in acidic medium, we’re done.
Example 10.2 Neutralizing hydrogen ions in redox balancing If the reaction of the lastexample had occurred in a neutral (or basic) environment, there would not have been many

P1: SFK Trim: 247mm × 174mm Top: 14.586mm Gutter: 23.198mm
CUUK1808-10 CUUK1808/Roussel 978 1 107 00678 2 October 29, 2011 13:19
206 Electrochemistry
protons available to participate in the reaction. In these cases, add a sufficient number ofhydroxide ions to each side to convert all the protons appearing to water and obtain, aftercancellation of excess water molecules,
Cr2O2−7 + 7H2O + 6Br− → 2Cr3+ + 14OH− + 3Br2
Exercise group 10.1
(1) Carbon dioxide reacts with calcium metal in a basic aqueous environment to produceethanedioate ions (a.k.a. oxalate, C2O2−
4 ) and calcium ions. Balance the reaction.(2) Permanganate (MnO−
4 ) reacts with sulfur dioxide (SO2) to form manganese(II) ionsand HSO−
4 in acidic solution. Balance the reaction.(3) Solid bismuth(III) hydroxide (Bi(OH)3) reacts with the SnO2−
2 anion to form SnO2−3
and metallic bismuth in basic solution. Balance the reaction.(4) Pyruvate ions (C3H3O−
3 ) react with glucose (C6H12O6) to form lactate (C3H5O−3 ) and
gluconate (C6H11O−7 ) ions. The unbalanced half-reactions are C3H3O−
3 → C3H5O−3
and C6H12O6 → C6H11O−7 . The reaction medium is slightly acidic. Balance the
reaction.
10.3 Voltaic cells
If we allow the different species in a redox reaction to freely intermix, it will proveimpossible to harness their free energy to derive electrical work. In order to produceelectricity, it is necessary to separate the reduction and oxidation half-reactions. This isdone by building a voltaic cell, a cell that converts free energy into electricity. Althoughthere are many different designs of voltaic cells, every one has three essential components:
(1) spatial separation between the two half-reactions;(2) a conductive connection that allows electrons to flow between the electrodes and(3) a means for electrical neutrality to be maintained in all parts of the system.
In one half-cell, oxidation occurs. The electrons generated by the oxidation reactionare carried by the conductive connection to the other half-cell where reduction (gain ofelectrons) occurs. This would normally lead to accumulation of negative charge in thereduction half-cell counteracting the normal tendency for current to flow, hence the needfor a mechanism to maintain electrical neutrality. For example, consider the reaction
Zn(s) + Cu2+(aq) → Cu(s) + Zn2+
(aq)
If we just put a piece of solid zinc into a copper(II) solution, this spontaneous reactionoccurs without any possibility of extracting work from it. Instead, we put together anapparatus like the one shown in Figure 10.1. We have two beakers. In one, we place asolid zinc electrode bathing in a zinc sulfate solution. In the other, we place a solid copperelectrode in a copper(II) sulfate solution. We connect the two electrodes by an electrical
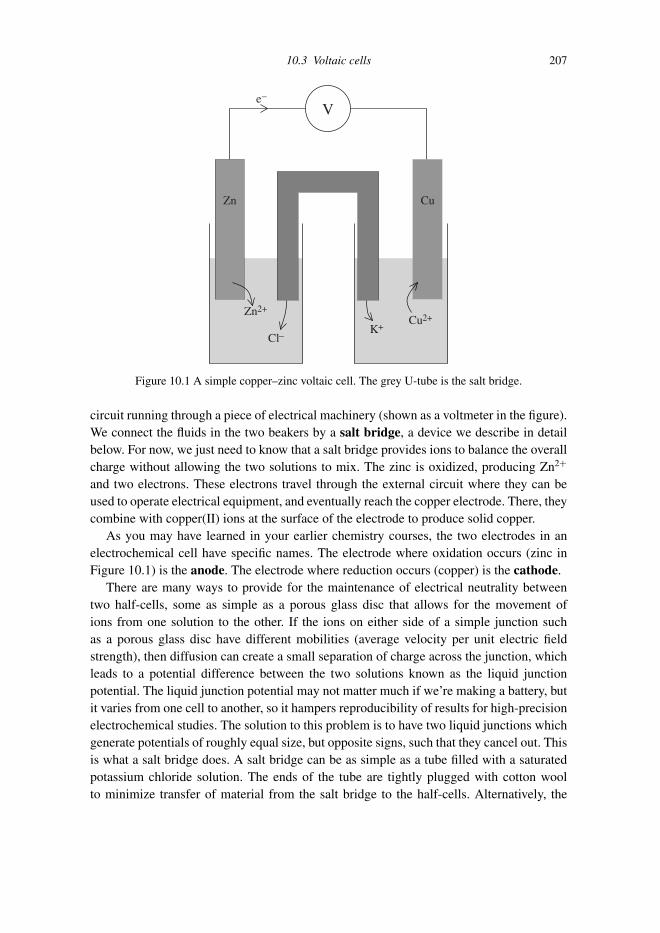
P1: SFK Trim: 247mm × 174mm Top: 14.586mm Gutter: 23.198mm
CUUK1808-10 CUUK1808/Roussel 978 1 107 00678 2 October 29, 2011 13:19
10.3 Voltaic cells 207
K+−Cl
Ve−
2+
uCnZ
Cu2+Zn
Figure 10.1 A simple copper–zinc voltaic cell. The grey U-tube is the salt bridge.
circuit running through a piece of electrical machinery (shown as a voltmeter in the figure).We connect the fluids in the two beakers by a salt bridge, a device we describe in detailbelow. For now, we just need to know that a salt bridge provides ions to balance the overallcharge without allowing the two solutions to mix. The zinc is oxidized, producing Zn2+
and two electrons. These electrons travel through the external circuit where they can beused to operate electrical equipment, and eventually reach the copper electrode. There, theycombine with copper(II) ions at the surface of the electrode to produce solid copper.
As you may have learned in your earlier chemistry courses, the two electrodes in anelectrochemical cell have specific names. The electrode where oxidation occurs (zinc inFigure 10.1) is the anode. The electrode where reduction occurs (copper) is the cathode.
There are many ways to provide for the maintenance of electrical neutrality betweentwo half-cells, some as simple as a porous glass disc that allows for the movement ofions from one solution to the other. If the ions on either side of a simple junction suchas a porous glass disc have different mobilities (average velocity per unit electric fieldstrength), then diffusion can create a small separation of charge across the junction, whichleads to a potential difference between the two solutions known as the liquid junctionpotential. The liquid junction potential may not matter much if we’re making a battery, butit varies from one cell to another, so it hampers reproducibility of results for high-precisionelectrochemical studies. The solution to this problem is to have two liquid junctions whichgenerate potentials of roughly equal size, but opposite signs, such that they cancel out. Thisis what a salt bridge does. A salt bridge can be as simple as a tube filled with a saturatedpotassium chloride solution. The ends of the tube are tightly plugged with cotton woolto minimize transfer of material from the salt bridge to the half-cells. Alternatively, the

P1: SFK Trim: 247mm × 174mm Top: 14.586mm Gutter: 23.198mm
CUUK1808-10 CUUK1808/Roussel 978 1 107 00678 2 October 29, 2011 13:19
208 Electrochemistry
salt bridge may be made by packing a tube with a gel saturated with potassium chloride.Either way, when we insert the salt bridge into a solution, a little bit of potassium ionand a little bit of chloride ion leaks out of both ends. Potassium chloride is a deliberatechoice, since the two ions in this compound have very similar mobilities. Accordingly,roughly equal amounts of potassium and chloride leak out of each end, generating verysmall liquid junction potentials. Better still, since this happens at both ends of the tube, theliquid junction potentials are opposite in sign with respect to the circuit. Overall, the saltbridge contributes to the cell emf a term which is a difference of two small numbers ofsimilar magnitude, thus minimizing the effect of liquid junctions. In the case that potassiumchloride cannot be used, other ionic compounds whose ions would have similar mobilitiescan be substituted. Ammonium nitrate is a popular choice.
There is a standard notation for electrochemical cells, which is best demonstrated byexample. In the case of the cell described in the last paragraph, we would write
Zn(s)|Zn2+(aq)‖Cu2+
(aq)|Cu(s)
A solid bar represents an interface between two phases. A double bar represents a junction(e.g. a salt bridge) between two miscible phases (i.e. two phases that would mix if we putthem in direct contact). Depending on what we want to emphasize, we can either showonly essential species, as above, or we can write down a more complete description of thecontents of the cell. We can also indicate concentrations of species in our diagram whenthey matter, e.g.
Zn(s)|ZnSO4(aq)(0.52 mol L−1)‖CuSO4(aq)(0.28 mol L−1)|Cu(s)
In one common convention which you may have seen in your introductory chemistry course,we put the anode on the left. However, we don’t always know a priori which of the twohalf-reactions will provide the anode, and it makes no real difference to the way we docalculations or interpret the results, so we won’t bother with that convention here.
10.4 Standard reduction potentials
Just as with free energies, we do not want to tabulate the cell emf for every possibleelectrochemical cell. Instead, we tabulate half-cell potentials relative to a standard half-cell, namely the formation of hydrogen gas from hydrogen ions:
H+(aq) + e− → 1
2H2(g)
The reduction potential of this half-cell is arbitrarily set to zero. Every other half-cellis measured relative to this one, either directly or indirectly. By convention, we reporthalf-cell reduction potentials. Again, as with the other thermodynamic quantities we haveencountered, standard reduction potentials, i.e. reduction potentials for the half-reactionsin which all reactants and products are in their standard states, are tabulated.

P1: SFK Trim: 247mm × 174mm Top: 14.586mm Gutter: 23.198mm
CUUK1808-10 CUUK1808/Roussel 978 1 107 00678 2 October 29, 2011 13:19
10.4 Standard reduction potentials 209
Because the number of electrons is divided out of the free energy to obtain the emf,computing the standard cell emf is just a matter of subtracting the reduction potential of theoxidized species from that of the reduced species. The emf under particular experimentalconditions is then obtained via the Nernst Equation (10.2).
You must never multiply a reduction potential by a stoichiometriccoefficient when calculating the emf of a cell.
Example 10.3 Calculating cell emf A cell with the following cell diagram is constructedat 25 ◦C:
Cr(s)|CrCl2(aq)(1 mol L−1)‖HCl(aq)(pH = 3.0)|O3(g)(0.01 bar), O2(g)(0.2 bar)|Pt
The platinum electrode is inert. From the table of Appendix B, we find the followinghalf-reactions:
O3(g) + 2H+(aq) + 2e− → O2(g) + H2O(l) E◦ = +2.07V
Cr2+(aq) + 2e− → Cr(s) E◦ = −0.91V
In order for the overall process to be thermodynamically allowed, the emf must be positive.Given the standard reduction potentials given here, the standard emf will be positive whenthe second half-reaction runs in reverse, i.e. chromium is oxidized. It is often the case thatthe signs of the emf and standard emf are the same, so we guess that this cell oxidizeschromium. The overall reaction is therefore probably
O3(g) + 2H+(aq) + Cr(s) → O2(g) + H2O(l) + Cr2+
(aq)
The standard cell emf is E◦ = 2.07 − (−0.91) = 2.98 V. The emf developed by this cellat the given activities is computed from the Nernst equation. We’re going to assume idealbehavior since the concentration of Cr2+ is outside the range where we can use Debye–Huckel theory and we have no other information about the activity coefficients. In thisreaction, νe = 2.
E = E◦ − RT
νeFln
(aO2 )(aCr2+)
(aO3 )(aH+ )2
= 2.98 V − (8.31441 J K−1mol−1)(298.15 K)
(2)(96485.342 C mol−1)ln
(0.2)(1)
(0.01)(10−3)2
= 2.76 V
If we had incorrectly guessed which species was oxidized, we would have gotten the samevalue for the emf, but with the opposite sign. The sign would have told us that we wrotethe reaction backwards. There would be no need to recalculate anything once this fact hadbeen noted.

P1: SFK Trim: 247mm × 174mm Top: 14.586mm Gutter: 23.198mm
CUUK1808-10 CUUK1808/Roussel 978 1 107 00678 2 October 29, 2011 13:19
210 Electrochemistry
Example 10.4 Determining standard reduction potentials from emf measurements At25◦C, the cell
Pt(s)|H2(g)(1 bar)|H+(aq)(pH 5)‖Al(NO3)3(aq)(0.001 mol L−1)|Al(s)
develops an emf of 1.425 V and bubbles are observed to form on the inert platinum electrode.What is the standard reduction potential of the aluminum ion?
We first need to write down the two half-reactions and the overall reaction. If bubblesform on the inert electrode, hydrogen gas is being produced. Therefore
2H+(aq) + 2e− → H2(g)
The other half-reaction must be
Al(s) → Al3+(aq) + 3e−
The two half-reactions don’t have the same number of electrons. We can fix this bymultiplying the first by 3 and the second by 2. Each reaction then involves νe = 6 electrons,and the overall reaction is
2Al(s) + 6H+(aq) → 2Al3+
(aq) + 3H2(g)
We have a measurement of E. We can use this to calculate E◦, given the activities ofthe species participating in the reaction. For the solution on the left, we have the activity ofhydrogen ions directly from the pH.
aH+,left = 10−pH = 10−5
For the aluminum nitrate solution, we can use Debye–Huckel theory:
Ic,right = 1
2
[(3)2(0.001) + (−1)2(0.003) mol L−1
] = 0.006 mol L−1
∴ ln γAl3+ = −(1.107 × 10⁻¹⁰)(+3)2
× [(6.939 × 10⁻¹⁰ C2N−1m−2)(298.15 K)]−3/2√
0.006 mol L−1
= −0.820
∴ γ±,right = exp(−0.820) = 0.440
∴ aAl3+ = γAl3+ [Al3+]/c◦ = (0.442)(0.001) = 4.40 × 10⁻⁴
aH2 = 1 bar
1 bar= 1
E◦ = E + RT
νeFln Q
∴ E◦ = 1.425 V + (8.314 472 J K−1mol−1)(298.15 K)
6(96 485.342 C mol−1)ln
((4.42 × 10⁻⁴)2(1)3
(10−5)6
)= 1.655 V

P1: SFK Trim: 247mm × 174mm Top: 14.586mm Gutter: 23.198mm
CUUK1808-10 CUUK1808/Roussel 978 1 107 00678 2 October 29, 2011 13:19
10.4 Standard reduction potentials 211
The reaction is written with aluminum being oxidized. If we take E◦Al3+ to be the standard
reduction potential of the aluminum ion and E◦H+ to be the standard reduction potential of
the hydrogen ion, we have
E◦ = E◦H+ − E◦
Al3+
E◦H+ = 0 by definition, so E◦ = −E◦
Al3+ , which implies that E◦Al3+ = −1.655 V.
Example 10.5 Determining solubility products from emf measurements You may havewondered how very small solubility products are measured. There are two commonly usedtechniques, both of which are electrochemical in nature: one is to measure the conductivityof a saturated solution, a method that we shall not consider in this book; the other is tomeasure an emf in a cell involving the salt in question. Consider the cell
Ag(s)|Ag+(aq), I−(aq)|AgI(s), Ag(s)
The half-reactions are
Ag(s) → Ag+(aq) + e−, E◦ = −0.7991 V
and AgI(s) + e− → Ag(s) + I−(aq), E◦ = −0.1518 V
The E◦ values for the half-reactions can be obtained from emf measurements, as shown inthe previous example. The overall reaction for this cell is
AgI(s) → Ag+(aq) + I−(aq)
with a standard cell emf of −0.9509 V. This reaction is exactly that for which the equilibriumconstant is the Ksp of AgI. Therefore
�rG◦m = −νeFE◦ = −(1)(96 485.342 C mol−1)(−0.9509 V)
= 91.75 kJ mol−1
∴ Ksp = exp
( −91.75 × 10³ J mol−1
(8.314 472 J K−1mol−1)(298.15 K)
)= 8.44 × 10⁻¹⁷
Exercise group 10.2
(1) The cell
Pt(s)|H2(g)|H+(aq)‖V2+
(aq)|V(s)
is prepared using a 0.001 mol L−1 solution of vanadium (II) nitrate in the right half-cell, and a pH 5 nitric acid solution in the left half-cell. At 298 K under a hydrogengas pressure of 1 atm, the cell develops an emf of 0.97 V and bubbles are observed toform on the inert platinum electrode. What is the standard reduction potential of thevanadium (II) ion? Use Debye–Huckel theory to estimate the activity coefficients ofthe ions.

P1: SFK Trim: 247mm × 174mm Top: 14.586mm Gutter: 23.198mm
CUUK1808-10 CUUK1808/Roussel 978 1 107 00678 2 October 29, 2011 13:19
212 Electrochemistry
(2) Calculate the equilibrium constant for the reaction
Hg2+2(aq) � Hg(l) + Hg2+
(aq)
at 25 ◦C. Which of the two aqueous ions will be more abundant under equilibriumconditions? (Metallic mercury is insoluble in water, so it precipitates out.)
(3) (a) Ethanol (C2H5OH) reacts with the dichromate ion (Cr2O2−7 ) in acidic solution to
produce ethanal (acetaldehyde, C2H4O) and the chromium(III) ion. Balance thereaction.
(b) Calculate the standard reduction potential corresponding to the ethanal/ethanolhalf-reaction obtained above.
Hint: Start by calculating the standard emf for the electrochemical cell
Pt(s)|H2(g)|H+(aq)‖C2H4O(aq), C2H5OH(aq), H+
(aq)|Pt(s)
(c) Calculate the standard free energy of formation of the aqueous chromium(III) ion.(4) What emf would be generated by the cell
Pt, H2(1 bar)|HCl(pH = 1.5)‖NaCl(0.004 mol/L)|Ag, AgCl
at 25 ◦C? Use Debye–Huckel theory to calculate the emf.(5) Electrochemical cells are sometimes used to measure concentrations. Consider the cell
Cu(s)|CuSO4(aq)(1.4 × 10⁻³ mol L−1)‖NaBr(aq)(8.5 × 10⁻³ mol L−1), Br2(aq)|Pt(s)
Electrons flow in the external circuit from the copper to the platinum electrode. Theequilibrium voltage at 25◦C is 0.7558 V. What is the concentration of bromine inthe right half-cell? Use Debye–Huckel theory to calculate the activity coefficients ofthe ions.
(6) Electrochemical cells can also be used to measure activity coefficients. Consider thecell
Cu(s)|CuCl2(aq)(0.20 mol L−1)|AgCls, Ag(s)
Here, we use the convention that the anode is on the left. The emf of this cells is−0.074 V at 25 ◦C. Estimate the mean ionic activity coefficient of copper(II) chloride.
10.5 Other types of cells
10.5.1 Concentration cells
Suppose that we have constructed a cell such as
Cu(s)|Cu2+(aq)(c1)‖Cu2+
(aq)(c2)|Cu(s)
In other words, the only difference between the two half-cells is the concentration of thesolutions in which the electrodes bathe. It is understood that an anion is present to balance

P1: SFK Trim: 247mm × 174mm Top: 14.586mm Gutter: 23.198mm
CUUK1808-10 CUUK1808/Roussel 978 1 107 00678 2 October 29, 2011 13:19
10.5 Other types of cells 213
charge on both sides, and that a salt bridge is present to close the circuit. This is called aconcentration cell. The overall reaction is
Cu2+(1) + Cu(2) → Cu2+
(2) + Cu(1)
The standard emf of this cell is clearly zero, so
E = −RT
2Fln
a2
a1(10.3)
where a1 is the activity coefficient of the copper ions in the left half-cell, and a2 is theactivity coefficient in the right half-cell. Therefore, if a2 < a1 (usually implying c2 < c1),a positive emf is generated, i.e. the overall “reaction” is thermodynamically allowed aswritten.
Concentration cells are among the simplest electrochemical cells that can be devised.They don’t generate very large voltages, but they can sometimes be used in analyticalchemistry to determine the concentration of an ion in solution given a half-cell con-taining a known concentration of the same ion. They are also used to measure activitycoefficients since some complications that arise from cells made from solutions with dif-ferent components are minimized or eliminated when the two half-cells contain the samechemicals.
10.5.2 Transmembrane potential
Many living cells rely on the establishment of a transmembrane potential for their function.This is an electric potential difference between the inside and outside of the cell. Forinstance, neurons require a transmembrane potential in order to generate electrical impulses.The transmembrane potential is due to exactly the same effect as concentration cells relyon, namely that a difference in concentration is equivalent to a difference in potential.However, a membrane isn’t an electrochemical cell in the normal sense, so the reasoningthat leads to the equation for the transmembrane potential is a little different.
In Section 8.5, we discussed the cotransport of sodium and potassium across cell mem-branes. This cotransport exists to establish a transmembrane potential. It turns out that mostcell membranes are not very permeable to sodium or to chloride, the major small anionin vivo. These ions contribute little to the transmembrane potential. Cell membranes are,however, fairly permeable to potassium. As a result, the potassium ions that have beenpumped out by the cell leak back across the membrane:
K+(in) → K+
(out)
The free energy change associated with this process is
�Gm = RT ln
(γout[K
+(out)]
γin[K+(in)]
)

P1: SFK Trim: 247mm × 174mm Top: 14.586mm Gutter: 23.198mm
CUUK1808-10 CUUK1808/Roussel 978 1 107 00678 2 October 29, 2011 13:19
214 Electrochemistry
where γin and γout are the activity coefficients of the potassium ions on the two sides ofthe membrane. Using the same reasoning as we used to derive the Nernst equation, we canconvert this free energy change into a leakage potential, the main difference being that ourcharge carriers are now potassium ions of charge number z = 1 instead of electrons:
Eleak = RT
Fln
(γout[K
+(out)]
γin[K+(in)]
)
Recall that �Gm = Gm(K+, outside) − Gm(K+, inside). The leakage potential is similarlydefined as Eleak = Eoutside − Einside. This will be important in a little while.
The leak leads to a charge imbalance across the membrane since the membrane isimpermeable to the counterion (chloride). As a result, leaking stops almost immediatelybecause the charge imbalance establishes an electric potential �φ which opposes furthermovement of potassium ions across the membrane. This potential is the transmembranepotential.
The last step in the derivation of our equation for the transmembrane potential is toequate �φ to Eleak. We can do this because there are two canceling sign changes. The firstone is perhaps obvious: because �φ opposes Eleak, the former should be opposite in signto the latter. However, by convention, �φ is measured relative to the outside of the cell,which is opposite to the way Eleak was defined. Thus we have
�φ = RT
Fln
(γout[K
+(out)]
γin[K+(in)]
)
For mammalian muscle cells, we have [K+(out)] = 4 mmol L−1 and [K+
(in)] =155 mmol L−1. If we assume that the activity coefficients are similar inside and outsidethe cell, we can calculate a transmembrane potential at 37◦C of −98 mV. The negative signindicates that the potential is lower inside the cell than out. Positively charged particles(like our potassium ions) move spontaneously from areas of high electric potential to areasof lower electric potential so, as expected, the transmembrane potential opposes movementof potassium ions out of the cell, i.e. it opposes the tendency for concentrations to equalizeacross a permeable membrane. The value we calculated is fairly close to the experimentalvalue of −85 mV. The main source of the discrepancy is that the membrane is not com-pletely impermeable to other ions. However, accounting for these factors properly wouldrequire a much more sophisticated theory than we have in hand.
10.5.3 Fuel cells
A fuel cell is essentially just a voltaic cell whose overall reaction looks like combustion.However, the efficiency of a fuel cell is much greater than that of any engine that functionsby burning a fuel. The reason for this greater efficiency is interesting, so let’s consider itfor a moment.

P1: SFK Trim: 247mm × 174mm Top: 14.586mm Gutter: 23.198mm
CUUK1808-10 CUUK1808/Roussel 978 1 107 00678 2 October 29, 2011 13:19
10.5 Other types of cells 215
Air
e−
H2
Air,water vapor
V
KOH
Figure 10.2 A simple hydrogen fuel cell. The gases are admitted to separate chambers, where they arein contact with porous electrodes. These electrodes are both in contact with an electrolyte solution,often aqueous KOH, which mediates the transfer of charge from one electrode to the other. Typically,atmospheric air flows over the oxygen (right-hand) electrode, while the hydrogen can either flowthrough, with unused hydrogen being recovered and recycled, or, as shown here, be maintained at aconstant pressure over its electrode. The flow of air has the additional role of removing excess water,the product of the oxidation of hydrogen, as vapor.
The Second Law essentially tells us that no heat engine can convert heat into work withperfect efficiency (Section 6.1). In other words, at constant pressure, only a portion of theenthalpy can be converted to work, if we, for instance, use this heat to expand a gas andmove a piston. In fact, the maximum fraction of the enthalpy that can be converted towork by a heat engine can be calculated using formulas developed in Section 6.8. On theother hand, in an electrochemical cell, we use the free energy rather than the heat. The freeenergy change is related to the enthalpy change by �G = �H − T �S. Usually, �S is notparticularly large, so in an isothermal free energy machine such as an electrochemical cell,the maximum work can be similar to �H . In fact, if �S is positive, �G can be larger inabsolute value than �H . (Recall that useful work is performed when �G is negative. Thisusually means that �H is negative, again because �S is not normally very large.) Thus, afuel cell should be able to produce more work than a heat engine using the same reaction.
As with all electrochemical cells, the trick is to design a fuel cell in such a way that thereactants don’t combine directly. Many common fuels (hydrogen, methane, etc.) are gases atnormal ambient temperatures, and of course the oxidant, which is usually just atmosphericoxygen, is also a gas. Typically, the fuel and oxidant are admitted into separate chamberswhere they are placed in contact with appropriate electrodes. A hydroxide solution oftenprovides the medium necessary for ion exchange to maintain electroneutrality. Figure 10.2shows a sketch of a simple hydrogen fuel cell. This fuel cell has the diagram
H2(g)|OH−(aq)|O2(g)

P1: SFK Trim: 247mm × 174mm Top: 14.586mm Gutter: 23.198mm
CUUK1808-10 CUUK1808/Roussel 978 1 107 00678 2 October 29, 2011 13:19
216 Electrochemistry
The half-reactions are
O2(g) + 2H2O(l) + 4e− → 4OH−(aq), E◦ = +0.401 V
H2(g) + 2OH−(aq) → 2H2O(l) + 2e−, E◦ = +0.8277 V
and the overall reaction is the familiar
2H2(g) + O2(g) → 2H2O(l)
with E◦ = 1.229 V and νe = 4. The hydroxide solution appearing in the diagram has therole of facilitating the transfer of charge, in this case in the form of hydroxide ions, betweenone side of the cell and the other.
Suppose that hydrogen gas is admitted at a pressure of 1 atm. Oxygen is typicallyprovided from the air, so the partial pressure of O2 would be 0.21 atm at sea level. The cellemf at 25 ◦C is therefore
E = 1.229 − (8.314 472 J K−1mol−1)(298.15 K)
4(96 485.342 C mol−1)ln
1
(1.01325)2(0.21)= 1.199 V
Just as with chemical cells, several fuel cells can be joined in series to form a battery ifhigher voltages are required.
Fuel cells have two main advantages over heat engines: first, as mentioned above, theyare more efficient, and thus use less fuel to do the same amount of work; secondly, becausethere is no combustion, there are no combustion by-products (sulfur oxides, etc.), so theyproduce little if any pollution. The main obstacles to widespread adoption of fuel celltechnology at present all revolve around the porous electrodes required to separate thegases from the solution. Typically, polymeric membranes are used. Some of the materialsthat have been tried so far are expensive. Others aren’t very durable. There are also issueswith water management since the membranes have to stay wet, but can’t be so wet that theelectrolyte leaks out.
Since we can get most of the data we need from free energy tables, to calculate the emfof a fuel cell, the only number we need from the half-reactions is the ratio of electrons tooxygen. However, this is always 4:1 – look at the two possible oxygen half-reactions inAppendix B – so we don’t generally need to work out the half-reactions.
Example 10.6 Suppose that a fuel cell is powered by methane and oxygen. The overallreaction is
CH4(g) + 2O2(g) → CO2(g) + 2H2O(l)
The standard free energy change for this reaction is
�rG◦ = −817.93 kJ mol−1
To convert this to a cell emf, we need to know how many electrons are exchanged inthe reaction as written. Four electrons are transferred for every oxygen, and there are two

P1: SFK Trim: 247mm × 174mm Top: 14.586mm Gutter: 23.198mm
CUUK1808-10 CUUK1808/Roussel 978 1 107 00678 2 October 29, 2011 13:19
10.5 Other types of cells 217
oxygens, so νe = 8. Therefore
E◦ = −�rG◦m
νeF= 817.93 × 10³ J mol−1
8(96 485.342 C mol−1)= 1.0597 V
If the methane pressure is held at 1 atm and the oxygen pressure is held at 0.2 atm, carbondioxide being allowed to accumulate to a pressure of 0.1 atm, the Nernst equation gives usa maximum output voltage of
E = 1.0597 − (8.314 472 J K−1mol−1)(298.15 K)
8(96 485.342 C mol−1)ln
0.101 325
(1.013 25)(0.202 65)2
= 1.0568 V
at 25 ◦C. Note that this voltage is a maximum because it is the electric potential we wouldmeasure under equilibrium (reversible) conditions.
Exercise group 10.3
(1) Methanol is often touted as a potential replacement for fossil fuels because it can becheaply produced in large quantities by a number of different processes.
Note: Attempt this question only if you have covered the material in Section 6.8.(a) Suppose that gaseous methanol is burned in an internal combustion engine with
upper and lower operating temperatures of 400 and 900 K, respectively. One of theproducts is water vapor. How much work can be obtained per mole of methanolunder these conditions?
(b) Suppose that liquid methanol is instead oxidized in a fuel cell. The methanol iskept separate from all other reactants and products at all times in the particularcell used. The carbon dioxide produced shows up in a gaseous stream flowingthrough another part of the cell at a pressure of approximately 0.1 atm. Air alsoflows through so that the oxygen pressure is always 0.22 atm. How much work canbe obtained from this fuel cell at 298 K?
(2) A fuel cell operates on liquid ethanol at 298 K. Oxygen is supplied at a constantpressure of 0.21 atm and carbon dioxide is removed at such a rate that its pressure is anessentially constant 0.1 atm.(a) What maximum voltage does this fuel cell generate?(b) If the cell is improperly operated, it is also possible for it to generate carbon
monoxide instead of carbon dioxide. Assuming that the carbon monoxide pressureis 0.1 atm and that the cell otherwise operates under identical conditions, what isthe maximum operating voltage?
(3) (a) Propane is a gas at room temperature. A fuel cell operates on propane at a pressureof 1 atm at 298 K. Assume that propane is an ideal gas and calculate the maximumelectrical work available from the fuel cell per cubic meter of propane oxidized if

P1: SFK Trim: 247mm × 174mm Top: 14.586mm Gutter: 23.198mm
CUUK1808-10 CUUK1808/Roussel 978 1 107 00678 2 October 29, 2011 13:19
218 Electrochemistry
the oxygen pressure is 0.2 atm and the carbon dioxide pressure is 0.03 atm. Hint:Calculate the maximum work per mole first.
(b) Calculate the maximum voltage produced by the fuel cell under the operatingconditions described above.
Key ideas and equations
� �rGm = −νeFE
� E = E◦ − RT
νeFln Q
� Procedure for balancing redox reactions
� Transmembrane potential: �φ = RT
Fln
(γout[K
+(out)]
γin[K+(in)]
)� In fuel cells, four electrons are transferred for each oxygen used.
Review exercise group 10.4
(1) When cyanide ions (CN−) react with permanganate (MnO−4 ) in basic solution, the
products are manganese(IV) oxide (MnO2(s)) and cyanate ions (OCN−). Balance thereaction.
(2) What emf (voltage) would be generated by the cell
Pt, H2(1 bar)|H+(0.03 mol kg)−1‖Cl−(0.004 mol kg)−1|Ag, AgCl
at 25◦C, assuming ideal behavior?(3) Gold is often known as a noble metal because it is highly unreactive under most con-
ditions. For instance, most acids won’t dissolve gold. Gold can, however, be dissolvedby aqua regia, a mixture of concentrated nitric and hydrochloric acid. When nitric acidreacts with gold, the following reaction occurs:1
2Au(s) + 3NO−3(aq) + 9H+
(aq) → 2Au3+(aq) + 3HNO2(aq) + 3H2O(l)
1. Calculate the equilibrium constant for this reaction at 25◦C. From the result of yourcalculation, argue that this reaction alone won’t dissolve much gold.
2. The hydrochloric acid provides chloride ions which go on to react with the gold(III) ions:
Au3+(aq) + 4Cl−(aq) � AuCl−4(aq)
Explain qualitatively why this reaction could help dissolve gold.(4) Sketch a methane/oxygen fuel cell. What are the half-reactions? Where do these half-
reactions occur? In what direction do electrons flow? What is the standard emf of thiscell? (Some of these questions can be answered in your diagram.)
1 This is a bit of a cartoon. The reaction generates a range of nitrogen oxide products, including the brown gas NO2.

P1: SFK Trim: 247mm × 174mm Top: 14.586mm Gutter: 23.198mm
CUUK1808-10 CUUK1808/Roussel 978 1 107 00678 2 October 29, 2011 13:19
10.5 Other types of cells 219
(5) Nickel–cadmium (nicad) batteries are based on the following half-cell reactions:
NiO(OH)(s) + H2O(l) + e− → Ni(OH)2(s) + OH−(aq)
Cd(s) + 2OH−(aq) → Cd(OH)2(s) + 2e−
(a) The emf of a nicad cell is 1.4 V. The standard reduction potential of cadmium (II)hydroxide is −0.809 V. What is the standard reduction potential of NiO(OH)?
(b) What is the standard free energy of formation of NiO(OH)?

P1: SFK Trim: 247mm × 174mm Top: 14.586mm Gutter: 23.198mm
CUUK1808-10 CUUK1808/Roussel 978 1 107 00678 2 October 29, 2011 13:19

P1: SFK Trim: 247mm × 174mm Top: 14.586mm Gutter: 23.198mm
CUUK1808-11 CUUK1808/Roussel 978 1 107 00678 2 October 29, 2011 13:22
Part Three
Kinetics

P1: SFK Trim: 247mm × 174mm Top: 14.586mm Gutter: 23.198mm
CUUK1808-11 CUUK1808/Roussel 978 1 107 00678 2 October 29, 2011 13:22

P1: SFK Trim: 247mm × 174mm Top: 14.586mm Gutter: 23.198mm
CUUK1808-11 CUUK1808/Roussel 978 1 107 00678 2 October 29, 2011 13:22
11
Basics of chemical kinetics
Thermodynamics tells you what reactions can happen, but not how fast they will happen. Infact, some reactions are so slow that they are never actually observed, even though they arethermodynamically allowed. Other reactions are stunningly fast. In this part of the book,we will discuss the factors that affect rates of reaction, and consider some basic theoriesthat can be used to rationalize them. This chapter introduces a few definitions and ideasthat we will need in our study of kinetics.
11.1 The business of kinetics
Chemical kinetics is the study of the rates of chemical reactions or, to put it in simplerlanguage, of the speeds of chemical reactions. There are many different questions one canask about how fast reactions go, and many different approaches one can take to answeringthese questions. Roughly though, we can break down the field into two major branches:
(1) Phenomenological kinetics: this is the part of kinetics that is concerned with measuringrates of reactions and with the relationship between rates and chemical mechanisms.
(2) Kinetic theory and dynamics: this field focuses on the relationship between rates ofreactions and events on a molecular scale. In the best cases, we are able to predict areaction mechanism and the rates of the reactions that make up that mechanism. Morecommonly, kinetic theory or dynamics let us relate molecular properties to observedreaction rates. Kinetic theory and dynamics are attempts to answer questions aboutwhy the rate of a reaction has a particular value, rather than just taking the rates asquantities determined by experiment, as we do in phenomenological kinetics.
There is of course not a clear line separating these two approaches to kinetics. Nevertheless,this is a useful classification if only because it brings out the fact that we might have differentreasons to study kinetics.
Regardless of the approach taken, the central concept in kinetics is the rate of reaction.We express rates as an amount of change divided by the time, or
rate = �x
�t(11.1)
223

P1: SFK Trim: 247mm × 174mm Top: 14.586mm Gutter: 23.198mm
CUUK1808-11 CUUK1808/Roussel 978 1 107 00678 2 October 29, 2011 13:22
224 Basics of chemical kinetics
When �t is small, the rate becomes a derivative:
rate = lim�t→0
�x
�t= dx
dt
Accordingly, the study of rate processes inevitably leads to the use of calculus.In general, the rate will have units of x, whatever those are, over time. In solution for
example, the rate will often have units of mol L−1s−1.
11.2 Subtleties of the rate concept
The concept of rate of reaction, which seems quite simple on the surface, has a number ofsubtleties. In particular, the rates of appearance and disappearance of reactants and productsin a reaction need not be the same, although they are usually simply related.
Suppose that we are discussing a reaction with the stoichiometry
A → 2B
To save myself some writing when I’m analyzing abstract reactions like this one, I usuallywrite a instead of [A] for the concentration of A, and similarly for other reactants andproducts. In this reaction, the rate da/dt would be a negative number telling us how fast theconcentration of A decreases with time due to this reaction, which consumes A. Similarly,db/dt would be the rate at which the concentration of B increases. These rates will normallybe related by
db
dt= −2
da
dt(11.2)
because
(1) B is formed when A is removed so the signs are opposite, and(2) since 2 units of B are formed for every unit of A consumed, the rate of appearance of
B is twice as large (in absolute value) as the rate of removal of A. To see the latter,consider that, by stoichiometry, �b = −2�a. Equation (11.2) then follows from thedefinition of the rate (11.1). The one exception is the case where there are intermediatesthat accumulate to significant concentrations, in which case they need to be consideredin the stoichiometric balance. This is, however, a rare event.
Since each reactant or product can, in principle, have a different rate of formationor removal, the concept of the “rate of reaction” is ill-defined unless we introduce aconvention: the rate of reaction is the rate of appearance of a (possibly imaginary) productwith a stoichiometric coefficient of 1. In the above example, the rate of reaction is therefore
reaction rate = v = −da
dt= 1
2
db
dt
Note that the symbol v is usually used for the rate of reaction because many classicalauthors used the term “reaction velocity” where we would now use “reaction rate.”

P1: SFK Trim: 247mm × 174mm Top: 14.586mm Gutter: 23.198mm
CUUK1808-11 CUUK1808/Roussel 978 1 107 00678 2 October 29, 2011 13:22
11.3 Kinetics experiments 225
Example 11.1 Rate of reaction For the reaction
2A + 3B → 4C
the rate of reaction is
v = −1
2
da
dt= −1
3
db
dt= 1
4
dc
dt
Note that the relationship between the rate of reaction and the rates of formation orremoval depends on how the reaction is written. If we rewrite the reaction 1
2 A + 34 B → C,
we obtain, for instance, v = dc/dt . Thus, it is important to always show the reaction forwhich we are giving a reaction rate.
Example 11.2 Rate of reaction with “excess” molecules Consider the reaction
3A → A + B
There is a complication here: A is both a reactant and a product of this reaction. In somesense, the reaction is just
2A → B
We will see later that there are sometimes sensible reasons to write reactions with “excess”molecules, but for the purpose of determining the relationships between rates, the second“simplified” form, which just shows the stoichiometry of the reaction, is the correct one touse. Thus we have
v = −1
2
da
dt= db
dt
11.3 Kinetics experiments
Before we get too deeply into the subject, it is useful to know that there are two fundamen-tally different kinds of kinetics experiments in common use:
Initial rate experiments: in an initial rate experiment, we measure how fast a reactionproceeds in its initial moments. This often allows us to determine the rate law of areaction, which is the relationship between rate and concentration.
The initial rate is typically computed using the approximate Formula (11.1).Progress curve experiments: We can also let a reaction go for a while, measuring
the concentration as a function of time. This is called a progress curve experiment.Progress curves can also sometimes be used to determine a rate law, but more impor-tantly they allow us to see how the reaction behaves beyond the first moments.
Example 11.3 Calculating the initial rate of reaction Suppose that for the reaction2A → B at 25 ◦C with an initial concentration of A of 0.9 mol L−1, 0.05 mol L−1 of A is

P1: SFK Trim: 247mm × 174mm Top: 14.586mm Gutter: 23.198mm
CUUK1808-11 CUUK1808/Roussel 978 1 107 00678 2 October 29, 2011 13:22
226 Basics of chemical kinetics
converted to product in 3.4 s. Then
da
dt≈ −0.05 mol L−1
3.4 s= −0.015 mol L−1s−1
The rate of reaction is therefore
v = −1
2
da
dt= 7.4 × 10⁻³ mol L−1s−1
Exercise group 11.1
(1) Suppose that, for a reaction A → 3B, 1.4 × 10⁻⁴ mol L−1 of product accumulates inthe first 3.5 s of the reaction. What is the initial rate?
(2) A set of initial rate experiments was performed for the reaction A → 2P by stoppingthe reaction after approximately 1 min and measuring the concentration of P (initiallyzero). In one run, the initial concentration of A was 0.04 mol L−1. The reaction wasstopped at 64 s, at which time p had reached 1.3 × 10⁻⁵ mol L−1. What was the initialrate?
11.4 Elementary and complex reactions
Most reactions are complex, which is to say that they occur via more than one step.Each step of the reaction is called an elementary reaction. An elementary reaction is aprocess that really occurs, exactly as written. To put it slightly differently, an elementaryreaction can’t be broken down into simpler chemical reactions. A reaction mechanism isthe complete sequence of elementary reactions that contribute to the kinetics of a givenreaction.
For example, consider the formation of NO2 from NO and O2. The overall reaction is
2NO(g) + O2(g) → 2NO2(g)
This is, as it turns out, a complex reaction. The elementary reactions making up thismechanism are
2NO(g) → N2O2(g)
N2O2(g) + O2(g) → 2NO2(g)
When we say that 2NO(g) → N2O2(g) is elementary, we mean that if we were to watch thereaction happen on a molecular scale, we would actually see two NO molecules collide andform a bond to produce an N2O2 molecule in one step.
Note that the elementary reactions, when added, give the overall reaction. A mechanismcan include reactions that don’t contribute to the overall reaction. These might be sidereactions or other processes that affect the rate of reaction, but aren’t on the pathway fromreactants to products. Nevertheless, there will always be some subset of the reactions thatadds up to give the overall reaction.

P1: SFK Trim: 247mm × 174mm Top: 14.586mm Gutter: 23.198mm
CUUK1808-11 CUUK1808/Roussel 978 1 107 00678 2 October 29, 2011 13:22
11.4 Elementary and complex reactions 227
N2O2 appears in the mechanism, but not in the overall reaction. We call such a species anintermediate. Intermediates need not be added to the reaction mixture. They are generatedduring the reaction, either from the reactants or from other intermediates, and are consumedto make products.
There is no sure way to tell whether a reaction is elementary or complex. However, thefollowing rules are helpful:
(1) Reactions that involve more than two reactant molecules are rarely elementary, espe-cially in the gas phase. The elementary reaction 2NO(g) → N2O2(g) requires a collisionbetween two molecules of NO. Collisions between pairs of molecules are frequentevents. Three-body collisions, i.e. events in which three molecules arrive at the sameplace at exactly the same time, are rare in the gas phase. Elementary steps involv-ing three gaseous reactant molecules are therefore rare. In solution, elementary stepsinvolving three reactant molecules are a little more likely but are still rare. The dif-ference is that once two molecules come into close proximity in solution, the solventtends to keep them from moving away from each other for a while. There is thereforea little time for a third molecule to arrive. Elementary reactions involving four or morereactant molecules are unknown, either in the gas phase or in solution.
(2) The proposed elementary step should correspond to sensible chemistry; the step shouldnot involve more than a few bond-forming and bond-breaking events. Hypervalentintermediates (e.g. involving five-coordinate carbon atoms) are not uncommon, but thedegree of hypervalency should not be excessive. Similarly, radicals and even diradicalsare common intermediates, but intermediates with more than two unpaired electronsare exceedingly unlikely.
Example 11.4 Elementary reaction or not? The reaction F2(g) + 2ClO2(g) → 2FClO2(g)
is almost certainly not elementary because of the number of reactant molecules and the factthat this is a gas-phase reaction.
Example 11.5 Is combustion of graphite elementary? The reaction C(s) + O2(g) →CO2(g) is not elementary. Too many bonds must be broken and formed for this reactionto be elementary; the reaction must remove a carbon atom from graphite (which requiresthe breaking of three C–C bonds), break an O–O bond and create two C–O bonds. Anadditional clue to the non-elementary nature of this reaction is provided by the fact that,in an oxygen-poor environment, this reaction produces carbon monoxide. There are twopossible interpretations of this fact: either CO is an intermediate that goes on to react withan oxygen-containing species (O2 itself or another intermediate like an oxygen atom) tomake CO2 in an oxygen-rich atmosphere, or the reaction has other intermediates that canmake CO in the absence of sufficient oxygen. In the latter case, we would say that thereaction has two reaction channels, one of which leads to CO2, and the other to CO. Theproportion we get of one or the other product will then depend on reaction conditions. Amajor thrust of modern research in reaction dynamics is the control of chemical reactionsin order to select a particular reaction channel.
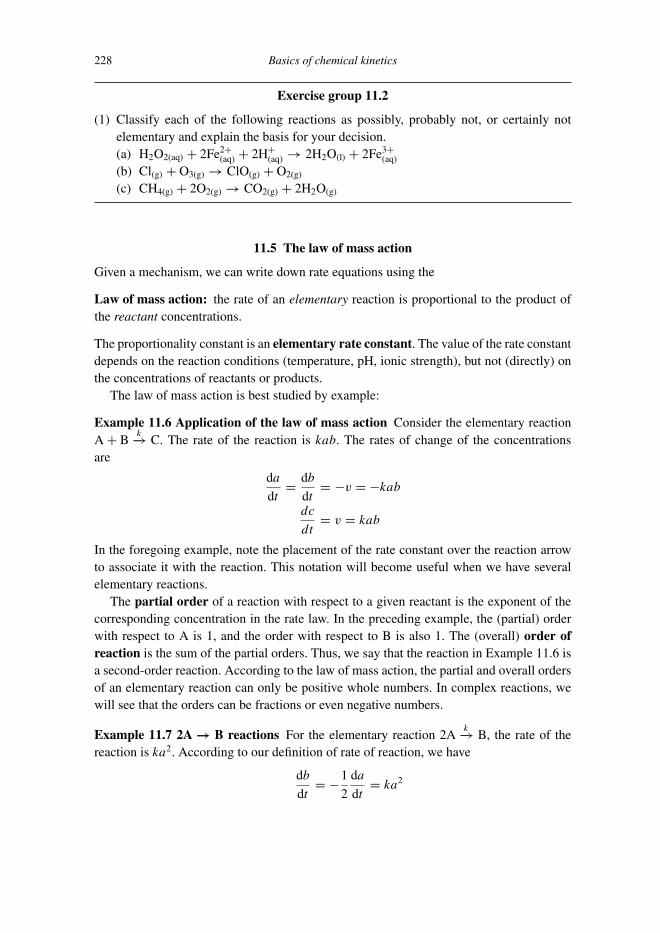
P1: SFK Trim: 247mm × 174mm Top: 14.586mm Gutter: 23.198mm
CUUK1808-11 CUUK1808/Roussel 978 1 107 00678 2 October 29, 2011 13:22
228 Basics of chemical kinetics
Exercise group 11.2
(1) Classify each of the following reactions as possibly, probably not, or certainly notelementary and explain the basis for your decision.(a) H2O2(aq) + 2Fe2+
(aq) + 2H+(aq) → 2H2O(l) + 2Fe3+
(aq)
(b) Cl(g) + O3(g) → ClO(g) + O2(g)
(c) CH4(g) + 2O2(g) → CO2(g) + 2H2O(g)
11.5 The law of mass action
Given a mechanism, we can write down rate equations using the
Law of mass action: the rate of an elementary reaction is proportional to the product ofthe reactant concentrations.
The proportionality constant is an elementary rate constant. The value of the rate constantdepends on the reaction conditions (temperature, pH, ionic strength), but not (directly) onthe concentrations of reactants or products.
The law of mass action is best studied by example:
Example 11.6 Application of the law of mass action Consider the elementary reactionA + B
k−→ C. The rate of the reaction is kab. The rates of change of the concentrationsare
da
dt= db
dt= −v = −kab
dc
dt= v = kab
In the foregoing example, note the placement of the rate constant over the reaction arrowto associate it with the reaction. This notation will become useful when we have severalelementary reactions.
The partial order of a reaction with respect to a given reactant is the exponent of thecorresponding concentration in the rate law. In the preceding example, the (partial) orderwith respect to A is 1, and the order with respect to B is also 1. The (overall) order ofreaction is the sum of the partial orders. Thus, we say that the reaction in Example 11.6 isa second-order reaction. According to the law of mass action, the partial and overall ordersof an elementary reaction can only be positive whole numbers. In complex reactions, wewill see that the orders can be fractions or even negative numbers.
Example 11.7 2A → B reactions For the elementary reaction 2Ak−→ B, the rate of the
reaction is ka2. According to our definition of rate of reaction, we have
db
dt= −1
2
da
dt= ka2

P1: SFK Trim: 247mm × 174mm Top: 14.586mm Gutter: 23.198mm
CUUK1808-11 CUUK1808/Roussel 978 1 107 00678 2 October 29, 2011 13:22
11.5 The law of mass action 229
or
da
dt= −2ka2
anddb
dt= ka2
You should get used to writing the rate equations directly in the latter form. The logic behindour equation for da/dt is that the reaction removes two molecules of A per elementary step,leading to a coefficient of −2. When we start adding more steps, going back to the basicdefinition of the rate of reaction is actually confusing.
When there is more than one elementary step, the overall rate equation for a givenreactant or product is obtained by adding the rates due to the individual steps. For now, wewill only deal with reversible elementary reactions, but the principle would be the same fora complex reaction.
Example 11.8 The law of mass action and reversible reactions Suppose that the
reversible elementary reaction Ak+−⇀↽−k−
B is a complete mechanism. The rate of the for-
ward step is k+a. The rate of the reverse step is k−b. The forward step consumes A whilethe reverse step produces it, so
da
dt= −k+a + k−b
The reverse is true for B so for this compound,
db
dt= k+a − k−b
Again note the use of rate constants over and under the reversible harpoons to associate rateconstants to each direction of the reaction, each of which is to be thought of as a separateelementary reaction.
Example 11.9 A more complex example of the law of mass action Suppose that 2Ak+−⇀↽−k−
B
is the complete mechanism of a reaction. The rates of the forward and reverse steps are,respectively, k+a2 and k−b. The rate of production of B is therefore
db
dt= k+a2 − k−b
For each B formed in the forward reaction, two As are consumed. Similarly, for each Bconsumed in the reverse reaction, two As are produced. Accordingly,
da
dt= −2k+a2 + 2k−b
Note where the stoichiometric factors go in this last equation: The forward reaction removestwo molecules of A, so we put −2 in front of k+a2. The reverse reaction creates twomolecules of A, so the stoichiometric coefficient +2 appears in front of k−b.

P1: SFK Trim: 247mm × 174mm Top: 14.586mm Gutter: 23.198mm
CUUK1808-11 CUUK1808/Roussel 978 1 107 00678 2 October 29, 2011 13:22
230 Basics of chemical kinetics
Exercise group 11.3
(1) Give the rate of reaction and rate of change of a for each of the following reactions:
(a) A + Bk−→ 2C
(b) 2Ak−→ A + B
(c) Ak1−⇀↽−k−1
B + C
(2) Give the rate equations for all the chemical species in the following mechanism:
A + Bk1−⇀↽−k−1
C
2Ck2−→ P
11.6 Microscopic reversibility and chemical equilibrium
Chemical mechanisms are subject to an additional constraint, known as the
Law of microscopic reversibility: every elementary reaction is reversible. In other words,a complete mechanism should include both forward and reverse versions of every elemen-tary step.
This law is necessary to make kinetics compatible with thermodynamics. In practice, it isoften possible to obtain a useful mechanism without including all reverse steps. However,we should be aware that when we leave out a reverse step, we are making an approximationto the true mechanism.
To understand why the law of microscopic reversibility is necessary, consider thefollowing elementary reaction, which we assume to be irreversible:
A → B
This reaction implies that all of the A initially present in the system will be transformed toB. In other words, since the equilibrium constant is K = b/a, it implies an infinitely largeequilibrium constant. Moreover, since K = exp(−�rG
◦m/RT ), �rG
◦m must be infinitely
large and negative. Infinite values of �rG◦m or, equivalently, of K , are not physically
possible since A and B must each have a finite free energy. The reaction step must thereforebe at least somewhat reversible. In other words, we must have
Ak+−⇀↽−k−
B
For this mechanism,
da
dt= −db
dt= −k+a + k−b

P1: SFK Trim: 247mm × 174mm Top: 14.586mm Gutter: 23.198mm
CUUK1808-11 CUUK1808/Roussel 978 1 107 00678 2 October 29, 2011 13:22
11.6 Microscopic reversibility and chemical equilibrium 231
Equilibrium is reached when the rates of change of the concentrations are zero. In this case,equilibrium requires
k+a = k−b
or
K = b
a= k+
k−
The empirical equilibrium constant (which may have units) can therefore be calculatedfrom the rate constants. Note that the rates of the forward and reverse reactions are notzero at equilibrium. The reactions are still happening, but the forward and reverse reactionsoccur at equal rates so there is no net change in the concentrations. This is what we meanby dynamic equilibrium.
It is worth pausing here to discuss the two different kinds of equilibrium constantswe have encountered thus far. In Chapter 8, we encountered thermodynamic equilibriumconstants, which have no units. These are constructed as ratios of activities which willin general contain activity coefficients as well as concentrations. On the other hand, theempirical equilibrium constant encountered here is just a ratio of concentrations. If allsubstances in a system behave ideally, then the two are numerically equal, provided weuse units in the empirical equilibrium constant that are consistent with the desired standardstate (e.g. mol L−1 for solutes in the chemists’ standard state). On the other hand, if anyof the substances in a reaction display non-ideal behavior, then the two will deviate by afactor of the ratio of activity coefficients.
Example 11.10 Rate and equilibrium constants Suppose that, for the reaction
Ak+−⇀↽−k−
2B
the equilibrium constant is 1.8 × 10¹⁸ mol L−1 and k+ = 14 s−1. The equilibrium conditionis
da
dt= −k+a + k−b2 = 0
∴ K = b2
a= k+
k−
∴ k− = k+K
= 14 s−1
1.8 × 10¹⁸ mol L−1 = 7.8 × 10⁻¹⁸ L mol−1s−1
Note that measuring such a small rate constant directly would be impractical.
Although every reaction is in principle reversible, some are effectively irreversible. Thelast example shows this: for all but the tiniest of values of b, da
dt≈ −k+a. This suggests
that many reactions may have simple rate laws, a topic that we will pick up in the nextchapter.

P1: SFK Trim: 247mm × 174mm Top: 14.586mm Gutter: 23.198mm
CUUK1808-11 CUUK1808/Roussel 978 1 107 00678 2 October 29, 2011 13:22
232 Basics of chemical kinetics
Exercise group 11.4
(1) For the elementary reaction
H(g) + Br2(g)k+−⇀↽−k−
HBr(g) + Br(g)
k+ = 8.47 × 10⁶ bar−1s−1 and the equilibrium constant K = 1.18 × 1031 at 298.15 K.What is the value of k−?
Key ideas and equations
� Rate of reaction: rate of formation of a product with a stoichiometric coefficient of 1.� Elementary reactions occur as written. Complex reactions can be broken down into
several elementary reactions.� Law of mass action: the rate of an elementary reaction is proportional to the product of
the reactant concentrations.� Order of reaction, rate constant.� Law of microscopic reversibility.
Review exercise group 11.5
(1) The rate constant for the elementary reaction
I(g) + I(g) + Ar(g) → I2(g) + Ar(g)
is 5.9 × 10³ m6mol−2s−1 at 293 K. The empirical equilibrium constant for this reactioncan be estimated from thermodynamic data to have the value 1.15 × 10²⁰ m3 mol
−1.
(a) What is the rate constant for the reverse reaction?(b) What is unusual about this reaction?(c) What is the order of the reaction with respect to argon? With respect to the iodine
atoms?(d) What rate of reaction does the law of mass action predict if the partial pressure of
iodine atoms is 15 mPa and the partial pressure of argon is 80 kPa?Hint: Given the units of the rate constant, in what units do you need [Ar] and [I]?
(e) At the partial pressures given above, roughly how long would it take to use up 1%of the iodine atoms?
(2) Proflavin is a large aromatic ion used to stain DNA: Like many other planar aromatic
N
H
NH2H2N +
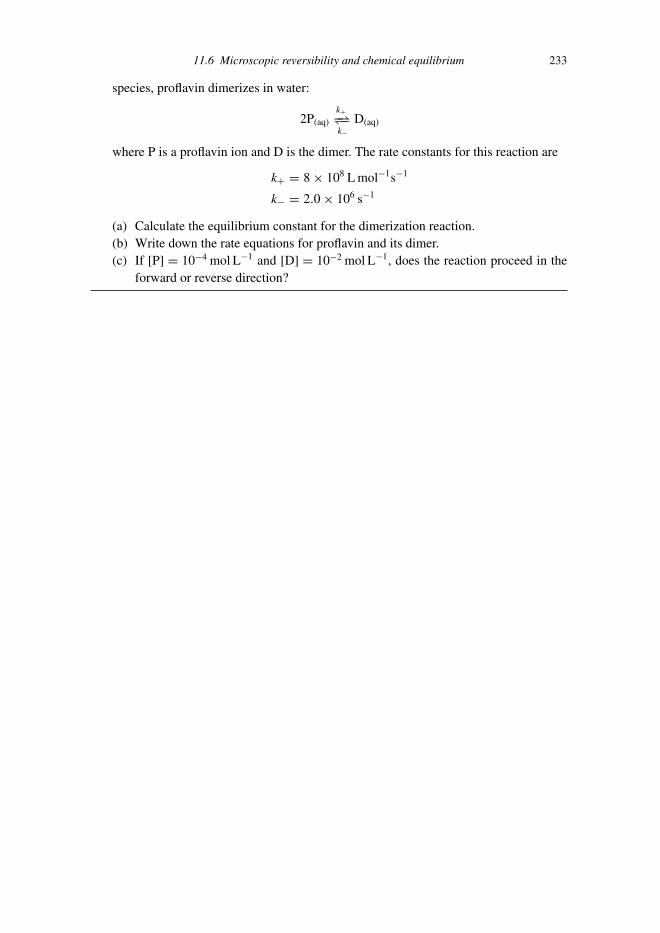
P1: SFK Trim: 247mm × 174mm Top: 14.586mm Gutter: 23.198mm
CUUK1808-11 CUUK1808/Roussel 978 1 107 00678 2 October 29, 2011 13:22
11.6 Microscopic reversibility and chemical equilibrium 233
species, proflavin dimerizes in water:
2P(aq)k+−⇀↽−k−
D(aq)
where P is a proflavin ion and D is the dimer. The rate constants for this reaction are
k+ = 8 × 10⁸ L mol−1s−1
k− = 2.0 × 10⁶ s−1
(a) Calculate the equilibrium constant for the dimerization reaction.(b) Write down the rate equations for proflavin and its dimer.(c) If [P] = 10−4 mol L−1 and [D] = 10−2 mol L−1, does the reaction proceed in the
forward or reverse direction?

P1: SFK Trim: 247mm × 174mm Top: 14.586mm Gutter: 23.198mm
CUUK1808-12 CUUK1808/Roussel 978 1 107 00678 2 October 29, 2011 13:19
12
Initial rate experiments andsimple empirical rate laws
This chapter will introduce you to the analysis of a key class of kinetics experiments,namely initial rate experiments. We will consider only the simplest class of rate laws,those where the rate is proportional to some powers of the concentrations. This is a limitedclass, but one that comes up surprisingly often in practice. Initial rate experiments arealso useful when a reaction has a complex rate law. However, complex rate laws are bestunderstood in the context of a study of reaction mechanisms, so we put off this discussion fornow.
12.1 Initial rate studies
Rate laws of chemical reactions are often complicated. They can depend on the concen-trations of reactants, products or other chemicals present in the system in almost arbitraryways. It would be impractical to try to deal at once with all possible complications, so weoften try to study reactions under conditions in which we can expect simpler behavior.
Perhaps the most widely used experimental simplification is the method of initial rates,which we briefly mentioned in Section 11.3. In this method, we study the reaction onlyfor a very short time after initiation. During this time, the concentrations change very littleso that a number of complications arising from changes in the reaction mixture over timeare avoided. For instance, if we start with a mixture containing only reactants, then verylittle product will accumulate during the reaction and we can neglect the reverse reactionwhose rate, according to the law of mass action, depends on the product concentrations.
How long a period of time should an initial rate study cover? Unfortunately, there isn’ta simple answer to this question. Chemical reactions occur over a vast range of time scales,ranging from geological periods (thousands of years or more) to the microsecond range,or faster. The key is to study the reaction for a time that is short compared to the timeover which products accumulate. One useful measure of what is a short and what is a longtime in a reaction is the half-life. The half-life is the time it takes for the reaction to gethalf-way to equilibrium. In a nearly irreversible reaction, the half-life would be the timerequired for the concentration of the limiting reagent to fall to half its initial value. An initialrate study would cover a period of time that is short (usually very short) compared to thehalf-life. However, the period of the study must be sufficiently long for there to have been
234
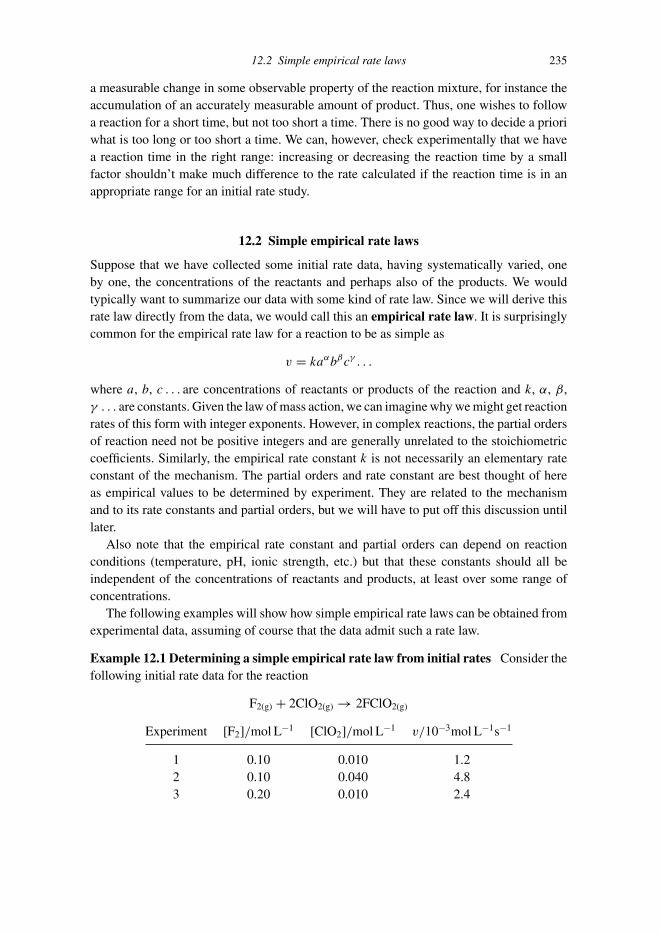
P1: SFK Trim: 247mm × 174mm Top: 14.586mm Gutter: 23.198mm
CUUK1808-12 CUUK1808/Roussel 978 1 107 00678 2 October 29, 2011 13:19
12.2 Simple empirical rate laws 235
a measurable change in some observable property of the reaction mixture, for instance theaccumulation of an accurately measurable amount of product. Thus, one wishes to followa reaction for a short time, but not too short a time. There is no good way to decide a prioriwhat is too long or too short a time. We can, however, check experimentally that we havea reaction time in the right range: increasing or decreasing the reaction time by a smallfactor shouldn’t make much difference to the rate calculated if the reaction time is in anappropriate range for an initial rate study.
12.2 Simple empirical rate laws
Suppose that we have collected some initial rate data, having systematically varied, oneby one, the concentrations of the reactants and perhaps also of the products. We wouldtypically want to summarize our data with some kind of rate law. Since we will derive thisrate law directly from the data, we would call this an empirical rate law. It is surprisinglycommon for the empirical rate law for a reaction to be as simple as
v = kaαbβcγ . . .
where a, b, c . . . are concentrations of reactants or products of the reaction and k, α, β,γ . . . are constants. Given the law of mass action, we can imagine why we might get reactionrates of this form with integer exponents. However, in complex reactions, the partial ordersof reaction need not be positive integers and are generally unrelated to the stoichiometriccoefficients. Similarly, the empirical rate constant k is not necessarily an elementary rateconstant of the mechanism. The partial orders and rate constant are best thought of hereas empirical values to be determined by experiment. They are related to the mechanismand to its rate constants and partial orders, but we will have to put off this discussion untillater.
Also note that the empirical rate constant and partial orders can depend on reactionconditions (temperature, pH, ionic strength, etc.) but that these constants should all beindependent of the concentrations of reactants and products, at least over some range ofconcentrations.
The following examples will show how simple empirical rate laws can be obtained fromexperimental data, assuming of course that the data admit such a rate law.
Example 12.1 Determining a simple empirical rate law from initial rates Consider thefollowing initial rate data for the reaction
F2(g) + 2ClO2(g) → 2FClO2(g)
Experiment [F2]/mol L−1 [ClO2]/mol L−1 v/10−3mol L−1s−1
1 0.10 0.010 1.22 0.10 0.040 4.83 0.20 0.010 2.4

P1: SFK Trim: 247mm × 174mm Top: 14.586mm Gutter: 23.198mm
CUUK1808-12 CUUK1808/Roussel 978 1 107 00678 2 October 29, 2011 13:19
236 Initial rate experiments
Experiments 1 and 3 were carried out under identical conditions except that the concentra-tion of F2 was doubled. The reaction rate also doubled so the rate is proportional to [F2]. Inother words, this reaction is of the first order with respect to F2. Analogously, experiments1 and 2 were carried out under identical conditions except that the concentration of ClO2
is four times higher in experiment 2 than in experiment 1. The rate also goes up by a factorof four so the reaction is also of the first order with respect to ClO2. The data are thereforeconsistent with the rate law
v = k[F2][ClO2]
This is a second-order reaction (sum of partial orders = 2). Note that the order with respectto ClO2 is different from its stoichiometric coefficient. This proves that this reaction is notelementary, otherwise the law of mass action would require a partial order of 2 with respectto ClO2.
Moreover, it is important to understand that the data suggest the above rate law, butfall far short of proving it. The problem is that there is just enough data to calculate thepartial orders, but not enough to verify that these orders are consistent across a range ofconcentrations. We should really have additional data points in which [ClO2] is varied atfixed [F2], and vice versa.
We can also calculate the rate constant k from the data:
k = v
[F2][ClO2]
Any one point will give a value for k. For instance, using the first point, we get
k = 1.2 × 10⁻³ mol L−1s−1
(0.10 mol L−1)(0.010 mol L−1)= 1.2 L mol−1s−1
In principle, we should repeat this calculation with the other two points and average theresults. In this case, you will get exactly the same value in all three cases.
Example 12.2 Another empirical rate law determined from initial rates For thereaction
2HgCl2(aq) + C2O2−4(aq) → Hg2Cl2(s) + 2Cl−(aq) + 2CO2(g)
the following initial rate data were obtained:
Experiment [HgCl2]/mol L−1 [C2O2−4 ]/mol L−1 v/10−7mol L−1s−1
1 0.10 0.10 1.32 0.10 0.20 5.23 0.20 0.20 10
Compare experiments 1 and 2: at identical [HgCl2], doubling [C2O2−4 ] increases the rate by
a factor of 5.21.3 = 4. The rate therefore increases as the square of the C2O2−
4 concentration.The order of the reaction with respect to C2O2−
4 is therefore 2. Similarly, experiments 2 and

P1: SFK Trim: 247mm × 174mm Top: 14.586mm Gutter: 23.198mm
CUUK1808-12 CUUK1808/Roussel 978 1 107 00678 2 October 29, 2011 13:19
12.2 Simple empirical rate laws 237
3 imply a partial order of 1 with respect to HgCl2. The rate law is therefore
v = k[HgCl2][C2O2−4 ]
2
The rate constant is
k = 1.3 × 10⁻⁷ mol L−1s−1
(0.10 mol L−1)(0.10 mol L−1)2= 1.3 × 10⁻⁴ L2mol−2s−1
Example 12.3 Partial orders that can’t be determined by inspection Consider thefollowing data for a reaction A + B → P:
Experiment a/mol L−1 b/mol L−1 p/mol L−1 v/10−3mol L−1s−1
1 0.2 0.1 0.5 1.62 0.4 0.1 0.5 2.33 0.8 0.1 0.5 3.34 0.2 0.2 0.5 1.65 0.2 0.3 0.5 1.66 0.2 0.1 0.3 2.77 0.2 0.1 0.1 8.0
Let’s start by considering experiments 1, 4 and 5. When the initial concentration of B ischanged, there is no effect on the rate. Accordingly the order of the reaction with respectto B is zero.
Experiments 1, 2 and 3 show the variation of the rate with a, but in this case, most ofus wouldn’t be able to figure out the order of reaction by inspection as we have previouslydone. We start by calculating the ratios of the concentrations and rates:
Experiments (i, j ) aj/ai vj /vi
1, 2 2 1.442, 3 2 1.43
Each time we double the concentration, the rate increases by the same factor. This indicatesthat the relationship is a simple power law. The question then is to what exponent must weraise 2 to get roughly 1.43? Some of you might be able to see the answer right away, butfor the rest of us, here’s how we go about this problem. We are looking for a relationship ofthe form v ∝ aα (holding everything else constant). Therefore, the ratio of rates at differentvalues of a is
vj
vi
= aαj
aαi
=(
aj
ai
)α

P1: SFK Trim: 247mm × 174mm Top: 14.586mm Gutter: 23.198mm
CUUK1808-12 CUUK1808/Roussel 978 1 107 00678 2 October 29, 2011 13:19
238 Initial rate experiments
To find the value of α, we take the logarithm (any base) of both sides of this equation
log
(vj
vi
)= log
(aj
ai
)α
= α log
(aj
ai
)
∴ α = log(vj/vi)
log(aj/ai)
In this case, we have α ≈ log 1.43/ log 2 = 0.52. We could report this value as the order ofthe reaction, However, we will see later that orders that are simple fractions come up fairlyfrequently in certain types of mechanisms. In this case, the order we calculated is closeenough to 1
2 that, considering the precision of the data, we would be justified in reportingthe order as α = 1
2 .We now turn to experiments 1, 6 and 7 in which the concentration of P was varied.
Again, we compute the ratios of concentrations and rates in the different experiments:
Experiments (i, j ) pi/pj vi/vj
1, 6 1.67 0.596, 7 3 0.34
Here, the rate increases as the concentration of P decreases. The partial order with respectto P is therefore negative. We could solve for this exponent as we did for the order ofreaction with respect to A, but this one is not quite as difficult. Note that 1/1.67 = 0.60and that 1/3 = 0.33. Accordingly, the order is −1. The complete rate law is therefore
v = ka1/2p−1
This rate law implies that the product P slows down the reaction, a common phenomenonknown as product inhibition.
The rate constant can be calculated from k = vp/a1/2. If we calculate the rate constantfor each experiment and average the values, we get k = 1.80 × 10⁻³ mol3/2L−3/2s−1.
Exercise group 12.1
(1) The rate of a reaction triples when the concentration of a reactant is doubled. What isthe order of the reaction with respect to the concentration of this reactant?
(2) For the reaction of ozone with nitrogen monoxide (O3(g) + NO(g) → O2(g) + NO2(g))at 340 K, the following initial rate data have been obtained:
[O3]/μmol L−1 [NO]/μmol L−1 v/μmol L−1s−1
2.1 2.1 164.2 2.1 326.3 2.1 486.3 4.2 966.3 6.3 144
Determine the empirical rate law and the value of the rate constant.
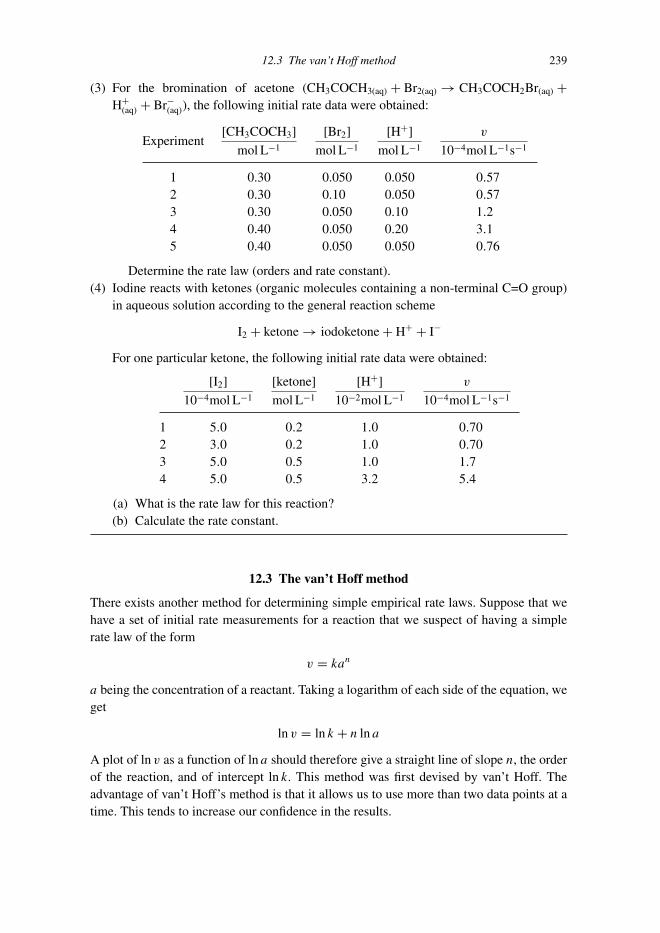
P1: SFK Trim: 247mm × 174mm Top: 14.586mm Gutter: 23.198mm
CUUK1808-12 CUUK1808/Roussel 978 1 107 00678 2 October 29, 2011 13:19
12.3 The van’t Hoff method 239
(3) For the bromination of acetone (CH3COCH3(aq) + Br2(aq) → CH3COCH2Br(aq) +H+
(aq) + Br−(aq)), the following initial rate data were obtained:
Experiment[CH3COCH3]
mol L−1
[Br2]
mol L−1
[H+]
mol L−1
v
10−4mol L−1s−1
1 0.30 0.050 0.050 0.572 0.30 0.10 0.050 0.573 0.30 0.050 0.10 1.24 0.40 0.050 0.20 3.15 0.40 0.050 0.050 0.76
Determine the rate law (orders and rate constant).(4) Iodine reacts with ketones (organic molecules containing a non-terminal C=O group)
in aqueous solution according to the general reaction scheme
I2 + ketone → iodoketone + H+ + I−
For one particular ketone, the following initial rate data were obtained:
[I2]
10−4mol L−1
[ketone]
mol L−1
[H+]
10−2mol L−1
v
10−4mol L−1s−1
1 5.0 0.2 1.0 0.702 3.0 0.2 1.0 0.703 5.0 0.5 1.0 1.74 5.0 0.5 3.2 5.4
(a) What is the rate law for this reaction?(b) Calculate the rate constant.
12.3 The van’t Hoff method
There exists another method for determining simple empirical rate laws. Suppose that wehave a set of initial rate measurements for a reaction that we suspect of having a simplerate law of the form
v = kan
a being the concentration of a reactant. Taking a logarithm of each side of the equation, weget
ln v = ln k + n ln a
A plot of ln v as a function of ln a should therefore give a straight line of slope n, the orderof the reaction, and of intercept ln k. This method was first devised by van’t Hoff. Theadvantage of van’t Hoff’s method is that it allows us to use more than two data points at atime. This tends to increase our confidence in the results.

P1: SFK Trim: 247mm × 174mm Top: 14.586mm Gutter: 23.198mm
CUUK1808-12 CUUK1808/Roussel 978 1 107 00678 2 October 29, 2011 13:19
240 Initial rate experiments
−5
−4
−3
−2
−1
0
1
0−2.5 −2 −1.5 −1 −0.5
ln(v
/mol
L−1
s−1)
ln(a/mol L−1)
Figure 12.1 van’t Hoff plot of the data from Example 12.4.
We will get the slope and intercept of the line by linear regression. In addition, weshould always plot the data since it is nearly impossible to figure out if the data fit alinear relationship without looking at the graph. The correlation coefficient, which youmay have been told to use for such purposes, is actually not that useful, as we will see inSection 13.2.
Example 12.4 Application of the van’t Hoff method Consider the following initial ratedata for a reaction A → P:
a/mol L−1 0.11 0.25 0.52 0.91
v/mol L−1s−1 9.0 × 10⁻³ 6.5 × 10⁻² 0.37 1.4
To use van’t Hoff’s method, we take the logarithms of both quantities:
ln(a/mol L−1) −2.21 −1.39 −0.65 −0.09
ln(v/mol L−1s−1) −4.71 −2.73 −0.99 0.34
The graph of this data set is shown in Figure 12.1. The data plotted in this fashion fit astraight line of slope n = 2.4 and intercept ln k = 0.56. Thus, the reaction does obey asimple rate law: v = ka2.4. The rate constant is k = exp(0.56) = 1.75 L1.4 mol−1.4 s−1. Theunits of the rate constant are obtained by unit analysis from the rate law.
While van’t Hoff’s method is a reasonably good way to determine the order of a reaction,it must be used with caution. The problem is that log–log plots tend to make things looklinear, even when the underlying relationship isn’t a simple power law. Thus, while we canuse a van’t Hoff plot to determine whether a reaction obeys a simple rate law, a carefulexperimentalist will always:
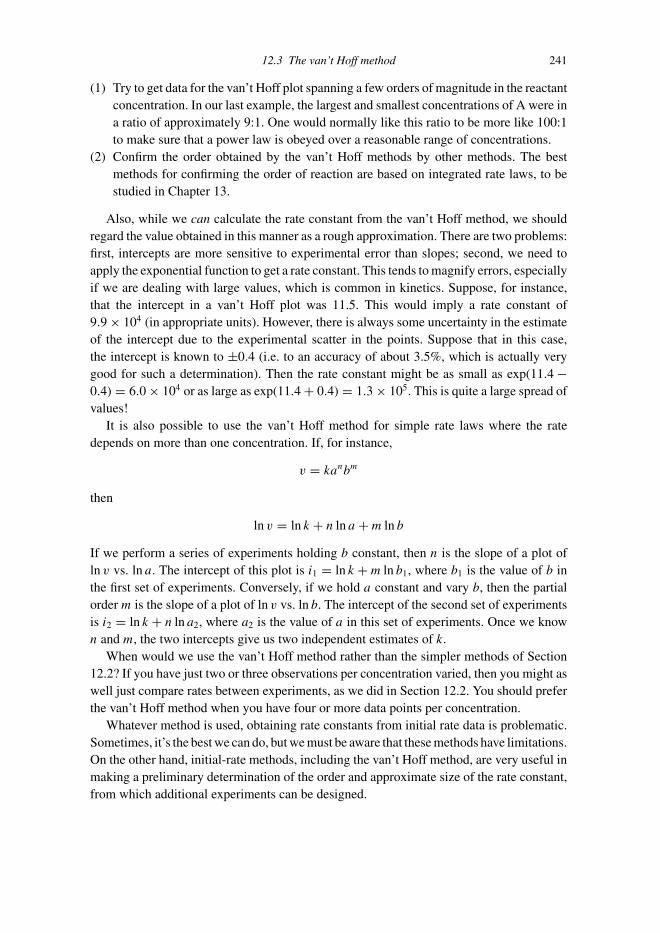
P1: SFK Trim: 247mm × 174mm Top: 14.586mm Gutter: 23.198mm
CUUK1808-12 CUUK1808/Roussel 978 1 107 00678 2 October 29, 2011 13:19
12.3 The van’t Hoff method 241
(1) Try to get data for the van’t Hoff plot spanning a few orders of magnitude in the reactantconcentration. In our last example, the largest and smallest concentrations of A were ina ratio of approximately 9:1. One would normally like this ratio to be more like 100:1to make sure that a power law is obeyed over a reasonable range of concentrations.
(2) Confirm the order obtained by the van’t Hoff methods by other methods. The bestmethods for confirming the order of reaction are based on integrated rate laws, to bestudied in Chapter 13.
Also, while we can calculate the rate constant from the van’t Hoff method, we shouldregard the value obtained in this manner as a rough approximation. There are two problems:first, intercepts are more sensitive to experimental error than slopes; second, we need toapply the exponential function to get a rate constant. This tends to magnify errors, especiallyif we are dealing with large values, which is common in kinetics. Suppose, for instance,that the intercept in a van’t Hoff plot was 11.5. This would imply a rate constant of9.9 × 104 (in appropriate units). However, there is always some uncertainty in the estimateof the intercept due to the experimental scatter in the points. Suppose that in this case,the intercept is known to ±0.4 (i.e. to an accuracy of about 3.5%, which is actually verygood for such a determination). Then the rate constant might be as small as exp(11.4 −0.4) = 6.0 × 10⁴ or as large as exp(11.4 + 0.4) = 1.3 × 10⁵. This is quite a large spread ofvalues!
It is also possible to use the van’t Hoff method for simple rate laws where the ratedepends on more than one concentration. If, for instance,
v = kanbm
then
ln v = ln k + n ln a + m ln b
If we perform a series of experiments holding b constant, then n is the slope of a plot ofln v vs. ln a. The intercept of this plot is i1 = ln k + m ln b1, where b1 is the value of b inthe first set of experiments. Conversely, if we hold a constant and vary b, then the partialorder m is the slope of a plot of ln v vs. ln b. The intercept of the second set of experimentsis i2 = ln k + n ln a2, where a2 is the value of a in this set of experiments. Once we known and m, the two intercepts give us two independent estimates of k.
When would we use the van’t Hoff method rather than the simpler methods of Section12.2? If you have just two or three observations per concentration varied, then you might aswell just compare rates between experiments, as we did in Section 12.2. You should preferthe van’t Hoff method when you have four or more data points per concentration.
Whatever method is used, obtaining rate constants from initial rate data is problematic.Sometimes, it’s the best we can do, but we must be aware that these methods have limitations.On the other hand, initial-rate methods, including the van’t Hoff method, are very useful inmaking a preliminary determination of the order and approximate size of the rate constant,from which additional experiments can be designed.

P1: SFK Trim: 247mm × 174mm Top: 14.586mm Gutter: 23.198mm
CUUK1808-12 CUUK1808/Roussel 978 1 107 00678 2 October 29, 2011 13:19
242 Initial rate experiments
Exercise group 12.2
(1) For the decomposition of dinitrogen pentoxide in tetrachloromethane (2N2O5 →4NO2 + O2), the following initial rate data have been obtained:
[N2O5]/mol L−1 0.92 1.23 1.79 2.00 2.21
v/μmol L−1s−1 9.5 12.0 19.3 21.0 22.6
Determine the empirical rate law (order of reaction and rate constant).(2) Succinimide can be made by oxidation of pyrrolidone with tetraphenylporphyrinatoiron
(III) chloride (TPPFe) and tert-butyl hydroperoxide (ButOOH):
NH
O
NH
O
O
pyrrolidone succinimide
TPPFe
ButOOH
Varying only the concentration of pyrrolidone, the following initial rate data wereobtained:1
[pyrrolidone]/mmol L−1 0.5 3.0 5.0 10.0
v/mmol L−1h−1 0.908 3.86 5.98 6.52
Does this reaction have a simple rate law with respect to pyrrolidone and if so, what isthe order?
(3) The reaction 2HBr(g) + NO2(g) → H2O(g) + NO(g) + Br2(g) has been studied at 127 ◦C.A series of initial-rate experiments were performed at a constant NO2 pressure of10 torr but different HBr pressures:
pHBr/torr 4.7 11.0 15.3 20.3 26.1 34.1
v/torr min−1 0.98 2.35 3.16 3.96 5.56 6.77
A second series of initial-rate experiments were carried out at a constant HBr pressureof 10 torr while varying the NO2 pressure:
pNO2 /torr 5.0 10.2 15.4 20.3 25.7
v/torr min−1 1.27 2.37 3.64 4.94 6.19
(a) Show that the reaction obeys a simple rate law and determine the orders withrespect to the two reactants.
(b) What is the value of the rate constant?
1 J. Iley et al., J. Chem. Soc., Perkin Trans. 2, 1299 (2001).

P1: SFK Trim: 247mm × 174mm Top: 14.586mm Gutter: 23.198mm
CUUK1808-12 CUUK1808/Roussel 978 1 107 00678 2 October 29, 2011 13:19
12.3 The van’t Hoff method 243
Key ideas and equations
� Many reactions have simple rate laws of the form v = kaαbβ . . .� In general, the partial orders of reaction can have any value, positive or negative, although
in practice small whole numbers or fractions with small denominators are most common.� van’t Hoff method: if v = kan, ln v = ln k + n ln a, which allows you to extract k and n
by a graphical method.
Review exercise group 12.3
(1) In an initial rate experiment, it is found that increasing the concentration of a reactantby a factor of 10 increases the rate by a factor of 3.2. What is the order of the reaction?
(2) (a) In a particular experiment, the rate of hydrolysis of nitrogen dioxide
2NO2(g) + H2O(g) → HNO2(g) + HNO3(g)
was found to be 0.26 mol L−1min−1. What is the rate of change of the concentrationof NO2(g)?
(b) The empirical rate law for this reaction is v = k[H2O][NO2]. Suppose that werepeated the experiment for which data was given in question 2a, but tripled theinitial concentration of water and doubled the initial concentration of NO2. Whatrate of reaction would you predict would be measured?
(3) Consider the following table of initial rate data for a reaction A → 2B:
Experiment a/mol L−1 b/mol L−1 v/kmol L−1s−1
1 1.5 1.3 172 3.5 1.3 233 9.2 1.3 314 1.5 0.55 185 1.5 0.13 17
Verify that this reaction has a simple rate law. Determine the rate law, the overall orderand the rate constant.

P1: SFK Trim: 247mm × 174mm Top: 14.586mm Gutter: 23.198mm
CUUK1808-13 CUUK1808/Roussel 978 1 107 00678 2 October 29, 2011 14:57
13
Integrated Rate Laws
Rate laws, whether obtained from the law of mass action or from empirical rate studies, arein fact differential equations. What does this mean? In general, a differential equation is arelationship between some quantities and their derivatives. Our rate laws are relationshipsbetween concentrations and their derivatives with respect to time. The solution of a set ofrate equations is a set of equations that tell us how the concentrations depend on time.
As we saw in the last chapter, even complex reactions can have simple-looking ratelaws. In this chapter, we will learn how to solve simple rate equations, and how to use thesesolutions to analyze data from experiments in which we measure concentration vs. time.
13.1 First-order reactions
Let’s start by examining a very simple differential equation, namely that arising from areaction with a first-order rate law:
dx
dt= −kx
In this equation, x represents the concentration of a reactant (hence the negative sign).This equation can be solved by separation of variables, which we encountered previouslywhen we were deriving the Beer–Lambert law. In this technique, we treat dx and dt asindependent entities. We rearrange the differential equation to isolate terms that depend onx from those that depend on t :
dx
x= −k dt (13.1)
(The constant −k depends neither on x nor on t and so could have gone on either side ofthe equation.) Next, we integrate both sides from an initial condition up to some arbitrarytime. Suppose that at t = 0, x = x0. Then∫ x(t)
x0
dx ′
x ′ = −k
∫ t
0dt ′
A few notes are in order here:
244

P1: SFK Trim: 247mm × 174mm Top: 14.586mm Gutter: 23.198mm
CUUK1808-13 CUUK1808/Roussel 978 1 107 00678 2 October 29, 2011 14:57
13.1 First-order reactions 245
� The primed variables are merely intended to distinguish the integration variables fromthe “real” variables. If we didn’t modify the variables under the integral signs, we wouldend up with the same variable names inside the integrals as in the limits, which might beconfusing.
� Starting the integration from t = 0 is purely a matter of convention and convenience. Ifwe knew the concentration at some other time, we could equally well start from there.
From here, it is purely a matter of elementary calculus and algebra:∫ x(t)
x0
dx ′
x ′ = −k
∫ t
0dt ′
∴ ln x ′∣∣x(t)x0
= −k t ′∣∣t0
∴ ln x(t) − ln x0 = −k(t − 0) (13.2)
∴ ln
(x(t)
x0
)= −kt
∴ x(t)
x0= exp(−kt)
∴ x(t) = x0e−kt (13.3)
We now have a solution to the differential equation, i.e. an equation that tells us the valueof x at any time t . This solution can be verified by substituting it back into the differentialequation (13.1); taking a derivative of Equation (13.3), we get
dx(t)
dt= −kx0 exp(−kt) = −kx(t)
which is just the original differential equation. The solution is therefore correct.We usually take it for granted that x depends on t , so we can drop the explicit argument
from x. Equation (13.2) can then be written as
ln x = ln x0 − kt (13.4)
This form gives us a reasonably direct method for measuring rate constants of first-orderreactions. Suppose we know that a certain reaction obeys a first-order rate law. If we plotln x as a function of t , we should get a straight line of slope −k.
Example 13.1 Decomposition of dimethyldiazene At sufficiently high pressures, thegas-phase decomposition of dimethyldiazene (a.k.a. azomethane)
CH3N = NCH3(g) → C2H6(g) + N2(g)
obeys a first-order rate law. The following data were obtained at 300◦C:
t /s 0 100 150 200 250 300p(CH3N)2 /mmHg 284 220 193 170 150 132

P1: SFK Trim: 247mm × 174mm Top: 14.586mm Gutter: 23.198mm
CUUK1808-13 CUUK1808/Roussel 978 1 107 00678 2 October 29, 2011 14:57
246 Integrated Rate Laws
4.8
4.9
5
5.1
5.2
5.3
5.4
5.5
5.6
5.7
0 50 100 150 200 250 300
ln(p
(CH
3N) 2
/mm
Hg)
t/s
Figure 13.1 Plot of data from Example 13.1.
In Equation (13.4), we can use any quantity that is proportional to the number of molesof reactant for x. In particular, the pressure p = nRT/V is often a convenient choice forgases:
t /s 0 100 150 200 250 300ln(p(CH3N)2/mmHg
)5.65 5.39 5.26 5.14 5.01 4.88
The graph of ln p(CH3N)2 as a function of t is linear (Figure 13.1)You will note that the data fit a straight line beautifully. If the reaction obeyed a different
rate law, this would not normally be the case. We determine the slope by linear regressionof the ln p(CH3N)2 vs. t data. We find a slope of −2.55 × 10⁻³ s−1, implying a rate constantk = 2.55 × 10⁻³ s−1.
In Equation (13.4), x refers to the concentration of a reactant. Depending on the natureof the reactants and products, it may, however, be easier to measure the concentration of aproduct. It is possible to derive integrated rate laws for these cases, but it’s a little easierto calculate the concentration or pressure of one of the reactants by stoichiometry beforeapplying Equation (13.4).
13.1.1 Half-life
The half-life (t1/2) is the time required to get half-way to equilibrium from some givenreaction conditions. The half-life is used most often for nearly irreversible reactions, inwhich case it is the time required for half the reactant to be consumed. This quantityturns out to be particularly useful in studying first-order reactions, although it has otheruses.

P1: SFK Trim: 247mm × 174mm Top: 14.586mm Gutter: 23.198mm
CUUK1808-13 CUUK1808/Roussel 978 1 107 00678 2 October 29, 2011 14:57
13.1 First-order reactions 247
To compute the half-life of a reaction, we determine the value of t = t1/2 at whichx = 1
2x0 from the integrated rate law.
x(t1/2) = x0 exp(−kt1/2) = 1
2x0
∴ −kt1/2 = ln(1/2) = − ln 2
∴ t1/2 = ln 2
k
You can see that the half-life of a first-order reaction is constant. We will soon learn thatthis is not the case for any other order of reaction, which explains why the half-life is amuch more useful statistic for first-order reactions than it is for other orders.
Example 13.2 Half-life and rate constant If a first-order reaction has a half-life of 1 h,the rate constant is
k = ln 2
t1/2= ln 2
1 h= 0.69 h−1 = 1.9 × 10⁻⁴ s−1
The half-life of a first-order reaction is independent of the initial amount of reac-tant present. This means that, for a first-order reaction, it takes the same amount oftime to eliminate half of what is left of the reactant, no matter how much of it hasalready reacted. This idea can be given mathematical form by rewriting Equation (13.3) asfollows:
x(t) = x0 exp(−kt)
= x0 exp
(− ln 2
t
t1/2
)= x0 (exp(ln 2))−t/t1/2
= x02−t/t1/2 .
∴ x(t) = x0
(1
2
)t/t1/2
(13.5)
This is just another way to write the integrated rate law for a first-order reaction. If we taket = t1/2, we get x = 1
2x0. After two half-lives (t = 2t1/2), x = 14x0; after three half-lives,
x = 18x0 and so on.
Exercise group 13.1
(1) The radical cation of 2,5-dihydrofuran (2,5-DHF+•) can be generated by irradiation ina CF3CCl3 matrix at 77 K. (Think of the matrix as a solid solvent.) The radical cationdecays with first-order kinetics. It can be detected by electron paramagnetic resonance(EPR). The intensity of the EPR signal is proportional to concentration. The following

P1: SFK Trim: 247mm × 174mm Top: 14.586mm Gutter: 23.198mm
CUUK1808-13 CUUK1808/Roussel 978 1 107 00678 2 October 29, 2011 14:57
248 Integrated Rate Laws
data were obtained:1
t /min 2.6 3.4 4.4 5.4 6.9 8.4 10.1EPR intensity 0.54 0.43 0.36 0.26 0.21 0.15 0.12
(a) Calculate the half-life of the radical cation.(b) How long would it take for the 2,5-DHF+• concentration to fall to 1% of its initial
value?(2) Indium (I) chloride dissolves quickly in dilute acid. The following reaction then occurs:
3In+(aq) → 2In(s) + In3+
(aq)
The reaction is known to obey a first-order rate law. The concentration of indium (I)ions varies with time as follows:
t /s 0 240 480 720 1000[In+]/mmol L−1 8.23 6.41 5.00 3.89 3.03
(a) Confirm that the reaction obeys a first-order rate law.(b) Obtain the rate constant for the process.(c) The total volume of the solution is 0.4 L. What mass of indium metal is formed in
15 min? The molar mass of indium is 114.82 g mol−1.(3) Suppose that a certain drug is administered in pill form at a rate of one pill every 6 hours.
Each pill, as it is manufactured, contains 18 mg of the drug. The minimum effectivedose for an adult of average mass is 12 mg every 6 hours. The drug is somewhat unstableand breaks down in a first-order process with a half-life of 47 days. What is the shelflife of the drug? In other words, how long does it take before each pill contains lessthan the minimum effective dose?
13.1.2 Other processes with first-order rate laws
In addition to chemical reactions, there are many processes with first-order rate laws. Weexamine several examples in this section.
Radioactive decay
Radioactive decay processes are almost certainly the best-known examples of processesobeying first-order rate laws. The kinetics of radioactive decay is almost always character-ized by the half-life.
It is fairly easy to measure the half-life of a short-lived radioisotope; we can measure therate of radioactive decays using a Geiger counter. Because radioactive decay is a first-orderprocess, the rate of decay is proportional to the number of atoms left. Thus we can applyour usual treatment of first-order data directly to the radioactivity measurements without
1 W. Knolle et al., J. Chem. Soc., Perkin Trans. 2, 2447 (1999).

P1: SFK Trim: 247mm × 174mm Top: 14.586mm Gutter: 23.198mm
CUUK1808-13 CUUK1808/Roussel 978 1 107 00678 2 October 29, 2011 14:57
13.1 First-order reactions 249
even needing to know how many atoms of the radioactive substance we have: a plot of ln A
(A for (radio)activity) vs. t should have a straight line of slope −k.Half-lives of radioisotopes can be very long. For very long-lived radioisotopes, the
activity of a sample might not change detectably during a person’s lifetime. How are thesehalf-lives measured? The key is that the rate of disintegrations, i.e. the radioactivity, isdirectly measurable using a Geiger counter. We simply count up the number of radioactiveparticles emitted from a sample in a given amount of time. This allows us to calculate therate:
rate = A = −�x
�t= disintegrations
time
Even if the half-life is long, the number of disintegrations can be large for a macroscopicsample because the number of atoms is large. For instance, the half-life of 40K is 1.25 ×10⁹ y, from which we can calculate k = 5.55 × 10⁻¹⁰ y−1. The natural abundance of thisisotope is 0.0117%. One gram of potassium (0.026 mol) therefore contains about 3 ×10⁻⁶ mol of potassium-40 atoms, which corresponds to about 1.8 × 10¹⁸ atoms. The rateof disintegration is therefore kx = (5.55 × 10⁻¹⁰ y−1)(1.8 × 10¹⁸) = 1 × 10⁹ y−1 ≈ 3 ×10⁶ day−1. It is therefore entirely feasible to measure the rate of disintegration since thereis a large number of events in one day, even when the half-life is very large. Given the rate,we simply divide by the number of atoms of the radioactive isotope in the sample to getthe rate constant and thence the half-life. The isotopic abundance must be independentlymeasured, but this can be straightforwardly accomplished by mass spectroscopy.
Radioisotope dating
Living organisms get almost all their carbon from one of two sources, namely from theatmosphere during photosynthesis, or from eating other living organisms. At the verybottom of the food pyramid are photosynthesizing organisms, and since the time scale fromcarbon fixation to consumption is short (several decades at most), the mixture of carbonisotopes in any living organism is essentially the same as that in the atmosphere duringits life. In particular, the ratio of carbon-14 to carbon-12 in living organisms is essentiallyidentical to that in the atmosphere. The atmospheric abundance of carbon-14 is in a steadystate. In other words, the rate of production of this isotope is balanced by its rate of decaysuch that the atmospheric concentration is approximately constant. Carbon-14 is producedfrom nitrogen-14 in the upper atmosphere by cosmic-ray neutron bombardment:
147N + 1
0n → 146C + 1
1H
The rate of this reaction depends on the intensity of cosmic rays striking the Earth. Thisdoes vary with time, but mostly only by a few percent. There are occasionally periods ofunusually low or high cosmic-ray activity,2 but these only last a few hundred years or less,which won’t affect carbon dates by much unless the artifact to be dated happens to have
2 D. Lal et al., Earth Planet. Sci. Lett. 234, 335 (2005).

P1: SFK Trim: 247mm × 174mm Top: 14.586mm Gutter: 23.198mm
CUUK1808-13 CUUK1808/Roussel 978 1 107 00678 2 October 29, 2011 14:57
250 Integrated Rate Laws
been made during one of these periods. Obviously, this is potentially a problem, which iswhy archaeologists and paleontologists generally try to confirm carbon dates using otherevidence.
Carbon-14 decays back to nitrogen-14 by spontaneous beta emission:
146C → 14
7N + 0−1β.
Again, the rates of these two processes balance each other such that the relative amountof carbon-14 in the atmosphere is nearly constant. Recently, another factor has started toaffect the relative abundance of carbon-14: due to heavy use of fossil fuels containing “old”carbon depleted of carbon-14, the relative abundance of this isotope has been decreasingover the past hundred years or so. The data given in this section is appropriate to pre-industrial samples. Carbon dating will still be useful to date artifacts of the industrial era,but the calculations will be more complex since they will need to take into account thevariation of the ratio of 14C to 12C due to the burning of fossil fuels. A similar commentcan be made about variations in cosmic-ray activity. It is possible to correct for this factor,it just takes a little extra work.
Ignoring all of these higher-order complications, we can use average data to get reason-able estimates of the age of an artifact: for typical samples, the ratio of carbon-14 to totalcarbon is such that 14C atoms disintegrate at a rate of 0.255 Bq g−1 (0.255 disintegrationsper second per gram of carbon). When an organism dies, it ceases to take in carbon. Sincecarbon-12 and carbon-13 are stable, while carbon-14 decays with a half-life of 5730 y,the ratio of carbon-14 to total carbon decreases as the remains age. Consequently, thespecific radioactivity (the number of disintegrations per minute per gram of carbon) alsodecreases.
Example 13.3 Radiocarbon dating Suppose that a wooden tool has a specific radioactivityof 0.195 Bq g−1. Since this rate is proportional to the concentration of carbon-14 atoms, wehave (from Equation 13.5),
t
t1/2= ln(x0/x)
ln 2=
ln
(0.255 Bq g−1
0.195 Bq g−1
)ln 2
= 0.387
Since the half-life is 5730 y, the wood from which the tool was made is approximately2220 y old.
Carbon dating is only reliable if:
1 Enough 14C has decayed that the rate of disintegration is significantly different from thatof an atmospheric sample, and
2 There are still enough atoms of 14C that a reasonable number of disintegrations occur ina few hours.
Generally speaking, we would want a difference of at least several percent from the atmo-spheric reading before we could reliably use carbon dating. If, for instance, our equipment

P1: SFK Trim: 247mm × 174mm Top: 14.586mm Gutter: 23.198mm
CUUK1808-13 CUUK1808/Roussel 978 1 107 00678 2 October 29, 2011 14:57
13.1 First-order reactions 251
allows us to resolve differences in disintegration counts of 2%, we could use carbon datingwith samples as young as
t = t1/2ln(1.02)
ln(2)= 160 y
At the other end of the range, we want a few disintegrations per hour so that, over a day, thestatistical fluctuations will average out and a reasonably accurate rate of disintegration willbe obtained. Very small samples are generally used since one generally wishes to preservethe artifacts being studied. A typical sample size is 0.05 g. If we want one disintegrationper hour, the minimum specific activity is
A = 1 h−1
(0.05 g)(3600 s h−1)= 0.006 Bq g−1
The age of an artifact with this specific activity would be
t = (5730 y)ln
(0.255 Bq g−1
0.006 Bq g−1
)ln 2
= 31 000 y
This is the approximate reliable range of the carbon dating technique: a few hundred to afew tens of thousands of years.
Other radioisotopes with longer half-lives can be used to date objects too old for carbondating. For instance, the following nuclear reaction is used to date rocks:
40K + e− → 40Ar
Because it is an unreactive gas, argon is almost exclusively found in the Earth’s crust asa result of radioactive decay. The ratio of argon-40 to potassium-40 can thus be used tomeasure of the age of a non-porous rock. Since the half-life of potassium-40 is 1.25 billionyears, very ancient rocks can be dated by this technique. In the experiment, a rock sample isvaporized with a high-powered laser. The gas sample is pumped off to a mass spectrometerwhich measures the ratio of 40Ar to 40K. The potassium-40 has been undergoing radioactivedecay since the rock solidified, so its concentration in the rock obeys the equation[
40K] = [40K
]0 exp(−kt)
The amount of argon-40 created by radioactive decay of potassium-40 equals the amountof potassium-40 used, i.e.[
40Ar] = [40K
]0 − [40K
] = [40K]
0 − [40K]
0 exp(−kt)
The ratio of the two isotopes is therefore
r =[
40Ar]
[40K] =[
40K]
0 − [40K]
0 exp(−kt)[40K]
0 exp(−kt)= 1
exp(−kt)− 1 = exp(−kt) − 1
Note that the initial amount of potassium-40 drops out of the equation. The ratio r isobtained by mass spectrometry. The rate constant k is calculated from the known half-life.

P1: SFK Trim: 247mm × 174mm Top: 14.586mm Gutter: 23.198mm
CUUK1808-13 CUUK1808/Roussel 978 1 107 00678 2 October 29, 2011 14:57
252 Integrated Rate Laws
The only unknown in this equation is t :
exp(kt) = r + 1
∴ kt = ln(r + 1)
∴ t = 1
kln(r + 1)
or, in terms of the half-life,
t = t1/2
ln 2ln(r + 1)
Population growth
Population growth is often described by equations similar to those for first-order chemicalprocesses. The rate law for population growth is often given as
dp
dt= kp
In this context, k is called the specific growth rate. In other words, it is the growth rate perunit population. The solution to this differential equation is
p = p0 exp(kt)
k is related to the doubling time t2 of the population by
t2 = ln 2/k
by analogy to the half-life of a chemical reaction.
Example 13.4 World population growth The following table shows estimates of theworld’s population for the last several decades:
Year 1950 1960 1970 1980 1990 2000 2010Population/109 2.56 3.04 3.71 4.45 5.27 6.07 6.91ln(p/109) 0.940 1.112 1.311 1.493 1.662 1.803 1.933
A plot of ln p vs. t is not really linear (Figure 13.2). By fitting only the 1950–1990 data, wesee that this apparent curvature is mostly due to the last two points. Up to 1990, the specificgrowth rate (slope) was k = 0.0183 y−1, corresponding to a doubling time of 38 y. If thistrend has been maintained, the world population would have hit 12 billion sometime in thelate 2030s. However, growth has clearly slowed in recent years, and many demographersbelieve that the world’s population will stabilize somewhere around 10 billion. There areseveral reasons for this slowing in population growth, but by far the largest factor is theone-child policy in China. As a result of this policy, population growth in China has slowedtremendously in recent years, from a peak of 2.3% per year in the 1960s to about 0.6% peryear now.

P1: SFK Trim: 247mm × 174mm Top: 14.586mm Gutter: 23.198mm
CUUK1808-13 CUUK1808/Roussel 978 1 107 00678 2 October 29, 2011 14:57
13.1 First-order reactions 253
0.8
1
1.2
1.4
1.6
1.8
2
1950 1960 1970 1980 1990 2000 2010
ln(p
/109 )
Year
Figure 13.2 Plot of world population data from Example 13.4. The solid line is a fit of the full dataset. The dashed line is a fit of the 1950–1990 data.
Cooling and warming
When a warm object is placed in a cool environment, the object’s temperature drops untilit reaches the temperature of the surroundings. Conversely, a cool object warms to thetemperature of its surroundings. The difference in temperature between the object and itsenvironment obeys a first-order law:
d�T
dt= −k�T
In this equation, k is a constant that depends both on the object’s and on the environment’sthermal properties. This equation is known as Newton’s law. The solution of this differentialequation is just
�T = �T0 exp(−kt) (13.6)
These equations have obvious physical applications, but they are also extensively used inforensic science.
Example 13.5 Time of death Detectives arrive at a murder scene at 2:04 a.m. The bodyis found in a climate-controlled room in which the temperature is 20.0 ◦C. They record thetemperature of the body at 2:08 a.m. and every 20 minutes thereafter for an hour. The bodyis only removed from the room after the measurements are complete. Their results are asfollows:
t 2:08 2:28 2:48 3:08T/◦C 32.2 31.1 30.0 29.1
Equation (13.6) implies that if we plot ln �T vs. t , we should get a straight line. It is alsoconvenient to convert the time into hours since midnight rather than leave it as hours and

P1: SFK Trim: 247mm × 174mm Top: 14.586mm Gutter: 23.198mm
CUUK1808-13 CUUK1808/Roussel 978 1 107 00678 2 October 29, 2011 14:57
254 Integrated Rate Laws
2.2
2.25
2.3
2.35
2.4
2.45
2.5
2.55
2 2.2 2.4 2.6 2.8 3 3.2
ln(Δ
T/°
C)
t/h
Figure 13.3 Plot of temperature data from Example 13.5.
minutes.
t /h 2.13 2.47 2.80 3.13�T/◦C 12.2 11.1 10.0 9.1ln(�T/◦C) 2.501 2.407 2.303 2.208
The data fit a straight line quite well (Figure 13.3). The equation of the line of best fit is
ln �T = 3.13 − 0.295t
Since the body’s temperature at the time of death would have been approximately 37 ◦C,�T at that moment would have been 17 ◦C. This would mean that the time of death wouldhave been approximately t = 1.0 h or 1:00 a.m.
Exercise group 13.2
(1) 90Sr has a half-life of 28.1 y. This radioisotope is particularly hazardous because itbecomes incorporated into bones and thus remains in the body and is never excreted.If a person accidentally ingests 1 μg of 90Sr, how much will remain after 40 y?
(2) Over a period of several days, a sample of 1.00 g of osmium displays an average of 47decays per day. These decays are due to the very long-lived radioisotope 186Os. Thenatural abundance of this isotope is 1.58%. What is the half-life? Express your answerin years.
(3) 238U decays by alpha emission. A natural sample of uranium weighing 0.0532 g pro-duces 651 alpha particles per second. This sample is analyzed by mass spectrom-etry and found to contain 99.2832% 238U and to have an average molar mass of238.029 229 g mol−1. What is the half-life of 238U? Express your answer in years.

P1: SFK Trim: 247mm × 174mm Top: 14.586mm Gutter: 23.198mm
CUUK1808-13 CUUK1808/Roussel 978 1 107 00678 2 October 29, 2011 14:57
13.2 Reactions of other orders 255
(4) The following table gives the population of Finland in the past two centuries:
Year 1800 1850 1900 1950 1980 1990 1998Population/103 833 1637 2656 4030 4788 4998 5160
(a) Doubling times are computed on the assumption that the population is growingexponentially. What is the doubling time for the population of Finland?
(b) Assuming exponential growth, in what year would you predict that the populationwill reach six million?
(c) Is the population really growing exponentially?(5) All stars contain traces of metals which can be detected by analyzing their spectra.
The heavier metals are almost exclusively made during extremely violent events suchas supernova explosions. The debris from a supernova is widely scattered and isincorporated into other stellar bodies (stars and planets) during their formation. Someof the very heavy metals are (relatively) stable, while others are not. If we know the ratioin which these heavy metals are initially present and the half-life of an unstable metal,we can estimate the average ages of the supernovas that contributed to the sample.Since young galaxies have many more supernova explosions than older galaxies, thisgives a rough idea of the age of the galaxy. The initial ratios are only known fromtheoretical calculations, so their values are a source of considerable uncertainty whichmust be taken into account in deriving these estimates.
232Th has a very long half-life and can be taken to be stable for the purpose of thesecalculations. 238U has a much shorter half-life of about 4.5 Gy. According to stellarnucleosynthesis models, the initial ratio of 238U to 232Th was between 0.56 and 0.79.The currently observed ratio of these two isotopes in star CS31082-001 is 0.18. Usingthese data, determine a range of possible ages for our galaxy.
(6) While cooking a beef roast recently, I recorded the following data: the oven temperaturewas 175◦C; I recorded the internal temperature of the roast at various times (given ashours and minutes p.m.) during the cooking process:
Time 4:37 4:53 5:13 5:25 5:33T/◦C 6 19 39 51 60
The experiment stopped at 5:33 p.m. because the internal temperature had reached themedium-rare point. Do these data obey Newton’s law for warming?
13.2 Reactions of other orders
Reactions with simple rate laws whose order is different than one can be treated together.The rate equation is
dx
dt= −kxn (13.7)

P1: SFK Trim: 247mm × 174mm Top: 14.586mm Gutter: 23.198mm
CUUK1808-13 CUUK1808/Roussel 978 1 107 00678 2 October 29, 2011 14:57
256 Integrated Rate Laws
We solve this equation by separation of variables:
dx
xn= −k dt
∴∫ x
x0
(x ′)−n dx ′ = −k
∫ t
0dt ′
∴ 1
−n + 1(x ′)−n+1
∣∣xx0
= −k t ′∣∣t0
∴ 1
1 − n
(x1−n − x1−n
0
) = −kt
or x1−n = x1−n0 + kt(n − 1) (13.8)
As in our treatment of first-order processes, x0 is the value of x at time zero.We typically use Equation (13.8) the same way as we do the first-order equation, i.e.
by constructing a plot in which the data appear as a straight line. If we think (or know,from other evidence), that a reaction might obey an nth order rate law, we plot x1−n vs.t . For an nth order reaction, this will give a straight line of slope k(n − 1) so that the rateconstant can be obtained. On the other hand, if we have the wrong rate law (wrong n, ordata that doesn’t obey a simple rate law at all), our graph will be curved. If the order of thereaction is not known, we can try plots appropriate to different values of n to see if one fitsparticularly well.
Second-order reactions are particularly important. For n = 2, Equation (13.8) specializesto
1
x= 1
x0+ kt (13.9)
so a plot of 1/x as a function of t gives a straight line of slope k.
Example 13.6 Determining the order of reaction The decomposition of chlorine dioxideto chlorine and oxygen is known to be a complex reaction. The overall reaction is
2ClO(g) → Cl2(g) + O2(g)
The following data were obtained in one experiment:
t /ms 0.12 0.96 2.24 3.20 4.00 5.20 6.81[ClO]/μmol L−1 8.49 7.10 5.79 5.20 4.77 4.17 3.61
We would like to determine if this reaction obeys a simple rate law, and if so, what theorder is. Generally in these cases, we might try the first- and second-order rate laws becausethese are the two most common alternatives, unless something about the reaction suggeststo us that we should try something else. If one of the two plots fits the data well, we wouldconclude that the reaction is of that order.
If the reaction is of the first order, a plot of ln[ClO] against time should be linear. Thedata don’t fit the first-order rate law very well (Figure 13.4). Real experimental data oftenhas noticeable scatter around a line of best fit. What we’re looking for when we are trying
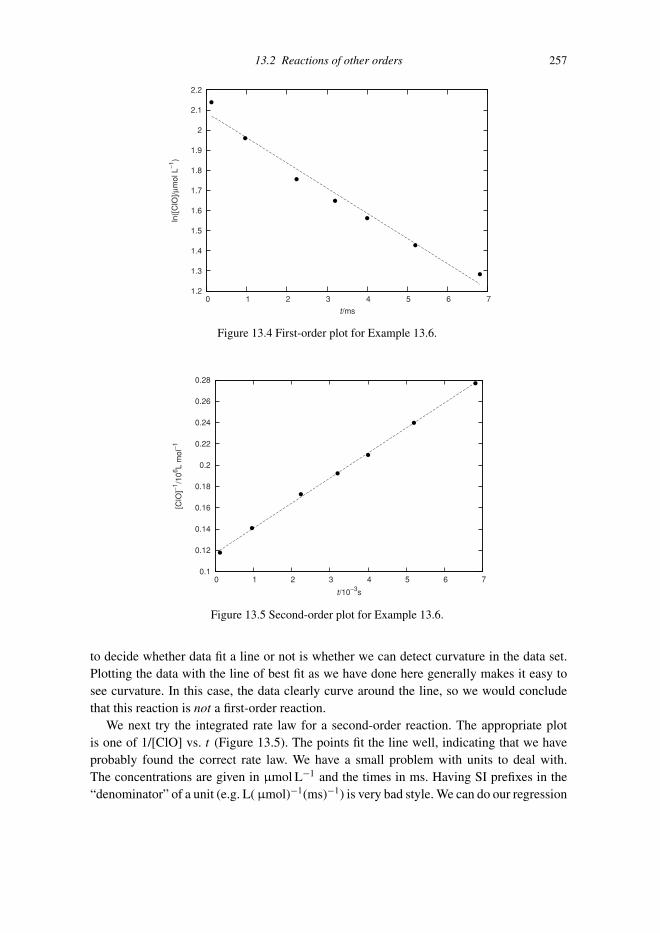
P1: SFK Trim: 247mm × 174mm Top: 14.586mm Gutter: 23.198mm
CUUK1808-13 CUUK1808/Roussel 978 1 107 00678 2 October 29, 2011 14:57
13.2 Reactions of other orders 257
1.2
1.3
1.4
1.5
1.6
1.7
1.8
1.9
2
2.1
2.2
0 1 2 3 4 5 6 7
ln([
ClO
]/μm
ol L
−1)
t/ms
Figure 13.4 First-order plot for Example 13.6.
0.1
0.12
0.14
0.16
0.18
0.2
0.22
0.24
0.26
0.28
0 1 2 3 4 5 6 7
[ClO
]−1/1
06 L m
ol−1
t/10−3s
Figure 13.5 Second-order plot for Example 13.6.
to decide whether data fit a line or not is whether we can detect curvature in the data set.Plotting the data with the line of best fit as we have done here generally makes it easy tosee curvature. In this case, the data clearly curve around the line, so we would concludethat this reaction is not a first-order reaction.
We next try the integrated rate law for a second-order reaction. The appropriate plotis one of 1/[ClO] vs. t (Figure 13.5). The points fit the line well, indicating that we haveprobably found the correct rate law. We have a small problem with units to deal with.The concentrations are given in μmol L−1 and the times in ms. Having SI prefixes in the“denominator” of a unit (e.g. L( μmol)−1(ms)−1) is very bad style. We can do our regression

P1: SFK Trim: 247mm × 174mm Top: 14.586mm Gutter: 23.198mm
CUUK1808-13 CUUK1808/Roussel 978 1 107 00678 2 October 29, 2011 14:57
258 Integrated Rate Laws
using the raw data and then convert to L mol−1s−1 at the end, but I find this to be an error-prone process. A better approach is to convert the concentrations to mol L−1 and the timesto s before doing the linear regression. (In effect, I do this before I draw the graph, althoughI may still take out a power of 10 when I label my axes, as I have done here.) If you do this,you will find a rate constant (the slope of the line) of k = 2.35 × 10⁷ L mol−1s−1.
There’s one little subtlety here. If we just want to use Equation (13.9) to predict [ClO](or, by stoichiometry, the concentrations of some of the products) at future times, then therate constant we found above is perfectly adequate. However, if we want the rate constantfor this reaction to agree with the definition of rate in Section 11.2, we have to look at thestoichiometry of the reaction, which in this case has a stoichiometric coefficient of 2 forthe ClO. By convention, the rate of reaction is therefore
v = −1
2
d[ClO]
dt= k[ClO]2
or
d[ClO]
dt= −2k[ClO]2
This differs in form from Equation (13.7) by a factor of 2. In other words, the “rateconstant” we calculated above is really twice the real rate constant of this reaction. Weshould therefore report
k = 1
2
(2.35 × 10⁷ L mol−1s−1
) = 1.18 × 10⁷ L mol−1s−1
Note that either answer is acceptable provided it’s clear which one you’re providing.
This method of distinguishing between simple rate laws requires a reasonably longtime series. Data that only span one half-life or less will probably not be sufficient todistinguish between rate laws on the basis of the time course of the reaction, particularly ifthe experimental uncertainties are large, as we will see in the following example.
Example 13.7 Too little data Consider the following data for a reaction A → B:
t /ms 0 10 20 30 40 50 60
a/mol L−1 0.50 0.46 0.43 0.39 0.36 0.34 0.31
Note that these data cover less than one half-life. Compare the first- and second-order plotsshown in Figure 13.6. Neither of these plots is obviously better than the other.
You will note that I decide which plot is better based on visual appearance. Many studentswho have taken statistics are tempted to use the correlation coefficient. This is indeedvery tempting: most scientists like quantitative measures, and the correlation coefficientmeasures how good a linear relationship we have. Why not use this coefficient? The problemis that the correlation coefficient can’t distinguish between scatter, which is expected inexperimental measurements, and non-linearity, which indicates that we are using the wrong

P1: SFK Trim: 247mm × 174mm Top: 14.586mm Gutter: 23.198mm
CUUK1808-13 CUUK1808/Roussel 978 1 107 00678 2 October 29, 2011 14:57
13.2 Reactions of other orders 259
−1.2
−1.15
−1.1
−1.05
−1
−0.95
−0.9
−0.85
−0.8
−0.75
−0.7
−0.65
0 10 20 30 40 50 60
ln(a
/mol
L−1
)
t/ms
1.8
2
2.2
2.4
2.6
2.8
3
3.2
3.4
0 10 20 30 40 50 60
a−1
/L m
ol−1
t/ms
Figure 13.6 Plots of data from Example 13.7
model for the data. The following example demonstrates how the correlation coefficientcan fail to distinguish between scatter and curvature.
Example 13.8 Scatter vs. curvature Consider the following data set from a kineticsexperiment:
t /s x/mol L−1
0 0.3560.12 0.2600.24 0.1670.36 0.1420.48 0.1030.60 0.0850.72 0.0510.84 0.0400.96 0.032
Figure 13.7 shows these data plotted on a logarithmic scale, along with the line of best fit.There is some scatter, but overall the data fit a first-order relationship well.
Now consider the following data set:
t /s x/mol L−1
0 0.3200.12 0.2860.24 0.2490.36 0.2130.48 0.1790.60 0.1490.72 0.1220.84 0.1000.96 0.081

P1: SFK Trim: 247mm × 174mm Top: 14.586mm Gutter: 23.198mm
CUUK1808-13 CUUK1808/Roussel 978 1 107 00678 2 October 29, 2011 14:57
260 Integrated Rate Laws
−4
−3.5
−3
−2.5
−2
−1.5
−1
−0.5
0 0.2 0.4 0.6 0.8 1
ln(x
/mol
L−1
)
t/s
Figure 13.7 First-order plot for the first data set from Example 13.8. The correlation coefficient forthis data set is −0.9962.
−2.6
−2.4
−2.2
−2
−1.8
−1.6
−1.4
−1.2
−1
−0.8
0 0.2 0.4 0.6 0.8 1
ln(x
/mol
L−1
)
t/s
Figure 13.8 First-order plot for the second data set from Example 13.8. The correlation coefficientfor this data set is also −0.9962.
The first-order plot for these data is shown in Figure 13.8. This data set clearly showscurvature rather than random scatter. However, the linear correlation coefficient of this dataset is exactly the same as that of the first data set. Clearly then, correlation coefficients don’ttell the whole story. The lesson to learn from this example is that in typical applicationsin the physical sciences, we should look at the graph of the data, not at the correlationcoefficient.

P1: SFK Trim: 247mm × 174mm Top: 14.586mm Gutter: 23.198mm
CUUK1808-13 CUUK1808/Roussel 978 1 107 00678 2 October 29, 2011 14:57
13.2 Reactions of other orders 261
Half-life
The half-life of a reaction of general order is found by setting x = 12x0 and solving for
t = t1/2 from the general integrated rate law (13.8):
t1/2 = 2n−1 − 1
kxn−10 (n − 1)
(13.10)
The half-life in general depends on the initial concentration of reactant. First-order reactionstherefore stand out as an exceptional case for having constant half-lives. For this reason,half-lives are often used to describe first-order reactions, and rarely used for other orders.In principle though, it is possible to determine the order of a reaction from the dependenceof the half-life on initial concentration.
Exercise group 13.3
(1) For the essentially irreversible reaction 2A(aq) → B(aq), the following data wereobtained:
t /min 0 10 20 30 40 ∞b/mol L−1 0 0.089 0.153 0.200 0.230 0.312
Previous experiments showed that the rate did not depend on b. The order of thereaction with respect to A is either 1
2 or 1. Can these data be used to determine theorder? If so, report the order and rate constant. If not, demonstrate that the data areinadequate to this purpose.Hint: The amount of B that accumulates after a long time can be used to calculate theinitial amount of A.
(2) The reaction of ethyl acetate with hydroxide to form acetate ions and ethanol has arate law v = k[AcOEt][OH−] with a rate constant of 0.11 L mol−1s−1. If the initialconcentrations are [AcOEt] = [OH−] = 0.05 mol L−1, what would the concentrationof ethanol be after 10 min?
(3) π–π interactions in molecules with several double or triple bonds often result inthe formation of loosely bound dimers or, in extreme cases, of stacks of molecules.Butadiene dimerizes in this way in the gas phase, i.e. it undergoes the reaction2 butadiene → dimer. The following data were obtained in a reaction vessel held at326 ◦C that originally contained pure butadiene:
t /min p/torr
0 632.020.78 556.949.50 498.177.57 464.8
103.58 442.6
Note that the pressure measured is the total pressure, not the pressure of reactant.

P1: SFK Trim: 247mm × 174mm Top: 14.586mm Gutter: 23.198mm
CUUK1808-13 CUUK1808/Roussel 978 1 107 00678 2 October 29, 2011 14:57
262 Integrated Rate Laws
(a) Could this reaction be elementary? If so, what would the order of the reaction be?(b) Are the data consistent with the order of reaction you predicted above? If so, what
is the rate constant?(4) Suppose that a company wants to remove a pollutant X from a solution produced
as a byproduct of an industrial process. Their research department finds a reactionX + A → Y + 2Z that can convert the pollutant into the harmless substances Y and Z.(a) Preliminary experiments indicate that the rate of the reaction only depends on the
concentration of X and that the order with respect to X is either 2 or 3. To determinethe order of the reaction, an experiment was performed in which the concentrationof the product Z was followed as a function of time:
t /min 0 3.22 6.58 10.02 13.91z/mmol L−1 0 13.0 22.6 30.0 36.4
In this experiment, the initial concentration of X was 0.0400 mol L−1. What is theorder of the reaction and rate constant?
(b) The industrial waste produced by this company contains X at a concentra-tion of 0.2 mol L−1 and is considered safe when this concentration drops below1 μmol L−1. If the reaction conditions are more or less as given above, how longwould the treatment of the industrial waste take? In your opinion, is this an accept-able length of time?
(5) Isoxaflutole (denoted by I in the table below) is a herbicide used to halt the growthof grass and broadleaf weeds in corn fields. In a recent study,3 the concentration ofisoxaflutole was measured in the top soil of corn fields after application of this herbicide.In a sandy loam field, the following data were obtained:
t /days 0 14 29 45 70 87 105[I]/μg (kgsoil)−1 99 42 29 21 12 9 7
Leaching of chemicals out of soil generally follows first-order kinetics, as do variousdegradation processes. However, the authors of this study claim that the decay ofthe isoxaflutole concentration obeys second-order kinetics. Unfortunately, they do notshow their analysis. Do these data unambiguously support the authors’ claim? If thedata are clearly consistent with a particular order of reaction (whether first or secondorder) give the corresponding rate constant. Otherwise, explain clearly why these datacannot be used to claim either a first- or a second-order relationship.
13.3 Two-reactant reactions
13.3.1 How to avoid complex integrated rate laws
It is possible to obtain integrated rate laws for more complicated cases, such as reactionswith two or more reactants. These equations are more complex than those for simple
3 J. Rouchaud et al., Arch. Environ. Contam. Toxicol. 42, 280 (2002).

P1: SFK Trim: 247mm × 174mm Top: 14.586mm Gutter: 23.198mm
CUUK1808-13 CUUK1808/Roussel 978 1 107 00678 2 October 29, 2011 14:57
13.3 Two-reactant reactions 263
reactions, so they tend to be harder to use in practice, and they are of almost no use if wedon’t already know the partial orders of the reaction. In general, kineticists avoid them.
Kineticists like to keep things as simple as possible, particularly when exploring a newreaction. Ideally, we would study the dependence of the rate on one concentration at atime. It turns out that we can do exactly that by using a large excess of one reagent. Theconcentration of the reagent in large excess will remain roughly constant, so we will thenhave isolated the kinetics of the other reagent.
Suppose we have a two-reactant reaction, again with a stoichiometry A + B → C. Weassume this reaction has a rate law v = kaαbβ . If we have a large (say, hundredfold)stoichiometric excess of B, then b = b1 is approximately constant, and the rate law reducesto v = k′aα , where k′ = kb
β
1 is a pseudo-first-order rate constant. We treat this reactionunder these conditions as if A were the only reactant and determine k′ and α. Once weknow these, we turn around and use a large stoichiometric excess of A (a = a2), so thatv = k′′bβ , and find k′′ and β. Once we know all of these constants, we can calculate thetrue rate constant k by k = k′/bβ
1 = k′′/aα2 . The two estimates of k should of course agree
within the experimental errors.In an important variation on this technique, we do experiments at several different
concentrations of B, each of which is much larger than the initial concentration of A. Wedetermine the order of the reaction with respect to A as above, with the added caveat that weshould get the same order of reaction at each value of b. We will, however, get a differentvalue of k′ for each concentration of B since k′ = kbβ . Then we plot ln k′ vs. ln b which, ifall goes well, should give a straight line of slope β and intercept k.
13.3.2 Integrated rate laws
Suppose that you do want an integrated rate law for a reaction with two reactants. Thesecases can also be treated by separation of variables because the reactant concentrations arerelated by stoichiometry. It’s much easier to see how this works through examples than bytrying to explain it in general, so here goes:
Example 13.9 Suppose that the rate of the reaction A + B → C is known to be v = kab.There are two cases to consider:
(1) If the initial concentrations of A and B are equal, then we know by stoichiometry thata = b throughout the course of the reaction. It follows that v = ka2 and we can useEquation (13.9) to describe the time course of the reaction.
(2) Otherwise, the two concentrations are still related by stoichiometry. Suppose that theinitial reaction mixture contains none of the product C. Then c represents both theamount of A reacted and the amount of B reacted. By stoichiometry, it follows thata = a0 − c and b = b0 − c where a0 and b0 are the initial concentrations of the tworeactants. The rate law becomes
v = dc
dt= k(a0 − c)(b0 − c)

P1: SFK Trim: 247mm × 174mm Top: 14.586mm Gutter: 23.198mm
CUUK1808-13 CUUK1808/Roussel 978 1 107 00678 2 October 29, 2011 14:57
264 Integrated Rate Laws
This differential equation can be solved by separation of variables:∫ c(t)
0
dc′
(a0 − c′)(b0 − c′)=∫ t
0k dt ′
The integral on the right-hand side is trivial. The integral on the left-hand side can besolved using the table of integrals given in Appendix I.1. The appendix tells us that∫
dx
(a + bx)(c + ex)= 1
ae − bcln
(c + ex
a + bx
)
Our variable of integration is c′ rather than x. The other correspondences are more-or-less obvious (a ← a0, b ← −1, etc.). Our integral is
kt =∫ c(t)
0
dc′
(a0 − c′)(b0 − c′)
= 1
−a0 − (−b0)ln
(b0 − c′
a0 − c′
)∣∣∣∣c(t)
0
= 1
b0 − a0
[ln
(b0 − c(t)
a0 − c(t)
)− ln
(b0
a0
)](13.11)
= 1
b0 − a0ln
(a0(b0 − c(t))
b0(a0 − c(t))
)
With a little effort, we can isolate c(t):
c(t) = a0b0[ekt(b0−a0) − 1
]b0ekt(b0−a0) − a0
If we know the initial concentrations and rate constant, we can calculate the concen-tration of the product, and therefore, by stoichiometry, of the reactants, at any time t .
We can also rearrange Equation (13.11) to a form suitable for extracting the rateconstant by a graphical method: Recall that b0 − c = b and a0 − c = a. Thus we have
ln
(b
a
)= (b0 − a0)kt + ln
(b0
a0
)(13.12)
A graph of ln(b/a) vs. t should give us a straight line with a slope of (b0 − a0)k.In almost every instance, we know the initial concentrations of a and b, so we cancalculate the rate constant from the slope.
13.4 Reversible elementary reactions
If a mechanism consists of a single reversible elementary reaction, we can solve therate equation after the application of a simple stoichiometric argument. As an example,we consider aspartic acid dating, a technique that is sometimes used to date biologicalmaterials.

P1: SFK Trim: 247mm × 174mm Top: 14.586mm Gutter: 23.198mm
CUUK1808-13 CUUK1808/Roussel 978 1 107 00678 2 October 29, 2011 14:57
13.4 Reversible elementary reactions 265
Most living organisms only produce the l stereoisomers of the amino acids. Thus,living tissue mostly contains the l amino acids. However, once an organism dies, it stopsreplenishing its supply of amino acids and natural processes result in racemization, i.e. inequilibration between the d and l forms. In principle then, we can use the ratio of the d tol amino acids to determine how long it has been since a piece of living tissue died. Theamino acid of choice in these studies is aspartic acid.
Interestingly, this technique can also be used to determine the ages of individuals in apopulation because some types of tissue consist essentially of dead material deposited atbirth. Aspartic acid dating has been used to determine the ages of bowhead whales, withsome surprising results.4
Although the isomerization is not an elementary reaction, both directions behave likesimple first-order reactions:
lkLD−−⇀↽−−kDL
d
The rate equation for (say) the L form is
d[l]
dt= −kLD[l] + kDL[d]
Since the total amount of the d and l forms is constant, we have
[l] + [d] = [l]0 + [d]0 (13.13)
where [l]0 is the initial concentration of the l amino acid and [d]0 is the initial concentrationof the d form. The differential equation to solve is therefore
d[l]
dt= −kLD[l] + kDL ([l]0 + [d]0 − [l])
Changing the stereochemistry at a carbon center involves essentially identical steps, whetherone is going in one direction or the other. Thus the rate constants kLD and kDL are roughlyequal. The differential equation therefore simplifies to
d[l]
dt= −k[l] + k ([l]0 + [d]0 − [l]) = k ([l]0 + [d]0 − 2[l])
where k = kLD = kDL. By separation of variables, we obtain∫ [l]
[l]0
d[l]
2[l] − [l]0 − [d]0= −kt
(Both sides were multiplied by −1 to make some of the algebra that follows a littlesimpler.) This integral can be solved by the simple substitution u = 2[l] − [l]0 − [d]0.Then du = 2 d[l] and the integral becomes
1
2
∫du
u= 1
2ln u = 1
2ln (2[l] − [l]0 − [d]0)
4 J. C. George et al., Can. J. Zool. 77, 571 (1999).
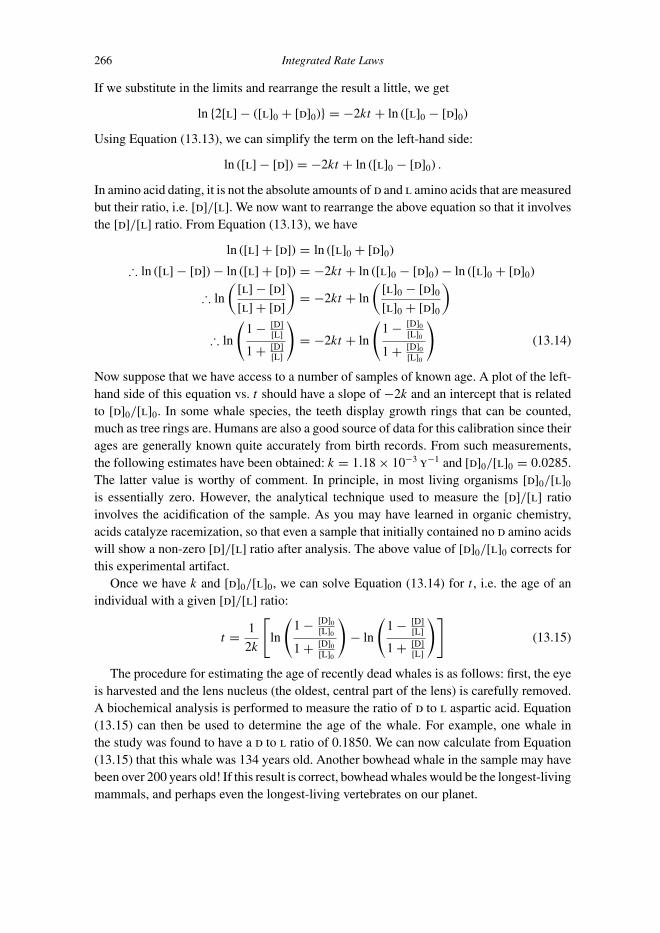
P1: SFK Trim: 247mm × 174mm Top: 14.586mm Gutter: 23.198mm
CUUK1808-13 CUUK1808/Roussel 978 1 107 00678 2 October 29, 2011 14:57
266 Integrated Rate Laws
If we substitute in the limits and rearrange the result a little, we get
ln {2[l] − ([l]0 + [d]0)} = −2kt + ln ([l]0 − [d]0)
Using Equation (13.13), we can simplify the term on the left-hand side:
ln ([l] − [d]) = −2kt + ln ([l]0 − [d]0) .
In amino acid dating, it is not the absolute amounts of d and l amino acids that are measuredbut their ratio, i.e. [d]/[l]. We now want to rearrange the above equation so that it involvesthe [d]/[l] ratio. From Equation (13.13), we have
ln ([l] + [d]) = ln ([l]0 + [d]0)
∴ ln ([l] − [d]) − ln ([l] + [d]) = −2kt + ln ([l]0 − [d]0) − ln ([l]0 + [d]0)
∴ ln
([l] − [d]
[l] + [d]
)= −2kt + ln
([l]0 − [d]0
[l]0 + [d]0
)
∴ ln
(1 − [D]
[L]
1 + [D][L]
)= −2kt + ln
(1 − [D]0
[L]0
1 + [D]0[L]0
)(13.14)
Now suppose that we have access to a number of samples of known age. A plot of the left-hand side of this equation vs. t should have a slope of −2k and an intercept that is relatedto [d]0/[l]0. In some whale species, the teeth display growth rings that can be counted,much as tree rings are. Humans are also a good source of data for this calibration since theirages are generally known quite accurately from birth records. From such measurements,the following estimates have been obtained: k = 1.18 × 10⁻³ y−1 and [d]0/[l]0 = 0.0285.The latter value is worthy of comment. In principle, in most living organisms [d]0/[l]0
is essentially zero. However, the analytical technique used to measure the [d]/[l] ratioinvolves the acidification of the sample. As you may have learned in organic chemistry,acids catalyze racemization, so that even a sample that initially contained no d amino acidswill show a non-zero [d]/[l] ratio after analysis. The above value of [d]0/[l]0 corrects forthis experimental artifact.
Once we have k and [d]0/[l]0, we can solve Equation (13.14) for t , i.e. the age of anindividual with a given [d]/[l] ratio:
t = 1
2k
[ln
(1 − [D]0
[L]0
1 + [D]0[L]0
)− ln
(1 − [D]
[L]
1 + [D][L]
)](13.15)
The procedure for estimating the age of recently dead whales is as follows: first, the eyeis harvested and the lens nucleus (the oldest, central part of the lens) is carefully removed.A biochemical analysis is performed to measure the ratio of d to l aspartic acid. Equation(13.15) can then be used to determine the age of the whale. For example, one whale inthe study was found to have a d to l ratio of 0.1850. We can now calculate from Equation(13.15) that this whale was 134 years old. Another bowhead whale in the sample may havebeen over 200 years old! If this result is correct, bowhead whales would be the longest-livingmammals, and perhaps even the longest-living vertebrates on our planet.

P1: SFK Trim: 247mm × 174mm Top: 14.586mm Gutter: 23.198mm
CUUK1808-13 CUUK1808/Roussel 978 1 107 00678 2 October 29, 2011 14:57
13.5 Fluorescence kinetics 267
This method has several significant sources of uncertainty. As we will see later, rateconstants increase with temperature. The estimate of k used in this study is based on anaverage of data from humans and fin whales. The average body temperature of humans is37 ◦C while the body temperature of fin whales is approximately 36 ◦C. The bowhead isan Arctic species. Its eyes are in almost constant contact with freezing water so that thetemperature of its eye lens is probably somewhat lower than either of the above. Accord-ingly, the appropriate rate constant for aspartic acid racemization in bowhead whale eyelenses is probably smaller than the estimate used. This would mean that bowheads wouldbe older than calculated. Other sources of error, mostly relating to bacterial contamination,would cause the ages calculated by the aspartic acid method to be overestimates of thetrue ages of the whales. It is impossible to tell without considerable further study whichsource of error is the most important. However, one other line of evidence supports thehypothesis that bowheads are extraordinarily long-lived: it is not uncommon to find har-poon heads deeply buried in the flesh of recently deceased bowheads. These harpoon headswould have been implanted into the whales as a result of unsuccessful hunts. Anthro-pologists have examined these harpoons. Based on the style and materials used, some ofthe recovered harpoon heads may be over 100 years old. A whale that escaped a huntwas probably a mature individual at the time, so some of these whales must be very oldindeed.
Exercise group 13.4
(1) Suppose that the reaction 2A + 3B → P has a rate law v = kab. Write down an integralthat relates the concentration of P to time if a(0) = a0, b(0) = b0 and p(0) = 0. Do notsolve the integral.
(2) Consider the reaction
2H2(g) + 2NO(g) → 2H2O(g) + N2(g)
(a) Could this reaction be studied by monitoring the total pressure? Why or why not?(b) The empirical rate law for the reaction is v = k[H2][NO]2. Derive an integrated
rate law for this reaction with general initial conditions. Leave your answer in theform t = something.
1. At 700 ◦C, k = 0.384 L2 mol−2 s−1. If the initial concentrations of hydrogen andof nitrogen monoxide are, respectively, 0.10 and 0.050 mol L−1, how long wouldit take to consume 95% of the NO?
13.5 Fluorescence kinetics
Way back in Section 3.5.1, I mentioned that quantum yields are difficult to measure directly,and that there was a method based on fluorescence to measure the FRET efficiency. Wenow have enough kinetics to look at these methods.

P1: SFK Trim: 247mm × 174mm Top: 14.586mm Gutter: 23.198mm
CUUK1808-13 CUUK1808/Roussel 978 1 107 00678 2 October 29, 2011 14:57
268 Integrated Rate Laws
Imagine the following experiment: we give a fluorescent sample a short flash of light;we then watch the fluorescent emission over time. After the flash, the energy stored inelectronic excitation of a molecule can be lost in the following ways:
� The molecule can fluoresce.� The molecule can transfer its excitation to another molecule by FRET.� The molecule can lose its electronic energy in some other way (e.g. collisional deactiva-
tion).
These alternatives can be expressed as reactions. The donor will be denoted D, and theacceptor A. Excitation will be represented by an asterisk. The three reactions correspondingto the above three deactivation pathways are, in order,
D∗ kf−→ D + hν
D∗ + AkFRET−−→ D + A∗
D∗ kc−→ D
The last reaction represents all deactivation mechanisms other than fluorescence andFRET.
True second-order processes arise because two molecules have to come together to react.When FRET is used as a spectroscopic ruler, the donor and acceptor are generally part ofa single molecular assembly (molecule or complex), so really we’re talking about FRETbeing a first-order process, despite the representation above, which suggests a second-orderprocess.
The fluorescence intensity at any given time is just the rate at which photons are beingemitted by fluorescence, i.e. If = kf [D∗]. Thus, the fluorescence intensity is proportionalto the concentration of excited fluorophores, [D∗]. This concentration will decrease withtime due to the above processes. The rate equation for [D∗] is
d[D∗]
dt= − (kf + kc + kFRET
)[D∗]
This is a first-order process with effective rate constant
k = kf + kc + kFRET
The solution to the first-order equation is, of course
[D∗] = [D∗]0 exp(−kt).
By convention, spectroscopists write the exponential term in the form exp(−t/τ ), where τ
is the fluorescence lifetime. By comparison, you can see that k = τ−1, or
τ−1DA = kf + kc + kFRET

P1: SFK Trim: 247mm × 174mm Top: 14.586mm Gutter: 23.198mm
CUUK1808-13 CUUK1808/Roussel 978 1 107 00678 2 October 29, 2011 14:57
13.5 Fluorescence kinetics 269
where we have added the subscript “DA” to emphasize that this is the lifetime of the donorin the presence of the acceptor. If we measure the lifetime in the absence of the acceptor,then we would have
τ−1D = kf + kc
The FRET efficiency is the fraction of the photons absorbed by the donor that are transferredto the acceptor. For a single molecule, the probability that the excitation decays by anyparticular process is proportional to its rate constant, so in particular, the probability thata molecule transfers its excitation by FRET is proportional to kFRET. Since the excitationhas to eventually be lost by one of the three processes considered here, then kFRET/k is theprobability that the excitation will be lost by FRET or, averaged over a large number ofmolecules, the efficiency:
ηFRET = kFRET
kf + kc + kFRET
= τ−1DA − τ−1
D
τ−1DA
= 1 − τ−1D
τ−1DA
= 1 − τDA
τD
The FRET efficiency can therefore be expressed in terms of the fluorescence lifetimes mea-sured with and without the acceptor. The lifetimes are easy to measure: since fluorescencedecay is a first-order process, we just plot the logarithm of the fluorescence intensity vs.time. The slope of this graph is k, and the lifetime is the inverse of this value. Fluorescencelifetimes are generally of the order of milliseconds, so the flash that starts off the exper-iment and the subsequent intensity measurements must be coordinated electronically, butthis is still much easier than photon counting, which is what we need to do to get quantumyields.
Example 13.10 Cameleon proteins are genetically engineered proteins that consist of adonor and an acceptor fused to either side of a protein that undergoes a conformationalchange on calcium binding. The change in fluorescence on calcium binding can thereforebe used as a calcium indicator. YC3.60 uses enhanced cyan fluorescent protein (ECFP)as the donor, and Venus, an enhanced yellow fluorescent protein, as the acceptor. For thisdonor–acceptor pair, R0 = 4.90 nm. The fluorescence lifetime of the donor ECFP alone is2.71 ns. The fluorescence lifetime of YC3.60 in the absence of calcium is 1.33 ns, whilethe lifetime in the presence of calcium is 0.095 ns.5 These data allow us to calculate thedistance between ECFP and Venus in the presence and absence of calcium.
Without calcium, we have
ηFRET = 1 − τDA
τD= 1 − 1.33 ns
2.71 ns= 0.509
5 J. W. Borst et al., Biophys. J. 95, 5399 (2008).

P1: SFK Trim: 247mm × 174mm Top: 14.586mm Gutter: 23.198mm
CUUK1808-13 CUUK1808/Roussel 978 1 107 00678 2 October 29, 2011 14:57
270 Integrated Rate Laws
Using Equation (3.9), we have(R
R0
)6
= 1
ηFRET− 1 = 1
0.509− 1 = 0.96
∴ R
R0= (0.96)1/6 = 0.99
∴ R = 0.99(4.90 nm) = 4.9 nm
If we repeat these calculations for YC3.60 in the presence of calcium, we get R = 2.8 nm.The interpretation of these numbers is that YC3.60 collapses to a compact conformationon calcium binding, with the two ends of the protein close together.
Exercise group 13.5
(1) Polyglutamine repeats in proteins are thought to facilitate amyloid plaque formation,which in turn is thought to be important in several neurological diseases. Digambaranathand coworkers have studied the structure of polyglutamine using FRET.6 Specifically,they studied a polyglutamine they called DQ16 which had an N -terminal o-aminobenz-amide (a fluorescent donor group), and another called DQ16A which was identical toDQ16 except that it had an acceptor group, 3-nitrotyrosine, at its C-terminal. The R0
value for this donor–acceptor pair is 24.3 A in acidic solution.(a) Following a light pulse, the fluorescence intensity of DQ16 decayed as follows:
t/ns 5.05 9.00 13.18 17.57I 0.827 0.551 0.323 0.218
What is the fluorescence lifetime of DQ16?(b) A similar set of measurements for of DQ16A gave the following results:
t/ns 4.79 9.00 13.18 17.57I 0.696 0.320 0.150 0.071
What is the fluorescence lifetime of DQ16?(c) What is the distance between the N - and C-terminals of this peptide?
Key ideas and equations
� Separation of variables� For first-order reactions,◦ x = x0 exp(−kt) or ln x = ln x0 − kt
◦ t1/2 = ln 2/k
� For reactions of order n �= 1, x1−n = x1−n0 + kt(n − 1)
� ηFRET = 1 − τDA/τD
6 J. L. Digambaranath et al., Proteins 79, 1427 (2011).

P1: SFK Trim: 247mm × 174mm Top: 14.586mm Gutter: 23.198mm
CUUK1808-13 CUUK1808/Roussel 978 1 107 00678 2 October 29, 2011 14:57
13.5 Fluorescence kinetics 271
Review exercise group 13.6
(1) Suppose that someone told you that a second-order reaction has a half-life of 30 s at25 ◦C. Is this a meaningful statement? Explain briefly.
(2) As we have seen, exponential growth or decay, corresponding to a first-order rate law,are commonly observed in a variety of contexts. Consider the following atmosphericCO2 data:7
Year 1744 1847 1943 1962 1980 2000
[CO2]/ppm 276.8 286.8 307.9 317.62 336.98 367.01
Is the atmospheric CO2 concentration growing exponentially? If so, what is the doublingtime? If not, is the growth faster or slower than exponential?
Aside: A very deep ice core taken at the Russian Vostok research station in EastAntarctica provides data for the last 400 000 years. The atmospheric CO2 levels duringthis period have fluctuated quite a bit, but have never been higher (until the lastfew years) than 300 ppm. A single reading of 298.7 ppm was obtained for a samplecorresponding to 323 000 years before the present. All the other readings are below290 ppm. Recent CO2 levels are therefore higher than any in the recent geologicalhistory of the planet, which is one of the major sources of concern about the rapidincrease in atmospheric carbon dioxide concentrations in our times: we are rapidlygetting away from a range of concentrations where historical trends provide any clueas to what will happen next.
(3) When ion channels are opened in a cell membrane (e.g. the membranes of neurons),the flow of ions creates a voltage difference between the two sides of the membrane.This voltage is not established instantaneously but obeys the rate law
d(�V )
dt= −�V
RC
where �V is the difference between the transmembrane voltage and its equilibriumvalue,
�V = V − Veq
R is the membrane electrical resistance and C is its capacitance. Resistance is measuredin ohms (�), and capacitance is measured in farads (F). The units of resistance andcapacitance combine as follows: 1 � × 1 F = 1 s.(a) Derive an integrated rate law for the voltage. Write your final answer in the form
V = something. Show all your steps.
7 The first three points are from the Antarctic ice core data of Neftel et al. (1994), available on the web athttp://cdiac.esd.ornl.gov/trends/co2/siple.htm. The last three points are annual averages of direct atmospheric measurementstaken since 1957 at the South Pole and summarized by Keeling and Whorf (2002) at http://cdiac.esd.ornl.gov/trends/co2/sio-spl.htm.

P1: SFK Trim: 247mm × 174mm Top: 14.586mm Gutter: 23.198mm
CUUK1808-13 CUUK1808/Roussel 978 1 107 00678 2 October 29, 2011 14:57
272 Integrated Rate Laws
(b) A membrane has a capacitance of 15 pF and a resistance of 10 M�. If the initialtransmembrane voltage is 0 mV and the equilibrium voltage is 100 mV, how longwould it take for the membrane voltage to reach 99 mV?
(4) The reaction 2NO(g) + Cl2(g) → 2NOCl(g) is thought to be elementary. (Yes, it’s anotherone of those supposedly rare termolecular gas-phase elementary reactions. There’snothing a physical chemist likes better than a good exception, so there’s a dispropor-tionate amount of information available on termolecular reactions.) Suppose that thereis initially no NOCl present, and that the initial concentrations of NO and of Cl2 haveno particular relationship. Work out the integrated rate law for this reaction, right up tothe step of taking the integral. Do not evaluate the integral. In other words, leave youranswer in the form t = ∫ b
af (z) dz.
(5) We normally write simple integrated rate laws (e.g. the first-order equation) in termsof the concentration of a reactant. This is not the only possibility. Suppose that areaction has the stoichiometry A → 2B and has a second-order rate law, v = ka2.Derive an integrated rate law for the concentration of the product, b, assuming thatb(0) = 0.
(6) Fungal pellets are roughly spherical masses that sometimes form when fungi are grownin a liquid medium. The growth of the fungal population results in an increase in pelletmass which has empirically been found to obey the following equation:
m1/3 = m1/30 + kt
(a) What is the kinetic order of this growth process?(b) Derive an equation for the doubling time.
(7) In question 1 of Exercise Group 13.1, we discussed the first-order decay of the 2,5-dihydrofuran radical cation (2,5-DHF+•) in a CF3CCl3 matrix. First-order decay ofradicals can result in one of two ways:(a) A unimolecular reaction occurs in which the radical rearranges itself. This is the
case for 2,5-DHF+• which rearranges to the radical cation 2,4-DHF+• which isstable up to 140 K.
(b) The radical reacts with the matrix. The resulting process is really a pseudo-first-order reaction.
These two possibilities are difficult to distinguish by kinetic methods alone.Radicals can also react by recombination, i.e. by a reaction of the type R• + R• →
R2, or by other similar bimolecular reactions that pair up the odd electrons and producenonradical products.
The decay of 2,3-dihydrofuran radicals (DHF•) was studied by electron paramag-netic resonance (EPR) in an F-113 matrix at 140 K. (F-113 is the freon CFCl2CF2Cl.)Recall that the intensity of an EPR signal is proportional to the concentration of thecorresponding radical species. The results were as follows:8
8 W. Knolle et al., J. Chem. Soc., Perkin Trans. 2, 2447 (1999).
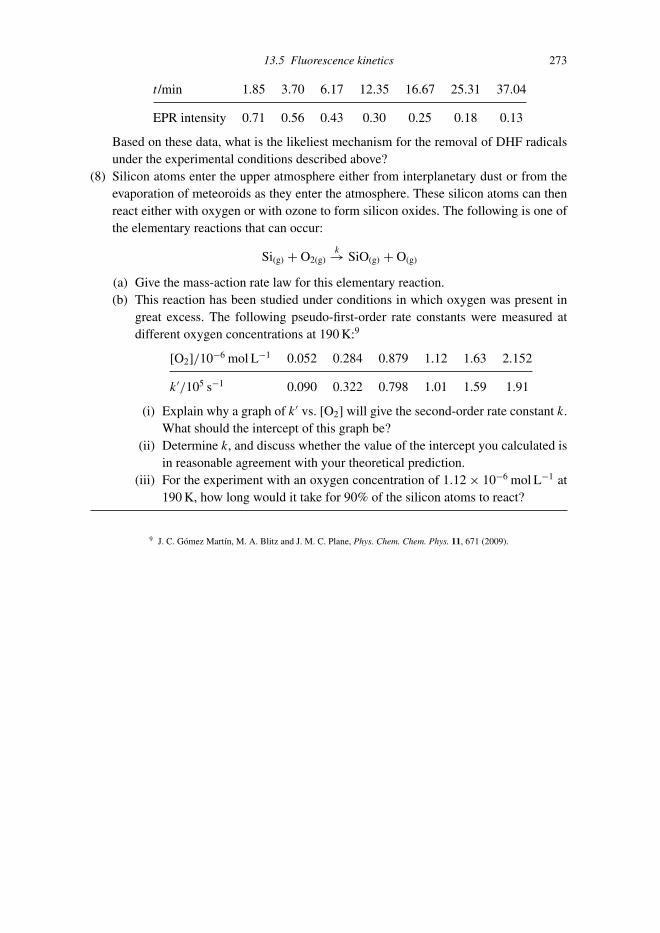
P1: SFK Trim: 247mm × 174mm Top: 14.586mm Gutter: 23.198mm
CUUK1808-13 CUUK1808/Roussel 978 1 107 00678 2 October 29, 2011 14:57
13.5 Fluorescence kinetics 273
t /min 1.85 3.70 6.17 12.35 16.67 25.31 37.04
EPR intensity 0.71 0.56 0.43 0.30 0.25 0.18 0.13
Based on these data, what is the likeliest mechanism for the removal of DHF radicalsunder the experimental conditions described above?
(8) Silicon atoms enter the upper atmosphere either from interplanetary dust or from theevaporation of meteoroids as they enter the atmosphere. These silicon atoms can thenreact either with oxygen or with ozone to form silicon oxides. The following is one ofthe elementary reactions that can occur:
Si(g) + O2(g)k→ SiO(g) + O(g)
(a) Give the mass-action rate law for this elementary reaction.(b) This reaction has been studied under conditions in which oxygen was present in
great excess. The following pseudo-first-order rate constants were measured atdifferent oxygen concentrations at 190 K:9
[O2]/10−6 mol L−1 0.052 0.284 0.879 1.12 1.63 2.152
k′/105 s−1 0.090 0.322 0.798 1.01 1.59 1.91
(i) Explain why a graph of k′ vs. [O2] will give the second-order rate constant k.What should the intercept of this graph be?
(ii) Determine k, and discuss whether the value of the intercept you calculated isin reasonable agreement with your theoretical prediction.
(iii) For the experiment with an oxygen concentration of 1.12 × 10⁻⁶ mol L−1 at190 K, how long would it take for 90% of the silicon atoms to react?
9 J. C. Gomez Martın, M. A. Blitz and J. M. C. Plane, Phys. Chem. Chem. Phys. 11, 671 (2009).

P1: SFK Trim: 247mm × 174mm Top: 14.586mm Gutter: 23.198mm
CUUK1808-14 CUUK1808/Roussel 978 1 107 00678 2 October 29, 2011 13:42
14
Complex reactions
I have mentioned several times in the past few chapters that complex reactions can haveeither simple or complex rate laws. We will now see how complex reactions can give riseto complex rate laws, but also how these rate laws often simplify to simple forms.
You may notice as you read this chapter that it seems to focus a lot on gas-phasechemistry, and that there are few biological examples and problems. This is a deliberatechoice. First of all, gas-phase chemistry is of interest to biologists since the atmosphereties us all together. My second reason for focusing on gas-phase chemistry here has to dowith pedagogy: examples of complex mechanisms deriving from gas-phase chemistry areoften simpler than those arising in biochemistry. We will get a good grounding in the basicmethods for treating complex mechanisms in this chapter before moving on to enzymekinetics in the next chapter.
14.1 Two-step mechanisms
In order to get our feet wet with complex reactions, we will try to resolve a puzzle:On the surface, unimolecular gas-phase reactions, i.e. reactions with the stoichiometryA → product(s), should be the simplest reactions around. However, these reactions alwayshave complex rate laws: at low pressures, they display second-order kinetics, while at highpressures, they follow first-order kinetics with respect to the reactant. (At intermediatepressures, the rate can’t be described by either a first- or a second-order rate law.) There’s afairly straightforward explanation for this behavior, first proposed by Lindemann in 1922: astable molecule doesn’t just decompose or isomerize on its own. Decomposition reactions,for instance, require bonds to be broken. A molecule therefore has to be energized somehowto undergo reaction. In the gas phase, molecules can gain energy through collisions. Supposethat A is a reactant molecule and P a product, and that X is an energized version of A.Lindemann’s hypothesis is equivalent to the following mechanism:
A + Ak1−⇀↽−k−1
A + X
Xk2−→ P
274

P1: SFK Trim: 247mm × 174mm Top: 14.586mm Gutter: 23.198mm
CUUK1808-14 CUUK1808/Roussel 978 1 107 00678 2 October 29, 2011 13:42
14.1 Two-step mechanisms 275
In the first step, two molecules of A collide, and one of them acquires enough energyto react. The reactive intermediate X then goes on to form the product(s). We show theproduct-forming step as being irreversible because these reactions are often very stronglythermodynamically favored such that reversion to the reactant is unlikely. It then doesn’tmatter whether P is a single product (as shown here) or a set of breakdown products, sinceit won’t appear in the rate law.
In Section 11.5, the rule for writing rate laws for complex mechanisms was given.Basically, the rate of change of a given concentration is the sum of the rates of change dueto each elementary reaction in which that species appears. This is our first example of theapplication of this rule to a complex mechanism, so make sure you understand where eachterm in the following rate equations came from:
da
dt= −k1a
2 + k−1ax (14.1a)
dx
dt= k1a
2 − k−1ax − k2x (14.1b)
These are coupled differential equations, meaning that we have two equations in twodependent variables, each of which appears in both equations. Unlike the simple casesstudied in the last section, these equations cannot be solved analytically. There exists noprocedure analogous to separation of variables for solving coupled differential equations.
We don’t need to solve the rate equations to address Lindemann’s puzzle. Note that thispuzzle was stated in terms of the rate of reaction. All we need to do is to be able to arriveat an equation for the rate of reaction. If you look back at the mechanism, you should beable to convince yourself that the overall reaction is just A → P. From the definition of therate of reaction and using the law of mass action, we would therefore write
v = dp
dt= k2x
Note that this rate involves the concentration of the intermediate X. Intermediate con-centrations are often difficult to measure. Furthermore, the observations we are trying toexplain are phrased in terms of the reactant pressure a. We should therefore try to find someexpression that relates x to a.
Recall that the intermediate X is an energized version of the reactant A. It should behighly reactive, since it is carrying excess energy. Indeed, this is the reason why it eventuallybreaks down into products, whereas A doesn’t do so directly. That being the case, in theinitial stages of the reaction, we expect X to build up, but we will soon reach a situationwhere it breaks down as fast as it can be produced by A + A collisions. We then say that x
has reached a steady state. In mathematical form, we expect that
dx/dt ≈ 0 (14.2)
or, using Equation (14.1b),
k1a2 − k−1ax − k2x ≈ 0

P1: SFK Trim: 247mm × 174mm Top: 14.586mm Gutter: 23.198mm
CUUK1808-14 CUUK1808/Roussel 978 1 107 00678 2 October 29, 2011 13:42
276 Complex reactions
We wanted to eliminate x from the rate equation. We can solve this last equation for x:
x ≈ k1a2
k−1a + k2
The rate of reaction would then be given by
v = k2x ≈ k1k2a2
k−1a + k2(14.3)
This procedure for obtaining a rate law is called the steady-state approximation. Specif-ically, the steady-state approximation involves the assumption that, after an initial tran-sient, the concentrations of any intermediates change slowly, which we express math-ematically by a condition such as Equation (14.2). This approximation will usually bevalid when the intermediates are highly reactive so that they do not accumulate to highconcentrations.
We are now ready to resolve Lindemann’s puzzle. The denominator of Equation (14.3)is a sum of terms, one of which depends on a. If the pressure of A is sufficiently small, thenk−1a eventually becomes much smaller than k2 and can be neglected. This gives
v ≈ k1k2a2
k2= k1a
2
This agrees with the observation that a second-order rate law is observed at low pressures.Note in fact that the rate of reaction under these conditions is just the rate of the first step,A + A → A + X. At sufficiently low pressures, we expect this second-order process, whichrequires collisons between molecules of A, to be slow. A reaction can’t proceed faster thanits slowest step, so this first step is said to be rate limiting under these conditions.
Now consider what happens if a is sufficiently large that k−1a � k2:
v ≈ k1k2a2
k−1a= k1k2
k−1a
This is the first-order behavior observed at high pressures. Lindemann’s mechanism thusexplains both extremes of the rate law for gas-phase unimolecular reactions.
Note the following:� In general, the Lindemann mechanism has a complex rate law that is different in form
from the simple rate laws we discussed in Chapter 12.� Even in limits in which we get simple rate laws, the observed rate constant may not cor-
respond to an elementary rate constant. For the Lindemann mechanism at high pressures,the observed first-order rate constant would be related to the elementary rate constantsby k = k1k2/k−1.
14.1.1 The oxidation of NO to NO2
As a second example, consider the oxidation of NO to NO2,
2NO(g) + O2(g) → 2NO2(g)

P1: SFK Trim: 247mm × 174mm Top: 14.586mm Gutter: 23.198mm
CUUK1808-14 CUUK1808/Roussel 978 1 107 00678 2 October 29, 2011 13:42
14.1 Two-step mechanisms 277
The mechanism of this reaction is
2NO(g)k1−⇀↽−k−1
N2O2(g)
N2O2(g) + O2(g)k2−→ 2NO2(g)
v = 1
2
d[NO2]
dt= k2[N2O2][O2] (14.4)
You should take a moment to verify Equation (14.4), and in particular to see how thefactor of 1
2 , which comes from the overall stoichiometry, cancels a factor of 2 fromthe product-forming step.
We are faced with the same problem as in the Lindemann mechanism, namely that therate law depends on the concentration of the intermediate N2O2. Once again, because it’shard to do experiments in which we control the concentration of intermediates, we wouldlike to obtain a rate law that depends only on reactant concentrations. We could apply thesteady-state approximation to the intermediate N2O2, but in this case we have an extrapiece of experimental information: it is known that the equilibrium 2NO � N2O2 is fast.This isn’t something we could have guessed, but sometimes this kind of information isavailable from studies of other, related reactions. Given this extra piece of information, wemight reason that the dimerization of NO can be treated as being in equilibrium, with thesecond reaction in the mechanism acting only as a small disturbance to the equilibrium.This reasoning leads to the relationship
k1[NO]2 ≈ k−1[N2O2]
from which we obtain
[N2O2] ≈ k1
k−1[NO]2
The rate of reaction is then
v = k1k2
k−1[NO]2[O2]
This procedure is called the equilibrium approximation.What if we had used the steady-state approximation instead? The steady-state condition
reads
d[N2O2]
dt= k1[NO]2 − k−1[N2O2] − k2[N2O2][O2] ≈ 0
Solving for [N2O2] and substituting into Equation (14.4), we get
v = k1k2[NO]2[O2]
k−1 + k2[O2]
If k2[O2] k−1, which is what we mean when we say that the product-forming step is slowcompared to the equilibrium, we recover the equilibrium approximation rate. In other words,the steady-state approximation includes the equilibrium approximation as a special case,so if the equilibrium approximation is correct, then so is the steady-state approximation.

P1: SFK Trim: 247mm × 174mm Top: 14.586mm Gutter: 23.198mm
CUUK1808-14 CUUK1808/Roussel 978 1 107 00678 2 October 29, 2011 13:42
278 Complex reactions
The reverse is not generally true, on the other hand. This observation turns out to hold formany simple mechanisms.
14.1.2 Choosing between the equilibrium and steady-state approximations
The following rules should help you decide which approximation to use in a given case:
� The steady-state approximation (SSA) is usually applied to highly reactive intermediates.� The equilibrium approximation (EA) is used when a reversible elementary reaction is
expected to be much faster than other steps in the mechanism.� The SSA is more general, so if there is any doubt at all about the validity of the EA, use
the SSA. On the other hand, the EA is generally easier to apply, so it should be usedwhen it is valid.
14.2 Chain reactions
In order to sharpen our skills in using the classical steady-state and equilibrium approxi-mations, we will now study an example of an important class of reactions known as chainreactions. We will also see how these approximations can be applied when we have morethan one intermediate to eliminate from a rate law.
The gas-phase reaction of hydrogen with bromine to form hydrogen bromide displayssurprisingly complex kinetics, as first shown by Bodenstein and Lind in 1906. For onething, the reaction rate depends on a fractional power of the bromine concentration. Foranother, the reaction is noticeably inhibited by its product. Bodenstein and Lind showedthat the experimental rate data are well fit by the equation
v = ka[H2][Br2]1/2
kb + [HBr]/[Br2]
This peculiar rate law went unexplained for over a decade. Then, in 1919–1920, J.A.Christiansen, Karl Ferdinand Herzfeld and Michael Polanyi, working independently, allproposed the following mechanism for the hydrogen-bromine reaction:
Br2k1−→ 2Br (CHP1)
Br + H2k2−→ HBr + H (CHP2)
H + Br2k3−→ HBr + Br (CHP3)
2Brk−1−→ Br2 (CHP4)
H + HBrk−2−→ H2 + Br (CHP5)
This is called a chain reaction; Steps CHP2 and CHP3 generate each other’s reactantsso that, once the reaction gets going, it is self-sustaining. These two steps are called

P1: SFK Trim: 247mm × 174mm Top: 14.586mm Gutter: 23.198mm
CUUK1808-14 CUUK1808/Roussel 978 1 107 00678 2 October 29, 2011 13:42
14.2 Chain reactions 279
propagation reactions. Chain propagation reactions make at least as many radicals as theyconsume. The first step is the initiation step or, in other words, the step that starts offthe reaction. The elementary reaction CHP4 is the termination or chain-breaking step.It eliminates any excess bromine ions once the reaction starts to slow down. Every chainreaction has initiation, propagation and termination steps. Reaction CHP5 is not responsiblefor product formation. In fact, it is the reverse of step CHP2. It is an inhibition step: itsoverall effect is to slow (inhibit) the reaction by consuming the product. This is the reactionthat will account for the inverse relationship on the HBr concentration in the empiricalrate law. Note that our mechanism does not include the reverse of reaction CHP3. This isbecause the elementary process HBr + Br → H + Br2 has a very low rate, due in part tothe extraordinarily small bond dissociation energy of the bromine molecule, which makesthis reaction very endothermic. We will see later that a key factor in determining the sizesof rate constants is the activation energy, the amount of energy the reactants must gainin order to react. The larger the activation energy is, the smaller the corresponding rateconstant. For an endothermic reaction, the minimum activation energy is �rH , so reactionswith large, positive enthalpies of reaction tend to be slow. The small bond dissociationenergy of bromine is, incidentally, the same factor that makes reaction CHP1 a significantprocess at reasonable temperatures. It is also worth noting that reaction CHP1 is actuallya complex reaction obeying a variation of the Lindemann mechanism. Specifically, a Br2
molecule can be energized by collision with any other molecule in the reaction vessel. Wecan treat CHP1 as a pseudo-first-order reaction because the stoichiometry of the reaction,Br2 + H2 → 2HBr, means that the total number of molecules in the gas phase, and thusthe total pressure, is constant. However, if we systematically varied the pressure, we wouldfind that k1 actually depends on pressure. A mechanism is a model, and not necessarilya catalog of everything we know about a reaction. When we build a model of a complexreaction, we often leave out reactions (in this case, collisional activation of Br2) that are notdirectly relevant to the phenomenon we are trying to explain (different rate laws in differentpressure ranges) in order not to distract ourselves from the central issues. This is what wehave done here. Similar comments could be made for the reverse reaction, CHP4, whichwill require a collision with another molecule to carry away the bond energy before thebromine molecule made in this process can dissociate again. We can also neglect steps likeH + Br → HBr, because the concentrations of the two radicals should remain quite lowdue to their reactivities. Collisions between rare species are much less likely than collisionsbetween rare species and abundant molecules. Of the possible radical recombination steps,the Br+Br step turns out to have the highest rate by far, and thus to be the only significantreaction of this type.
Since free radicals are highly reactive, it should be reasonable to apply the steady-stateapproximation to their concentrations:
d[Br]
dt= 2k1[Br2] − k2[Br][H2] + k3[H][Br2] − 2k−1[Br]2 + k−2[H][HBr] ≈ 0
d[H]
dt= k2[Br][H2] − k3[H][Br2] − k−2[H][HBr] ≈ 0

P1: SFK Trim: 247mm × 174mm Top: 14.586mm Gutter: 23.198mm
CUUK1808-14 CUUK1808/Roussel 978 1 107 00678 2 October 29, 2011 13:42
280 Complex reactions
We treat these equations as two equations in the two unknowns [H] and [Br]. If we first addthe two equations, we get the relationship
2k1[Br2] − 2k−1[Br]2 ≈ 0
or
[Br] ≈√
k1[Br2]/k−1
(Adding steady-state relationships in order to get simpler equations to solve is a commontrick.) Substituting this relationship into the second steady-state equation, we get
[H] ≈ k1/21 k2[Br2]1/2[H2]
k1/2−1 (k3[Br2] + k−2[HBr])
The overall reaction is H2 + Br2 → 2HBr so the reaction rate is
v = 1
2
d[HBr]
dt= 1
2(k2[Br][H2] − k−2[H][HBr] + k3[H][Br2])
We can substitute the steady-state concentrations of H and Br into this equation and thenspend a good deal of time simplifying terms. However, there is a slightly easier way to goabout this chore. The steady-state condition for H can be rearranged to the form
k2[Br][H2] − k−2[H][HBr] ≈ k3[H][Br2]
We use this equation to simplify the reaction rate, and get
v ≈ k3[H][Br2] = k1/21 k2k3[Br2]3/2[H2]
k1/2−1 (k3[Br2] + k−2[HBr])
=
k1/21 k2k3
k1/2−1 k−2
[Br2]1/2[H2]
k3/k−2 + [HBr]/[Br2]
This is just the Bodenstein–Lind rate law, except that the empirical constants ka and kb arenow expressed in terms of elementary rate constants.
The dependence of the rate on the square-root of the concentration of one of the reactantsis typical of reactions in which radical intermediates appear. The reason is simple: theinitiation step generally involves the splitting of a reactant into two radicals. This generatesa quadratic relationship between the reactant and radical concentrations which, when solved,gives us a square root. Note, however, that mechanisms involving radicals don’t alwaysgive rate laws containing square-root terms, since it sometimes occurs that these terms endup being squared away (literally) at some point during the derivation.
14.3 Deriving rate laws of complex mechanisms
Deriving rate laws is one of those exercises that strikes fear in the hearts of many studentsof chemistry and biochemistry. Although there may occasionally be opportunities forcreativity, the truth is that deriving a rate law for a complex mechanism can largely bereduced to an algorithm. If you always do things in the order indicated below, you can

P1: SFK Trim: 247mm × 174mm Top: 14.586mm Gutter: 23.198mm
CUUK1808-14 CUUK1808/Roussel 978 1 107 00678 2 October 29, 2011 13:42
14.3 Deriving rate laws of complex mechanisms 281
get these derivations right every time, give or take algebraic errors. Here are the steps youshould go through:
(1) Identify any intermediates in the mechanism.(2) If you don’t have the overall reaction, figure out what it is.(3) Write down an expression for v based on the overall reaction using the law of mass
action and the definition of the rate of reaction.(4) You will need to apply one approximation for every intermediate in the mechanism, be
it a steady-state or an equilibrium approximation. Start with the reversible steps. Askyourself if any of the information you have would lead you to think that the equilibriumapproximation would be valid for that step. If so, apply the EA. Add one SSA equationfor each intermediate not already appearing in an EA equation.
(5) The intermediate concentrations are your unknowns, and you should now have asmany equations as intermediates. You want to solve your equations for the unknownintermediate concentrations. Before you start, look at your expression for v. In order toavoid back-substitutions (i.e. extra work), you will want to solve for the intermediateconcentration(s) appearing in v last. Keeping this in mind, solve for the intermediateconcentrations. Look for opportunities to simplify the work by adding equations beforeyou go too far.
(6) Substitute the intermediate concentration(s) into v. You’re done!
Exercise group 14.1
(1) The N2O5-catalyzed decomposition of ozone proceeds by the following mechanism:
N2O5(g)k1−⇀↽−k−1
NO2(g) + NO3(g)
NO2(g) + O3(g)k3−→ NO3(g) + O2(g)
2NO3(g)k4−→ 2NO2(g) + O2(g)
(a) Write down the overall reaction.Hint: The nitrogen oxides are catalytic species which do not appear in the overallprocess. You can ignore the first reaction which simply serves to create the truecatalyst in this reaction, namely nitrogen dioxide.
(b) The first reaction is known to equilibrate rapidly relative to the rate at which theother reactions proceed. Using this information, and assuming that the nitrogentrioxide concentration reaches a steady state, derive a rate law for this reactioninvolving only the ozone and dinitrogen pentoxide concentrations.
(c) Is the rate law simple? If so, what are the orders of reaction with respect to N2O5
and O3?(d) Do you get the same rate law if you simply use the SSA for both nitrogen dioxide
and nitrogen trioxide?

P1: SFK Trim: 247mm × 174mm Top: 14.586mm Gutter: 23.198mm
CUUK1808-14 CUUK1808/Roussel 978 1 107 00678 2 October 29, 2011 13:42
282 Complex reactions
(2) Here is a variation on the Lindemann mechanism:
2Ak1−⇀↽−k−1
B
Bk2−→ A + P
(a) What is the overall reaction?(b) Assume that the intermediate is highly unstable. Derive an approximate rate law
for this mechanism.(c) What overall order of reaction does your rate law predict?
(3) Consider the following mechanism:
W + Wk1−⇀↽−k−1
W + 2X
X + Yk2−→ Z
(a) What is the overall reaction? Identify the reactants, products and intermediates inthe mechanism.
(b) Assuming that W is a normal molecule with fully satisfied valencies, what kind ofchemical species is X?
(c) Suppose that the first step reaches equilibrium rapidly. Derive an approximate ratelaw valid in this case.
(d) Under what condition(s) could you apply the steady-state approximation? Derivean approximate rate law using this approximation.
(4) Two mechanisms have been proposed for the reaction CO(g) + Cl2(g) → COCl2(g):
Cl2(g)k1−⇀↽−k−1
2Cl(g)
Cl(g) + Cl2(g)k2−⇀↽−k−2
Cl3(g)
Cl3(g) + CO(g)k3−→ COCl2(g) + Cl(g)
(14.5)
Cl2(g)k1−⇀↽−k−1
2Cl(g)
Cl(g) + CO(g)k2−⇀↽−k−2
COCl(g)
COCl(g) + Cl2(g)k3−→ COCl2(g) + Cl(g)
(14.6)
(a) Identify the radical intermediates appearing in these mechanisms.(b) Identify the initiation, chain propagation and termination steps in both mechanisms.
Are there any elementary reaction in either mechanism that don’t fall into one ofthese categories?
(c) Derive rate laws for both mechanism involving only concentrations of stablemolecules. Could these mechanisms be distinguished experimentally? Explain.

P1: SFK Trim: 247mm × 174mm Top: 14.586mm Gutter: 23.198mm
CUUK1808-14 CUUK1808/Roussel 978 1 107 00678 2 October 29, 2011 13:42
14.4 Equilibria in complex reactions 283
(5) The experimental rate law for the reaction 2NO(g) + Br2(g) → 2NOBr(g) is v =k[NO]2[Br2]. Show that this rate law is consistent with the mechanism
NO(g) + Br2(g)k1−⇀↽−k−1
NOBr2(g)
NOBr2(g) + NO(g)k2−→ 2NOBr(g)
Give an equation for the experimental rate constant k in terms of the elementary rateconstants k1, k−1 and k2. Briefly discuss, based on your derivation of the rate equation,which elementary processes are fast and which are slow in this reaction.
(6) Although elementary trimolecular reactions are rare, reactions with third-order ratelaws are not. Consider the mechanism
A + Ak1−⇀↽−k−1
B
B + Ck2−→ P
Under what conditions will this reaction display third-order kinetics?
14.4 Equilibria in complex reactions
Back in Section 11.6, we discussed the relationship between equilibrium and kinetics forsingle elementary reactions. The principle is the same for complex reactions as it is forelementary reactions; the rates of change of the concentrations are zero at equilibrium. Wehave more equations to solve, however. We are assisted in this task by the principle ofdetailed balance, a consequence of the laws of mass action and of microscopic reversibility:at equilibrium, every elementary reaction is itself in equilibrium.
Example 14.1 Detailed balance in action Consider the following mechanism:
Ak1−⇀↽−k−1
2B
Bk2−⇀↽−k−2
C
The overall reaction is
A � 2C
with empirical equilibrium constant
K = c2
a
According to the principle of detailed balance, at equilibrium
k1a = k−1b2
and k2b = k−2c

P1: SFK Trim: 247mm × 174mm Top: 14.586mm Gutter: 23.198mm
CUUK1808-14 CUUK1808/Roussel 978 1 107 00678 2 October 29, 2011 13:42
284 Complex reactions
These relationships can be rearranged to the form
K1 = k1
k−1= b2
a
K2 = k2
k−2= c
b
If we square the second of these equations and multiply by the first, the concentration ofthe intermediate cancels out and we get
K = K1K22 = k1k
22
k−1k2−2
= c2
a
Relationships such as those derived in the previous example between the equilibriumand rate constants mean that the rate constants are not all independent; one of them isfixed by the thermodynamics of the overall reaction. This has important implications inmechanisms containing cycles, as we shall see in the following example.
Example 14.2 Cyclic reaction mechanisms Reaction cycles are common in biochemicalreaction networks. Consider the following cycle:
2B C
A
kk
k
k
kk3
−3
−2
−1
1
The equilibrium constants for the three steps are
K1 = b
a= k1
k−1
K2 = c
b= k2
k−2
K3 = a
c= k3
k−3
If we multiply the three equilibrium constants together, we get
K1K2K3 = 1 = k1k2k3
k−1k−2k−3
Therefore, if we know any five of the rate constants, the sixth is automatically fixed.

P1: SFK Trim: 247mm × 174mm Top: 14.586mm Gutter: 23.198mm
CUUK1808-14 CUUK1808/Roussel 978 1 107 00678 2 October 29, 2011 13:42
14.4 Equilibria in complex reactions 285
Exercise group 14.2
(1) Consider the mechanism
Ak1−⇀↽−k−1
2B + C
Bk2−⇀↽−k−2
C
(a) What is the overall reaction?(b) If k1 = 1.2 s−1, k−1 = 3.4 × 10⁸ L2 mol−2s−1, k2 = 2800 s−1 and k−2 = 2.5 s−1,
what is the equilibrium constant for the overall reaction?
Key ideas and equations
� Useful rate laws typically do not depend on the concentrations of intermediates.� The steady-state approximation is applied to highly reactive intermediates.� The equilibrium approximation is applied to fast reversible reactions.� Principle of detailed balance: at equilibrium, each elementary reaction is in equilibrium.
Review exercise group 14.3
(1) The oxidation of indole by HSO−5 in acidic solution is thought to proceed by the
following mechanism:1
indole + HSO−5
k1−⇀↽−k−1
Ck2−→ oxindole + HSO−
4
(a) Derive a rate law for this mechanism.(b) Experimentally, it is found that the rate depends on the concentrations as follows:
v = k[indole][HSO−5 ]
How is the experimental rate constant k related to the elementary rate constants?(c) At 293 K in a 20:80 (by volume) mixture of acetonitrile and water, k =
4.0 × 10⁻³ L mol−1s−1. If we start the reaction with [indole] = [HSO−5 ] =
0.030 mol L−1, how long would it take before 90% of the indole was oxidizedunder these reaction conditions?
(2) Peracetic acid (PAA) is the following compound:
OCH OH3 C
O
1 S. Meenakshisundaram and N. Sarathi, Int. J. Chem. Kinet. 39, 46 (2007).

P1: SFK Trim: 247mm × 174mm Top: 14.586mm Gutter: 23.198mm
CUUK1808-14 CUUK1808/Roussel 978 1 107 00678 2 October 29, 2011 13:42
286 Complex reactions
Recently, Zhao and coworkers have proposed the following mechanism for the decom-position of peracetic acid in aqueous solution at elevated temperatures:2
� First, PAA is protonated on the carbonyl oxygen, creating a carbocation:
PAA + H+ k1−⇀↽−k−1
PAAH+
� The carbocation forms an intermediate addition product with another PAA:
PAAH+ + PAAk2−→ X + H+
� The intermediate decomposes to acetic acid (symbolized AH), acetate (A−), a protonand oxygen:
Xk3−→ AH + A− + H+ + O2
� Finally, the acetate reprotonates:
A− + H+ k4−→ AH
(a) Determine the overall reaction.(b) Protonation and deprotonation steps are extremely fast in aqueous solution. Using
this information and any reasonable additional assumptions you find necessary,determine the rate law for this reaction.
(c) What is the order of the reaction with respect to PAA?(d) What would you predict the effect of raising the pH on the reaction rate to be?
2 X. Zhao et al., J. Mol. Catal. A: Chem. 284, 58 (2008). I have changed their numbering of the steps for convenience, andexpanded one of their steps.

P1: SFK Trim: 247mm × 174mm Top: 14.586mm Gutter: 23.198mm
CUUK1808-15 CUUK1808/Roussel 978 1 107 00678 2 October 31, 2011 8:0
15
Enzyme kinetics
Enzymes are biological catalysts. Recall that a catalyst is a substance that accelerates achemical reaction without itself being consumed by the reaction. Enzyme catalysis holdsa special place in the history of chemistry. The law of mass action was enunciated inthe nineteenth century in a thermodynamic context by Guldberg and Waage. By the earlytwentieth century, the law of mass action was supported by a growing mass of both ther-modynamic and kinetic evidence. Nevertheless, some reactions had complex rate lawswhich were not obviously compatible with mass action. Enzyme catalysis posed such adifficulty. In fact, there was some debate as to whether enzyme molecules even had to comein contact with the reactant molecules to accelerate the reaction. In 1902, Victor Henrishowed, with some help from Max Bodenstein, that enzyme kinetics is in fact compatiblewith the law of mass action. The complex rate law obeyed by enzyme-catalyzed reactionswas simply a manifestation of a complex mechanism. Although debates with respect tothe mode of action of enzymes persisted for some time, it was at least clear from thispoint on that enzyme catalysis was compatible with the then-emerging theory of chemicalkinetics. This is the vein we will pick up in this chapter. Our study of enzyme kinetics willparticularly emphasize the derivation of rate laws and the analysis of data from initial rateexperiments.
15.1 Properties of enzymes
While enzymes are biological molecules, much of what we will learn about enzymes in thischapter is equally true for inorganic catalysts. However, enzymes do have some remarkablefeatures that set them apart from inorganic catalysts:
� Enzymes are remarkably selective. Most enzymes catalyze a very specific reaction. Therate enhancement is often sensitive to even minor structural changes in the reactants(generally called substrates in enzymology). Moreover, enzymes are almost alwaysstereospecific. In other words, if a compound has two stereoisomers, a given enzyme willgenerally only accelerate the reaction with one of the stereoisomers. Inorganic catalystsare generally much less specific and are almost never sensitive to the stereochemistry ofthe reactants.
287

P1: SFK Trim: 247mm × 174mm Top: 14.586mm Gutter: 23.198mm
CUUK1808-15 CUUK1808/Roussel 978 1 107 00678 2 October 31, 2011 8:0
288 Enzyme kinetics
� The rate enhancements obtained with an enzyme are often spectacular. The rate ofan enzyme-catalyzed reaction is typically greater than the rate of the correspondinguncatalyzed reaction by a factor of 106 to 1012. Inorganic catalysts seldom achieve suchlarge rate enhancements.
� Enzymes are much more sensitive to temperature and pH than typical inorganic catalysts.Most enzymes rapidly lose their activity if the temperature is changed by more than10 or 20 ◦C, or if the pH is changed by more than two or so units. Many enzymes arecompletely inactive outside their optimal temperature and pH operating ranges. In somecases, the enzyme does not regain its activity even if the temperature and pH are returnedto their optimal values. Some inorganic catalysts lose their activity, and sometimes do soirreversibly, as the temperature and pH are changed, but this loss of activity is rarely seenover such narrow ranges of conditions as is the case for enzymes.
What sets enzymes apart from other catalysts? A large part of the answer is theircomplexity. Enzymes are proteins, assemblies of proteins or, sometimes, complexes ofproteins and RNA with molar masses of tens or hundreds of thousands of grams per mole.This complexity makes high selectivity and large rate enhancements possible, but makesthem more fragile than most inorganic catalysts (metal surfaces and particles, transition-metal complexes, etc.). From the point of view of kinetics however, this complexity is largelyirrelevant, except insofar as it limits the experimental conditions under which enzymes canbe studied.
15.2 The Michaelis–Menten mechanism
The mechanism by which enzymes accelerate reactions was uncovered in stages. Perhapsthe first clear indication of the mechanism of enzyme action was obtained by an elegantexperiment carried out in 1880 by Wurtz with the enzyme papain. Papain is a proteolyticenzyme, i.e. one that breaks down proteins. In case you’re curious, the name of this enzymecomes from its source, the papaya fruit. Papaya is often used as a meat tenderizer preciselybecause it contains papain which helps break down protein, the main biochemical con-stituent of the connective tissue that sometimes makes meat tough. Wurtz was particularlyinterested in the action of papain on fibrin, one of the proteinaceous components of bloodclots. Fibrin is insoluble in water, but its breakdown products (small peptides) do dissolve.Wurtz took a sample of fibrin and soaked it in a papain solution for a while, long enoughto see that the fibrin was dissolving, but not long enough to destroy all of it. The remainingfibrin was filtered out and carefully washed over and over again. When the washed fibrinwas placed in pure water, two things happened: first, the fibrin started to dissolve; secondly,if he added additional fibrin, this too dissolved. Both of these observations indicate that theenzyme had remained attached to the first batch of fibrin through several thorough wash-ings. Wurtz had shown that the enzyme forms a stable complex with its substrate. Fromthis experimental demonstration, Wurtz hypothesized that this complex was catalytically

P1: SFK Trim: 247mm × 174mm Top: 14.586mm Gutter: 23.198mm
CUUK1808-15 CUUK1808/Roussel 978 1 107 00678 2 October 31, 2011 8:0
15.2 The Michaelis–Menten mechanism 289
significant. Specifically, his hypothesis was that an enzyme acted on its substrate while thetwo were complexed together, and that the products were subsequently released from theenzyme, the latter having suffered no chemical transformation in the process.
In modern notation, Wurtz’s hypothesis is equivalent to the following mechanism:
E + Sk1−⇀↽−k−1
Ck−2−→ E + P (MM)
where E is the enzyme, S is the substrate (reactant), C is an enzyme–substrate complex andP is the product. This mechanism is called the Michaelis–Menten mechanism, althoughWurtz clearly thought of it first, an example of Stigler’s law that no scientific discovery isever named for its original discoverer.
The details of how an enzyme achieves catalysis is a subject worthy of its own course. Itis, however, useful to have some basic ideas of the nature of the enzyme–substrate complex.As mentioned earlier, an enzyme is a large protein. Some of the amino acids that make up aprotein are hydrophobic. As a result, a protein in aqueous solution will fold up in such a wayas to “hide” the hydrophobic amino acids from the solvent. Folding does not in general leadto a unique structure, but typically there will be just a few dominant structures in solution,and sometimes just one. In the case of enzymes, at least one of the dominant structures willhave a cleft in which the substrate can fit. The shape of this cleft is usually such that veryfew molecules other than the intended substrate fit properly, which accounts for the greatspecificity of enzymes. This cleft is called the active site of the enzyme, because that iswhere catalysis happens. Various chemical groups will be positioned within the active siteto facilitate the reaction. The precise positioning of these chemical groups accounts for thevery high catalytic efficiency of enzymes. This description of enzyme function is sometimesreferred to as the lock-and-key theory, originally developed by Emil Fischer. There are acouple of subtleties not properly captured by the simplest version of lock-and-key theory.We will return to these issues in Chapter 17. However, lock-and-key theory is sufficient todevelop the theory of enzyme kinetics.
Let’s now work out the rate equations. If you look back at the mechanism, you willnote that the enzyme is never destroyed. It forms a complex C with the substrate, but thiscomplex either dissociates back into enzyme and substrate or into enzyme and product.The total amount of enzyme is therefore a constant:
e + c = e0 (15.1)
We can use this equation to eliminate e:
e = e0 − c
Note that we don’t want to eliminate c yet since v = k−2c, so that we will eventually needto find an expression for c involving only reactant concentrations. Furthermore, since weassume that product formation is irreversible, p doesn’t appear in the rate equations. We

P1: SFK Trim: 247mm × 174mm Top: 14.586mm Gutter: 23.198mm
CUUK1808-15 CUUK1808/Roussel 978 1 107 00678 2 October 31, 2011 8:0
290 Enzyme kinetics
can therefore write just two rate equations for this mechanism:
ds
dt= −k1es + k−1c = −k1s(e0 − c) + k−1c (15.2a)
dc
dt= k1es − k−1c − k−2c = k1s(e0 − c) − (k−1 + k−2)c (15.2b)
We now develop the classical equilibrium and steady-state approximations for thismechanism. We start with the simpler equilibrium approximation, the approach takenby Henri in his 1902 paper. Suppose that equilibrium is established rapidly between theenzyme–substrate complex and the free species. Then
k1es = k1s(e0 − c) ≈ k−1c
or
c ≈ k1e0s
k1s + k−1= e0s
s + k−1/k1
k−1/k1 is the equilibrium constant for the dissociation of the enzyme–substrate complexinto enzyme and substrate (the reverse of reaction 1). If we let
KE = k−1/k1 (15.3)
we get
c ≈ e0s
s + KE
If we now use this approximate equilibrium value of c in our expression for the rate ofreaction, we get
v ≈ k−2e0s
s + KE
= vmaxs
s + KE
where vmax = k−2e0.We will come back to this equation in a minute, but first let’s look at the steady-state
approximation, first applied to this mechanism by Briggs and Haldane. Suppose that theenzyme–substrate complex is in a steady state, i.e. that k−2 is large so that C reacts rapidlyafter its production. Then
dc
dt= k1s(e0 − c) − (k−1 + k−2)c ≈ 0
∴ c ≈ k1e0s
k1s + k−1 + k−2= e0s
s + KS
(15.4)
∴ v ≈ k−2e0s
s + KS
= vmaxs
s + KS
In these equations,
KS = (k−1 + k−2)/k1 (15.5)
and vmax is defined as in Henri’s equilibrium approach.

P1: SFK Trim: 247mm × 174mm Top: 14.586mm Gutter: 23.198mm
CUUK1808-15 CUUK1808/Roussel 978 1 107 00678 2 October 31, 2011 8:0
15.2 The Michaelis–Menten mechanism 291
0
vmax
0 20KM 40KM 60KM
v
s
(a)
0
vmax/2
vmax
0 KM 2KM 3KM 4KM
v
s
(b)
Figure 15.1 Properties of the Michaelis–Menten rate law (15.6). (a) The rate tends to vmax at very largesubstrate concentration s. At sufficiently large s, v is essentially constant and the reaction displayszero-order kinetics with respect to the substrate. (b) The Michaelis constant KM is the value of s atwhich v = 1
2 vmax. The dotted line has a slope of vmax/KM. Note that the Michaelis–Menten curve istangent to this line at small s, i.e. the reaction there displays first-order kinetics with an apparent rateconstant of vmax/KM.
The two methods for obtaining a simplified rate law yield equations of the same form,namely
v ≈ vmaxs
s + KM(15.6)
KM is best thought of as an experimentally measured quantity called the Michaelis con-stant. To the extent that an enzyme-catalyzed reaction obeys this rate law, it will not bepossible to tell which interpretation we should give to KM (KE or KS). In either interpre-tation, KM can be thought of as a dissociation constant, i.e. a ratio of the rate constantfor dissociation of an enzyme–substrate complex to the rate constant for formation of thecomplex. If KM is very large, the substrate dissociates easily from the enzyme. If KM
is small, the substrate is strongly bound. For two enzyme–substrate pairs that have thesame vmax, the pair with the lowest KM has the higher rate of reaction at similar substrateconcentrations.
The Michaelis–Menten rate law (15.6) describes a hyperbolic relationship of the rate tothe substrate concentration. In particular:
(1) At large substrate concentrations (s � KM), v becomes asymptotic to vmax (Figure15.1(a)), which is the maximum rate of reaction, as its name suggests. We say thatthe enzyme is saturated. Literally, this means that almost all of the enzyme exists inthe intermediate complex (C) form. The enzyme is transforming substrate into productas fast as it can and the reaction displays zero-order kinetics with respect to the substrate.The only way to raise the rate of the reaction under these conditions is to increase theamount of enzyme.

P1: SFK Trim: 247mm × 174mm Top: 14.586mm Gutter: 23.198mm
CUUK1808-15 CUUK1808/Roussel 978 1 107 00678 2 October 31, 2011 8:0
292 Enzyme kinetics
The proper use of conservation relations like (15.1) is essential in deriving rate laws.In this mechanism for instance, the conservation of enzyme is directly responsible forthe saturation phenomenon observed at large s. You are therefore strongly encouragedto look for conservation relations before deriving rate equations.
(2) At small substrate concentrations (s KM), v ≈ vmaxs/KM, i.e. the reaction behavesas if it had a simple first-order rate law (Figure 15.1(b)) with rate constant vmax/KM.
(3) Half the maximal rate is reached when s = KM (Figure 15.1(b)). This is sometimesused to get a crude estimate of KM and is a useful check on other methods for computingthe value of this constant.
(4) In theory, if we know the concentration of enzyme (e0) and vmax, we can calculatek−2 by k−2 = vmax/e0. In practice, many enzymes have more complex mechanismsthan the simple Michaelis–Menten mechanism (additional steps, multiple substratesor products, etc.). Moreover, we may not know the exact mechanism at the time of akinetic study. We thus define the turnover number of an enzyme by kcat = vmax/e0.The turnover number, which has units of inverse time, is the maximum number ofmolecules of substrate that a single molecule of enzyme can convert to product per unittime. For the simple Michaelis–Menten mechanism, kcat = k−2. In other mechanisms,kcat may have a more complicated relationship to the rate constants.
There is an additional complication we often face in enzyme kinetic studies: someenzymes are hard to purify. It is not unusual for an enzyme to lose all activity duringpurification procedures. In these cases, we often study an enzyme in an unpurified, or onlypartially purified, cell extract. We would then have, at best, a crude estimate of the enzymeconcentration, and we would therefore not calculate kcat. Rather, we would use vmax as arelative measure of enzyme concentration since vmax is proportional to e0. In a variationon this idea, people often report the specific activity, which is defined as the (maximum)rate of substrate conversion (often in μmol min−1) by a given preparation divided by thetotal protein mass in the sample. (I put maximum in parentheses because specific activityis sometimes used at less than saturating substrate concentrations, although the resultsunder such conditions are often difficult to reproduce.) The units of the specific activity aretherefore mol min−1g−1 (or equivalent). The specific activity is a convenient way to checkif, for example, a given enzyme preparation has degraded during storage, or if a sample Imade up today is as good as the one I made yesterday. If we multiply the specific activityby the protein concentration in g L−1, we get vmax. If the specific activity was calculatedper gram of the particular enzyme under study rather than per gram of total protein, thenthe specific activity multiplied by the molar mass of the enzyme gives kcat.
15.2.1 Determining vmax and KM
The experimental parameters vmax and KM can be determined in a number of ways, somebetter than others. It is first important to note that enzymologists generally use initial ratemethods. This avoids complications related to the reverse reaction. It also avoids difficulties

P1: SFK Trim: 247mm × 174mm Top: 14.586mm Gutter: 23.198mm
CUUK1808-15 CUUK1808/Roussel 978 1 107 00678 2 October 31, 2011 8:0
15.2 The Michaelis–Menten mechanism 293
related to the fact that enzymes are often not very stable once taken out of their originalcellular environment so that long experiments to be analyzed with an integrated rate laware not always practical.
The classic method for treating initial rate data from an enzyme-catalyzed reaction iscalled the Lineweaver–Burk or double-reciprocal plot. The method is simple: take thereciprocal of both sides of the Michaelis–Menten rate law (Equation 15.6):
1
v= s + KM
vmaxs
∴ 1
v= 1
vmax+ KM
vmax
1
s(15.7)
A plot of 1/v as a function of 1/s should therefore give a straight line of slope KM/vmax
and intercept 1/vmax.
Example 15.1 Lineweaver–Burk plot Consider the following initial rate data for anenzyme-catalyzed reaction:
s/mmol L−1 2.0 4.0 8.0 12.0 16.0 20.0
v/μmol L−1s−1 130 200 290 330 360 380
To use the Lineweaver–Burk method, we compute 1/s and 1/v and plot these quantities:
s−1/L mol−1 500 250 125 83.3 62.5 50.0
v−1/L s mol−1 7692 5000 3448 3030 2778 2632
Note that I got rid of the SI prefixes before taking the inverses to avoid having oddunits for the slope. This isn’t necessary, but I find that it saves me from making errorshandling the units during the subsequent calculations. The plot is shown in Figure 15.2.The slope is 11.3 s and the intercept is 2.08 × 10³ L s mol−1. From the intercept, we findvmax = 480 μmol L−1s−1. The slope is KM/vmax so KM = (11.3 s)(480 μmol L−1s−1) =5.43 mmol L−1.
The Lineweaver–Burk plot is the worst possible way to obtain vmax
and KM values, short of just eyeballing the data.
One of the problems can clearly be seen in Figure 15.2: data obtained at larger values of s
ends up bunched up together at small values of 1/s, and small-s data ends up widely spacedand far from the other points. This gives one or two points at the very smallest values ofs a large statistical moment. Statistical moment is analogous to the moment of a force inphysics; think of a mechanical force applied to a long lever at a point far from the fulcrum.The idea is the same here: when the points are not evenly spaced, the sum of squared errors(which is what linear regression minimizes) is typically smallest when the line passes near

P1: SFK Trim: 247mm × 174mm Top: 14.586mm Gutter: 23.198mm
CUUK1808-15 CUUK1808/Roussel 978 1 107 00678 2 October 31, 2011 8:0
294 Enzyme kinetics
2000
3000
4000
5000
6000
7000
8000
9000
0 100 200 300 400 500 600
v−1/L
s m
ol−1
s−1/L mol−1
Figure 15.2 Lineweaver–Burk plot of the data of Example 15.1.
points that are isolated from the others, even if the other points suggest a different trend.If the point at smallest s happens to have been badly measured, the slope and interceptreturned by fitting a Lineweaver–Burk plot could be very wrong. Having one or two pointsdominate the fitting procedure defeats the purpose of measuring points at several differentvalues of s. This problem could be overcome by choosing substrate concentrations that areequally spaced on a 1/s axis, but then we would have very few points at large s, and thosepoints are necessary to accurately estimate vmax. It’s a no-win situation.
There’s another problem with Lineweaver–Burk plots. Let’s say that we have a data setlike the one in the previous example, which has points at both small and large values ofs. This results in the bunching up of a lot of our data in the lower left-hand corner of theplot, as noted above. This tends to exaggerate our impression that the data fit a straightline, since only a few points are out of the lower left-hand mass. My own observations ofpublished Lineweaver–Burk plots over a number of years, as well as a systematic studyby Hill, Waight and Bardsley,1 suggest that true Michaelis–Menten behavior is far fromuniversal, and may in fact be the exception rather than the rule. Lineweaver–Burk plots oftenmake non-Michaelian behavior less obvious, which is problematic, particularly since non-Michaelian behavior of an enzyme is sometimes physiologically relevant, and sometimesa sign of problems with an experimental protocol.
Despite the serious shortcomings of Lineweaver–Burk plots, these are still in verycommon use. Accordingly, it’s a good idea to learn to interpret them, but not a particularlygood idea to participate in propagating their use.
There are other ways to transform the Michaelis–Menten law into a linear form. TheEadie–Hofstee transformation starts from the Lineweaver–Burk equation. If we multiply
1 C. M. Hill, R. D. Waight and W. G. Bardsley, Mol. Cell. Biochem. 15, 173 (1977).

P1: SFK Trim: 247mm × 174mm Top: 14.586mm Gutter: 23.198mm
CUUK1808-15 CUUK1808/Roussel 978 1 107 00678 2 October 31, 2011 8:0
15.2 The Michaelis–Menten mechanism 295
50
100
150
200
250
300
350
400
450
0.02 0.03 0.04 0.05 0.06 0.07
v/μm
ol L
−1s−1
v [S]−1/s−1
Figure 15.3 Eadie–Hofstee plot of the data presented in Example 15.1.
both sides of Equation (15.7) by vvmax and rearrange, we get
v = vmax − KMv
s(15.8)
A plot of v as a function of v/s should give a straight line of slope −KM and interceptvmax.
Example 15.2 Eadie–Hofstee plot We return to the data of Example 15.1. In the Eadie–Hofstee plot, the data take the form
v[S]−1/s−1 0.0650 0.0500 0.0363 0.0275 0.0225 0.0190
v/μmol L−1s−1 130 200 290 330 360 380
(Note that I have reverted to the square bracket notation in v/[S] to avoid confusion withthe units in my table headings and graph axis labels.) The graph is shown in Figure 15.3.As illustrated in this graph, the Eadie–Hofstee plot stretches the data at small s (large v/s)less than does the Lineweaver–Burk plot. This allows us to use a reasonable spread ofvalues of s to get accurate estimates of both vmax and KM. It will also allow us to see non-Michaelian behavior, when it arises, more clearly than would be the case in a Lineweaver–Burk plot. Moreover, note that the parameters of the hyperbola are trivially related tothe slope and intercept of the Eadie–Hofstee plot. Unlike the Lineweaver–Burk plot then,there is no need to do any arithmetic with the slope and intercept to get vmax and KM.Given all these advantages, it is frankly amazing that anyone still uses Lineweaver–Burkplots!
In any event, for this particular data set, we find vmax = 484 μmol L−1s−1 and KM =−(slope) = 5.50 mmol L−1. These values are slightly different than those obtained usingthe Lineweaver–Burk plot. The differences are attributable to the statistical difficulties

P1: SFK Trim: 247mm × 174mm Top: 14.586mm Gutter: 23.198mm
CUUK1808-15 CUUK1808/Roussel 978 1 107 00678 2 October 31, 2011 8:0
296 Enzyme kinetics
previously mentioned with respect to bunching up of the large-s data in a Lineweaver–Burkplot. In other cases, the two methods can give results that differ substantially. To be clear:the Eadie–Hofstee results are more reliable.
Although the Eadie–Hofstee plot is much better behaved than the Lineweaver–Burk plot,the best way to get the Michaelis–Menten parameters is to do a non-linear regression using acomputer program. Non-linear regression directly fits the parameters of an expression suchas the Michaelis–Menten equation to your data. As an added bonus, non-linear regressionroutines almost always return a standard error in addition to the value of the parameter itself.If we run the data of Examples 15.1 and 15.2 through a non-linear regression program,we get vmax = 484 ± 5 μmol L−1s−1 and KM = 5.55 ± 0.16 mmol L−1. These are our bestestimates of these parameters. You will note that the Eadie–Hofstee results are much closerto these best estimates than the Lineweaver–Burk values.
If we should be using non-linear regression, why do we bother with Eadie–Hofsteeplots? There are two good reasons and one not-so-good one. Let’s start with the not-so-good reason: I don’t know of any hand-held calculators that can do a non-linear regression,so an Eadie–Hofstee plot is something you can actually do in an exam, unlike a non-linear regression. Now for some better reasons: as previously mentioned, not every enzymefollows the Michaelis–Menten mechanism. If you don’t know ahead of time if your enzymeis Michaelian, you would like to check this graphically, and that is one of the things thatthe Eadie–Hofstee method lets you do. The other reason has to do with enzyme inhibitors,which we will come to in the next section. There are different kinds of inhibition, and theylook different from each other in Eadie–Hofstee plots. Figuring out what kind of inhibitionyou have from a graph is much easier than trying to do the same thing by looking at numbersspit out by a non-linear regression program.
Exercise group 15.1
(1) Myosin is an enzyme that catalyzes the hydrolysis of ATP, harnessing the freeenergy of this reaction for muscle contraction. The initial rates of this reaction are asfollows:
[ATP]/μmol L−1 v/μmol L−1s−1
75 0.067125 0.095200 0.119325 0.149625 0.185
1550 0.1913200 0.195
Calculate vmax and KM for this enzyme–substrate system. Comment on the fit of thedata to the Michaelis–Menten rate law.

P1: SFK Trim: 247mm × 174mm Top: 14.586mm Gutter: 23.198mm
CUUK1808-15 CUUK1808/Roussel 978 1 107 00678 2 October 31, 2011 8:0
15.2 The Michaelis–Menten mechanism 297
(2) Consider the following initial rate data for an enzyme:
s/mmol L−1 v/μmol L−1s−1
2.0 1304.0 2008.0 290
12.0 33016.0 36020.0 380
(a) Given that the concentration of enzyme is 2.0 g L−1 and that its molar mass isapproximately 50 kg mol−1, and assuming ordinary Michaelis–Menten kinetics,calculate KM and k−2.
(b) The sum k−1 + k−2 appearing in the expression for KM derived from the steady-state approximation (KS) can’t be smaller than k−2. From this observation, computea lower bound for the value of k1.
(3) Chlorotriazines are widely used as herbicides. Their principal mode of action is toinhibit photosynthesis. They do not degrade readily in the environment so that theytend to accumulate in soils and in water. They are not very toxic to mammals, but thereare some questions about their long-term effects on the endocrine system. Studies ofthe in vivo fates of the compounds are therefore of considerable interest. Simazine(2-chloro-4,6-bis(ethylamino)-1,3,5-triazine) is metabolized, chiefly in the liver, to 2-chloro-4-ethylamino-6-amino-1,3,5-triazine:
NN
NCl
NN
NCl
NHCH2CH3
NHCH2CH3
NH2
NHCH2CH3
simazine
Hanioka et al.2 have studied the kinetics of this reaction catalyzed by a rat liver extractcontaining 400 μg of protein in a total volume of 1 mL. Their data are shown below:
[simazine]/μmol L−1 13 25 48 93 194
v/nmol L−1s−1 0.26 0.39 0.53 0.56 0.62
Determine the Michaelis constant and the specific activity.(4) Enzyme catalysis is not the only biochemical process that obeys the Michaelis–Menten
rate law. Transport of nutrients and other chemicals across cell membranes also fre-quently obeys the Michaelis–Menten equation. In the simplest case, the transport
2 N. Hanioka et al., Toxicol. Appl. Pharmacol. 156, 195 (1999).

P1: SFK Trim: 247mm × 174mm Top: 14.586mm Gutter: 23.198mm
CUUK1808-15 CUUK1808/Roussel 978 1 107 00678 2 October 31, 2011 8:0
298 Enzyme kinetics
mechanism can be represented by
T + N(out) � C → T + N(in)
where N is a nutrient and T is a transporter (a protein whose role is to facilitate themovement of N across the membrane). Note that, give or take a change in notation, thisis just the Michaelis–Menten mechanism except that the “reactant” and “product” arechemically identical, but located on opposite sides of a membrane. The following datahave been obtained for the rate transport of sucrose into a strain of Bacillus:3
[sucrose]/μmol L−1 6.3 17.1 23.3 34.7 48.3
v/μmol min−1g−1 0.151 0.296 0.389 0.488 0.540
Note: The rates are given as a specific activity relative to the total mass of cellularprotein. The division by the amount of protein is meant to normalize the results to theamount of transporter present in the cells studied. The assumption is that the amountof transporter is a constant fraction of the total amount of protein in the cells.(a) Do these data obey Michaelis–Menten kinetics? Discuss briefly.(b) Regardless of your answer to question 4a, determine the best-fit values of vmax
and KM.
15.3 Enzyme inhibition
15.3.1 Competitive inhibition
Suppose that, in addition to the substrate, an enzyme is presented with a second specieswhose binding to the enzyme prevents the binding of the substrate, i.e.
E + Sk1−⇀↽−k−1
Ck−2−→ E + P
E + Ik3−⇀↽−k−3
H(CI)
I is a competitive inhibitor of the reaction of S catalyzed by E. Competitive inhibitorsare almost always molecules that fit in the active site of an enzyme, thus blocking out thesubstrate.
When trying to derive rate equations for a complex mechanism like this one, it’s goodto remind ourselves of what we want to do before we proceed: the rate of reaction (rateof formation of product) is v = dp/dt = k−2c. C is an intermediate, so we don’t want itsconcentration appearing in the rate equations. A similar comment could be made about H;it’s neither a reactant nor a product, so it shouldn’t appear in the rate equation we obtain inthe end. We will use the equilibrium and/or steady-state approximations to eliminate thesetwo concentrations. It’s also important in deriving rate equations to take proper account
3 C.J. Peddie et al., Extremophiles 4, 291 (2000).

P1: SFK Trim: 247mm × 174mm Top: 14.586mm Gutter: 23.198mm
CUUK1808-15 CUUK1808/Roussel 978 1 107 00678 2 October 31, 2011 8:0
15.3 Enzyme inhibition 299
of any conservation relations that arise, as we saw in our treatment of the Michaelis–Menten mechanism. These should be used to eliminate concentrations other than those ofintermediate complexes like C and H, since we will use the equilibrium or steady-stateapproximations to get rid of these.
There are two useful conservation relations in this mechanism. First of all, the totalamount of enzyme in its three possible forms (E, C and H) is constant:
e + c + h = e0
where e0 is the total amount of enzyme. Moreover, the total amount of inhibitor is a constant:
i + h = i0
We can use these conservation relations to eliminate e and i:
i = i0 − h (15.9)
e = e0 − c − h
If we try to use the steady-state or equilibrium approximation along with these conservationrelations, we eventually get a quadratic equation. There is nothing wrong with that ofcourse, and the resulting steady-state rate should be valid across a range of experimentalconditions, so arguably it is a very important equation to have at our disposal. However, thisequation doesn’t lead to graphical methods and, as we saw above, graphical methods canbe very useful, even though we will usually use a non-linear regression program to fit theparameters.
If we want a graphical method, we will have to use the fact that, in a laboratoryexperiment, we have a lot of freedom to choose the concentrations. Suppose that we use alot more inhibitor than enzyme, i.e. that i0 � e0. Then, since h < e0, we can conclude thath i0. Equation (15.9) then becomes simply i ≈ i0.
At this point, we have to decide whether we are going to use the steady-state or equi-librium approximation. In enzyme kinetics, it rarely makes a difference to the form of theequations we will eventually obtain. That being the case, I usually pick the equilibriumapproximation since it cuts down a little on the algebra we need to do. We apply theequilibrium approximation to the two reversible steps:
k1es = k1s(e0 − c − h) ≈ k−1c (15.10)
k3ei ≈ k3i0(e0 − c − h) ≈ k−3h (15.11)
In order to reduce the number of symbols we are carrying, and in accord with commonpractice in enzyme kinetics, we divide Equation (15.10) by k1, and Equation (15.11) by k3.We get
s(e0 − c − h) ≈ KSc (15.12)
i0(e0 − c − h) ≈ KIh (15.13)

P1: SFK Trim: 247mm × 174mm Top: 14.586mm Gutter: 23.198mm
CUUK1808-15 CUUK1808/Roussel 978 1 107 00678 2 October 31, 2011 8:0
300 Enzyme kinetics
where we have defined the dissociation constants KS = k−1/k1 and KI = k−3/k3. Note thatk−1/k1 had previously been called KE . I use KS here to emphasize that this is the Michaelisconstant of the substrate, and not to denote any particular approximation. I’m holding backthe symbol KM for another use.
We want to solve these two equations for c and h, the concentrations of the two enzymecomplexes. Recall that v = k−2c so that we want to solve for c last. We can start by solvingEquation (15.12) for h. (It doesn’t actually matter which equation you solve for h, only thatyou start by solving for h.) We get
h ≈ e0 − c − KSc/s
Now substitute this into Equation (15.13), and isolate c. After a few rearrangements, weget
c ≈ KIe0s
KIs + KS(KI + i0)
∴ v = k−2c ≈ KIk−2e0s
KIs + KS(KI + i0)
When we derive rate laws in enzyme kinetics, we usually try to put them in the Michaelis–Menten form. This allows us to use Eadie–Hofstee plots to extract the parameters, amongother advantages. In this case, the equation we have obtained is almost in the form ofEquation (15.6), except that there is a factor of KI multiplying s in the denominator of theexpression. If we now divide the top and bottom of our expression by KI, we can put theequation into the Michaelis–Menten form:
v ≈ vmaxs
s + KS
(1 + i0
KI
) (15.14)
where, as in the Michaelis–Menten mechanism, vmax = k−2e0. It is worth emphasizing thatthis equation is only valid if the inhibitor concentration is very much larger than the enzymeconcentration.
Suppose that we have performed a series of experiments at different values of i0, keepingall other conditions identical. Suppose also that each of our experiments satisfies i0 � e0,except perhaps for one experiment performed without the inhibitor. Note that Equation(15.14) looks like Equation (15.6), except that KM = KS(1 + i0/KI). In other words, if wecreate an Eadie–Hofstee plot of our data, each individual experiment would appear as astraight line. The lines corresponding to each experiment would have a common interceptbecause competitive inhibition doesn’t affect vmax. However, the absolute value of the slope,which is just KM, would increase with increasing inhibitor concentration. If we calculatethe apparent KM for each i0 and replot KM as a function of i0, we should get a straight lineof intercept KS and slope KS/KI.

P1: SFK Trim: 247mm × 174mm Top: 14.586mm Gutter: 23.198mm
CUUK1808-15 CUUK1808/Roussel 978 1 107 00678 2 October 31, 2011 8:0
15.3 Enzyme inhibition 301
0
50
100
150
200
250
300
0 2 4 6 8 10 12 14 16 18 20
v/μm
ol L
−1s−1
v [S]−1/s−1
i0 = 0 i0 = 0.885 i0 = 1.77 i0 = 2.65 i0 = 3.54
μmol L−1
μmol L−1
μmol L−1
μmol L−1
μmol L−1
Figure 15.4 Eadie–Hofstee plot of the enzyme inhibition data from Example 15.3.
Example 15.3 Treatment of competitive inhibition data Consider the following initialrate data from an enzyme inhibition study:
i0 = 0s/10−6 mol L−1 4.91 14.72 24.54 34.36 44.17
v/10−6 mol L−1s−1 91.0 163.9 195.1 212.4 223.5
i0 = 0.885 μmol L−1
s/10−6 mol L−1 4.91 14.72 24.54 34.36 44.17
v/10−6 mol L−1s−1 68.3 136.6 170.7 191.2 204.8
i0 = 1.77 μmol L−1
s/10−6 mol L−1 4.91 14.72 24.54 34.36 44.17
v/10−6 mol L1s−1 54.6 117.0 151.7 173.8 189.1
i0 = 2.65 μmol L−1
s/10−6 mol L−1 4.91 14.72 24.54 34.36 44.17
v/10−6 mol L1s−1 45.5 102.4 136.6 159.3 175.6
i0 = 3.54 μmol L−1
s/10−6 mol L−1 4.91 14.72 24.54 34.36 44.17
v/10−6 mol L1s−1 39.0 91.0 124.1 147.1 163.9
Our first task is to obtain KM and vmax for each set of experiments. We use an Eadie–Hofstee plot since that is the better of the two commonly used graphical methods. As wecan see from Figure 15.4, the slope (−KM) changes with i0, but the intercept (vmax) is

P1: SFK Trim: 247mm × 174mm Top: 14.586mm Gutter: 23.198mm
CUUK1808-15 CUUK1808/Roussel 978 1 107 00678 2 October 31, 2011 8:0
302 Enzyme kinetics
5
10
15
20
25
30
0 0.5 1 1.5 2 2.5 3 3.5 4
KM
/μm
ol L
−1
i0/μmol L−1
Figure 15.5 Secondary plot of the enzyme inhibition data from Example 15.3.
constant. This is consistent with competitive inhibition. The parameters obtained by fittingare as follows:
i0/μmol L−1 KM/μmol L−1 vmax/μmol L−1s−1
0 9.8 2730.88 14.7 2731.77 19.7 2732.65 24.6 2743.54 29.5 273
vmax is therefore 273 μmol L−1s−1. If we plot KM against i0, we get a straight line(Figure 15.5). The slope of this line is 5.57 and the intercept is 9.79 μmol L−1. The interceptis KS while the slope is the ratio of KS to KI. It follows that KI = 1.76 μmol L−1.
15.3.2 Uncompetitive inhibition
In uncompetitive inhibition, the inhibitor does not bind to the free enzyme, but does bindto and inactivate the enzyme–substrate complex:
E + Sk1−⇀↽−k−1
Ck−2−→ E + P
C + Ik3−⇀↽−k−3
H(UI)
Uncompetitive inhibition usually involves binding of the inhibitor to a regulatory siterather than to the active site. The binding of the substrate to the active site modifiesthe conformation (shape) of the enzyme in such a way that it becomes possible for the

P1: SFK Trim: 247mm × 174mm Top: 14.586mm Gutter: 23.198mm
CUUK1808-15 CUUK1808/Roussel 978 1 107 00678 2 October 31, 2011 8:0
15.3 Enzyme inhibition 303
inhibitor to bind to the regulatory site. If an inhibitor does bind to this site, it also alters theconformation of the enzyme, but this time in such a way as to make catalysis impossible.This is an example of what biochemists call an allosteric interaction, an interaction betweendifferent sites that alters the activity of the enzyme.
We are again seeking to express the rate as a function of s. There are two conservationrelations, namely conservation of enzyme and of inhibitor:
e0 = e + c + h
i0 = i + h
We can use these equations to eliminate e and i:
e = e0 − c − h
i = i0 − h
If we carried on from here without making any further approximations, we would get aquadratic equation. As before, we’re going to focus on laboratory experiments where wecan select reaction conditions such that i0 � e0, which implies that i ≈ i0. We apply theEA for the two reversible steps of the reaction. We obtain the equations
k1s(e0 − c − h) ≈ k−1c
k3i0c ≈ k−3h
Defining KS = k−1/k1 and KI = k−3/k3, we get
s(e0 − c − h) ≈ KSc (15.15)
i0c ≈ KIh (15.16)
The latter of these two equations gives us h ≈ i0c/KI. If we now substitute this value of h
into Equation (15.15) and rearrange, we get
c = e0s
s(
1 + i0KI
)+ KS
∴ v = k−2c = k−2e0s
s(
1 + i0KI
)+ KS
(15.17)
As with the other mechanisms we have studied in this chapter, the rate equation is ahyperbola. We can always rewrite such rate equations in the Michaelis–Menten form(Equation 15.6). In this case, we can do this by dividing top and bottom of Equation (15.17)by (1 + i0/KI):
v =k−2e0
1 + i0/KIs
s + KS
1 + i0/KI
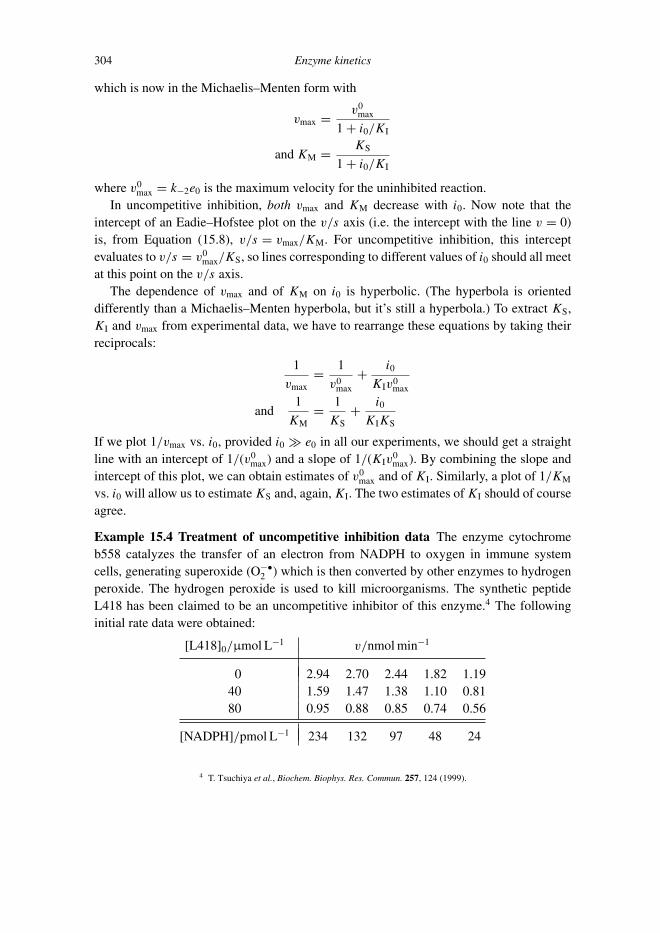
P1: SFK Trim: 247mm × 174mm Top: 14.586mm Gutter: 23.198mm
CUUK1808-15 CUUK1808/Roussel 978 1 107 00678 2 October 31, 2011 8:0
304 Enzyme kinetics
which is now in the Michaelis–Menten form with
vmax = v0max
1 + i0/KI
and KM = KS
1 + i0/KI
where v0max = k−2e0 is the maximum velocity for the uninhibited reaction.
In uncompetitive inhibition, both vmax and KM decrease with i0. Now note that theintercept of an Eadie–Hofstee plot on the v/s axis (i.e. the intercept with the line v = 0)is, from Equation (15.8), v/s = vmax/KM. For uncompetitive inhibition, this interceptevaluates to v/s = v0
max/KS, so lines corresponding to different values of i0 should all meetat this point on the v/s axis.
The dependence of vmax and of KM on i0 is hyperbolic. (The hyperbola is orienteddifferently than a Michaelis–Menten hyperbola, but it’s still a hyperbola.) To extract KS,KI and vmax from experimental data, we have to rearrange these equations by taking theirreciprocals:
1
vmax= 1
v0max
+ i0
KIv0max
and1
KM= 1
KS+ i0
KIKS
If we plot 1/vmax vs. i0, provided i0 � e0 in all our experiments, we should get a straightline with an intercept of 1/(v0
max) and a slope of 1/(KIv0max). By combining the slope and
intercept of this plot, we can obtain estimates of v0max and of KI. Similarly, a plot of 1/KM
vs. i0 will allow us to estimate KS and, again, KI. The two estimates of KI should of courseagree.
Example 15.4 Treatment of uncompetitive inhibition data The enzyme cytochromeb558 catalyzes the transfer of an electron from NADPH to oxygen in immune systemcells, generating superoxide (O−•
2 ) which is then converted by other enzymes to hydrogenperoxide. The hydrogen peroxide is used to kill microorganisms. The synthetic peptideL418 has been claimed to be an uncompetitive inhibitor of this enzyme.4 The followinginitial rate data were obtained:
[L418]0/μmol L−1 v/nmol min−1
0 2.94 2.70 2.44 1.82 1.1940 1.59 1.47 1.38 1.10 0.8180 0.95 0.88 0.85 0.74 0.56
[NADPH]/pmol L−1 234 132 97 48 24
4 T. Tsuchiya et al., Biochem. Biophys. Res. Commun. 257, 124 (1999).

P1: SFK Trim: 247mm × 174mm Top: 14.586mm Gutter: 23.198mm
CUUK1808-15 CUUK1808/Roussel 978 1 107 00678 2 October 31, 2011 8:0
15.3 Enzyme inhibition 305
0
0.5
1
1.5
2
2.5
3
3.5
0 10 20 30 40 50 60 70
v/nm
ol m
in−1
v [NADPH]−1/L min−1
[L418]0 = 0 μmol L−1
[L418]0 = 40 μmol L−1
[L418]0 = 80 μmol L−1
Figure 15.6 Eadie–Hofstee plot of the data from Example 15.4.
In Eadie–Hofstee form, the data become
[L418]0 = 0v[NADPH]−1/L min−1 12.56 20.45 25.15 37.92 49.58
v/nmol min−1 2.94 2.70 2.44 1.82 1.19
[L418]0 = 40 μmol L−1
v[NADPH]−1/L min−1 6.79 11.14 14.23 22.92 33.75
v/nmol min−1 1.59 1.47 1.38 1.10 0.81
[L418]0 = 80 μmol L−1
v[NADPH]−1/L min−1 4.06 6.67 8.76 15.42 23.33
v/nmol min−1 0.95 0.88 0.85 0.74 0.56
The Eadie–Hofstee graph is shown in Figure 15.6. Incidentally, these are superb experi-mental results. The Eadie–Hofstee graph shows that the intercept and absolute value of theslope both decrease with increasing inhibitor concentration, which would be consistent withuncompetitive inhibition. However, the v/[NADPH] intercepts are different. This could bedue to one of two things:
(1) These data do not correspond to uncompetitive inhibition, but to some other type ofinhibition. There are, in fact, a great many inhibition mechanisms, some of which areonly subtly different when plotted in Eadie–Hofstee form. It’s entirely possible thatthe data arise from a type of inhibition other than the two we have studied here. Inparticular, the fact that there is a systematic decrease in the intercept with increasingconcentration of L418 suggests that this is the case.

P1: SFK Trim: 247mm × 174mm Top: 14.586mm Gutter: 23.198mm
CUUK1808-15 CUUK1808/Roussel 978 1 107 00678 2 October 31, 2011 8:0
306 Enzyme kinetics
Table 15.1 Kinetic parameters for the inhibition of cytochrome b558 by L418.
[L418]0/μmol L−1 KM/pmol L−1 vmax/nmol min−1 vmax/KM/L min−1
0 49 3.64 7440 29 1.79 6280 20 1.02 51
(2) We have just three lines, so it’s possible that random error has just accidentally causedthe three intercepts to look like they are drifting systematically. This is always apossibility, but I would argue that the relatively good fits to the Eadie–Hofstee linesmake it unlikely that there were large enough errors to account for the differences inthe intercepts.
Given the appearance of the Eadie–Hofstee graph, I would tend to conclude that this isnot an example of uncompetitive inhibition. In their paper, Tsuchiya and coworkers wrotethat they decided that they did have uncompetitive inhibition based on their Lineweaver–Burk plots for which “all lines obtained with different concentration of L418 have identicalslopes of Km/Vmax.” You will recognize this criterion for uncompetitive inhibition as beingequivalent to a common v/[NADPH] intercept of v0
max/KS, despite the slight differencesin notation. Their Lineweaver–Burk lines do look like they have similar slopes. Unfortu-nately, they do not give the values of these slopes, so it’s difficult to judge how well theyagree.
Suppose that we were to accept that this is a case of uncompetitive inhibition. We couldthen work out the kinetic parameters as described above. Table 15.1 gives the values of vmax
and KM for each inhibitor concentration, as well as the v/[NADPH] intercept. We see fromthis table that the spread of values of the intercept is not great. It is possible that Tsuchiyaand coworkers computed a similar spread of values for the slopes of their Lineweaver–Burkplots and concluded that these were in reasonable agreement with each other. Be that asit may, we can replot these data in the form 1/vmax and 1/KM vs. [L418]0 (Figure 15.7).The slope and intercept of the 1/KM plot are, respectively, 3.70 × 10¹⁴ L2 mol−2 and2.02 × 1010 L mol−1. The intercept is 1/KS so we have KS = 50 pmol L−1. The interceptdivided by the slope gives KI = 54 μmol L−1. Similarly, the 1/vmax plot has a slope andintercept of 8.82 × 10¹² min L mol−2 and 2.52 × 10⁸ min mol−1, respectively, from whichwe can calculate v0
max = 4.0 nmol min−1 and KI = 29 μmol L−1. The two estimates of KI
disagree somewhat. Whether this is due to random errors or to this not being a case ofuncompetitive inhibition is a matter of judgment. If, again, we assume that this is randomerror, we would report the following final data:
v0max = 4.0 nmol min−1
KS = 50 pmol L−1
KI = 42 ± 13 μmol L−1

P1: SFK Trim: 247mm × 174mm Top: 14.586mm Gutter: 23.198mm
CUUK1808-15 CUUK1808/Roussel 978 1 107 00678 2 October 31, 2011 8:0
15.3 Enzyme inhibition 307
Table 15.2 Relationship between the Michaelis–Menten parameters vmax andKM and the inhibitor concentration in two types of enzyme inhibition studiedat large inhibitor concentrations.
Type vmax (v intercept) KM vmax/KM (v/s intercept)
competitive k−2e0 KS(1 + i0/KI ) varies
uncompetitive 1vmax
= 1v0
max+ i0
KIv0max
1KM
= 1KS
+ i0KIKS
v0max/KS
0.01
0.02
0.03
0.04
0.05
0.06
0 10 20 30 40 50 60 70 800.2
0.4
0.6
0.8
1
KM−1
/1012
L m
ol−1
v−1
/109 m
in m
ol−1
[L418]0/μmol L−1
KM−1
v−1max
max
Figure 15.7 Secondary plots of the uncompetitive inhibition data from Example 15.4. Note the largeamount of scatter from the line for the 1/vmax data.
The value of KI was obtained by averaging the two estimates, while the uncertainty is halfthe difference between them. Interestingly, Tsuchiya and coworkers give a very differentvalue for KI, namely 11 μmol L−1. The difference is difficult to explain since they do notreport any of their other kinetic parameters.
15.3.3 Determining the type of inhibition
Assume that we have carried out a set of inhibition experiments with i0 � e0. In this case,the data from a set of rate measurements at a particular value of i0 will generally plot outas a hyperbola. Each type of inhibitory interaction has a different effect on KM and vmax.The two examples studied in this chapter are summarized in Table 15.2. There are manyother ways in which inhibitors can act on an enzyme. Other types of inhibition would leadto different patterns in Eadie–Hofstee plots. Reference books on enzyme kinetics, such asthose listed at the end of this chapter, provide rate equations for several more examples ofinhibition mechanisms than it is possible to include in this book.
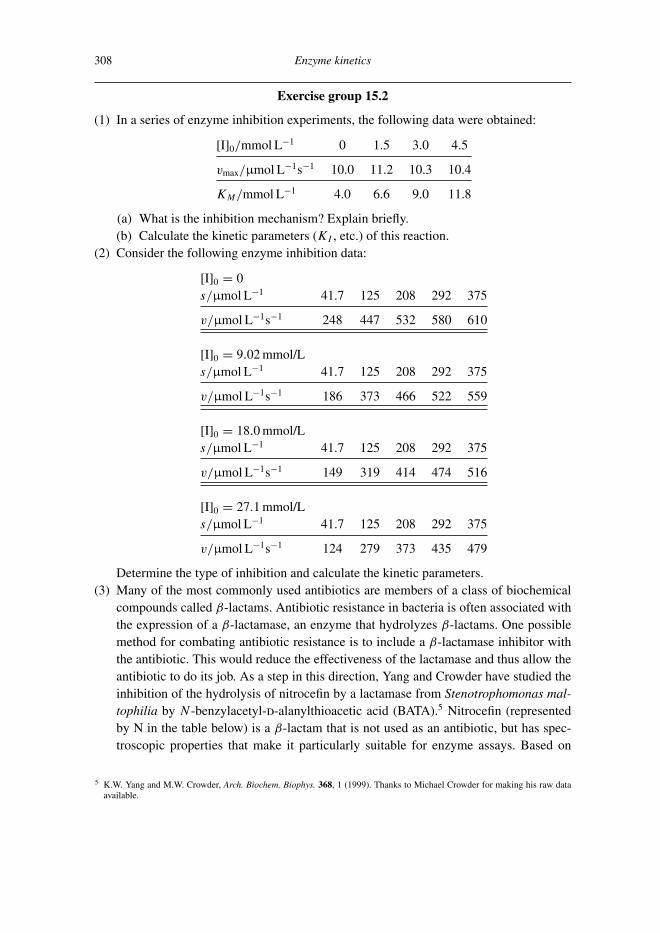
P1: SFK Trim: 247mm × 174mm Top: 14.586mm Gutter: 23.198mm
CUUK1808-15 CUUK1808/Roussel 978 1 107 00678 2 October 31, 2011 8:0
308 Enzyme kinetics
Exercise group 15.2
(1) In a series of enzyme inhibition experiments, the following data were obtained:
[I]0/mmol L−1 0 1.5 3.0 4.5
vmax/μmol L−1s−1 10.0 11.2 10.3 10.4
KM/mmol L−1 4.0 6.6 9.0 11.8
(a) What is the inhibition mechanism? Explain briefly.(b) Calculate the kinetic parameters (KI , etc.) of this reaction.
(2) Consider the following enzyme inhibition data:
[I]0 = 0s/μmol L−1 41.7 125 208 292 375
v/μmol L−1s−1 248 447 532 580 610
[I]0 = 9.02 mmol/Ls/μmol L−1 41.7 125 208 292 375
v/μmol L−1s−1 186 373 466 522 559
[I]0 = 18.0 mmol/Ls/μmol L−1 41.7 125 208 292 375
v/μmol L−1s−1 149 319 414 474 516
[I]0 = 27.1 mmol/Ls/μmol L−1 41.7 125 208 292 375
v/μmol L−1s−1 124 279 373 435 479
Determine the type of inhibition and calculate the kinetic parameters.(3) Many of the most commonly used antibiotics are members of a class of biochemical
compounds called β-lactams. Antibiotic resistance in bacteria is often associated withthe expression of a β-lactamase, an enzyme that hydrolyzes β-lactams. One possiblemethod for combating antibiotic resistance is to include a β-lactamase inhibitor withthe antibiotic. This would reduce the effectiveness of the lactamase and thus allow theantibiotic to do its job. As a step in this direction, Yang and Crowder have studied theinhibition of the hydrolysis of nitrocefin by a lactamase from Stenotrophomonas mal-tophilia by N -benzylacetyl-d-alanylthioacetic acid (BATA).5 Nitrocefin (representedby N in the table below) is a β-lactam that is not used as an antibiotic, but has spec-troscopic properties that make it particularly suitable for enzyme assays. Based on
5 K.W. Yang and M.W. Crowder, Arch. Biochem. Biophys. 368, 1 (1999). Thanks to Michael Crowder for making his raw dataavailable.
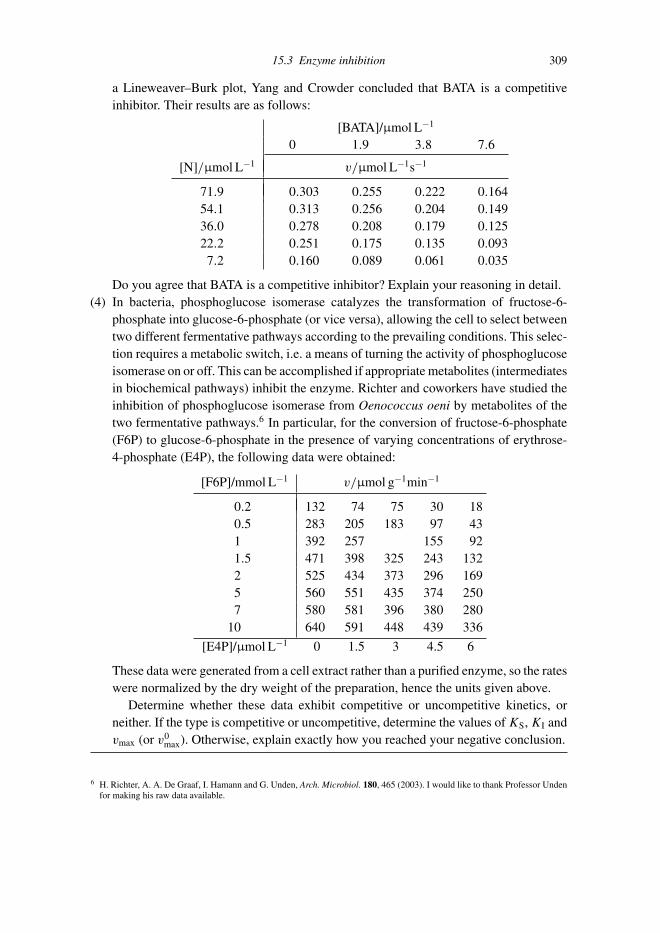
P1: SFK Trim: 247mm × 174mm Top: 14.586mm Gutter: 23.198mm
CUUK1808-15 CUUK1808/Roussel 978 1 107 00678 2 October 31, 2011 8:0
15.3 Enzyme inhibition 309
a Lineweaver–Burk plot, Yang and Crowder concluded that BATA is a competitiveinhibitor. Their results are as follows:
[BATA]/μmol L−1
0 1.9 3.8 7.6
[N]/μmol L−1 v/μmol L−1s−1
71.9 0.303 0.255 0.222 0.16454.1 0.313 0.256 0.204 0.14936.0 0.278 0.208 0.179 0.12522.2 0.251 0.175 0.135 0.0937.2 0.160 0.089 0.061 0.035
Do you agree that BATA is a competitive inhibitor? Explain your reasoning in detail.(4) In bacteria, phosphoglucose isomerase catalyzes the transformation of fructose-6-
phosphate into glucose-6-phosphate (or vice versa), allowing the cell to select betweentwo different fermentative pathways according to the prevailing conditions. This selec-tion requires a metabolic switch, i.e. a means of turning the activity of phosphoglucoseisomerase on or off. This can be accomplished if appropriate metabolites (intermediatesin biochemical pathways) inhibit the enzyme. Richter and coworkers have studied theinhibition of phosphoglucose isomerase from Oenococcus oeni by metabolites of thetwo fermentative pathways.6 In particular, for the conversion of fructose-6-phosphate(F6P) to glucose-6-phosphate in the presence of varying concentrations of erythrose-4-phosphate (E4P), the following data were obtained:
[F6P]/mmol L−1 v/μmol g−1min−1
0.2 132 74 75 30 180.5 283 205 183 97 431 392 257 155 921.5 471 398 325 243 1322 525 434 373 296 1695 560 551 435 374 2507 580 581 396 380 280
10 640 591 448 439 336
[E4P]/μmol L−1 0 1.5 3 4.5 6
These data were generated from a cell extract rather than a purified enzyme, so the rateswere normalized by the dry weight of the preparation, hence the units given above.
Determine whether these data exhibit competitive or uncompetitive kinetics, orneither. If the type is competitive or uncompetitive, determine the values of KS, KI andvmax (or v0
max). Otherwise, explain exactly how you reached your negative conclusion.
6 H. Richter, A. A. De Graaf, I. Hamann and G. Unden, Arch. Microbiol. 180, 465 (2003). I would like to thank Professor Undenfor making his raw data available.

P1: SFK Trim: 247mm × 174mm Top: 14.586mm Gutter: 23.198mm
CUUK1808-15 CUUK1808/Roussel 978 1 107 00678 2 October 31, 2011 8:0
310 Enzyme kinetics
15.4 Deriving rate laws for enzyme mechanisms
The algorithm for deriving rate laws for enzyme mechanisms or, in general, for catalyzedreactions, is similar to the system presented in Section 14.3, but there are a few extra steps.I won’t repeat the entire algorithm here. Rather, I will highlight the differences:
� Instead of intermediates, look for enzyme complexes.� Write down an enzyme conservation relation before you try to apply any approximations.
Also write down any other conservation relations you notice. Conservation of inhibitorsis a common condition. In reactions that pass a chemical group around (e.g. a phosphategroup), conservation of this chemical group (called a “conserved moiety” in the enzymeliterature) is another potentially useful relationship.
� If you have any information about some concentrations being large or small compared toeach other, use this immediately to simplify the conservation relations.
� Use the enzyme conservation relation to eliminate the concentration of free enzymein all equations where it appears. Similarly use any other conservation relationships toeliminate concentrations or simplify equations.
� Unless you have a special reason for doing otherwise, apply the equilibrium approxima-tion for any reversible complexation steps that appear in the mechanism. If necessary,round out the set of approximations with steady-state approximations for some of theenzyme complexes.
Key ideas and equations
� For the Michaelis–Menten mechanism, v = vmaxs
s + KM◦ kcat = vmax/e0
◦ KM is a dissociation constant for the enzyme-substrate complex.� Eadie–Hofstee plot: v = vmax − KM
v
s� Table 15.2
Suggested reading
There are a number of useful books on enzyme kinetics. Here are a few I particularly like:
A. Cornish-Bowden, Principles of Enzyme Kinetics (Butterworths: London, 1976).
Cornish-Bowden’s books – he has written several more – present the ideas of enzymekinetics is an extremely clear manner.
K. J. Laidler and P. S. Bunting, The Chemical Kinetics of Enzyme Action, 2nd edn. (Claren-don: Oxford, 1973).

P1: SFK Trim: 247mm × 174mm Top: 14.586mm Gutter: 23.198mm
CUUK1808-15 CUUK1808/Roussel 978 1 107 00678 2 October 31, 2011 8:0
15.4 Deriving rate laws for enzyme mechanisms 311
This book is a wonderful summary of ideas, methods and results in enzyme kinetics,with many references to the literature.
A. Fersht, Enzyme Structure and Mechanism, 2nd edn. (Freeman: New York, 1985).
This is a much wider ranging book than Laidler and Bunting’s, but it still manages toprovide considerable depth and is absolutely beautifully written.
I. H. Segel, Enzyme Kinetics (Wiley: New York, 1975).
If you ever want a rate law for an enzyme mechanism and don’t want to derive it yourself,this is the first place I would look. This book is absolutely encyclopedic when it comes tomechanisms and rate laws. As you may have gathered, I have a soft spot for the historyof enzymology. If you’re interested in this subject, here are a couple of books I wouldrecommend:
J. S. Fruton, Molecules and Life (Wiley: New York, 1972).
This book contains a series of essays on the history of biochemistry.
H. C. Friedmann, Enzymes (Hutchinson Ross: Stroudsburg, PA, 1981).
This book contains extracts and translations of most of the key papers in the history ofenzymology, along with extensive, insightful notes by the editor.
Review exercise group 15.3
(1) Microorganisms are increasingly being used to degrade pollutants. Accordingly, thekinetics of these processes are of considerable interest. Because biochemical degra-dation pathways often have a rate-limiting enzyme-catalyzed step, it is often (but notalways) the case that biodegradation obeys simple Michaelis–Menten kinetics. Considerthe following initial rate data obtained for the degradation of phenol by Pseudomonasputida immobilized on calcium alginate beads:7
[phenol]/mmol L−1 1.01 2.67 5.29 7.94 10.4
v/μmol L−1h−1 3.1 6.4 10 12 14
(a) Does this reaction follow Michaelis-Menten kinetics? Explain briefly.(b) Regardless of your answer to part 1a, provide estimates of the Michaelis constant
and maximum reaction rate.(2) DNA polymerase α (pol α) catalyzes the first step in the replication of DNA. Pol α is
inhibited by replication factor C (RF-C). (RF-C is a DNA-binding protein that playsa role in helping other enzymes involved in DNA synthesis (e.g. pol δ) attach to theDNA. The complete story is too complex to explain in any detail here.) In this case,
7 K. Bandhyopadhyay et al., Biochem. Eng. J. 8, 179 (2001).

P1: SFK Trim: 247mm × 174mm Top: 14.586mm Gutter: 23.198mm
CUUK1808-15 CUUK1808/Roussel 978 1 107 00678 2 October 31, 2011 8:0
312 Enzyme kinetics
instead of having two small molecules competing for the active site of an enzyme, wehave two enzymes competing for a single substrate, namely DNA.(a) A crude cartoon of the mechanism for this competitive process would be
pol α + DNAk1−⇀↽−k−1
CPk−2−→ pol α + P + DNA
RF-C + DNAk3−⇀↽−k−3
CR
Derive a rate law for this mechanism valid when the pol α concentration is muchsmaller than the DNA concentration, and the latter is in turn much smaller than theRF-C concentration. Show that this rate law is of identical form to that for ordinarycompetitive inhibition.Hint: Start by writing down three conservation relations, then use the conditionsgiven above to simplify these relations. After that, the derivation follows the normalpath.
(b) The following initial rate data have been obtained in the presence of 0.2 mu ofpol α:8
[DNA]/g L−1
0.025 0.049 0.121 0.241
[RF-C]/mu v/fmol min−1
0 85 159 246 3280.2 47 90 167 246
A unit (u) of enzyme is an empirical unit used to measure the amount of enzymein a preparation based on its catalytic activity (as described on page 292). Thedefinition of a unit varies somewhat from study to study. Here, a unit was takento be the amount of RF-C that allows polymerase δ to polymerize 1 nmol of DNAbases in 60 minutes. This definition of a unit doesn’t actually matter all that muchhere. Just take it as a measure of concentration.
Show that these data are consistent with competitive inhibition, and calculateKS, KI and the specific activity.Note: Since you will only have two points, it won’t be necessary to draw a graphto extract KS and KI.
(3) Show that the following mechanism is kinetically indistinguishable from (leads to thesame rate law as) the ordinary Michaelis–Menten mechanism:
E + Sk1−⇀↽−k−1
C1k2−⇀↽−k−2
C2k3−→ E + P
Provide equations for KM and vmax appropriate to this mechanism.
8 Maga et al., J. Mol. Biol. 295, 791 (2000).

P1: SFK Trim: 247mm × 174mm Top: 14.586mm Gutter: 23.198mm
CUUK1808-15 CUUK1808/Roussel 978 1 107 00678 2 October 31, 2011 8:0
15.4 Deriving rate laws for enzyme mechanisms 313
(4) When determining rate laws for complex mechanisms, we generally assume that thefinal product-forming step is irreversible. This is appropriate when data from initial-rate experiments are to be treated, but violates the law of microscopic reversibility.Moreover, in some cases we do want to know how the rate depends on the productconcentration.
Derive a rate law for the fully reversible Michaelis–Menten mechanism
E + Sk1−⇀↽−k−1
Ck−2−⇀↽−k2
E + P
under the assumption that the enzyme concentration is small compared to the substrateconcentration. Simplify your answer, but don’t attempt to introduce Michaelis constantsor a maximum velocity into your equation.Hints: Think carefully about the conservation relations. The EA can’t be applied herebecause there are two elementary reactions that might both equilibrate rapidly. The finalresult will be in a form similar (but not identical) to the Michaelis–Menten equation.

P1: SFK Trim: 247mm × 174mm Top: 14.586mm Gutter: 23.198mm
CUUK1808-16 CUUK1808/Roussel 978 1 107 00678 2 October 29, 2011 13:32
16
Techniques for studying fast reactions
Many elementary chemical reactions occur on extremely short time scales (down to fem-toseconds). Special experimental and mathematical methods are required to study fastprocesses. Here, we will focus on reactions in solution. Some of the methods describedhere are also adaptable to gas-phase reactions, but there are also some gas-phase methodsthat are quite different from anything we would use in solution. Also note that this chapterdoes not provide a comprehensive survey of methods, even for reactions in solution. Theintention is to discuss a few particularly important methods, which hopefully will give youa flavor of the various approaches available.
16.1 Flow methods
16.1.1 The continuous flow method
The basic idea behind the continuous flow method is very simple: the reactants are suppliedat a constant rate into a tube where the reaction takes place. At constant flow velocity,positions in the tube correspond to specific times since mixing, the relationship betweentime and the distance from the mixing chamber L being t = L/v. By varying the flowspeed or moving a detector along the length of the tube, we can therefore study the courseof a fast reaction at our leisure.
Figure 16.1 shows a diagram of a typical solution-phase continuous-flow apparatus. Themixing chamber must be so designed that the two reactants mix quickly. The chamber thencorresponds to t = 0 (freshly mixed reactants). We also need to operate at high flow ratesbecause we want some turbulence in the tube. The alternative is laminar flow; in a laminarflow, the flow velocity varies with the distance from the tube wall, higher flow velocitiesbeing achieved near the center than at the wall (Figure 16.2). In the direction transverseto the flow direction, only diffusion operates, so mixing in this direction is very slow.The result is that molecules close to the center of the tube have traveled from the mixingchamber for a shorter period of time than molecules closer to the walls. Turbulent liquidflows on the other hand are well mixed in the radial direction (the direction perpendicularto the tube wall) so that the average speeds of the molecules are all the same, regardless ofwhether they started close to the wall or not when they entered the tube. Turbulent flows
314
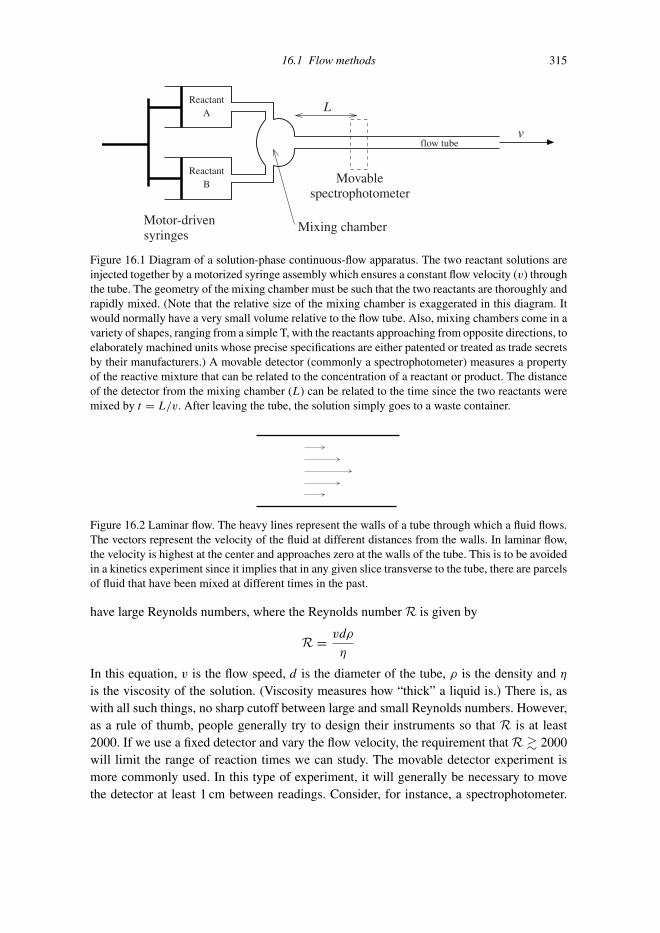
P1: SFK Trim: 247mm × 174mm Top: 14.586mm Gutter: 23.198mm
CUUK1808-16 CUUK1808/Roussel 978 1 107 00678 2 October 29, 2011 13:32
16.1 Flow methods 315
ReactantA
ReactantB Movable
spectrophotometer
Motor-drivensyringes
vflow tube
Mixing chamber
L
Figure 16.1 Diagram of a solution-phase continuous-flow apparatus. The two reactant solutions areinjected together by a motorized syringe assembly which ensures a constant flow velocity (v) throughthe tube. The geometry of the mixing chamber must be such that the two reactants are thoroughly andrapidly mixed. (Note that the relative size of the mixing chamber is exaggerated in this diagram. Itwould normally have a very small volume relative to the flow tube. Also, mixing chambers come in avariety of shapes, ranging from a simple T, with the reactants approaching from opposite directions, toelaborately machined units whose precise specifications are either patented or treated as trade secretsby their manufacturers.) A movable detector (commonly a spectrophotometer) measures a propertyof the reactive mixture that can be related to the concentration of a reactant or product. The distanceof the detector from the mixing chamber (L) can be related to the time since the two reactants weremixed by t = L/v. After leaving the tube, the solution simply goes to a waste container.
Figure 16.2 Laminar flow. The heavy lines represent the walls of a tube through which a fluid flows.The vectors represent the velocity of the fluid at different distances from the walls. In laminar flow,the velocity is highest at the center and approaches zero at the walls of the tube. This is to be avoidedin a kinetics experiment since it implies that in any given slice transverse to the tube, there are parcelsof fluid that have been mixed at different times in the past.
have large Reynolds numbers, where the Reynolds number R is given by
R = vdρ
η
In this equation, v is the flow speed, d is the diameter of the tube, ρ is the density and η
is the viscosity of the solution. (Viscosity measures how “thick” a liquid is.) There is, aswith all such things, no sharp cutoff between large and small Reynolds numbers. However,as a rule of thumb, people generally try to design their instruments so that R is at least2000. If we use a fixed detector and vary the flow velocity, the requirement that R � 2000will limit the range of reaction times we can study. The movable detector experiment ismore commonly used. In this type of experiment, it will generally be necessary to movethe detector at least 1 cm between readings. Consider, for instance, a spectrophotometer.

P1: SFK Trim: 247mm × 174mm Top: 14.586mm Gutter: 23.198mm
CUUK1808-16 CUUK1808/Roussel 978 1 107 00678 2 October 29, 2011 13:32
316 Techniques for studying fast reactions
The light beam used by the spectrophotometer might be a few millimeters wide, or perhapsas little as 1 mm for a laser source. We want each of our measurements to correspond toa distinct time, so we have to move the detector at least the width of the beam to makesure that our sample volumes don’t overlap. A distance of about 1 cm satisfies this criterionwhile being easily measured.
Having taken all of this information in, we can examine the consequences of thesevarious ideas for the design of a continuous flow apparatus. Suppose that we want to studya reaction that is complete in about 15 ms. We will be moving the detector 1 cm at a time.Say we want to get samples corresponding to every millisecond of the reaction. This wouldmean that the tube would have to be at least 15 cm long. If it takes 15 ms for the fluid totravel 15 cm, the flow speed must be v = L/t = 10 m s−1. The density and viscosity of thesolution will both be close to those of water (assuming that this is the solvent). Water hasa density of about 1000 kg m−3 and a viscosity of about 1 mPa s near room temperature. Ifthe Reynolds number is to be greater than 2000, we must therefore have
d >2000η
vρ= 2000(1 × 10⁻³ Pa s)
(10 m/s)(1000 kg m−3)= 2 × 10⁻⁴ m ≡ 0.2 mm
which shouldn’t pose much of a problem. There are some tradeoffs here: if the diameter ofthe tube is too small, the detector won’t be working with a very large sample and may notbe able to pick up enough signal to give reliable results. It is sometimes possible to makeup for this by letting the detector average its readings over a longer period of time, but thistakes more solution. On the other hand, if we make the tube too large, we’ll need to putenormous amounts of solution through the tube.
Suppose that we decide on a 1 mm tube and that our detector can take a reading in 1 s.We can stop pushing fluid through the tube while we reposition the detector, so we don’tneed to waste our reactant solutions in between readings. The cross-sectional area of thetube is
A = πr2 = π (0.5 × 10⁻³ m)2 = 7.9 × 10⁻⁷ m2
The volume of solution that passes through a particular point in the tube every second (theflow rate) is therefore
f = Av = (7.9 × 10⁻⁷ m2)(10 m s−1) = 7.9 × 10⁻⁶ m3 s−1 = 8 mL s−1
Each reading will therefore require at least 8 mL of the mixed solution. There are startupissues to consider as well (e.g. flushing out any old solution before taking a reading), sosay we really need about twice that much solution per reading, or 15 mL. Fifteen readingswould then take 225 mL of solution. This probably doesn’t sound like much, but if thereactants are expensive or difficult to make, this could be a problem.
There is another design challenge to be met. In order to push a fluid through a 1 mmtube at a speed of 10 m s−1, a large pressure has to be applied. The exact pressure dependson a number of details, but would typically be a few atmospheres. These are hardly hugepressures, but they are high enough that some care must be taken in building the apparatusif it is to hold together during the experiment.

P1: SFK Trim: 247mm × 174mm Top: 14.586mm Gutter: 23.198mm
CUUK1808-16 CUUK1808/Roussel 978 1 107 00678 2 October 29, 2011 13:32
16.2 Flash photolysis 317
ReactantA
ReactantB
Activationswitch
Motor-drivensyringes
Mixing chamber
Detector
Stop syringe
Figure 16.3 Diagram of a stopped-flow apparatus. As in the continuous flow method, reactants arerapidly injected into a mixing chamber (again, exaggerated in size in this diagram, and possibly ofa very different shape than shown here). From there, they enter a tube that leads to a third syringe.As this syringe fills, it pushes out a plunger which eventually activates the detector and turns off thedrive motors.
16.1.2 The stopped-flow method
What do we do if one or both of our reactant solutions are difficult to make in largequantities? In this case, we want to rapidly mix the reactant solutions and then rapidly startacquiring data without shooting our reactive mixture out of the apparatus. Both of thesecan be achieved using a variation on the experiment described in the last section calledthe stopped-flow method. A sketch of the apparatus is shown in Figure 16.3. In this case,instead of being discarded, the reactive mixture fills a third syringe. This causes the plungerto move out. It eventually hits a switch that stops the drive motors and activates the detector.The detector in this case is not mobile, and takes a series of readings over time.
The stopped-flow technique relies on:
(1) rapid filling of the mixing chamber, tube and syringe, and(2) a detector that can very rapidly measure concentrations or, more precisely, an observable
proportional to concentration, such as the absorbance at a particular wavelength.
The dead time (the time it takes to fill the sample tube and start recording data) can beas short as one or two milliseconds. Equipment that achieves such short mixing times isusually highly miniaturized, with reaction volumes of a few tens of microliters. Becausethe detector doesn’t have to move, a huge variety of detection methods can be used, rangingfrom more-or-less straightforward spectroscopic methods to more exotic techniques likeX-ray and neutron scattering.
16.2 Flash photolysis
Flow methods, as we have seen above, can get us experimental information on a millisecondtime scale. Unfortunately, many reactions are much faster than this. One of the mostproductive avenues for studying fast reactions was developed by Norrish and Porter in the

P1: SFK Trim: 247mm × 174mm Top: 14.586mm Gutter: 23.198mm
CUUK1808-16 CUUK1808/Roussel 978 1 107 00678 2 October 29, 2011 13:32
318 Techniques for studying fast reactions
UV lamp
UV lamp
PowerSupply
Sample
Detectionlamp
Mirror
Capacitor
1
2
mirror
Spectrophotometer
Figure 16.4 Traditional flash photolysis apparatus. The switches labeled 1 and 2 are closed in turn tocharge the capacitor and to discharge it through the ultraviolet (UV) lamps. The mirrors ensure thatmost of the light generated passes through the sample tube. The spectrometer then either collects thetransmitted light intensity at a fixed wavelength as a function of time, or for detection of intermediates,takes a complete spectrum as a function of wavelength.
1940s. Suppose we have a reaction in which the reactants can coexist, at least for a time,without reacting. Further suppose that we can trigger this reaction by a pulse of light. Thissecond condition is true of a great many reactions, since the absorption of light can causeelectronic excitation and bond breakage, typically forming radicals.
The traditional flash photolysis apparatus is shown in Figure 16.4. The capacitor ischarged by closing switch 1. Once this is done, switch 1 is opened and switch 2 is closed.The charge accumulated in the capacitor discharges through the ultraviolet (UV) lamps,producing a flash of white light lasting 20 μs or so. Recording of data can therefore startwithin several tens of microseconds. This is sufficiently fast to observe many chemicalintermediates using straightforward spectroscopic techniques. Accordingly, this techniquenot only allows us to study the kinetics of a reaction, but also to identify intermediates. Forthe latter purpose, the detection lamp would usually also be operated in a short pulse. Ina modern version of this experiment, the transmitted light would be sent through a gratingto a diode array detector. Complete spectra could be taken at different time points, givinga complete profile of the reaction both in terms of the time evolution, and in terms of thechemical species generated.

P1: SFK Trim: 247mm × 174mm Top: 14.586mm Gutter: 23.198mm
CUUK1808-16 CUUK1808/Roussel 978 1 107 00678 2 October 29, 2011 13:32
16.2 Flash photolysis 319
Most laboratories carrying out flash photolysis experiments now use lasers instead offlash lamps. Lasers have several advantages:
(1) Instead of white light from a flash lamp, which contains a range of frequencies, lasersproduce a beam with a very narrow range of frequencies. This gives the experimentalistmore control over the bonds to be photolyzed and over the energy distribution of thephotolysis products than is possible with flash lamps. Modern lasers are often tunable(i.e. their emission wavelength can be adjusted) so that different energy ranges can beexplored.
(2) Laser flashes can be very fast, allowing faster reactions to be studied than in conven-tional flash photolysis. Picosecond flashes are now routinely produced.
(3) Using conventional flash lamps, there is a tradeoff between the light energy producedand the duration of the flash: nanosecond flashes are possible, but only microjoules ofenergy are produced in these flashes. At the other end of the scale, we can generateflashes that release several hundred joules of energy, but they last several microseconds.Furthermore, the energy from a flash lamp is delivered over a large area. A typical flashtube might be up to 1 m long. The result is that any given part of the reactive mixturegenerally receives only a small amount of energy, particularly if we want a fast flash.On the other hand, high flash energies focused on a very small area are easily obtainedwith lasers. This allows the generation of very high concentrations of intermediatesand thus facilitates their detection.
Lasers though have one important disadvantage: it’s hard to make a wide laser beam.Accordingly, a laser flash is delivered to a very small volume. In some experiments, thatdoesn’t matter. In others, this means that we are only making radicals in one part of thereaction vessel, which will make diffusion of radicals an important process in addition tothe reaction kinetics we are trying to study. Contrast that to the traditional flash apparatus(Figure 16.4), which is designed to deliver the light evenly to the entire reaction vessel.
What do you do if the reaction you want to study isn’t one that can be triggered by light?In a clever and relatively recent variation on the flash photolysis experiment, chemists havedeveloped methods for releasing reactants from chemical “cages” using a light flash. Oneexample is the release of ATP by photolysis of compound 1 in Figure 16.5. Compound 1 isnot hydrolyzed by enzymes that hydrolyze ATP. In fact, it generally doesn’t even bind inthe active site because of the nitrobenzyl group at the “business end” of ATP. If you wantto study an enzyme that hydrolyzes ATP, you can therefore mix the enzyme and compound1, then release ATP by photolysis and watch the reaction from there.
Norrish and Porter shared the 1967 Nobel Prize in Chemistry for their developmentof flash photolysis with Manfred Eigen, who developed another approach to studying fastreactions which we will study shortly. More recently, the 1999 Nobel Prize was awardedto Ahmed Zewail for developing methods for studying transition states (Section 17.1)using femtosecond laser pulses. While Zewail’s methods are quite different from ordinaryflash photolysis, they are undoubtedly the intellectual descendants of Norrish and Porter’swork.
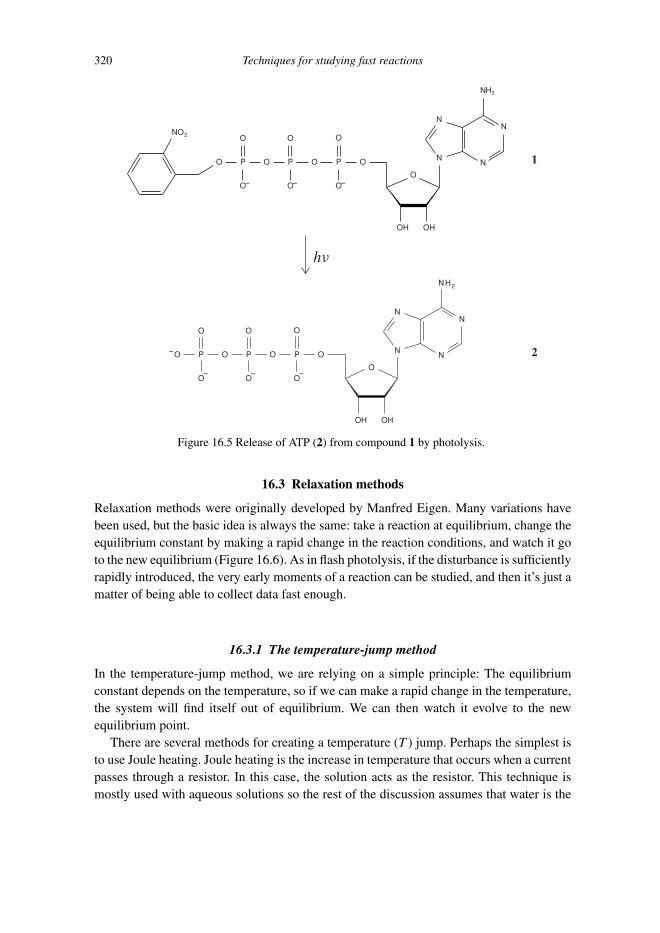
P1: SFK Trim: 247mm × 174mm Top: 14.586mm Gutter: 23.198mm
CUUK1808-16 CUUK1808/Roussel 978 1 107 00678 2 October 29, 2011 13:32
320 Techniques for studying fast reactions
O
H2
O− O− O−
NO2 O
N
O
N
NN
N
OHOH
OPOPOPO
O
1
hν
O
H2
O−
O−
O−
O
N
O
N
NN
N
OHOH
OPOPOPO−
O
2
Figure 16.5 Release of ATP (2) from compound 1 by photolysis.
16.3 Relaxation methods
Relaxation methods were originally developed by Manfred Eigen. Many variations havebeen used, but the basic idea is always the same: take a reaction at equilibrium, change theequilibrium constant by making a rapid change in the reaction conditions, and watch it goto the new equilibrium (Figure 16.6). As in flash photolysis, if the disturbance is sufficientlyrapidly introduced, the very early moments of a reaction can be studied, and then it’s just amatter of being able to collect data fast enough.
16.3.1 The temperature-jump method
In the temperature-jump method, we are relying on a simple principle: The equilibriumconstant depends on the temperature, so if we can make a rapid change in the temperature,the system will find itself out of equilibrium. We can then watch it evolve to the newequilibrium point.
There are several methods for creating a temperature (T ) jump. Perhaps the simplest isto use Joule heating. Joule heating is the increase in temperature that occurs when a currentpasses through a resistor. In this case, the solution acts as the resistor. This technique ismostly used with aqueous solutions so the rest of the discussion assumes that water is the

P1: SFK Trim: 247mm × 174mm Top: 14.586mm Gutter: 23.198mm
CUUK1808-16 CUUK1808/Roussel 978 1 107 00678 2 October 29, 2011 13:32
16.3 Relaxation methods 321
[X]
t
Figure 16.6 Typical course of a relaxation experiment. The system starts out at equilibrium. At aparticular point in time, indicated by the arrow, the reaction conditions are rapidly changed. Thesystem then relaxes to its new equilibrium. We observe the system during this relaxation phase, afterthe sudden change in conditions.
999.70
999.75
999.80
999.85
999.90
999.95
1000.00
0 2 4 6 8 10
ρ/kg
m−3
T/oC
Figure 16.7 Density of liquid water as a function of temperature. Because water has a density maximumnear 4 ◦C, it is possible to choose initial and final temperatures straddling 4 ◦C that correspond to thesame density. For instance, the density is 999.95 kg m−3 at both 2.34 and 5.73 ◦C.
solvent. A large capacitor is charged, and then discharged through a sample cell containingat most a few milliliters of solution. The discharge is typically done in 10−7 to 10−6 sand leads to a temperature rise of 7–8 ◦C. There are a number of complications to worryabout. First of all, the density of water varies with temperature (Figure 16.7) so that thislarge a temperature rise can cause shock waves as the water rapidly expands. To minimizethis problem, the experiment is carried out at temperatures near 4 ◦C. It is then possibleto choose initial and final temperatures at which the solution has approximately the samedensity.
Another issue in T -jump experiments is thermal equilibration between the sample celland the solvent. The walls of the sample cell are usually made of an insulating material and

P1: SFK Trim: 247mm × 174mm Top: 14.586mm Gutter: 23.198mm
CUUK1808-16 CUUK1808/Roussel 978 1 107 00678 2 October 29, 2011 13:32
322 Techniques for studying fast reactions
so are not subject to Joule heating. As a result, heat is transferred from the solvent to thecooler walls of the cell. This results in convection currents which begin roughly 1 s afterthe discharge. These convection currents cause optical turbulence, which tends to makespectrophotometer readings fluctuate, so the experiment must be over before these currentsstart. This means that Joule heating can be used to study reactions on time scales rangingfrom microseconds to one or two tenths of a second.
Another option is to use an intense laser beam to heat the sample. By this method, calledoptical heating, temperature jumps of up to 10 ◦C can be obtained in a few nanoseconds.Optical heating is therefore suitable for measuring rates of reactions on time scales rangingfrom nanoseconds and up. The main problem here is that the sample volume must be small,since it must be completely contained in the laser beam to obtain uniform heating. Verysensitive detectors will be necessary in these experiments.
However the temperature jump is achieved, the result is the same. The variation of theequilibrium constant with temperature is given by Equation 8.12. Suppose that a reactionhas an enthalpy change of 100 kJ mol−1. Then, for a temperature jump of 8 ◦C with anaverage T of 4 ◦C (to minimize the shock waves due to expansion), we get
ln
(K2
K1
)= �rH
◦m
R
(1
T1− 1
T2
)
= 100 × 103 J mol−1
8.314 472 J K−1mol−1
(1
273.15− 1
281.15 K
)= 1.25
∴ K2
K1= exp(1.25) ≈ 3.5
If �rH◦m were negative, we would predict a decrease of the equilibrium constant by a similar
factor. Larger enthalpy changes or larger temperature jumps would create larger changes inthe equilibrium constant, and therefore larger displacements from the new equilibrium.
16.3.2 The pressure-jump method
Although equilibrium constants are not very sensitive to pressure, it is possible to changethe equilibrium constant of a system by making very large pressure changes. This is thebasis of the pressure (p) jump method.
Again, there are many methods for obtaining a pressure jump, some of which areillustrated in Figure 16.8. In one technique [Figure 16.8(a)], a valve is rapidly opened to atank of pressurized gas. This is a fairly slow method, taking several hundredths of a second,but large pressure jumps of over 100 atm can be achieved.
In a variation on this technique, a valve is opened between the sample cell and a muchlarger liquid reservoir [Figure 16.8(b)]. Pressure changes are transmitted very rapidly wheretwo liquids are in contact. The pressure of the liquid reservoir determines the pressure ofthe sample cell. Mixing between the two is minimized because the surface of contact insidethe open valve is very small. On the time scale of this experiment, we can therefore neglecteffects associated with dilution of the sample by the solvent in the liquid reservoir. Pressure

P1: SFK Trim: 247mm × 174mm Top: 14.586mm Gutter: 23.198mm
CUUK1808-16 CUUK1808/Roussel 978 1 107 00678 2 October 29, 2011 13:32
16.3 Relaxation methods 323
(a)
Samplecell
Valve
Pressurizedgas
Valve
cell
(b)
Sample
liquidPressurized
Rupture disk
Valve
Samplecell
(c)
Pressurizedgas
Figure 16.8 Methods for creating a pressure jump. (a) A valve is opened to a pressurized gas cylinder.(b) A valve is opened to a pressurized liquid ballast. Note that the sample cell in this case is filledright up to the valve such that the pressure is transmitted through the liquid. (c) The sample cell ispressurized prior to the start of the experiment. After closing the valve to the pressurized gas reservoir,a rapid downward pressure jump is obtained by breaking a rupture disk.
changes (increases or decreases) of a few hundred atmospheres can be achieved in under5 ms. Because the pressure can be varied up or down, the effect of pressure on the reactioncan be fully studied by this method.
Another simple method involves pressurizing the system to be studied, then rapidlydecreasing the pressure (to ambient pressure) by breaking a rupture disk [Figure 16.8(c)].The pressure change in this case is much faster, taking about 60 μs. One advantage of thismethod, in addition to the very fast change in pressure, is that the readings are taken near1 bar rather than at an elevated pressure. This makes the data more directly comparable todata from other experiments near 1 bar (thermochemical measurements, classical kineticsexperiments, etc.) than would be the case for high-pressure data. However, slightly smallerpressure jumps are obtained (50–60 atm), which in turn means that smaller changes in theequilibrium constant occur.
The pressure-jump method involves one unfortunate complication: when we rapidlychange the pressure on a sample, the temperature changes. The temperature increasesduring pressurization and decreases in a depressurization. This temperature change isusually at most a few tenths of a degree, but this is enough to cause difficulties with somemeasurement methods. Of course, if this is a problem for p-jump experiments, it’s an evenlarger problem for T jumps.
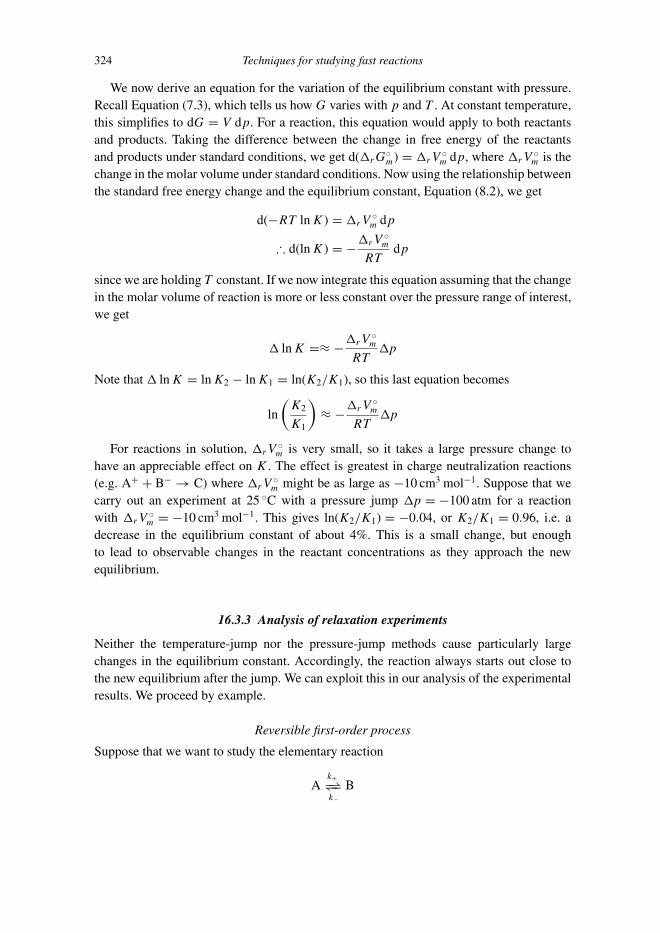
P1: SFK Trim: 247mm × 174mm Top: 14.586mm Gutter: 23.198mm
CUUK1808-16 CUUK1808/Roussel 978 1 107 00678 2 October 29, 2011 13:32
324 Techniques for studying fast reactions
We now derive an equation for the variation of the equilibrium constant with pressure.Recall Equation (7.3), which tells us how G varies with p and T . At constant temperature,this simplifies to dG = V dp. For a reaction, this equation would apply to both reactantsand products. Taking the difference between the change in free energy of the reactantsand products under standard conditions, we get d(�rG
◦m) = �rV
◦m dp, where �rV
◦m is the
change in the molar volume under standard conditions. Now using the relationship betweenthe standard free energy change and the equilibrium constant, Equation (8.2), we get
d(−RT ln K) = �rV◦m dp
∴ d(ln K) = −�rV◦m
RTdp
since we are holding T constant. If we now integrate this equation assuming that the changein the molar volume of reaction is more or less constant over the pressure range of interest,we get
� ln K =≈ −�rV◦m
RT�p
Note that � ln K = ln K2 − ln K1 = ln(K2/K1), so this last equation becomes
ln
(K2
K1
)≈ −�rV
◦m
RT�p
For reactions in solution, �rV◦m is very small, so it takes a large pressure change to
have an appreciable effect on K . The effect is greatest in charge neutralization reactions(e.g. A+ + B− → C) where �rV
◦m might be as large as −10 cm3 mol−1. Suppose that we
carry out an experiment at 25 ◦C with a pressure jump �p = −100 atm for a reactionwith �rV
◦m = −10 cm3 mol−1. This gives ln(K2/K1) = −0.04, or K2/K1 = 0.96, i.e. a
decrease in the equilibrium constant of about 4%. This is a small change, but enoughto lead to observable changes in the reactant concentrations as they approach the newequilibrium.
16.3.3 Analysis of relaxation experiments
Neither the temperature-jump nor the pressure-jump methods cause particularly largechanges in the equilibrium constant. Accordingly, the reaction always starts out close tothe new equilibrium after the jump. We can exploit this in our analysis of the experimentalresults. We proceed by example.
Reversible first-order process
Suppose that we want to study the elementary reaction
Ak+−⇀↽−k−
B

P1: SFK Trim: 247mm × 174mm Top: 14.586mm Gutter: 23.198mm
CUUK1808-16 CUUK1808/Roussel 978 1 107 00678 2 October 29, 2011 13:32
16.3 Relaxation methods 325
by a relaxation technique. The experiment follows what happens after the disturbanceso only the values of the parameters (rate and equilibrium constants) after the jump arerelevant. The temperature or pressure jump only serves to create slightly out-of-equilibriumconditions in the system.
Let the new equilibrium point be (aeq, beq). Since the jump leaves us close to the newequilibrium, we can write
a = aeq + δa
where δa is a small displacement. We similarly define δb by b = beq + δb. By stoichiometry,δb = −δa so
b = beq − δa
According to the law of mass action,
da
dt= −k+a + k−b = −k+(aeq + δa) + k−(beq − δa) = −k+aeq + k−beq − δa(k+ + k−).
However, −k+aeq + k−beq = 0, because da/dt = 0 at equilibrium. Moreover,
da
dt= d
dt(aeq + δa) = d(δa)
dt
because aeq is a constant. (Recall that we are only interested in what happens after thejump, when the temperature and pressure have stopped changing.) Therefore
d(δa)
dt= −δa(k+ + k−)
This is just a first-order rate equation with solution
δa = δa0 exp(−[k+ + k−]t)
By convention, we write the solution in terms of a relaxation time τ such that
δa = δa0 exp(−t/τ )
In this case, τ = (k+ + k−)−1. If we measure the relaxation time (by the usual graphicalmethod for first-order rate processes), we then know the sum of the forward and reverse rateconstants. Once the reaction reaches equilibrium, we can measure the equilibrium constant:
K = beq/aeq = k+/k−
This measurement gives us the ratio of the two rate constants. The equilibrium constantand relaxation time together will let us determine the two rate constants.
Example 16.1 Transfer RNA can exist in two different conformations in solution:
Ak+−⇀↽−k−
B
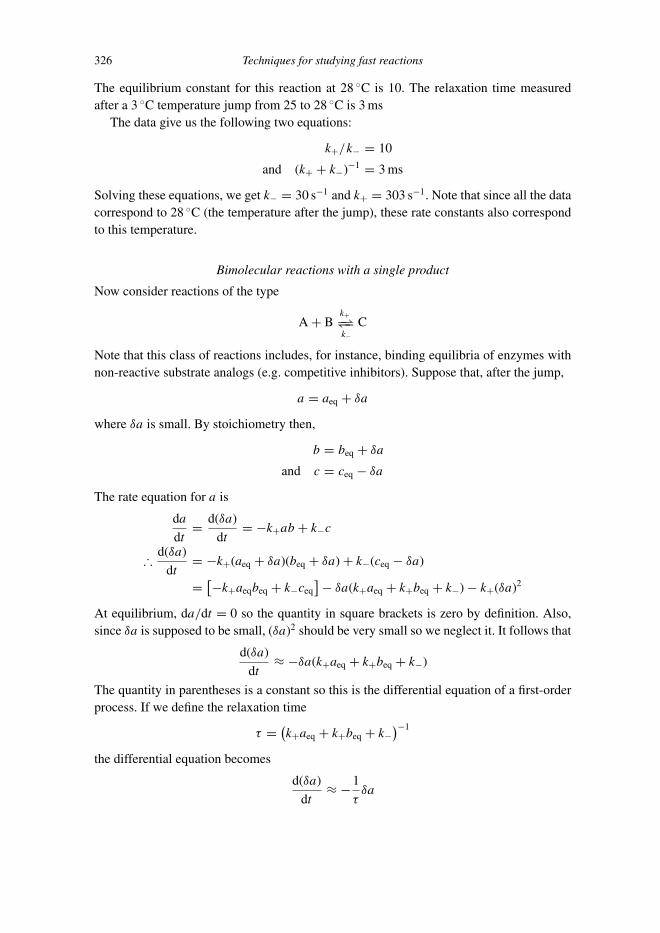
P1: SFK Trim: 247mm × 174mm Top: 14.586mm Gutter: 23.198mm
CUUK1808-16 CUUK1808/Roussel 978 1 107 00678 2 October 29, 2011 13:32
326 Techniques for studying fast reactions
The equilibrium constant for this reaction at 28 ◦C is 10. The relaxation time measuredafter a 3 ◦C temperature jump from 25 to 28 ◦C is 3 ms
The data give us the following two equations:
k+/k− = 10
and (k+ + k−)−1 = 3 ms
Solving these equations, we get k− = 30 s−1 and k+ = 303 s−1. Note that since all the datacorrespond to 28 ◦C (the temperature after the jump), these rate constants also correspondto this temperature.
Bimolecular reactions with a single product
Now consider reactions of the type
A + Bk+−⇀↽−k−
C
Note that this class of reactions includes, for instance, binding equilibria of enzymes withnon-reactive substrate analogs (e.g. competitive inhibitors). Suppose that, after the jump,
a = aeq + δa
where δa is small. By stoichiometry then,
b = beq + δa
and c = ceq − δa
The rate equation for a is
da
dt= d(δa)
dt= −k+ab + k−c
∴ d(δa)
dt= −k+(aeq + δa)(beq + δa) + k−(ceq − δa)
= [−k+aeqbeq + k−ceq]− δa(k+aeq + k+beq + k−) − k+(δa)2
At equilibrium, da/dt = 0 so the quantity in square brackets is zero by definition. Also,since δa is supposed to be small, (δa)2 should be very small so we neglect it. It follows that
d(δa)
dt≈ −δa(k+aeq + k+beq + k−)
The quantity in parentheses is a constant so this is the differential equation of a first-orderprocess. If we define the relaxation time
τ = (k+aeq + k+beq + k−)−1
the differential equation becomes
d(δa)
dt≈ − 1
τδa

P1: SFK Trim: 247mm × 174mm Top: 14.586mm Gutter: 23.198mm
CUUK1808-16 CUUK1808/Roussel 978 1 107 00678 2 October 29, 2011 13:32
16.3 Relaxation methods 327
The solution of this differential equation is
δa = δa0 exp(−t/τ )
If we measure the relaxation time and equilibrium concentrations, we can recover bothk+ and k−. First, the equilibrium concentrations can be used to determine the equilibriumconstant:
K = ceq
aeqbeq= k+
k−
There is one important note here: the equilibrium constant that appears here is the phe-nomenological equilibrium constant (with units of L mol−1) and not the dimensionlessthermodynamic equilibrium constant. This will be an important consideration in the exam-ple to be discussed below.
We can rearrange the expression for the relaxation time slightly:
τ−1 = k−[K(aeq + beq
)+ 1]
Thus, if we have measured τ and the equilibrium concentrations, from which we can alsocalculate K , we can recover k−. Given k− and K , we can calculate k+.
Example 16.2 Perhaps the most famous application of relaxation methods has been to themeasurement of the rate constants for the autoionization of water:
H2O(l)kd−⇀↽−ka
H+(aq) + OH−
(aq)
The relaxation time is 37 μs at 25 ◦C. This is a reaction of the same stoichiometry as studiedin this section, except that it is written backwards:
H+(aq) + OH−
(aq)
ka−⇀↽−kd
H2O(l).
The equilibrium concentrations are, at 25 ◦C, [H+]eq = [OH−]eq = 1.0 × 10⁻⁷ mol L−1
and [H2O] = 55.33 mol L−1. Note that we need the mole density of water because kineticsrequires the use of phenomenological equilibrium constants:
K = [H2O]
[H+][OH−]= 5.5 × 10¹⁵ L mol−1
kd can be calculated from the relaxation time by
k−1d = τ
[K([H+]eq + [OH−](eq)
)+ 1]
= (37 × 10−6 s)[(5.5 × 10¹⁵ L mol−1)(1.0 × 10⁻⁷ + 1.0 × 10⁻⁷ mol L−1) + 1
]= 4.1 × 10⁴ s
∴ kd = 2.4 × 10⁻⁵ s−1
Since K = ka/kd ,
ka = kdK = 1.35 × 10¹¹ L mol−1s−1

P1: SFK Trim: 247mm × 174mm Top: 14.586mm Gutter: 23.198mm
CUUK1808-16 CUUK1808/Roussel 978 1 107 00678 2 October 29, 2011 13:32
328 Techniques for studying fast reactions
Exercise group 16.1
(1) The phenomenological equilibrium constant of the reaction
CH3COOH(aq)kd−⇀↽−ka
CH3COO−(aq) + H+
(aq)
has the value 1.8 × 10⁻⁵ mol L−1 at 25 ◦C. The relaxation time measured at this tem-perature in a 0.100 mol L−1 solution of acetic acid is 8.3 ns. What are the values of thetwo rate constants?Hint: You will need the equilibrium concentrations of acetate and of protons. Thesecan be calculated from the equilibrium condition.
(2) The trp repressor (R) is a dimeric protein formed by the assembly of two identicalsubunits in solution:
2Ska−⇀↽−kd
R
This reaction has recently been studied by the pressure-jump method.1
(a) Derive an equation for the relaxation time.(b) In the presence of 2.5 mol L−1 of the denaturant guanidine hydrochloride (GuHCl)
the value of �rV◦m for the reaction is −162 mL mol−1. (Without a denaturant, the
trp repressor is too stable for its association and dissociation kinetics to be studied.)The apparatus used created downward pressure jumps of up to 150 bar at 21 ◦C.By roughly what factor would the equilibrium constant increase or decrease afterthese pressure jumps?
(3) The DNA stain proflavin dimerizes in solution:
2Pka−⇀↽−kd
P2
This is of course the same kind of reaction as in the previous problem, so you can reusesome of the results derived there.(a) In the experiments, relaxation times were measured at several different proflavin
concentrations. Define the total proflavin concentration pt = [P] + 2[P2]. Relatept to [P]eq, the equilibrium concentration of P. Then obtain an equation relatingthe relaxation time τ to pt and propose a graphical method for extracting the rateconstants of this reaction.
(b) The following data have been obtained:
τ/10−7s 3.2 1.8 1.4 1.2
pt/10−3mol L−1 0.5 2.0 3.5 5.0
Determine the values of ka and kd .(c) Calculate �rG
◦m for the dimerization of proflavin.
1 G. Desai et al., J. Mol. Biol. 288, 461 (1999).

P1: SFK Trim: 247mm × 174mm Top: 14.586mm Gutter: 23.198mm
CUUK1808-16 CUUK1808/Roussel 978 1 107 00678 2 October 29, 2011 13:32
16.3 Relaxation methods 329
Key ideas and equations
� Mixing is the major limiting factor in studying fast reactions. There are two possiblestrategies to deal with this: rapid mixing (flow methods) or avoiding mixing altogether(flash photolysis, relaxation methods). Methods that avoid mixing can be used to studymuch faster reactions than rapid mixing methods.
� For a T jump, ln
(K2
K1
)= �rH
◦m
R
(1
T1− 1
T2
)� For a p jump, ln
(K2
K1
)≈ −�rV
◦m
RT�p
Reaction τ
Ak+−⇀↽−k−
B (k+ + k−)−1
A + Bk+−⇀↽−k−
C{k−[K(aeq + beq) + 1
]}−1
Suggested reading
The Methods in Enzymology series has always taken a broad view of what might be usefulto an enzymologist. Consequently, these volumes are a tremendous resource for anyoneworking in the molecular sciences. Volume XVI is dedicated to fast reactions. Althoughit’s a little old – it was published in 1969 – the basic ideas are all there so that it’s a greatstarting point for someone wanting to become acquainted with the classical methods forstudying reactions on micro- to millisecond time scales.
If you’re interested in caged compounds for use in kinetics studies, I would recommendthe following review papers:
Gunter Mayer and Alexander Heckel, Angew. Chem., Int. Ed. 45, 4900–4921 (2006).Hsien-Ming Lee, Daniel R. Larson and David S. Lawrence, ACS Chem. Biol. 4, 409–427
(2009).

P1: SFK Trim: 247mm × 174mm Top: 14.586mm Gutter: 23.198mm
CUUK1808-17 CUUK1808/Roussel 978 1 107 00678 2 October 29, 2011 15:7
17
Factors that affect the rate constant
The rate constant is called that because, ideally, it is constant with respect to the concentra-tions of chemical species in the system. However, it does depend on the reaction conditions.Most obviously, rate constants depend on the temperature. They also depend on the chem-ical environment in which the reaction occurs. For instance, some reactions can be carriedout in different solvents. Provided the two solvents are reasonably similar, the mechanismis likely to be the same. However, the rate constants are generally different. Moreover, itis only true to a first approximation that rate constants do not depend on concentration.Changing the concentrations of species in a system can change the intermolecular forcesacting on the participants in a reaction and thus the rate constants. The effect is particularlypronounced in electrolyte solutions, where the concentrations of ions have a profound effectboth on the organization of the solvent and on the distribution of solutes.
17.1 A simple picture of elementary reactions
Let’s consider a specific elementary reaction, namely
Br(g) + H2(g) � HBr(g) + H(g)
We have thermodynamic data for all the species in this reaction in Appendix A.1. Since�rνgas = 0, we can calculate that �rU
◦m = �rH
◦m = 69.84 kJ mol−1. (See Section 5.9 for
the connection between �rU◦m and �rH
◦m.) This means that the products are higher in
energy than the reactants by 69.84 kJ mol−1.Let’s now try to construct a picture of this reaction in our minds. Two things have to
happen: An H–Br bond must be formed and an H–H bond must be broken. Since thisreaction is elementary, both of these things happen more or less at the same time. (That’swhat we mean by an elementary reaction.) Since we are now going to talk about reactionson a molecular scale, however, we must be clear about what “at the same time” reallymeans. Roughly speaking, it means that the H–Br bond is formed while the H–H bondis lengthening and preparing to “break”. The whole event takes about the same time as abond vibration (about 10−13 s). Knowing that the bond forming and breaking events occurmore or less simultaneously still leaves some room for different possibilities. For instance,the two bond lengths could change at similar rates. Then, if we could look at the atoms
330

P1: SFK Trim: 247mm × 174mm Top: 14.586mm Gutter: 23.198mm
CUUK1808-17 CUUK1808/Roussel 978 1 107 00678 2 October 29, 2011 15:7
17.1 A simple picture of elementary reactions 331
mro
Br−H + H
Br + H−H
E
E
Δ
x
a
U = 69.84 kJ mol−1
aE+
−
HHBr
Figure 17.1 Sketch of the potential energy profile of the elementary reaction Br + H2 � HBr + H.In the forward direction, the reactants must gain an energy E+
a to cross the activation barrier. Thereverse reaction has an activation energy of E−
a .
during the 10−13 s or so that it takes to transform the reactants into products, we would seesomething like this:
Br H − H =⇒ Br · · · ·H · · · ·H =⇒ Br − H H
We start with a Br atom and an H2 molecule. The central structure represents a species withvery weak H–Br and H–H bonds. The H–Br bond strengthens, forming a stable molecule,and the H–H bond breaks, leaving us with the products of this elementary reaction. Note thatthe central structure must represent a very high-energy species relative to both reactants andproducts since the H–H bond has been substantially weakened (which takes energy), butthe H–Br bond has not completely formed yet either. If this mental picture of the reaction iscorrect, we can think of (for instance) the difference between the H–H and H–Br distancesas a reaction coordinate, i.e. a variable that locates where we are along the path fromreactants to products. The reaction coordinate x = dHH − dHBr increases as the reactionproceeds. We can sketch the potential energy along our reaction coordinate (Figure 17.1).The high-energy species between the reactant and products is called the activated complexor transition state. The amount of energy needed to get to the transition state is calledthe activation energy and is normally denoted by the symbol Ea . On the above diagram,we show both the activation energy for the forward (E+
a ) and reverse (E−a ) elementary
reactions. Note that the activation energies and �rU◦m are related, as you can see from the
figure:
�rU◦m = E+
a − E−a
The above picture is not the only one we can imagine for this reaction. Instead of a“loose” transition state, we might have a “tight” one in which the atoms are all at more-or-less normal bonding distances from each other:
Br H − H =⇒ Br − H − H =⇒ Br − H H

P1: SFK Trim: 247mm × 174mm Top: 14.586mm Gutter: 23.198mm
CUUK1808-17 CUUK1808/Roussel 978 1 107 00678 2 October 29, 2011 15:7
332 Factors that affect the rate constant
o
E
R
r m2
Br + Br
E+aU = 190.35 kJ mol−1=
BrΔ
Figure 17.2 Sketch of the potential energy profile of the elementary reaction Br2 � 2Br. The reactioncoordinate here is the bond length, R. The radical recombination reaction has an activation energyof zero. Accordingly, the activation energy for dissociation equals the change in energy for thereaction.
In this scenario, the bromine forms a more-or-less normal bond to hydrogen, using itsnon-bonding electrons, and then the other hydrogen atom leaves. We can guess that thetransition state in this picture will also have a high energy since it requires a hydrogenatom to form more than one bond, which in turn requires valence shell expansion, i.e. theparticipation of 2s and perhaps 2p electrons. (Note that I’m only listing possibilities herefor illustrative purposes. In this case, because the energy required to expand the valenceshell of hydrogen is so large, a tight transition state is unlikely.) The energy diagram forthis pathway will therefore look much like the one for the scenario with a loose transitionstate.
Either way, we conclude that the reaction must pass through a high-energy transitionstate. The reactants will have to surmount an activation barrier (an energy hill, as picturedabove) in order to proceed to products.
Not every reaction involves an activation energy. Consider the elementary reaction
Br2(g) � 2Br(g)
The reverse reaction, recombination of the radicals, is all downhill. The energy diagramfor radical formation/recombination reactions is sketched in Figure 17.2. The activationenergy for recombination is zero. The activation energy for dissociation is just �rU
◦m.
It must be emphasized before we move on that the first case (the existence of a transitionstate of higher energy than either the reactants or products) is by far the more common ofthe two cases illustrated here.
Finally, it is useful to distinguish clearly between the transition state and a chemicalintermediate. A chemical intermediate is a stable chemical species which can, at least inprinciple, be isolated. The lifetime of a chemical intermediate is much longer than thetime scale of molecular vibrations. On the other hand, a transition state is not, by any

P1: SFK Trim: 247mm × 174mm Top: 14.586mm Gutter: 23.198mm
CUUK1808-17 CUUK1808/Roussel 978 1 107 00678 2 October 29, 2011 15:7
17.1 A simple picture of elementary reactions 333
E
x
TS1TS2
E
E
a(1)
a(2)
R
P
I
Figure 17.3 Potential energy profile for a reaction with a high-energy intermediate. Only the activationenergies for the forward reaction R → P are shown. There are two independent activation energiesand two transition states (TS1 and TS2) in this system associated with the two elementary reactionsR → I and I → P.
definition whatsoever, stable and cannot, even in theory, be isolated. Transition states canonly be studied by ultra-fast spectroscopic methods, their lifetimes being of the order10−13 s.
We can picture the difference between intermediates and transition states by referenceto an energy profile for a simple isomerization reaction (Figure 17.3). The intermediate (I)occupies a “well” in the potential energy. Intermediates, once formed, need to gain enoughenergy to surmount an activation barrier to react. These barriers may be relatively low (asshown in the figure) or may be quite high. The transition states, on the other hand, sit atenergy maxima and typically do not survive a single molecular vibration.
If you compare Figures 17.1 and 17.3, you may wonder why, in one case, the reactantand product regions are shown as flat regions of the potential energy landscape, whilein the other, they are shown as wells. The answer is that the reaction coordinate x canrepresent very different quantities for different reactions, and that the potential energy profiletherefore looks different as we move away from the barrier. For the Br + H2 reaction, wesuggested that x = dHH − dHBr might be a good reaction coordinate. Large positive valuesof this coordinate correspond to an H atom and an HBr molecule that are far apart. Atlarge distances, the intermolecular forces tend to zero, so the potential energy flattens out.Similar comments could be made about large negative values of x, where the Br atom andH2 molecule are far apart. On the other hand, for an isomerization reaction like the onesketched in Figure 17.3, the reaction coordinate is an internal coordinate of the molecule(distance between some pair of atoms, bond angle, etc.). There is a limit to the values thatan internal coordinate can adopt without breaking bonds, so typically in these cases thegraph of potential energy vs. internal coordinate rises, sometimes very sharply, at extremevalues of x. The reactant, product and intermediate (if any) then sit at the bottoms of theirrespective potential energy wells.

P1: SFK Trim: 247mm × 174mm Top: 14.586mm Gutter: 23.198mm
CUUK1808-17 CUUK1808/Roussel 978 1 107 00678 2 October 29, 2011 15:7
334 Factors that affect the rate constant
17.2 The Arrhenius equation
In general, molecules will have to surmount an activation (energy) barrier to react. Themolecules in a sample of matter don’t all have the same energy. Some have more, some haveless. Moreover, they are constantly exchanging energy with each other through collisions.We would like to know how many reactant molecules have at least εa units of energy relativeto their ground state (the lowest energy available). (Note that I’m using ε here for energieson a per molecule basis to distinguish these from molar energies.) Only these moleculescan react to form products according to the simple picture developed in the last section.Our question can be answered using the Boltzmann equation (Section 3.2). The probabilitythat a given molecule has an energy of ε is given by Equation 3.1, which we rewrite slightlyhere:
P (ε) = g(ε) exp(−ε/[kBT ])/q, (17.1)
where g(ε) is the degeneracy of energy level ε, i.e. the number of different quantum states ofthe molecule with the same energy, and q is the molecular partition function. The molecularpartition function is a proportionality constant that only depends on the temperature. In thederivation that follows, we will treat the energy as a continuous variable. In other words,we will apply a classical (non-quantum) treatment. The equation we will obtain is knownto only be approximately correct, partly because of quantum effects, but also because itis based on a rough kind of reasoning. Assuming classical behavior is, as it turns out, noworse than the other approximations on which this equation is based.
If any energy is allowed, then we have to reinterpret Equation 17.1. Instead of thedegeneracy, g(ε) becomes the density of states, which is the number of states with energybetween ε and ε + dε. In such a case, we cannot talk of the probability that a moleculehas an energy of exactly ε. This probability is zero because there are an infinite number ofallowed energies in any finite interval or, to put it another way, the energy of the systemis bound to differ in some decimal place from any number we care to write down. In thecase where the energy varies continuously then, we should think of the right-hand-sideof Equation 17.1 as a probability density for energy ε, i.e. a probability per unit energy.More specifically, if ε is a possible outcome of an energy measurement for a molecule,we have
P (ε ≤ ε ≤ ε + dε) = g(ε)exp(−ε/[kBT ])
qdε
If we add up these probabilities for all the little intervals of width dε, which is equivalentto integrating the probability density, we should get 1 since the molecule has to have somevalue or other of the energy:
1 =∫ ∞
0
g(ε)exp(−ε/[kBT ])
qdε = 1
q
∫ ∞
0g(ε) exp(−ε/[kBT ]) dε
∴ q =∫ ∞
0g(ε) exp(−ε/[kBT ]) dε.

P1: SFK Trim: 247mm × 174mm Top: 14.586mm Gutter: 23.198mm
CUUK1808-17 CUUK1808/Roussel 978 1 107 00678 2 October 29, 2011 15:7
17.2 The Arrhenius equation 335
We want to know the probability that a molecule has an energy in excess of εa , theactivation energy. This probability would be the sum of the probabilities that the energy isin an interval of width dε for all values of ε > εa:
P (ε > εa) =∫ ∞
εa
g(ε) exp(−ε/[kBT ])
qdε =
∫ ∞
εa
g(ε) exp(−ε/[kBT ]) dε∫ ∞
0g(ε) exp(−ε/[kBT ]) dε
If we can’t say anything about the density of states, we’re stuck here. We now makea radical approximation, namely that there is one, constant density of states below theactivation energy, which we will call gb, and a different, but also constant, density of statesabove the barrier, ga . Mathematically, we would write g(ε) = gb for ε < εa and g(ε) = ga
for ε > εa , with ga and gb constant. Then
P(ε > εa) =ga
∫ ∞
εa
exp(−ε/[kBT ]) dε
gb
∫ εa
0exp(−ε/[kBT ]) dε + ga
∫ ∞
εa
exp(−ε/[kBT ]) dε
Usually, the second term in the denominator of this expression will be much smaller thanthe first because the transition state will be high in energy and thus a low-probability state.We would therefore not make a large error by neglecting this term. For the same reason, wewould not make a large error by extending the range of integration in the remaining termin the denominator to infinity:
P(ε > εa) =ga
∫ ∞
εa
exp(−ε/[kBT ]) dε
gb
∫ ∞
0exp(−ε/[kBT ]) dε
= −ga kBT exp(−ε/[kBT ])|∞εa
−gb kBT exp(−ε/[kBT ])|∞0= ga
gb
exp(−εa/[kBT ]) = ga
gb
exp(−Ea/[RT ])
In the last equality, we have used the fact that Boltzmann’s constant is just the idealgas constant on a per molecule basis to transform the equation from one involving theactivation energy per molecule, εa , to one involving the activation energy per mole, Ea .We conclude that the probability that a molecule has an energy above εa , or Ea on a molarbasis, is proportional to exp(−εa/[kBT ]) or, equivalently, to exp(−Ea/[RT ]). We thensuppose that, once the reactants have come together, the probability of a reaction occurringis proportional to the probability that the reactants have enough energy. If this is the case,then the rate constant should contain a term proportional to the Boltzmann factor derivedabove, and we write
k = A exp(−εa/[kBT ]) = A exp(−Ea/[RT ]) (17.2)

P1: SFK Trim: 247mm × 174mm Top: 14.586mm Gutter: 23.198mm
CUUK1808-17 CUUK1808/Roussel 978 1 107 00678 2 October 29, 2011 15:7
336 Factors that affect the rate constant
0
0.1
0.2
0.3
0.4
0.5
0.6
0.7
0.8
0.9
1
0.01 0.1 1 10 100 1000
k/A
RT/Ea
Figure 17.4 General shape of the Arrhenius function. Since R is a constant and Ea is fixed for a givenelementary reaction, the quantity plotted as the abscissa is simply proportional to the temperature.Similarly, the ordinate is proportional to the rate constant since A is a constant for a given reaction.Note the logarithmic scale on the temperature axis.
This is the Arrhenius equation. The parameter A is rather boringly called the pre-exponential factor, and is taken to be constant at this level of theory.
The Arrhenius function has a straightforward shape, shown in Figure 17.4. At verylow temperatures, the rate constant decreases to zero because none of the molecules thenhave any excess energy. As the temperature rises, the rate constant increases, reaching alimiting value of A at very high temperatures. At ultra-high temperatures, all moleculeshave enough energy to get over the activation barrier such that this barrier no longer matters.Thus, A is the value the rate constant would have if the energy barrier between reactantsand products weren’t relevant. To put it another way, the pre-exponential factor containsall the factors other than simple energetics that determine the rate of reaction, such as therelative orientations of the two molecules in a bimolecular process. The crossover betweenlow- and high-temperature behavior occurs when RT is of a similar order of magnitudeto Ea .
We can recover the activation energy and A by studying the dependence of a rate constanton temperature. To do this, we transform the Arrhenius equation to a linear form. If we takea natural logarithm of both sides of the equation, we get
ln k = ln A − Ea
R
1
T(17.3)
Thus, a plot of ln k against 1/T should yield a straight line of slope −Ea/R and interceptln A.

P1: SFK Trim: 247mm × 174mm Top: 14.586mm Gutter: 23.198mm
CUUK1808-17 CUUK1808/Roussel 978 1 107 00678 2 October 29, 2011 15:7
17.2 The Arrhenius equation 337
−12
−10
−8
−6
−4
−2
0
0.0028 0.003 0.0032 0.0034 0.0036 0.0038
ln(k
/min
−1)
T −1/K−1
Figure 17.5 Arrhenius plot of the data from Example 17.1.
Example 17.1 Extraction of Arrhenius parameters The decomposition of dinitrogenpentoxide follows a simple first-order rate law at moderate pressures. The rate constant isfound to vary with temperature as follows:
T/◦C 0 25 45 65
k/min−1 4.7 × 10⁻⁵ 2.0 × 10⁻³ 3.0 × 10⁻² 3.0 × 10⁻¹
To obtain the Arrhenius parameters, we must evaluate ln k and 1/T . Note that T must bein kelvins before we take its reciprocal.
T −1/K−1 3.661 × 10⁻³ 3.354 × 10⁻³ 3.143 × 10⁻³ 2.957 × 10⁻³
ln(k/min−1) −9.965 −6.215 −3.507 −1.204
The Arrhenius plot is shown in Figure 17.5. The slope and intercept are, respectively,−1.25 × 10⁴ K and 35.68. The Arrhenius parameters are therefore
Ea = −R(−1.25 × 10⁴ K) = 104 kJ mol−1
A = exp(35.68) = 3.1 × 10¹⁵ min−1
Note that the activation energy and A will always be positive. Also note that the units of A
are the same as those of the original rate constant.
The experimental activation energy found by fitting data to the Arrhenius equation is notexactly equal to the difference in energy between the bottom of the reactant energy well andthe top of the energy barrier at which we find the transition state due to a couple of quantummechanical effects we encountered in Chapters 2 and 3. First, zero-point energy prevents amolecule from having no vibrational energy at all. Accordingly, a molecule’s total energy isalways somewhat higher than the lowest corresponding point on the energy profile; reactants

P1: SFK Trim: 247mm × 174mm Top: 14.586mm Gutter: 23.198mm
CUUK1808-17 CUUK1808/Roussel 978 1 107 00678 2 October 29, 2011 15:7
338 Factors that affect the rate constant
never quite sit at the bottoms of their valleys and transition states cannot be formed at exactlythe energy of the top of the activation barrier. The size of this effect is different at the topand bottom of the energy barrier, so the two zero-point energies do not offset each other.The net effect can either be an increase or a decrease in the activation energy by (at most)a few kJ mol−1, which might be significant in reactions with low barriers. Additionally,tunneling allows molecules to pass right through the barrier rather than going over it.This tends to lower the experimentally observed activation energy. Additionally, at verylow temperatures where tunneling may become similar in importance to over-the-barriertrajectories, tunneling may cause a deviation from linearity in Arrhenius plots.
Exercise group 17.1
(1) The following second-order rate constants were obtained for the reaction between2-tolyl isocyanate and 1-butanol:
T/◦C 0.0 7.0 15.0 25.0
k/L mol−1s−1 4.04 × 10⁻⁵ 7.72 × 10⁻⁵ 1.29 × 10⁻⁴ 2.50 × 10⁻⁴
Calculate the activation energy and pre-exponential factor for this reaction.(2) Aromatic compounds can be nitrated in strong acids according to the general reaction
scheme
A + HNO3 → ANO2 + H2O
The empirical rate law for these reactions is
v = k[A][HNO3]
The rate constant for the nitration of p-chloronitrobenzene in 83.70% sulfuric acid hasbeen measured at a few temperatures:1
T/◦C 40 60 75
k/L mol−1s−1 6.9 × 10⁻⁴ 3.6 × 10⁻³ 0.43
Determine the pre-exponential factor and activation energy for this reaction.(3) The reaction 2Fe(CN)3−
6(aq) + 2S2O2−3(aq) → 2Fe(CN)4−
6(aq) + S4O2−6(aq) displays first-order
kinetics. Measurements of the rate constant at different temperatures are given below:2
T/◦C 20 30 40 50 60 70
k/10−4min−1 1.52 2.13 3.28 5.29 9.31 14.06
(a) Calculate the activation energy and preexponential factor for this reaction.(b) Predict the value of the rate constant at 0 ◦C.
1 N.C. Marziano et al., J. Chem. Soc., Perkin Trans. 2, 1973 (1998). 2 Y. Li et al., J. Phys. Chem. B 104, 10956 (2000).

P1: SFK Trim: 247mm × 174mm Top: 14.586mm Gutter: 23.198mm
CUUK1808-17 CUUK1808/Roussel 978 1 107 00678 2 October 29, 2011 15:7
17.3 Transition-state theory 339
(4) In living cells, molecular motors transport other molecules from place to place by“walking” along microtubules. The speed at which these motors move along micro-tubules can be measured. For a molecular motor known as Eg5, the following data havebeen obtained:3
T/◦C 13 17 24 26 30
speed/μm s−1 0.21 0.26 0.31 0.33 0.39
(a) Many processes with an underlying chemical basis obey the Arrhenius equation.Is this true of the speed of this molecular motor?
(b) Regardless of your answer to question 4, determine an activation energy for thisprocess.
(c) Predict the temperature at which the speed would be 0.5 μm s−1. Report youranswer in degrees Celsius.
17.3 Transition-state theory
Transition-state theory, sometimes also called absolute-rate theory, takes a thermodynamicapproach to the description of the transition state. The starting point is a simple one:We imagine that there is a pseudo-equilibrium established between the reactants and thetransition state. In order words, we imagine that the elementary reaction
Rk−→ P (17.4)
is in fact made up of two steps, namely
RK‡
−⇀↽− TSk‡−→ P
This “mechanism” must not be taken too seriously. The transition state TS is not a stablespecies at all, so there is no sense in which it can be thought of as being in equilibriumwith anything. However, if the activation barrier is high so that the transition state is rarelyreached, this is a reasonable description of the effective dynamics.
If we do accept the above description for the formation of the transition state, we find,assuming ideal behavior,
[TS] = K‡[R] (17.5)
so that the rate of formation of the product due to this elementary reaction is
d[P]
dt= k‡[TS] = k‡K‡[R]
Since the rate of the elementary reaction (17.4) should be k[R], the elementary rate constantmust be
k = k‡K‡ (17.6)
3 I. M.-T. C. Crevel et al., J. Mol. Biol. 273, 160 (1997).

P1: SFK Trim: 247mm × 174mm Top: 14.586mm Gutter: 23.198mm
CUUK1808-17 CUUK1808/Roussel 978 1 107 00678 2 October 29, 2011 15:7
340 Factors that affect the rate constant
The pseudo-equilibrium constant K‡ can be related to the standard free energy changefor reaching the transition state from the reactants by the familiar formula
K‡ = exp(−�‡Gm/[RT ]) (17.7)
We also need a value for k‡. This is the “rate constant” for the disintegration of thetransition state to product. This process is closely related to a bond vibration as it involvesthe stretching of a bond that is about to break. Thus, k‡ can be thought of as a frequencyfor the stretching of a bond associated with the reaction coordinate. This frequency is givenby a statistical mechanical treatment, which we omit to avoid getting too far from our mainline of thought, as
k‡ = kBT
h(17.8)
If we now combine Equations (17.6), (17.7) and (17.8), we get
k = kBT
hexp(−�‡Gm/[RT ]) (17.9)
Conceptually, this is a very pivotal equation in transition-state theory. The only part of thisequation that depends on the reaction is �‡Gm. For two reactions of the same order, theparameter that controls whether one reaction is fast and the other slow at a given temperatureis just their values of �‡Gm. Arguably, rather than the energy profiles we considered in theprevious sections of this chapter, we should be focusing on free-energy profiles. We willreturn to this idea shortly.
The free energy of activation can be written in terms of an enthalpy and entropy ofactivation by
�‡Gm = �‡Hm − T �‡Sm (17.10)
Written in terms of the enthalpy and entropy, our expression for the rate constant thusbecomes
k = kBT
hexp(�‡Sm/R) exp(−�‡Hm/[RT ]) (17.11)
If we have measurements of k vs. T , we can get the activation parameters by a graphicalmethod. First, rearrange Equation 17.11 to the form
kh
kBT= exp(�‡Sm/R) exp(−�‡Hm/[RT ])
Then, take a logarithm of both sides:
ln
(kh
kBT
)= �‡Sm
R− �‡Hm
R
1
T(17.12)
If we plot ln[kh/(kBT )] vs. T −1, we should get a straight line with a slope of −�‡Hm/R,and an intercept of �‡Sm/R. We can therefore get the activation parameters from the slopeand intercept of this graph, which is called an Eyring plot.
Strictly speaking, Equation (17.12) only applies to first-order reactions. The reasonis that we wrote Equation (17.5) for a first-order reaction in a homogeneous phase (i.e.

P1: SFK Trim: 247mm × 174mm Top: 14.586mm Gutter: 23.198mm
CUUK1808-17 CUUK1808/Roussel 978 1 107 00678 2 October 29, 2011 15:7
17.3 Transition-state theory 341
−44
−43
−42
−41
−40
−39
−38
−37
−36
−35
−34
0.0029 0.003 0.0031 0.0032 0.0033 0.0034 0.0035 0.0036 0.0037
ln[k
h/(k
BT
)]
T −1/K−1
Figure 17.6 Eyring plot from Example 17.2.
with all reactants or products in the same phase). For other types of reactions, we wouldhave ended up with some extra factors involving the standard concentration or pressure.The derivation of the equation is exactly the same, except that we end up with thesefactors of the standard concentration or pressure that exactly cancel off the correspondingparts of the units of the rate constant. Since these factors are generally chosen to havenumeric values of 1, we can still use Equation (17.12) provided we use units for therate constant that are consistent with our thermodynamic standard state. Specifically, forreactions in solution the rate constants should be in units derived from the mol L−1 (e.g.L mol−1s−1 for a second-order reaction), while in the gas phase we should have rateconstants in units derived from the bar (e.g. bar−1s−1 for a second-order reaction). Alsonote that the units of time in the rate constant must be seconds in order to agree with theunits of h.
Example 17.2 Eyring plot We will generate an Eyring plot to obtain the activation param-eters for the reaction of Example (17.1). We need to convert the values of the rate constantto units of s−1 before we calculate ln[kh/(kBT )].
T −1/10−3K−1 3.661 3.354 3.143 2.957
k/s−1 7.8 × 10⁻⁷ 3.3 × 10⁻⁵ 5.0 × 10⁻⁴ 5.0 × 10⁻³
ln[kh/(kBT )] −43.43 −39.77 −37.12 −34.88
The Eyring plot is shown in Figure 17.6. The slope of the graph is −1.22 × 10⁴ K, fromwhich we calculate �‡Hm = −R(slope) = 101 kJ mol−1. The intercept is 1.11, leading toan entropy of activation of �‡Sm = R(intercept) = 9.25 J K−1mol−1.
The reaction we have analyzed here is not an elementary reaction. It is a gas-phaseunimolecular reaction, so it proceeds via the Lindemann mechanism. We will discuss theinterpretation of the activation parameters for complex reactions in Section 17.3.1.

P1: SFK Trim: 247mm × 174mm Top: 14.586mm Gutter: 23.198mm
CUUK1808-17 CUUK1808/Roussel 978 1 107 00678 2 October 29, 2011 15:7
342 Factors that affect the rate constant
If we have previously calculated the Arrhenius parameters, we can also calculate theenthalpy and entropy of activation from Ea and A. To determine the relationship between thetwo sets of parameters, we need to look at the temperature dependence of the rate constant,since that is how the Arrhenius parameters are determined. Let’s start with the logarithmicform of the Arrhenius equation (Equation 17.3). Taking a derivative with respect to T , weget
d
dTln k = Ea
RT 2(17.13)
assuming that A and Ea don’t depend on temperature. Similarly, we will assume that �‡S
varies only negligibly with temperature, as we often did in our study of thermodynamics.Equation 17.11 then gives
ln k = ln
(kBT
h
)+ �‡Sm
R− �‡Hm
RT
∴ d
dTln k = 1
T− 1
RT
d
dT�‡Hm + �‡Hm
RT 2
Applying Equation 5.15 (page 91) to the middle term of the last equation, we get �‡Hm =�‡Um + RT �‡νgas, where �‡νgas is the change in the number of molecules of gas requiredto reach the transition state per reactive event. This term is zero for reactions in solution,so that we will only need to consider this effect for reactions in the gas phase. Assumingthat �‡Um depends only weakly on T , we get
d
dTln k = 1
T− �‡νgas
T+ �‡Hm
RT 2
If we now compare this equation to Equation 17.13, which gives the dependence of ln k onT for the Arrhenius equation, we find
�‡Hm = Ea + RT (�‡νgas − 1) (17.14)
This equation tells us how to calculate the enthalpy of activation from the experimentalactivation energy. Conversely, it can be used to calculate activation energies from theoreticalcomputations of the enthalpy of activation.
Example 17.3 Enthalpy of activation in solution For the elementary reaction A(aq) +B(aq) → C(aq), the activation energy is 100 kJ mol−1. What is the enthalpy of activation at25 ◦C?
To solve this problem, we must first realize that since the reaction proceeds in solution,�‡νgas = 0. Thus
�‡H = 100 kJ mol−1 − (8.314 472 × 10−3 kJ K−1mol−1)(298.15 K) = 98 kJ mol−1
Example 17.4 Enthalpy of activation in the gas phase For the elementary reactionA(g) + B(g) → C(g), the activation energy is 100 kJ mol−1. What is the enthalpy of activationat 25 ◦C?

P1: SFK Trim: 247mm × 174mm Top: 14.586mm Gutter: 23.198mm
CUUK1808-17 CUUK1808/Roussel 978 1 107 00678 2 October 29, 2011 15:7
17.3 Transition-state theory 343
Since this is a gas-phase reaction, we need to consider the term in �‡νgas. Since thiselementary reaction combines two reactant molecules into one product molecule, the tran-sition state is itself almost certainly a single species that combines A and B. Accordingly,�‡νgas = −1 and
�‡H = 100 kJ mol−1 − 2(8.314 472 × 10−3 kJ K−1mol−1)(298.15 K) = 95 kJ mol−1
If we combine Equations (17.11) and (17.14), we obtain our final expression for thetransition-state theory rate constant:
k = kBT
hexp(�‡Sm/R) exp(1 − �‡νgas) exp(−Ea/[RT ]) (17.15)
If we compare this equation to the Arrhenius form, we find that
A = kBT
hexp(�‡Sm/R) exp(1 − �‡νgas) (17.16)
Transition-state theory therefore predicts that A is not exactly constant, but depends linearlyon T . To see this dependence, however, one needs to perform experiments over a very widerange of temperatures, since the exponential dependence of the rates on T through theactivation energy term is much stronger.
If one has measured A, one can then calculate �‡Sm:
�‡Sm = R
[ln
(hA
kBT
)− 1 + �‡νgas
](17.17)
This equation is correct as written only for a first-order elementary reaction. The issueis exactly the same as for the Eyring equation, and the solution is also exactly the same:for reactions in solution, the rate constant should be expressed in units derived from themol L−1, and for reactions in the gas phase, the rate constant should be in units derivedfrom the bar.
Example 17.5 Entropy of activation in solution For the elementary reaction A(aq) +B(aq) → C(aq), the preexponential factor A is 1.4 × 10⁵ L mol−1s−1. Calculate the entropyof activation at 25 ◦C.
Since this reaction occurs in solution, �‡νgas = 0. Therefore
�‡S = (8.314 472 J K−1mol−1)
×[
ln
((6.626 0688 × 10−34 J Hz−1)(1.4 × 10⁵ L mol−1s−1)
(1.380 6503 × 10−23 J K−1)(298.15 K)
)− 1
]= −155 J K−1mol−1
As described above, the units are troublesome in these calculations. The pre-exponentialfactor was expressed in units of L mol−1s−1, which:
(1) is in units compatible with mol L−1, and(2) uses the SI unit of time (s).

P1: SFK Trim: 247mm × 174mm Top: 14.586mm Gutter: 23.198mm
CUUK1808-17 CUUK1808/Roussel 978 1 107 00678 2 October 29, 2011 15:7
344 Factors that affect the rate constant
All the other quantities in the equation being in SI units, the result will come out in theappropriate SI unit for entropy, the J K−1mol−1, measured relative to the chemists’ standardstate.
Example 17.6 Entropy of activation in the gas phase For the elementary reaction A(g) +B(g) → C(g), the preexponential factor A is 1.4 × 10⁵ L mol−1s−1. Calculate the entropy ofactivation at 25 ◦C.
As in Example 17.4, �‡νgas = −1. Since this is a gas-phase reaction, the units of A
should be bar−1s−1, which implies a conversion from the value given to us. We can work outthe conversion factor using the ideal gas law: pV = nRT so that n/V = p/(RT ). Since1 bar is 100 000 Pa, 1 bar at 25 ◦C is equivalent to n/V = 40.3 mol m−3 = 0.0403 mol L−1.In other words, the conversion factor is 0.0403 mol L−1bar−1. The pre-exponential factorbecomes A = 5.6 × 10³ bar−1s−1.
We are now in a position to calculate the entropy of activation:
�‡S = (8.314 472 J K−1mol−1)
×[
ln
((6.626 0688 × 10−34 J Hz−1)(5.6 × 10³ bar−1s−1)
(1.380 6503 × 10−23 J K−1)(298.15 K)
)− 1 − 1
]= −190 J K−1mol−1
Recall (from Section 6.5) that entropy measures the number of microscopic statescompatible with a given macroscopic state. The entropy will therefore decrease, as in theabove two examples, when a system loses degrees of freedom. In the foregoing cases,where two reactant molecules form a single product, the transition state involves a bringingtogether of the reactants and thus should have fewer degrees of freedom than the reactants.In other cases, it is much less clear what the structure of the transition state should be.Calculating the entropy of activation tells us whether the transition state has fewer ormore microstates than the reactants. This in turn tells us something about the nature of thetransition state.
One useful rule of thumb you might want to remember is that forming a transitionstate complex from two reactants typically results in an entropy of activation of about−100 J K−1mol−1 (give or take 10 or 20 J K−1mol−1). If, for a bimolecular reaction, younotice that �‡S is much less negative than that, then you know that some other factor istending to offset some of the usual entropy decrease.
Example 17.7 For the elementary reaction
H(g) + Br2(g) → HBr(g) + Br(g)
the activation energy and preexponential factor are, respectively, 15.5 kJ mol−1 and 1.09 ×10¹¹ L mol−1s−1. Our objective is to calculate the enthalpy and entropy of activation at800 ◦C.
To calculate the enthalpy and entropy of activation, we need to guess �‡νgas. In thiscase, it seems quite likely that the transition state is a single complex, perhaps somethinglike H · · · ·Br · · · ·Br. Thus �‡νgas = −1. We can confirm that this is a sensible choice

P1: SFK Trim: 247mm × 174mm Top: 14.586mm Gutter: 23.198mm
CUUK1808-17 CUUK1808/Roussel 978 1 107 00678 2 October 29, 2011 15:7
17.3 Transition-state theory 345
by calculating the entropy of activation first: we start by converting the pre-exponentialfactor to bar−1s−1. At 800 ◦C (1073 K), the conversion factor from mol L−1 to bar is0.0112 mol L−1bar−1 so A = 1.22 × 10⁹ bar−1s−1. The rest of the calculation is straight-forward:
�‡S = (8.314 472 J K−1mol−1)
×[
ln
((6.626 × 10⁻³⁴ J Hz−1)(1.22 × 10⁹ bar−1s−1)
(1.381 × 10⁻²³ J/K)(1073 K)
)− 2
]= −98 J K−1mol−1
The negative entropy of activation confirms that the transition state is probably a singlemolecule. If we had instead guessed that this reaction had a very loose transition state inwhich there were still two distinct molecules (a case for which �‡νgas = 0), we would havecalculated �‡S = −79 J K−1mol−1, a significantly negative value which is not compatiblewith the assumption of a loose transition state.
We can now calculate the enthalpy of activation:
�‡H = Ea − 2RT = −2.3 kJ mol−1
We have two methods for getting the activation parameters: Eyring plots, and Equations(17.14) and (17.17). The two will give slightly different answers. Why? Equations (17.14)and (17.17) allow you to calculate the activation parameters at a particular temperature,while Eyring plots give you average values over the temperature range covered by a data set.Both conceptually and in practice, these are different quantities. Neither procedure is betternor more accurate than the other, they just give you slightly different results. Moreover,both the Arrhenius equation and the version of transition-state theory presented here areapproximate theories. It is therefore not reasonable to expect precise values from thesetheories. That does not make them any less useful; the entropy of activation, in particular,is one of the simpler pieces of data to obtain that provides some insight into the nature ofthe transition state.
Exercise group 17.2
(1) In the Diels–Alder reaction of ethene with 1,3-butadiene to form cyclohexene in thegas phase, the activation energy is 115 kJ mol−1. The following thermochemical datafor the reactants and products are available:
Species �f U ◦/kJ mol−1
C2H4(g) (ethene) 54.95C4H6(g) (1,3-butadiene) 115.4C6H10(g) (cyclohexene) 14.24
(a) Sketch the energy profile of the reaction. Clearly label �rU◦m as well as the activa-
tion energies for the forward and reverse reactions.
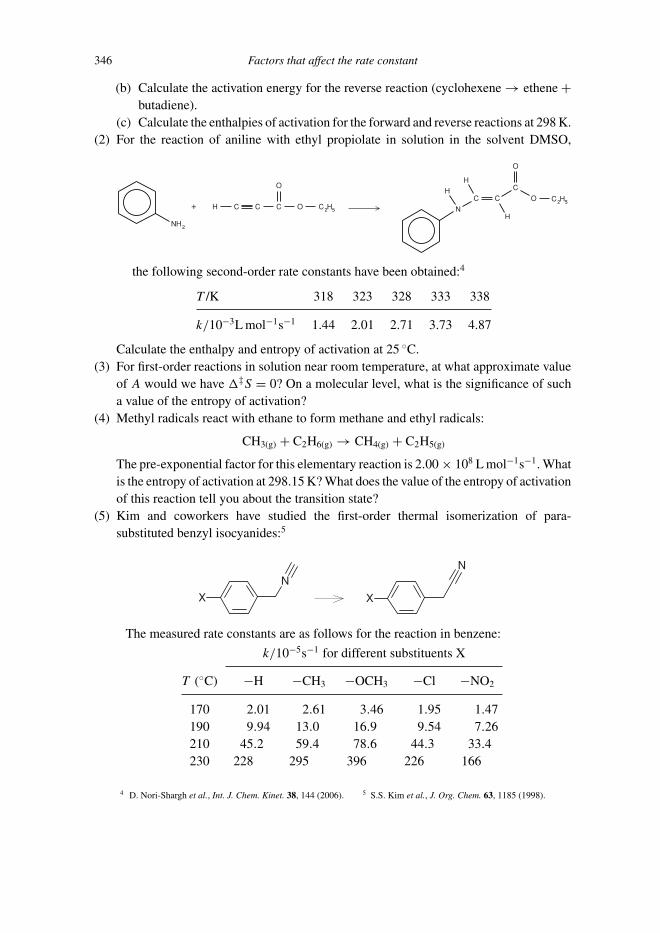
P1: SFK Trim: 247mm × 174mm Top: 14.586mm Gutter: 23.198mm
CUUK1808-17 CUUK1808/Roussel 978 1 107 00678 2 October 29, 2011 15:7
346 Factors that affect the rate constant
(b) Calculate the activation energy for the reverse reaction (cyclohexene → ethene +butadiene).
(c) Calculate the enthalpies of activation for the forward and reverse reactions at 298 K.(2) For the reaction of aniline with ethyl propiolate in solution in the solvent DMSO,
H
H+ H C C C
O
O
NH
C HNC
C
H
C
H
C
O
O
the following second-order rate constants have been obtained:4
T /K 318 323 328 333 338
k/10−3L mol−1s−1 1.44 2.01 2.71 3.73 4.87
Calculate the enthalpy and entropy of activation at 25 ◦C.(3) For first-order reactions in solution near room temperature, at what approximate value
of A would we have �‡S = 0? On a molecular level, what is the significance of sucha value of the entropy of activation?
(4) Methyl radicals react with ethane to form methane and ethyl radicals:
CH3(g) + C2H6(g) → CH4(g) + C2H5(g)
The pre-exponential factor for this elementary reaction is 2.00 × 10⁸ L mol−1s−1. Whatis the entropy of activation at 298.15 K? What does the value of the entropy of activationof this reaction tell you about the transition state?
(5) Kim and coworkers have studied the first-order thermal isomerization of para-substituted benzyl isocyanides:5
N
X
N
X
The measured rate constants are as follows for the reaction in benzene:
k/10−5s−1 for different substituents X
T (◦C) −H −CH3 −OCH3 −Cl −NO2
170 2.01 2.61 3.46 1.95 1.47190 9.94 13.0 16.9 9.54 7.26210 45.2 59.4 78.6 44.3 33.4230 228 295 396 226 166
4 D. Nori-Shargh et al., Int. J. Chem. Kinet. 38, 144 (2006). 5 S.S. Kim et al., J. Org. Chem. 63, 1185 (1998).

P1: SFK Trim: 247mm × 174mm Top: 14.586mm Gutter: 23.198mm
CUUK1808-17 CUUK1808/Roussel 978 1 107 00678 2 October 29, 2011 15:7
17.3 Transition-state theory 347
(a) Calculate the activation energy and pre-exponential factor for each of thereactions.
(b) The reaction is apparently elementary and proceeds via a triangular transitionstate, i.e. the cyanide group “rotates” during the reaction. Calculate the enthalpyand entropy of activation for each reaction at 200 ◦C. Comment on what the resultstell us about the effects of the substituents on the transition state.
(6) Fluorinated organic compounds are currently replacing chlorofluorocarbons as refriger-ants and anesthetics. Little is known of their atmospheric chemistry and, in particular,of their reactivity toward common stratospheric species such as hydroxide radicals.Consider the elementary reaction
OH(g) + CF3CH2OCHF2(g) → products
The products are unspecified because the reaction can produce a number of differentproducts depending on where the OH radical attacks, the energies of reactant andproduct, and so on. In other words, this reaction really stands for a whole family ofelementary reactions. However, for the purposes of the calculations performed in thisquestion, this can be treated as a simple elementary reaction. The following data havebeen obtained for this reaction:6
T /K 292 298 347 402
k/107L mol−1s−1 1.3 1.0 2.5 6.6
Calculate the enthalpy, entropy and free energy of activation at 25 ◦C. Discuss brieflywhat the value calculated tells you about the transition state of this reaction.
17.3.1 Complex reactions and transition-state theory
Azomethane (CH3N2CH3) decomposes to methyl radicals and nitrogen at elevated temper-atures in the gas phase by a first-order process. Suppose that you were given the followingdata, which relates the rate constant to temperature, and were asked to calculate the entropyof activation:
T /K 523 541 560 576 593
k/s−1 1.8 × 10⁻⁶ 1.5 × 10⁻⁵ 6.0 × 10⁻⁵ 1.6 × 10⁻⁴ 9.5 × 10⁻⁴
Using an Eyring plot, we find �‡Hm = 215 kJ mol−1 and �‡Sm = 53 J K−1mol−1.The overall reaction is
CH3N2CH3(g) → 2 CH3(g) + N2(g)
6 S.D. Beach et al., Phys. Chem. Chem. Phys. 3, 3064 (2001).

P1: SFK Trim: 247mm × 174mm Top: 14.586mm Gutter: 23.198mm
CUUK1808-17 CUUK1808/Roussel 978 1 107 00678 2 October 29, 2011 15:7
348 Factors that affect the rate constant
This is not, however, an elementary reaction. It is a gas-phase unimolecular reaction. Theseproceed (almost universally) by the Lindemann mechanism (Section 14.1):
2 CH3N2CH3(g)k1−⇀↽−k−1
CH3N2CH3(g) + {CH3N2CH3(g)}∗
{CH3N2CH3(g)}∗ k2−→ 2 CH3(g) + N2(g)
According to the theory we have seen so far, transition-state theory should only be appliedto elementary reactions. What happens if we have a complex reaction, as in this case?
We know from our previous study of the Lindemann mechanism that we get first-orderkinetics in this mechanism at high pressures. The rate law in this case is
v = k1k2
k−1[CH3N2CH3(g)]
The observed first-order rate constant is therefore
k = k1k2
k−1
If we recognize that K1 = k1/k−1 is the equilibrium constant of the first step, we get
k = K1k2 (17.18)
k2 is the elementary rate constant for step 2, so we can apply the transition-state theoryEquation (17.15) to this rate constant:
k2 = kBT
hexp(�‡S(2)/R) exp(1 − �‡ν(2)
gas) exp(−E(2)a /(RT )) (17.19)
where I have used a superscript (2) to indicate properties of reaction 2.K1 on the other hand is the equilibrium constant for step 1 of the reaction. We therefore
have
K1 = exp
(−�rG◦(1)
RT
)= exp
(−�rH◦(1)
RT+ �rS
◦(1)
R
)(17.20)
where the superscript (1) indicates properties of reaction 1.If we now substitute Equations (17.19) and (17.20) into Equation (17.18), we get
k = kBT
hexp(1 − �‡ν(2)
gas) exp
(�‡S(2) + �rS
◦(1)
R
)exp
(−E(2)
a + �rH◦(1)
RT
)
This looks like Equation (17.15), except that the entropy of activation and activation energyhave been replaced by
�‡S ← �‡S(2) + �rS◦(1) ≡ �‡S(app) (17.21)
and Ea ← E(2)a + �rH
◦(1) ≡ E(app)a (17.22)
The activation parameters calculated above therefore correspond to these apparent param-eters. Incidentally, you will note that I calculated these parameters using an Eyring plotrather than using Equations (17.14) and (17.17). While we can usually choose either of

P1: SFK Trim: 247mm × 174mm Top: 14.586mm Gutter: 23.198mm
CUUK1808-17 CUUK1808/Roussel 978 1 107 00678 2 October 29, 2011 15:7
17.3 Transition-state theory 349
(1)
2CH
}* 3
N2C
H3
x
S
TS(2)
Δ‡SΔrSo(1)
2CH
+ N
{CH
CH
3
3
3
2
(app)Δ‡S(2)
TS
N
Figure 17.7 Entropy diagram for the gas-phase decomposition of azomethane.
these methods, in the case of complex reactions, it is difficult to decide what one shoulduse for �‡νgas, so Eyring plots are to be preferred.
We still need to figure out what these apparent activation parameters mean. Let’s focusparticularly on the entropies. The story would be similar for the enthalpies. The two termsappearing in Equation (17.21) can be rewritten as differences in entropy:
�rS◦(1) = S◦ ({CH3N2CH3(g)}∗
)− S◦ (CH3N2CH3(g))
and �‡S(2) = S◦({TS(2)}) − S◦ ({CH3N2CH3(g)}∗)
The apparent entropy of activation is therefore
�‡S(app) = S◦({TS(2)}) − S◦ (CH3N2CH3(g))
This isn’t a completely crazy quantity to look at. It’s not the entropy of activation for anyparticular elementary reaction, but it is the entropy gained going from the reactant to thesecond transition state of the reaction.
Let’s put the entropies on a graph to see what this means. Have a look at Figure 17.7.The entropy (per molecule) of the first transition state is probably lower than that of a singleazomethane molecule because the first elementary reaction involves the coming together oftwo molecules. The entropy of the energized azomethane molecule should be higher thanthat of an ordinary molecule because increasing the energy of a molecule generally makesmore microstates available. The entropy of the second transition state should be higher stillsince it should involve a loosening of chemical bonds, leading to the eventual dissociation.The final, dissociated state (three separate molecules in the gas phase) should have thehighest entropy of all.
We can now see that the entropy of activation we calculate in this problem is the changein entropy in going from the reactant azomethane to the second transition state. This total“entropy of activation” involves a sum of the entropy change in reaction 1 (collisionalenergization of the reactant) and of the entropy of activation of reaction 2. Both are positivecontributions to the entropy change. Given that �‡S(app) = 53 J K−1mol−1, we see thatthe changes in going from the reactant to the second transition state, which represents a

P1: SFK Trim: 247mm × 174mm Top: 14.586mm Gutter: 23.198mm
CUUK1808-17 CUUK1808/Roussel 978 1 107 00678 2 October 29, 2011 15:7
350 Factors that affect the rate constant
version of the reactant that has first been energized, and then shifted the appropriate amountof energy into the reaction coordinate, involve an increase in the number of microstates,probably associated with a loosening of some of the bonds.
The last paragraph contains an implicit idea which we should bring out into the open: It’snot good enough for a molecule to have enough energy to react. If it were, then unimoleculargas-phase reactions would occur in one step; as soon as a molecule had enough energy toreact, it would go to product. In fact, this doesn’t happen because the energy has to end up inthe right part of the molecule. It’s no good for a bond that has nothing to do with the reactionto hold lots of vibrational energy. After the activating collision, the energy gained by themolecule redistributes itself randomly. It’s only if that energy finds its way into the reactioncoordinate before it is lost that the reaction can actually occur. The energy profiles we havebeen using as thinking tools in this chapter are thus one-dimensional simplifications of amuch more complicated situation.
17.3.2 Enzymes and transition-state theory
How exactly does an enzyme or, in general, any catalyst, speed up a reaction? The simplestanswer to this question can be obtained by looking at Equation (17.9): enzymes mustsomehow be decreasing the free energy of activation. Given Equation (17.10), enzymesmight be doing either or both of the following:
� Decreasing the enthalpy of activation� Increasing the entropy of activation
Enzymes use both of these tricks to accelerate reactions. That decreasing the enthalpy ofactivation is helpful is no great surprise: the enthalpy of activation and the activation energyare almost the same thing (Equation 17.14), so this is just saying that lowering the energyof the transition state speeds up the reaction. We could have come to a similar conclusionfrom Arrhenius theory, without all the embellishments of transition-state theory.
The idea that increasing the entropy of activation can speed up a reaction takes a littlemore thought. First, we have to remember that enzyme catalysis takes at least two steps:binding of the substrate(s), and reaction catalysis per se. If the reaction is limited by reactioncatalysis (which is often, but not always, the case), then we should focus our attention onkcat (k−2 in the Michaelis–Menten mechanism; Section 15.2). One of the key things thatan enzyme does is to hold the substrate(s) in its active site in the appropriate position forthe reaction to occur. This has the effect of reducing the number of microstates of thereactants (the substrates) relative to the number of microstates they would have if they werefree-floating in solution. Since this reduces the entropy of the reactants, all other thingsbeing equal, it will increase the entropy of activation, which is a difference between theentropy of the transition state and the entropy of the reactants.
Whether it’s through entropic or enthalpic effects, reducing the free energy of the tran-sition state means that we are stabilizing this state with respect to the reactants. This leadsus to one of the great insights that transition-state theory has to offer to enzyme kinetics;

P1: SFK Trim: 247mm × 174mm Top: 14.586mm Gutter: 23.198mm
CUUK1808-17 CUUK1808/Roussel 978 1 107 00678 2 October 29, 2011 15:7
17.4 Ionic strength 351
naıvely, we might think that enzymes should be good at binding their substrates, but infact, what enzymes are really good at is binding their transition states. From this insightflows another one: if you want to design a competitive inhibitor for an enzyme, you shouldlook for compounds that are similar in shape and charge distribution to the transition state,and not to the substrates. This idea is of huge practical importance since many drugs andpesticides are competitive inhibitors. For example, β-lactams, a group of antibiotics thatincludes penicillin, are competitive inhibitors of bacterial enzymes that are involved incell wall synthesis. Some chemotherapeutic agents are also competitive inhibitors, suchas methotrexate, which inhibits dihydrofolate reductase, an enzyme necessary for the pro-duction of nucleotides. Since cancer cells divide rapidly, inhibiting nucleotide production,which is necessary for DNA replication, tends to be more toxic for these cells than for non-dividing cells. Knowing that our inhibitors should be transition-state analogs has openedup whole new vistas in drug design.
17.4 Ionic strength
Our understanding of the effect of ionic strength on elementary rate processes derives fromtransition-state theory. It turns out that there is little effect of ionic strength in unimolecularelementary reactions, for reasons that will probably become clear from the derivation below.We therefore consider the bimolecular elementary process
A + Bk−→ P
As before, we assume that this reaction can be decomposed into accession to the transitionstate
A + BK‡
−⇀↽− TS
which is assumed to be in pseudo-equilibrium, and decomposition of the transition state toproduct
TSk‡−→ P
The rate of the reaction depends on the concentration of the transition state:
v = k‡[TS]
However, if the first part of this process can be described as an equilibrium, we should have
K‡ = aTS
aAaB= γTS[TS]c◦
γA[A]γB[B]= [TS]c◦
[A][B]
γTS
γAγB
∴ [TS] = K‡ [A][B]
c◦γAγB
γTS
The reaction rate is therefore
v = k‡K‡ [A][B]
c◦γAγB
γTS

P1: SFK Trim: 247mm × 174mm Top: 14.586mm Gutter: 23.198mm
CUUK1808-17 CUUK1808/Roussel 978 1 107 00678 2 October 29, 2011 15:7
352 Factors that affect the rate constant
If we compare this equation to the mass-action rate for our elementary step (v = k[A][B]),we find that
k = k‡K‡
c◦γAγB
γTS
If the ionic strength is zero, then γi = 1 for all species. The quantity k0 = k‡K‡/c◦ istherefore the limiting value of the rate constant at zero ionic strength. This relationshipshould be compared to the simple transition-state theory expression (17.6). The extra factorof 1/c◦ is related to the fact that in our development of transition-state theory we assumed afirst-order reaction, whereas in this case we assumed a second-order reaction. These issuesare closely connected to those raised in Section 17.3 with respect to the calculation oftransition-state entropies.
If we substitute k0 into our expression for k and take a logarithm of both sides of theequation, we get
ln k = ln k0 + ln γA + ln γB − ln γTS
We use Equation (9.6) to approximate the activity coefficients. After collecting terms, weget
ln k = ln k0 − 1.107 × 10⁻¹⁰ (εT )−3/2√
Ic
(Z2
A + Z2B − Z2
TS
)The transition state is formed by combining A and B. By conservation of charge, the chargeof the transition state is therefore ZTS = ZA + ZB. The term in parentheses is thus
Z2A + Z2
B − Z2TS = Z2
A + Z2B − (ZA + ZB)2 = −2ZAZB
Consequently, the rate constant is related to the ionic strength by
ln k = ln k0 + 2.214 × 10⁻¹⁰ZAZB (εT )−3/2√
Ic (17.23)
This equation, called the Brønsted–Bjerrum equation, tells us that if we plot ln k against√Ic (at fixed T ), we should get a straight line, at least if the ionic strength is not too high.
This relationship between Ic and k has been confirmed in a number of experimental studies.It highlights the importance of ionic strength as a variable to control, on an equal footingwith temperature and pH. We have to remember that Debye–Huckel theory, from whichEquation (17.23) is derived, only applies to ions in solution. The activity coefficients ofother solutes will also depend on the ionic strength, since the Coulomb force affects solventorganization and can also polarize other solutes. We just can’t predict how the ionic strengthwill affect rate constants from the Brønsted–Bjerrum equation for reactions that involve atleast one uncharged reactant. It is therefore critical to control the ionic strength in kineticstudies, regardless of the natures of the reactants and products.
Example 17.8 Use of the Brønsted–Bjerrum equation If the rate constant for an ele-mentary second-order reaction A2+ + B− → AB+ is 1.0 × 10⁻⁴ L mol−1s−1 in an aqueoussolution at 25 ◦C with an ionic strength of 0.003 mol L−1, what would the value of the rateconstant be if the ionic strength were increased to 0.01 mol L−1?

P1: SFK Trim: 247mm × 174mm Top: 14.586mm Gutter: 23.198mm
CUUK1808-17 CUUK1808/Roussel 978 1 107 00678 2 October 29, 2011 15:7
17.4 Ionic strength 353
The charges here are ZA = 2 and ZB = −1. We calculate the permittivity of water fromthe relative permittivity, and get ε = εrε0 = 6.939 × 10⁻¹⁰ C2N−1m−2. From the data atIc = 0.003 mol L−1, we can calculate
ln k0 = ln k − 2.214 × 10⁻¹⁰ZAZB
(εT )3/2
√Ic
= ln(1.0 × 10⁻⁴
)− 2.214 × 10⁻¹⁰(2)(−1)[(6.939 × 10⁻¹⁰
)(298.15)
]3/2
√0.003
= −8.953
Note that I don’t keep track of my units in these calculations because the constant in theBrønsted–Bjerrum equation, just like the constant in the Debye–Huckel limiting law, hasawkward units that cancel with the units of the other quantities in the equation. The rateconstant at Ic = 0.01 mol L−1 is therefore calculated by
ln k = ln k0 + 2.214 × 10⁻¹⁰ZAZB
(εT )3/2
√Ic
= −8.953 + 2.214 × 10⁻¹⁰(2)(−1)[(6.939 × 10⁻¹⁰
)(298.15)
]3/2
√0.01
= −9.423
∴ k = exp(−9.423) = 8.1 × 10⁻⁵ L mol−1s−1
The effect is certainly not negligible, amounting to approximately 20% of the value of therate constant in this example.
Example 17.9 Brønsted-Bjerrum plot The reaction
BrCH2COO−(aq) + S2O2−
3(aq) → S2O3CH2COO2−(aq) + Br−(aq)
was studied at 25 ◦C by mixing equimolar solutions of the sodium salts of the two reactants.If we define c = [BrCH2COONa(aq)] = [Na2S2O3(aq)], the following data were obtained:
c/mmol L−1 0.5 0.7 1.0 1.4 2.0
k/L mol−1min−1 0.298 0.309 0.324 0.343 0.366
Are these data consistent with the Brønsted–Bjerrum equation?A plot of ln k vs.
√Ic should give us a straight line. We need to calculate the ionic
strengths of these solutions. The ionic strength is defined by Equation (9.5). In this case,we get
Ic = 1
2
{(−1)2[BrCH2COO−
(aq)] + (−2)2[S2O2−3(aq)] + (1)2[Na+]
}We can simplify this expression a little for these experiments given that the salts werepresent in equimolar amounts: [BrCH2COO−
(aq)] = [S2O2−3(aq)] = c and [Na+] = 3c (two

P1: SFK Trim: 247mm × 174mm Top: 14.586mm Gutter: 23.198mm
CUUK1808-17 CUUK1808/Roussel 978 1 107 00678 2 October 29, 2011 15:7
354 Factors that affect the rate constant
−1.25
−1.20
−1.15
−1.10
−1.05
−1.00
−0.95
0.04 0.05 0.06 0.07 0.08 0.09 0.1
ln(k
/L m
ol−1
min
−1)
I1/2/mol1/2L−1/2
Figure 17.8 Dependence of the rate constant on the ionic strength for the data of example 17.9.
from the Na2S2O3 and one more from the BrCH2COONa). The ionic strength is thereforeIc = 4c. Our data become
Ic/mmol L−1 2.00 2.80 4.00 5.60 8.00√
Ic/mol1/2L−1/2 0.0447 0.0529 0.0632 0.0748 0.0894
k/L mol−1min−1 0.298 0.309 0.324 0.343 0.366
ln(k/L mol−1min−1) −1.2107 −1.1744 −1.1270 −1.0700 −1.0051
The resulting graph is shown in Figure 17.8. As predicted by Brønsted-Bjerrum theory,the plot is linear. The intercept, which extrapolates the data to zero ionic strength, isln k0 = −1.4186 so that k0 = 0.242 L mol−1min−1. The slope is 4.633. According to thetheory, it should be
slope =2.214 × 10⁻¹⁰ZCH2COONa−ZS2O2−
3
(εT )3/2
= 2.214 × 10⁻¹⁰(−2)(−1)[(6.939 × 10⁻¹⁰
)(298.15)
]3/2
= 4.706
The agreement between theory and data is excellent.
Exercise group 17.3
(1) Fluorescence quenching is a process in which a molecule transfers energy that wouldotherwise be released as fluorescence to another species in solution, called a quencher:
F∗ + QkQ−→ F + Q∗
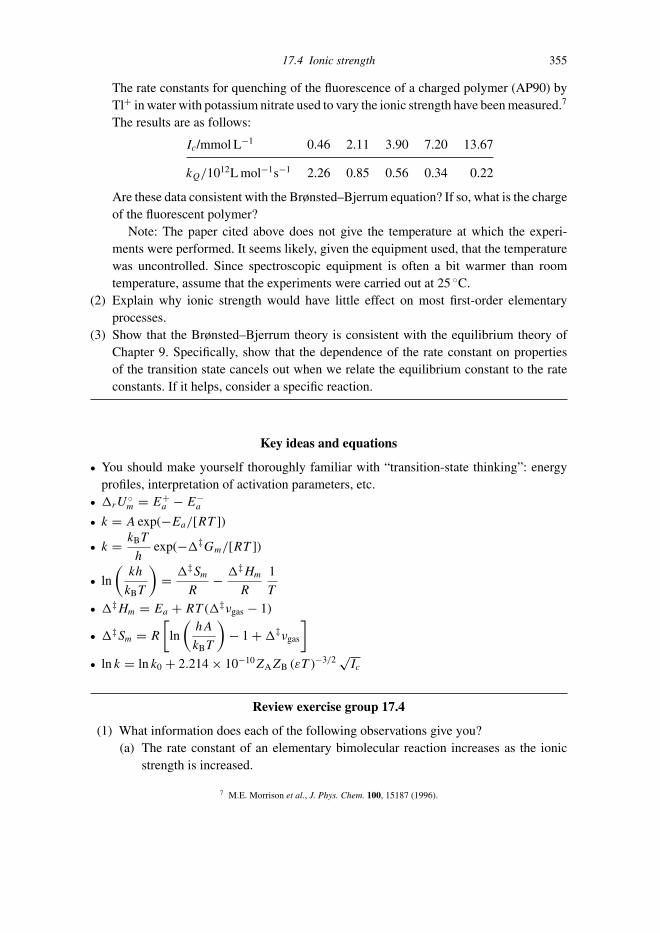
P1: SFK Trim: 247mm × 174mm Top: 14.586mm Gutter: 23.198mm
CUUK1808-17 CUUK1808/Roussel 978 1 107 00678 2 October 29, 2011 15:7
17.4 Ionic strength 355
The rate constants for quenching of the fluorescence of a charged polymer (AP90) byTl+ in water with potassium nitrate used to vary the ionic strength have been measured.7
The results are as follows:
Ic/mmol L−1 0.46 2.11 3.90 7.20 13.67
kQ/1012L mol−1s−1 2.26 0.85 0.56 0.34 0.22
Are these data consistent with the Brønsted–Bjerrum equation? If so, what is the chargeof the fluorescent polymer?
Note: The paper cited above does not give the temperature at which the experi-ments were performed. It seems likely, given the equipment used, that the temperaturewas uncontrolled. Since spectroscopic equipment is often a bit warmer than roomtemperature, assume that the experiments were carried out at 25 ◦C.
(2) Explain why ionic strength would have little effect on most first-order elementaryprocesses.
(3) Show that the Brønsted–Bjerrum theory is consistent with the equilibrium theory ofChapter 9. Specifically, show that the dependence of the rate constant on propertiesof the transition state cancels out when we relate the equilibrium constant to the rateconstants. If it helps, consider a specific reaction.
Key ideas and equations
� You should make yourself thoroughly familiar with “transition-state thinking”: energyprofiles, interpretation of activation parameters, etc.
� �rU◦m = E+
a − E−a
� k = A exp(−Ea/[RT ])
� k = kBT
hexp(−�‡Gm/[RT ])
� ln
(kh
kBT
)= �‡Sm
R− �‡Hm
R
1
T
� �‡Hm = Ea + RT (�‡νgas − 1)
� �‡Sm = R
[ln
(hA
kBT
)− 1 + �‡νgas
]� ln k = ln k0 + 2.214 × 10⁻¹⁰ZAZB (εT )−3/2 √
Ic
Review exercise group 17.4
(1) What information does each of the following observations give you?(a) The rate constant of an elementary bimolecular reaction increases as the ionic
strength is increased.
7 M.E. Morrison et al., J. Phys. Chem. 100, 15187 (1996).

P1: SFK Trim: 247mm × 174mm Top: 14.586mm Gutter: 23.198mm
CUUK1808-17 CUUK1808/Roussel 978 1 107 00678 2 October 29, 2011 15:7
356 Factors that affect the rate constant
(b) The equilibrium constant of a reaction increases as the temperature isincreased.
(2) The enthalpies of formation of ethane (C2H6) and of methyl radicals (CH3) are,respectively, −83.85 and 145.69 kJ mol−1 at 298.15 K. Calculate the activation energyfor the dissociation of ethane into methyl radicals.Hint: Sketch the expected energy profile for this reaction.
(3) (a) A textbook gives the following initial rate data for the reaction OCl−(aq) + I−(aq) →OI−(aq) + Cl−(aq):
Experiment[OCl−]
mol L−1
[I−]
mol L−1
[OH−]
mol L−1
v
10−4mol L−1s−1
1 0.0040 0.0020 1.00 4.82 0.0020 0.0040 1.00 5.03 0.0020 0.0020 1.00 2.44 0.0020 0.0020 0.50 4.65 0.0020 0.0020 0.25 9.4
Determine the rate law and the value of the rate constant.(b) There’s something suspicious about these data. What is it?
(4) In aqueous solution at high temperature and high acid concentrations, formic acidbreaks down by decarbonylation:
HCOOH(aq) → CO(g) + H2O(l)
(a) The rate of this reaction is known to depend on both the formic acid and hydrogenion concentrations. The following initial rate data have been obtained by Yasakaand coworkers at 200 ◦C:8
Experiment [HCOOH]/mol kg−1 [H+]/mol kg−1 v/10−5mol kg−1 s−1
1 1.0 0.062 1.12 1.0 0.062 1.33 1.0 0.26 5.44 0.16 0.10 0.285 0.66 0.10 1.26 1.6 0.10 2.7
Determine the rate law and rate constant for this reaction.Note: Pick the whole-number partial orders that best describe these data for yourfinal answer. Because there is considerable experimental scatter in the measure-ments, you must use all the data to calculate the rate constant.
8 Y. Yasaka et al., J. Phys. Chem. A 110, 11082 (2006). The data given here are a subset of the data obtained by these authors.

P1: SFK Trim: 247mm × 174mm Top: 14.586mm Gutter: 23.198mm
CUUK1808-17 CUUK1808/Roussel 978 1 107 00678 2 October 29, 2011 15:7
17.4 Ionic strength 357
(b) The rate constant was measured at different temperatures. The following datawere obtained:
T/◦C 170 210 240 280
k/kg mol−1s−1 1.5 × 10⁻⁵ 5.1 × 10⁻⁴ 3.7 × 10⁻³ 6.3 × 10⁻²
Calculate the Arrhenius parameters for this reaction.(5) Some chemical processes appear to have negative activation energies. This is of
course not possible for an elementary reaction and so must be indicative of a complexreaction. Consider the following two-step mechanism for the conversion of a reactantR to a product P:
Rk1−⇀↽−k−1
Xk2−→ P
(a) Show that, if the second step is slow, this reaction displays simple first-orderkinetics.
(b) Determine the conditions under which the apparent first-order rateconstant would display a negative activation energy.
(6) The reaction A2+(aq) + B(aq) → C2+
(aq) has a rate constant of 2.9 × 10³ L mol−1s−1 at a
temperature of 295 K and an ionic strength of 1.6 × 10⁻⁴ mol L−1. The permittivity ofwater at this temperature is 7 × 10⁻¹⁰ C2J−1m−1. What rate constant does Brønsted–Bjerrum theory predict at an ionic strength of 2.6 × 10⁻³ mol L−1? Is this reasonable?Discuss briefly.
(7) The decomposition of the ethoxy radical (CH3CH2O) has been studied in the gas phaseat very low ethoxy radical pressures in the presence of helium.9 The mechanism is avariation on the Lindemann mechanism:
CH3CH2O(g) + He(g)k1−⇀↽−k−1
He(g) + CH3CH2O∗(g)
CH3CH2O∗(g)
k2−→ CH2O(g) + CH3(g)
where CH3CH2O∗ is an energized radical.(a) Obtain an approximate rate law giving the dependence of the rate on the concen-
trations of reactants.(b) Show that at low pressures of helium, this rate law reduces to v =
k1[He][CH3CH2O] = k′1[CH3CH2O], where k′
1 is a pseudo-first-order rate con-stant.
(c) Measurements of the pseudo-first-order rate constant for the reaction at (known)low helium pressures therefore allow us to recover k1. It was found that k1 varieswith temperature according to the Arrhenius law with a pre-exponential factor of2.0 × 1013 L mol−1s−1. Calculate the entropy of activation for the correspondingelementary reaction at 170 ◦C, a typical temperature at which this reaction isstudied.
9 F. Caralp et al., Phys. Chem. Chem. Phys. 1, 2935 (1999).

P1: SFK Trim: 247mm × 174mm Top: 14.586mm Gutter: 23.198mm
CUUK1808-17 CUUK1808/Roussel 978 1 107 00678 2 October 29, 2011 15:7
358 Factors that affect the rate constant
(8) Reactions of the hydroperoxy radical (HO2) with hydrocarbons are important in com-bustion processes. The rate constant has been measured as a function of temperaturefor the elementary reaction
HO2(g) + c-C5H10(g) → H2O2(g) + c-C5H9(g)
(c-C5H10(g) is cyclopentane.) The following data were obtained:10
T /K 673 713 753 783
k/104L mol−1s−1 2.95 5.55 12.3 18.4
(a) Calculate the pre-exponential factor and activation energy.(b) Calculate the entropy of activation at 298 K. What does the value of the entropy
of activation tell us about the transition state?(9) The inorganic complex CoRu(CO)5(μ-bma)(μ-PPh2) loses a carbonyl group to form
CoRu(CO)4(μ-bma)(μ-PPh2) in solution at moderate temperatures. [bma is 2,3-bis-(diphenylphosphino)maleic anhydride.](a) The following first-order rate constants have been measured for this process:11
T/◦C 77.2 83.0 88.0 93.2 98.1
k/10−4s−1 2.37 7.3 10.1 20.4 30.3
Calculate the activation energy and preexponential factor.(b) In reactions in which a ligand is lost, there are two possibilities:
(i) The ligand is lost “early”, i.e. reaching the transition state mostly involvesthe loosening of the metal-ligand bond.
(ii) The ligand is lost “late”, i.e. reaching the transition state involves an internalrearrangement but no significant weakening of the metal-ligand bond.
Calculate the entropy of activation at 80 ◦C and comment on whether you thinkthe carbonyl group leaves early or late in this reaction.
(10) Arrhenius theory assumes that the pre-exponential factor and activation energy areboth independent of temperature. However, more advanced theoretical approaches tokinetics typically predict that these quantities are temperature dependent. Calculatethe rate constant for a first-order solution-phase reaction with �‡S◦ = 80 J K−1mol−1
and �‡H ◦ = 100 kJ mol−1 at 300, 350, 400, 450 and 500 K. Produce an Arrheniusplot using your rate constants. Is this graph straight? What activation energy andpre-exponential factor do you get from your graph? How do these values compareto those you would calculate directly from �‡S◦ and �‡H ◦ at, say, 300 K? Whatdo you conclude about the temperature dependence of the pre-exponential factor andactivation energy predicted by transition-state theory?
10 S. M. Handford-Styring and R. W. Walker, Phys. Chem. Chem. Phys. 4, 620 (2002).11 S. G. Bott et al., Inorg. Chem. 39, 6051 (2000).

P1: SFK Trim: 247mm × 174mm Top: 14.586mm Gutter: 23.198mm
CUUK1808-18 CUUK1808/Roussel 978 1 107 00678 2 October 29, 2011 13:28
18
Diffusion and reactions in solution
A bimolecular elementary reaction requires that the two reactants meet. In solution,molecules are constantly bumping into other molecules, with the net effect that they wan-der randomly through the solution, which we call diffusion. In this chapter, we will studydiffusion and its effect on chemical reactions, specifically focusing on the rate at whichmolecules meet each other. This will give us an upper bound on the reaction rate, which isuseful for a number of purposes.
18.1 Diffusion
A molecule in solution is constantly surrounded by other molecules. All the moleculesare constantly bumping into their neighbors. They move around the solution by slidingbetween their neighbors, much as you might slide between people to make your way arounda crowded room. This process is a form of diffusion, the random motion of molecules inspace.
The central quantity in describing diffusion is the flux, which is the rate at whichmolecules cross an imaginary surface in space per unit area of this surface. The fluxtherefore has units of number per unit time per unit area (e.g. mol s−1m−2). We’re goingto focus on diffusion in one dimension, where it’s a little easier to picture what is goingon. Imagine that we have a tube of cross-sectional area A. The tube is narrow enough thatwe can treat the concentration across the tube as being constant. We imagine countingthe net number of molecules that pass a certain cross-section of the tube – this is theimaginary surface mentioned above – from left to right. Some molecules will go from leftto right, and some from right to left. We subtract the number of molecules that cross ourimaginary surface in the leftward direction from those traveling in the rightward direction.This net rightward traffic, divided by the duration of our counting experiment and bythe cross-sectional area of the tube, is the flux. If there are more molecules travelingfrom left to right than in the reverse direction, then the flux is positive, otherwise it’snegative.
In general, the flux is a vector, usually denoted J. (You can think of a little cube, andcount the molecules that go out of each of the faces.) We can denote the components of Jby Jx , Jy and Jz or, if there’s only one component of significance in a given problem, as
359

P1: SFK Trim: 247mm × 174mm Top: 14.586mm Gutter: 23.198mm
CUUK1808-18 CUUK1808/Roussel 978 1 107 00678 2 October 29, 2011 13:28
360 Diffusion and reactions in solution
A
x
J ( x ) J ( x + dx )
x + dx
Figure 18.1 Fluxes entering and leaving a small volume of cross-sectional area A and length dx.
in our narrow tube, we can simply write J . For this one-dimensional case, we will assumethat the tube lies along the x axis.
We can connect the flux to the concentration profile through Fick’s first law, which isvalid in its simplest form if we can neglect solute–solute interactions. Since the moleculesare moving randomly through the solution, the probability that molecules will move froma region of higher concentration to a region of lower concentration is larger than theprobability of the reverse process, simply because there are more molecules in the high-concentration region that could, randomly, find themselves wandering over to the region oflow concentration. This suggests that the sign of the flux should be opposite to the sign of theconcentration gradient: if the concentration decreases from left to right (negative gradient),then the flux should point in that direction, and vice versa. Fick’s first law assumes thatthese two quantities are in fact directly proportional:
J = −D∂c
∂x(18.1)
Fick’s first law has been found to be an excellent approximation to the relationship betweenthe flux and the concentration gradient in a wide variety of systems. The proportionalityconstant D is the diffusion coefficient. You can think of it as a rate constant for diffusion:large values of D correspond to fast diffusion. The diffusion coefficient depends both onwhat is diffusing and on the medium in which it is diffusing, as we will see. If you workout the units for the diffusion coefficient, you should find that it has units of area per unittime (e.g. m2 s−1).
Suppose that we now want to know how the concentration changes at a given point inspace as a result of diffusion. Look at Figure 18.1. We consider a small volume of lengthdx and cross-sectional area A. We allow for the possibility that the flux might be differentat different points in space, and write J (x) for the flux at position x. From the definitionof the flux, the number of moles of the diffusible substance entering our volume at x perunit time is AJ (x). The number of moles leaving through the imaginary surface at x + dx
per unit time is AJ (x + dx). The net rate of change of the number of moles in this smallvolume is therefore AJ (x) − AJ (x + dx). Since concentration is number over volume, the

P1: SFK Trim: 247mm × 174mm Top: 14.586mm Gutter: 23.198mm
CUUK1808-18 CUUK1808/Roussel 978 1 107 00678 2 October 29, 2011 13:28
18.1 Diffusion 361
c
x
Figure 18.2 In diffusion, the flux vector (heavy arrows) points in the opposite direction to theconcentration gradient, i.e. “downhill.” The magnitude of the flux is proportional to the gradient, so itis larger where the gradient is steeper, symbolized here by the lengths of the flux vectors. This resultsin a lowering of high points (where ∂2c/∂x2 < 0) in the concentration profile and in a raising of lowpoints (∂2c/∂x2 > 0), as indicated by the light arrows.
net rate of change of the concentration in this volume is therefore
∂c
∂t= AJ (x) − AJ (x + dx)
A dx= −J (x + dx) − J (x)
dx
However, by the definition of the derivative, if dx is small, the fraction on the right-handside is just the derivative of J with respect to x:
∂c
∂t= −∂J
∂x(18.2)
This last equation is very general: it tells us how the concentration of a substance changesdue to any transport process with flux J .
We can now combine Equations (18.1) and (18.2). The result is Fick’s second law, alsoknown as the diffusion equation:
∂c
∂t= −∂
∂x
(−D
∂c
∂x
)
∴ ∂c
∂t= D
∂2c
∂x2(18.3)
Fick’s second law says that the rate of change of the concentration of a substance ata particular point in space is proportional to the second derivative of the concentrationwith respect to x. The second derivative is positive for concave concentration profiles, sodiffusion “fills in” points where the concentration is low. Conversely, the second derivativeis positive for convex concentration profiles, so diffusion “flattens” high points in theconcentration profile. Figure 18.2 illustrates these observations. The overall tendency is fordiffusion to homogenize a system.

P1: SFK Trim: 247mm × 174mm Top: 14.586mm Gutter: 23.198mm
CUUK1808-18 CUUK1808/Roussel 978 1 107 00678 2 October 29, 2011 13:28
362 Diffusion and reactions in solution
18.2 A peculiar theory for diffusion coefficients in solution
We noted above that the diffusion coefficient depends on what is diffusing and on themedium. We now want to relate the diffusion coefficient to molecular properties. Theapproach we will take will blend macroscopic theory with a microscopic picture in a mostpeculiar way, yielding a surprisingly useful theory for diffusion coefficients.
Note again that diffusion causes molecules to move from regions of high concentrationto regions of lower concentration. Let’s imagine that we can follow one molecule in solutionthrough a small part of its journey. We start by calculating the change in free energy whena single molecule moves from a region of concentration c to one of concentration c + dc.This can be calculated from the general relationship between free energy and concentration,Equation (7.7), once we realize that �G◦ = 0 since no chemical reaction is occurring, andassuming that the solute behaves ideally:
dG = kBT ln
(c + dc
c
)
(Compare Equation (10.3) which gives the voltage developed due to a concentration dif-ference. Also note the use of kB instead of R since we are interested in a single molecule.)Since free energy is the negative of the maximum work that can be done by the system, wehave
dw = −kBT ln
(c + dc
c
)= −kBT ln
(1 + dc
c
)
Here, dw is the work that we could extract from a molecule moving down the concentrationgradient. Using a Taylor series, we can show that ln(1 + x) ≈ x for small values of x. If youdon’t know about Taylor series, consider that ln(1 + 0) = 0, and that the slope of ln(1 + x)is (1 + x)−1, which tends to 1 as x → 0, so y = ln(1 + x) passes through the origin with aslope of 1, i.e. it behaves like f (x) = x for small values of x. Applying this approximationto the work, we have
dw ≈ −kBTdc
c
Moreover, dw = F dx, so we can think of this work as being the result of a virtual force
Fv ≈ −kBT
c
∂c
∂x
This virtual force is usually known as the driving force for diffusion. A molecule subjectedto a constant force just keeps accelerating. There has to be an opposing force to limit theincrease in speed. As the molecule pushes through the solvent, it experiences a frictionalforce. For objects of normal size at low speeds, the frictional force is roughly proportionalto the speed v:
Ff = −f v

P1: SFK Trim: 247mm × 174mm Top: 14.586mm Gutter: 23.198mm
CUUK1808-18 CUUK1808/Roussel 978 1 107 00678 2 October 29, 2011 13:28
18.2 A peculiar theory for diffusion coefficients in solution 363
where f is a shape- and medium-dependent constant known as the frictional coefficient.A steady diffusive speed is reached when the driving and frictional forces are equal andopposite, i.e. Ff = −Fv , which gives
f v = −kBT
c
∂c
∂x
which in turn can be rearranged to
cv = −kBT
f
∂c
∂x
Now imagine a small surface of area A transverse to the velocity vector. How manymoles of material pass through this surface per unit time? Each time unit, the diffusiblesubstance moves v distance units. The volume of material that passes through our surfaceper unit time is therefore vA. The corresponding number of moles is therefore cvA. Theflux is the number of moles per unit time per unit area, so J = cvA/A = cv. Therefore
J = −kBT
f
∂c
∂x
Comparing this equation to Fick’s first law, Equation (18.1), we get
D = kBT
f(18.4)
If we look back at the derivation of this equation, we see some real peculiarities: westarted with an equation that comes from thermodynamics, which is a theory that appliesto large numbers of molecules, and applied it to a single molecule. We obtained from thatan expression for a force that drives diffusion, although individual molecules experienceno such force: they just bounce around between solvent molecules. We then brought inthe idea of friction, which is appropriate to large objects, but not obviously applicableto molecules. The equation we obtained for the diffusion coefficient (18.4), reflects theseoddities: it depends on the temperature, a thermodynamic property of a system which isonly meaningful for molecules in an average sense, and on a frictional coefficient whichhas no obvious molecular interpretation.
If that was all there was to this theory, then it wouldn’t be very useful. However, if westick with the idea that a molecule experiences ordinary friction as it moves through thefluid, we can use expressions obtained in fluid mechanics for the frictional coefficients.The simplest case is that of a spherical solute. For a sphere moving through a fluid, Stokesshowed that
f = 6πrη
where r is the radius of the sphere (solute) and η is the viscosity of the solvent. Viscositymeasures the resistance of a fluid to shear forces, i.e. to sliding of layers of fluid relative to

P1: SFK Trim: 247mm × 174mm Top: 14.586mm Gutter: 23.198mm
CUUK1808-18 CUUK1808/Roussel 978 1 107 00678 2 October 29, 2011 13:28
364 Diffusion and reactions in solution
each other. Combining Stokes’s law with Equation (18.4), we get
D = kBT
6πrη(18.5)
an equation known as the Stokes–Einstein relationship. If anything, Equation (18.5) iseven more peculiar than (18.4) since it involves the viscosity, a property with no obviousrelevance at the molecular level.
Equation (18.5) can be used in one of two ways: the viscosity of a solvent is availablefrom independent experiments. Thus, if we know roughly how large a molecule is, wecan use Equation (18.5) to estimate the diffusion coefficient. Conversely, if we know thediffusion coefficient, we can estimate the size of the molecule.
Despite its peculiarities, Stokes–Einstein theory works remarkably well for solutes witha wide range of sizes in a variety of solvents. There are equations for the frictional coefficientfor shapes other than a sphere so we are not limited to molecules that are approximatelyspherical in shape. In fact, the shape dependence of f can be used to determine the solutionconformations of biological macromolecules. In the interest of brevity, we will leave thisvery interesting topic aside.
Example 18.1 Radius of ribonuclease The diffusion coefficient of the enzyme ribonucle-ase in water at 20 ◦C is 1.31 × 10⁻¹⁰ m2 s−1. The viscosity of water at this temperature is1.00 mPa s. We can use these data to estimate the radius of a ribonuclease molecule:
r = kBT
6πηD
= (1.380 6503 × 10−23 J K−1)(293.15 K)
6π (1.00 × 10⁻³ Pa s)(1.31 × 10⁻¹⁰ m2 s−1)= 1.64 nm
Exercise group 18.1
(1) Buckminsterfullerene (C60) has a diameter of 10.18 A. Benzonitrile has a viscosityof 1.24 mPa s at 25 ◦C. Estimate the diffusion coefficient of C60 in benzonitrile, andcompare your value to the experimental value1 of (4.1 ± 0.3) × 10−10 m2 s−1.
18.3 Bimolecular reactions in solution
We now turn to bimolecular reactions in solution. As we have been discussing, in solution,molecules do not fly around freely because they are in constant contact with the solvent.Rather, we should think of their motion as one in which they slip between solvent moleculesfrom time to time. Since this requires a bit of luck – a molecule has to just happen to hit a
1 Y. Hishida et al., Anal. Sci. 22, 931 (2006).

P1: SFK Trim: 247mm × 174mm Top: 14.586mm Gutter: 23.198mm
CUUK1808-18 CUUK1808/Roussel 978 1 107 00678 2 October 29, 2011 13:28
18.3 Bimolecular reactions in solution 365
gap between two solvent molecules to move – once two reactant molecules come in contact,they will tend to stay together for a while. This effect is known as solvent caging.
To understand the relative importance of diffusion and reaction, it is useful to decomposethe reaction as follows. First, the two reactants (A and B) have to come close enough to eachother that reaction is possible. Reactants that have come to this distance of each other aresaid to have formed an encounter pair, denoted {AB}. The reactants can then either moveaway from each other again, or they can react. We can think of this as a pseudo-mechanism(in the same way as we did in transition-state theory):
A + Bkd−⇀↽−k−d
{AB} kr−→ P
The rate of reaction is kr [{AB}]. Since {AB} is a short-lived configuration, we can applythe steady-state approximation:
d[{AB}]dt
= kd [A][B] − (k−d + kr )[{AB}] ≈ 0
∴ [{AB}] ≈ kd [A][B]
k−d + kr
∴ rate ≈ kdkr [A][B]
k−d + kr
Since we are really talking about an elementary reaction, the rate should be k[A][B]. Inother words, the rate constant has the value
k = kdkr
k−d + kr
(18.6)
If the actual reaction is slow, then kr is small and the rate constant becomes k = krKd
where Kd = kd/k−d is the “equilibrium constant” for the creation of an encounter pair.In this case, we say that the reaction is activation controlled. If, on the other hand, thereaction occurs very easily once the encounter pair has been formed (kr is large), the rateconstant becomes k = kd and the reaction is said to be diffusion controlled. Between thesetwo extremes, we have diffusion-influenced reactions, those for which both reaction anddiffusion processes are important.
Diffusion-influenced and activation-controlled reactions can only be treated using quan-tum mechanics, since kr depends very much on the detailed interaction between the twomolecules. On the other hand, we are able to solve the diffusion equation, at least in somesimple cases, including one that is directly useful here. Consequently, we are able to calcu-late rates for diffusion-controlled reactions. In the following, we will again mix ideas frommacroscopic and microscopic theory, so watch for that.
For a diffusion-limited reaction, molecules of A and B will react whenever their centerspass within a distance RAB of each other, where RAB = RA + RB for non-interactingspherical molecules. RAB is the reactive distance for molecules A and B. If the moleculesare non-spherical or are subject to strong intermolecular forces, then there will still be a

P1: SFK Trim: 247mm × 174mm Top: 14.586mm Gutter: 23.198mm
CUUK1808-18 CUUK1808/Roussel 978 1 107 00678 2 October 29, 2011 13:28
366 Diffusion and reactions in solution
typical distance to which they will need to approach each other to react, but it may bedifferent from the sum of the molecular radii.
We will only sketch the mathematical development from this point. Let r be the distancefrom a particular molecule of A. Molecules of B should satisfy the three-dimensionalanalog of the diffusion equation (Equation 18.3). We use a coordinate system centered onthe molecule of A we are considering. We can then replace the diffusion coefficient ofB in the diffusion equation by the relative diffusion coefficient DAB = DA + DB, whichimmediately takes care of the fact that the A molecules are in motion, too.
If molecules of A and B react whenever they pass within RAB of each other, then therewon’t be any molecules of B within this radius of A. Accordingly, [B]r=RAB
= 0, where[B]r denotes the concentration of B at distance r from a molecule of A. On the other hand,far from an A molecule, [B]r → [B], the bulk concentration. It is possible to solve thediffusion equation subject to this pair of conditions. We will only state the result here, sincethe derivation isn’t very enlightening.
[B]r = [B]
[1 − RAB
r+ RAB
rerf
(r − RAB
2√
DABt
)]
where erf(x) is the error function defined by
erf(x) = 2√π
∫ x
0exp(−z2)dz (18.7)
If you have never seen the error function before, don’t worry. Computer programs (spread-sheets, for instance) often know how to calculate it. Think of it the same way you think ofa sine function; you probably don’t know how to calculate sin x by hand, but you reallydon’t have to since your calculator can work it out for you.
The flux towards the molecule of A on which we are concentrating is given by Fick’sfirst law. Here, we calculate |J |, i.e. we drop the negative sign in Fick’s first law, in orderto avoid getting tangled up with our signs later on. We know in this case that the flux isdirected toward A, i.e. that J < 0, so it’s easier conceptually to just keep this in mind andnot carry the sign around.
|J | = DAB∂[B]
∂r
= DAB[B]
[RAB
r2− RAB
r2erf
(r − RAB
2√
DABt
)+ RAB
r√
πDABtexp
(r − RAB
2√
DABt
)](18.8)
This last expression was obtained using the fundamental theorem of calculus and the chainrule.
Recall that the flux is the number of molecules crossing through a surface per unit areaper unit time. The surface area of a sphere of radius RAB is 4πR2
AB, so the net rate of arrivalof B molecules at the reactive distance is 4πR2
AB|J |r=RAB . This is the rate of reaction permolecule of A. For a diffusion-limited reaction, the first molecule that arrives at this surfacereacts. Moreover, the number of molecules of A per unit volume is [A]LV , where V is thevolume and L is Avogadro’s number. The overall rate of change of the number of molecules
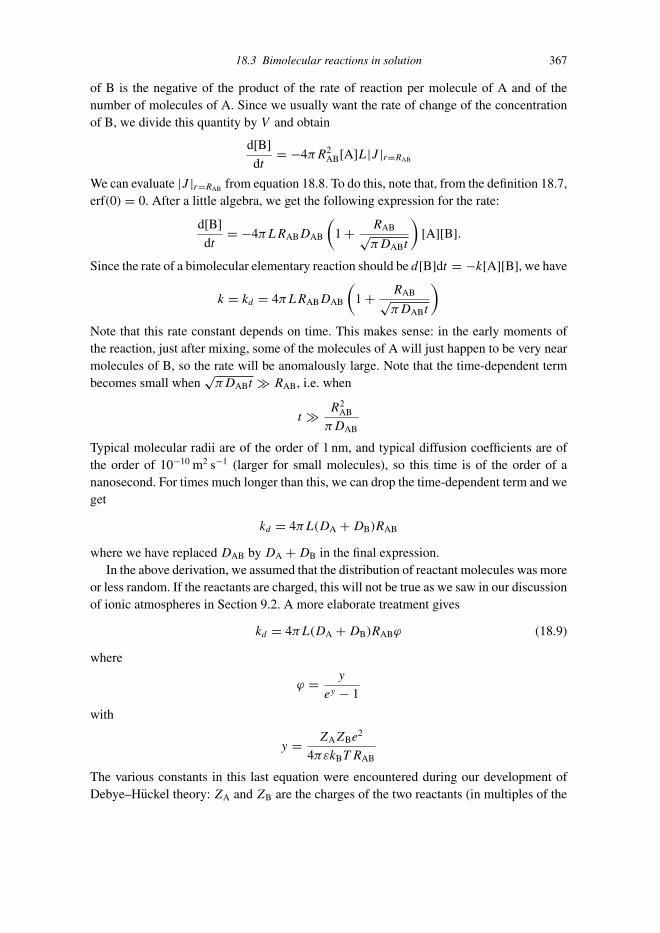
P1: SFK Trim: 247mm × 174mm Top: 14.586mm Gutter: 23.198mm
CUUK1808-18 CUUK1808/Roussel 978 1 107 00678 2 October 29, 2011 13:28
18.3 Bimolecular reactions in solution 367
of B is the negative of the product of the rate of reaction per molecule of A and of thenumber of molecules of A. Since we usually want the rate of change of the concentrationof B, we divide this quantity by V and obtain
d[B]
dt= −4πR2
AB[A]L|J |r=RAB
We can evaluate |J |r=RAB from equation 18.8. To do this, note that, from the definition 18.7,erf(0) = 0. After a little algebra, we get the following expression for the rate:
d[B]
dt= −4πLRABDAB
(1 + RAB√
πDABt
)[A][B].
Since the rate of a bimolecular elementary reaction should be d[B]dt = −k[A][B], we have
k = kd = 4πLRABDAB
(1 + RAB√
πDABt
)
Note that this rate constant depends on time. This makes sense: in the early moments ofthe reaction, just after mixing, some of the molecules of A will just happen to be very nearmolecules of B, so the rate will be anomalously large. Note that the time-dependent termbecomes small when
√πDABt � RAB, i.e. when
t � R2AB
πDAB
Typical molecular radii are of the order of 1 nm, and typical diffusion coefficients are ofthe order of 10−10 m2 s−1 (larger for small molecules), so this time is of the order of ananosecond. For times much longer than this, we can drop the time-dependent term and weget
kd = 4πL(DA + DB)RAB
where we have replaced DAB by DA + DB in the final expression.In the above derivation, we assumed that the distribution of reactant molecules was more
or less random. If the reactants are charged, this will not be true as we saw in our discussionof ionic atmospheres in Section 9.2. A more elaborate treatment gives
kd = 4πL(DA + DB)RABϕ (18.9)
where
ϕ = y
ey − 1
with
y = ZAZBe2
4πεkBT RAB
The various constants in this last equation were encountered during our development ofDebye–Huckel theory: ZA and ZB are the charges of the two reactants (in multiples of the

P1: SFK Trim: 247mm × 174mm Top: 14.586mm Gutter: 23.198mm
CUUK1808-18 CUUK1808/Roussel 978 1 107 00678 2 October 29, 2011 13:28
368 Diffusion and reactions in solution
elementary charge), e is the elementary charge (in coulombs), and ε is the permittivity ofthe solvent. Note that ϕ = 1 if either reactant is uncharged.
There are a variety of methods to measure diffusion constants which we will have toleave aside in the interests of brevity. It’s also sometimes possible to estimate RAB fromstructural or other molecular data. From time to time however, we run into a situation wherewe have no easy way to estimate RAB. One neat way to finesse this problem is to use theStokes–Einstein relation (Equation 18.5) to estimate RA and RB from the correspondingdiffusion coefficients:
RAB ≈ RA + RB = kBT
6πη
(1
DA+ 1
DB
)(18.10)
Equation (18.9) can then be used to calculate the diffusional rate constant.
Example 18.2 Recombination of H+ with OH− The recombination of H+ with OH−
in water is a typical example of a process that we expect to be diffusion-limited: thereaction is extremely fast. The diffusion constants of the ions are DH+ = 9.31 × 10⁻⁹
and DOH− = 5.30 × 10⁻⁹ m2 s−1 at 25 ◦C. We could use Equation (18.10) to calculate theencounter radius, but in this case, because the ions involved are so small, there is a simplerand probably more accurate method for estimating RAB; we expect this reaction to occurwhen the H+ and OH− ions are separated by a distance equivalent to the OH bond lengthof water. This would give an encounter radius of approximately 9.58 × 10⁻¹¹ m. The factory that enters into the computation of ϕ is then
y = (1)(−1)(1.602 176×10−19 C)2
4π (6.939×10⁻¹⁰ C2N−1m−2)(1.380 6503×10−23 J K−1)(298.15 K)(9.58×10⁻¹¹ m)= −7.465
∴ ϕ = −7.465
exp(−7.449) − 1= 7.469
In other words, this reaction will be more than seven times faster than it would be if thereactants weren’t charged. The diffusional rate constant is
kd = 4π (6.022 142 × 1023 mol−1)(9.31 × 10⁻⁹ + 5.30 × 10⁻⁹ m2 s−1)
× (9.58 × 10−11 m)(7.453)
= 7.91 × 10⁷ m3mol−1s−1
≡ 7.91 × 10¹⁰ L mol−1s−1
In Example 16.2, we found that the experimental value of this rate constant (which wascalled ka in the previous example) is 1.35 × 10¹¹ L mol−1s−1. This is larger than ourestimate of the diffusional rate constant. Since the diffusional rate constant is in principlean upper limit for the real rate constant, this suggests that the reaction is indeed diffusion-controlled. We might guess that the problem is our estimate of RAB, since that is the mostuncertain quantity in our calculations. If we assume that kd = 1.35 × 10¹¹ L mol−1s−1 andsolve for RAB, we get RAB = 8.1 × 10⁻¹⁰ m. This is an enormous value for the encounter

P1: SFK Trim: 247mm × 174mm Top: 14.586mm Gutter: 23.198mm
CUUK1808-18 CUUK1808/Roussel 978 1 107 00678 2 October 29, 2011 13:28
18.3 Bimolecular reactions in solution 369
.
O
H
H
O
H H
O
H
H+
H
.. .. ....
.
Figure 18.3 Grotthuss mechanism for proton diffusion. The curved arrows show the changes in theorganization of the valence electrons, while the dashed lines show the new bonds to be formed.
distance. It suggests that there is some mechanism operating in this reaction that is notaccounted for by our simple model of diffusion control. What we’re missing is that protonsand hydroxide ions in aqueous solution can diffuse by a relay mechanism first proposed byGrotthuss and illustrated in Figure 18.3. By simply rearranging the electrons, the excesscharge carried by a proton can move from one water molecule to another. The net effect ofthe electron motions shown in the figure is that the charge of the proton has moved from theleftmost to the rightmost molecule of water. Since electrons move much faster than nuclei,the overall effect is ultrafast diffusion of protons. As an exercise, you may want to draw ananalogous mechanism for the diffusion of hydroxide.
Example 18.3 Is catalase diffusion controlled? The diffusion constant of the enzymecatalase is 4.3 × 10⁻¹¹ m2 s−1. This enzyme catalyzes the disproportionation of hydrogenperoxide:
2H2O2 → 2H2O + O2
The mechanism involves sequential loading of two hydrogen peroxide molecules into theactive site:
E + H2O2k1−⇀↽−k−1
C1
C1 + H2O2k2−⇀↽−k−2
C2
Catalase is one of the more efficient enzymes known. The forward rate constants k1 and k2
have both been measured and are quite high:
k1 = 5 × 10⁶ L mol−1s−1
and k2 = 1.5 × 10⁷ L mol−1s−1
We might want to know whether k2 is near the diffusion limit. According to the Stokes–Einstein relation, the diffusion constant mostly depends on the radius of a molecule. Puttinga small molecule in the active site of a large enzyme shouldn’t make much of a differenceto the size, so we will assume that the catalase–peroxide complex C1 has a similar diffusioncoefficient to the pure enzyme. The diffusion constants of small molecules in water aretypically about 2 × 10⁻⁹ m2 s
−1. All of the data given above correspond to 25 ◦C. The

P1: SFK Trim: 247mm × 174mm Top: 14.586mm Gutter: 23.198mm
CUUK1808-18 CUUK1808/Roussel 978 1 107 00678 2 October 29, 2011 13:28
370 Diffusion and reactions in solution
viscosity of water at this temperature is 8.91 × 10⁻⁴ Pa s. The encounter radius is thereforeapproximately
RAB = (1.380 6503 × 10−23 J K−1)(298.15 K)
6π (8.91 × 10⁻⁴ Pa s)
(1
4.3 × 10⁻¹¹+ 1
2 × 10⁻⁹ m2 s−1
)= 5.82 × 10⁻⁹ m
Using this value for RAB makes the assumption that the enzyme and peroxide can react ifthe peroxide meets any part of the surface of catalase. This is of course not true since theperoxide has to find the enzyme’s active site. The effect of this assumption is mitigated bythe fact that catalase is actually a tetramer, with four active sites on its surface. Still, theseactive sites represent a small fraction of the surface of the enzyme. We will take a stab atbringing in a correction to account for this factor later.
Carrying on, since the hydrogen peroxide is a neutral molecule, ϕ = 1. The diffusionalrate constant is therefore
kd = 4π (6.022 142 × 1023 mol−1)(4.3 × 10⁻¹¹ + 2 × 10⁻⁹ m2 s−1)(5.82 × 10⁻⁹ m)
= 9.0 × 10⁷ m3mol−1s−1
≡ 9.0 × 10¹⁰ L mol−1s−1
This estimate of kd is quite a bit higher than the experimental rate constants for either ofthe substrate binding steps, but then again we haven’t taken into account the issue that notthe entire surface of catalase is reactive. The active site in catalase is accessed througha channel whose mouth is about 15 A across. If we think of this mouth as defining adisc-shaped opening in the surface of the enzyme, the mouth has an area of
Amouth = πr2 = π (7.5 × 10⁻¹⁰ m)2 = 1.8 × 10⁻¹⁸ m2
There are four active sites, each with its own channel, so the surface area of catalase coveredby these openings is 7.1 × 10⁻¹⁸ m2.
From the diffusion coefficient of catalase, we calculate a radius of the enzyme of
R = kBT
6πDη= 5.7 × 10⁻⁹ m
The surface area of a sphere of this radius is
Acatalase = 4πR2 = 4.1 × 10⁻¹⁶ m2
The fraction of the total surface of the enzyme accounted for by the channel openings istherefore
Aopenings
Acatalase= 7.1 × 10⁻¹⁸ m2
4.1 × 10⁻¹⁶ m2= 0.017
We would only expect binding to occur if hydrogen peroxide finds one of the openings,which we would only expect to happen 1.7% of the time. We should therefore reduce our

P1: SFK Trim: 247mm × 174mm Top: 14.586mm Gutter: 23.198mm
CUUK1808-18 CUUK1808/Roussel 978 1 107 00678 2 October 29, 2011 13:28
18.3 Bimolecular reactions in solution 371
estimate of the diffusion-limited rate constant by this factor:
kd,eff = 0.017(9.0 × 10¹⁰ L mol−1s−1) = 1.6 × 10⁹ L mol−1s−1)
This is still about 100 times larger than k2. We conclude that the binding of hydrogenperoxide to catalase is diffusion-influenced, but not diffusion-limited.
For reactions between small neutral molecules, we can also estimate Kd and k−d bya simple statistical argument, at least for the case in which intermolecular forces arenegligible. The concentration of encounter pairs is given by the concentration of A timesthe probability that a molecule of B is to be found next to A. Suppose that N is the averagenumber of molecules (of any kind) in direct contact with a molecule of A. This numberis called the coordination number. If the intermolecular forces between and A and Bare about the same as the intermolecular forces between A and the solvent, then we wouldexpect that B would replace a solvent molecule in A’s coordination shell in rough proportionto the relative abundance of B to the solvent. The probability that any particular solventmolecule coordinated to A is replaced by a molecule of B is then [B]/[S] where [S] isthe number of moles of solvent in a liter of solution. Since there are N sites where thisreplacement can occur, the probability that any of the solvent molecules has been replacedby B is roughly N times [B]/[S], assuming [B] [S]. This means that
[{AB}] ≈ [A]N [B]
[S]
The equilibrium constant Kd is defined by
Kd = [{AB}][A][B]
so we have
Kd ≈ N[S]
Once we know Kd and kd , we can calculate k−d by
k−d = kd/Kd
Example 18.4 Equilibrium constant for formation of encounter pairs Coordinationnumbers for small molecules (e.g. methanol) in aqueous solution are typically in the rangeof 6–8. The mole density of water at 25 ◦C is 55.33 mol L−1. For typical neutral-moleculereactions in water, Kd would therefore be
Kd = 8/(55.33 mol L−1) = 0.14 L mol−1
Note that the equilibrium constant here is a phenomenological equilibrium constant (withunits).
Example 18.5 Estimate of rate constant for dissociation of encounter pairs Supposethat, for a neutral-molecule reaction in water at 25 ◦C, DA ≈ DB = 2 × 10⁻⁹ m2 s−1 and

P1: SFK Trim: 247mm × 174mm Top: 14.586mm Gutter: 23.198mm
CUUK1808-18 CUUK1808/Roussel 978 1 107 00678 2 October 29, 2011 13:28
372 Diffusion and reactions in solution
SO 3−
C O
Br
Br
Br
HO
Br
quinoid form
SO 3−
O−
C
OH
Br
BrBr
Br
HO
carbinol form
Figure 18.4 The quinoid and carbinol forms of bromphenol blue. The quinoid form is blue while thecarbinol is colorless.
the coordination number of both reactants is 8. We can calculate kd by
RAB = (1.380 6503 × 10−23 J K−1)(298.15 K)
6π (8.91 × 10⁻⁴ Pa s)
(2
2 × 10⁻⁹ ms s−1
)= 2.45 × 10⁻¹⁰ m
∴ kd = 4π (6.022 142 × 1023 mol−1)(2)(2 × 10⁻⁹ m2 s−1)(2.45 × 10⁻¹⁰ m)
= 7.4 × 10⁶ m3mol−1s−1
≡ 7.4 × 10⁹ L mol−1s−1
We calculated Kd = 0.14 L mol−1 in the previous example. Since Kd = kd/k−d , k−d =5.3 × 10¹⁰ s−1. This is an extraordinarily large value. Neglecting reaction, it implies thatthe half-life of the encounter pair is just 13 ps.
Example 18.6 Estimate of kr If we can calculate kd and k−d , we can then get kr from ameasured value of k using Equation (18.6). Bromphenol blue (BPB) is a pH indicator thatreacts with hydroxide in aqueous solution as follows:
quinoid (blue) + OH− → carbinol (colorless)
The quinoid and carbinol forms of this indicator are shown in Figure 18.4. At 25 ◦C,k = 9.30 × 10⁻⁴ L mol−1s−1 for this reaction. We’re only going to be able to get ballparkestimates for kd and k−d since we don’t know the coordination number or diffusion coeffi-cient of BPB. Still, it should be enough to let us calculate an order-of-magnitude estimateof kr .
For our two reactants, ZA = ZB = −1, so y = 7.449, which gives f = 4.338 × 10⁻³.The diffusion coefficient of OH− is 5.30 × 10⁻⁹ m2 s−1. Diffusion coefficients for smallishmolecules like BPB are typically around 10−9 m2 s−1. As for the reactive distance RAB, itmight be quite small since the hydroxide has to make a bond with the central carbon. Let’s

P1: SFK Trim: 247mm × 174mm Top: 14.586mm Gutter: 23.198mm
CUUK1808-18 CUUK1808/Roussel 978 1 107 00678 2 October 29, 2011 13:28
18.3 Bimolecular reactions in solution 373
assume this distance is similar to the C–O bond length, which is about 143 pm. We get
kd = 4π (6.022 142 × 1023 mol−1)[(5.30 + 1) × 10−9 m2 s−1
](143 × 10−12 m)
× (4.338 × 10⁻³)
= 3 × 10⁴ m3 mol−1s−1
≡ 3 × 10⁷ L mol−1s−1
Since the hydroxide has to react at the central carbon atom, it’s the coordination numberof this atom that counts, and not the coordination number for the whole molecule. BPB isflat and sterically hindered at this carbon, so the coordination number is likely to be small,perhaps as low as 2 (one above and one below the plane of the central carbon). For thesake of argument, let’s use N = 2. This gives Kd = 4 × 10⁻² L mol−1, from which we cancalculate k−d = kd/Kd = 8 × 10⁸ s−1. We also have, from Equation (18.6),
kr = kk−d
kd − k≈ kk−d
kd
= k
Kd
= 9.30 × 10⁻⁴ L mol−1s−1
4 × 10⁻² L mol−1
= 2 × 10⁻² s−1
This reaction is strongly activation controlled, as we could also have seen from the relativevalues of k and kd . The value of kr we calculated here could now be compared to valuesobtained from quantum mechanical calculations.
Exercise group 18.2
(1) Diffusion coefficients for large macromolecules such as antibodies are generally ofthe order of 10−11 m2 s−1. Diffusion coefficients for viruses are much smaller, typi-cally about 10−12 m2 s
−1. Assuming that the binding of antibodies to viral particles is
diffusion-controlled, estimate the rate constant for this process at 25 ◦C. The viscosityof water at this temperature is 8.91 × 10⁻⁴ Pa s. Convert your answer to L mol−1s−1.
(2) Although we usually talk about acid–base chemistry in aqueous solution, we can alsostudy acid–base chemistry in other solvents. Consider the following data for water andmethanol at 25 ◦C.
Water Methanol
εr 78.37 32.63η/mPa s 0.8904 0.547
The rate constant for the reaction
CH3COO− + H+ → CH3COOH
has the value ka,w = 4.5 × 10¹⁰ L mol−1s−1 in water at 25 ◦C. Based on the theoryof diffusion-limited reactions, what value would you predict for the rate constant inmethanol at 25 ◦C?

P1: SFK Trim: 247mm × 174mm Top: 14.586mm Gutter: 23.198mm
CUUK1808-18 CUUK1808/Roussel 978 1 107 00678 2 October 29, 2011 13:28
374 Diffusion and reactions in solution
Hints: Consider the ratio of the rate constants in the two solvents and think about whatwould be the same or different in the two solvents. When the reactants have oppositecharges, the term ey in the equation for the electrostatic factor f which appears in thediffusion-limited rate constant is very small.
Key ideas and equations
� D = kBT 6πrη
� k = kdkr
k−d + kr
� kd = 4πL(DA + DB)RABϕ with ϕ = y/(ey − 1) and y = ZAZBe2
4πεkBT RAB� Kd = kd/k−d = N /[S]
Review exercise group 18.3
(1) The diffusion coefficient of iodine in CCl4 is 1.5 × 10⁻⁹ m2 s−1 at 320 K.(a) Making a reasonable assumption, estimate the diffusion coefficient of iodine atoms
in CCl4.(b) Iodine atoms can be created in solution by flash photolysis. Recombination of
radicals in solution is usually diffusion-limited since the solvent is always presentto carry away excess energy liberated in bond formation, and the solvent cagingeffect tends to keep the radicals together long enough to react, even if they don’treact as soon as they first touch. The rate constant at 320 K was found to be7 × 109 L mol−1s−1. Assuming that the reaction is diffusion-controlled, calculatethe reactive distance. Compare this radius to the bond length of 2.66 × 10⁻¹⁰ m,and comment on the result.
(2) (a) The viscosity of a liquid typically decreases with increasing temperature. Thistemperature dependence is sometimes described using the Arrhenius-like equation
η = Aη exp
(Eη
RT
)
Note the lack of a negative sign in the exponential. Using any relevant theories,determine how the activation energy of a diffusion-controlled reaction betweenneutral molecules is related to the “activation energy” of viscosity.Hints: The size of a solute molecule depends very little on temperature and shouldbe treated as a fixed quantity. To figure out the activation energy, take d(ln k)/dT
both for the Arrhenius equation and for your expression for the rate constant.(b) The viscosity of water is 1.79 mPa s at 0 ◦C, and 0.28 mPa s at 100 ◦C. What is the
value of Eη for water?(c) What is the predicted activation energy for a diffusion-controlled reaction at 25 ◦C?

P1: SFK Trim: 247mm × 174mm Top: 14.586mm Gutter: 23.198mm
CUUK1808-APP-A CUUK1808/Roussel 978 1 107 00678 2 October 29, 2011 13:55
Appendix A
Standard thermodynamic propertiesat 298.15 K and 1 bar
The thermodynamic quantities in these tables are appropriate to the molarity-basis(chemists’) standard state.
A.1 Enthalpy, free energy and heat capacity data
Species�f H ◦
kJ mol−1
�f G◦
kJ mol−1
Cp,m
J K−1mol−1
Ag+(aq) 105.79 77.11
Ag2O(s) −31.1 −11.2 65.9Ag2S(s) −32.6 −40.7 76.5BCl3(l) −427 −387 107.1BCl3(g) −403.8 −388.7 62.7B2H6(g) 36 86.7 56.9Ba2+
(aq) −537.6 −560.7BaCO3(s) −1216 −1138 85.4Br(g) 111.87 82.38 20.79Br−(aq) −121.41 −103.85Br2(l) 0 0 75.689Br2(g) 30.91 3.11 36.02BrF3(g) −255.60 −229.43 66.61BrF5(g) −428.8 −350.6 99.62C(graphite) 0 0 8.53C(diamond) 1.88 2.90 6.12CH3COOH(l) −484.5 −389.9 123.43CH3COOH(aq) −485.26 −396.39CH3COO−
(aq) −486.01 −369.31CH3OH(l) −239.1 −166.3 81.6CH3OH(g) −201.6 −162.0 43.9CH4(g) −74.81 −50.72 35.31C2H2(g) 226.73 209.20 43.9C2H4(g) 52.26 68.15 43.6
(cont.)
375

P1: SFK Trim: 247mm × 174mm Top: 14.586mm Gutter: 23.198mm
CUUK1808-APP-A CUUK1808/Roussel 978 1 107 00678 2 October 29, 2011 13:55
376 Standard thermodynamic properties
Species�f H ◦
kJ mol−1
�f G◦
kJ mol−1
Cp,m
J K−1mol−1
C2H4O(aq) −212.34 −139.00C2H5OH(aq) −276.98 −180.85C2H5OH(l) −277.69 −174.78 111.5C2H6(g) −84.68 −32.82 52.6C3H8(g) −103.85 −23.47 73.6C6H6(l) (benzene) 49.0 124.8 132C6H6(g) (benzene) 82.9 129.8 81.6C6H12(g) (cyclohexane) −123.1 32.0 105.3C6H12O6(s) (α-d-glucose) −1274.4 −910.23 218.16C6H12O6(aq) (α-d-glucose) −1263.06 −914.25C12H22O11(aq) (α-lactose) −2232.37 −1564.36C12H22O11(aq) (β-lactose) −2233.50 −1565.61C12H22O11(aq) (sucrose) −2215.85 −1550.89CO(g) −110.53 −137.17 29.12CO2(g) −393.51 −394.37 37.1CO2(aq) −413.26 −386.05CO2−
3(aq) −675.23 −527.90CaCO3(s) −1206.9 −1128.8 81.9CaO(s) −634.92 −603.30 42.8Cd(OH)2(s) −469.8Cl(g) 121.301 105.305 21.84Cl−(aq) −167.080 −131.218ClO(g) 101.22 97.48 31.54Cl2(g) 0 0 33.91Cl2O(g) 87.88 105.10 47.50Co2+
(aq) −58 −54Cr2O2−
7(aq) −1490.3 −1301.1F−
(aq) −335.35 −281.52F2(g) 0 0 31.30Fe(s) 0 0 25.1Fe2+
(aq) −90.0 −90.5FeCl2(s) −341.6 −302.2 76.7FeSO4(s) −928.4 −820.8 100.6HCO−
3(aq) −689.9 −586.8H(g) 217.998 203.276 20.79H2(g) 0 0 28.82HBr(g) −36.29 −53.36 29.14H2O(l) −285.830 −237.140 75.40H2O(g) −241.826 −228.582 33.58H2S(g) −20.50 −33.33 34.20HPO2−
4(aq) −1299.0 −1096.0H2PO−
4(aq) −1302.6 −1137.2
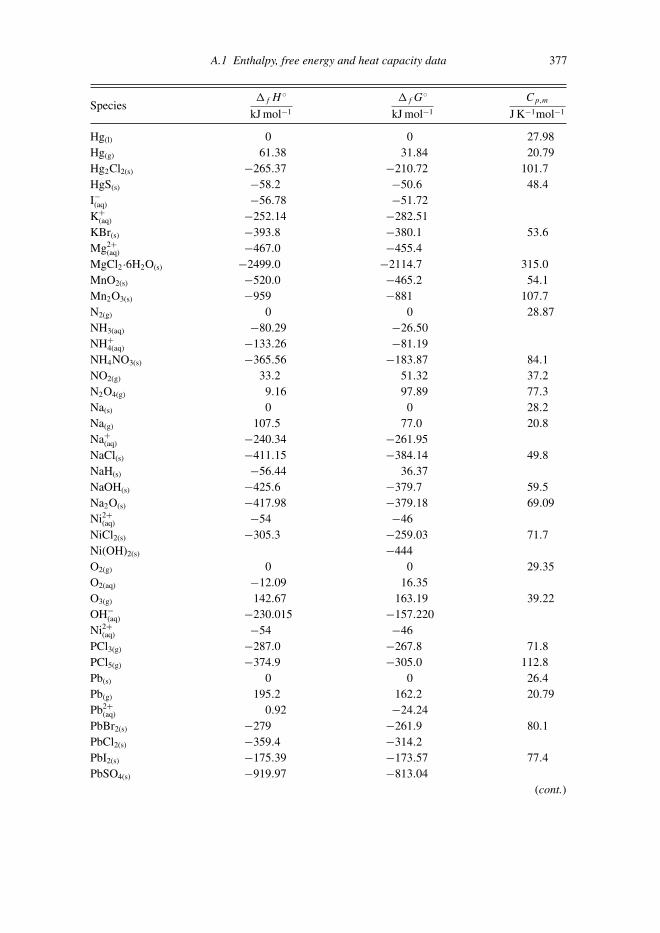
P1: SFK Trim: 247mm × 174mm Top: 14.586mm Gutter: 23.198mm
CUUK1808-APP-A CUUK1808/Roussel 978 1 107 00678 2 October 29, 2011 13:55
A.1 Enthalpy, free energy and heat capacity data 377
Species�f H ◦
kJ mol−1
�f G◦
kJ mol−1
Cp,m
J K−1mol−1
Hg(l) 0 0 27.98Hg(g) 61.38 31.84 20.79Hg2Cl2(s) −265.37 −210.72 101.7HgS(s) −58.2 −50.6 48.4I−(aq) −56.78 −51.72K+
(aq) −252.14 −282.51KBr(s) −393.8 −380.1 53.6Mg2+
(aq) −467.0 −455.4MgCl2·6H2O(s) −2499.0 −2114.7 315.0MnO2(s) −520.0 −465.2 54.1Mn2O3(s) −959 −881 107.7N2(g) 0 0 28.87NH3(aq) −80.29 −26.50NH+
4(aq) −133.26 −81.19NH4NO3(s) −365.56 −183.87 84.1NO2(g) 33.2 51.32 37.2N2O4(g) 9.16 97.89 77.3Na(s) 0 0 28.2Na(g) 107.5 77.0 20.8Na+
(aq) −240.34 −261.95NaCl(s) −411.15 −384.14 49.8NaH(s) −56.44 36.37NaOH(s) −425.6 −379.7 59.5Na2O(s) −417.98 −379.18 69.09Ni2+
(aq) −54 −46NiCl2(s) −305.3 −259.03 71.7Ni(OH)2(s) −444O2(g) 0 0 29.35O2(aq) −12.09 16.35O3(g) 142.67 163.19 39.22OH−
(aq) −230.015 −157.220Ni2+
(aq) −54 −46PCl3(g) −287.0 −267.8 71.8PCl5(g) −374.9 −305.0 112.8Pb(s) 0 0 26.4Pb(g) 195.2 162.2 20.79Pb2+
(aq) 0.92 −24.24PbBr2(s) −279 −261.9 80.1PbCl2(s) −359.4 −314.2PbI2(s) −175.39 −173.57 77.4PbSO4(s) −919.97 −813.04
(cont.)

P1: SFK Trim: 247mm × 174mm Top: 14.586mm Gutter: 23.198mm
CUUK1808-APP-A CUUK1808/Roussel 978 1 107 00678 2 October 29, 2011 13:55
378 Standard thermodynamic properties
Species�f H ◦
kJ mol−1
�f G◦
kJ mol−1
Cp,m
J K−1mol−1
S2−(aq) 30 79
SF6(g) −1220.47 −1116.44 96.88SO2(g) −296.81 −300.09 39.8SO3(g) −395.7 −371.1 50.67SO2−
4(aq) −909.34 −744.00Si(s) 0 0 20.1SrSO4(s) −1453 −1341UF6(g) −2112.9 −2029.1U3O8(s) −3574.8 −3369.5Zn2+
(aq) −153.39 −111.62ZnF2(s) −764 −713.4 65.6ZnO(s) −350.46 −320.48 40.3
A.2 Standard entropies
SpeciesS◦
J K−1mol−1
C(s) (graphite) 5.74C2H5OH(l) 160.67C5H4N4O2(s) (xanthine) 161.1C6H12O6(aq) (α-d-glucose) 264.01CO2(g) 213.785CO2−
3(aq) −50.0Ca(s) 41.6CaCl2(s) 104.62Cl2(g) 223.081H2(g) 130.680H2O(l) 69.95N2(g) 191.609O2(g) 205.152O2(aq) 110.88O3(g) 238.92U(s) 50.20UO2+
2(aq) −98.2

P1: SFK Trim: 247mm × 174mm Top: 14.586mm Gutter: 23.198mm
CUUK1808-APP-B CUUK1808/Roussel 978 1 107 00678 2 October 29, 2011 14:1
Appendix B
Standard reduction potentials at 298.15 K
Reduction process E◦/V
O3(g) + 2H+(aq) + 2e− → O2(g) + H2O(l) +2.07
PbO2(s) + 4H+(aq) + SO2−
4(aq) + 2e− → PbSO4(s) + 2H2O(l) +1.68Au3+
(aq) + 3e− → Au(s) +1.498Cr2O2−
7(aq) + 14H+(aq) + 6e− → 2Cr3+
(aq) + 7 H2O(l) +1.33O2(g) + 4H+
(aq) + 4e− → 2H2O(l) +1.229Br2(aq) + 2e− → 2Br−(aq) +1.0873
NO−3(aq) + 4H+
(aq) + 3e− → NO(g) + 2H2O(l) +0.96NO−
3(aq) + 3H+(aq) + 2e− → HNO2(aq) + H2O(l) +0.934
Hg2+(aq) + 2e− → Hg(l) +0.851
Ag+(aq) + e− → Ag(s) +0.7996
Hg2+2(aq) + 2e− → 2Hg(l) +0.7973
O2(g) + 2H2O(l) + 4e− → 4OH−(aq), +0.401
Cu2+(aq) + 2e− → Cu(s) +0.3419
AgCl(s) + e− → Ag(s) + Cl−(aq) +0.222 33H+
(aq) + e− → 12 H2(g) 0
AgI(s) + e− → Ag(s) + I−(aq) −0.1518PbSO4(s) + 2e− → Pb(s) + SO2−
4(aq) −0.361Cd2+
(aq) + 2e− → Cd(s) −0.4030NiO2(s) + 2H2O(l) + 2e− → Ni(OH)2(s) + 2OH−
(aq) −0.490Zn2+
(aq) + 2e− → Zn(s) −0.7618Cd(OH)2(s) + 2e− → Cd(s) + 2OH−
(aq) −0.809Cr2+
(aq) + 2e− → Cr(s) −0.91Li+(aq) + e− → Li(s) −3.0401
379

P1: SFK Trim: 247mm × 174mm Top: 14.586mm Gutter: 23.198mm
CUUK1808-APP-C CUUK1808/Roussel 978 1 107 00678 2 October 29, 2011 10:33
Appendix C
Physical properties of water
Ice at 0 ◦CDensity = 0.915 g cm−3
Vapor pressure = 4.579 torrHeat of fusion = 333.4 J g−1 = 6.007 kJ mol−1
Absolute molar entropy = 41.0 J K−1mol−1
Specific heat capacity = 2.113 J K−1g−1
Molar heat capacity = 38.07 J K−1mol−1
Liquid waterSpecific heat capacity = 4.184 J K−1g−1
Molar heat capacity = 75.37 J K−1mol−1
See also next page.
Steam at 100 ◦CDensity = 5.880 × 10⁻⁴ g cm−3
Heat of vaporization = 2257 J/g = 40.66 kJ mol−1
Absolute molar entropy at 1 bar = 196.3 J K−1mol−1
Molar heat capacity at constant pressure = 33.76 J K−1mol−1
Table C.1 Properties of liquid water as a function of temperature
Temperature◦C
Density
g cm−3
Mole density
mol L−1
Vapor pressure
torr
�vaph◦
J g−1
S◦
J K−1mol−1εr
0 0.9999 55.49 4.579 2501 63.2 87.854 1.0000 55.49 6.101 2492 64.3 86.26
20 0.9982 55.39 17.535 2454 68.6 80.1825 0.9971 55.33 23.756 2443 69.95 78.3740 0.9922 55.06 55.324 2408 73.7 73.1860 0.9832 54.56 149.38 2362 78.3 66.7880 0.9718 53.93 355.1 2316 82.7 60.95
100 0.9584 53.19 760.000 2269 86.9 55.63
380

P1: SFK Trim: 247mm × 174mm Top: 14.586mm Gutter: 23.198mm
CUUK1808-APP-D CUUK1808/Roussel 978 1 107 00678 2 October 29, 2011 10:41
Appendix D
The SI system of units
The following is a table of some of the SI units which you will find useful during yourstudy of physical chemistry. This list is by no means exhaustive.
Observable SI unit Abbreviation Definition
Activity becquerel Bq 1 Bq = 1 event s−1
Charge coulomb CElectric potential volt VEnergy joule JForce newton NFrequency hertz Hz 1 Hz = 1 cycle s−1
Length meter mMass kilogram kgNumber mole molPower watt W 1 W = 1 J s−1
Pressure pascal PaTemperature kelvin KTime second sVolume cubic meter m3
SI units are often used with prefixes. Here is a list of the more commonly used ones:
Prefix Name Value
f femto 10−15
p pico 10−12
n nano 10−9
μ micro 10−6
m milli 10−3
c centi 10−2
k kilo 103
M mega 106
G giga 109
381

P1: SFK Trim: 247mm × 174mm Top: 14.586mm Gutter: 23.198mm
CUUK1808-APP-D CUUK1808/Roussel 978 1 107 00678 2 October 29, 2011 10:41
382 The SI system of units
D.1 Calculations in SI units
Physical chemistry is a quantitative science. As a result, there will be a lot of calculationsto be carried out during your study of the subject. I find that it helps a lot to learn to workwith the SI system of units and to try to be consistent about it. There will be times whereit’s more convenient to use another system, but when in doubt, use SI units. Why? TheSI system has one great advantage over most other systems of units: it’s consistent. Thismeans that if you use SI units consistently, your calculations will always give answers inappropriate SI units.
Take the ideal gas law. Suppose that you are given the volume, number of moles andtemperature of a system. Then you can calculate the pressure by p = nRT/V . If you usemoles for n, express the temperature in kelvins and the volume in m3, and use the SI valueof R, the answer comes out in the SI units of pressure, namely pascals. There’s no messingaround with unit analysis and no need to learn several different values of R. If you are givendata in non-SI units, convert them before doing the calculation. Once you get used to doingthings this way, you will probably find that you make fewer errors in handling units.
Example D.1 Here’s a typical first-year ideal gas question, solved in detail here to showyou my suggested problem-solving technique. Suppose you are asked to calculate thepressure of 8 mol of argon in a 3 L flask at 870 ◦C. First, convert all data to SI units usingthe conversion factors in appendix E.
V = 3 L
1000 L m−3= 0.003 m3
T = 870 + 273.15 K = 1143 K
Using the SI value of the ideal gas constant (appendix E), we get
p = (8 mol)(8.314 472 J K−1mol−1)(1143 K)
0.003 m3
= 2.5 × 10⁷ Pa
How do we know that the answer comes out in pascals? We used SI units consistently inthe calculation so the answer comes out in the SI unit of pressure, namely pascals. If weneed the answer in some other units, we can then convert it to whatever representation iswanted.
One persistent source of confusion when doing calculations in SI units relates to the unitof mass. It is tempting to think that the gram is the SI unit of mass, but it isn’t.
The kg is the SI unit of mass.
When doing calculations in SI units involving mass, it is therefore necessary to usekilograms. In some problems we will encounter in this book, this sometimes means writingmolar masses in the unusual units of kg mol−1. For now, let’s just have a look at a simpleand, hopefully, familiar example from your physics course:

P1: SFK Trim: 247mm × 174mm Top: 14.586mm Gutter: 23.198mm
CUUK1808-APP-D CUUK1808/Roussel 978 1 107 00678 2 October 29, 2011 10:41
D.1 Calculations in SI units 383
Example D.2 What is the kinetic energy of a 145 g baseball traveling at 145 km h−1?I think that most students who have taken physics would notice that they need to convert
the speed to the SI units of m s−1 because we need to strip the SI prefix from km h−1, andthe SI unit of time is the second. What many of us would miss is that we have to convertthe mass of the baseball to kg because the latter is the SI unit of mass, not the gram:
m = 145 g
1000 g/kg= 0.145 kg
v = 145 × 103 m h−1
3600 s h−1= 40.3 m s−1.
∴ K = 1
2mv2 = 1
2(0.145 kg)(40.3 m s−1)2 = 118 J.

P1: SFK Trim: 247mm × 174mm Top: 14.586mm Gutter: 23.198mm
CUUK1808-APP-E CUUK1808/Roussel 978 1 107 00678 2 October 29, 2011 10:39
Appendix E
Universal constants and conversion factors
Constant Symbol Valuea Units
Avogadro’s constant L 6.022 141 79 × 1023 mol−1
Boltzmann’s constant kB 1.380 6503 × 10−23 J K−1
Electron mass me 9.109 3819 × 10−31 kgElementary charge e 1.602 176 46 × 10−19 CFaraday’s constant F 96 485.342 C mol−1
Ideal gas constantb R 8.314 472 J K−1mol−1
Neutron mass mn 1.674 927 16 × 10−27 kgPermittivity of the vacuumc ε0 8.854 187 817 × 10−12 C2J−1m−1
Planck’s constant h 6.626 0688 × 10−34 J Hz−1
h 1.054 571 68 × 10−34 J sProton mass mp 1.672 621 58 × 10−27 kgSpeed of light in vacuume c 2.997 924 58 × 108 m s−1
Standard gravityf g 9.806 65 m s−2
a All values in this table are from the NIST web site:http://physics.nist.gov/cuu/Constants/index.html
b Also known as the “molar gas constant”.c Also known as the “electric constant”. The value of this constant is fixed in the SI system.e In the SI system of units, the values of c is fixed.f The standard acceleration due to gravity (standard gravity for short) is a value fixed by
convention.
Conversion factors
Length1 A = 10−10 mVolume1 cm3 = 1 mL1 m3 = 1000 L
384

P1: SFK Trim: 247mm × 174mm Top: 14.586mm Gutter: 23.198mm
CUUK1808-APP-E CUUK1808/Roussel 978 1 107 00678 2 October 29, 2011 10:39
Constants and conversion factors 385
Mass1 amu = 1 g mol−1
1 amu = 1.660 538 78 × 10−27 kg1 Da = 1 g mol−1
1 t = 1000 kgPressure1 atm = 760 torr or mmHg1 atm = 101 325 Pa1 bar = 100 000 PaEnergy1 cal = 4.184 J1 eV = 1.602 176 46 × 10−19 JTime1 y = 365.25 dTemperatureTo convert degrees Celsius to kelvins, add 273.15.

P1: SFK Trim: 247mm × 174mm Top: 14.586mm Gutter: 23.198mm
CUUK1808-APP-F CUUK1808/Roussel 978 1 107 00678 2 October 29, 2011 10:48
Appendix F
Periodic table of the elements, with molar masses
1 18
1 H 2 He
1.01 2 13 14 15 16 17 4.00
3 Li 4 Be 5 B 6 C 7 N 8 O 9 F 10 Ne
6.94 9.01 10.81 12.01 14.01 16.00 19.00 20.18
11 Na 12 Mg 13 Al 14 Si 15 P 16 S 17 Cl 18 Ar
22.99 24.31 3 4 5 6 7 8 9 10 11 12 26.98 28.09 30.97 32.07 35.45 39.95
19 K 20 Ca 21 Sc 22 Ti 23 V 24 Cr 25 Mn 26 Fe 27 Co 28 Ni 29 Cu 30 Zn 31 Ga 32 Ge 33 As 34 Se 35 Br 36 Kr
39.10 40.08 44.96 47.88 50.94 52.00 54.94 55.85 58.93 58.69 63.55 65.41 69.72 72.61 74.92 78.96 79.90 83.80
37 Rb 38 Sr 39 Y 40 Zr 41 Nb 42 Mo 43 Tc 44 Ru 45 Rh 46 Pd 47 Ag 48 Cd 49 In 50 Sn 51 Sb 52 Te 53 I 54 Xe
85.47 87.62 88.91 91.22 92.91 95.94 101.07 102.91 106.42 107.87 112.41 114.82 118.71 121.76 127.60 126.90 131.29
55 Cs 56 Ba 57 La 72 Hf 73 Ta 74 W 75 Re 76 Os 77 Ir 78 Pt 79 Au 80 Hg 81 Tl 82 Pb 83 Bi 84 Po 85 At 86 Rn
132.91 137.33 138.91 178.49 180.95 183.85 186.21 190.2 192.22 195.08 196.97 200.59 204.38 207.2 208.98
87 Fr 88 Ra 89 Ac 104 Rf 105 Db 106 Sg 107 Bh 108 Hs 109 Mt 110 Ds 111 Rg
58 Ce 59 Pr 60 Nd 61 Pm 62 Sm 63 Eu 64 Gd 65 Tb 66 Dy 67 Ho 68 Er 69 Tm 70 Yb 71 Lu
140.12 140.91 144.24 150.36 151.97 157.25 158.93 162.50 164.93 167.26 168.93 173.04 174.97
90 Th 91 Pa 92 U 93 Np 94 Pu 95 Am 96 Cm 97 Bk 98 Cf 99 Es 100 Fm 101 Md 102 No 103 Lr
232.04 231.04 238.03
386

P1: SFK Trim: 247mm × 174mm Top: 14.586mm Gutter: 23.198mm
CUUK1808-APP-G CUUK1808/Roussel 978 1 107 00678 2 October 29, 2011 14:5
Appendix G
Selected isotopic masses and abundances
Isotope Mass/amu Natural abundance/%
1H 1.007 825 032 99.98852H 2.014 101 778 0.011512C 12 98.9313C 13.003 354 837 8 1.0716O 15.994 914 622 99.75717O 16.999 131 70 0.03818O 17.999 161 0 0.20535Cl 34.968 852 71 75.7637Cl 36.965 902 60 24.24
387

P1: SFK Trim: 247mm × 174mm Top: 14.586mm Gutter: 23.198mm
CUUK1808-APP-H CUUK1808/Roussel 978 1 107 00678 2 October 29, 2011 10:54
Appendix H
Properties of exponential and logarithmic functions
(1) a0 = 1(2) axay = ax+y
(3) ax/ay = ax−y
(4) a−x = 1/ax
(5) (ax)y = axy
(6) a1/x = x√
a
(7) (ab)x = axbx
(8) Logarithms are inverse functions of exponentials:� loga ax = x� aloga x = x
(9) � log is usually a shorthand notation for log10.1 I generally prefer to explicitly writedown the base, but feel free to use the shorthand if you prefer.
� ln is called the “natural logarithm.” ln x means the same thing as loge x, wheree = 2.71828 . . . is Napier’s number. This very important logarithm comes up inmany equations in chemistry. For our purposes, you mostly need to remember thatit’s just a logarithm that behaves like all other logarithms.
(10) loga 1 = 0(11) loga(xy) = loga x + loga y
(12) loga(x/y) = loga x − loga y
(13) loga(1/x) = − loga x
(14) loga(xy) = y loga x
(15) Change of base: loga x = loga b logb x
1 One of the reasons that I like to explicitly write down the base is that some people, mostly mathematicians, use log for thenatural logarithm rather than the base-10 logarithm. Writing down the base avoids any possible confusion.
388

P1: SFK Trim: 247mm × 174mm Top: 14.586mm Gutter: 23.198mm
CUUK1808-APP-I CUUK1808/Roussel 978 1 107 00678 2 October 29, 2011 11:1
Appendix I
Review of integral calculus
A student needs remarkably little calculus to get by in physical chemistry. Mainly, you willneed to be able to take a few derivatives and to do some simple integrals. Hopefully, youremember how to take derivatives. Integration is a little more difficult, but the followingtwo integrals are the only ones you really need to know in this course:
d
dxxn = nxn−1 ⇐⇒
∫xn dx = xn+1
n + 1if n �= −1 (I.1a)
d
dxln x = 1
x⇐⇒
∫dx
x= ln x (I.1b)
You will from time to time need to do more complicated integrals, but these can behandled in one of two ways: either they can be reduced to one of the above by a simplesubstitution, or you should use a table of integrals such as the one given in Section I.1.The latter is a personal opinion: it’s good to know all the fancy integration techniques incase you run into an integral that isn’t in your table of integrals, but most integrals you’relikely to run into have been done already, and you’re much less likely to make errors usinga table of integrals than going through the tedious process of computing an integral fromscratch.
Let’s now look at examples of both procedures:
Example I.1 Suppose that we want to obtain the integral
I =∫
dx
ax + b
where a and b are constants. This looks a bit like integral I.1b, except that we have ax + b
appearing where we have x alone in equation I.1b. When we see a simple linear termreplacing a variable in an integral, we can use a simple substitution: Let
u = ax + b.
Then, since a and b are constants,1
du = a dx
1 You may recognize this step as a manipulation of differentials, first seen in Chapter 5.
389

P1: SFK Trim: 247mm × 174mm Top: 14.586mm Gutter: 23.198mm
CUUK1808-APP-I CUUK1808/Roussel 978 1 107 00678 2 October 29, 2011 11:1
390 Review of integral calculus
or
dx = 1
adu
We can now substitute for x and dx in the integral:
I =∫ 1
adu
u= 1
a
∫du
u= 1
aln u = 1
aln (ax + b) .
Example I.2 Suppose that we want to evaluate the integral
I =∫
da
(k1a + k2)(k3a + k4b0)
where each of the kis is a constant, as is b0. This isn’t one of the elementary cases, butit looks like integral 5 from Section I.1. In fact, it’s exactly the same if we make thesubstitutions
x ← a a ← k2
b ← k1 c ← k4b0
e ← k3
We can substitute these symbols directly into the answer given in the table of integrals:
I = 1
k2k3 − k1k4b0ln
(k3a + k4b0
k1a + k2
)
Not every integral you will encounter in this course will be quite as simple as these, butyou won’t need any techniques more advanced than these to solve them.
The only other wrinkle we need to deal with is that we almost always have to compute adefinite integral rather than an antiderivative. The rule is simple: if F (x) is an antiderivativeof f (x), i.e. if F (x) = ∫ f (x) dx, then
∫ b
a
f (x) dx = F (x)|ab = F (a) − F (b)
Note that this is not in general equal to F (a − b).
Example I.3 Suppose that we want to calculate
I =∫ a
a0
da′
(k1a′ + k2)(k3a′ + k4b0)

P1: SFK Trim: 247mm × 174mm Top: 14.586mm Gutter: 23.198mm
CUUK1808-APP-I CUUK1808/Roussel 978 1 107 00678 2 October 29, 2011 11:1
I.1 Table of integrals 391
Give or take a very minor change of notation, we have already found the antiderivative inExample I.2. Thus,
I = 1
k2k3 − k1k4b0ln
(k3a
′ + k4b0
k1a′ + k2
)∣∣∣∣a
a0
= 1
k2k3 − k1k4b0
[ln
(k3a + k4b0
k1a + k2
)− ln
(k3a0 + k4b0
k1a0 + k2
)]
= 1
k2k3 − k1k4b0ln
((k3a + k4b0)(k1a0 + k2)
(k1a + k2)(k3a0 + k4b0)
)
The last equality was obtained using the rule ln x − ln y = ln(x/y). If you’re a bit rusty withyour logarithms and exponents, you might want to look at Appendix H which summarizesthe key properties of these functions.
I.1 Table of integrals
This is not by any means a complete table of integrals. However, the integrals given hereshould be sufficient to work through the examples and exercises in this book.
(1)∫
exp(ax)dx = 1
aexp(ax)
(2)∫
xndx = 1
n + 1xn+1
(3)∫
dx
x= ln x
(4)∫
ln(a/V ) dV = V ln(a/V ) + V
(5)∫
dx
(a + bx)(c + ex)= 1
ae − bcln
(c + ex
a + bx
)
(6)∫
dx
x2(a + bx)= b
a2ln
(a + bx
x
)− 1
ax
(7)∫
dx
x(a + bx)2= 1
a2ln
(x
a + bx
)+ 1
a(a + bx)

P1: SFK Trim: 247mm × 174mm Top: 14.586mm Gutter: 23.198mm
CUUK1808-APP-J CUUK1808/Roussel 978 1 107 00678 2 October 29, 2011 15:21
Appendix J
End-of-term review problems
OK, so you’ve reached the end of term, and you’ve answered all the problems in the book. What doyou do to study for the final exam? Try these problems! They’re a mixed bag of problems intendedto help you review all the material. They appear in no particular order, so you’ll have to think aboutwhat these questions relate to and what sections you’ll have to review to answer them. The answersappear at the end of the next section.
(1) If we say, for a particular process on a particular system, that w = −5 J, what does that mean?(2) Throughout the textbook, when discussing thermodynamics, I avoided the commonly used word
“spontaneous”, preferring the phrase “thermodynamically allowed”. Why?(3) Explain why the law of microscopic reversibility is required to make kinetics consistent with
thermodynamics.(4) For each of the following statements, indicate whether it is true or false and, in a few words,
explain your reasoning.(a) The dual nature of light is implied by the equation E = hν.(b) The probability that a molecule occupies a certain energy level only depends on the energy
(relative to the ground state) and on the temperature.(c) A bomb calorimeter measures �rH .(d) Exothermic reactions are always thermodynamically allowed.(e) According to Debye–Huckel theory, the activity coefficient of a solute depends on its
charge, so all uncharged solutes have an activity coefficient of 1.(f) The rate of a reaction with overall stoichiometry A → 2B is 1
2d[B]dt
.(g) The gas-phase reaction CH3N = NCH3 → C2H6 + N2 is not elementary.(h) The activation energy of an elementary reaction can’t be negative.(i) The encounter pair in the theory of bimolecular reactions in solution is a transition state
for the reaction.(j) �f H ◦ = 0 for an aqueous proton.(k) �S > 0 for any spontaneous process.(l) It is impossible for a system to reach absolute zero.(m) The Clausius inequality is equivalent to the Second Law.(n) If a reaction is not thermodynamically allowed, we can make it go by adding a catalyst.(o) Since the overall reaction is combustion in either case, a fuel cell is no more efficient than
a heat engine.(p) If, for a certain reaction, E◦ > 0, then that reaction is thermodynamically allowed.(q) The reaction Fe(CO)5 + OH− → (CO)4FeH− + CO2 is probably not elementary.
(5) Briefly define or explain each of the following concepts:(a) Molar absorption coefficient(b) Zero-point energy
392

P1: SFK Trim: 247mm × 174mm Top: 14.586mm Gutter: 23.198mm
CUUK1808-APP-J CUUK1808/Roussel 978 1 107 00678 2 October 29, 2011 15:21
End-of-term review problems 393
(c) The First Law of Thermodynamics(d) Coupled reactions(e) Indirect calorimetry(f) Microstate(g) Third Law of Thermodynamics(h) Vapor pressure
(6) Which of the following formulas only apply to photons? Which only apply to ordinary particles?Which apply to both? (a) E = hν, (b) p = h/λ, (c) E = cp, (d) E = 1
2 mv2.(7) What do the following symbols in the Nernst equation represent? Be specific.
(a) E, (b) E◦, νe.(8) Classify each of the following reactions as possibly, probably not or certainly not elementary.
Explain your reasoning briefly.(a) O2(g) + CH2(g) → CO(g) + H2O(g)
(b) OH(aq) + NO(aq) → NO−2(aq) + H+
(aq)
(9) Equilibrium constants are related to rate constants for the underlying elementary processes.Rate constants always increase with increasing temperature, while equilibrium constants canincrease or decrease with temperature. Why is this possible?
(10) The Helmholtz free energy can be used to obtain two different pieces of information about aprocess. What are they?
(11) What is wrong with the following statement?
�G gives the maximum work which a system can perform at constant temperature and pressure.
(12) Consider the following argument:
For an endothermic process, dq > 0. According to the Clausius inequality, dS ≥ dq/T > 0,so the entropy change for an endothermic process is always positive. Therefore endothermicprocesses are always thermodynamically allowed.
Do you agree with argument? If so, can we use similar reasoning to say somethingabout the spontaneity of exothermic processes? If not, explain where the argument goeswrong.
(13) Many reactions involve water as a reactant or product. When treating the thermodynamics ofsuch reactions, we generally ignore the activity of the water, i.e. set its value to unity. Why is itoften reasonable to do this?
(14) What is an initial rate experiment? Briefly discuss the advantages and disadvantages of initialrate experiments.
(15) Explain why the following statements are true. Consider two energy levels with E1 < E2. Ifthe two levels have the same degeneracy, then their populations only tend to equalize at veryhigh temperatures. If g1 > g2, then there will always be more molecules in energy level 1 thanin energy level 2. If on the other hand g1 < g2, there will be a temperature at which the twopopulations are equal.
(16) Antioxidants are molecules that react with strong oxidizing agents generated by metabolism incells, leaving harmless products. One of the simplest and most common antioxidants is ascorbicacid (C6H8O6), also known as vitamin C. Ascorbic acid can react with strong oxidizing agentslike hydroxyl radicals (OH), producing water and dehydroascorbic acid (C6H6O6) as products.Balance this reaction, assuming that the pH in the cell is 7. Also give the value of νe for thisreaction.
(17) In basic solution, Br2 disproportionates into bromate (BrO−3 ) and bromide ions. Balance the
reaction.

P1: SFK Trim: 247mm × 174mm Top: 14.586mm Gutter: 23.198mm
CUUK1808-APP-J CUUK1808/Roussel 978 1 107 00678 2 October 29, 2011 15:21
394 End-of-term review problems
(18) (a) Calculate the lowest two energy levels of an electron in a 1 nm box.(b) What are the wavelength, wavenumber and frequency of a photon whose absorption could
cause a transition from the ground to the first excited state of this system?(c) What is the momentum of the photon?(d) The energy of a particle in a box is all kinetic. Calculate the momentum of the particle in
each of the two lowest energy levels.(e) Is momentum conserved during the transition? Discuss.
(19) The ratio of the populations of two energy levels tends toward 2 at very high temperatures(higher energy population:lower energy population), and the populations are roughly equal at75 ◦C. What is the spacing between these energy levels? What other information can you extractfrom these data?
(20) As you know, we often see the pH defined as − log10 [H+] rather than the more correct definitionbased on the activity of the hydrogen ion. How large a difference does this make? Using Debye–Huckel theory, calculate the difference between the correct and approximate (concentration-based) definitions of pH for a 0.01 mol L−1 HCl solution at 25 ◦C.
(21) The diffusion coefficient of a proton in water is very large: D = 9.31 × 10⁻⁹ m2 s−1 at 25 ◦C.What value does this imply for the radius of this ion in water? Does this value make sense?
(22) Ethanol (molar mass 46.069 g mol−1) is a very toxic substance that cells have to keep at lowlevels. Alcohol dehydrogenase is an enzyme that catalyzes the reaction
NADox + ethanol → NADred + acetaldehyde + H+
where NADox and NADred are the oxidized and reduced forms of NAD, respectively.(a) Ethanol concentrations of 35 g L−1 or so are toxic to most strains of Escherichia coli. Is the
reaction catalyzed by alcohol dehydrogenase thermodynamically allowed at this ethanolconcentration at 25 ◦C, pH 5.5, and an ionic strength of 0.25 mol L−1 when the concentra-tions of the other reactants are [NADox] = 3.7 mmol L−1, [NADred] = 0.47 mmol L−1 and[acetaldehyde] = 1.2 μmol L−1? Use the following data in the biochemists’ standard stateat 25 ◦C, pH 7 and ionic strength 0.25 mol L−1 to solve this problem:
Species�f H ◦′
kJ mol−1
�f G◦′
kJ mol−1
Acetaldehyde(aq) 24.06 −213.97Ethanol(aq) 62.96 −290.76NADox
(aq) 1059.11 −10.26NADred
(aq) 1120.09 −41.38
(b) Why don’t you need to know anything about the enzyme to answer this question?(23) Kurt Stern was probably the first person to observe the formation of an enzyme–substrate
complex by spectroscopy.1 He provided an excess of a bad substrate (hydroperoxyethane) tocatalase. Catalase binds this substrate rapidly, but catalysis is very inefficient. The result isthat the spectrum of the enzyme disappears almost instantly, and is replaced by the spectrumof the enzyme–substrate complex. The spectrum of the free enzyme takes several minutes toreappear. The spectrum of catalase in the visible range consists of three bands, one roughlyspanning the range one from 490 to 510 nm (maximum at 500 nm), one from 530 to 550 nm(540 nm), and from 610 to 650 nm (629 nm). The enzyme–substrate complex, on the other hand,has a spectrum consisting of two bands, from 529 to 540 nm (535 nm), and from 564 to 576 nm(570 nm).(a) Suppose that you wanted to study this reaction by spectrophotometry. Which would be the
most convenient bands of the enzyme and enzyme–substrate complex to use?
1 K. G. Stern, Nature 136, 335 (1935).

P1: SFK Trim: 247mm × 174mm Top: 14.586mm Gutter: 23.198mm
CUUK1808-APP-J CUUK1808/Roussel 978 1 107 00678 2 October 29, 2011 15:21
End-of-term review problems 395
N
3
CH 3
C
O
N
H
N
H
C
O
N
H
OH
N
S
C
O
n
Figure J.1 Compounds synthesized by Stryer and Haugland to test Forster’s predicted dependence ofthe FRET efficiency on R6. The group to the right of the repeated proline units is the donor α-naphthylgroup. The group to the left is the acceptor dansyl group.
(b) Describe briefly an experiment to determine the molar absorption coefficients and explainhow you would calculate these coefficients.
(c) Suppose that you have made a solution of equine liver catalase. The molar absorptioncoefficient of this enzyme at 623 nm is 8.3 × 10⁴, L mol−1cm−1. Based on the amounts ofenzyme and buffer you used, you calculate that the concentration should be 12 μmol L−1.When you measure the absorbance of this solution, you get A623 = 0.95 in a 1 cm cuvette.Is this consistent with the concentration?
(d) Stern observed that the time required for the reappearance of the enzyme’s spectrum anddisappearance of the enzyme–substrate complex’s spectrum was four times longer at 4 ◦Cthan at 24 ◦C. What is the activation energy implied by these data?
(24) ATP (adenosine 5′-triphosphate) is the major energy carrier in cells. Energy is mainly releasedfrom ATP in the hydrolysis reaction
ATP + H2O → ADP + Pi
where ADP is adenosine 5′-diphosphate, and Pi represents “inorganic phosphate”, i.e. one ofthe protonation states of the phosphate anion. For this reaction, �rHm = −30.88 kJ mol−1. In aturtle hepatocyte (liver cell) with a volume of 10−11 L, 7 × 10⁻¹³ mol of ATP are consumed perhour. Assume that a cell is mostly water with a density of about 1 kg L−1 and a heat capacity ofabout 4.2 J K−1g−1. Now suppose that we could put a little insulated jacket around a hepatocyte.Considering only this one reaction, how long would it take for the temperature to rise by 5 ◦C?
(25) Calculate the enthalpy of formation of sodium hydride at −20 ◦C.(26) Calculate the base ionization constant of the hydrogen phosphate ion at 80 ◦C, i.e. the equilibrium
constant for the transfer of a proton from water to the hydrogen phosphate ion.(27) When a carbonate solution is acidified, carbon dioxide is produced.
(a) Can we predict the sign of the entropy change in this process without doing any calculations?If so, predict the sign. In either event, explain your reasoning.
(b) Calculate the standard entropy change for the reaction of carbonate ions with hydrogen ionsproducing carbon dioxide.
(28) Stryer and Haugland tested the dependence of the FRET efficiency on the sixth power ofthe distance by synthesizing a series of proline polymers with an α-naphthyl donor groupat one end and a dansyl acceptor group at the other end (Figure J.1).2 Polyproline forms arelatively rigid helix so that the distance between the ends for a given value of the numberof proline monomers, n, can be predicted with reasonable accuracy. The following data wereobtained:
2 L. Stryer and R. P. Haugland, Proc. Natl. Acad. Sci. USA 58, 719 (1967).

P1: SFK Trim: 247mm × 174mm Top: 14.586mm Gutter: 23.198mm
CUUK1808-APP-J CUUK1808/Roussel 978 1 107 00678 2 October 29, 2011 15:21
396 End-of-term review problems
R/A 21.2 24.5 27.8 31.0 34.4 37.0 40.5 43.1 46.0
ηFRET/% 96.5 82.9 74.8 64.9 49.6 40.3 28.3 25.4 16.6
(a) Rewrite Equation (3.9) in a linearized form, i.e. a form in which the data should fall on astraight line when plotted. Ideally, you would obtain a form in which R0 and the exponentcan be recovered from the slope and intercept.Hint: Start by taking 1/ηFRET.
(b) Plot your data according to the theory developed in question 28a. Confirm that the data areconsistent with the efficiency–distance relationship, and determine the value of R0.
(29) Enantiomers can often be separated by gas chromatography, using columns packed with achiral stationary phase. It is also possible to study the kinetics of interconversion between twoenantiomers in a gas chromatograph. There are a number of techniques which can be used,ranging from a “stopped-flow” method in which the flow of carrier gas is stopped to allow timefor the reaction to occur inside the column, to dynamic methods which require the analysis ofchromatogram peak shapes.3 The chiral stationary phase may affect the kinetics of the reactiondue to binding of the material being studied to the stationary phase. However, this is a minordisadvantage to a relatively easy experimental method for studying the interconversion betweentwo enantiomers in the gas phase.(a) Mydlova has measured the rate constant for the interconversion between the two enantiomers
of 1-chloro-2,2-dimethylaziridine by dynamic reaction gas chromatography in a setup withcoupled ChiralDex BTA and polydimethylsiloxane columns.4 The R isomer is illustratedbelow:
CH3
CH3
CC
N
Cl
H
H
The reaction involves inversion of the configuration at the nitrogen atom. The data givenbelow are averages of two estimates of the rate constant, assuming that K = 1 for theinterconversion process:
T /K 338 348 358 368
k/10−4 s−1 0.8 1.8 3.2 9.4Calculate the activation energy and pre-exponential factor for this interconversion.
(b) Calculate the entropy of activation at 25 ◦C. What does the value of the entropy of activationtell us about this reaction?
(30) Anikeev, Ermakova and Goto have studied the decomposition reaction of nitromethane insupercritical water.5 Specifically, they measured the fraction of the initial nitromethane convertedto product as a function of reaction time at a temperature of 664 K and a pressure of 272 atm:
t/s 0 45 67 134 270 467
X 0 0.381 0.537 0.763 0.951 0.994
Show that the reaction obeys first-order kinetics, and determine the rate constant.(31) (a) What is the enthalpy of combustion of α-d-glucose at 10 ◦C?
3 J. Krupcik et al., J. Chromatogr. A 1186, 144 (2008). 4 Data reported in J. Krupcik et al. (2008), cited above.5 Anikeev et al., Kinet. Catal. 46, 821 (2005).

P1: SFK Trim: 247mm × 174mm Top: 14.586mm Gutter: 23.198mm
CUUK1808-APP-J CUUK1808/Roussel 978 1 107 00678 2 October 29, 2011 15:21
End-of-term review problems 397
(b) If you burned 1.00 g of glucose in a bomb calorimeter near 25 ◦C, how much heat would bereleased? The molar mass of glucose is 180.156 g mol−1.
(32) Uric acid is a diprotic organic acid formed by the oxidation of purines. Gout is a medicalcondition in which crystals of uric acid or of sodium hydrogen urate (the sodium salt of theconjugate base of uric acid, also known as monosodium urate) are deposited in a joint, causingpain when the joint is flexed. Under physiological conditions, uric acid mostly exists as itsconjugate base, the hydrogen urate ion.
At 25 ◦C and a physiological ionic strength of 0.15 mol L−1, the (first) acid dissociationconstant of uric acid is 5.50 × 10−6.6 Calculate the standard free energy of formation of thehydrogen urate ion, given that the standard free energy of formation of aqueous uric acid is−356.6 kJ mol−1.
(33) The following data were obtained for the gas-phase dimerization of C2F4 at 300 ◦C:
t /min [C2F4]/mol L−1
0 0.0500250 0.0250750 0.0125
1750 0.006253750 0.00312
(a) Show that the data are consistent with this being an elementary reaction and calculate therate constant.
(b) Suppose that we wanted to collect at least 0.1 mol of the dimer in an experiment startingwith 0.25 mol of C2F4 in a volume of 0.60 L at 300 ◦C. How long should we let the reactiongo?
(c) The rate constant for the reverse reaction is 9.6 × 10⁻¹³ s−1. What is the equilibrium con-stant?
(34) The mechanism for the reaction
Hg2+2(aq) + Tl3+
(aq) → 2Hg2+(aq) + Tl+(aq)
is thought to be
Hg2+2(aq)
k1−⇀↽−k−1
Hg2+(aq) + Hg(aq) (fast)
Hg(aq) + Tl3+(aq)
k2−→ Hg2+(aq) + Tl+(aq) (slow)
(a) What rate law would you predict based on this mechanism?(b) Suppose that we carried out two initial rate experiments where, all other factors being held
constant, we doubled the concentration of the mercury (II) ion from one experiment to thenext. What effect would this have on the rate?
6 Wang and Konigsberger, Thermochim. Acta 310, 237 (1998).
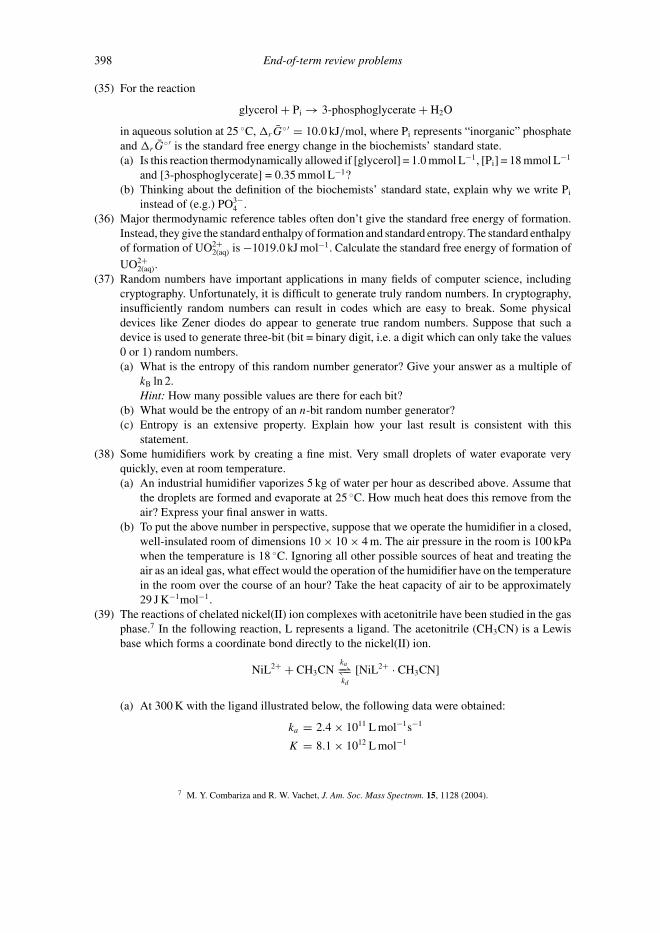
P1: SFK Trim: 247mm × 174mm Top: 14.586mm Gutter: 23.198mm
CUUK1808-APP-J CUUK1808/Roussel 978 1 107 00678 2 October 29, 2011 15:21
398 End-of-term review problems
(35) For the reaction
glycerol + Pi → 3-phosphoglycerate + H2O
in aqueous solution at 25 ◦C, �rG◦′ = 10.0 kJ/mol, where Pi represents “inorganic” phosphate
and �rG◦′ is the standard free energy change in the biochemists’ standard state.
(a) Is this reaction thermodynamically allowed if [glycerol] = 1.0 mmol L−1, [Pi] = 18 mmol L−1
and [3-phosphoglycerate] = 0.35 mmol L−1?(b) Thinking about the definition of the biochemists’ standard state, explain why we write Pi
instead of (e.g.) PO3−4 .
(36) Major thermodynamic reference tables often don’t give the standard free energy of formation.Instead, they give the standard enthalpy of formation and standard entropy. The standard enthalpyof formation of UO2+
2(aq) is −1019.0 kJ mol−1. Calculate the standard free energy of formation ofUO2+
2(aq).(37) Random numbers have important applications in many fields of computer science, including
cryptography. Unfortunately, it is difficult to generate truly random numbers. In cryptography,insufficiently random numbers can result in codes which are easy to break. Some physicaldevices like Zener diodes do appear to generate true random numbers. Suppose that such adevice is used to generate three-bit (bit = binary digit, i.e. a digit which can only take the values0 or 1) random numbers.(a) What is the entropy of this random number generator? Give your answer as a multiple of
kB ln 2.Hint: How many possible values are there for each bit?
(b) What would be the entropy of an n-bit random number generator?(c) Entropy is an extensive property. Explain how your last result is consistent with this
statement.(38) Some humidifiers work by creating a fine mist. Very small droplets of water evaporate very
quickly, even at room temperature.(a) An industrial humidifier vaporizes 5 kg of water per hour as described above. Assume that
the droplets are formed and evaporate at 25 ◦C. How much heat does this remove from theair? Express your final answer in watts.
(b) To put the above number in perspective, suppose that we operate the humidifier in a closed,well-insulated room of dimensions 10 × 10 × 4 m. The air pressure in the room is 100 kPawhen the temperature is 18 ◦C. Ignoring all other possible sources of heat and treating theair as an ideal gas, what effect would the operation of the humidifier have on the temperaturein the room over the course of an hour? Take the heat capacity of air to be approximately29 J K−1mol−1.
(39) The reactions of chelated nickel(II) ion complexes with acetonitrile have been studied in the gasphase.7 In the following reaction, L represents a ligand. The acetonitrile (CH3CN) is a Lewisbase which forms a coordinate bond directly to the nickel(II) ion.
NiL2+ + CH3CNka−⇀↽−kd
[NiL2+ · CH3CN]
(a) At 300 K with the ligand illustrated below, the following data were obtained:
ka = 2.4 × 10¹¹ L mol−1s−1
K = 8.1 × 10¹² L mol−1
7 M. Y. Combariza and R. W. Vachet, J. Am. Soc. Mass Spectrom. 15, 1128 (2004).
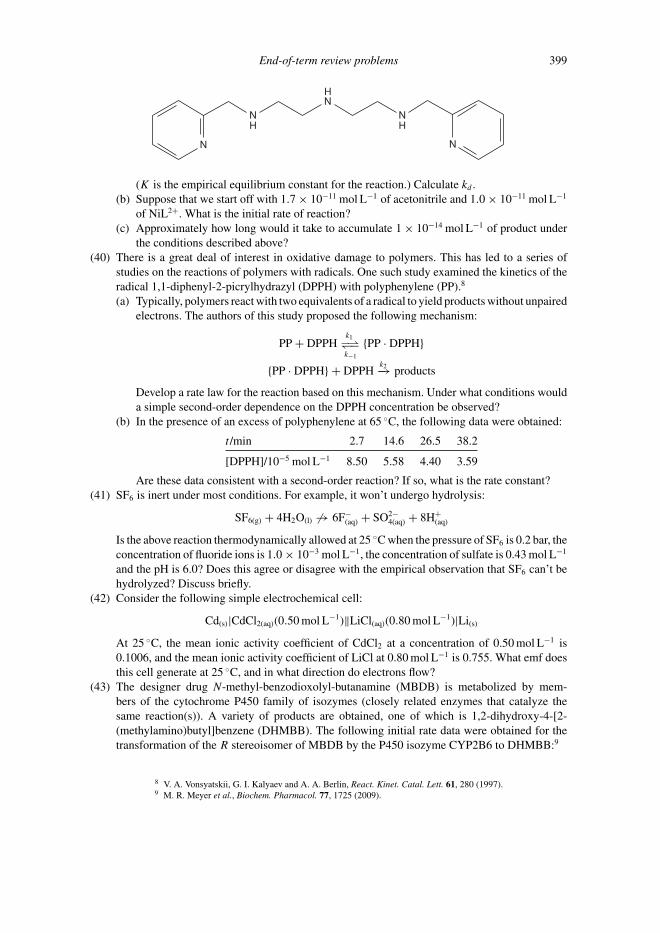
P1: SFK Trim: 247mm × 174mm Top: 14.586mm Gutter: 23.198mm
CUUK1808-APP-J CUUK1808/Roussel 978 1 107 00678 2 October 29, 2011 15:21
End-of-term review problems 399
H
N
NN
NHH
N
(K is the empirical equilibrium constant for the reaction.) Calculate kd .(b) Suppose that we start off with 1.7 × 10⁻¹¹ mol L−1 of acetonitrile and 1.0 × 10⁻¹¹ mol L−1
of NiL2+. What is the initial rate of reaction?(c) Approximately how long would it take to accumulate 1 × 10⁻¹⁴ mol L−1 of product under
the conditions described above?(40) There is a great deal of interest in oxidative damage to polymers. This has led to a series of
studies on the reactions of polymers with radicals. One such study examined the kinetics of theradical 1,1-diphenyl-2-picrylhydrazyl (DPPH) with polyphenylene (PP).8
(a) Typically, polymers react with two equivalents of a radical to yield products without unpairedelectrons. The authors of this study proposed the following mechanism:
PP + DPPHk1−⇀↽−k−1
{PP · DPPH}
{PP · DPPH} + DPPHk2−→ products
Develop a rate law for the reaction based on this mechanism. Under what conditions woulda simple second-order dependence on the DPPH concentration be observed?
(b) In the presence of an excess of polyphenylene at 65 ◦C, the following data were obtained:
t /min 2.7 14.6 26.5 38.2
[DPPH]/10−5 mol L−1 8.50 5.58 4.40 3.59
Are these data consistent with a second-order reaction? If so, what is the rate constant?(41) SF6 is inert under most conditions. For example, it won’t undergo hydrolysis:
SF6(g) + 4H2O(l) �→ 6F−(aq) + SO2−
4(aq) + 8H+(aq)
Is the above reaction thermodynamically allowed at 25 ◦C when the pressure of SF6 is 0.2 bar, theconcentration of fluoride ions is 1.0 × 10⁻³ mol L−1, the concentration of sulfate is 0.43 mol L−1
and the pH is 6.0? Does this agree or disagree with the empirical observation that SF6 can’t behydrolyzed? Discuss briefly.
(42) Consider the following simple electrochemical cell:
Cd(s)|CdCl2(aq)(0.50 mol L−1)‖LiCl(aq)(0.80 mol L−1)|Li(s)
At 25 ◦C, the mean ionic activity coefficient of CdCl2 at a concentration of 0.50 mol L−1 is0.1006, and the mean ionic activity coefficient of LiCl at 0.80 mol L−1 is 0.755. What emf doesthis cell generate at 25 ◦C, and in what direction do electrons flow?
(43) The designer drug N-methyl-benzodioxolyl-butanamine (MBDB) is metabolized by mem-bers of the cytochrome P450 family of isozymes (closely related enzymes that catalyze thesame reaction(s)). A variety of products are obtained, one of which is 1,2-dihydroxy-4-[2-(methylamino)butyl]benzene (DHMBB). The following initial rate data were obtained for thetransformation of the R stereoisomer of MBDB by the P450 isozyme CYP2B6 to DHMBB:9
8 V. A. Vonsyatskii, G. I. Kalyaev and A. A. Berlin, React. Kinet. Catal. Lett. 61, 280 (1997).9 M. R. Meyer et al., Biochem. Pharmacol. 77, 1725 (2009).

P1: SFK Trim: 247mm × 174mm Top: 14.586mm Gutter: 23.198mm
CUUK1808-APP-J CUUK1808/Roussel 978 1 107 00678 2 October 29, 2011 15:21
400 End-of-term review problems
[R-MBDB]/μmol L−1 v/mol min−1(mol enzyme)−1
21 0.6555 1.17
100 1.94132 2.01258 2.73452 2.73585 2.98845 3.02
(a) Calculate vmax and KM for this enzyme.(b) Rates (and therefore vmax values) in enzyme kinetics are often reported in units that are not,
strictly speaking, units of rate. This particular study is an example. In this case, given theunits in which we calculated vmax, we have actually obtained a different constant than whatwe would normally call vmax. Which constant do you have?
(44) In aqueous solution, the acridine homodimer (AcrH)
NH
NCl Cl
NH
N
)3222
OCH3 OCH3
)(CH 3NH(CH )4NH(CH
can exist either in an unfolded form or in a folded conformation where the two ring systemsstack on top of each other. The folded AcrH molecules can also form aggregates in which thering systems from different molecules interleave. Schematically, we have
1
2+
↼↼
↼↼
In this diagram, the heavy straight lines represent the ring systems, which we are viewingfrom the side. Further aggregation reactions are possible involving additional AcrH molecules.However, for the purposes of this question, we will assume that only these two reactions aresignificant.(a) Evstigneev and coworkers have measured the equilibrium constant for the folding process
(reaction 1) at 298 K and at 308 K.10 They found K298 = 42 and K308 = 26. Calculate(i) the standard enthalpy of reaction,
(ii) the standard free energy of reaction, and(iii) the standard entropy of reaction.Does the sign of the entropy change make sense? Explain briefly.
10 M. P. Evstigneev et al., J. Mol. Struct. 784, 162 (2006).

P1: SFK Trim: 247mm × 174mm Top: 14.586mm Gutter: 23.198mm
CUUK1808-APP-J CUUK1808/Roussel 978 1 107 00678 2 October 29, 2011 15:21
End-of-term review problems 401
(b) For the dimerization reaction (reaction 2), Evstigneev and coworkers found �rH◦ =
−32 kJ mol−1. Find the overall enthalpy change for the process which takes unfolded AcrHand creates the two-molecule aggregate.
(c) The equilibrium constant for reaction 2 at 298 K is 540. Suppose that we dissolve 5.0 ×10⁻⁴ mol L−1 of AcrH in water. At equilibrium at 298 K, what are the concentrations of theunfolded molecule, folded AcrH, and the two-molecule aggregate?Hint: You have three unknowns, so you need three equations. The first two equations shouldbe obvious. One way to get a third equation is to consider that the total amount of AcrH insolution is constant.
(45) Volatile organic compounds in the atmosphere can be oxidized by NO3, often yielding unde-sirable products (e.g. toxic compounds). These reactions often happen in water droplets ratherthan in the gas phase. Gaillard de Semainville and coworkers have studied the reactions of NO3
with some ketones, aldehydes and carboxylic acids in aqueous solution.11 In their experiments,NO3 was generated by laser flash photolysis.(a) In one set of experiments, peroxodisulfate anions (S2O2−
8 ) were photolyzed to SO−4 radical
ions using a laser flash at 351 nm. The SO−4 ions then reacted with nitrate ions to yield
sulfate ions and NO3. The reaction of NO3 with either a carboxylic acid or its conjugatebase was then followed spectroscopically by recording the absorbance of the solution at awavelength where NO3 absorbs strongly (632.8 nm).(i) Briefly explain how the laser flash photolysis experiment works, with specific reference
to this reaction system. Make sure to explain what solution(s) must be prepared. Do thereactions have to satisfy any special conditions in order for the measurements describedabove to give the rate of reaction of NO3 with an organic compound?
(ii) Suppose that the reaction of SO−4 with nitrate is diffusion-limited. Estimate the rate
constant of this reaction at 25 ◦C, assuming that the diffusion coefficients of SO−4 and
of nitrate are both about 2 × 10⁻⁹ m2 s−1, and that the radii of the two ions are bothabout 2 × 10⁻¹⁰ m.
(b) The reaction of NO3 with an organic compound in aqueous solution displays a simple ratelaw, v = k[NO3][R], where R stands for the organic reactant. NO3 is a highly reactiveradical, so it will typically react with other compounds in solution, yielding an additional“background” decay which obeys first-order kinetics. In these experiments, the organicreactant was present in great excess over the NO3 generated by flash photolysis. Explainwhy the data from these experiments would be consistent with a first-order rate law, and givean equation for the observed rate constant. Then show that the second-order rate constantfor the reaction of NO3 with R is the slope of a graph of the observed first-order rate constantvs. [R].
(c) The following data were obtained for the reaction of excess lactic acid (R) with NO3 at298 K:
[R]/μmol L−1 100 300 500 700 900
kobs/s−1 620 911 1091 1142 1535
Determine the second-order rate constant for the reaction of lactic acid with NO3.(d) The following second-order rate constants were recovered for the reaction of lactic acid
with NO3:
T /K 278 288 298 308 318
k/106L mol−1s−1 0.74 0.84 2.06 2.75 2.59
Determine the activation energy and preexponential factor of the reaction.
11 Ph. Gaillard de Semainville et al., Phys. Chem. Chem. Phys. 9, 958 (2007).
P1: SFK Trim: 247mm × 174mm Top: 14.586mm Gutter: 23.198mm
CUUK1808-APP-J CUUK1808/Roussel 978 1 107 00678 2 October 29, 2011 15:21
402 End-of-term review problems
(46) Consider the gas-phase reaction A + B → C. Sketch the probable entropy profile for thisreaction against the reaction coordinate. Label your sketch with the quantities �rS and�‡S.
(47) A classic demonstration involves putting some liquid nitrogen in a balloon, getting rid of as muchair as possible, sealing it (usually with a clip), and then watching the balloon expand as the liquidnitrogen evaporates. Typically, we put in a lot of liquid nitrogen and let the balloon explode.However, suppose that we have put just 5 mL of liquid nitrogen (density 0.8086 g mL−1) in aballoon of sufficient capacity that it doesn’t explode.(a) The boiling point of liquid nitrogen (i.e. the initial temperature) is 77.34 K. If we let the
nitrogen evaporate completely and return to room temperature (20 ◦C) at a constant externalpressure of 1 atm, what is the work done during this process? Is work done on or by thesystem?
(b) The enthalpy of vaporization of liquid nitrogen at its boiling point is 5.586 kJ mol−1. Themolar heat capacity of nitrogen gas (in J K−1mol−1) is given by the equation
Cp,m = A + BT + CT 2
where A = 28.3, B = 2.54 × 10⁻³, C = 5.4 × 10⁻⁵, and T is in kelvins. Calculate the heatgained by the nitrogen during this process.
(c) Calculate the change in internal energy of the nitrogen during this process.(48) Strontium is used in a number of applications, for instance as a component of alloys in structural
or magnetic materials, as a corrosion inhibitor in coatings and in fireworks, where it is oftenused for its red emission. The most important strontium ore is celestite (SrSO4). Like most ores,celestite is not a pure material, so the strontium needs to be separated from contaminants. Fur-thermore, the most convenient starting point for industrial applications is strontium carbonate.Strontium carbonate is much less soluble than strontium sulfate, so in principle we can makethe former by reacting the latter with (e.g.) a sodium carbonate solution:
SrSO4(s) + CO2−3(aq) → SrCO3(s) + SO2−
4(aq)
(a) Demonstrate how this overall reaction can be broken down into two coupled reactionsrelated to the solubility equilibria of strontium sulfate and of strontium carbonate, andtherefore why the relative solubilities of the two compounds determine the direction ofequilibrium.
(b) The solubility products of strontium sulfate and strontium carbonate at 25 ◦C are, respec-tively, 3.42 × 10⁻⁷ and 5.60 × 10⁻¹⁰. Calculate the equilibrium constant for the abovereaction.
(c) Calculate the standard free energy of formation of an aqueous strontium ion.(d) Using Debye–Huckel theory, calculate the solubility of strontium sulfate in water at
25 ◦C.(49) Consider the following table, which gives the results of a set of initial rate experiments for a
reaction with the stoichiometry A + B → P.
Experiment a/mol L−1 b/10−3mol L−1 v/10−3mol L−1s−1
1 0.10 1.4 0.312 0.20 1.4 1.243 0.10 2.1
(a) What is the order with respect to A?(b) In a separate set of experiments, it was determined that the order with respect to B is 1
2 .What reaction rate would you predict for experiment 3?

P1: SFK Trim: 247mm × 174mm Top: 14.586mm Gutter: 23.198mm
CUUK1808-APP-J CUUK1808/Roussel 978 1 107 00678 2 October 29, 2011 15:21
End-of-term review problems 403
(c) What is the value of the rate constant?(d) Could this reaction be elementary? Why or why not?
(50) Gallium nitride (GaN) is a solid semiconductor used in light-emitting diodes. Jacob and Rajithahave recently reviewed the available data on the thermodynamic properties of GaN.12 Theyfound that the standard free energy of formation of GaN over the temperature range was wellfit by the equation
�f G◦ = −131 530 + 117.4 T (J.1)
over the temperature range 800 to 1400 K, where �f G◦ is in J mol−1 and T is in K.(a) Over this temperature range, what is the standard enthalpy of formation of GaN?(b) What does the coefficient of T in Equation (J.1) represent?(c) At high temperatures, gallium nitride decomposes into its elements. Predict the temperature
above which this would happen when GaN is kept in 1 bar of N2.(d) Above what temperature would GaN decompose into its elements if kept in 20 bar of N2?
Does the difference between your answers to this and the previous question agree with LeChatelier’s principle? Explain briefly.Note: Gallium melts at 302.9 K and boils at 2477 K, so it is a liquid over the temperaturerange for which Equation (J.1) is valid.
(51) In a recent study, the electrochemistry of 1,5,2,4,6,8-dithiatetrazocine (R)
N
NS
N
NS
and its radicals was studied by EPR spectroscopy.13 In one experiment, the radical anion R•−
was generated electrochemically, then its decay was followed by monitoring the intensity of thecorresponding EPR signal, which is proportional to the concentration of the radical.(a) Is the formation of the radical anion from the neutral compound an example of oxidation
or reduction?(b) The radical anion can decay by one of at least two mechanisms:
1 R•− + R•− → R + R2−
2 R•− + S → R + S•−
where S is the solvent. Explain why these two elementary processes would be expected tolead to different rate laws. What law of chemical kinetics is involved? What simplification(s)arise due to the reaction conditions?
(c) The following data were obtained for the decay of the radical in dichloromethane,14 startingimmediately after the electrolytic current generating the radical had been turned off:
t /s 14.68 27.80 40.92 54.04 67.16 80.28
I 4.28 1.29 0.56 0.35 0.18 0.09
On the basis of these data, can you determine which of the above two mechanismsis the correct one? If so, also calculate the rate constant. Otherwise, explain what theproblem is.
12 K. T. Jacob and G. Rajitha, J. Cryst. Growth 311, 3806 (2009). 13 R. T. Boere et al., Inorg. Chem. 46, 5596 (2007).14 Thanks to Dr Tracey Roemmele for making the original data available.

P1: SFK Trim: 247mm × 174mm Top: 14.586mm Gutter: 23.198mm
CUUK1808-APP-J CUUK1808/Roussel 978 1 107 00678 2 October 29, 2011 15:21
404 End-of-term review problems
(52) Some enzymes have an inactive form that is in equilibrium with the active form, i.e. themechanism includes, along with the usual Michaelis–Menten reaction steps, a reversiblestep
Ek3−⇀↽−k−3
X
where X is the inactive form of the enzyme. Derive a rate law for catalysis of an isomerizationreaction S → P by an enzyme with this characteristic. Clearly identify vmax and KM.
(53) (a) The enzyme chorismate mutase catalyzes one reaction step in the biosynthesis of phenylala-nine and tyrosine in bacteria, fungi and plants. Kast, Asif-Ullah and Hilvert have measuredkcat for this enzyme at different temperatures, and obtained the following data:15
T/K 278 288 298 308 318
kcat/s−1 6.54 15.7 33.8 69.9 130
Calculate the activation energy and pre-exponential factor.(b) Calculate the entropy of activation at 25 ◦C. Assuming a simple Michaelis–Menten reaction,
what does the sign and/or value of the entropy of activation tell you about the reaction forwhich kcat is the rate constant?
(54) Aplysia dactylomela is a species of sea hare (a type of sea slug) that reproduces very rapidly. A.dactylomela’s diet consists of a variety of algae. In one set of lab experiments, A. dactylomelawas fed a diet of Cladophora, a green algae.16 The animals were weighed before the experiment,then again at the end. They were then dried in an oven. The percentage of the body weight thatwas water was assumed to be constant throughout the experiment, so the gain in dry weightcould be estimated. Any offspring produced were also dried and weighed. Finally, feces werecollected and dried. The dried animals, offspring and feces were analyzed by bomb calorimetryto determine their energy content. When dealing with whole animals, some percentage of thematerial is non-combustible, and shows up as ash after opening the calorimeter. Calculationsof metabolic energy are only concerned with the material that can be burned, so the non-combustible ash component, reported as a percentage of the dry mass, must be excluded fromthe mass of the biological materials in the calculations. The following data were obtained:
Duration of experiment: 14 daysEnergy content of food: 27.92 kcal
Animal Increase in dry mass: 2.21 gAsh: 33 %Specific combustion energy: 4.666 kcal (g ash-free material)−1
Offspring Dry mass: 0.39 gAsh: 31 %Specific combustion energy: 4.920 kcal (g ash-free material)−1
Feces Dry mass: 23.50 gAsh: 76 %Specific combustion energy: 3.220 kcal (g ash-free material)−1
How much energy did the animals use per day for metabolism (not counting energy stored inbiomass) and physical activity?
15 P. Kast, M. Asif-Ullah and D. Hilvert, Tetrahedron Lett. 37, 2691 (1996).16 T. H. Carefoot, J. Exp. Mar. Biol. Ecol. 5, 47 (1970).
P1: SFK Trim: 247mm × 174mm Top: 14.586mm Gutter: 23.198mm
CUUK1808-APP-J CUUK1808/Roussel 978 1 107 00678 2 October 29, 2011 15:21
End-of-term review problems 405
(55) Many marine organisms contain a substantial amount of calcium carbonate, either as a shell oras skeletal elements. Shells can be removed, but other skeletal elements are often less easy toseparate from the soft tissues. Moreover, depending on the diet of the organism, a substantialamount of calcium carbonate can end up in feces. When we carry out bomb calorimetry onmarine organisms or their feces, the following reaction occurs:
CaCO3(s) → CaO(s) + CO2(g)
This reaction does not correspond to any biological oxidation so, if we want to use calorimetryto calculate the amount of energy an organism has stored, the amount of calcium carbonate inthe sample must be analyzed, and a correction must be made to the raw calorimetric resultscorresponding to the heat of this reaction. Incidentally, such corrections are included in the datapresented in question54.(a) The initial and final temperatures in a bomb calorimeter are both close to 25 ◦C. Show that
this reaction is not thermodynamically allowed at this temperature in the presence of 39 Paof carbon dioxide (the atmospheric partial pressure of this gas). That being the case, why isthis reaction relevant anyway?
(b) Calculate the correction to the measured heat per gram of calcium carbonate in the sample.Explain briefly how you would use this correction. The molar mass of calcium carbonate is100.09 g mol−1.
(56) Suppose that we wanted to add chlorine to a molecule and that we thought we could initiatethe reaction by breaking the Cl2 bond. The bond enthalpy (the enthalpy change for the reactionCl2(g) → 2Cl(g)) is 242 kJ mol−1 at 298.15 K.(a) Enthalpy is heat at constant pressure, but photons aren’t “heat” in any reasonable sense of
the word. It is better to think of them as bundles of energy. Calculate the bond energy forchlorine.
(b) Calculate the frequency of a photon that can break the Cl2 bond. To which spectral regiondoes this frequency correspond?
(57) Hemoglobin (Hb) is the major oxygen carrier in the blood of vertebrates. It is made up of twoα and two β subunits (i.e. two copies of each of two different kinds of metalloproteins). Eachof the four subunits can carry one oxygen molecule. The equilibrium constants for binding ofoxygen to human hemoglobin at 21.5 ◦C and pH 7 are as follows:17
Hb(aq) + O2(aq) � HbO2(aq) K1 = 9.32 × 10³
HbO2(aq) + O2(aq) � Hb(O2)2(aq) K2 = 2.10 × 10⁵
Hb(O2)2(aq) + O2(aq) � Hb(O2)3(aq) K3 = 9.07 × 10³
Hb(O2)3(aq) + O2(aq) � Hb(O2)4(aq) K4 = 6.60 × 10⁵
(a) Calculate the standard free energy of reaction for the first binding step at 21.5 ◦C.(b) From experiments carried out with purified subunits under conditions where they do not
associate, it is known that the equilibrium constants for binding of oxygen to isolated α andβ subunits are both similar to K1 and K3. If the subunits did not interact with each other, allfour equilibrium constants for binding of oxygen to hemoglobin would also be similar to K1
and K3. The larger equilibrium constants in steps 2 and 4 are examples of cooperativity,where binding of a ligand (in this case, oxygen) to a multi-subunit protein alters the affinityof the protein for the ligand at additional binding sites.
(i) What is the free energy change for the overall reaction for the first two steps, Hb(aq) +2O2(aq) � Hb(O2)2(aq)? Call this quantity �r(57(b)i)G
◦m.
17 Q. H. Gibson, J. Biol. Chem. 245, 3285 (1970).

P1: SFK Trim: 247mm × 174mm Top: 14.586mm Gutter: 23.198mm
CUUK1808-APP-J CUUK1808/Roussel 978 1 107 00678 2 October 29, 2011 15:21
406 End-of-term review problems
(ii) Suppose that there was no cooperativity, i.e. that the equilibrium constant for bindingoxygen was the same in step 2 as in step 1. What would the free energy change befor the overall reaction Hb(aq) + 2O2(aq) � Hb(O2)2(aq) in this case? Call this quantity�r(57(b)ii)G
◦m.
(iii) The difference between these two values, i.e. �r(57(b)i)G◦m − �r(57(b)ii)G
◦m, is the free
energy of cooperativity, i.e. the free energy decrease due to the cooperative binding.Calculate this quantity.
(c) Now consider a solution containing hemoglobin in which there is a large excess of oxygen ata concentration of 300 μmol L−1. Using the equilibrium relationships, show that almost allof the hemoglobin will be in the fully oxygenated form (Hb(O2)4(aq)) under these conditions.Note: While you need to do a few calculations, you don’t have to be precise about theexpected fraction that will be in the fully oxygenated form, provided you explain clearlyhow the numbers indicate that this form will be strongly dominant.
(d) Would the fully oxygenated form still be overwhelmingly dominant if all the equilibriumconstants were similar to K1 and K3, i.e. if there was no cooperativity? Explain briefly.
(58) Barbital (5,5-diethylbarbituric acid, C8H12N2O3) is a diprotic acid. Barbital was once sold as asleeping aid, although it has gone out of use due to the risk of accidental overdoses.(a) For the dissociation of the first proton, the apparent (i.e. not considering non-ideal effects) Ka
in aqueous solution is18 1.26 × 10⁻⁸ at 25 ◦C and an ionic strength of 0.002 mol L−1. Whatis the value of the thermodynamic equilibrium constant? Assume that the undissociatedacid behaves ideally.
(b) At an ionic strength of 2.00 mol L−1, the apparent Ka is 2.75 × 10⁻⁸. What is the meanionic activity coefficient at this ionic strength?
(59) Hans-Jurgen Hinz and his group in Munster have been studying the formation of DNA doublestrands using short (12-base) complementary single-stranded sequences.(a) In one set of experiments, they studied the binding equilibrium for the following comple-
mentary sequences:19
5′-TAG GTC AAT ACT-3′
3′-ATC CAG TTA TGA-5′
The following data were obtained:
T/◦C 10 15 20 25
K/108 3.19 2.82 2.25 1.10
Calculate the standard enthalpy, entropy, and free energy of reaction.(b) Discuss the sign and size of the entropy of reaction.(c) Calculate the equilibrium concentrations of single and double strands at 25 ◦C in an exper-
iment starting with 4 μmol L−1 of each single strand.(d) In another set of experiments, they studied the kinetics of double-strand formation by
stopped-flow kinetics for the following complementary pair:20
5′-ATC CTC AAT ACT-3′
3′-TAG GAG TTA TGA-5′
Briefly explain how a stopped-flow apparatus would be used to study this reaction.(e) Neglecting the reverse reaction, what rate law would you expect, assuming that double-
strand formation is an elementary reaction? How would this rate law simplify if the initialconcentrations of the two single strands were equal?
18 M. E. Krahl, J. Phys. Chem. 44, 449 (1940). 19 E. Carrillo-Nava et al., J. Phys. Chem. B, 114, 16087 (2010).20 E. Carrillo-Nava et al., Biochemistry, 47, 13153 (2008).

P1: SFK Trim: 247mm × 174mm Top: 14.586mm Gutter: 23.198mm
CUUK1808-APP-J CUUK1808/Roussel 978 1 107 00678 2 October 29, 2011 15:21
End-of-term review problems 407
(f) When the stopped-flow experiments were carried out at different temperatures in a phosphatebuffer at pH 7.0, the following rate constants were obtained:
T/◦C 10 15 20 25 30 35
k/106 L mol−1s−1 1.092 1.340 1.591 1.864 1.951 2.269
Calculate the activation energy and preexponential factor.(g) Neglecting the reverse reaction, starting with 4 μmol L−1 of each single strand, how long
would it take before 80% of the single strands were bound into double strands at 35 ◦C?(h) Calculate the enthalpy, entropy, and free energy of activation at 25 ◦C.(i) Does the sign of the entropy of activation agree with your expectations? Discuss briefly.(j) Sketch the free energy profile of the reaction, i.e. how the free energy varies going from
reactants to products. Label your graph with the values of the free energies calculated in pre-vious parts of this question, assuming that there are only small differences in thermodynamicproperties between one pair of sequences and the other.
(60) In the section on enzyme kinetics, we focused our attention on single-substrate reactions.Of course, there are lots of two-substrate reactions out there. The kinetics of multi-substratereactions is complicated by the question of the order in which the substrates bind. Some enzymescan bind the substrates in either order, while others can only bind the substrates in a particularorder. Work out the rate law for the following ordered two-substrate reaction:
E + Ak1−⇀↽−k−1
C1
C1 + Bk2−⇀↽−k−2
C2k−3−→ E + P
Try to write your final rate law in a form similar to the Michaelis–Menten form.

P1: SFK Trim: 247mm × 174mm Top: 14.586mm Gutter: 23.198mm
CUUK1808-APP-K CUUK1808/Roussel 978 1 107 00678 2 October 31, 2011 6:58
Appendix K
Answers to exercises
Exercise group 2.1
(1) 0.61 mol(2) p = 7.71 × 10⁻²⁴ kg m s−1, K = 3.14 × 10⁻²² J(3) E = 5.81 × 10⁻¹⁹ J, ν = 8.77 × 10¹⁴ Hz, λ = 342 nm, ultraviolet
Exercise group 2.2
(1) 4.945 × 10⁻¹¹ m(2) λ = 4 × 10⁻¹⁰ m. The question of whether quantum effects are important or not reduces to
deciding whether this is a large or a small number. This in turn depends on what kind ofexperiment we have in mind. If, for instance, we wanted to hold a helium atom in a nanometer-sized atom trap, then quantum effects would be important, since the wavelength is a signifi-cant fraction of the size of the trap. If, on the other hand, we wanted to study a helium gasin a large container (several centimeters across, say), then we might conclude that quantummechanical effects are unimportant, since the wavelength is so much smaller than the size of thecontainer.
Exercise group 2.3
(1) 2.93 × 10−71 J. Small doesn’t even begin to describe this number.(2) n = 8 × 10⁷, �E = 5 × 10⁻²⁹ J. Since the gap between energy levels is much, much smaller
than the kinetic energy, the energy will behave like a continuous variable so we don’t expectquantum effects to be important.
Exercise group 2.4
(1) 121.5684 nm(2) (a) 1
2 hν0. (b) Ephoton = hν0�v. (c) ν0 = 3.598 × 10¹³ Hz. (d) 2400 cm−1.
Review exercise group 2.5
(1) There must be two energy levels in the molecule separated by the energy of the photon, i.e. byhc/λ.
(2) Energy: 1.62 × 10⁻²⁴ J; wavelength: 0.122 m; wavenumber: 8.17 m−1
(3) 5.807 × 10⁻¹⁵ m. This is a tiny wavelength, smaller than typical atomic dimensions by five ordersof magnitude, so quantum effects are not going to be significant in most experiments. However,
408

P1: SFK Trim: 247mm × 174mm Top: 14.586mm Gutter: 23.198mm
CUUK1808-APP-K CUUK1808/Roussel 978 1 107 00678 2 October 31, 2011 6:58
Answers to exercises 409
LUMO
n = 0
n
n
= ±1
= ±2
HOMO
Figure K.1 Particle-on-a-ring model of benzene, with π electrons placed in lowest-energy orbitals.
this wavelength is similar to the size of a nucleus, so quantum effects might be important inexperiments where we shoot α particles at nuclei (e.g. Rutherford’s gold foil experiment).
(4) (a) 2πr = nλ, where n is an integer
(b) En = n2h2
8π 2mr2
(c) Lz = nh/(2π )(d) See Figure K.1.(e) 1.28 × 10⁻¹⁰ m(f) 1.28 × 10⁻¹⁰ m. The bond length is actually 1.395 × 10⁻¹⁰ m. The agreement isn’t bad for a
crude model!
Exercise group 3.1
(1) 49.9988% at 20 ◦C, 49.9985% at −30 ◦C(2) (a) The probability of a particular molecule being at altitude h is given by P (h) ∝
exp(−Ep/(kBT )) = exp(−mgh/(kBT )). If we have a large number of molecules, weget N (h) = NtotalP (h) ∝ exp(−mgh/(kBT )). This proportionality still holds if we con-sider a particular volume and divide by this volume, and p ∝ N/V , so p/p0 =exp(−mgh/(kBT ))/e0 = exp(−mgh/(kBT )).
(b) Substitute kB = R/L and m = M/L into the barometric formula.(c)
h/m 920 1900 3660
pO2/atm 0.18 0.16 0.13(d) 0.980%, vs a sea-level abundance of 1.06%.
(3) (a) P (E2) = 4
exp [ε/(kBT )] + 4. (b) In terms of the reduced temperature, we have P (E2) =
4
exp(1/θ ) + 4. The percentage denatured would be 100P (E2). The denaturation curve is shown
in Figure K.2. (c) We can’t give an exact number for this temperature, but any answer nearθ = 0.2 or 0.3 would be reasonable. (d) 20%.
Exercise group 3.2
(1) ν0 = 8.6456 × 10¹³ Hz(2) 9(3) (a) All four. (b) 0.0096.

P1: SFK Trim: 247mm × 174mm Top: 14.586mm Gutter: 23.198mm
CUUK1808-APP-K CUUK1808/Roussel 978 1 107 00678 2 October 31, 2011 6:58
410 Answers to exercises
0
20
40
60
80
100
0.001 0.01 0.1 1 10 100 1000
Per
cent
den
atur
ed
θ
Figure K.2 Denaturation curve for a four-residue peptide with hydrophobic end residues on a lattice
Exercise group 3.3
(1) 1.6 × 10⁻⁴ mol L(2) (a) 7.19 × 10⁻⁵ mol. (b) 1.1 × 10⁵ L mol−1cm−1.(3) (a) Suppose that the graph is convex, i.e. that it deviates downward from the line of best fit
obtained at low concentrations. Then the apparent molar absorption coefficients would decreasewith increasing concentration. The reverse would be true for a concave graph. These coefficientswould not be of any real use. The correct procedure then would be to treat the A vs. c curve as anempirical relationship and to interpolate on this curve to estimate concentrations from absorbancemeasurements. (b) (i) The four concentrations are 3.0 × 10⁻⁴, 5.95 × 10⁻⁴, 8.92 × 10⁻⁴ and1.19 × 10−3. (ii) 454 L mol−1cm−1.
(4) (a) [Chl a] = 0.00605 g L−1, [Chl b] = 0.00182 g L−1; 3.02 mg Chl a, 0.908 mg Chl b; 29.1 mgChl a/g, 8.73 mg Chl b/g
(b)ελ/L mol−1cm−1
643 nm 660 nm
Chlorophyll a 1.46 × 10⁴ 9.11 × 10⁴
Chlorophyll b 5.22 × 10⁴ 4.08 × 10³
Exercise group 3.4
(1) (a) ε-ATP is the donor, and FITC is the acceptor. (b) 3.8 nm(2) FRET is most sensitive to distance when R ∼ R0. The only dye in this set that satisfies this
condition is DPH.(3) (a) Protein without lipid: 23 A; protein with lipid: 42 A. (b) The two helices involved in this
experiment are close together (probably packed against each other) in the absence of lipid.Binding to a lipid induces a conformational change that moves these two helices apart.
Review exercise group 3.5
(1) (a) The dipole moment of O2 is identically zero. This frequency could have been measuredby observing vibrational bands in the UV spectrum. Alternatively, it could have been done byRaman spectroscopy, a scattering technique not discussed in this book. (b) Somewhere around1000–2000 K. (There’s no point trying to be too precise here since the question isn’t very precise.)
(2) (a) The energy level spacing between levels 1 and 2 is 2.84 × 10⁻¹⁹ J. (b) T = −8926 K. Thetemperature calculated this way is negative. We are used to thinking of the Kelvin scale as starting

P1: SFK Trim: 247mm × 174mm Top: 14.586mm Gutter: 23.198mm
CUUK1808-APP-K CUUK1808/Roussel 978 1 107 00678 2 October 31, 2011 6:58
Answers to exercises 411
at zero. Note that a negative temperature is actually hotter than any normal temperature since,to return to equilibrium with surroundings of any given positive temperature, we would have toreturn the system to a Boltzmann distribution in which there were more molecules in the groundstate than in the excited state, which means that the system would have to release energy. This is,to say the least, an unintuitive property of our usual absolute temperature scale.
(3) Fluorescence intensities depend on a number of details of the environment, such as the presenceof quenchers. Moreover, the fluorescence intensity depends on the intensity of the excitingradiation. In order to reproducibly get the same intensities, we have to use the same spectrometer,and identically prepared solutions.
Exercise group 5.1
(1) 2.25 u
Exercise group 5.2
(1) −911 J(2) 1.3 × 10⁵ J. The work is positive, which indicates that work is being done on the system.(3) (a) −29 kJ. The negative sign tells us that work is done by the system, i.e. that the system expends
energy in the form of work. (b) The mass is raised by 1.3 km.(4) (a) −222 J. (b) −151 J. (c) −181 J.
(5) (a) w = −nRT ln
(Vf − nb
Vi − nb
)− n2a
(1
Vf
− 1
Vi
). (b) −2.713 MJ. (c) −2.740 MJ. Whether the
extra work was worth the effort will very much depend on how accurately we needed the answer.For most purposes, the ideal gas result would be accurate enough.
(6) 0.2 J mol−1. The work is tiny, especially when we consider the enormous change in pressure.Ignoring pressure-volume terms for solids should therefore be safe.
Exercise group 5.3
(1) According to the First Law of Thermodynamics, energy cannot be created, only transformed.The electric energy generated in the induction coil came from the magnetic fields produced bythe power lines and thus ultimately from the electric energy generated by the power company.He was therefore stealing energy from the electric company.
Exercise group 5.4
(1) 4.3 h(2) 639 ◦C(3) (a) 147 J. (b) The error in using a constant heat capacity is negligible.(4) (a) 4.2 s. (b) 19 ◦C.
Exercise group 5.5
(1) Um = −Lε exp(ε/(kBT )) (exp(ε/(kBT )) + 4)−1 .CV,m/R = 4ε2
k2BT 2
exp(ε/(kBT ))(
exp(ε/(kBT ))
+ 4)−2 = 4
θ2exp(1/θ) (exp(1/θ ) + 4)2. The result is shown in Figure K.3.
Exercise group 5.6
(1) 1.33 mol of liquid water and 0.67 mol of steam at 100 ◦C(2) 106 g

P1: SFK Trim: 247mm × 174mm Top: 14.586mm Gutter: 23.198mm
CUUK1808-APP-K CUUK1808/Roussel 978 1 107 00678 2 October 31, 2011 6:58
412 Answers to exercises
0
0.2
0.4
0.6
0.8
1
1.2
1.4
0.001 0.01 0.1 1 10 100 1000
CV,
m/R
θ
Figure K.3 Heat capacity of a four-residue peptide with hydrophobic end residues on a lattice
(3) cp = 0.491 J K−1g−1 and Tf = 1240 K (I got this number by careful measurement from thegraph. Any answer within 10 degrees or so of this number would be reasonable.)
(4) (a) 694 kJ. (b) 14 ◦C.
Exercise group 5.7
(1) 296.8 K(2) 49 kJ mol−1
(3) (a) −206.61 kJ mol−1. (b) 59 g.(4) (a) 0.002 10 mol. (b) 0.0126 mol. (c) 11.5 breaths min−1. (d) −585 J
Exercise group 5.8
(1) −57.53 kJ mol−1
(2) −220 kJ mol−1
Exercise group 5.9
(1) (a) −1299.58 kJ mol−1. (b) −1295.86 kJ mol−1.(2) The balanced reaction is
CH2O(s) + O2(g) → CO2(g) + H2O(l)
Since solids and liquids have small molar volumes and are nearly incompressible, �Hm = �Um +� (pVm) ≈ �Um + RT �νgas where �νgas is the change in the number of gaseous moleculesduring the reaction. In the case of the combustion of carbohydrates, �νgas = 0 so �H ≈ �U .
(3) 134.46 kJ mol−1 of heat produced(4) (a) −108.56 kJ mol−1. (b) −19.01 kJ.(5) 2.4 g(6) (a) 10.37 kJ/K. (b) −5673 kJ mol−1. (c) �f H ◦(C12H22O11, s = −2194 kJ mol−1, a value in rea-
sonable agreement, for a single experiment, with that given in the appendix.(7) (a) −203 kJ mol. (b) 1.7 mol L−1. (c) 174.5 kJ mol−1.
Exercise group 5.10
(1) −2032 kJ/mol(2) 142 kJ/mol

P1: SFK Trim: 247mm × 174mm Top: 14.586mm Gutter: 23.198mm
CUUK1808-APP-K CUUK1808/Roussel 978 1 107 00678 2 October 31, 2011 6:58
Answers to exercises 413
(3) −5634 J mol−1
(4) The enthalpy of reaction is −2801.61 kJ mol−1 at 25 ◦C and −2798.24 kJ/mol at 37 ◦C. Thedifference (about 0.1%) is negligible for most purposes.
(5) −144.1 kJ mol−1
Exercise group 5.11
(1) mprotein = 19 g, with a metabolic energy equivalent of 86 kcal or approximately 362 kJ(2) (a) 32 days. (b) 30 days.(3) (a) 2.96 Mcal. (b) 11 kcal.(4) 15 kJ(5) All other things being equal, the fat rat gains weight because he doesn’t generate as much heat.(6) 0.21 g(7) (a) 172 kJ. (b) 4.3 g.(8) 35 h(9) 177 kcal
Review exercise group 5.12
(1) In the following, words in parentheses are optional (a) molar (internal) energy (change) ofcombustion. (b) constant-volume heat capacity. (c) specific enthalpy (change) of reaction.
(2) (a) Mass of sample and temperature change. (b) To obtain the calorimeter’s heat capacity.(c) The specific (or molar) internal energy change.
(3) Heat isn’t a state function, so it doesn’t make sense to talk of “the change in heat”. To put itanother way, bodies don’t contain heat so the heat evolved during a process can’t be thought ofas the change of a property.
(4) 0.499 J K−1g−1
(5) (a) 351 kJ. (b) The dependence of the heat capacity on T can’t be ignored over a temperaturerange of 1400 K so the answer given above won’t be very accurate. We need to know how Cp,m
depends on T . Then we could calculate the heat by
q = n
∫ 1693 K
293Cp,m dT
(6) �T = 33.5 K. This is not so large a temperature change as to make this process very dangerous(the final temperature will be well below the burn temperature for human skin), but it will clearlybe necessary to stir the solution as we go to avoid creating hot spots due to slow diffusion of theheat away from the site of dissolution.
(7) (a) −793.1 kJ mol−1. (b) The heat capacities of the reactants and products were assumed to beindependent of temperature. However, over the large temperature range studied (over 900 K),this is not a particularly good approximation. (c) −793.1 kJ mol−1.
(8) 36 ◦C(9) −13 kJ
(10) 26 ◦C(11) −108.95 kJ mol−1
(12) �f H ◦(NO3−, aq) = −207 kJ mol−1; �f H ◦(NaNO3, s) = −467 kJ mol−1
(13) 15 300 t h−1.(14) 50.9 kJ mol−1
Exercise group 6.1
(1) �S = 0
(2) �S = qrev
T

P1: SFK Trim: 247mm × 174mm Top: 14.586mm Gutter: 23.198mm
CUUK1808-APP-K CUUK1808/Roussel 978 1 107 00678 2 October 31, 2011 6:58
414 Answers to exercises
(3) 20 J K−1mol−1
(4) 3.0 J K−1
(5) (a) 35.7 kJ mol−1. (b) 87.5 J K−1mol−1.
Exercise group 6.2
(1) �Ssystem,m = −109.0 J K−1mol−1, �Ssurroundings,m = 138.8 J K−1mol−1. The entropy change of theuniverse is therefore positive so the process is thermodynamically allowed.
(2) �Sglass = 116.92 J K−1 and �Sroom = −122.80 J K−1, therefore �Suniverse = −5.88 J K−1 < 0,indicating a process which cannot occur.
(3) �S < 0, �U = 0(4) (a) 6.1 ◦C. (b) 0.29 J K−1. The Second Law says that that entropy change for a thermodynamically
allowed adiabatic process should be positive. Since temperature equilibration is a spontaneousprocess, this result is consistent with the Second Law.
(5) The reaction has a certain entropy change �rS. The reaction is exothermic so it will heat thecontents of the adiabatic container, resulting in an entropy increase �heatS. Since the reactionis spontaneous, the Second Law requires that �heatS + �rS > 0, i.e. that �rS > −�heatS. Notethat �heatS > 0 so that we cannot determine the sign of �rS from this argument.
Exercise group 6.3
(1) In order to determine whether or not a process is thermodynamically allowed, we must computethe change in entropy of the Universe, not just of the system. Most mixing processes are non-ideal; the particles interact so heat can be generated in the mixing process. If qmix > 0 (i.e. heatflows into the system under isothermal conditions), then the surroundings must lose entropy tosupply the heat needed. If this loss is greater than the gain in entropy of the system on mixing,the net change in entropy of the universe is negative and the process in not thermodynamicallyallowed.
(2) The entropy of mixing is maximized when X1 = X2 = 12 .
Exercise group 6.4
(1) (a) kB ln 4. (b) We see here a very clear illustration of entropy as a measure of our ignorance.The number of microstates is purely a function of our lack of knowledge of anything but thetotal amount which our friend has in his pocket. (c) If we knew that one of the coins was a 5¢piece, then two of the above possibilities would be eliminated and the entropy would decrease(to kB ln 2) as our knowledge of the system increased.
(2) The number of molecules increases during the reaction. This represents an increase in the numberof microstates so the entropy of the system increases.
(3) The reaction uses up a gas and forms a crystalline solid. The product has fewer microstates thanthe reactants so the decreases.
(4) The entropy would be the same in both cases. In the first case, we would need to figure out howmany ways we can put N/10 molecules on N sites. In the second case, we could tell ourselvesthat we are choosing the N/10 unoccupied sites. Either way, the number of configurations isexactly the same.
(5) (a) 520. (b) We would calculate a larger number of conformations for the unfolded state.
Exercise group 6.5
(1) 200.093 J K−1mol−1
(2) 279.1 J K−1mol−1
(3) �heatingS = 34.9 J K−1mol−1, �fusS = 9.68 J K−1mol−1

P1: SFK Trim: 247mm × 174mm Top: 14.586mm Gutter: 23.198mm
CUUK1808-APP-K CUUK1808/Roussel 978 1 107 00678 2 October 31, 2011 6:58
Answers to exercises 415
(4) (a) The reaction is 2H+(aq) + CO2−
3(aq) → H2O(l) + CO2(g). Ions tend to organize polar solventmolecules, so the reactant side is more organized (has fewer microstates) than might first appear.The product side includes a gas, which has a lot of microstates. We would therefore expect theentropy to increase in this reaction. (b) 333.7 J K−1mol−1.
(5) 14.897 53 J K−1mol−1
Exercise group 6.6
(1) (a) 2 MW. (b) 500 K.(2) 29 kW(3) (a) 19 MW. (b) 3376 kJ kg−1. (c) 5.6 kg s−1. (c) 0.66 kg s−1.(4) (a) 1.70 × 10⁹ m3. (b) 286 MW. (c) 6.69 × 10⁸ m3 day−1. (d) Suppose that we can only get 30%
efficiency from the electrical generator instead of the roughly 60% efficiency you would calculatefrom the operating temperatures. We would have to use roughly twice as much fuel to generatethe same amount of electricity. However, in a cogeneration plant, the extra heat generated byburning the additional fuel replaces heat that would otherwise have had to have been generatedin a furnace or boiler. If the cogeneration plant and furnace or boiler use the same fuel, then theefficiency of the electrical generator makes very little difference in terms of input costs. (It mightmake a difference in terms of operating profits depending on the price of electricity.) By contrast,in a conventional power plant, any extra fuel that has to be burned due to low efficiency is justwasted.
Exercise group 6.7
(1) 255 kJ(2) 19 W
Review exercise group 6.8
(1) p, S and U
(2) 210.21 J K−1mol−1
(3) The Second Law says that the entropy of the Universe always increases. The argument givenonly considers the entropy change of the substance being frozen and not of its surroundings.A substance can be frozen if the sum of these two contributions to the entropy change of theUniverse is positive.
(4) Entropy of vaporization is the entropy change in the process liquid → gas. Thus, �vapS =S(gas) − S(liquid). A high entropy of vaporization could therefore be the result of one of twothings: (1) the entropy of the gas could be unusually large, or (2) the entropy of the liquid couldbe unusually small. I can’t think of any reason why (1) would be true for water. However, (2)is quite clearly true for water; water forms strong hydrogen bonds which result in a substantialdegree of organization, and thus a low entropy.
Based on this argument, you would expect that other compounds which form strong hydrogenbonds (alcohols, carboxylic acids, . . . ) would also have large entropies of vaporization. Thisturns out to be true.
(5) (a) The reaction is
CH3CH2OH(l) + 3O2(g) → 2CO2(g) + 3H2O(l)
There is a decrease in the number of moles of gas. Moreover, ethanol can form only onehydrogen bond while three water molecules can be involved in multiple hydrogen bondinginteractions. Both of these factors indicate an increase in the organization of the productsrelative to the reactants and so a decrease in entropy.

P1: SFK Trim: 247mm × 174mm Top: 14.586mm Gutter: 23.198mm
CUUK1808-APP-K CUUK1808/Roussel 978 1 107 00678 2 October 31, 2011 6:58
416 Answers to exercises
(b) −138.71 J K−1mol−1.(c) We would have to adjust the entropies of the reagents and products to the new temperature.
This is done by adding the entropy at 25 ◦C to the change in entropy associated with heatingeach substance to 500 ◦C. For water and ethanol, we would need to calculate the change inentropy on warming the liquid to the boiling point, the entropy of vaporization at the boilingpoint and the change in entropy on warming the vapor to the final temperature. For oxygenand carbon dioxide, we would only need to calculate the entropy change on warming thesegases from 25 ◦C to 500 ◦C. Accordingly, we would need the following data:• the entropies at 25 ◦C (from the table)• the boiling temperatures of water and of ethanol• the heats of vaporization of water and of ethanol at their respective boiling points• the specific heat capacities of ethanol and water in both the liquid and vapor phases, of
oxygen and of carbon dioxide
Exercise group 7.1
(1) If q > 0, then �S ≥ q/T > 0.(2) If q < 0, �S can be either positive or negative and still satisfy the Clausius inequality.(3) (a) −2.24 kJ mol−1. (b) No process can produce more work than an equivalent reversible process.
The claim that the machine produces 3.5 kJ mol−1 is in error. Your friend shouldn’t invest.
Exercise group 7.2
(1) �G = −nRT ln (V2/V1)
Exercise group 7.3
(1) �G = �A + �(pV ) in general. �G = �A − wp at constant p.
Exercise group 7.4
(1) �rG◦ = −1325.5 kJ mol−1 < 0 therefore the reaction is thermodynamically allowed.
(2) (a) 118.89 J K−1mol−1. (b) 188.84 J K−1mol−1.(3) −92.1 J K−1mol−1
(4) −150.720 kJ mol−1
Exercise group 7.5
(1) For this reaction,
Q = aP
aA aH2O
Note that aH2O = XH2O. Adding an inert salt to the solution decreases the activity of water, whichincreases Q. Since
�rGm = �rG◦m + RT ln Q
increase Q can only make the free energy change more positive, and thus cannot make thereaction thermodynamically allowed.
(2) �rGm = −111.24 kJ mol−1 < 0 so the reaction is thermodynamically allowed.(3) The free energy change for the reaction Pb2+
(aq) + SO2−4(aq) → PbSO4(s) under the stated conditions
is −18.93 kJ mol−1, which is negative, so a precipitate will form.

P1: SFK Trim: 247mm × 174mm Top: 14.586mm Gutter: 23.198mm
CUUK1808-APP-K CUUK1808/Roussel 978 1 107 00678 2 October 31, 2011 6:58
Answers to exercises 417
(4) (a) −4.15 MJ kg−1. (b) 23 kJ.(5) 116 MJ
Exercise group 7.6
(1) �rGm = −2859.2 kJ mol−1, so the maximum work is 2859.2 kJ mol−1. In Example 7.3, wecalculated that at 25 ◦C, �rGm = −2859.31 kJ mol−1. The two values are extremely close.
(2) (a) For the reaction B2H6(g) + 3Cl2(g) → 2BCl3(l) + 3H2(g), �rG = −880 kJ mol−1. Since thisis negative, the reaction is thermodynamically allowed. (b) At the new temperature, �rG =−881 kJ mol−1, which is still negative, so the reaction is still thermodynamically allowed.
(3) wmax = 54 J; hmax = 5.5 m
Review exercise group 7.7
(1) The activity of the solvent is its mole fraction. Except for very concentrated solutions, the molefraction of the solvent is usually very close to unity.
(2) �G gives the maximum non- pV work.(3) Solids and liquids are incompressible. Therefore, �H = �U + �(pV ) ≈ �U . It follows then
that �G = �H + �(T S) ≈ �U + �(T S) = �A.(4) (a) 213 kJ mol−1. (b) 193 kJ mol−1.(5) 7.0 km(6) (a) −491.5 kJ mol−1. (b) This quantity is related to the heat capacity: H ◦
m(298.15 K) −H ◦
m(0 K) = ∫ 298.15 K0 Cp,m dT (assuming that there are no phase transitions between 0 and
298.15 K).(7) The Gibbs free energy change under the stated conditions is −20.98 kJ mol−1. Since the free
energy change is negative, the reaction would be thermodynamically allowed. There is thereforeno thermodynamic reason why this would not work.
(8) �rSm = �rS◦m − R ln Q
(9) 34.4 kJ mol−1
(10) (a) −401 kJ mol−1. (b) The sodium/sulfur battery has the larger energy storage capacity, by afactor of more than two. (c) Solids have unit activity, except under very unusual circumstances.Accordingly, �rG = �rG
◦ as long as we have any reactants left. If any of the reactants orproducts were, for instance, solutes, then the work produced per mole consumed would changeas the battery discharges. We would somehow have to integrate the work over these changingconditions.
Exercise group 8.1
(1) 9.97 × 10⁻¹⁵
(2) Using standard methods, we find a solubility of 483 mol L−1. This absurdly large number meansthat nickel chloride is extremely soluble in water, although clearly the level of theory studied inthis course is not adequate to determine exactly how soluble it is.
(3) 6.6(4) 9.1(5) (a) −314.4 kJ mol−1. (b) −314.3 kJ mol−1. The result is virtually identical. (c) 1.0 × 10−37 Pa.
(d) The atmospheric gases at that altitude are not in chemical equilibrium. In particular, photo-chemical processes are important.

P1: SFK Trim: 247mm × 174mm Top: 14.586mm Gutter: 23.198mm
CUUK1808-APP-K CUUK1808/Roussel 978 1 107 00678 2 October 31, 2011 6:58
418 Answers to exercises
Exercise group 8.2
(1) 0.604
Exercise group 8.3
(1) (a) We get the maximum amount of product when a reaction reaches equilibrium. In this case,�rG
◦m is relatively large and positive. This means that the equilibrium constant
K = exp(−�rG◦m/(RT ))
will be very small. Since
K = (aB)(aC)
aA
we wouldn’t expect to get much of the product C unless the activity of the reactant A wereextremely large.
(b) (A) consumes the desired product C, so it won’t be much help.(B) has a negative standard free energy change, and it consumes the undesired product
B, so it would increase the yield (technically), but not by enough to make the synthesis of Cpractical, given the size of its �rG
◦m.
(C) has a negative free energy change and generates the reactant A. This will tend to shiftthe equilibrium toward the products of reaction (0), so it will increase the yield, but becausewe’re making a reactant, stoichiometry is going to limit the effectiveness of this reaction inincreasing the yield.
We conclude that none of these reactions will help us very much.(2) (a) 1.5 × 10⁻⁵. (b) 2.5 × 10⁵.(3) 26.87 kJ mol−1
Exercise group 8.4
(1) 91 mol L−1. This is an unreasonably large concentration, indicating that ATP hydrolysis providesenough free energy to reach any reasonable concentration of glucose in the cell.
(2) (a) 52.49 kJ. (b) −8.56 kJ. (c) 7.
Exercise group 8.5
(1) Dissolving an ionic salt in water is generally an endothermic reaction.(2) 9.3 × 10⁻¹³ bar(3) (a) 0.0259 bar. (b) 0.0816 bar. (c) 0.119 bar. Benzene should be most easily removed.(4) (a) 97 ◦C. (b) My calculation did not take into account the temperature variation of �H ◦.(5) Let’s first consider an exothermic reaction. Le Chatelier’s principle predicts that the equilibrium
constant of an exothermic reaction decreases as the temperature increases. (The reactive systemattempts to “soak up” the extra thermal energy by favoring the direction which absorbs heat.)Take T2 > T1. For an exothermic reaction, �rH
◦m < 0 so the right-hand side of the equation
ln
(K2
K1
)= �rH
◦m
R
(1
T1− 1
T2
)
is negative. Thus, K2 (at the higher temperature T2) is lower than K1, which is precisely aspredicted by Le Chatelier’s principle. Conversely, for an endothermic reaction, the right-handside of the equation is positive implying that K2 > K1 which agrees with Le Chatelier’s principlesince in this case heat is absorbed by forming more products.
(6) (a) −27.28 kJ mol−1. (b) −37.96 kJ mol−1. (c) 126.9 J K−1mol−1.

P1: SFK Trim: 247mm × 174mm Top: 14.586mm Gutter: 23.198mm
CUUK1808-APP-K CUUK1808/Roussel 978 1 107 00678 2 October 31, 2011 6:58
Answers to exercises 419
(7) (a) �rG for the decomposition reaction is positive under normal atmospheric conditions so thedecomposition is not thermodynamically allowed. This means that calcium carbonate is stable.(b) 518 ◦C.
(8) (a) 3.76. (b) The solubility goes up as the temperature goes down, so we need a smaller pressureto get a given amount of CO2 into solution.
(9) 33.96 kJ mol−1
(10) (a) 1.41 × 10⁻⁴ mol L−1. (b) −350.2 kJ mol−1. (c) −165.7 kJ mol−1. (d) −143.5 kJ mol−1.
Exercise group 8.6
(1) 6.8 ◦C(2) −4.9 ◦C
Review exercise group 8.7
(1) The process of dissolving gas molecules in water must generally be exothermic.(2) If the reaction is endothermic, increasing the temperature should favor products. Conversely,
we should decrease the temperature if the reaction is exothermic.Since the reaction converts two moles of gas to one, Le Chatelier’s principle suggests that
increasing the pressure on the system should favor the products.We can use free energy coupling to increase the yield if we arrange for one of the reactants
to be produced by a reaction with a large, negative �rG.(3) The vapor pressure of lead is 3.21 × 10⁻²² mg m−3 so yes, it’s safe.(4) 3.62(5) The boiling point at this pressure is 59 ◦C so it should still be possible to observe liquid water
on the surface of the planet.(6) −628 kJ mol−1
(7) The pH is 10.1 at 298 K and 9.0 at 333 K.(8) 107 ◦C(9) −1149.3 kJ mol−1
(10) (a) 83.1 kJ mol−1. (b) 1.4 × 10³.(11) [tetramer] = 21 μmol L−1 and dimer = 8 μmol L−1
(12) 196 g(13) (a) d-glucose + 2, phosphate + 2 NADox+2 ADP→2 pyruvate + 2 NADred + 2 H+ + 2 ATP +
2 H2O, �rG◦′ = −73.1 kJ mol−1. (b) aATP
aADP
∣∣∣max
= 2.11 × 10⁶.
(14) 7.2 × 10⁻⁴ g(15) �S◦ = 22 J K−1mol−1 > 0. We would expect a positive �S◦ for the breaking of a hydrogen
bond, so this is consistent with the hypothesis.(16) (a) 16 atm. (b) 36.50 kJ mol−1. (c) 5.8 kJ. (d) −79 J. (e) Heat is clearly much more important.
(Compare the answers to questions 16c and 16d, noting that the latter is in joules while theformer is expressed in kilojoules.) We should therefore concentrate on heat if we want to knowthe �U of popcorn. Some data which would prove useful are the heat capacity of unpoppedpopcorn and the change in enthalpy associated with cooking the starch and protein. If we hadthese, we could calculate the heat required to bring the whole, unbroken kernel to 200 ◦C, theheat needed to vaporize the moisture at this temperature (calculated above), and the heat usedto cook the solids. Sum of these quantities should be reasonably close to �U .
(17) (a) 18.3 kJ mol−1. (b) −10.8 kJ mol−1. (c) 5.2 × 10⁻⁴ mol L−1bar−1. (d) 2.6 × 10⁻³ mol L−1.(e) 308 cm3. (f) 308 cm3 is almost a third of a liter. Large bubbles will almost certainly beformed almost everywhere in the bloodstream. This could indeed cause serious problems.

P1: SFK Trim: 247mm × 174mm Top: 14.586mm Gutter: 23.198mm
CUUK1808-APP-K CUUK1808/Roussel 978 1 107 00678 2 October 31, 2011 6:58
420 Answers to exercises
Exercise group 9.1
(1) 0.9890
Exercise group 9.2
(1) 2.28(2) Ksp = 4.6 × 10⁻⁷
(3) (a) In the equation
ln
(K2
K1
)= �rH
◦
R
(1
T1− 1
T2
)
we see the ratio of equilibrium constants K2/K1. According to the Debye–Huckel theory, theactivity coefficient of an ion only depends on the ionic strength and temperature. In theseexperiments, the ionic strength is constant, and activity coefficients depend only weakly ontemperature, so the activity coefficients would roughly cancel in this ratio. (b) 13.0 kJ mol−1.(c) Ka = 3.29 × 10⁻⁶. (d) 31.3 kJ mol−1. (e) 30.0 kJ mol−1.
Exercise group 9.3
(1) (a) 2.88. (b) 1.37 × 10⁻³ mol L−1.(2) In pure water, s = 8.9 × 10⁻⁹ mol L−1. In the sodium nitrate solution, s = 9.9 × 10⁻⁹ mol L−1.(3) (a) −299.7 kJ mol−1. (b) [H+] = [F−] = 0.0087 mol L−1. (c) 2.11.
Review exercise group 9.4
(1) (a) 8.3 × 10⁻⁵ mol L−1. (b) 9.88.(2) (a) [P] = 1.01 × 10⁻⁶ mol L−1 and [P2] = 5.1 × 10⁻⁷ mol L−1. (b) [P] = 8.3 × 10⁻⁷ mol L−1
and [P2] = 6.0 × 10⁻⁷ mol L−1.
Exercise group 10.1
(1) Ca(s) + 2CO2(aq) → Ca2+(aq) + C2O2−
4(aq)
(2) 2MnO−4(aq) + 5SO2(aq) + H+
(aq) + 2H2O(l) → 2Mn2+(aq) + 5HSO−
4(aq)
(3) 2Bi(OH)3(s) + 3SnO2−2(aq) → 2Bi(s) + 3SnO2−
3(aq) + 3H2O(l)
(4) C6H12O6(aq) + C3H3O−3(aq) + H2Oaq → C6H11O−
7(aq) + C3H5O−3(aq) + H+
(aq)
Exercise group 10.2
(1) −1.17 V(2) K = 0.0153. This value of K implies that the reaction is reactant favored, i.e. that there will be
more Hg2+2 than Hg2+ at equilibrium.
(3) (a) 3C2H5OH(aq) + Cr2O2−7(aq) + 8H+
(aq) → 3C2H4O(aq) + 2Cr3+(aq) + 7H2O(l). (b) 0.2169 V. (c)
−206 kJ mol−1.(4) 0.45 V(5) 1.3 × 10⁻⁷ mol L−1
(6) 0.966
Exercise group 10.3
(1) (a) 376 kJ mol−1. (b) 703 kJ mol−1.(2) (a) 1.1446 V. (b) 1.055 V.(3) (a) 86.5 MJ m−3. (b) 1.095 72 V.

P1: SFK Trim: 247mm × 174mm Top: 14.586mm Gutter: 23.198mm
CUUK1808-APP-K CUUK1808/Roussel 978 1 107 00678 2 October 31, 2011 6:58
Answers to exercises 421
electrodes4
e−
O2
CH 4 + 2H 2 8HO + + 8e − + CO 2 2O 2 + 8H + + 8e − 4H 2O
V
PorousCH
Figure K.4 Methane/oxygen fuel cell
Review exercise group 10.4
(1) 3CN−(aq) + 2MnO−
4(aq) + H2O(l) → 3OCN−(aq) + 2MnO2(s) + 2OH−
(aq)
(2) 0.455 28 V(3) (a) K = 6.29 × 10−58. This is a tiny equilibrium constant, so at equilibrium (ignoring other
reactions), we expect only a tiny amount of product to form. (b) This is an example of LeChatelier’s principle: the reaction of gold(III) ions with Cl− removes one of the products of thefirst reaction, which should favor the formation of more products.
(4) See Figure K.4 for the diagram. E◦ = 1.0597 V.(5) (a) 0.6 V. (b) −307 kJ mol−1.
Exercise group 11.1
(1) 1.3 × 10⁻⁵ mol L−1s−1
(2) 1.0 × 10⁻⁷ mol L−1s−1
Exercise group 11.2
(1) (a) Certainly not, too many reactants. (b) Possibly. (c) Certainly not, too many bonds to bonds tomake/break in one step.
Exercise group 11.3
(1) (a) v = kab, da/dt = −kab. (b) v = ka2, da/dt = −2ka2. (c) v = k1a − k−1bc, da/dt =−k1a + k−1bc.
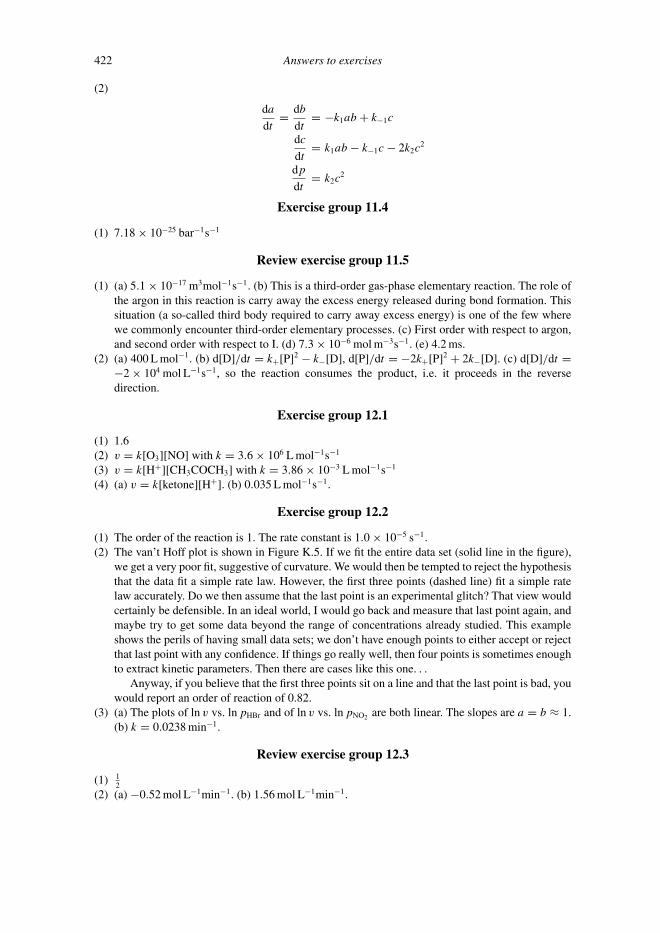
P1: SFK Trim: 247mm × 174mm Top: 14.586mm Gutter: 23.198mm
CUUK1808-APP-K CUUK1808/Roussel 978 1 107 00678 2 October 31, 2011 6:58
422 Answers to exercises
(2)
da
dt= db
dt= −k1ab + k−1c
dc
dt= k1ab − k−1c − 2k2c
2
dp
dt= k2c
2
Exercise group 11.4
(1) 7.18 × 10⁻²⁵ bar−1s−1
Review exercise group 11.5
(1) (a) 5.1 × 10⁻¹⁷ m3mol−1s−1. (b) This is a third-order gas-phase elementary reaction. The role ofthe argon in this reaction is carry away the excess energy released during bond formation. Thissituation (a so-called third body required to carry away excess energy) is one of the few wherewe commonly encounter third-order elementary processes. (c) First order with respect to argon,and second order with respect to I. (d) 7.3 × 10⁻⁶ mol m−3s−1. (e) 4.2 ms.
(2) (a) 400 L mol−1. (b) d[D]/dt = k+[P]2 − k−[D], d[P]/dt = −2k+[P]2 + 2k−[D]. (c) d[D]/dt =−2 × 10⁴ mol L−1s−1, so the reaction consumes the product, i.e. it proceeds in the reversedirection.
Exercise group 12.1
(1) 1.6(2) v = k[O3][NO] with k = 3.6 × 10⁶ L mol−1s−1
(3) v = k[H+][CH3COCH3] with k = 3.86 × 10⁻³ L mol−1s−1
(4) (a) v = k[ketone][H+]. (b) 0.035 L mol−1s−1.
Exercise group 12.2
(1) The order of the reaction is 1. The rate constant is 1.0 × 10⁻⁵ s−1.(2) The van’t Hoff plot is shown in Figure K.5. If we fit the entire data set (solid line in the figure),
we get a very poor fit, suggestive of curvature. We would then be tempted to reject the hypothesisthat the data fit a simple rate law. However, the first three points (dashed line) fit a simple ratelaw accurately. Do we then assume that the last point is an experimental glitch? That view wouldcertainly be defensible. In an ideal world, I would go back and measure that last point again, andmaybe try to get some data beyond the range of concentrations already studied. This exampleshows the perils of having small data sets; we don’t have enough points to either accept or rejectthat last point with any confidence. If things go really well, then four points is sometimes enoughto extract kinetic parameters. Then there are cases like this one. . .
Anyway, if you believe that the first three points sit on a line and that the last point is bad, youwould report an order of reaction of 0.82.
(3) (a) The plots of ln v vs. ln pHBr and of ln v vs. ln pNO2 are both linear. The slopes are a = b ≈ 1.(b) k = 0.0238 min−1.
Review exercise group 12.3
(1) 12
(2) (a) −0.52 mol L−1min−1. (b) 1.56 mol L−1min−1.

P1: SFK Trim: 247mm × 174mm Top: 14.586mm Gutter: 23.198mm
CUUK1808-APP-K CUUK1808/Roussel 978 1 107 00678 2 October 31, 2011 6:58
Answers to exercises 423
−0.5
0
0.5
1
1.5
2
−1 −0.5 0 0.5 1 1.5 2 2.5
ln(v
/mm
ol L
−1 h
−1)
ln([pyrrolidone]/mmol L−1)
Figure K.5 Van’t Hoff plot for the oxidation of pyrrolidone by TPPFe and ButOOH. The solid line isa fit of the entire data set. The dashed line is a fit of the first three points only.
(3) Rate law: v = ka1/3. (Note that it’s not necessary to round the exponent to 1/3, but that it isnecessary to (a) use each of experiments 1, 2 and 3 at least once to get the order with respect toA (i.e. make two determinations of the order) and (b) note that the rate is basically constant inexperiments 1, 4 and 5, indicating that the order with respect to B is zero. ) Overall order: 1/3.Rate constant (obtained by averaging estimates from all five experiments): 1.51 × 10⁴ mol2/3
L−2/3s−1.
Exercise group 13.1
(1) (a) 3.43 min. (b) 22.8 min.(2) (a) A plot of ln [In+] vs. t is linear which confirms the first-order rate law. (b) k = 1.01 × 10⁻³ s−1.
(c) 0.15 g.(3) 27 d
Exercise group 13.2
(1) 0.37 μg(2) 2.0 × 10¹⁵ y(3) 4.51 × 10⁹ y(4) (a) 77 y. (b) 2004. (c) A graph of ln p vs. t doesn’t look linear, so probably not.(5) 7.4–9.6 Gy(6) If we plot ln �T vs. t , we get the graph shown in Figure K.6. The graph is clearly curved, so we
conclude that cooking roast beef does not obey Newton’s law.

P1: SFK Trim: 247mm × 174mm Top: 14.586mm Gutter: 23.198mm
CUUK1808-APP-K CUUK1808/Roussel 978 1 107 00678 2 October 31, 2011 6:58
424 Answers to exercises
4.7
4.75
4.8
4.85
4.9
4.95
5
5.05
5.1
5.15
5.2
4.4 4.6 4.8 5 5.2 5.4 5.6
ln(Δ
T/K
)
t/h
Figure K.6 Roast beef temperature vs. time data
Exercise group 13.3
(1) First order with k = 3.4 × 10⁻² min−1 (rate constant directly computed from the slope)(2) 0.038 mol L−1
(3) (a) The process (collide and stick) is simple enough to be elementary. The reaction would followsecond-order kinetics if it were elementary. (b) A plot of 1/pB vs. t is linear, indicating that this isa second-order reaction. The rate constant is 2.279 × 10⁻⁵ torr−1min−1 (directly computed fromthe slope).
(4) (a) Second order, k = 1.50 L mol−1min−1. (b) 6.7 × 10⁵ min, far too long to be practical.(5) Both the first- and second-order plots are curved. The data support neither a first- nor a second-
order model.
Exercise group 13.4
(1) kt =∫ p
0
dp′
(a0 − 2p′)(b0 − 3p′)(2) (a) Yes. The reaction converts four equivalents of gas to three so the total pressure should
decrease as the reaction proceeds.(b)
t = 1
2k ([H2]0 − [NO]0)
[1
[H2]0 − [NO]0ln
([H2]0[NO]
[NO]0 ([NO] + [H2]0 − [NO]0)
)
+ 1
[NO]− 1
[NO]0
]
(c) 8671 s.

P1: SFK Trim: 247mm × 174mm Top: 14.586mm Gutter: 23.198mm
CUUK1808-APP-K CUUK1808/Roussel 978 1 107 00678 2 October 31, 2011 6:58
Answers to exercises 425
5.55
5.6
5.65
5.7
5.75
5.8
5.85
5.9
5.95
1750 1800 1850 1900 1950 2000
ln([
CO
2]/p
pm)
t/y
Figure K.7 Atmospheric CO2 concentrations from question 2 of exercise group 13.6.
Exercise group 13.5
(1) (a) 9.2 ns. (b) 5.6 ns. (c) 26.1 A.
Review exercise group 13.6
(1) No. The half-life of a second-order reaction depends on the initial concentration of reactant, soat minimum we need to know this concentration to make sense of this number.
(2) The first-order plot is shown in Figure K.7. The data clearly do not obey a first-order rate law,and in fact increase much faster than exponentially.
(3) (a)
d(�V )
dt= −�V
RC
∴ d(�V )
�V= − dt
RC.
∴∫ �V
�V0
dx
x= − 1
RC
∫ t
0dt ′
∴ ln x|�V�V0
= − 1
RCt ′∣∣t
0
∴ − t
RC= ln(�V ) − ln(�V0) = ln
(�V
�V0
)
∴ �V
�V0= exp(−t/(RC))
∴ V − Veq = �V0 exp(−t/(RC))
∴ V = Veq + �V0 exp(−t/(RC))
(b) 691 μs.

P1: SFK Trim: 247mm × 174mm Top: 14.586mm Gutter: 23.198mm
CUUK1808-APP-K CUUK1808/Roussel 978 1 107 00678 2 October 31, 2011 6:58
426 Answers to exercises
(4) There are three possible answers, depending on the rate equation you choose to work from:Using the [NO] rate law:
t = −1
2k
∫ [NO]
[NO]0
dx
x2{[Cl2]0 − 1
2 ([NO]0 − x)}
Using the [Cl2] rate law:
t = −1
k
∫ [Cl2]
[Cl2]0
dx
x {[NO]0 − 2 ([Cl2]0 − x)}2
Using the [NOCl] rate law:
t = 1
2k
∫ [NOCl]
0
dx
([NO]0 − x)2([Cl2]0 − 1
2 x)
(5)1
a0 − 12 b
= 1
a0+ kt
(6) (a) 23 . (b) t2 = m
1/30
(3√
2 − 1)
/k.
(7) The second-order plot is linear, which supports the hypothesis that DHF decays by recombination.(8) (a) v = k[Si][O2]
(b) (i) Given a large excess of oxygen, the oxygen concentration will be roughly constantduring the experiment. Thus, v = (k[O2]) [Si] = k′[Si] with k′ = k[O2]. A graph of k′
vs. [O2] should therefore have a slope of k and an intercept of 0.(ii) k = 8.85 × 10¹⁰ L mol−1s−1. The intercept is 5083 s−1. This is smaller than any of the
rate constants in the original data set, and there is some scatter in the values, so thisvalue is in reasonable agreement with the expected intercept of zero.
(iii) 22.8 μs
Exercise group 14.1
(1) (a) 2O3(g) → 3O2(g). (b) v =(
k21k
23k4
4k2−1
[N2O5]2[O3]2
)1/3
. (c) Yes. Order w.r.t. N2O5 = order w.r.t.
ozone = 23 . (d) Yes.
(2) (a) A → P. (b) v = k2b ≈ k1k2a2
k−1 + k2. (c) 2.
(3) (a) W + 2Y → 2Z. Reactants: W, Y. Product: Z, Intermediate: X. (b) a radical. (c) v = 1
2
dz
dt=
1
2k2y√
k1w/k−1. (d) The steady-state approximation is applicable when either k−1w or k2 is large
compared to k1. The steady-state approximation value of x satisfies the quadratic equation
2k−1wx2 + k2yx − 2k1w2 = 0
Taking the positive root and computing the reaction rate as above, we find
v = k2y
(−k2y +
√k2
2y2 + 16k1k−1w3
4k−1w
)

P1: SFK Trim: 247mm × 174mm Top: 14.586mm Gutter: 23.198mm
CUUK1808-APP-K CUUK1808/Roussel 978 1 107 00678 2 October 31, 2011 6:58
Answers to exercises 427
(4) (a) Mechanism 1: Cl, Cl3
Mechanism 2: Cl, COCl(b) Mechanism 1: Initiation: Cl2(g) → 2Cl(g)
Chain propagation:
Cl(g) + Cl2(g) → Cl3(g)
Cl3(g) + CO(g) → COCl2(g) + Cl(g)
Termination: 2Cl(g) → Cl2(g)
None of the above: Cl3(g) → Cl(g) + Cl2(g)
Mechanism 2:Initiation: Cl2(g) → 2Cl(g)
Chain propagation:
Cl(g) + CO(g) → COCl(g)
COCl(g) + Cl2(g) → COCl2(g) + Cl(g)
Termination: 2Cl(g) → Cl2(g)
None of the above: COCl(g) → Cl(g) + CO(g)
(c) Mechanism 1: v = k2k3[CO]
k−2 + k3[CO]
√k1[Cl2]3
k−1
Mechanism 2: v = k2k3[CO]
k−2 + k3[Cl2]
√k1[Cl2]3
k−1
The two mechanisms can be distinguished because the rates behave differently at high andlow pressures of the two reactants. For instance, mechanism 1 predicts that the order withrespect to CO will be zero at high pressure of CO, while mechanism 2 predicts first-orderbehavior with respect to CO under any experimental conditions.
(5) There are two ways to go about answering this question, each of which gives a slightly differentresult. If you assume that the first step is in quasi-equilibrium, we get the experimental rate lawwith k = k1k2
k−1. If you make this assumption, you would conclude that the first step is fast (in both
directions) while the second step is slow.We can also apply the steady-state approximation to the NOBr2 concentration. We get the
rate law v = k1k2[NO]2[Br2]k−1+k2[NO] , which reduces to the experimental rate law if k2[NO] k−1. The
correspondence between the experimental rate constant k and the rate constants appearing inthe mechanism are exactly as above, i.e. k = k1k2
k−1. We get this result by assuming that the step
controlled by k2 is slow, along with the steady-state approximation which implies that the removalof the intermediate is fast. This means that the dissociation of NOBr2 into NO and Br2 is thefastest process in this reaction, the other two elementary reactions being relatively slow.
(6) If we apply the steady-state approximation to the intermediate, we get a rate law
v = k1k2a2c
k−1 + k2c
If k−1 � k2c, this reduces to v ≈ k1k2k−1
a2c, which is a third-order rate law. This implies that thedegradation of the dimer B back to monomers is a fast process.
Exercise group 14.2
(1) (a) A → 3C (b) K = 4.4 × 10⁻³ mol2 L−2

P1: SFK Trim: 247mm × 174mm Top: 14.586mm Gutter: 23.198mm
CUUK1808-APP-K CUUK1808/Roussel 978 1 107 00678 2 October 31, 2011 6:58
428 Answers to exercises
Review exercise group 14.3
(1) (a) v = k1k2
k−1 + k−2[indole][HSO−
5 ]. (b) k = k1k2k−1 + k−2. (c) 7.5 × 10⁴ s or 21 h.
(2) (a) 2PAA → 2AH + O2. (b) v = k1k2k−1
[PAA]2[H+]. (c) 2nd order. (d) Increasing the pH decreasesthe proton concentration, which should decrease the rate of reaction.
Exercise group 15.1
(1) From an Eadie–Hofstee plot, we can calculate vmax = 0.215 μmol L−1s−1 and KM =159 μmol L−1. However, the fit to the data is very poor, suggesting that the simple Michaelis–Menten mechanism may not be the correct model in this case.
(2) (a) KM = 5.5 mmol/L, k−2 = 12 s−1. (b) k1 > 2.2 × 10³ L mol−1s−1.(3) KM = 21 μmol L−1, specific activity = 1.8 nmol s−1g−1
(4) (a) There is some scatter, but the Eadie–Hofstee plot is linear. This transport process thereforedisplays Michaelis–Menten kinetics. (b) KM = 31.8 μmol/L, vmax = 0.903 μmol min−1g−1.
Exercise group 15.2
(1) (a) The vmax values are nearly constant and a plot of KM vs. i0 is linear, so the data arecompatible with competitive inhibition. (b) vmax = 10.5 μmol L−1s−1, KS = 3.98 mmol L−1,KI = 2.31 mmol L−1.
(2) Competitive with vmax = 745 μmol L−1s−1, KS = 83 μmol L−1, KI = 18 mmol L−1
(3) I find the following for the Eadie-Hofstee plots at each of the BATA concentrations:
[BATA]/μmol L−1 slope/μmol L−1 intercept/μmol L−1s−1
0 −8.44 0.3471.9 −19.72 0.3323.8 −30.22 0.3207.6 −47.90 0.281
Both the intercept and slope are changing, so this is not an instance of competitive inhibition.(4) If you create Eadie–Hofstee plots for each inhibitor concentration, you should get the following
data:
[E4P]/μmol L−1 vmax/μmol g−1min−1 KM/μmol L−1
0 677 7481.5 691 13763 501 9544.5 521 21956 467 4284
The vmax isn’t constant, so that rules out competitive inhibition. (I would expect the vmax to show amore consistent trend than this, so experimental errors are probably causing some trouble gettingaccurate values for the intercepts of the Eadie–Hofstee plots. However, the overall trend of vmax
decreasing with increasing [E4P] is clear.) If we had uncompetitive inhibition, KM would decreasewith increasing [E4P]. However, the trend runs the other way, give or take some experimentaldifficulties around 1.5–3 μmol/L E4P. Thus, it can’t be uncompetitive inhibition either. Someother type of inhibition not studied in this course is operating here.
Incidentally, if you actually draw the Eadie–Hofstee plot (which you should), you’ll see thatthe data are pretty messy. It’s often difficult to get great data in some of these experiments. I

P1: SFK Trim: 247mm × 174mm Top: 14.586mm Gutter: 23.198mm
CUUK1808-APP-K CUUK1808/Roussel 978 1 107 00678 2 October 31, 2011 6:58
Answers to exercises 429
0
2
4
6
8
10
12
14
16
1.2 1.4 1.6 1.8 2 2.2 2.4 2.6 2.8 3 3.2
v/μm
ol L
−1h−1
v [phenol]−1/10−3h−1
Figure K.8 Eadie-Hofstee plot for problem 1a from exercise group 15.3.
should also note that there are one or two suspicious points that we might think about throwingout from the data set. This wouldn’t affect our overall conclusion.
Review exercise group 15.3
(1) (a) See the Eadie–Hofstee plot in Figure K.8. There is some scatter, but no obvious curva-ture, so it seems that this biological remediation process does obey Michaelis–Menten kinetics.(b) KM = 6.20 mmol L−1, vmax = 21.8 μmol L−1h−1.
(2) (a) We have the following conservation relations:
[pol-α] + cp = α0 (K.1)
[RF-C] + cr = r0 (K.2)
[DNA] + cp + cr = d0 (K.3)
where α0, r0 and d0 are, respectively, the total concentrations of pol-α, RF-C and DNA. We aretold that
r0 � d0 � α0
Since cr ≤ d0 and d0 r0, Equation (K.2) implies
[RF-C] ≈ r0.
Similarly, since cp ≤ α0 and α d0, Equation (K.3) implies
[DNA] ≈ d0 − cr
Apply the SSA to cp and cr . After some work, you should obtain
v = vmaxd0
d0 + KS (1 + r0/KI)
where vmax = k−2α0, KS = (k−1 + k−2)/k1, and KI = k−3/k3. (b) For [RF-C] = 0, vmax =467 fmol min−1 and KM = 0.105 g L−1. For [RF-C] = 0.2 mu, vmax = 463 fmol min−1 and

P1: SFK Trim: 247mm × 174mm Top: 14.586mm Gutter: 23.198mm
CUUK1808-APP-K CUUK1808/Roussel 978 1 107 00678 2 October 31, 2011 6:58
430 Answers to exercises
C H42 C H64
C H106
Δr U
Ea+
Ea−
+
Figure K.9 Energy profile for the Diels–Alder reaction of ethene with 1,3-butadiene.
KM = 0.213 g L−1. Thus, vmax is essentially constant, while KM increases with the inhibitorconcentration, which is consistent with competitive inhibition. We calculate KS = 0.108 g L−1,KI = 0.205 mu and vmax = 2.33 nmol min−1u−1 (expressed as a specific activity).
(3) Use the enzyme conservation relation e0 = e + c1 + c2, and apply the SSA to both intermediates.After some algebra, you get the Michaelis–Menten rate law with vmax = k3e0
α+1 and KM = k−1α+k3k1(α+1) ,
where α = k−2+k3k2
.
(4) v = e0 [k1k−2s − k−1k2(s0 − s)]
k1s + k−1 + k−2 + k2(s0 − s)
Exercise group 16.1
(1) kd = 8.0 × 10⁵ s−1, ka = 4.5 × 10¹⁰ L mol−1s−1
(2) (a) τ = (4kaseq + kd )−1. (b) The equilibrium constant decreases by a factor of 0.37.(3) (a) Combine the equilibrium relation and the definition of pt to obtain pt = peq + 2kap
2eq/kd .
Then isolate peq from the equation for the relaxation time (from problem 2) and substituteinto the equation for pt . After rearranging, you get τ−2 = 8kakdpt + k2
d . If we plot τ−2 vs. pt ,the slope is 8kakd and the intercept is k2
d . (b) ka = 8.57 × 10⁸ L mol−1s−1, kd = 1.95 × 10⁶ s−1.(c) −15.1 kJ mol−1.
Exercise group 17.1
(1) Ea = 48.6 kJ mol−1, A = 8.33 × 10⁴ L mol−1s−1
(2) Ea = 159 kJ mol−1, A = 1.5 × 10²³ L mol−1s−1. In this case, the Arrhenius plot shows an unusualamount of scatter, probably because of experimental errors. (Working in hot acid raises all kindsof problems.)
(3) (a) Ea = 38.2 kJ mol−1, A = 849 min−1. (b) 4.27 × 10⁻⁵ min−1.(4) (a) A plot of ln v vs. 1/T is linear, so the data are consistent with the Arrhenius equation.
(b) Ea = 24.5 kJ mol−1. (c) 38 ◦C.
Exercise group 17.2
(1) (a) See Figure K.9. (b) 271 kJ mol−1. (c) �‡H+ = 110 kJ mol−1, �‡H− = 269 kJ mol−1.(2) If you calculate the activation parameters from the activation energy and preexponential factor,
you get �‡H = 52 kJ mol, �‡S = −136 J K−1mol−1. If you use an Eyring plot, you get aboutthe same enthalpy, but the entropy is closer to −137 J K−1mol−1.

P1: SFK Trim: 247mm × 174mm Top: 14.586mm Gutter: 23.198mm
CUUK1808-APP-K CUUK1808/Roussel 978 1 107 00678 2 October 31, 2011 6:58
Answers to exercises 431
(3) A = 1.7 × 10¹³ s−1. The condition �‡S = 0 separates reactions in which the transition stateis more orderly than the reactants (negative �‡S, A < 1.7 × 10¹³ s−1, corresponding to bondformation) from reactions in which the transition state is less orderly than the reactants (positive�‡S, A > 1.7 × 10¹³ s−1, corresponding to bond breaking on the way to the transition state).From Equation (17.16), we see that if �‡Sm = 0, A is kBT e/h, i.e. it is just a small multiple of k‡
(Equation 17.8). Thus in this case, for reactants of sufficient energy, formation of the products isentirely associated with molecular vibrations, unlike the normal case in which statistical effectsassociated with the relative number of microstates of reactants and transition state (i.e. theactivation entropy) modulate the pre-exponential factor.
(4) �‡S = −129 J K−1mol−1. This very negative value of �‡S tells us that the transition state ismore organized than the reactants, i.e. that a complex is formed on the way to the transition state.
(5) (a)
Substituent Ea /kJ mol−1 A/s−1
−H 145.44 2.63 × 10¹²
−CH3 145.42 3.41 × 10¹²
−OCH3 145.89 5.09 × 10¹²
−Cl 146.22 3.13 × 10¹²
−NO2 145.45 1.93 × 10¹²
(b)
Substituent �‡H /kJ mol−1 �‡S/J K−1mol−1
−H 141.50 −19.30−CH3 141.48 −17.14−OCH3 141.95 -13.82−Cl 142.29 −17.84−NO2 141.52 −21.86
There is very little variation in the enthalpy of activation. This means that the amount of energyrequired to reach the transition state is nearly independent of the substituents. On the otherhand, there is significant variation in the entropy of activation. Since �‡S = STS − Sreactant,this can either be due to a significant variation in the “looseness” of the transition state,or to different degrees of disorganization in the reactant. The former seems unlikely. Thetriangular transition state is probably quite similar in all cases. (The approximate constancyof the activation energy suggests this.) However, it may be that the isocyanide group is eithermore or less mobile in the reactant depending on substituent effects.
(6) There are at least three ways you can do this problem. Because there was significant scatter inthe measurements, you will get slightly different values, depending on how you go about solvingthis problem. If you get the activation energy and pre-exponential factor using the raw data, thenconvert the exponential factor to bar−1s−1, and then compute the activation parameters, you get�‡H = 10.6 kJ mol−1, �‡S = −101 J K−1mol−1 and �‡G = 40.6 kJ mol−1. If you convert therate constants to bar−1s−1 first, then get the activation energy and pre-exponential factor, and thencalculate the activation parameters, you get �‡H = 7.7 kJ mol−1, �‡S = −110 J K−1mol−1
and �‡G = 40.6 kJ mol−1. If you use an Eyring plot, you get �‡H = 9.9 kJ mol−1,�‡S = −103 J K−1mol−1 and �‡G = 40.6 kJ mol−1. Whichever calculation you do, the valueof �‡S is large and negative, which suggests that the transition state is a tightly bound complexof the two reactants.
Exercise group 17.3
(1) The plot of ln kQ vs.√
I is not linear, so Brønsted–Bjerrum theory is not adequate in this case.Brønsted-Bjerrum theory is based on Debye–Huckel theory, which assumes that charged particles
P1: SFK Trim: 247mm × 174mm Top: 14.586mm Gutter: 23.198mm
CUUK1808-APP-K CUUK1808/Roussel 978 1 107 00678 2 October 31, 2011 6:58
432 Answers to exercises
in solution organize in a certain way. The arrangement may, however, be substantially differentfor large polymeric particles than it is for smaller solutes.
(2) In Brønsted–Bjerrum theory, non-ideal effects enter through the equilibrium constant for acces-sion to the transition state, K‡. For a first-order elementary reaction, A � TS → B, we have
K‡ = [TS]
[A]
γTS
γA
Debye–Huckel theory gives a first approximation to the activity coefficients. In this theory, theactivity coefficients only depend on the charge. Since the charge of the transition state has to bethe same as the charge of the reactant A, the two activity coefficients that appear in K‡ wouldcancel. As a side-note, in more sophisticated theories, the activity coefficients also depend onthe size of a solute. However, for a unimolecular reaction, where moving to the transition stateonly involves an internal rearrangement of some sort, the change in volume of the solute will benegligible. We would again conclude that γTS ≈ γA, so that ionic strength should have very little(if any) effect on the rate constant.
(3) Consider an elementary reaction
A + Bk+−⇀↽−k−
C + D
According to the Brønsted–Bjerrum theory,
k+ = k‡K‡+
c◦γAγB
γTS
and k− = k‡K‡−
c◦γCγD
γTS
In these equations, k‡ is the frequency for motion through the transition state, K‡+ is the equilibrium
constant between the transition state and reactants, and K‡− is the equilibrium constant between
the products and transition state. Note that k‡ is a universal temperature-dependent constant intransition-state theory (Equation 17.8), and not a quantity that depends on the specific reactionbeing studied. From our study of the relationship between kinetics and equilibrium, we knowthat the phenomenological equilibrium constant Kapp is related to the rate constants by
Kapp = k+/k− = K‡+
K‡−
γAγB
γCγD
Now K‡+ is related to the standard free energy change for accession to the transition state by
K‡+ = exp(−�
‡(+)Gm/(RT ))
with �‡(+)Gm = �f G◦
m(TS) − [�f G◦m(A) + �f G◦
m(B)]
and, similarly, K‡− = exp(−�
‡(−)Gm/(RT ))
with �‡(−)Gm = �f G◦
m(TS) − [�f G◦m(C) + �f G◦
m(D)]
Putting these equations together, we get
Kapp = exp(�rG◦m/(RT ))
γAγB
γCγD= K
γAγB
γCγD
where �rG◦m = �f G◦
m(C) + �f G◦m(D) − [�f G◦
m(A) + �f G◦m(B)]
or K = KappγAγB
γCγD
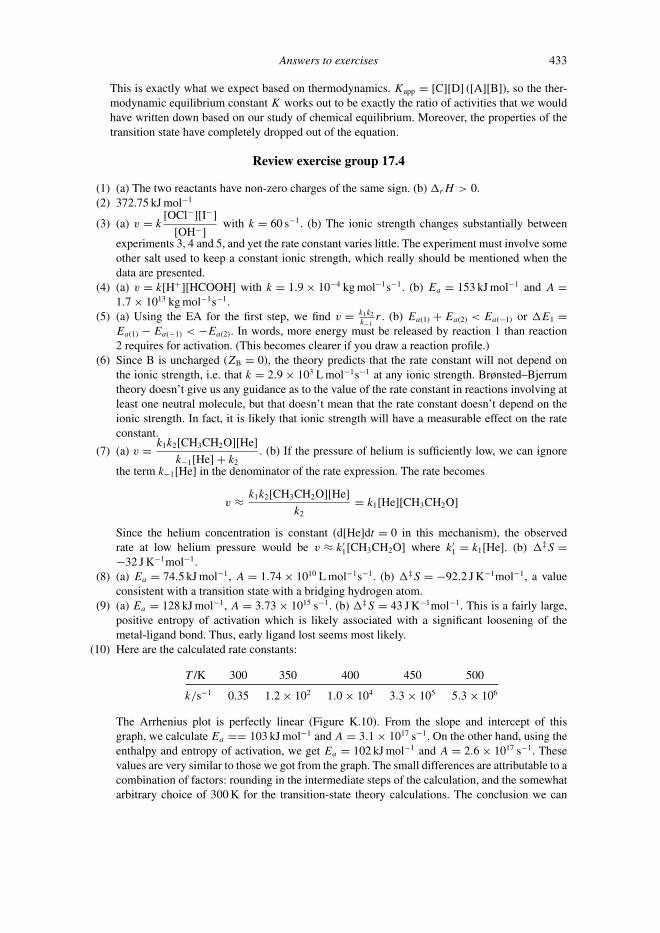
P1: SFK Trim: 247mm × 174mm Top: 14.586mm Gutter: 23.198mm
CUUK1808-APP-K CUUK1808/Roussel 978 1 107 00678 2 October 31, 2011 6:58
Answers to exercises 433
This is exactly what we expect based on thermodynamics. Kapp = [C][D] ([A][B]), so the ther-modynamic equilibrium constant K works out to be exactly the ratio of activities that we wouldhave written down based on our study of chemical equilibrium. Moreover, the properties of thetransition state have completely dropped out of the equation.
Review exercise group 17.4
(1) (a) The two reactants have non-zero charges of the same sign. (b) �rH > 0.(2) 372.75 kJ mol−1
(3) (a) v = k[OCl−][I−]
[OH−]with k = 60 s−1. (b) The ionic strength changes substantially between
experiments 3, 4 and 5, and yet the rate constant varies little. The experiment must involve someother salt used to keep a constant ionic strength, which really should be mentioned when thedata are presented.
(4) (a) v = k[H+][HCOOH] with k = 1.9 × 10⁻⁴ kg mol−1s−1. (b) Ea = 153 kJ mol−1 and A =1.7 × 10¹³ kg mol−1s−1.
(5) (a) Using the EA for the first step, we find v = k1k2k−1
r . (b) Ea(1) + Ea(2) < Ea(−1) or �E1 =Ea(1) − Ea(−1) < −Ea(2). In words, more energy must be released by reaction 1 than reaction2 requires for activation. (This becomes clearer if you draw a reaction profile.)
(6) Since B is uncharged (ZB = 0), the theory predicts that the rate constant will not depend onthe ionic strength, i.e. that k = 2.9 × 10³ L mol−1s−1 at any ionic strength. Brønsted–Bjerrumtheory doesn’t give us any guidance as to the value of the rate constant in reactions involving atleast one neutral molecule, but that doesn’t mean that the rate constant doesn’t depend on theionic strength. In fact, it is likely that ionic strength will have a measurable effect on the rateconstant.
(7) (a) v = k1k2[CH3CH2O][He]
k−1[He] + k2. (b) If the pressure of helium is sufficiently low, we can ignore
the term k−1[He] in the denominator of the rate expression. The rate becomes
v ≈ k1k2[CH3CH2O][He]
k2= k1[He][CH3CH2O]
Since the helium concentration is constant (d[He]dt = 0 in this mechanism), the observedrate at low helium pressure would be v ≈ k′
1[CH3CH2O] where k′1 = k1[He]. (b) �‡S =
−32 J K−1mol−1.(8) (a) Ea = 74.5 kJ mol−1, A = 1.74 × 10¹⁰ L mol−1s−1. (b) �‡S = −92.2 J K−1mol−1, a value
consistent with a transition state with a bridging hydrogen atom.(9) (a) Ea = 128 kJ mol−1, A = 3.73 × 10¹⁵ s−1. (b) �‡S = 43 J K−1mol−1. This is a fairly large,
positive entropy of activation which is likely associated with a significant loosening of themetal-ligand bond. Thus, early ligand lost seems most likely.
(10) Here are the calculated rate constants:
T /K 300 350 400 450 500
k/s−1 0.35 1.2 × 10² 1.0 × 10⁴ 3.3 × 10⁵ 5.3 × 10⁶
The Arrhenius plot is perfectly linear (Figure K.10). From the slope and intercept of thisgraph, we calculate Ea == 103 kJ mol−1 and A = 3.1 × 10¹⁷ s−1. On the other hand, using theenthalpy and entropy of activation, we get Ea = 102 kJ mol−1 and A = 2.6 × 10¹⁷ s−1. Thesevalues are very similar to those we got from the graph. The small differences are attributable to acombination of factors: rounding in the intermediate steps of the calculation, and the somewhatarbitrary choice of 300 K for the transition-state theory calculations. The conclusion we can
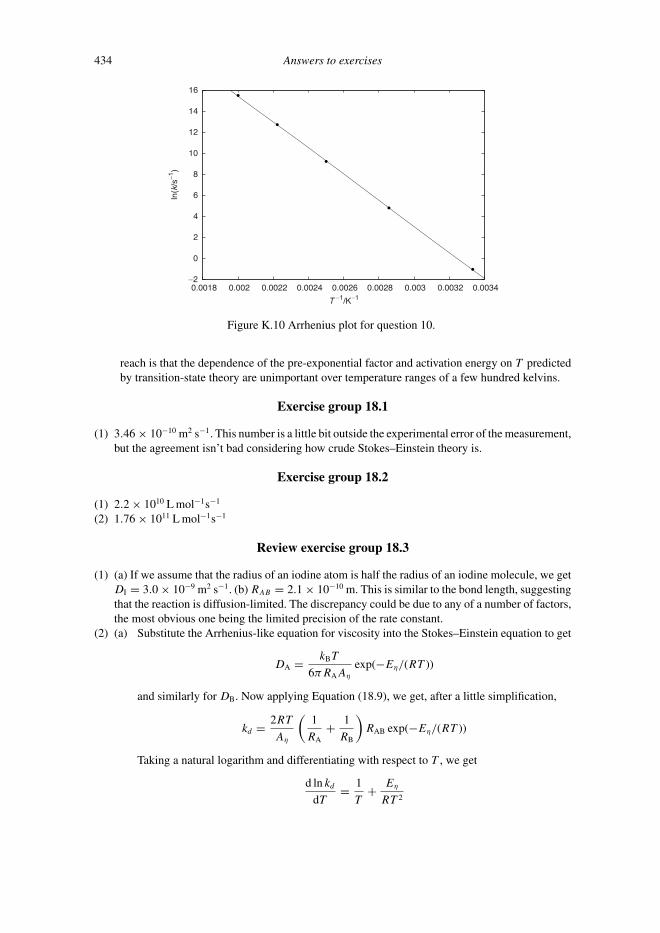
P1: SFK Trim: 247mm × 174mm Top: 14.586mm Gutter: 23.198mm
CUUK1808-APP-K CUUK1808/Roussel 978 1 107 00678 2 October 31, 2011 6:58
434 Answers to exercises
−2
0
2
4
6
8
10
12
14
16
0.0018 0.002 0.0022 0.0024 0.0026 0.0028 0.003 0.0032 0.0034
ln(k
/s−1
)
T −1/K−1
Figure K.10 Arrhenius plot for question 10.
reach is that the dependence of the pre-exponential factor and activation energy on T predictedby transition-state theory are unimportant over temperature ranges of a few hundred kelvins.
Exercise group 18.1
(1) 3.46 × 10⁻¹⁰ m2 s−1. This number is a little bit outside the experimental error of the measurement,but the agreement isn’t bad considering how crude Stokes–Einstein theory is.
Exercise group 18.2
(1) 2.2 × 10¹⁰ L mol−1s−1
(2) 1.76 × 10¹¹ L mol−1s−1
Review exercise group 18.3
(1) (a) If we assume that the radius of an iodine atom is half the radius of an iodine molecule, we getDI = 3.0 × 10⁻⁹ m2 s−1. (b) RAB = 2.1 × 10⁻¹⁰ m. This is similar to the bond length, suggestingthat the reaction is diffusion-limited. The discrepancy could be due to any of a number of factors,the most obvious one being the limited precision of the rate constant.
(2) (a) Substitute the Arrhenius-like equation for viscosity into the Stokes–Einstein equation to get
DA = kBT
6πRAAη
exp(−Eη/(RT ))
and similarly for DB. Now applying Equation (18.9), we get, after a little simplification,
kd = 2RT
Aη
(1
RA+ 1
RB
)RAB exp(−Eη/(RT ))
Taking a natural logarithm and differentiating with respect to T , we get
d ln kd
dT= 1
T+ Eη
RT 2

P1: SFK Trim: 247mm × 174mm Top: 14.586mm Gutter: 23.198mm
CUUK1808-APP-K CUUK1808/Roussel 978 1 107 00678 2 October 31, 2011 6:58
Answers to exercises 435
Applying the same operation to the Arrhenius equation, we get
d ln k
dT= Ea
RT 2
If we set these two results equal to each other, we get Ea = Eη + RT .(b) 15.7 kJ mol−1.(c) 18.2 kJ mol−1.

P1: SFK Trim: 247mm × 174mm Top: 14.586mm Gutter: 23.198mm
CUUK1808-IND CUUK1808/Roussel 978 1 107 00678 2 October 31, 2011 7:58
Index
β-lactamase, 308β-lactams, 308, 351
absolute rate theory, see transition-state theoryabsolute zero, 128, 129, 134absorbance, 42absorption coefficient, 42, 44–45
protein, 53absorption spectroscopy, see spectroscopyacetic acid, 162, 328, 373acid dissociation constant, 162–163activated complex, see transition stateactivation energy, 331, 337–338activation-controlled reaction, 365active transport, 169–172activity, 148–150, 160, 161,
185–200coefficient, 186–188
ionic, 191–195mean ionic, 190, 193–195, 212
adenosine triphosphate, see ATPadiabatic, 74adsorption, 121alcohol dehydrogenase, 394allosteric interaction, 303amino acid, see dating, aspartic acid
fluorescent, 48hydrophobic, 289isomerization, 264–266residue, 30, 126
amyloid plaque, 270anode, 207antifreeze, 79
protein, 79antioxidant, 393Aplysia dactylomela, 404Arrhenius equation, 334–337ascorbic acid, 393ash, 404aspartic acid, see datingATP, 152–153, 169–172, 319ATPase, 170
Avogadro’s constant, 384axis labels, 3
barometric formula, 29battery, 156, 216
alkaline, 151dry cell, 155
Beer’s law, see Beer–Lambert lawBeer–Lambert law, 42–44benzene, 22, 88, 177–178benzoic acid, 95blank subtraction, 32Bodenstein, Max, 278, 287boiling, 80
chips, 80boiling point
elevation, 174–175normal, 83variation with pressure, 174
Boltzmann distribution, 25–29,334
Boltzmann’s constant, 24, 384Boltzmann’s equation, 120bombardier beetle, 96Born, Max, 15Briggs, George Edward, 290Brønsted–Bjerrum equation,
352bubble, 80
caged compounds, 319calcium carbonate, 404–405calculator, 44, 196–197calculus, 389–391caloric theory, 58calorie, 93calorimetry
bomb, 85, 91–96, 404–405direct, 100–101indirect, 102–104
carbohydrate, 95, 102carbon dating, see dating, radioisotope
436

P1: SFK Trim: 247mm × 174mm Top: 14.586mm Gutter: 23.198mm
CUUK1808-IND CUUK1808/Roussel 978 1 107 00678 2 October 31, 2011 7:58
Index 437
carbon dioxidevibrational modes, 38
carbon monoxide, 129–130Carnot cycle, 132–138Carnot, Sadi, 132catabolizable energy, 93, 102catalase, 394–395catalyst, 164, 287cathode, 207cell
concentration, 212–213dry, 155electrochemical, 202fuel, 151–152, 214–217Leclanche, 155voltaic, 206–208
Celsius, degreevs. kelvins, 73
chain reaction, 278chain-breaking, 279inhibition, 279initiation, 279propagation, 279termination, 279
Chalfie, Martin, 48chemotherapy, 351China, 252chlorophyll, 45–46chromophore, 48Clausius inequality, 141–143Clausius, Rudolf, 139closed system, 57combustion, 227competitive inhibition, see enzymecomplex reaction, 226condensed phase, 90conserved moiety, 310continuous flow method, 314–316conversion factors, 384–385cooking
pasta, 174–175popcorn, 183–184roast beef, 255
cooling, see Newton’s lawcooperativity, 405–406coordination number, 371correlation coefficient, 258–260cotransport, 169coupled reactions, 165–168,
170cyclic reactions, 284cynicism, 138–139cytochrome, 304–307
�, 157–158dalton, 45dating
aspartic acid, 264–267radioisotope, 249–252
Debye–Huckel theory, 191–200, 201extended, 198–199
decompression sickness, 184degeneracy, 22, 25density
water, 380density of states, 334detailed balance, 283dew point, 179–180dielectric constant, 192differential, 62–63, 69–70
exact, 62–63, 69inexact, 63, 69
differential equation, 244, 245coupled, 275
diffusion, 121, 359–364coefficient, 360, 362–364driving force, 362equation, 361proton, 369
diffusion-controlled reaction, 365–374diffusion-influenced reaction, 365diode array spectrometer, see spectrometerdipole moment, 37dissociation constant, 291DNA, 15, 406–407
replication, 351DNA polymerase, 311–312double-reciprocal plot, see Lineweaver–Burk
plotdoubling time, 252dry cell, 155dual-beam spectrometer, see spectrometerduality, see wave-particle dualitydynamics, see reaction
Eadie–Hofstee plot, 294–296, 300Eigen, Manfred, 319electric constant, see permittivityelectrolyte, 185, 189electromagnetic
radiation, 8–10spectrum, 11wave, 8–9
electromotive force, 202–203and free energy, 202–203standard, 203
electron mass, 384electron microscope, 14, 16electronic
energy, 23, 24elementary charge, 384elementary reaction, 226–228emf, see electromotive forceencounter pair, 365

P1: SFK Trim: 247mm × 174mm Top: 14.586mm Gutter: 23.198mm
CUUK1808-IND CUUK1808/Roussel 978 1 107 00678 2 October 31, 2011 7:58
438 Index
endothermic, 85energy
free, see free energyinternal, 26, 68–70, 82, 90–96
and heat, 70, 82ideal gas, 73statistical, 76–77
kinetic, 24metabolic requirements
calorimetry, 100–101indirect calorimetry, 102–103nutritional balance method, 99–100
molecular, 23–24translational, see translationalvibrational, see vibrationalzero-point, see zero-point energy
enthalpy, 70, 90–95and heat, 70–71, 82data, 375–378of combustion, 85–86of formation, 83–87of vaporization
water, 380temperature dependence, 96–98
entropy, 111–113, 141absolute, 128–131, 147and evolution, 126–128and free energy, 143and temperature, 130–131as disorder, 125Boltzmann, see entropy, statisticaldata, 378mixing, 116–118, 121–123residual, 130statistical, 118–123, 128–130Third Law, 128–131water, 380
enzyme, 164, 166–167, 287–313active site, 289and transition-state theory, 350–351deriving rate laws, 310dissociation constant, 291inhibition, 298–307
competitive, 298–302, 351uncompetitive, 302–307
lock-and-key theory, 289saturation, 291specific activity, 292turnover number, 292
equilibrium, 57, 159, 230–231, 283–284and free energy, 159–163constant, 159, 230–231, 283–284
and pressure, 323–324and temperature, 173–177empirical vs thermodynamic, 231
dynamic, 2, 231thermal, 59, 111
equilibrium approximation, 277–278error function, 366erythrocyte, 170Escherichia coli, 394ethanol, 82, 177evolution, 126–128excited state, 18exclusion principle, 19exothermic, 85exponential functions
properties, 388extensive property, 60–61, 110, 203Eyring plot, 340–341
Faraday’s constant, 203, 384fat, 102, 105, 169fibrin, 288Fick’s first law, 360Fick’s second law, 361First Law of Thermodynamics, 62, 68–69, 109, 138first-order reaction, 244–255Fischer, Emil, 289flash memory, 16flash photolysis, 317–319fluorescence, 46–51
amino acid, 48imaging, 48kinetics, 267–270lifetime, 268–270quantum yield, 49quenching, 48–49
fluorescent protein, 48, 269fluorobenzene, 132fluorophore, 48flux, 359–360food energy, 93Forster resonant energy transfer, 48–51, 267–270free energy
and entropy, 143and equilibrium, see equilibriumGibbs, 143, 145, 148–151, 157–159, 203, 230
and electromotive force, 202–203and temperature, 173–177data, 375–378of formation, 146standard, 146
Helmholtz, 142–144machine, 152
freezer, see refrigeratorfreezing, 79–81, 139freezing point
depression, 79, 174frequency, 8
natural, 36FRET, see Forster resonant energy transferfrictional coefficient, 363fuel cell, see cell

P1: SFK Trim: 247mm × 174mm Top: 14.586mm Gutter: 23.198mm
CUUK1808-IND CUUK1808/Roussel 978 1 107 00678 2 October 31, 2011 7:58
Index 439
Gibbs free energy, see free energyGibbs paradox, 117global warming, 38glutamine synthetase, 167–168glycerol, 79, 169glycolysis, 169, 172, 182gravity
standard, 384greenhouse gas, 38Grotthuss mechanism, 369ground state, 18, 334
Haldane, John Burdon Sanderson, 290half-life, 234, 246–249, 260–261half-reaction, 204halogen oxides, 227, 235–236, 256–258halogenation, 238–239harmonic oscillator, 35haste, see wasteheat, 58–60, 69
and enthalpy, see enthalpyand internal energy, see energyflow, 113–115latent, 78of dilution, 87reversible, 111
heat capacity, 71–75data, 375–378solution, 86–87statistical, 76–78
heat engine, 109, 132–135, 215efficiency, 134
Helmholtz free energy, see free energyhemoglobin, 181, 405–406Henri, Victor, 287, 290Henry’s law, 160Hertz, 8HOMO, 20humidity
relative, 179hydrogen peroxide, 304hydrogen–bromine reaction, 278–280, 330–332hydrophobicity, 30hydroxyl radical, 393
ice fog, 180ice nucleating protein, 80ideal gas, 66, 72–73, 112, 116–117, 382ideal gas constant, 384ignorance, 120infrared spectroscopy, see spectroscopyinhibition, see product inhibition, see chain reaction,
see enzymeinitial rate, see rateinorganic phosphate, 146integrals
table, 391
intensive property, 110, 203intermediate, 227internal combustion engine, 134–135internal energy, see energyionic atmosphere, 189–190ionic strength, 146, 191
and rate constants, 351–355isotherm, 65isothermal, 65, 128, 144isotopic fractionation, 29
Joule heating, 320–322
Kelvin, Lord (William Thomson), 109kelvins
vs. degrees Celsius, 73kinetic energy, 24kinetic theory, 223kinetics, 1Kirschenbaum, David, 53
Lambert–Beer law, see Beer–Lambert lawlaser, 19, 53–54laser heating, see optical heatingLavoisier–Laplace calorimeter, 100law of mass action, see mass actionLe Chatelier’s principle, 173least-squares fitting, see linear regressionLeclanche cell, 155lifetime, see fluorescencelight, 7–13
speed, see speed of lightLindemann mechanism, 274–276linear regression, 175, 294Lineweaver–Burk plot, 293–295liquid junction potential, 207lock-and-key theory, 289logarithm
properties, 388LUMO, 20
macroscopic, 57mass action, 228–229, 287matter
wave properties, 15–22Maxwell’s equations, 8mechanism, 226melting, 79, 90–91melting point
normal, 83membrane potential, see potential, transmembranemercury halides, 236–237metabolizable energy, see catabolizable energymetastability, 79methanol, 131, 155–156, 373methotrexate, 351Michaelis constant, 291

P1: SFK Trim: 247mm × 174mm Top: 14.586mm Gutter: 23.198mm
CUUK1808-IND CUUK1808/Roussel 978 1 107 00678 2 October 31, 2011 7:58
440 Index
Michaelis–Menten mechanism, 164, 288–296microscopic reversibility, 230–231, 283microstate, 118microwave oven, 21mixing, 116–118, 122mobility, 207model, 279molality, 145, 187molar absorption coefficient, see absorption
coefficientmole density
water, 380mole fraction, 117, 149, 187molecular orbital, 19monochromator, 32muscle, 152
N -formylmethionine, 50natural frequency, 36Nernst equation, 203neuron, 213neutron mass, 384Newton’s law (of cooling or warming), 253–254nitration, 338nitrogen, 38nitrogen oxides, 226, 238, 281, 337nonequilibrium thermodynamics, 2Norrish, Ronald, 319nuclear reactor, 108nucleation, 79, 80, 180
Oktaba, Walter, 109one-child policy, 252optical heating, 322order of reaction, 228, 235
partial, 228pseudo, 263
oxalate, 236–237oxidation, 204, 206oxidizing agent, 204oxygen, 29, 38, 53, 159–160
debt, 104transport, 405–406
ozone, 163, 238, 281
papain, 288papaya, 288partial derivative, 25particle in a box, 16–20
and translational energy, 23–24particle on a ring, 21–22partition coefficient, 175–177partition function, 27–28, 118
and entropy, 118–120and heat capacity, 76–78and internal energy, 76–77molecular, 25, 76–78, 334
pasta, 174path dependence, 63path function, 63, 69path independence, 63Pauli exclusion principle, 19periodic table, 386permittivity, 192
relative, 192vacuum, 384water, 380
perpetual motionfirst kind, 68second kind, 109
pH, 162phase
condensed, 90transition, 78–81
phenomenological kinetics, 223phosphate
inorganic, 146phosphorylation, 166–167photochemical equivalence, 10, 19photoelectric effect, 10photon, 10–11
momentum, 11–13physical chemistry, 1–2Planck’s constant, 384Planck, Max, 10platinum, 209pMg, 146popcorn, 183–184population growth, 252Porter, George, 319potassium permanganate, 35, 40–41potential
electric, see electromotive forceliquid junction, 207reduction, see reduction potentialtransmembrane, 213–214
pressure, 64standard, 82vapor, see vapor pressure
pressure jump, 322–324probability
density, 16, 334wave, 15
product inhibition, 238proflavin, 232–233, 328progress curve, 225protein, 7, 15, 102, 164, 288
absorption coefficient, see absorption coefficientactivity coefficient, 200–201conformation, 52, 126denaturation, 31fluorescent, see fluorescent proteinfolding, 30–31, 78, 289solubility, 199

P1: SFK Trim: 247mm × 174mm Top: 14.586mm Gutter: 23.198mm
CUUK1808-IND CUUK1808/Roussel 978 1 107 00678 2 October 31, 2011 7:58
Index 441
protondiffusion, 369mass, 384
pseudo order of reaction, see order of reaction
quantization, 17quantum mechanics, 1quantum number, 17quantum yield, 49quasi-adiabatic, 74quinone, 96
radioactive decay, 248–252radioisotope dating, see datingRana sylvatica, 80, 106Raoult’s law, 161rate, 223–225
constant, 228, 330and ionic strength, 351–355and temperature, 335–337diffusion-limited, 367–368elementary, 228empirical, 235in diffusion-influenced reactions, 365time-dependent, 367transition-state theory, 339–343
initial, 225, 234–235law, 225
deriving, 280–281, 310empirical, 235–242first order, 245–246integrated, 244–267second order, 256
rate constant, 241, 258rate-limiting step, 276reaction
channel, 227complex, see complex reactioncoordinate, 331, 333dynamics, 2, 223, 227elementary, see elementary reactionintermediate, see intermediatemechanism, see mechanismorder, see order of reactionquotient, 150rate, see ratevelocity, see rate
reactive distance, 365red blood cell, 170redox reaction
balancing, 204–206reducing agent, 204reduction, 204reduction potential, 208–211
data, 379refrigerator, 136–138
coefficient of performance, 137
related rates, 224relativity, 11, 13relaxation methods, 320–328relaxation time, 325reversibility, 65, 66, 111, 142, 202Reynolds number, 315ribosome, 50–51RNA, 288
transfer, 50, 325–326rotational
energy, 23, 24spectroscopy, see spectroscopy
salt bridge, 207–208salting in, 194, 199salting out, 199scuba diving, 184sea hare, 404sea slug, 404Second Law of Thermodynamics, 109–110, 113, 134,
138–139, 141, 143information perspective, 120Kelvin statement, 109, 132
second-order reaction, 256, 263–267selection rule
vibrational, 37separation of variables, 41, 244Shimomura, Osamu, 48SI system of units, 381–383sign convention, 59–60single-beam spectrometer, see spectrometersodium-potassium cotransport, 169–172solar sailing, 12–13solubility
gas, 159–160ionic compound, 161–162, 185, 194,
196–198product, 161–162
solvent caging, 365specific absorption coefficient, 42specific growth rate, 252specific quantity, 60–61spectrometer
diode array, 33, 318dual-beam, 32–33fluorescence, 46–48single-beam, 32
spectrophotometry, 42spectroscopic ruler, see Forster resonant energy
transferspectroscopy, 19, 31
absorption, 19–20electronic, 28, 39–41fluorescence, 46–48infrared, 9–10, 24, 28, 34–38rotation-vibration, 35–37rotational, 29

P1: SFK Trim: 247mm × 174mm Top: 14.586mm Gutter: 23.198mm
CUUK1808-IND CUUK1808/Roussel 978 1 107 00678 2 October 31, 2011 7:58
442 Index
spectroscopy (cont.)UV/visible, 24, 28, 31, 35, 39–41vibrational, 28, 35–38
spectrum, 32speed of light, 7, 8, 8, 384spontaneous, 113spreadsheet, 196standard gravity, 384standard pressure, see pressurestandard state, 82, 87, 145–146, 149, 159
biochemists’, 145–146Stark–Einstein law, see photochemical equivalencestart codon, 50state, 57
function, 62, 68–70, 83, 144microscopic, see microstatevariable, 62
statistical moment, 293statistical thermodynamics, 1, 76–78, 118–121steady state, 249steady-state approximation, 275–278Stern, Kurt, 394Stirling’s approximation, 122Stokes–Einstein relation, 364stopped flow method, 317substrate, 287supercooling, 79–80superheating, 80, 174superoxide, 304system, 60
table headings, 3temperature, 58–59, 71, 111
standard, 145temperature jump, 320–322thermal wavelength, 14thermodynamically allowed, 113, 141, 143, 159, 203thermodynamics, 1, 57
classical, 57equilibrium, 57
thermometer, 59third body, 422Third Law of Thermodynamics, 128–131, 134, 138titanium, 165–166transfer RNA, see RNAtransition state, 331
analog, 351transition-state theory, 2, 339–351
and complex reactions, 347–350and enzymes, 350–351
translation, 50–51translational
energy, 23, see particle in a boxtransmembrane potential, 213–214transport equation, 360–361transporter, 169–170, 297–298Trouton’s rule, 140
tryptophan, 51Tsien, Roger, 48tunneling, 16, 338turkey, 138turnover number, see enzymetwo-photon process, 19
uncertainty, 16uncompetitive inhibition, see enzymeuric acid, 45, 195–196urinary stones, 178UV/visible spectroscopy, see spectroscopy
vacuum permittivity, see permittivityvan’t Hoff method, 239–242vapor pressure, 160–161, 187
water, 380velocity, see ratevibrational
energy, 23, 24, 35modes, 37
carbon dioxide, 38water, 37
selection rule, 37spectroscopy, see spectroscopy
vibronic transition, 40–41visible spectrum, 11vitamin C, 393voltage, see electromotive forcevoltmeter, 202
warming, see Newton’s lawwaste, 142water, 177, 373, 380
autoionization, 173, 327–328, 368–369density, 321vibrational modes, 37
wave, see electromagnetic, see matter, see probabilitywave-particle duality, 10–15wavefunction, 16wavelength, 8
de Broglie, 13–15thermal, 14
wavenumber, 9–10wood frog, see Rana sylvaticawork, 58, 60, 69
electrical, 58, 203maximum, 134, 142, 144, 145mechanical, 64pressure-volume, 64–66, 111reversible, 111
X rays, 75–76xanthine, 178–179
zero-point energy, 18, 36, 128, 337Zewail, Ahmed, 319

P1: SFK Trim: 247mm × 174mm Top: 14.586mm Gutter: 23.198mm
CUUK1808-APP-K CUUK1808/Roussel 978 1 107 00678 2 October 31, 2011 6:58
Answers to exercises 1
Answers to end-of-term review problems
(1) 5 J of work was done by the system.(2) In common language, spontaneous implies “will happen.” Even scientists tend to use the word
this way. However, the sense usually given to spontaneous in thermodynamics is “could happen.”The phrase “thermodynamically allowed” removes this potential ambiguity.
(3) An irreversible reaction would have an infinite equilibrium constant or, equivalently, an infinitelynegative value of �rG
◦m. Since �rG
◦m = �rH
◦m − T �rS
◦m, this would imply that either �rH
◦m
is infinitely negative (unlimited heat production), or �rS◦m is infinitely positive (infinite increase
in the number of microstates of the system), neither of which is possible.(4) (a) True. This equation relates the energy of an individual photon (seen as a particle) to the
frequency, a wave property.(b) False. The probability also depends on the degeneracy of the level.(c) False. At constant volume, we get �rU .(d) False. Suppose we’re at constant temperature and pressure. Then we can decide whether a
reaction is thermodynamically allowed or not using �rG = �rH − T �rS. For an exother-mic reaction, �rH < 0. However, �rG could be positive, i.e. the reaction might not bethermodynamically allowed, if −T �rS is positive and larger than |�rH |, i.e. if �rS issufficiently negative.
(e) False. Debye–Huckel theory only applies to charged solutes, and only at low ionic strengths.It tells us nothing about the activity coefficients of uncharged solutes, which can differsignificantly from unity.
(f) True, by definition.(g) True. This is a gas-phase unimolecular reaction. These almost always follow the Lindemann
mechanism. Certainly, a stable, isolated molecule doesn’t just fall apart on its own, so someform of activation is required.
(h) True. Activation energy is the height of the energy barrier separating reactants and products.It can be zero, but it can’t be negative.
(i) False. The encounter pair just represents two molecules sitting next to each other. Thetransition state is formed after the encounter pair.
(j) True, by convention(k) False. �S, without any special notations, usually refers specifically to the system. It is the
entropy change of the universe as a whole which must increase.(l) True. This is a consequence of the Third Law.(m) True. We can prove either one from the other.(n) False. Catalysts do not change the thermodynamics of a reaction.(o) False. Fuel cells are limited by the free energy change of a reaction, whereas heat engines
can only convert a fraction of the enthalpy change into work.(p) False. E determines whether a reaction is thermodynamically allowed or not, not E◦.(q) True. In order for this reaction to occur, we need to break an Fe–C bond, break up the
hydroxide ion, transfer its oxygen atom to CO, and make a new bond between the ironatom and the resulting hydride ion. This seems like a lot to do in one step.
(5) (a) The absorbance at a given wavelength of a 1 mol L−1 solution of a particular solute in a cell ofpath length 1 cm (b) The non-zero minimum energy that quantum mechanical systems typicallymust have (c) Either of the following is an acceptable answer: (i) Energy is conserved. (ii)�U = q + w. (d) Suppose that we have one reaction that, by itself, is not thermodynamicallyallowed. If we add a second reaction that removes one of the products of the first, and if the overallfree energy change for the two reactions put together is negative, then the first reaction can occur.We say in these cases that we have coupled reactions. (e) In indirect calorimetry, we measuregas exchange in a living organism, and perhaps also analyze urine. We use these measurements

P1: SFK Trim: 247mm × 174mm Top: 14.586mm Gutter: 23.198mm
CUUK1808-APP-K CUUK1808/Roussel 978 1 107 00678 2 October 31, 2011 6:58
2 Answers to exercises
to estimate the energy used by the organism based on the known stoichiometry of oxygen used,carbon dioxide generated and urea generated in metabolizing different storage compounds(fat, carbohydrates, protein), and on the energy released in these metabolic processes. (f) Amicrostate (microscopic state) is an arrangement of the components of a system (including theenergy stored in the molecules) that is consistent with a given macroscopic state. (g) �S fora reaction between thermodynamic equilibrium states approaches zero as T approaches zero,i.e. the entropy of a thermodynamic equilibrium state approaches a constant as T → 0. (h) Thevapor pressure of a compound is the equilibrium pressure of its vapor over a given condensedphase (solid or liquid) at a particular temperature.
(6) (a) Photons. (b) Both. (c) Photons. (d) Particles.(7) (a) The cell emf. (b) The emf for a cell under standard conditions. (c) The number of electrons
exchanged in the redox process for the reaction as written.(8) (a) This is almost certainly not elementary. Three bonds have to be broken and three bonds
made. That’s a bit too much to happen in one step. (b) This one could be elementary as it onlyinvolves the transfer of an oxygen radical anion (O−) to NO.
(9) Rate constants increase with T because they depend on temperature according to the ArrheniusEquation (17.2). For an elementary reaction, the equilibrium constant is related to the rateconstants by:
K = kforward
kreverse=
Aforward exp(−Ea,forward
RT
)Areverse exp
(−Ea,reverse
RT
) = Aforward
Areverseexp
(−(Ea,forward − Ea,reverse)
RT
)
If Ea,forward − Ea,reverse > 0, i.e. if Ea,forward > Ea,reverse then K increases with temperaturebecause the rate constant for the forward reaction increases more quickly with temperaturethan for the reverse reaction. (Think about the slopes of the Arrhenius plots for the forward andreverse reactions.) Note that Ea,forward − Ea,reverse = �rUm, so we’re saying that K increaseswith T for an endothermic reaction, which agrees with the discussion of Section 8.6. [You mayobject that in Section 8.6, it is �rHm that determines whether an equilibrium constant increasesor decrease with temperature, whereas here we’re looking at �rUm. This is a valid objectionsince, for reactions which are nearly thermo-neutral (�rHm and �rUm both close to zero), it ispossible for these two quantities to have different signs, although in practice this is extremelyrare. The problem is that the Arrhenius equation, which is only derived heuristically, is onlyapproximately correct.] If we look at the case �rUm = Ea,forward − Ea,reverse < 0, we concludeusing similar reasoning that K decreases with increasing temperature for an exothermic reaction,again in agreement with Section 8.6.
(10) �A < 0 for a thermodynamically allowed process at constant T and V .�A = wrev for a process at constant T .
(11) �G gives the maximum non-P V work at constant temperature and pressure.(12) The Second Law requires the entropy change of the universe to be positive. The argument is
wrong because it says nothing about the entropy change of the surroundings. We simply can’tconclude anything from the information given in the question.
(13) The activity of the solvent is its mole fraction. Except for very concentrated solutions, the molefraction of the solvent is usually very close to unity.
(14) In an initial rate experiment, we determine the rate in the very early moments of the reaction.The main advantage of an initial rate experiment is that the effects of changes in concentration
of reactants and products during the reaction don’t need to be considered. This simplifies theanalysis of the results. In particular, since products don’t accumulate to a significant extent,we don’t need to worry about the reverse reaction unless we have specifically designed theexperiment to investigate the effect of the product on the reaction rate by adding knownamounts of product to the reaction mixture.

P1: SFK Trim: 247mm × 174mm Top: 14.586mm Gutter: 23.198mm
CUUK1808-APP-K CUUK1808/Roussel 978 1 107 00678 2 October 31, 2011 6:58
Answers to exercises 3
The main disadvantage of initial rate experiments is that they tend to be labor intensive. Weneed to vary the concentrations of each reactant and of other species of interest such as catalystsand sometimes, as mentioned above, of products. Each different combination of concentrationsrepresents a separate experiment.
(15) The relative populations are given by
N (E2)
N (E1)= P (E2)
P (E1)= g2
g1exp
(− �E
kBT
)
Since �E > 0, the Boltzmann factor increases from 0 to 1 as T goes from 0 to large values.Thus, if g2 = g1, the populations can only become equal at very large temperatures (technically,at infinite T ). If g2 < g1, then the relative populations can be seen to always be in a ratio of lessthan unity. Finally, if g2 > g1, then at large temperatures the population ratio will be larger thanunity, which implies that there is a temperature where the two populations cross.
(16) C6H8O6(aq) + 2OH(aq) → C6H6O6(aq) + 2H2O(aq) with νe = 2(17) 3Br2 + 6OH− → BrO−
3 + 3H2O + 5Br−
(18) (a) E1 = 6.025 × 10⁻²⁰ J, E2 = 2.410 × 10⁻¹⁹ J. (b) ν = 2.728 × 10¹⁴ Hz, λ = 1.099 μm,ν = 9099 cm−1. (c) 6.029 × 10⁻²⁸ kg m s1. (d) p1 = 3.313 × 10⁻²⁵ kg m s−1, p2 = 6.626 ×10⁻²⁵ kg m s1. (e) If we assume that the electron is traveling in the same direction after absorp-tion as before, we get a change in momentum of �p = p2 − p1 = 3.313 × 10⁻²⁵ kg m s−1. Thisis the smallest possible change in momentum for the particle, and it is much larger than themomentum of the photon. Accordingly, momentum is not conserved in this process. Wheredoes the extra momentum come from? The only possible answer is that the box itself mustacquire a momentum equal and opposite to the extra momentum of the particle. Since the boxwould typically either be much more massive than the electron itself, or would be anchored toa massive object, this change in momentum would more than likely not be detectable. Even ifwe think about the cyanine dyes discussed in Example 2.10, whose conjugated π orbitals aremolecular scale boxes, the ratio of the mass of one electron to the mass of the whole moleculeis very, very small.
(19) �E = 3.33 × 10⁻²¹ J, g2/g1 = 2(20) 0.05(21) 2.63 × 10⁻¹¹ m. This is very small, especially considering that a hydrated proton is bound to
several water molecules. This small effective radius is almost certainly due to the Grotthussrelay mechanism (page 369).
(22) (a) �rGm = 16.00 kJ mol−1 > 0, so not thermodynamically allowed. (b) Enzymes don’t affectthe overall thermodynamics of a reaction, only its rate.
(23) (a) The 500 and 629 nm bands of the enzyme don’t overlap those of the enzyme–substratecomplex. Also, the 570 nm band of the enzyme–substrate complex doesn’t overlap any ofthe enzyme’s bands. These three bands would therefore be the most convenient ones to usein a spectrophotometric study.
(b) Make solutions of the enzyme and substrate of known concentrations. Put a measuredvolume of the enzyme solution into a spectrophotometric cuvette, leaving enough room inthe cuvette for the substrate solution to be added later. (This might take a little planningto make sure that the enzyme solution is fully in the spectrophotometer’s beam, althoughmodern dip probes could be used to get around this problem. Given a dip probe attachment,we could use a test tube instead of a cuvette.) Acquire the spectrum. Now add a measuredvolume of substrate solution to the solution and mix. Acquire another spectrum. For theenzyme spectrum, divide the absorbance at either (or both) of the wavelengths givenabove for the enzyme by the enzyme concentration and by the path length to get themolar absorption coefficient. For the enzyme–substrate spectrum, we can calculate the

P1: SFK Trim: 247mm × 174mm Top: 14.586mm Gutter: 23.198mm
CUUK1808-APP-K CUUK1808/Roussel 978 1 107 00678 2 October 31, 2011 6:58
4 Answers to exercises
−3.5
−3
−2.5
−2
−1.5
−1
−0.5
0
0.5
1
1.5
2
3 3.1 3.2 3.3 3.4 3.5 3.6 3.7 3.8 3.9
ln(η
−1
FR
ET −
1)
ln(R/Å)
Figure K.11 Graph of the data of end-of-term question 28.
concentration of the complex because the enzyme is quantitatively converted to enzyme–substrate complex by the excess of substrate. The concentration in the final solution iscalculated taking into account the dilution of the solution by the addition of the substratesolution. The molar absorption coefficient is again calculated by dividing the absorbanceat 570 nm by the path length and concentration.
(c) Yes. From the concentration and molar absorption coefficient, we calculate A623 = 1.00.The small difference between this expected value and the measurement could be due toany of a number of factors: minor impurities in the enzyme sample, minor differences inspectrometer responses, etc.
(d) 47 kJ mol−1
(24) 9.7 h(25) −56.2 kJ mol−1
(26) 4.38 × 10⁻⁶
(27) (a) The balanced reaction is
CO2−3(aq) + 2H+
(aq) → H2O(l) + CO2(g).
Gases have a particularly high entropy, so we expect �rSm > 0. (b) 333.72 J K−1mol−1.(28) (a)
1
ηFRET= 1 + (R/R0)6
∴ 1
ηFRET− 1 = (R/R0)6
∴ ln
(1
ηFRET− 1
)= 6 ln R − 6 ln R0
If we plot ln(η−1
FRET − 1)
vs. ln R, we should therefore get a line with a slope of 6 and anintercept of −6 ln R0. The former will allow us to verify the R6 dependence of the FRETefficiency, while the latter will allow us to recover the value of R0.
(b) The graph is shown in Figure K.11. The fit is reasonable, with a slope of 5.79, in reasonableagreement with the expected value of 6. The intercept is −6 ln R0 = −20.51, so R0 =30.5 A.

P1: SFK Trim: 247mm × 174mm Top: 14.586mm Gutter: 23.198mm
CUUK1808-APP-K CUUK1808/Roussel 978 1 107 00678 2 October 31, 2011 6:58
Answers to exercises 5
-6
-5
-4
-3
-2
-1
0
0 100 200 300 400 500
lnf
t/s
Figure K.12 Plot of the data from end-of-term question 30.
(29) (a) Ea = 82.2 kJ mol−1, A = 3.84 × 10⁸ s−1. (b) �‡S = −88.9 J K−1mol−1. The transition statehas many fewer microstates than the reactants.
(30) We need a variable proportional to the concentration of reactant, not product. Therefore definef = 1 − X and plot ln f vs. t . The graph is shown in Figure K.12. It is essentially perfectlylinear, which shows that the data obey first-order kinetics. The rate constant is 0.011 s−1.
(31) (a) −2806 kJ mol−1. (b) −15.6 kJ.(32) −326.6 kJ mol−1
(33) (a) If the reaction is elementary, then according to the law of mass action, it should obeysecond-order kinetics. The simplest way to show that it does is to draw a graph of 1/[C2F4] vs.t . The graph (not shown) shows an essentially perfect linear relationship with a rate constant ofk = 8.01 × 10⁻² L mol−1min−1. 120 min. 1.4 × 10⁹ L mol−1.
(34) (a) v = k1k2[Hg2+2 ][Tl3+]
k−1[Hg2+]. (b) According to our rate law, doubling the mercury (II) ion con-
centration cuts the rate in half.(35) (a)�rGm = 17.4 kJ mol−1 > 0 therefore the reaction is not thermodynamically allowed. (b) In
the biochemists’ standard state, we do not distinguish between different ionization states ofphosphate (PO3−
4 , HPO2−4 , etc.).
(36) −952.6 kJ mol−1
(37) (a) 3kB ln 2. (b) nkB ln 2. (c) If we double the size of the system (in this case the number ofrandom bits generated), the entropy should double. Note that S is proportional to the number ofrandom bits, so the entropy of these n-bit random number generators is an extensive quantity.
(38) (a) −3.392 kW. (b) The temperature would decrease by 25 K per hour under these conditions.(39) (a) 0.030 s−1. (b) 4.1 × 10⁻¹¹ mol L−1s−1. (c) 0.0002 s.
(40) (a) v ≈ k1k2[PP][DPPH]2
k−1 + k2[DPPH]. If k2[DPPH] k−1, then this rate law reduces to v ≈
k1k2
k−1[PP][DPPH]2. (b) The graph of 1/[DPPH] vs. t (not shown) is linear, so the reaction
does obey second-order kinetics with rate constant k = 448 L mol−1min−1.(41) We can calculate �rG = −742.95 kJ mol−1 under the given conditions. This reaction is there-
fore thermodynamically allowed. Thus, SF6 is non-hydrolyzable because of kinetic rather thanthermodynamic factors.

P1: SFK Trim: 247mm × 174mm Top: 14.586mm Gutter: 23.198mm
CUUK1808-APP-K CUUK1808/Roussel 978 1 107 00678 2 October 31, 2011 6:58
6 Answers to exercises
(42) 2.6116 V with electrons flowing from the Li to the Cd electrode(43) (a) vmax = 3.41 mol min−1(molenzyme)−1, KM = 90 μmol L−1. (b) vmax is given here in moles
of product formed per mole of enzyme. This is precisely the definition of the turnover numberkcat (k−2 in the simple Michaelis–Menten mechanism).
(44) (a) (i) −36.6 kJ mol−1. (ii) −9.3 kJ mol−1. (iii) −92 J K−1mol−1. �rS◦ < 0 as expected since
the the folded form has fewer microstates. (b) −105 kJ mol−1. (c) Let F = folded, U = unfoldedand A = aggregate. The third equation expresses the conservation of monomers:
aU + aF + 2aA = 5.0 × 10⁻⁴
Use the two equilibrium relationships with this equation to obtain one equation in one unknown,then solve this equation using your calculator’s equation solver. You should get
[F] = 3.55 × 10⁻⁴ mol L−1
[U] = 8.46 × 10⁻⁶ mol L−1
[A] = 6.81 × 10⁻⁵ mol L−1
(45) (a) (i) A laser flash at an appropriate wavelength causes bond breakage, in this case splittingS2O2−
8 into two SO−4 ions, which go on to react with NO−
3 to make SO2−4 and NO3.
The reaction of NO3 with a carboxylic acid can then be followed spectroscopically.To carry out this experiment, we would dissolve a peroxodisulfate salt (e.g.
Na2S2O8), a nitrate salt (e.g. NaNO3) and the carboxylic acid together in water. Thereaction is initiated by the laser flash, which can be very fast. The experiment yieldsspecific information on the reaction of NO3 with the carboxylic acid provided thereaction of SO−
4 with NO−3 is fast.
(ii) 4 × 10⁹ L mol−1s−1.(b) Overall, we have
−dNO3
dt= k[R][NO3] + kb[NO3]
where kb is the rate constant for background decay. If [R] � [NO3], then [R] is roughlyconstant during the reaction, and we get
−dNO3
dt= kobs[NO3]
where
kobs = k[R] + kb
A plot of the observed rate constant kobs vs. [R] should therefore give a straight line ofslope k.
(c) k = 1.03 × 10⁶ L mol−1s−1.(d) Ea = 27.3 kJ mol−1, A = 9.89 × 10¹⁰ L mol−1s−1.
(46) See Figure K.13. Note that the product C could be either higher or lower in entropy than thetransition state (TS), depending on the nature of the latter.
(47) (a) −3.5 × 10² J The negative sign means that work is done by the system on its surroundings.(b) 1.77 × 10³ J. (c) 1.42 kJ.
(48) (a) The overall reaction can be decomposed as follows:
SrSO4(s) → Sr2+(aq) + SO2−
4(aq) K1 = Ksp(SrSO4)Sr2+
(aq) + CO2−3(aq) → SrCO3(s) K2 = 1/Ksp(SrCO3)
SrSO4(s) + CO2−3(aq) → SrCO3(s) + SO2−
4(aq) K = Ksp(SrSO4)/Ksp(SrCO3)

P1: SFK Trim: 247mm × 174mm Top: 14.586mm Gutter: 23.198mm
CUUK1808-APP-K CUUK1808/Roussel 978 1 107 00678 2 October 31, 2011 6:58
Answers to exercises 7
S
x
A+B
TS
C
Δr S
‡ SΔ
Figure K.13 Entropy profile for question 46.
This reaction will have a large equilibrium constant if Ksp(SrSO4) � Ksp(SrCO3). (b) 611.(c) −560 kJ mol−1. (d) 7.57 × 10⁻⁴ mol L−1.
(49) (a) 2. (b) 3.8 × 10⁻⁴ mol L−1s−1. (c) 0.83 L3/2mol−3/2s−1. (d) This reaction is certainly notelementary. An elementary reaction with this stoichiometry would have a rate law v = kab, bythe law of mass action.
(50) (a) −131.53 kJ mol−1. (b) This is −�f S◦, where �f S◦ is the standard entropy change offormation, i.e. the entropy change in the formation of GaN from its elements under standardconditions. (c) 1120 K. (d) 1253 K. Looking at the formation reaction, Le Chatelier’s principlewould predict that increasing the pressure of nitrogen should shift the equilibrium toward theproducts, i.e. make GaN stable over a wider temperature range or, in other words, raise thedecomposition temperature, which is exactly what we observe.
(51) (a) Reduction. (b) According to the law of mass action, the first reaction should have a second-order rate law, while the second reaction should have a first-order rate law. In the latter case, afirst-order rate law arises because the solvent is in great excess. The reaction thus has no realeffect on its concentration. (c) We can eliminate a second-order rate law from the obviouslynon-linear appearance of a graph of I−1 vs. t (not shown). Reasonable people could havedifferent opinions on the linearity of the ln I vs. t graph, but to my eye, it seems reasonablylinear (Figure K.14). For my part, I think that the data display reasonable linearity, so I wouldconclude that (ii) is the likely mechanism, and report a rate constant of 0.056 s−1.
(52) Here is a brief outline of the method of attack: apply enzyme conservation to eliminate e = e0 −c − x. Apply the equilibrium approximation to reaction steps 1 and 3: k1(e0 − c − x) = k−1c andk3(e0 − c − x) = k−3x. (You could also apply the steady-state approximation to c. The resultswould be similar except that k−1 would be replaced by k−1 + k−2 in the final expressions.) Solveone of these equations for x, then substitute into the other equation, which is then solved for c.Substitute your equation for c into v = k−2c. The final result can be rearranged to the form
v = vmaxs
s + KM
with vmax = k−2e0, KM = KE(1 + 1/KI), KE = k−1/k1 and KI = k−3/k3.(53) (a) Ea = 55.0 kJ mol−1, A = 1.46 × 10¹¹ s−1. (b) −39.5 J K−1mol−1. Since the entropy of acti-
vation is negative, the number of microstates decreases on going to the transition state. Breakingup the complex into enzyme and product will increase the entropy, so the transition state mustoccur earlier, i.e. during the actual conversion of S to P in the enzyme.
(54) 109 cal day−1

P1: SFK Trim: 247mm × 174mm Top: 14.586mm Gutter: 23.198mm
CUUK1808-APP-K CUUK1808/Roussel 978 1 107 00678 2 October 31, 2011 6:58
8 Answers to exercises
-3
-2.5
-2
-1.5
-1
-0.5
0
0.5
1
1.5
10 20 30 40 50 60 70 80 90
lnI
t/s
Figure K.14 First-order plot for the data of question 51c.
(55) (a) We calculate �rGm = 111.7 kJ mol−1, so this reaction is not thermodynamically allowedgiven the initial and final states of the calorimeter. However, during the combustion processitself, the temperature of the sample rises far above 25 ◦C for a short period of time, allowing CaOto be formed. Presumably, the reverse reaction is much slower than the calorimetry experiment,so calcium carbonate is not reformed sufficiently quickly to cancel the heat of decompositionof calcium carbonate. (b) �ru = 1.758 kJ/g.
In the calorimeter, we have the following heat balance:
q = 0 =⎧⎨⎩
heat ofcombustion ofbiomolecules
⎫⎬⎭+⎧⎨⎩
heat ofcombustion
of fuse
⎫⎬⎭+⎧⎨⎩
heat ofdecomposition
of CaCO3
⎫⎬⎭
+{
warming ofcalorimeter
}
Knowing the mass percent of CaCO3 in the sample, we can calculate the third term and thuscorrect for its effect on the combustion energy of the biomolecules, which is usually what wewant to know.
(56) (a) 239.5 kJ mol−1. (b) 6.00 × 10¹⁴ Hz. This is in the yellow-green region of the visible spectrum.(57) (a) −22.4 kJ mol−1.
(b) (i) −52.4 kJ mol−1. (ii) −44.8 kJ mol−1. (iii) −7.6 kJ mol−1.(c) [HbO2]/[Hb] = 2.8, [Hb(O2)2]/[HbO2] = 63, [Hb(O2)3]/[Hb(O2)2] = 2.7,
[Hb(O2)4]/[Hb(O2)3] = 198. At this oxygen concentration, there is more of eachform than of the previous, and there is almost 200 times more Hb(O2)4 than of Hb(O2)3.The fully oxygenated form must therefore make up about 99.5% of the total hemoglobin.(If you calculate this number accurately, you find that 99.3% of the hemoglobin is in thefully oxygenated form.)
(d) If there were no cooperativity, then each form would only be more abundant than theprevious by a factor of about 2.8. Many of the states of hemoglobin would in fact coexistunder the stated conditions. (If you prefer hard numbers to this qualitative argument, you cancalculate that the fully oxygenated form only accounts for 64.6% of the total hemoglobinif binding is not cooperative.)

P1: SFK Trim: 247mm × 174mm Top: 14.586mm Gutter: 23.198mm
CUUK1808-APP-K CUUK1808/Roussel 978 1 107 00678 2 October 31, 2011 6:58
Answers to exercises 9
x
G
A+B
D
+37
−46 kJ mol-1
Figure K.15 Gibbs free energy vs. reaction coordinate for the data of end-of-term problem 59.
(58) (a) 1.13 × 10⁻⁸. (b) 0.642.(59) (a) �rH
◦m = −47.7 kJ mol−1. Depending on how you calculate �rG
◦m, you get either
�rS◦m = −6.09 J K−1mol−1 and �rG
◦m = −45.9 kJ mol−1, or �rS
◦m = −4.62 J K−1mol−1
and �rG◦m = −46.3 kJ mol−1.
(b) For a binding event, we might expect a relatively large and negative value of �rS◦m because
you would think that binding two molecules together, particularly when it involves com-plementary base pairing, would greatly decrease the number of microstates available to thesystem. The value we calculate is negative, but it is actually very small. Because single-stranded DNA would be expected to hydrogen bond to many water molecules, binding oftwo single strands would liberate many water molecules, which would tend to increase theentropy of the system. It turns out that the two contributions to the entropy nearly balance.
(c) [SS] = 1.86 × 10⁻⁷ mol L−1, [DS] = 3.81 × 10⁻⁶ mol L−1.(d) We would put single strand A in one syringe and single strand B in the other. The stopped
flow apparatus mixes A and B rapidly. We then monitor the reaction over time. (It turnsout that the absorbance at 260 nm is a good variable to follow for DNA double strandformation.)
(e) v = k[A][B]. If [A] = [B], then v = k[A]2.(f) Ea = 20.55 kJ mol−1, A = 7.053 × 10⁹ L mol−1s−1
(g) 10.9 s(h) �‡H ◦
m = 18.08 kJ mol−1, �‡S◦m = −64.69 J K−1mol−1, �‡G◦
m = 37.36 kJ mol−1 (I calcu-lated these quantities from the activation energy and pre-exponential factor. Your resultsmay differ slightly if you used an Eyring plot.)
(i) To get to the transition state, we have to bring two single strands together and, probably,some of the hydrogen bonding bases have to line up with each other, which greatly reducesthe number of microstates occupied by the system compared to two strands that are far apartfrom each other. This typically results in entropy reductions of this order of magnitude.
(j) See figure K.15.
(60) v = vmaxab
a(K2 + b) + K1K2with vmax = k−3e0, K1 = k−1/k1 and K2 = k−2/k2.