a life cycle cost analysis framework for...
TRANSCRIPT

SANDIA REPORT SAND2010-6938 Unlimited Release Printed October 2010
A LIFE CYCLE COST ANALYSIS FRAMEWORK FOR GEOLOGIC STORAGE OF HYDROGEN: A SCENARIO ANALYSIS Anna S. Lord, Peter H. Kobos and David J. Borns
Prepared by Sandia National Laboratories Albuquerque, New Mexico 87185 and Livermore, California 94550
Sandia National Laboratories is a multi-program laboratory managed and operated by Sandia Corporation, a wholly owned subsidiary of Lockheed Martin Corporation, for the U.S. Department of Energy’s National Nuclear Security Administration under contract DE-AC04-94AL85000.

Issued by Sandia National Laboratories, operated for the United States Department of Energy by Sandia Corporation. NOTICE: This report was prepared as an account of work sponsored by an agency of the United States Government. Neither the United States Government, nor any agency thereof, nor any of their employees, nor any of their contractors, subcontractors, or their employees, make any warranty, express or implied, or assume any legal liability or responsibility for the accuracy, completeness, or usefulness of any information, apparatus, product, or process disclosed, or represent that its use would not infringe privately owned rights. Reference herein to any specific commercial product, process, or service by trade name, trademark, manufacturer, or otherwise, does not necessarily constitute or imply its endorsement, recommendation, or favoring by the United States Government, any agency thereof, or any of their contractors or subcontractors. The views and opinions expressed herein do not necessarily state or reflect those of the United States Government, any agency thereof, or any of their contractors. Printed in the United States of America. This report has been reproduced directly from the best available copy. Available to DOE and DOE contractors from U.S. Department of Energy Office of Scientific and Technical Information P.O. Box 62 Oak Ridge, TN 37831 Telephone: (865) 576-8401 Facsimile: (865) 576-5728 E-Mail: [email protected] Online ordering: http://www.osti.gov/bridge Available to the public from U.S. Department of Commerce National Technisa Information Service 5285 Port Royal Rd. Springfield, VA 22161 Telephone: (800) 553-6847 Facsimile: (703) 605-6900 E-Mail: [email protected] Online order: http://www.ntis.gov/help/ordermethods.asp?loc=7-4-0#online

3
SAND2010-6939 Unlimited Release
Printed October 2010
A Life Cycle Cost Analysis Framework for Geologic Storage of
Hydrogen: A Scenario Analysis
Anna S. Lord, Peter H. Kobos and David J. Borns
Sandia National Laboratories P.O. Box 5800
Albuquerque, NM 87185-0735
Abstract
The U.S. Department of Energy has an interest in large scale hydrogen geostorage, which would offer substantial buffer capacity to meet possible disruptions in supply. Geostorage options being considered are salt caverns, depleted oil/gas reservoirs, aquifers and potentially hard rock cavrns. DOE has an interest in assessing the geological, geomechanical and economic viability for these types of hydrogen storage options. This study has developed an ecocomic analysis methodology to address costs entailed in developing and operating an underground geologic storage facility. This year the tool was updated specifically to (1) a version that is fully arrayed such that all four types of geologic storage options can be assessed at the same time, (2) incorporate specific scenarios illustrating the model’s capability, and (3) incorporate more accurate model input assumptions for the wells and storage site modules. Drawing from the knowledge gained in the underground large scale geostorage options for natural gas and petroleum in the U.S. and from the potential to store relatively large volumes of CO2 in geological formations, the hydrogen storage assessment modeling will continue to build on these strengths while maintaining modeling transparency such that other modeling efforts may draw from this project.

4
Acknowledgments
The authors offer thanks to Monterey Gardiner, Technology Development Manager in the Office of Hydrogen, Fuel Cells & Infrastructure Technologies within the U.S. Department of Energy for his valuable insight and feedback throughout the duration of this project. Additionally, the authors would like to thank Darlene Steward of the National Renewable Energy Laboratory, Marianne Mintz and Amgad Elgowainy from Argonne National Laboratory for their insight and guidance. The authors also thank Jay Keller for his support. Lastly, the team thanks Len Malczynski for his ongoing modeling technical review efforts.

5
Introduction
The U.S. Department of Energy (DOE) Hydrogen Program has an interest in understanding underground storage in geologic formations in order to store hydrogen gas as a low cost storage option. The previous work as shown in Lord et al. (2009a) developed an economic analysis methodology to address this interest by characterizing the costs entailed in developing and operating a hydrogen underground storage facility. The model’s modular design allows for relatively simple modification for the specific physical and economic model parameters and assumptions.
The model framework discussed in this report differs from that in Lord et al.
(2009a) in a few key areas. First, the 2010 model version is fully arrayed such that all four types of geologic storage options can be assessed at the same time. The previous model version was only able to assess one system at a time. Second, the current model was developed using two scenarios provided by colleagues at the National Renewable Energy Laboratory (Steward, 2010). Third, additional effort was given to gathering more accurate model input assumptions for the well and storage site development information. With this information, other National Laboratories including the National Renewable Energy Laboratory and Argonne National Laboratory could incorporate this information into ongoing DOE-sponsored analyses including a potential wind farm to H2 storage scenario and the Hydrogen Delivery Scenario Analysis Model (HDSAM, 2006), respectively. Four general classes of underground storage are being considered at the conceptual level; salt caverns, depleted oil/gas reservoirs, aquifers, and hard rock caverns/other custom sites. These options hold substantial interest due to the lessons learned from moderate to large scale underground storage of natural gas already employed. Understanding these various geologic storage types will help identify what geologic option would be best suited for the storage of hydrogen. Currently, there are only three locations worldwide, two of which are in the United States, which store hydrogen. All three sites use salt caverns to store hydrogen.
The Hydrogen Geological Storage Model
The first goal of this project was to determine the suitability and availability of underground storage for hydrogen. The work by Lord (2009) describes the advantages and challenges associated with various types of geologic storage options, as well as their relative operational issues to storing hydrogen gas. The second goal of this project was to develop a basic economic and physical modeling framework to develop the capital and operational costs of various undground geological storage options (Lord et al., 2009a). The third goal is to incorporate a scenario illustrating the model’s capabilities. The following sections describe the current year model in more detail.

6
The Hydrogen Geological Storage Model (H2GSM) is a prototype analytical model developed to highlight the major components of a ‘gate-to-gate’ (the analysis focuses on the storage infrastructure only), large-scale hydrogen storage facility. This dynamic system’s level model was developed in Powersim Studio© (www.powersim.com) in order to illustrate the analysis from a physical infrastructure, H2 flow and cost perspective. The model can address questions such as, ‘For a potential use of renewable energy to store H2 during off-peak hours or periods of low demand, what might the representative storage size and costs look like between a salt cavern and an aquifer’. Figure 1 depicts the overarching assessment methodology and model framework for all phases of the project.
Figure 1: The Assessment Methodology and Model Framework.
Figure 2 illustrates the model entry screen for the H2GSM model. In Lord et al.
(2009a) an initial version of the model developed the basic cost calculator and inventory (demand) adjustment module. In the model version presented in this report, the modeling efforts focused largely on refining the cost calculator and implementing initial base-case scenarios provided by colleagues at the National Renewable Energy Technology Laboratory (Steward, 2010).

7
Figure 2: The Hydrogen Geologic Storage Model (H2GSM) Main Introduction Page.
Figure 1 illustrates H2GSM’s initial schematic representation of the underlying model’s structure. To make navigating the cost calculating tool easier for users, several interface buttons were developed. The Schmatic, Results, Inventory, and Documentation buttons take the model user to the model modules that address those points. The Inventory module, however, is a work in progress.
The model prototype version dated September 2010 uses the scenario parameters
outlined in Table 1 provided by NREL (Steward, 2010). The aquifer formation scenario was provided by NREL, and a corresponding salt cavern location was chosen by the Sandia team as the closest viable formation for a comparison study. The representative salt cavern is in the Salado Formation in the Permain Basin.

8
Table 1: Parameters for the NREL Wind Farm Scenario. Parameter Value Unit Note Demand 40,000 kg/day Steward, 2010 Site Life 40 Years hypothetical Storage Volume 8,000,000 kg/H2 50% is cushion gas, 50% is
working gas Compressor Size/ Injection Rate
2,487 kg/H2/hr Steward, 2010
Maximum Electrolizer Output
105,000 kg/H2/day Steward, 2010
Note: These parameters were developed based on information provided by NREL (Steward, 2010) at a preferred location for storage (e.g., sandstone). The Todilto Formation was used as the representative aquifer formation.
The underlying results of the model are displayed using the second-tier links
listed as Volume & Capacity, Wells, Compressors, Economics, and H2 Demand. The expanded input screens for these respective components are shown in subsequent Figures in this report and described in more detail. The main findings of the two scearnios indicate the levelized cost of Hydrogen may be on the order of $2 to 3 per kilogram of H2 for the aquifer or salt cavern storage sites, respectively (Figure 3). Salt caverns require an initial, substantial up front cost to develop the site. Ideally, depleted oil and gas reservoirs, aquifers and other related systems may not require material extraction (mining) to make room for the H2. Salt caverns, however, require excavation to develop the site thereby adding a substantial amount (over 40% in this instance) to the total capital cost. It is important to note that salt caverns may be able to manage many more annual cycles of H2 injection and withdrawl than the other representative sites. This ability, while not adequately captured by the current version of the model that indicate salt caverns have the largest levelized cost of H2, may add more value to this type of storage site over others. Including this cycling factor could substantially change or reduce the levelized cost of H2 over time. No final costs or results are developed for the ‘Other’ geological site option due to the fact the full set of assumptions are not finalized.

9
Figure 3: Working Results Page of H2GSM. (Note: The ‘Other’ geologic storage site option will be more fully developed in subsequent versions of H2GSM.)i The Volume & Capacity screen allows for custom model inputs to calculate different H2 storage option cost scenarios. Figure 4 illustrates the customizable inputs in dark blue boxes, and the calculated results in light blue. The custom user options therefore include the percentage of the total stored H2 used as cushion gas within the geological storage site, the percentage of the void space used in the reservoir, the total volume available at the site, the cost per cubic meter of H2, and the cost of the leaching plant for site development, if applicable. Additional ‘Other Parameters’ the user may address include pressure and temperature of the geologic storage site. Adjusting these parameters will affect the calculated volume of H2 the formation may contain, and therefore affects the relative cost per unit (e.g., $/tonne) of Hydrogen. This also allows users to develop custom storage options when and if new information is available, as well as run initial sensitivity tests regarding the storage site assumption’s affect on the H2 storage cost. The input assumptions and corresponding calcualtions for the ‘Other’ site option are hypothetical in this version of the model, and should be considered as placeholders only.

10
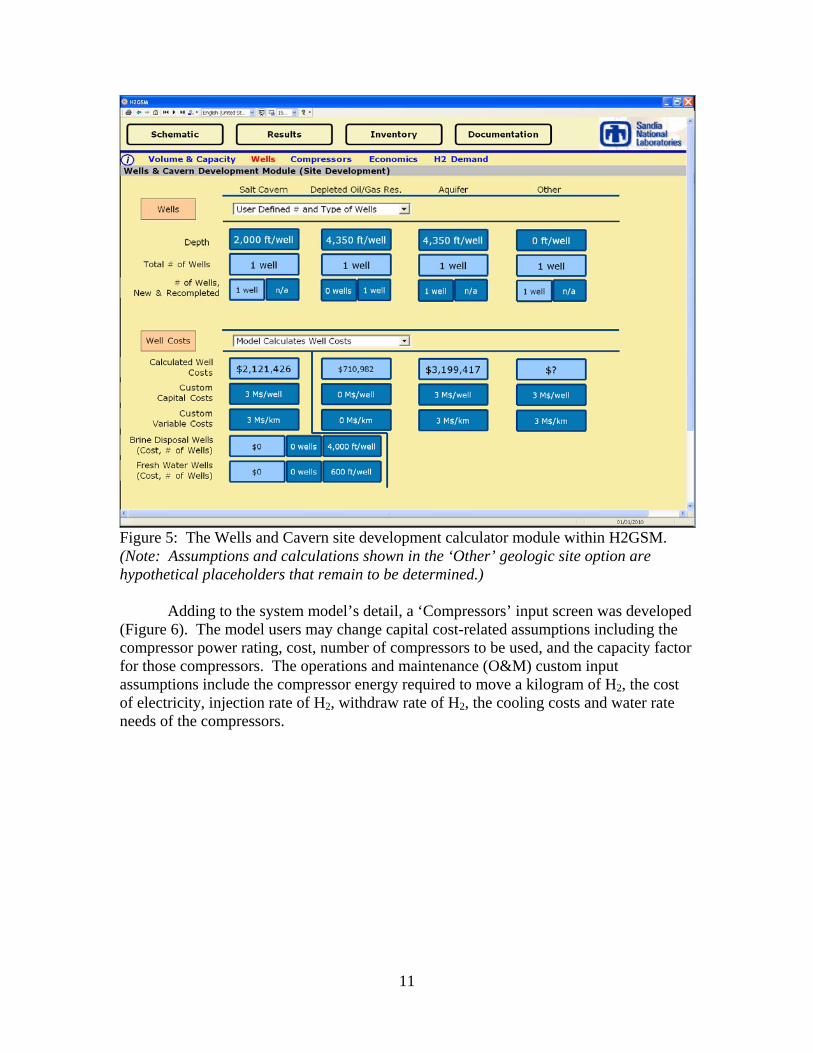
Figure 4: The Volume & Capacity interface input screen of H2GSM. (Note: Assumptions and calculations shown in the ‘Other’ geologic site option are hypothetical placeholders that remain to be determined.) The well and additional cavern development costs can be developed using the ‘Wells’ model interface page (Figure 5). The underlying framework allows the model user to determine the number of wells based on the demand for hydrogen and hence the number of wells required to store that particular volume. The model user may also manually select the number of wells. From this option, the user may enter the depth of the well(s), and number of new and/or recompleted wells where applicable (the recompleted wells only apply to ‘Depleted Oil/Gas Reservoirs’). The wells’ cost calculation may also develop from the model’s assumptions, or the model user may override these calculations to enter custom costs where more information is available. The custom inputs used for the model’s calculated well costs include the capital costs, the variable costs, and for a ‘Salt Cavern’ site, the number and cost of brine disposal and fresh water wells.
11
Figure 5: The Wells and Cavern site development calculator module within H2GSM. (Note: Assumptions and calculations shown in the ‘Other’ geologic site option are hypothetical placeholders that remain to be determined.) Adding to the system model’s detail, a ‘Compressors’ input screen was developed (Figure 6). The model users may change capital cost-related assumptions including the compressor power rating, cost, number of compressors to be used, and the capacity factor for those compressors. The operations and maintenance (O&M) custom input assumptions include the compressor energy required to move a kilogram of H2, the cost of electricity, injection rate of H2, withdraw rate of H2, the cooling costs and water rate needs of the compressors.

12
Figure 6: The Compressors Capital Cost and Operations and Maintainence (O&M) input module interface of the H2GSM model. Figure 7 illustrates the base case assumptions used to calculate the underlying economics of the site development costs. These assumptions include the lifetime of the equipment at the geologic site, the capacity factor of the site itself, the discount rate used and any additional contingency costs to be considered. Additionally, economic factors for the wells and compressors can be changed within the model from their base case scenarios (e.g., 30 and 20 year lifetimes, respectively).

13
Figure 7: The base case assumptions for the underlying economics used for the site development costs.
The feedstock cost and demand of H2 assumptions can be entered into the model (Figure 8). The capital costs of the full system take into account the feedstock cost, that directly affects the cost of cushion gas used to cycle the system. The amount of hydrogen demand (in kg) can be entered to allow for a relatively straightforward scenario calculation. Future versions of the model develop the H2 inventory cycling model with additional detail as initially described in Lord et al., 2009a.

14
Figure 8: The interim Hydrogen demand module interface. (Note: The market penetration/demand level was developed to address a scenario with NREL).
Summary Large scale fuel storage offers infrastructure systems the ability to mitigate short-
term supply shortages for natural gas and petroleum. The Hydrogen Geologic Storage Model (H2GSM) was developed to calculate the potential for large-scale underground geologic storage options for hydrogen. Salt caverns, depleted oil and gas reservoirs, aquifers and potentially other types of geologic storage sites offer potential distributed, large scale storage options for hydrogen. These options may allow, for example, wind farms or similar intermittent electricity production systems the ability to store energy by way of hydrogen extraction from water during times of off-peak demand for electricity. The H2GSM model, while still being refined, offers users the ability to compare the volume, location and costs for various geologic storage options.

15
Future Model Work and Suggestions
Future versions of the model will include a fourth storage option and may include additional details where available for the geological storage types (salt cavern, depleted oil/gas reservoir, aquifer and other). It may also include a more detailed H2 inventory module to address the potential of cycling storage across time and the value this may add to the system (e.g., supplying H2 at peak demand, and storing at low periods of demand). See Lord et al., 2009a for the initial work on the more detailed inventory model. The analysis will likely include additional information as it becomes available for well and drilling information. These efforts will continue to build upon the suggestions received at presentations developed for this project (Lord, et al., 2008; Lord et al., 2009a,b,c; Lord et al, 2010).

16
References American Gas Association (AGA), 1996, Gas Engineering & Operating Practices, Vol.
1,Ch. 1, Case Studies, Catalog No. XY9603C, Wharton Field, Pennsylvania National Fuel Gas Corporation.
Amos, W.A., 1998, Cost of Storing and Transporting Hydrogen. NETL/TP-570-25106. Hydrogen Delivery Scenario Analysis Model (HDSAM) V2.0, 2006, Amgad
Elgowainy, Marianne Mintz, Jerry Gillette. Matt Ringer and Daryl Brown Argonne National Laboratory, http://www1.eere.energy.gov/informationcenter/
Lord, A.S. and P.H. Kobos, 2008, Underground Storage of Hydrogen: Assessing
Geostorage Options with a Life Cycle Based Systems Approach, 28th USAEE/IAEE North American Conference, SAND2008-7739C, New Orleans, LA, December 3-5, 2008.
Lord, A.S., 2009, Overview of Geologic Storage of Natural Gas with an Emphasis of
Assessing the Feasibility of Storing Hydrogen, SAND2009-5878, Sandia National Laboratories, Albuquerque, NM.
Lord, A.S., Kobos, P.H. and D.J.Borns, 2009a, A Life Cycle Cost Analysis Framework for
Geologic Storage of Hydrogen, SAND2009-6310. Lord, A.S., Kobos, P.H. and D.J. Borns, 2009b, Geologic Storage of Hydrogen: Possible
Containment Issues, SAND2009-5384C, Hydrogen Pipeline Working Group Meeting, August 26, 2009.
Lord, A.S., Kobos, P.H. and D.J. Borns, 2009c, Geological Storage of Hydrogen,
2009 Annual Merit Review & Peer Evaluation Meeting, SAND2009-1840C, Washington, D.C., May 21, 2009.
Lord, A.S., Kobos, P.H. and D.J. Borns, 2010, A Life Cycle Cost Analysis Model
Framework for Geologic Storage of Hydrogen, 2010 U.S. DOE Hydrogen Program & Vehicle Tech. Merit Review & Peer Meeting, SAND2010-3677C, Washington, D.C., May 7-11, 2010.
National Carbon Sequestration Atlas (NatCarb), 2010, Estancia Todilto formation.
http://www.natcarb.org/ As of July 22, 2010. Ogden, J.M., 2002, Modeling Infrastructure For A Fossil Hydrogen Energy System With
CO2 Sequestration. 6th Greenhouse Gas Control Technologies Conference, Kyoto, Japan, September 30-October 4.
Parks, G.D., 2007, ChevronPhillips Hydrogen Cavern Clemens Terminal,

17
www.internationalpipelineconference.com/presentation_Files/1030_PARKS-Clemens_Release-Final.ppt.zip ConocoPhillips. As of June 2007.
Steward, D., Saur, G., Penev, M. and T. Ramsden, 2009, Lifecycle Cost Analysis of
Hydrogen Versus Other Technologies for Electrical Energy Storage. NREL/TP- 560-46719.
Steward, D., 2010, Personal Communication, representative scenario.

A-1
Appendix 1: Hydrogen Geological Storage Analysis Model Equations
The Hydrogen Geological Storage Model (H2GSM) was initially developed in
2009 using several modules. The key assumptions, sources of data, and equations used in the model are given in the following table.
A few of the key differences between the model versions of 2009 and 2010 involve adding more detailed model parameters, and focusing on two representative scenarios in the model.
Table A1: Parameter Descriptions for H2GSM.
Symbol or Abbreviation
Units Description Equation, Assumption and/or source
gH2 grams of hydrogen
Calculated grams of hydrogen based on the ideal gas law equation
PV=nRT
P kilopascals (kPa) Pressure Pressure measured in Kilopascals for each type of geological formation (gfpi)
gfpi psi Pounds per square inch of pressure
i = geological formation where; 1 = Salt Cavern (2,000 psi). Base case assumption based on Parks (2007). 2 = Oil / Gas Reservoir Pressure (3,600 psi). AGA (1996). 3 = Aquifer Pressure (psi). To be determined. 4 = Other Formation Type (psi). To be determined.
Vi l liters
Vi = volume of the reservoir where; 1 = Salt Cavern (1,011,011,428 l). Assumed base case (1,011,011 m3), Steward (2010). 2 = Oil / Gas Reservoir (593,655,913 l). Steward (2010). 3 = Aquifer (6,814,619 m3) (NatCarb, 2010) 4 = Other Formation Type. To be determined.
n grams/mol Hydrogen molecular weight
2.016 grams/mol
R kPa*l*(1/mol)*(1/K)
gas constant 8.314472 kPa*L*(1/mol)*(1/K)
T Kelvin Temperature 311 degrees Kelvin
cg% % of Total H2 Storage Volume
Cushion Gas Percent of the total Calculated Storage Volume of Hydrogen (50% for i=1.. 3; i=4, to be determined)
cg kg kilograms of Hydrogen
The calculated mass of cushion gas:
%*2 cggHcg
H2a Kg kilograms of Hydrogen
Kilograms of hydrogen available:

A-2
Symbol or Abbreviation
Units Description Equation, Assumption and/or source
available cggHaH 22
$cg 2010 $US Total Capital Cost of the Cushion Gas
2/00.6$*$ kgHcgcg Where kgH2 = $6.00 base case assumption derived
from the range H2 costs (Steward et al., 2009)
TCCi 2010 $US Total Capital Cost
Total Captial cost of the system.
cgcccgfccTCC ii $$$
Where:
$gfcci = geologic formation capital cost
$ccc = compressor capital cost
LTCC 2010 $US Levelized Total Capital Cost
CFCRFTCCLTCC i /*
Where:
))^1(1/( sCRF CRFs = Capital Recovery Factor
s = discount rate (Assumed 10%) for the site
s = Site Lifetime (Assumed 40 yrs)
CFs = Capacity Factor (Assumed 80%) for the site
L$H2 2010 $US / kg Levelized Dollars per kg of hydrogen
COMCaHLTCCHL i )/($ 2,2
Where:
*WCCCLCCOMC Where:
COMC = Compressor Operations and Maintanence
Costs
CLC = Compressor Levelized Cost
WCC = Water and Cooling Costs = number of compressors
CLC 2010 $US / tonne
Levelized Dollars per tonne of Hydrogen
)/1/1(*** kWhcoyrCRFECkWhcCLC c
kWhc = kilowatt hours required for the compressors
EC = Electricity cost
CRFc = compressor capital revovery factor
Where:
))^1(1/( ccccCRF
c = discount rate (Assumed 10%) for the wells
(identical to s )

A-3
Symbol or Abbreviation
Units Description Equation, Assumption and/or source
c = Compressor Lifetime (Assumed 20 yrs)
kWhco = kWh per year for compressor operations
WCC 2010 US$ / kg
Water and Cooling Costs for the Compressors
WCC = WC * WRCC
Where:
WCC = Water and Cooling Costs
WC = Water & Cooling (Assumed $0.02 per 1000
liters, Amos, 1998).
WRCC = Water Requirements for Compressor
Cooling (Assumed 50 liters / kg, Amos, 1998)
kWhc kWh Kilowatt hours
** IRCPkWhc Where:
CP = Compressor Power (Assumed base case 2.20
kWh/kg, Amos (1998))
IR = Injection Rate(Assumed 2487 kg/hr per
compressor) derived from Steward, 2010; Parks
(2007) also reports 2960 kg/hr for comparison
purposes. = Compressor hours per year
Hr/yr Hours per year
CCFyrhrs */8760 Where: CCF = Compressor Capacity Factor (Base Case Assumption 80%)
VSi m3 Void space
VSi = void space Where: 1 = 1,011,011 m3 2 = 6,814,619 m3 3 = 6,814,619 m3
4 = 100,000 m3, to be determined
W 2010 US$ Well Costs
2/))&*)(()*)((( gHMOvwCRFwvwcW ww wc = well capital cost wv = well variable cost CRFw = capital recovery factor for wells
Where:
))^1(1/( wwwwCRF CRFw = Capital Recovery Factor
w = discount rate (Assumed 10%) for the wells
(identical to s )
w = Well Lifetime (Assumed 30 yrs)
O&Mw = operations and maintainence for wells

A-4
Symbol or Abbreviation
Units Description Equation, Assumption and/or source
gH2 = mass (grams) of Hydrogen gas The well cost equation is based on the CO2 well costs outlined in Ogden, 2002. Future versions of the H2GSM analysis will likely include additional considerations for Hydrogen well costs.
tonne / day Expected Demand
Where: = Expected demand
tonne Tonnes of H2
)*( icp Where: cpi = compressor productivity i =1 (2,487 kg/hr, default derived from Steward, 2010, additional scenarios may include 2,960 kg/hr/compressor) (Parks, 2007) i =2,3 (2,487 kg/hr, default derived from Steward, 2010, additional scenarios may include 6189.3 kg/hr/compressor) AGA, 1996 i =4 (to be determined)
Compressors Number of Compressors
cp/ or user-defined custom # of compressors
j % (based factor) Inflation factor multiplier
Ij = 2010 / Year
Where: M2010 = inflation factor for the year 2010 NYear = the inflation factor for the year of the base cost to be adjusted up to 2010 $US (e.g., 1998 $US to be converted to 2010 $US).

DISTRIBUTION: U.S. Department of Energy (electronic copy) Office of Hydrogen, Fuel Cells and Infrastructure Technologies 1000 Independence Ave., SW Washington, DC 20585 Attn: M. Gardiner Sandia Internal: Copies MS Name Org. 1 0706 D.J. Borns 06732 2 0706 A.S. Lord 06732 1 0735 P. H. Kobos 06733 1 0735 J. Merson 06730 1 9052 J. Keller 08360 1 1137 S. Kuzio 06733 1 0899 Technical Library 09536 (electronic copy)
i The ‘Salt Cavern’ and ‘Aquifer’ site calculations were used to illustrate the NREL wind farm scenarios . The ‘Depleted Oil/Gas Reservoir’ values represent a scenario that is literature based.