a legacy of trust - brownsgroup.com
TRANSCRIPT

ANNUAL REPORT 2020/21
A LEGACY OF TRUST
www.brownsgroup.com
A LEG
AC
Y OF T
RU
ST
BROW
N A
ND
CO
MPA
NY P
LC
| A
NN
UA
L REPO
RT 2020/21

Our Vision and Our Mission Inner CoverFinancial Highlights 2Board of Directors 3Management Discussion & Analysis 5Corporate Governance Report 18Audit Committee Report 42Remuneration Committee Report 45The Related Party Transactions Review Committee Report 47Business Operations Committee Report 48
FINANCIAL INFORMATIONAnnual Report of the Board of Directors 50Statement of Directors’ Responsibility 55Independent Auditor’s Report 56Statement of Profit or Loss 64Statement of Comprehensive Income 65Statement of Financial Position 66Statement of Changes in Equity - Group 68Statement of Changes in Equity - Company 69Statements of Cash Flows 70Notes to the Financial Statements 72
SUPPLEMENTARY INFORMATIONTen Year Summary 176Economic Value Statement 177Investor Relations 178Parent, Subsidiary and Associate Companies 180Glossary of Financial Terms 185Notice of the Annual General Meeting 186Form of Proxy 187Corporate Information Inner Back Cover
03
18
65
72
CONTENTBOARD OF DIRECTORS
CORPORATE GOVERNANCE REPORT
STATEMENT OF COMPREHENSIVE INCOME
NOTES TO THE FINANCIAL STATEMENTS
Online References:The PDF version of the Annual Report 2020/21
OUR VISIONTo be a leading Sri Lankan conglomerate excelling through sunrise and sunshine industries with a global presence and cutting edge technology.
OUR MISSIONWith generations of trust and reliability, our aim is to continuously enhance the value propositions to our stakeholders through innovative and customer-centric solutions.
CORPORATE INFORMATION
COMPANY NAMEBROWN AND COMPANY PLC
LEGAL FORM A Public Limited Liability Company incorporated in Sri Lanka on 17th August 1892 under the Joint Stock Companies Ordinance 1861 and re-registered under the Companies Act No. 07 of 2007. The Company was listed on the Colombo Stock Exchange on 25th April 1991.
COMPANY REGISTRATION NO. PQ 25
DIRECTORSIshara Nanayakkara Executive Chairman
Kapila Jayawardena Non-Executive Director
Kalsha Amarasinghe Non-Executive Director
Janaka de SilvaIndependent Non-Executive Director
Tissa BandaranayakeIndependent Non-Executive Director
Danesh AbeyrathneExecutive Director (Appointed wef 18th November 2020)
SECRETARIES LOLC Corporate Services (Private) Limited,No.100/1, Sri Jayewardenepura Mawatha,Rajagiriya. Tel: 011 5063000Fax: 011 2307380
REGISTRARSS S P Corporate Services (Pvt) Ltd101, Inner Flower Road,Colombo 03Tel: 011 2573894Fax: 011 2573609
REGISTERED OFFICE No. 481, T. B. Jayah Mawatha (Darley Road),P. O. Box 200, Colombo 10.Tel: 011 5063000Fax: 011 2307380Website: www.brownsgroup.com
BUSINESS OFFICE No. 34, Sir Mohamed Macan Markar Mawatha, Colombo 3.Tel: 011 5063000.Fax: 011 2307380.Website: www.brownsgroup.com.
AUDITORS Messrs PricewaterhouseCoopers,Chartered Accountants,No. 100, Braybrooke Place, Colombo 02.Tel: 011 7719838Fax: 011 2303197Website: www.pwc.com
BANKERS Amana Bank PLCBank of CeylonCargills Bank Ltd.Commercial Bank of Ceylon PLC DFCC Bank PLCHatton National Bank PLCICICI Bank Ltd.MCB Bank Ltd.National Development Bank PLCNations Trust Bank PLCPan Asia Banking Corporation PLCPeoples BankSampath Bank PLCSeylan Bank PLCStandard Chartered BankUnion Bank of Colombo PLC

Brown and Company PLC is a name synonymous with trust and reliability; serving a wide range of stakeholders from
entrepreneurs and businesses, to families and communities over a span of 145 successful years.
Deeply rooted in the fundamentals of trust and dedication, our team is focused on ensuring success across diverse industries and businesses we operate in- aiming to continue to enhance
the lives of millions of Sri Lankans through innovative and customer-centric solutions which leaves behind a remarkable
legacy of trust.
A LEGACY OF TRUST

2 / BROWN AND COMPANY PLC
FINANCIAL HIGHLIGHTSGroup - 31st March 2021 2020 2019 2018 2017
Results for the Year
Revenue (Gross) Rs.Mn 29,391 20,439 21,194 20,554 22,648
EBIT Rs.Mn 2,799 4,448 3,980 5,403 7,330
Profit/(Loss) before Tax Rs.Mn (2,783) (970) 118 2,432 4,420
Profit/(Loss) after Tax Rs.Mn (3,344) (1,515) 3 1,936 3,961
Group Profit/ (Loss) Attributable to Equityholders Rs.Mn (16) 3,620 1,274 814 1,898
Position at the Year end
Shareholders’ Funds Rs.Mn 46,888 30,257 25,720 19,360 18,210
Total Assets Rs.Mn 195,762 147,673 92,736 75,262 66,055
Market Capitalisation Rs.Mn 33,006 8,930 10,206 4,890 5,032
Retained Earnings Rs.Mn 19,985 16,520 12,753 14,900 14,123
Financial Ratios
Gross Profit % 24.84 24.37 24.22 26.21 23.00
Interest Cover Times 0.50 0.82 1.03 1.82 2.52
Current Ratio Times 0.48 0.51 0.58 0.57 0.71
Price/ Earnings (year-end) Times (2,056.96) 2.47 6.65 6.01 2.65
Debt to Equity % 65.22 50.97 56.57 49.29 46.37
Return on Shareholders’ funds % (0.03) 11.97 4.96 4.20 10.42
Per Share
Earnings/ (Loss) per Share (Rs.) (0.08) 17.03 7.22 11.48 26.78
Market Price per Share (Rs.) 155.25 42.00 48.00 69.00 71.00
Net Assets per Share (year-end) (Rs.) 220.52 142.30 120.97 273.16 256.93
Dividend per Share (Rs.) - - - - 0.50
Rs. 3 BnEBIT
24.84%GP RATIO
Rs. 29 BnREVENUE
Rs. 196 BnTOTAL ASSETS2020
2020
2020
2020
2021
2021
2021
2021

Annual Report 2020/21 / 3
BOARD OF DIRECTORSISHARA NANAYAKKARAExecutive Chairman Ishara Nanayakkara is one of Sri Lanka’s leading entrepreneurs, whose strategic vision and intrepid spirit have led to the establishment of businesses of formidable strength in multiple industries, markets and geographies.
He joined Brown and Company PLC as a Non-Executive Director in 2005 before becoming an Executive Director and Executive Chairman at Browns in 2013. Mr. Nanayakkara was awarded the prestigious ‘Young Entrepreneur of the Year’ Award at the Asia Pacific Entrepreneurship Awards (APEA) in 2012.
Having joined the board of LOLC Holdings PLC in 2002, Ishara has since pursued an expansive ambition to create a multinational conglomerate that encompasses the entire financial service value chain. The LOLC Group under his leadership has set many benchmarks, becoming the world’s largest multi currency multi geography MSME financing platform in addition to becoming the most profitable conglomerate in the history of Sri Lanka. It has also diversified beyond the financial service arena, with large scale investments in leisure (in Sri Lanka, Maldives and the Mauritius), construction, plantations, trading and manufacturing.
His influence as a changemaker in the microfinance and SME sectors has seen the LOLC Group expanding its footprint in the Afro-Asian region. Over the years, reputed financial institutions in Sri Lanka, Cambodia, Myanmar, Pakistan, Indonesia, Philippines, Zambia, Nigeria, Tanzania, Malawi and Tajikistan have reaped benefits from his extensive knowledge. He has also been instrumental in setting up Life and General Insurance businesses within the LOLC Group and pioneered the concept of Micro Insurance in Sri Lanka and Cambodia, focusing on inclusion and sustainable development.
Believing in the power of innovation as a catalyst for growth, Ishara has pursued initiatives in new sciences and technologies, including large projects for the conversion of pure graphite in to graphene and bio-tech businesses, most notably ones that create value for the Group’s plantation portfolio of cinnamon, tea, sugarcane, rubber, and bi-products. This portfolio is enriched by his renewable energy interests in Sri Lanka and in Sierra Leone, where he backs the largest sugar-based bio ethanol and power plant in Africa.
Ishara, who holds a Diploma in Business Accounting from Dandenong College, Australia, has been internationally recognised for his entrepreneurship, and in particular his contribution to Micro Finance.
He brings with him considerable Board-level experience in both Sri Lankan and overseas and in addition, has key roles in many industry bodies, including being appointed by the government of Sri Lanka as the Chairman of the Sri Lanka Institute of Nano-technology, the apex national body for advanced technology research.
Other key appointmentsDeputy Chairman - LOLC Holdings PLC, Executive Chairman - Browns Investments PLC, Director - Associated Battery Manufacturers (Cey) Ltd, LOLC Myanmar Microfinance Co. Ltd, Pak Oman MFB, LOLC Asia (Pvt) Ltd, LOLC International Private
Limited & LOLC Private Limited, Singapore, Ceylon Real Estate Holdings (Pvt) Ltd, LOLC Advanced Technologies (Pvt) Ltd, LOLC Geo Technologies (Pvt) Ltd, LOLC Capital (Pvt) Ltd, Colombo Marina Development (Pvt) Ltd, Marina Hotel Holdings (Pvt) Ltd, LOLC Ceylon Holdings Ltd, Ceylon Graphene Technologies (Pvt) Ltd, LOLC Ceylon Property Holdings (Pvt) Ltd.
KAPILA JAYAWARDENANon-Executive DirectorJoining the Board in 2012, Mr. Kapila Jayawardena brings considerable and highly relevant experience in retail banking and financial services. He has over three decades of extensive experience in banking and financial services in both Sri Lanka and internationally. Significant board level strategic and financial leadership experience including investor relations, corporate strategy and development, and finance skills led Mr. Jayawardane being appointed as the Group Managing Director of LOLC. He served as the Country Head and the CEO (Sri Lanka and Maldives) of Citibank NA from 1998 to 2007 before joining LOLC Group. Mr. Jayawardena. holds an MBA in Financial Management and is a Fellow member of the Institute of Bankers and an Associate member of the Institute of Cost and Executive Accountants, London. He has varied experience in the fields of Investment Banking, Banking Operations, Audit, Relationship Management, Corporate Finance, Corporate Banking and Treasury Management across several Boards.
Some of his previous appointments includes the following: Chairman of the Sri Lanka Banks’ Association (SLBA) (2003/2004), President of the American Chamber of Commerce in Sri Lanka (2006/2007), Member of Financial Sector Reforms Committee (FSRC), Member of the National Council of Economic Development (NCED), Board Member of the United States - Sri Lanka Fulbright Commission.
Other key appointmentsChairman – Eden Hotel Lanka PLC, Palm Garden Hotels PLC, Serendib Hotels PLC, Dolphin Hotels PLC, Hotel Sigiriya PLC, LOLC General Insurance Ltd, LOLC Securities Ltd, LOLC Development Finance PLC. Deputy Chairman – Seylan Bank PLC, Executive Director/Group Managing Director – LOLC Holdings PLC, Managing Director - Riverina Resorts (Pvt) Ltd, LOLC Capital One (Pvt) Ltd, Ceylon Graphene Technologies (Pvt) Ltd, LOLC Advanced Technologies (Pvt) Ltd, Leapstitch Technologies (Pvt) Ltd, Non-Executive Director:- Browns Investments PLC, LOLC Asia (Pvt) Ltd, LOLC International (Private) Limited, LOLC Private Limited, LOLC Africa Holdings (Private) Limited
MRS. KALSHA AMARASINGHENon-Executive DirectorJoining the Group in 2012, Mrs. Kalsha Amarasinghe brings strong listed company experience and management expertise to the Board. She holds an Honours Degree in Economics and has an outstanding vision for investments. This vision has led her to play a key role in the strategic planning and implementation of the Group. Duet to her strong board governance experience across diverse industries, she is also vested with the responsibilities for advising the senior management on the risk mitigation processes. She serves on the Boards of subsidiaries of Browns Group of Companies and LOLC Holdings PLC.

4 / BROWN AND COMPANY PLC
Other key appointments:Executive Director – LOLC Holdings PLC, LOLC Finance PLC. Non-Executive Director – Browns Investments PLC, Eden Hotel Lanka PLC, Palm Garden Hotels PLC, Serendib Hotels PLC, Dolphin Hotels PLC, Hotel Sigiriya PLC. Director - LOLC Life Assurance Limited, Riverina Resorts (Pvt) Ltd, Green Paradise (Pvt) Ltd, Browns Holdings Ltd, Frontier Capital Lanka (Pvt) Ltd, Sanctuary Resorts Lanka (Pvt) Ltd, Kammala Hoteliers (Pvt) Ltd, Serendib Leisure Management Ltd
TISSA BANDARANAYAKEIndependent Non-Executive DirectorJoining the Board in 2014, Mr. Tissa Bandaranayake counts more than four decades of commercial and professional experience. He retired from Ernst & Young as a Senior Partner in 2009, where he served for 27 years, managing a large portfolio of clients both local and multinational, in various industries. Mr. Bandaranayake brings deep knowledge of audit and financial services together with strong leadership and strategic expertise. He is vested with the responsibility of chairing the Audit and Related Party Transactions Review Committees. Mr. Bandaranayake is a Fellow member of the Institute of Chartered Accountants of Sri Lanka and he holds a B.Sc. Degree from the University of Ceylon. He chairs the Quality Assurance Board established by the Institute. Mr. Bandaranayake is a Past Chairman of the Audit Faculty of the Institute and a Past President of the Practicing Chartered Accountants Forum. He is also a Past President of the National Stroke Association of Sri Lanka, a past member of the Rotary International Finance Committee and the Rotary International District Governor for Sri Lanka in 1999-2000.
Mr Bandaranayake was inducted to the Hall of Fame of the Institute of Chartered Accountants of Sri Lanka in recognition of his contribution to the development of the accounting profession, the business world and the country.
Other key appointmentsIndependent Non-Executive Director - Nawaloka Hospitals PLC, Samson International PLC, Overseas Realty (Ceylon) PLC, Renuka Holdings PLC, Renuka Foods PLC and Harischandra Mills PLC. Director - Micro Holdings (Pte) Ltd. Consultant – Board of Noritake Lanka Porcelain (Pvt) Ltd.
JANAKA DE SILVAIndependent Non-Executive DirectorJanaka de Silva holds a B.Sc., (Ceylon) and a M.B.A. (Sri Jayawardenapura). He is a Fellow of the Institute of Chartered Accountants of Sri Lanka (CA Sri Lanka), the Chartered Institute of Management Accountants and the Institute of Bankers of Sri Lanka. Mr. de Silva has served as the Senior Accountant at the State Engineering Corporation and as the Finance Manager at Building Material Corporation. He has also served as a Lecturer/ Accountant at Indeco Ltd, Lusaka, Zambia. Mr. de Silva joined Bank of Ceylon as the Assistant General Manager/Controller and was elevated to the position of Corporate Advisor. He set up the IT function which grew to become the largest IT facility in the
country by the end of 1985. He introduced computerised banking with central processing and multipoint access to Sri Lanka. He was the head of the Audit function, conducting the Internal Audits of over 200 branch offices throughout the country. Further he introduced new techniques such as statistical sampling. He was also a member of the Steering Committee appointed to set up the Automated Clearing House of Sri Lanka. In 1987, Mr. de Silva joined Sampath Bank as its first General Manager/CEO. He made the bank the most technologically advanced financial institution with all branches connected online for the first time in Sri Lanka. He was the first to introduce credit cards with a major international franchise and a multipoint ATM network. He pioneered many new innovations such as extended banking hours, interest on daily balance on Savings Accounts, and the use of UV lights for signature verification.
During 1992 to 1995, he served as the Director - Operations of American Express Bank, Colombo and was responsible for all operational activities and functioned as the Quality Coordinator of the Colombo Office. Mr. de Silva joined the Union Bank of Colombo Ltd as the General Manager/Chief Operations Officer and designed and implemented its information systems topology, pioneered web presence and Internet banking amongst indigenous banks. Under his direction the Bank obtained ISO 9002 Quality Certification and became the first bank in Sri Lanka to connect ATMs to a major international network. Mr. de Silva was appointed Managing Director/CEO in 2002. Later he served as a Consultant to the National Development Bank during the period of 2003 - 2007 and advised the Bank on the integration of financial and accounting systems in the merger of National Development Bank with NDB Bank.
DANESH ABEYRATHNE Executive Director Having joined the Group in 2018, the dynamic corporate professional, Mr. Danesh Abeyrathne was the former Chief Operating Officer of Browns and an Executive Director at present. He is also a Director/ Chief Executive Officer of LOLC Advanced Technologies, the Research and Innovation arm of the LOLC Group. The young professional with his proven track record in the fields of Engineering, Manufacturing, Plantation, Agriculture, Marketing and Research & Development, is also serving on some noteworthy foreign subsidiaries. Mr. Abeyrathne holds a Bachelor’s of Science (Hons) in Engineering from the University of Ruhuna. He is a Fellow Member of the Chartered Institute of Management Accountants (UK) and Chartered Global Management Accountants (CGMA - USA), an Associate Member of the Chartered Institute of Marketing (UK) and the Institute of Engineers (SL).
Other key appointmentsGal Oya Plantations (Pvt) Ltd, Gal Oya Holdings (Pvt) Ltd, Browns Agri Solutions (Pvt) Ltd, BI Commodities & Logistics (Pvt) Ltd, Grey Reach Investment Ltd, Sunbird Bioenergy Ltd (Sierra Leone), Fortigrains (Pvt) Ltd, Fortigrains Lanka (Pvt) Ltd, LOLC Advanced Technologies Ltd, Klevenberg (Pvt) Ltd and Snowcem Products Lanka (Pvt) Ltd.
BOARD OF DIRECTORS
Annual Report 2020/21 / 5
MANAGEMENT DISCUSSION & ANALYSIS
Browns Group becomes the very first conglomerate in the South East Asian region to implement the latest Microsoft Dynamics 365 Business Central cloud-based solution. Adapting to the constantly changing technological world and ever-evolving company trends, Browns embarks on a digital transformation journey by launching the company’s third ERP system, Microsoft Dynamics 365 Business Central SaaS.
Digitalisation is a key pillar of the Group’s strategy and in recent years the Group has sought to accelerate its digital journey with the aim of driving operational efficiencies, strengthening brand visibility and generating business. With the unprecedented shift to digital during the year, the Group seamlessly transitioned to virtual platforms in engaging with both customers and employees. As a tech-savvy company, we have implemented two futuristic solutions for the front end as well as the back end of our business. The Sales Force Automation System makes the lives of our sales staff as well as customers easier.
However, the most vital component of the Browns Digital Revolution is entirely moving our operations to the cloud. This is a total solution that covers project management, operations management, reporting & analytics powered by Power BI, Power Apps and Flow, supply chain management, sales & service management, manufacturing and re-distribution management, rolling forecast as well as financial management. Microsoft Dynamics Business Central enables everyone, across every team, to make better and more impactful decisions by converting your data into insights with Artificial Intelligence.

6 / BROWN AND COMPANY PLC
MANAGEMENT DISCUSSION & ANALYSIS
The battery division recorded the highest ever top line in its history of 95 years in the year 2020/21, surpassing the highest top line achieved last year. The automotive battery segment recorded an increase of 35% in sales and the motorcycle battery segment recorded a growth of 75% as compared to 2019/20 despite negative market conditions.
BROWN AND COMPANY PLCIndustry OverviewThe year under review was a challenging year for all businesses in general, due to the global pandemic caused by the coronavirus and other unfavourable economic conditions. Despite these unprecedented challenges, an undying Browns spirit enabled us to successfully rise above one of the most turbulent periods in the Company’s history. Demonstrating purposeful leadership through team effort, we relied on our collective knowledge, innovation and insight to bring order to a tumultuous environment; to prevail against the unexpected with strength and vigour, and challenge the unknown with strategies designed to redefine the future as we know it.
The ensuing section details the movement of the primary macroeconomic variables during the year under review and the resultant impacts on the performance of the Group’s businesses.
Following the disruptions caused by the COVID-19 pandemic in 2020, the global economy contracted by 3.3%. The Sri Lankan economy also contracted by 3.6% in 2020 while Sri Lanka’s sovereign rating was downgraded during the year.
Businesses across the Group recorded a faster than expected rebound in business activity with the easing of restrictions, with near normalcy levels reached from the end of 2020 onwards. An island-wide lockdown was imposed in Sri Lanka in March 2020 to prevent the spread of COVID-19. This lockdown continued until May 2020. Sporadic lockdowns and restrictions on inter-district/inter-provincial travel followed thereafter with a second wave in the third quarter of the financial year. While the situation improved with the rollout of vaccines in the fourth quarter, the country experienced a new wave in late April 2021 with a new variant assessed as a Level 2 threat by CDC, USA.
The pandemic forced 96% of the world’s countries to close international borders for tourism according to UNWTO. These were gradually opened, creating travel bubbles between a few countries. Many of these travel or bio bubbles were subject to stops and starts as new waves continued to disrupt travel and business.
The 12-month moving average inflation rate as measured by the National Consumer Price Index was 5.3% by the end of the financial year remaining within the targeted range of 4-6%. This
was when compared to the 4.9% in the same period last year. Oil prices remained a concern with its impact on headline inflation. State support was crucial in maintaining stable energy prices.
Interest rates continued to decline in response to monetary easing measures adopted by the Government and the Central Bank, including three reductions of the policy rate during the financial year. The monthly AWPLR which was 9.35% at the end of the last financial year, decreased to 5.67% during the current financial year. Treasury bills and bond rates have come down over the year. (1-year Treasury bill-5.11%, 5-year bond-7.05%). The reduction in interest rates lowered the borrowing cost of the Group significantly. Accessibility to low cost financing provided the Group, with alternative short-term funding options to optimise the overall borrowing position.
Hampered export earnings and the lack of foreign exchange inflows from tourism exerted pressure on the Sri Lankan Rupee. The local currency depreciated sharply against the US Dollar in April 2020 in tandem with the first lockdown phase but recovered to record a marginal appreciation by December. Thereafter, a swift depreciation in the range of 6.60% was seen from January to March 2021, owing to the lack of liquidity and uncertainty. The financial year ended with the USD/LKR pair recording an annual depreciation of nearly ten rupees.
The Government introduced several relief measures and large-scale policy stimuli to help businesses affected by the pandemic. The Central Bank eased monetary pressure through the rate cuts as well as reduction of the Statutory Reserve Ratio and restrictions imposed on imports to control the balance of payment and exchange rate. It must also be noted that agricultural policies and government mandated wage hikes play a key role in determining the fortunes of the regional plantation companies.
Response to COVID-19When COVID-19 impacted the world and Sri Lanka, the entire business community including Browns Group was thrust into the unknown. The advantages of the diversification strategy we had pursued to mitigate any regional catastrophe were diminished as it was a global pandemic of unprecedented scale. What we experienced was a hitherto unknown situation which evolved from a mild concern to fully fledged catastrophe within a few weeks. Successfully responding to such rapid change required

Annual Report 2020/21 / 7
drawing upon our business acumen and deep knowledge about the markets, developed for over one and a half centuries.
As the lockdown commenced, the leadership team immediately began putting together a contingency plan, responding on multiple fronts to mitigate the immediate impact as well as the medium to long term impact on business. The Company adopted a strategy to ensure that it can successfully navigate through any emergency in the future, the company had to re-evaluate “business as usual” and implement new ways of doing business. Responding with urgency was critical to the rapidly-evolving business landscape, and the Browns leadership focused on fast and proactive decision making, accelerated digitalisation to work and connect using technology, inculcating innovation within Browns and creating a new working environment within the organisation.
Ensuring the safety of our employees and customers was a key priority. We proactively established stringent health and safety protocols aligned to global benchmarks thereby minimizing the risk of exposure of our stakeholders.
Digitalisation is a key pillar of the Group’s strategy and during the recent years the Group has sought to accelerate its digital journey with the aim of driving operational efficiencies, strengthening brand visibility and generating business. With the unprecedented shift to digital during the year, the Group seamlessly transitioned to virtual platforms in engaging with both customers and employees. As a tech-savvy company, we have implemented two futuristic solutions for the front end as well as the back-end of our business. The Sales Force Automation System makes the lives of our sales staff as well as customers easier. With easy access from anywhere in the world, at any time, this paperless system helps our sales teams get a better handle on their pipelines, prospects, and performance.
However, the most vital component of the Browns Digital Revolution is entirely moving our operations to the cloud. This is a total solution that covers project management, operations management, reporting & analytics powered by Power BI, Power Apps and Flow, supply chain management, sales & service management, manufacturing and re-distribution management, rolling forecast as well as financial management. Microsoft Dynamics Business Central enables everyone, across every team, to make better and more impactful decisions by converting your data into insights with Artificial Intelligence (AI).
The pandemic brought on increases in the cost of production which led to diminishing margins. In response, there was increased focus across the group on adopting cost management strategies that allow us to remain competitive.
AUTOMOTIVE & HARDWAREBattery DivisionPerformance Review As the market leader in the automotive battery segment with its premium top brands Exide, Lucas and Dagenite, Browns continued to supply the demands of the market without any shortages.
The external environment continued to be challenging with the import ban on motor vehicles remaining in force throughout the year 2020/21 causing a major reduction in the market size
of the automotive industry. There were major fluctuations in the automotive and motorcycle battery demand, due to the ban and the general conditions brought on by the pandemic and lockdowns.
Despite these challenges, Browns battery division recorded the highest ever top line in its history of 95 years in the year 2020/21, surpassing the highest top line achieved last year. The automotive battery segment recorded an increase of 35% in sales and the motorcycle battery segment recorded a growth of 75% as compared to 2019/20 despite negative market conditions.
The division also took further measures to provide doorstep delivery and prompt service to the government sector during the period when this service was much needed. Browns Battmobile service was also activated in Colombo with all the safety precautions to support front line institutions and emergency services.
The Browns battery division undertook a brand building and engagement campaign in digital media under the theme of “DO IT THE RIGHT WAY”. The division continued to serve its customers by conducting incentive promotion for Exide Dealers from December 2020 to March 2021, which involved a volume-based gift promotion for Exide and Lucas dealers while allocating 100 Medtronic testers for 100 dealers. There was also a volume-based gift and tour promotion for motorcycle distributors.
Future OutlookBrowns battery division plans to further strengthen its product portfolio targeting the car and SUV premium market by introducing several batteries under the brand Exide Matrix. Furthermore, the division expects to introduce new products with extra features such as extended warranty to cater to the car and SUV segment. The division will continue to invest in its brand image with several communications campaigns in the pipeline. Another area that is being addressed is the further development of the new system which was initiated for the dealer channel, which will generate operational improvements and efficient processes when managing their business and in turn, will enable improved service to the customer.
General Trading DivisionPerformance ReviewIn collaboration with the world’s leading brands, Browns provides an unmatched range of machinery and tools reputed for cutting-edge technology, advanced functionality, versatility and energy efficiency. Browns is well ahead of the competition with its acclaimed 24-hour support service, highly trained and experienced technical team and its state-of-the-art service facilities.
Browns General Trading Division (GTD) consists of three main segments: Semi construction, Wood working and Semi agricultural tools and machinery, DIY tools and accessories segment; Hardware products and consumables segment; Sourcing and aftersales service segment.
GTD introduced several new products to the market during the year under review. These included a new range of compressors, generators, high pressure washers, electrical accessories, hose clips, 40V DC Power Tools, sprayers, blowers, and brush cutters.

8 / BROWN AND COMPANY PLC
MANAGEMENT DISCUSSION & ANALYSIS
During the year, GTD achieved its highest ever top line despite the pandemic. Leading from the front in the branded power tools segment, branded hacksaw and hacksaw blades segments, we continued to cater to the demands of the market without any disruption.
Our improved distributor network and the range of new products were the key to success for GTD. Challenges such as import restrictions, supplier price increases, increase of manufacturing lead time and the devaluation of rupee against USD & GBP negatively impacted sales along with the lockdowns.
Future OutlookThe division is positive about the future with many additions planned to further enhance the product portfolio. Adding industry related new products for all channels, increasing the distribution network to increase touch points from 2000 to 4000 in the hardware segment and improving and expanding the aftersales service network will be key.
Browns Thermal Engineering (Pvt) LtdPerformance ReviewBrowns Thermal Engineering (Pvt) Ltd (BTEL) is a wholly owned subsidiary of Browns. It is the only large-scale manufacturer of heat exchangers in Sri Lanka and is the market leader in the auto and industrial radiator segments. BTEL currently manufactures brass and copper radiators under the brand name of RADCO at the company’s factory, which is located at the Browns Industrial Park in Makandura, Pannala. BTEL also owns and operates a plastic moulding facility that supplies plastic components to the battery industry in Sri Lanka. In addition to the heat exchangers, BTEL manufactures ‘coolants’ - a complementary product line. As a testament to the quality of the manufactured products, BTEL has received the Sri Lanka Standards certification as well as the ISO 9001:2008 certification. Moreover, RADCO is the first and only radiator brand in the island to receive the SLS 740 and ISO 9001:2015 Quality Standards certifications.
BTEL is the largest heat exchanger manufacturer in the country laying claim to 70% of the motor vehicle radiator market while its market share in the other heat exchanger category goes up to 85%. BTEL has been manufacturing radiators since 1968; it stepped into the branded Browns radiators as RADCO in 2009 and has since, strategically expanded the product portfolio. Today, RADCO is the most sought-after brand in the industrial and power generation market with a diverse product portfolio, catering to four customer segments: dealers, industrial customers, government institutions, and individual customers.
The division has the capability to supply tailor-made products in copper and brass for its customers in both the auto and industrial segments. BTEL is one of the main suppliers to the Sri Lanka Railway, Sri Lanka Transport Board, Sri Lanka Ports Authority, Sri Lanka Fisheries Corporation and many other fleet owners in Sri Lanka.
Since 2013, BTEL has supplied replacement radiators for Caterpillar and MTU generators for APR Energy – a leading emergency electricity provider that operates sites around
the world. BTEL also works closely with Associated Battery Manufacturers to develop new moulds of batteries that will in turn expand the company’s plastic business. Identifying a declining trend in market demand for brass and copper auto radiators, BTEL is in the process of investing in a full production line to manufacture aluminium plastic radiators in Sri Lanka.
BANCO, a renowned brand in India, which manufactures engine cooling systems, is also marketed by BTEL. Offering a wide variety of solutions, BTEL is also the authorised distributor of KINGA aluminium plastic radiators and ASK brake liners. Moreover, BTEL is an authorised distributor of BOSCH products in Sri Lanka and offers a wide range of solutions.
Future OutlookBrowns thermal engineering division will focus on reducing the cost of production by optimising the usage of existing resources. New product development will be key for the division in order to capture growing market needs. There are plans to commission a manufacturing line in Sri Lanka to assemble plastic aluminium radiators in order to cater the growing demand in the sector.
AGRICULTURE, HEAVY MACHINERY & MARINE CLUSTERAgriculture DivisionPerformance Review Browns agriculture division achieved its highest ever top line during the year under review despite multiple challenges from the external market, thereby continuing to be the undisputed market leader in the agricultural segment. The performance was a result of strategically managing the many challenges that arose during the year, including the pandemic’s strain on the supply chain in terms of freight cost as well as the timely supply of goods to cater the demand; exchange rate depreciation; import ban on spare parts; low priced new entrants to the agricultural industry and entry of non-agricultural companies to agricultural business.
The division continued to serve its customers through the introduction of free doorstep services via service members and service dealers island-wide. Service being one of the key priorities, Browns Agriculture took the necessary steps to cater to the service needs of post-warranty customers via “Trac Tec” free service campaigns.
We also identified sugarcane as an emerging market and therefore, introduced a total “One-Stop Shop” agriculture machinery solution for the sugarcane industry consisting of planters, weeders, leaf removers and harvesters. Similarly, corn was identified as an emerging market to cater to. Hence training programmes were held in collaboration with the Mahaweli Authority of Sri Lanka to create awareness among farmers of Mahaweli areas with regard to the benefits of mechanizing the operation of corn plantation while introducing seed planters, inter row cultivators and dryers. We also focused on the development of a product portfolio that would cater to silage machinery needs of the Dairy Industry in collaboration with the National Livestock Development Board (NLDB) and MILCO Pvt Ltd. Training sessions and product introductions were carried out for farmers with regard to high-power tractors, planters and shredders.

Annual Report 2020/21 / 9
The SUMO portfolio under the Browns World brand, now carries Chinese combine harvester models of 75hp, 88hp and 100hp to cater across price bands with added superior competitive advantages; this enabled the division to become the number one choice for combine harvesters in the country. The spare parts network has been further enhanced during the year.
Special leasing campaigns with low down payments were deployed in partnership with key players in the financial services sector to enhance customers’ purchasing ability. The division held several training sessions for farmers in the emerging markets in collaboration with government departments in keeping with health guidelines.
Future OutlookKey developments for the coming year will include the introduction of a fully-fledged product portfolio for compost making and precision agriculture. Also under consideration is the expansion of the TAFE product range with the introduction of a range of lightweight compact tractors. The division will continue awareness campaigns among the next generation of target groups via educational tie-ups with institutions such as the Ceylon German Technical Training Institute, Schools of Agriculture and Universities.
Power Solutions DivisionPerformance Review Supply and installation of industrial and residential diesel power generators and facilitating best in class product support services have been key for the power solutions division. The prevailing COVID-19 pandemic made a significant impact on securing and managing ongoing projects as well as upcoming projects in terms of sales and operational aspects of the division. The price competition in the industrial and residential generator market directed the division towards the strategic introduction of new sub brands for cost conscious clientele.
The division was able to improve sales during the second and third quarters following the re-structuring of prices for core and sub brands and the alignment of process changes in understanding potentials and customer coverage.
New initiatives were taken to expand the capabilities and capacities in terms of generator installation which makes the power solutions division a “One-Stop Shop for power generation solutions”. These key initiatives pave the way for supplying a range of generators as well as providing cost effective solutions for generator installations through a dedicated generator installation team, which includes service such as fabrication of soundproofed canopies, stainless steel exhausts, fabrication of ducts and attenuators.
The power solutions division also launched a free-of-charge condition monitoring campaign during the pandemic. Browns launched these special services to support the efforts of the nation to drive forth the economy despite the challenging environment.
Future OutlookThe Company plans to introduce new generator variants, with justifiable owning and operating cost to make a better choice. Also, the Company hopes to become a cost leader in supplying branded generators as a cost-effective solution for customers who seek low owning costs.
Air Conditioner Solutions DivisionPerformance Review The Browns air conditioner solutions division markets wall mounted air conditioners, floor and ceiling type air conditioners, ceiling cassette type air conditioners, VRF systems and chillers. The year witnessed curtailments in capital expenditure from the private sector while multiple new projects were postponed. The shortage of investment impacted the construction industry, which in turn affected the division’s business.
The BG brand, which has a history of over 12 years, continued its exemplary service of its customers despite the pandemic. Timely services, aftersales service, island-wide coverage, continuous services and supply chain were some of the key deliverables to customers. The division also reported the successful performance of the IGNIS brand which serves the luxury market segment and has grabbed a considerable market share in a very short period.
Future OutlookThe division has earmarked several new products for the coming year, including chiller systems for large buildings, inverter multi-split air conditioner solutions for space constrained environments, and an Indian product range to the cost sensitive market. On the service aspect, the division will address strengthening the sales force in the Southern, Northern and North-Central provinces while mobile service teams will be expanded to respond to air conditioner service requirements within Colombo.
Heavy Machinery DivisionPerformance Review The main contributors to the performance of Browns heavy machinery division were the sale of construction and mining machinery, which were realised due to a 48% increase in government expenditure on road development. The division continued to expand into new business areas such as backhoe loaders. The existing products were further developed and diversified to cater to different market segments.
The division represents leading global brands which has a considerable market. The division also introduced several new products to achieve the concept of “Total Machinery Solutions Under One Roof” for the construction industry.
Future OutlookThe division anticipates a transformation in the construction industry soon and in order to capitalise on the product range in its possession, while identifying new product opportunities whenever required. Capitalising on government infrastructure projects will also be key for the division.

10 / BROWN AND COMPANY PLC
Browns agriculture division achieved its highest ever top line during the year under review despite multiple challenges from the external market, thereby continuing to be the undisputed market leader in the agricultural segment. The performance was a result of strategically managing the many challenges...
Marine & Leisure DivisionPerformance Review The division maintained its market leadership in the inboard marine engine segment; the division claims 46% of market share in the inboard marine engine segment and is the third largest player in the outboard motor (OBMs) segment.
The marine & leisure division is the most sought-after brand in the fishing industry because of its products portfolio which includes inboard and outboard marine engines, marine gears, spare parts, marine accessories, fiber glass raw materials and water-sports accessories and the provision of services related to these products. During the year, the JMP engine cooling sea water pump and rubber impeller were added to the portfolio.
Training programmes were also conducted for the fisheries community in order to create awareness and to enhance the knowledge base.
Future OutlookThe introduction of new marine engine brands and fiber glass raw materials have been earmarked for next year, while the division also plans to launch “A Brand New Marine Engine for the Price of a Used Engine” concept to the market.
PHARMACEUTICAL, CONSUMER & INTEGRATED ENGINEERING SOLUTIONS CLUSTERVeterinary Pharmaceuticals DivisionPerformance Review The veterinary pharmaceuticals division also faced many challenges during the year under review due to external factors. However, several new products were introduced to the market during the year under review which enabled the division to capture
market share in several untapped markets while continuing its leadership in many veterinary pharmaceutical segments.
The division marked a milestone by introducing the new 3 in 1 vaccine, Innovax ND IBD in partnership with one of our key suppliers MSD Animal Health, Netherlands. Veterinarians and farmers no longer need to choose between diseases as one dose of Innovax-ND-IBD protects birds against both infectious bursal disease and newcastle disease to significantly expand flock protection and improve efficiency. In parallel to the introduction of this vaccine, we were able to introduce innovative vaccination machineries to the Sri Lankan market together with Spray Cabinets which adhere to the world’s most innovative standards and technology. Further, we were able to introduce a vaccination team to educate, assist, train, and conduct audits to our customers on the correct vaccination procedures.
The division introduced the Lumpyvax vaccine for cattle market in consideration of the emerging cattle industry. We are proud to be the first solution provider for this disease, in line with recommendations of the World Organisation for animal health. The division also took measures to increase product awareness through social media, specially related to the pet animal product range.
The division continued to offer free technical support and farm management services to small scale and medium scale customers in order to provide them with up to date technical knowledge about the veterinary industry and farm management techniques in person and also via online methods. Apart from offering technical knowledge, we also conduct farmer education and training programs for customers by utilising internal, outsourced and international resource persons to impart quality knowledge so that our customers may become successful entrepreneurs. With the intention of eradicting rabies and making the cities and communities safer, the division also provided anti-rabies vaccines to animal welfare groups and societies on a FOC basis.
Future OutlookThe main strategy for the 2021/22 financial year will be to expand the market share of the poultry sector, while focusing on the pet animal & dairy sectors. The division plans to appoint new distributors to increase coverage island wide while also increasing support service to the market such as technical support, on time delivery, and maintaining sufficient product availability.
Browns Deals DivisionPerformance Review The Browns Deals division is the consumer electronic arm of the Brown & Company and it sells consumer electronics, kitchen appliances, gadgets and accessories. The introduction of the Solstar brand from Singapore was a key milestone for the division during the year under review.
The Browns Deals division was able to capitalise on changes in the consumer marketplace, with the move to online platforms from the traditional brick and mortar model. The pandemic-induced online drive resulted in the emergence of many home delivery services and multiple platforms during the year. The decades of trust, aftersales service and the quality of products enabled Browns Deals to gain a considerable number of new customers.
MANAGEMENT DISCUSSION & ANALYSIS

Annual Report 2020/21 / 11
Future OutlookFocusing on online platforms and driving traffic towards the online platforms will be key in the coming year, while ensuring an active social media presence for the division. Growing demand will also pivot on our ability to introduce new technologically advanced products while implementing cost effective strategies.
Boiler DivisionPerformance Review The boiler division markets world renowned Cochran boilers from the United Kingdom, which have a history of over 100 years, and Cheema boilers from India, which is one of the top five boiler companies in India. Several projects were delayed this year due to the pandemic while the lockdowns forced services to be cancelled or postponed. The division however was successful at securing a number of large-scale projects during the year despite the challenges.
The division also made a strategic move to enter into general engineering related services and installation works, such as large capacity goods storage bins, water storage tank systems and process flow machineries during the year under review.
Future OutlookDuring the coming year, the division will add new products to the product mix and hopes to expand existing business channels. In addition, the division will also focus on new industries such as rice and grain storage facilities, energy recovery instrumentation and spares, industrial water pumps and domestic type hot water boilers; negotiations with relevant suppliers are ongoing.
Industrial and Engineering Solutions DivisionPerformance Review The division consists of three main segments - Preventive water treatment chemicals & services, ELGI air compressors and ATS ELGI garage equipment.
We provide total preventive water treatment solutions for the Sri Lankan industrial market through our representation of the world recognised Deuterium brand treatment solutions from the United Kingdom. Deuterium’s cutting-edge technology and research developments enable us to deliver reliable services and solutions to the satisfaction of our client base. The product offering is perfectly complemented by the round the clock service provided by our experienced engineering staff and technical team.
The division is the exclusive dealer of world renowned ELGI equipment, which offers a complete range of compressed air solutions. We offer a range of ELGi air compressors including oil lubricated and oil-free electric powered rotary screw compressors, diesel powered portable screw compressors, oil lubricated, and oil-free reciprocating compressors, and centrifugal compressors, dryers, air receiver tanks, and other air accessories.
In addition, the division also acts as the exclusive dealer for several other major brands of automotive service equipment and thereby offers the widest range of garage equipment in Sri Lanka. Over the years, we have established long-standing partnerships with workshops, garages and vehicle servicing business.
Future OutlookThe division has plans in place to expand its stake by enhancing its high-end technical support capabilities. It is anticipated that upcoming developments in hotels, apartments, shopping complexes and other sectors would offer opportunities to increase our market share and volumes.
GROUP COMPANIESBROWNS AGRI SOLUTIONSPerformance Review Browns Agri Solutions markets crop protection products, seeds and specialised fertiliser from world renowned suppliers to the local market. In the financial year 2020/21, Browns Agri Solutions became a sizable player in the crop protection industry by achieving a market share of 5%. This was achieved within a mere two years of operations in this segment, making the Company one of the fastest growing crop protection companies in the country. The Company recorded year on year turnover growth of 76% and a profit growth of 119% during the year under review.
In the seeds product segment, we were able to introduce three promising hybrid varieties. The sub segments were fruit seeds (Watermelon Hunk), up country vegetable seeds (Hybrid Carrot – Challenge) and corn seeds (King Corn). The products easily captured the market with their key characteristics of response to fertiliser, lower propensity to disease and pest attack, and promising yields.
Agri input marketing was categorised as an essential service by the Government. Therefore, importation, repacking, production and distribution were planned according to Government health guidelines and without interruption.
Future OutlookThe future of this business segment faces uncertainty due to a decision taken by the government to ban the importation and use of all chemical fertilisers and crop protection products. We are in the process of developing organic fertiliser locally and importing organic crop protection products and fertiliser from existing and new suppliers.
BROWNS INDUSTRIAL PARKPerformance Review As the Company’s main warehouse, manufacturing and assembling facility, Browns Industrial Park Ltd has played a vital role in the performance of the Browns Group. Located in Makandura, the Industrial Park has done well by taking advantage of the increasing demand for office space and warehousing – a result of the general growth of business and industry in Sri Lanka.
GALOYA PLANTATIONS (PVT) LTD.Galoya Plantations (Pvt) Ltd is one of the few sugar factories operating in Sri Lanka which is 51% owned by the government and 49% by the consortium led by LOLC & Browns formed in 2006. Galoya Plantations reported a net profit of Rs.749 million for the financial year 2020/21 in the first time in the history of the Company, reflecting an increase of Rs. 2,180 Mn (291%) compared to 2019/20. The operating profit for the financial year 2020/2021 was Rs. 2.8 Bn (347% growth) and it is the highest increased percentage in Galoya’s history.

12 / BROWN AND COMPANY PLC
For the year 2020/21, planting was completed for 2,583 ha of sugarcane and reached a total extent up to 6,046 ha involving 7,111 farmers. Galoya recorded the highest sugarcane harvest of 340,808MT (Seed + Commercial) in the history of Hingurana during the year. In order to increase the sugarcane supply and sugar production, cultivation will be expanded to new areas specially Mahaoya and Siyambalanduwa, to reach the target of 10,500ha with an anticipated harvest of 1,000,000MT in the next five years.
During the year 2020/21, the factory was able to crush 306,726MT of sugarcane; the highest quantity of sugarcane crushed in a single year in its history; and was able to produce 19,232MT of sugar and 17,695MT of molasses this year.
During the financial year 2020/21, the distillery was able to produce 5,531,868L of ENA and this was the highest achievement in Galoya history. As a result of the ban on the importation of ethanol, the Company was able to get a good selling price during the year.
Sustainable SolutionsGaloya Plantations has the largest bio fertiliser yard in the country which can produce 7,000-9,000 MT of bio compost per year. Considering the low demand during the year, only 1,250 MT was produced for the year 2020/21. The produced bio fertiliser has been supplied to the Smallholder Tea and Rubber Revitalization (STARR) project as well as to the Company’s own sugarcane farmers. Currently, the Government has banned the import of chemical fertiliser and promotes bio fertiliser usage. Since the demand is high, the Company introduced the following organic fertiliser products in compliance with Government regulations: Golden Wash, Liquid Fertiliser, Bio Char, Black Gold, Growth Promoter and Soil Conditioner.
Further, Galoya Plantations has a Bio Digester which can produce Methane (CH4) Gas from the waste discharged from the distillery plant operation. This gas is utilised for the boiler operation to produce steam for the utilisation of the distillery as a sustainable solution. 242,000L of Methane was produced in the last five months which saved Rs. 24.3 Mn for the purchase of furnace oil for the boiler operation, thereby greening the carbon footprint.
Since the factory is over 60-years-old, equipment needs to be improved, which will offer higher efficiency and productivity, and conserve plant life. The project will increase the crushing capacity by 25%, rendement by 0.2% and power generation by 9MW. The project is scheduled to be completed by end 2024.
Its Roof Solar PV project will provide 3.75MW and 100% renewable power to the area and is expected to be completed by December 2021. The total cost of the project is Rs. 453 Mn.
Further, another project converting 100% waste product to a commercial product on BOO basis will be completed by December 2022.
Under its Green Factory Concept, Galoya has the only factory that has environmental protection license and Fly Ash Arresting System for zero discharge. In addition, the following steps were
practiced by Galoya Plantations (Pvt) Ltd. under the concept of Green Factory:
Methane gas extraction plant from spent wash using Bio Digester
Organic fertiliser production from sugar factory & distillery waste
Waste water treatment and recycle plant
CO2 gas extraction plant project in pipe line
Only factory complex designed with zero waste discharge, every waste such as compost, methane and water is converted to a value added product or reused:
Continuous greenery development programme
BROWNS INVESTMENTS PLCSri Lankan Tourism IndustrySri Lanka’s tourism sector has consistently recorded a two-digit growth rate both in international tourist arrivals and revenues for a decade until 2019, when following the Easter Sunday attacks, the industry suffered a loss of US $ 1.5 Bn in revenue. However, the sector showed a strong recovery by end of 2019. As per the statistics of the Sri Lanka Tourism Development Authority (SLTDA), Sri Lanka attracted 1.9 Mn tourists by the end of 2019 despite the unfortunate security breach.
The present COVID-19 outbreak reiterates the vulnerability of the tourism and hospitality industry to external shocks. Thousands of tourism service establishments ranging from blue chip companies to souvenir sellers on the beach are experiencing an unprecedented period of zero revenue - leaving the direct and indirect beneficiaries of the industry in a dilemma on the next steps to be taken.
The leisure industry is one of the main industries affected by the COVID-19 outbreak. The sector is experiencing a rapid and sharp drop in demand at a global level. With the quick spread of the virus across countries, both domestic and foreign demand reached zero levels. The lockdowns hampered the interim businesses from the local market and recovery will largely depend on how fast economic activity will pick up internally, when borders reopen and when the key market segments recover. With the assistance of SLTDA, the Government has formulated short-term and long-term strategies to rebuild the industry.
Leisure Sector of Browns GroupBrowns Hotels & Resorts is branded as one of the top holiday hotel and resort brands in Sri Lanka. The management and staff are dedicated to creating the best vacation experience for their guests as well as showcasing the best of Sri Lankan hospitality. The goal of the Group’s leisure sector is to keep growing and traverse new horizons of success.
Acquisition of Serendib GroupIn December 2020, Eden Hotel Lanka PLC acquired a 55.76% stake in Serendib Hotels PLC for a purchase consideration of Rs 800 Mn, which owns five leisure properties. As a result of this acquisition, Serendib Hotels PLC, Dolphin Hotels PLC, Hotel
MANAGEMENT DISCUSSION & ANALYSIS

Annual Report 2020/21 / 13
Sigiriya PLC, Serendib Leisure Management Limited, Sanctuary Resorts Lanka (Pvt) Limited, and Frontier Capital Lanka (Pvt) Limited were added to the Group’s portfolio. Thus, the Browns Group’s operating room portfolio increased to 870+ rooms.
Name of the Hotel No of Rooms
Eden Hotel Lanka PLC 158
Dickwella Resorts (Pvt) Limited 75
Green Paradise (Pvt) Limited 67
Sun and Fun Resorts Limited 70
Samudra Beach Resorts (Pvt) Limited 172
Dolphin Hotels PLC 154
Hotel Sigiriya PLC 79
Serendib Hotels PLC 75
Reveal The Collection 22
TOTAL 872
To further strengthen the local footprint, the Group’s leisure sector made a significant investment in Riverina Resorts (Pvt) Limited, which is located at Beruwala. Consisting of 359 keys, it is in the construction stage and scheduled to open in 2023. The estimated cost for the completion of the hotel is Rs 6 Bn. With key improvements to the design, considering global trends, the Company is expediting the construction work of the hotel.
Operating PropertiesThe market segments of Europe, Russia, India, China, the United Kingdom and Germany are key for the operating hotels. The management considered the short term to medium term strategies for all the properties and is currently operating these properties as quarantine hotels to support cash flow. The management is in constant dialogue with Foreign Tour Operators (FTOs) and local Destination Management Companies (DMCs) to ascertain the current market conditions of the target market segments. Even though the industry is facing a temporary setback, those local and foreign tour operators are positive about future prospects. Several FTOs are in discussions to finalise contracts for the upcoming winter season.
With the COVID-19 pandemic, debtor recovery decreased. However, the Group has a robust collection process, which prompts active engagement with the local and foreign tour operators and regular follow-ups. Evaluations are regularly carried out on the outstanding debtor balances. Proactive decisions are made to improve the debt collection. The Group makes conservative provisions where required.
Despite the negative impacts of the pandemic and to sustain within the industry, the Group formulated short to medium-term strategies. While securing the jobs of the existing employees and ensuring steady operations and revenue generation at the properties, a decision was taken to operate all the local properties as paid quarantine centres from June 2020. This decision positively impacted the leisure business of the Group and generated steady cash flows in the interim period.
The recorded revenue was Rs. 1.2 Bn for the year ended 31st March 2021. The signature hotels of the Group, Eden Hotel Lanka PLC and Samudra Beach Resorts (Pvt) Limited and the newest additions to the leisure portfolio, Dolphin Hotels PLC, contributed significantly towards sector revenues, followed by Dickwella Resorts, Green Paradise, Avani and Hotel Sigiriya.
Expense management initiatives are undertaken at each hotel and operations are limited to the minimum required level with staff following all the rules and regulations imposed by health organisations and the government, as precautionary measures.
Foreign InvestmentsThe Group’s leisure sector expands its wings to the global arena while making a significant investment in the Maldives. Nasandhura Maldives is planned as a luxury city hotel with 150+ rooms, 150+ apartments and a sophisticated retail mall. The project is now nearing completion. This is a flagship property and an iconic development in Malé city. Another project in progress is Bodhufarufinolhu in the Raa Atoll. The resort consists of 100 keys and is planned to feature a choice of four villa categories and thus will be different to other Maldivian properties, offering world-class resort features and accommodation to every guest.
The Group has signed a shareholder agreement with the Barceló Hotel Group to develop three hotel complex in the North Malé Atoll, Maldives, which consists of 470 keys. The total value of the development is estimated at US $ 150 Mn, with Barceló investing US $ 30 Mn for a stake of 33.33% shares of Bodufaru Beach Resorts Ltd.
Apart from the shareholder agreement, the Barceló Hotel Group entered into a management agreement to manage five leisure properties in Sri Lanka and the Maldives. Barceló will be the operator for the properties in the North Malé Atoll which is owned by Bodufaru Beach Resort (Pvt) Limited, the property currently under construction with 100 rooms in the South Ari Atoll, which is owned by Browns Ari Resort (Pvt) Limited and Nasandhura Palace in the Maldives, the most sought-after real estate in Malé, which is owned by NPH Investments (Pvt) Limited. In Sri Lanka, Barceló will be the operator for the five-star property in the southern coast, The Eden Resort & Spa with 158 keys and The Paradise Resort & Spa holding 67 eco-villas in Dambulla.
Despite all the negative effects felt by the industry, the sector was able to generate Rs 1.2 Bn revenue for the year ended 31st March 2021. At present, all properties (except for Frontier Capital, which is operated as the villa collection of the Group) are operating as repatriation hotels to support the cash flows in the interim period.
EXCEL RESTAURANTS Loon TaoSituated on the stunning shoreline of Mount Lavinia, Loon Tao stands out for its deliciously authentic Chinese seafood. Living true to its tagline - Chinese seafood on the beach - the restaurant promises a memorable dining experience on the beach where its patrons can indulge in tongue tingling seafood delicacies.

14 / BROWN AND COMPANY PLC
Darley rd. Pub & Restaurant Located down T. B Jayah Mawatha (sharing the premises with Excel World Entertainment Park), the Darley rd. Pub & Restaurant is a unique place in town for both weekend excitement and weeknight chills as there is something for everyone, every day. Darley rd. serves a deliciously diverse food menu to complement its degustation of wines and other spirited beverages, which includes a range of innovative cocktails.
The Four Leafed Clover Stylish and serene, The Four Leafed Clover creates a charming setting to indulge in a hearty feast in the heart of Kirulapone. The Four Leafed Clover delights its patrons with tasty dishes that bring out the exquisite Italian flavours as well as the taste of rich Irish cuisine.
The Shore By O!Situated on Mount Lavinia’s breathtaking shoreline with picturesque views of the sea, The Shore By O! is the ultimate hotspot for a relaxing time by the beach. The Shore By O! offers an extensive food menu as well as a funky cocktail menu.
LegacyA contemporary food court located inside the Excel World Entertainment Park, Legacy serves a range of culinary delights from different parts of the world. This is a novel dining space that gives the patrons the variety of choice while still maintaining affordability.
The Brick Lane Coffeehouse Conveniently located inside the Excel World Entertainment Park, The Brick Lane Coffeehouse serves an array of delicious cakes, bakes and coffees in a plush and tranquil setting. The Brick Lane Coffeehouse is an ideal place to while away the hours with coffee and cakes or grab a quick snack on the go.
Din Tai FungThe latest kid on the block, Din Tai Fung is a Chinese cloud kitchen, which mainly operates through the in-house delivery service and selected third-party delivery services. Excel Restaurants plans to take this delivery-only restaurant to the next level through the iPay market, fully capitalising on current market conditions.
EXCEL WORLD ENTERTAINMENT PARKPerformance ReviewExcel World Entertainment Park - located in Colombo - continues to offer the whole family, a ‘one-stop’ location for wholesome entertainment. It has gained a reputation for being a family activities fun centre with arcade games, bowling, birthday
parties, corporate events, dining at the food court and buffets for events in Colombo.
The ‘Strikes’ bowling alley is an ideal venue to conduct tournaments. The 12 bowling lanes are frequented by friends, co-workers and families as they test their bowling skills.
Excel Restaurants Pvt Ltd., which is a group of companies under Browns Investments PLC, has been granted franchise rights of The Shore By O! - a leading pub and restaurant brand in Colombo. Also, the company further expanded by managing the Chinese Seafood Restaurant ‘Loon Tao’ in Mt Lavinia, which is a recipient of the TripAdvisor Traveller’s Choice 2021. In addition, the Company acquired the authentic Irish and Italian Restaurant, ‘The Four Leafed Clover’ at Maya Avenue in September 2020.
This strategic move by Excel Restaurants is expected to gain a substantial opportunity to increase its presence in the entertainment and food sector in Colombo. The Company, also having realised the potential value of food and beverage and MICE market requirements in the city, decided to invest in the renovation of several facilities at Excel World.
The Park Premier conference facility is now revamped and catering to a particular segment of clientele that generates a significant demand in this sector. The newly renovated banquet hall Park Premier has a seating capacity for 450 guests. Moreover, the banquet facility will not only cater to conferences, training and various other corporate functions, including cocktails, but also will provide an ideal ambience for wedding functions for the specific category of clientele who look for great value for money.
The Legacy food court is another unit that is fully renovated in order to meet the existing food court standards of the city.
Further, Darley rd. Pub and the Restaurant based within the Park is one of the Colombo’s loveliest venues - serving elegant cocktails, variety of spirits and beverages and all kinds of food to suit a wide palate.
The newest member of Excel Restaurants is “The Brick Lane Coffeehouse” which recently opened its doors to a world of sweet delights. With its warm and attentive service, The Brick Lane Coffeehouse promises a relaxed and delectable experience for its patrons.
All in all, the Excel World will be presented as a totally new experience in the area of food and beverage, events and entertainment and will be the most sought-after place for
In December 2020, Eden Hotel Lanka PLC acquired a 55.76% stake in Serendib Hotels PLC for a purchase consideration of Rs 800 Mn, which owns five leisure properties.
MANAGEMENT DISCUSSION & ANALYSIS

Annual Report 2020/21 / 15
those who seek new experiences in this area. Moreover, due to the COVID-19 situation, which has affected the entertainment and food industry, the Company’s facilities have changed their business model to cater to online deliveries.
As a result of these new strategies planned to face the pandemic and the new normal, Excel Restaurants is expanding its strengths in the digital world. The Company has started a Chinese concept – Virtual Kitchen named as ‘Din Tai Fung’, which collaborates with the iPay App, coupled with all the other Excel restaurants planning ahead for the future in developing the virtual restaurant concept and creating a food ordering marketplace within the iPay App.
The future plans are to expand the Company’s presence in the entertainment sector by expanding gaming and food and beverage facilities at Excel World and to add more restaurants in strategic locations in the country while creating bigger value within the Excel World property.
BG Air Services (Pvt) Limited/Browns Tours (Pvt) LimitedBG Air Services (Pvt) Limited/Browns Tours (Pvt) Limited is the outbound and ticketing arm of Browns Group and LOLC Holdings and complements the leisure operations of the Group. The Company has been in the business of offering bespoke outbound tours for discerning travellers for over 50 years. The many years that have been spent in serving global clientele has helped BG Air and Browns Tours to make a name for itself in the tourism sphere.
COVID-19 has dramatically altered the travel & tourism sector. It is among the most affected sectors with a massive drop in international demand amid global travel restrictions, including many borders fully closed to contain the virus. The challenges have been many for the outbound and ticketing industry, including the initial effort to address cancellations, refunds and rebooking. In many instances, for little or no compensation, services were provided to our esteemed customers.
Giving a truly personalised travel experience, the Company obtained the GSA for luxury charters in Sri Lanka, the first in the market to promote such a product. Luxury charters allow a safe and exclusive personal travel experience which is not impacted by flight cancellations and schedule changes.
BG Air Services (Pvt) Ltd are among the ‘Top 10 travel agents’ in Sri Lanka. History has shown that travel is one of the most resilient industries. The long-term prospect of the travel agency business is positive, with emphasis on the advisors who know their clients and provide expert consultation and support, making travel easier, more enjoyable and more accessible.
PLANTATIONS AND AGRI BUSINESSMaturata PlantationsMaturata Plantations Limited (MPL) was able to report the highest Profit before Interest & Tax (PBIT) among the RPCs for the financial year 2020/21 (excluding oil palm dominated companies) and the highest-ever operating profit since privatisation.
TeaMPL Tea production increased by 0.67 Mn Kgs (19%) to 4.2 Mn Kgs compared with the previous year. The Company was able to achieve this yield as a result of adherence to best practices in agriculture, improved labour productivity, strengthened revenue share model of plucking and bought leaf operations.
The Net Sale average of the Company increased significantly by Rs. 101.14 (22%) per kilogram when compared to the previous year as a result of the favourable market conditions and focus on good manufacturing and agricultural practices. As a result, the tea turnover increased by Rs. 605 Mn (35%) over the previous year.
Despite the impact on additional gratuity provision consequent to labour wage increase and increase in bought leaf purchase cost due to the higher auction prices, the Company’s cost of sale per kilogram saw a marginal decrease (Rs. 6.33 per kilogram) over the previous year. This is mainly due to the Company’s strict cost control mechanisms, efficiency improvements and benefits of scale economies.
It is noteworthy that the revenue-share model has continued to gain confidence among estate communities, contributing productivity gains and cost benefits to the Company. As a result, the Company was able to keep its cost of production at lower levels. Further, the Company reported a gross profit of Rs. 336.5 Mn from tea as against the gross loss of Rs. 143.3 Mn recorded in the previous year.
RubberThe net sale average of rubber improved significantly during the financial year amidst post-pandemic demand recovery led by China, mainly due to the rebound in automobile manufacturing, where more than two-thirds of natural rubber is used by the tyre industry. The Company’s net sale average was Rs. 338.09 per kilogram, which is Rs 62.95 above the previous year.
The rubber production also increased from 0.23 million kilogram in the previous year to 0.33 million kilogram in the current year (43% increase) mainly due to higher yielding virgin lands that came under tapping in the current financial year coupled with improved labour productivity. The Company was able to turn around its continuous losses in rubber and make a gross profit of Rs. 15.4 Mn (previous year loss of Rs. 10.3 Mn).
CinnamonThe Company owns the largest cinnamon plantation among the RPCs in the country. During the year under review, the Company recorded a turnover increase of 93% from cinnamon over the previous year - achieving a Rs. 106 Mn turnover. Cinnamon is one of the main areas of diversification that the Company has focused on in recent years and expects a substantial increase in the turnover from cinnamon and payback on investments in the mid to long term.

16 / BROWN AND COMPANY PLC
AgStar PLCFertiliserAfter years of external challenges in the fertiliser business, the Company was able to achieve a record sales volume and turnover growth in 2020/21, against the backdrop of favourable weather conditions. As a result, the Company was successful in carving out a 17% share of the total market which marks an increase of around 71% compared to the preceding year. Despite the setbacks caused by the pandemic, AgStar’s new approach to the business as “Agents of Prosperity” - advising farmers on the importance of adopting good agronomic practices and a holistic approach on how to increase yields and profitability from farming without merely marketing products - proved to be a game-changer during the year.
Crop CareExtending the Company’s strong performance in the fertiliser segment, the Crop Care segment of the business too performed robustly during the period under review, experiencing volume growth in the weedicide, insecticide and fungicide categories. The granular as well as water soluble crop care products showed a slight uptick in demand in vegetable and paddy farming, which bodes well for future prospects.
SeedsThe year under review was truly an iconic one for the Company’s vegetable seeds and maize business and turnover increased by about 23%. It was a disappointing year when it came to seed paddy, as the Company was unable to achieve volumes and sales goals as a result of the high paddy prices that prevailed through the year. Many of the seed paddy farmers sold their paddy directly to the consumption trade without supplying to seed paddy processes.
Euro Asia TeaThe export segment however received a boost with the Company acquiring Euro Asia Tea, which has a state-of-the-art tea facility fully equipped to cater to a variety of tea bags, sachets, caddies, canisters, gift boxes, carton boxes, and bulk packs. The Company has already secured customers from Poland, Latvia, Israel and Azerbaijan.
Agri-Tech During the first full year of operations for the agri-tech segment, revenue increased by 538% as the division recorded 95% of its budgeted bottom line. Despite supply chain challenges, the Company successfully expanded its customer base by achieving 85% of the budgeted quantities for the year. Our core supplier was badly impacted by COVID-19 and was unable to supply enough tractors on time to meet the demand. However, by managing stocks, working capital and operational costs, the Company recorded a strong performance.
Sunbird Bio Energy Sierra LeoneThe Company trades wholesale ethanol (portable alcohol) to retail drink producers. The byproduct of the production process is renewable power, which is sold to the Government of Sierra Leone via the government-owned electricity Distribution
Company called EDSA. The Company, which has a large extent of 25,000ha of land along with a sophisticated production facility, is poised to produce ENA with is its newly-developed sugarcane plantation of 7,500ha. The current stock of ENA produced is 12 Mn litres and the Company is in the process of scaling up phase of the business plan. COVID-19 and other related factors have created a very challenging environment for the Company this year, with sales at lower than expected levels. But it continued its plantation extension and ENA production process, developing new storage infrastructure to enable increased production and export of products. This comprises of a new 5 Mn litre storage tank at a cost of US$1.1 Mn.
CONSTRUCTIONAjax EngineersAjax Engineers is a strong player in the fabrication and installation of aluminium doors, windows and facades, cladding work, structural glazing work and handrails for high-rise buildings and the household market. The most preferred and successful aluminium fabricator and installer among blue chip construction companies, with the Company having strong lines of businesses, including large apartment projects to corporate buildings.
With the COVID-19 pandemic impacting the construction business, the Company experienced a certain level of delay in completion of projects. However, Ajax continues to enjoy a strong line of new business, which provides a steady flow of revenues in the near future.
Creations Wooden Fabricators (Pvt) Ltd.Creations Wooden Fabricators is a main supplier for furniture solutions for hotel and apartment projects, offices as well as households. The project pipeline was promising for the year, however, due to the pandemic projects are being shifted, with further pressure on imports due to new regulations imposed. This will be an opportunity with a few more large-scale projects looking at local manufacturing opportunities. The Company introduced engineered wooden doors as a new solution for apartment projects in its product portfolio under the Lesso Brand. The Company also introduced readymade pantry cupboard solutions under two brands: Borcci and Golden Homes.
Creations will move into the manufacturing and installation of engineered type doors where immense potential is predicted in the market, especially with the current ongoing import restrictions. The Company is expected to start on large condominium pantry projects.
Gurind Accor (Pvt) LtdGurind Accor is into toughened safety (tempered glass) processing, insulated glass unit (DGDS), double glazing glass manufacturing and sand blast, facades, glass doors, staircase railings, shower cubicles, partitions, canopies, freezer tops, cabinet glass inside the refrigerator, table tops and vehicle glass.
MANAGEMENT DISCUSSION & ANALYSIS

Annual Report 2020/21 / 17
During the year under review, Gurind developed outstation markets and introduced double glazing and solar control glass panels (energy saving glasses/of different type of variety) and provided technical support to proper installation of glass in the market. The Company enjoys a strong growth since the acquisition by the Browns Investments Group.
Browns Engineering & Construction (Pvt) LtdBrowns Engineering & Construction (BEC) is engaged in telecommunication services, electrical engineering, MEP design and construction services, project management consultancy, project management and road construction works.
Browns Engineering holds a strong market position and is a major player in telecommunication infrastructure development and the maintenance industry. This achievement is considered remarkable given the short time the Company has taken to come to this strong position. Browns Engineering is a brand which is distinguished for its fully-fledged outside plant services for fibre networks (FTTx). The Company has become a strategic partner of Huawei Technologies and ZTE Lanka, while providing services to the telecom operators of Sri Lanka including Sri Lanka Telecom PLC, Mobitel Ltd, Dialog Axiata PLC, Airtel and Hutch. The Company provides design, supply and installation of fibre networks, construction of telecommunication towers, telecommunication equipment installation, drive testing and optimisation of networks, active and passive infrastructure maintenance.
During the year under review, the Company established departments for water supply, drainage construction and road construction work, participating in competitive bidding with third parties to fulfil the qualification requirements required under the terms of tenders.
In the civil construction sector, BEC is the Management Contractor for the Bodufinolhu Beach Resort Project in Maldives and has achieved a completion percentage of 78%. Further, BEC is the Management Consultant for the Nasandhura Hotel & Apartment Complex in the Maldives and has achieved a completion percentage of 86%.
Browns Engineering & Construction is also the Management Contractor for the Riverina Resort Project in Beruwela, and has commenced the balance MEP works and envisages completion of the project by end 2023. The new concept of development will be 357-key fully integrated 5-star beach resort of international standing.
RENEWABLE ENERGYSagasolar Power (Pvt) LtdSagasolar Power (Pvt) Limited is the first utility scale solar plant to be developed in Sri Lanka. The plant is scaled at 10 MW. At the time the plant was commissioned, the largest plant in the country was approximately 1MW. The plant which was commissioned in October 2016 has been in operation for
over three years and supplies power to the Hambantota CEB subgrid from its location in Baruthankanda, Hambantota. The plant produces approximately 19 million Kwh per year and thereby powers approximately 15,000 homes and reduces the nation’s carbon dioxide emissions by 11,000 tons.
REAL ESTATE AND OTHER INVESTMENTSBrowns Properties (Pvt) LtdBrowns Properties (Pvt) Ltd owns and manages the Browns Capital building in Colombo. There is a growing demand for office space and warehousing together with the gradual increase in property values, mainly due to the Government’s pursuit of rapid growth in infrastructure and road development and developments in business and industries across Sri Lanka. Most floors of the Browns Capital building are occupied and Browns Properties achieved good results in the year under review.
Other InvestmentsBrowns Investments PLC manages a substantial portfolio of lands consisting of a significant extent located in the Western Province. This land portfolio is currently held as a strategic investment for value appreciation or for future development.

18 / BROWN AND COMPANY PLC
CORPORATE GOVERNANCE REPORT
We are committed to creating value for our stakeholders and contributing to wider society through corporate governance excellence
The Board is committed to delivering strong corporate governance for our shareholders, employees, suppliers, partners and customers, especially during these times of uncertainty and instability presented by the COVID-19 pandemic. For this reason, we take seriously our commitment to maintaining the highest levels of corporate governance to support the creation of long-term sustainable value for the benefit of all our stakeholders over the past year and our plans for the coming year.
We continue to build on what we believe are our sound ethical foundations and strong culture as embodied in our values, namely respecting everyone’s dignity, acting with integrity, progressing through collaboration, and pursuing with rigour.
Whilst our approach of strong governance with a focus on ethics has remained unchanged, events in 2020/2021 have placed unexpected demands on the Board. The statement below, together with the rest of the Corporate Governance Report, provide information to aid understanding of how the Company has applied the principles in the Code of Best Practice on Corporate Governance (“the Code”) jointly issued by The Securities and Exchange Commission of Sri Lanka (SEC) and the Institute of Chartered Accountants of Sri Lanka (CA Sri Lanka).
As a listed company on the Colombo Stock Exchange, the Company is reporting in accordance with the Code. The Code sets out standards of good practice in relation to: board leadership; division of responsibilities; board composition, succession and evaluation; audit, risk and internal control; and remuneration.
The Board has been taking time to understand the views of our most valued stakeholder groups and is confident in presenting a statement in this Report on how various stakeholder interests have been taken into account in decision-making at the Board. The Board has worked closely with the Senior Management to ensure that we continue to make good progress on our strategic priorities whilst we respond to the changing needs of our stakeholders, delivering value to our customers and protecting the health, safety and wellbeing of our people in this fast-changing environment.
GOVERNANCE DOCUMENTS: The Companies Act No.7 of 2007
Articles of Association
Listing Rules of the CSE
SEC Act No.36 of 1987 as amended
The Code of Best Practices on Corporate Governance
Matters reserved for the Board
Terms of reference of the Board Committees
General business principles of Browns
Code of conduct

Annual Report 2020/21 / 19
These key elements are discussed in detail in this report.
KEY COMPONENTS OF THE CORPORATE GOVERNANCE FRAMEWORK
INTERNAL GOVERNANCE STRUCTUREIt comprises of units or committees within the Company that ensure effective monitoring and execution of governance related processes, policies and systems. This ensures the accountability and sustainability of the business.
ASSURANCE OF COMPLIANCEThe supervisory arm of the Company’s Corporate Governance Mechanism which guides the Company’s progress by way of developing and implementing appropriate corporate strategies. This supervisory arm enables regular review of progress, highlights deviations (if any), suggests corrective methods and ultimately ensures the integrity of operations.
REGULATORY FRAMEWORKThe Regulatory Framework governs the Company’s operations. This includes Articles of Association of the Company, Companies Act No. 07 of 2007, Listing Rules of the CSE, rules of the SEC and other applicable laws, regulations and best practices.

20 / BROWN AND COMPANY PLC
Mandatory Compliance Companies Act No. 07 of 2007 Articles of Association of the Company Listing Rules of the CSE Rules and Regulations of other Authorities such
as the Department of Inland Revenue of Sri Lanka
Voluntary Compliance The Code of Best Practice on Corporate Governance
jointly published by the Securities and Exchange Commission and The Institute of Chartered Accountants of Sri Lanka
Board approved policies and procedures on all major operations
EMPLOYEES
External Audit
Board Committees
Audit Committee Remuneration Committee Related Party Transactions
Review Committee Business Operations Committee Group Management Committee
REGULATORY FRAMEWORK
Chief Operating Officer & Senior Management
Operations Services
Executive Chairman & Board of Directors
Chief Financial
Officer
Company Secretaries
Assurance of C
ompliance
Internal Controls Code of Best Practice and Ethics Policies and Procedures Internal Audit
CORPORATE GOVERNANCE FRAMEWORK AT BROWNS
Inte
rnal
Gov
erna
nce
Stru
ctur
e
SHAREHOLDERS/STAKEHOLDERS
CORPORATE GOVERNANCE REPORT

Annual Report 2020/21 / 21
CORPORATE GOVERNANCE FRAMEWORKThe key components of the Corporate Governance framework of the Company is based on the following key elements:
1. INTERNAL GOVERNANCE STRUCTUREThe main three pillars of the internal governance structure of the Company are as follows;
A) The Executive Chairman and the Board of Directors
B) Board Committees
C) Internal Controls
1-A The Executive Chairman and the Board of DirectorsThe structure of the Board is designed to ensure that it focuses on strategy together with the monitoring of performance, control and risk. The Board considers that the Company’s governance structure facilitates the operation of an open and straightforward culture, and is not burdened by complex hierarchies and over-delegation of responsibilities.
THE BOARDResponsible for the overall conduct of the Group’s business including our long-term success; setting our purpose; monitoring
culture; values; standards and strategic objectives; reviewing our performance; and ensuring a positive dialogue with our stakeholders is maintained.
AUDIT COMMITTEEReviews the adequacy of the Group’s system of internal control, including the risk management framework and related compliance activities. Monitors the integrity of financial statements, reviews significant financial reporting judgements, advises the Board on fair, balanced and understandable reporting and the long-term viability statement.
REMUNERATION COMMITTEEReviews and recommends the policy on remuneration of the Senior Management team. Monitors the implementation of the Remuneration Policy. Oversees general pay practices across the Group.
RELATED PARTY TRANSACTIONS REVIEW COMMITTEEReviews and recommends the policy on all Related Party Transactions practices across the Group.
The Board has a formal schedule of matters reserved for it and holds regular meetings where such matters are discussed and approved, including investments, significant items of capital expenditure, property valuations, policies and procedures and IT security. It is also responsible for: The long term success of the Company, setting and
executing the business strategy and overseeing delivery in a way that enables sustainable long term growth;
Providing effective leadership whilst delegating more detailed matters to its Committees and officers including the Chief Operating Officer and the Chief Financial Officer of the Group;
Setting and monitoring the Group’s risk appetite and the system of risk management and internal control and for monitoring;
Implementation of its policies by the Executive Team; Approving Annual Group budget and subsequent regular
review of performance against budget including explanation of significant variances. Forecasts for each year are revised and reviewed in periodical manner.
HIGHLIGHTS OF WHAT THE BOARD DID THIS YEAR Approved to increase the stake in its listed subsidiary
Browns Investments PLC upto 64.55% and injecting more capital to identified unlisted subsidiaries
Approved the upgrading of ERP system to Microsoft Dynamics Business Central from Microsoft Dynamics AX 2009
Approved the Annual Budget for the FY 2021/2022 Approved major CSR activities Recommended the re-appointment of External
Auditors

22 / BROWN AND COMPANY PLC
THE ROLE OF THE EXECUTIVE CHAIRMANThe Chair is responsible for leading the Board, setting the agenda and ensuring its effectiveness. This position is responsible for promoting a culture of openness and robust debate within the Board and setting the tone of the Group as a whole. The Chair ensures there is effective communication with shareholders and other stakeholders and that the Board has a clear understanding of their views.
Key responsibilities of the Executive Chairman are as follows; Leads the Board, sets each meeting agenda and ensures the
Board receives accurate, timely and clear information in order to monitor, challenge, guide and take sound decisions;
Promotes a culture of open debate between Executive and Non-Executive Directors and holds meetings with the Non-Executives;
Regularly meets with the Executive Director, Group Chief Operating Officer and other senior management to stay informed;
Ensures effective communication with shareholders and other stakeholders;
Promotes high standards of corporate governance and ensures Directors understand the views of the Company’s shareholders and other key stakeholders so they can consider them in Board discussions and decision-making;
Promotes and safeguards the interests and reputation of the Company; and
Represents the Company to customers, suppliers, governments, shareholders, financial institutions, the media, the community and the public.
The Chief Operating Officer (COO) of the Group is responsible for leading and managing the Group’s business within a set of authorities delegated by the Board and for the implementation of Board strategy and policy.
Other responsibilities of the Group COO are as follows: Day-to-day management of the Group; Responsible for all commercial, operational, risk and financial
elements of the Group; Developing the Group’s strategic direction and implementing
the agreed strategy; Ensuring effective communication and information flows to
the Board and the Chairman; Representing the Group to external stakeholders; Responsible for the oversight of key functions of the Group.
THE BOARD OF DIRECTORS
Board activities are structured to develop the Group’s strategy and to enable the Board to support executive management on the delivery of it within a transparent governance framework.
The Board is collectively responsible to the Company’s shareholders for the direction and oversight of the Company to ensure its long-term success. This is achieved through effective governance and keeping the interests of stakeholders at the fore when making decisions. The Board provides leadership by establishing the Group’s purpose and values and setting the Group’s strategy, ensuring alignment with our culture and overseeing its implementation by the management.
The Board’s role is to provide entrepreneurial leadership of Browns within a framework of effective controls which enable risks to be assessed and managed. The Board establishes the Company’s purpose, values and strategy, and satisfies itself that these and its culture are aligned. It is responsible for ensuring the necessary resources are in place for the Company to meet its objectives and for measuring performance against them. The Board is accountable for promoting the long-term sustainable success of the Company, generating value for shareholders and contributing to wider society. The Board is also responsible for oversight of the Group’s governance, internal control and risk management, including the Group’s risk appetite.
At each scheduled Board meeting, reports are presented by the Group COO/ CFO and members of the Senior Management team, covering the operational and financial performance of the business, governance developments, investor relations, internal and external communications and corporate development.
CORPORATE GOVERNANCE REPORT

Annual Report 2020/21 / 23
Specific areas of focus by the Board during the year under review included:
Item Discussions, decisions and actions
Response to COVID-19 Discussed and appraised all major developments in the Group’s response Promoted colleague well being Endorsed enhanced health and safety measures
Strategy and business plans Discussed strategic priorities of the Company for the year 2020/2021 Continued to monitor the Group’s strength and stability whilst overseeing and
supporting the acceleration of digital services Considered strategic opportunities for the Group Received divisional strategic updates
Risk Management and compliance Risk management continued to be a priority for the Board, including the emergence of new risks such as sustainability
Appraised the principal risks, mitigating actions and controls Considered the Board’s risk appetite and tolerances Approved renewal of Directors’ and Officers’ Liability insurance cover Received update on the health, safety and security framework
Financial reporting and control Reviewed and approved the Group’s full-year and quarterly financial results for the FY 2020/2021 together with the 2021 Annual Report
Approved the re-appointment of M/s. PwC as the Auditors subject to shareholders’ approval at the AGM
Approved the Annual Budget
Organisation, People and culture Identified opportunities to improve our organisational culture and ways of working Regularly discussed the current Group culture, its alignment with strategy, and how it
has been further strengthened during the year Undertook an evaluation of the Board’s effectiveness, the effectiveness of each
committee and individual directors and implemented an action plan in accordance with its recommendations
Stakeholders Discussed brand and customer proposition
Received updates on customer metrics, strategies and challenged action plans to reduce customer complaints
The Board considered and endorsed our customer experience ambition, performance and plans for the business
Governance and compliance Received regular updates on compliance Undertook annual review of all conflicts of interest
Certain specific responsibilities are delegated to the Board Committees, which operate within clearly defined terms of reference and report regularly to the Board. For further details, please see the ‘Board Committees’ section on page 27 to 28. Authority for the operational management of the Group’s business has been delegated to the Group Chief Operating Officer for execution or further delegation by him for the effective day-to-day running and management of the Group. The Heads of each Business Units within the Group has authority for that business and reports directly to the Group Chief Operating Officer.
Board Meetings and AttendanceThe Board and its Committees have a scheduled forward programme of meetings to ensure that sufficient time is allocated to each key area and the Board’s time is used effectively. There is sufficient flexibility for items to be added to the agenda which enables to focus on key matters relating to the business at the right time. Directors may also propose the inclusion of items on the agenda. The Board is determined to hold not less than four annual meetings, and at least quarterly.

24 / BROWN AND COMPANY PLC
The Board of Directors held four meetings during the year under review.
All Directors bring independent judgement on matters relating to the Board. The Chief Operating Officer/ Chief Financial Officer of the Group are invited to attend Board meetings. The Heads of Divisions and any other senior officers of the Company including the Internal and External Auditors are invited, when appropriate.
The presentation on the results and strategies of the business units are presented by the Group Chief Operating Officer. Papers for Board and Committee meetings are generally provided to Directors in advance of the meetings. Where a Director is unable to participate in a meeting still his/her views on key items of business could be expressed and shared in advance of the relevant meeting enabling him/her to contribute to the debate.
The attendance details of the Directors at Board meetings during the year under review are shown in the table below.
20.07.2020 25.08.2020 13.11.2020 15.02.2021 Total
Ishara Nanayakkara √ √ x x 2/4
Kapila Jayawardena √ x √ √ 3/4
Kalsha Amarasinghe √ √ √ √ 4/4
Janaka de Silva √ x √ √ 3/4
Tissa Bandaranayake √ √ √ √ 4/4
Danesh Abeyrathne (appointed with effect from 18th November 2020)
- - - √ 1/1
Professional AdviceShould Directors judge it necessary to seek independent advice about the performance of their duties with the Company, they are entitled to do so at the Company’s expense. There is a regular flow of written and verbal information between all Directors irrespective of the timing of Board meetings. The Company has an open culture and its Non-Executive Directors meet on a formal and informal basis with the management and have unrestricted access to the business and its employees.
Company SecretariesAll Directors have access to the advice and services of the Company Secretaries who ensure that Directors take independent professional advice when it is judged necessary in order to discharge their responsibilities effectively. The Company Secretaries attend all Board meetings and are responsible for advising the Board on corporate governance matters and facilitating the flow of information within the Board. Any decision to appoint or remove the Company Secretaries is a matter reserved to the Board. LOLC Corporate Services (Private) Limited serves as the Secretaries of the Company.
Board Responsibilities and Decision RightsFaced with the sudden and unprecedented short- and long-term impact of the COVID-19 pandemic, both social and economic, it is important for the Board to demonstrate the strength of its leadership through fair and balanced decision-making. As the interests of key stakeholder groups continue to evolve, the Board will maintain its engagement to ensure their interests continue to be well understood in order to be appropriately considered and balanced in Board decision-making. Principal decisions are assessed as material to the Group’s strategy.
Given the Board´s commitment to continuous improvement, an ongoing training programme for Directors at appropriate times is in place. All Directors are well informed of the changes in any statutory and regulatory rules and regulations. Transactions which have a material bearing on the Company are disclosed by way of circulars to shareholders and by announcements to the Colombo Stock Exchange.
CORPORATE GOVERNANCE REPORT

Annual Report 2020/21 / 25
Induction and professional development
The Directors are required to follow the Best Practices as illustrated below:
Nominees are requested to make known their various interests that could potentially be in conflict with the interests of the Company.
Directors who have an interest in a matter under discussion; Excuse themselves from deliberations on the subject matter Abstain from voting on the subject matter (abstentions where applicable to form decisions
are duly minuted) Declare interest and comment if needed
Directors obtain Board clearance prior to engaging in any transaction that could create a potential conflict of interest.
All Non-Executive Directors shall notify the Executive Chairman of any changes to their current Board representations or interest including related parties.
All Directors should make a general disclosure of interest every year and also of any changes thereto.
PRIOR TO APPOINTMENT
ONCE APPOINTED
DURING BOARD MEETINGS
We believe good decision-making is enabled by a deep understanding of our operations and people. All our Directors commit their time to complete an induction and training programmes. The Board recognises that it needs to continually monitor and improve its performance. This is achieved through the annual performance evaluation, full induction of new Board members and ongoing Board development. The conclusions of this year’s review have been positive and confirmed that the Board remains effective.
We have a comprehensive induction programme in place for our newly appointed Directors and each new Director is provided with a tailored induction programme to suit their individual needs. This involves meetings with other members of the Board, Executive Committee members and senior management, it also covers technical briefings and site visits. During the induction, each Director is encouraged to identify areas which they would like additional information on, or further meetings. On completion of the induction programme, all new Directors have sufficient knowledge and understanding of the business to enable them to effectively contribute to strategic discussions and oversight of the Group.
Board training and developmentTo assist the Board in undertaking its responsibilities, ongoing training is provided for all Directors and training needs are assessed as part of the Board evaluation procedure. The Board programme includes regular presentations from the management, site visits if necessary, and informal meetings, to build their understanding of the business and sector. During the past year, Directors received regular training on our local markets, our operating environment and recent legal and governance developments impacting Browns.
Financial AcumenThe Board recognises that its responsibility to present a fair, balanced and understandable assessment extends to interim and other price-sensitive public reports, reports to regulators, and information required to be presented by statutory requests. In relation to this requirement, reference is made to the Statement of Directors’ Responsibility for preparing the Financial Statements set out on page 55 of this Annual Report and Accounts. The Board consists of three senior Accountants who possess the necessary knowledge to offer the Board guidance on matters of finance.

26 / BROWN AND COMPANY PLC
Board balance The structure of the Board is designed to ensure that it focuses on strategy together with the monitoring of performance, control and risk. Through delivery of our succession plan we have in place a smaller, cohesive Board that will provide the informed insight and constructive support and challenge that will be critical in the year ahead.
The Board is committed to ensuring that its membership reflects diversity in the broadest sense and while all Board appointments
are made on the basis of individual competence and merit, recruitment of Board members considers diversity of skills, background and personal strengths to provide the range of perspectives, insights and challenge needed to have a positive impact on the quality of decision making.
The composition of the Board changed during the year as part of succession planning exercise. Of the six members currently sitting on the Board, two are Non-Executives, two are Independent Non-Executives and two are Executives.
No Name of Director Executive / Non-executive
Independent/Non-independent
Involvement/interest in shareholding
Gender representation
1 Ishara Nanayakkara Executive Non-independent Yes Male
2 Kapila Jayawardena Non-Executive Non-independent No Male
3 Kalsha Amarasinghe Non-Executive Non-independent No Female
4 Janaka de Silva Non-Executive Independent No Male
5 Tissa Bandaranayake Non-Executive Independent No Male
6 Danesh Abeyrathne Executive Non-independent No Male
The Board considers that the two Independent Non-Executive Directors are independent in character and judgement and that they are each free from any business or other relationships which would materially interfere with the exercise of their independent judgement. The Independent Non- Executive Directors have submitted signed confirmations of their independence
Mr. Janaka de Silva, Director completed his term of nine (9) years on 23rd September 2019. The Board considered factors affecting the Independence of Mr. de Silva in accordance with the Colombo Stock Exchange Rules and determined that he is independent in character and judgement
The Directors have a range of experience and can bring independent judgement to bear on issues of strategy, performance, resources and standards of conduct. This experience and judgement are considered vital to our success. It is the balance of skills, experience, independence and knowledge of our Directors which ensures the duties and responsibilities of the Board and its Committees are discharged effectively. The Board has considered the Chairman’s role and determined that he has appropriate time and resource to devote to his role as the Chairman of Browns. All Directors are subject to election or re-election by shareholders at each Annual General Meeting.
The majority of the Board members are Non-Executives. The Non-Executive Directors provide independent oversight and constructive challenge to the Executive Management Team, helping to develop proposals on strategy, scrutinising performance in meeting agreed goals and objectives. They play a primary role in succession planning.
Appointment and Re-election of DirectorsIf any new appointments are made to the Board they are communicated to the shareholders via a market disclosure to the Colombo Stock Exchange. As announced in November 2020, Danesh Abeyrathne joined the Board of Brown and Company PLC on 18th November 2020 as an Executive Director. The profiles of the current Directors are given on pages 3 to 4.
The Company’s Articles of Association require one of the Directors in office to retire at each Annual General Meeting. The Director who retires will be the one who has been longest in office since his/her appointment/ re-appointment. Retiring Directors are generally eligible for re-election by the shareholders.
Board evaluation The Board recognises that it needs to continually monitor and improve its performance. This is achieved through the annual performance evaluation, full induction of new Board members and ongoing Board development. The conclusions of this year’s review have been positive and confirmed that the Board remains effective. The Chairman and Company Secretaries worked together to devise a structure for the internal evaluation process to enable a rigorous review of the Board as a whole, its Committees and individual Directors’ contributions to Board discussions and decision-making. More time devoted to discussion around strategic matters and succession planning was positively received. All Directors demonstrated commitment to their roles and contributed effectively.
CORPORATE GOVERNANCE REPORT

Annual Report 2020/21 / 27
Subsidiary Companies’ Monitoring FrameworkAll subsidiary companies of Brown and Company PLC are managed by their respective Boards according to the respective Companies’ Articles of Associations and in the best interest of their stakeholders. Brown and Company PLC monitors the performance of subsidiary companies.
1.B Board CommitteesThe Board discharges some of its responsibilities through, and is supported by, its Committees which provide oversight and make recommendations on the matters delegated to them by
the Board. The Board has established three principal Board Committees as shown on pages 27 to 28. From time to time, the Board establishes special purpose Committees to assist it in overseeing specific areas that may require additional attention.
Board Committee membership and attendance at meetings is set out on pages 27 to 28. Each Committee is led by an experienced Chair. The matters being recommended by a Committee are forwarded for Board approval. A calendar is prepared and agreed upon at the beginning of each year.
The compositions of the Board Committees as at date are as follows:
Audit Committee Remuneration Committee
Related Party Transactions Review Committee
Business Operations Committee
Group Management Committee
Two Independent Non -Executive Directors
Two Independent Non -Executive Directors
Two Independent Non- Executive Directors
One Executive Director (Chairman)
One Executive Director (Chairman)
One Non-Executive Director
One Non-Executive Director
Two Non-Executive Directors
Two Non-Executive Directors
Senior Management
Audit CommitteeThe Audit Committee plays a vital role in the strong governance framework in place at Browns by providing independent challenge and oversight to significant matters including external disclosures and the Group’s internal control environment.
The composition of the Audit Committee is as follows:
Tissa BandaranayakeChairman/Independent Non-Executive Director
Janaka de SilvaMember/Independent Non-Executive Director
Kalsha AmarasingheMember/Non-Executive Director
The Company Secretaries serve as the Secretary to the Committee. The Directors who are non-members of the Committee are invited to the meetings. The Chief Operating Officer/Chief Financial Officer of the Group and the Chief Manager of Enterprise Risk Management are requested to be present at the meetings. The External Auditors are invited, when appropriate. The Audit Committee reviews the scope and results of the audit and its effectiveness, and the independence and objectivity of the Auditors. They also review the nature and extent of non-audit services provided by the Auditors to ensure that Auditors maintain objectivity and independence. The Committee operates within its written Terms of Reference and the Audit Charter. The purpose of the Committee, its duties and responsibilities including the scope and functions of the Committee are summarised in the Audit Committee Report on pages 42 to 44.
The attendance details during the year under review are as follows:
20.07.2020 25.08.2020 13.11.2020 15.02.2021 Total
Tissa Bandaranayake √ √ √ √ 4/4
Janaka de Silva √ x √ √ 3/4
Kalsha Amarasinghe √ √ √ √ 4/4
Remuneration CommitteeThe Committee’s primary purpose is to incentivise Executive Directors and Senior Management by aligning their interests with the strategic priorities of the Group and the creation of long-term value for the shareholders and other stakeholders. The Remuneration Committee is also made up exclusively of Non-
Executive Directors. The Committee currently comprises three Non-Executive Directors, two of whom are independent. The Committee met in order to review the remuneration policy of the Group. The detailed Remuneration Committee Report is given on pages 45 to 46 of this Annual Report.

28 / BROWN AND COMPANY PLC
The Committee comprises;
Kalsha AmarasingheChairperson/Non-Executive Director
Tissa BandaranayakeMember/Independent Non-Executive Director
Janaka de SilvaMember/Independent Non-Executive Director
Related Party Transactions Review CommitteeThe Related Party Transactions Review Committee was established to enhance corporate transparency and promote fair transactions. The Committee is responsible for reviewing related party transactions as per the guidelines given in the Listing Rules of the CSE.
In accordance with Section 9 of the Listing Rules of the CSE, the Related Party Transactions Review Committee shall consist of Non-Executive Directors and Independent Non-Executive Directors. The composition of the Committee may also include Executive
Directors, at the option of the Listed Entity. The Committee currently consists of two Independent Non-Executive Directors.
The Related Party Transactions Review Committee meets at least once every quarter. The meeting schedule for the year is provided to the Committee by the Company Secretaries at the beginning of each year. The presence of a majority of the Committee members constitute a quorum and resolutions are adopted by a majority of the votes of members attending the meeting.
The Company recognizes that Related Party Transactions may raise questions as to whether those transactions are consistent with the best interests of the Company and its shareholders. It is the Company’s policy to enter into or ratify Related Party Transactions only when the Related Party Transactions Review Committee determines that the Related Party Transaction in question is in, or is not inconsistent with, the best interests of the Company and its shareholders. The Company’s Board of Directors will review the Policy at least annually and may update the Policy from time to time in connection with such review.
The attendance details during the year under review are as follows:
20.07.2020 25.08.2020 13.11.2020 15.02.2021 Total
Tissa Bandaranayake √ √ √ √ 4/4
Janaka de Silva √ x √ √ 3/4
Kalsha Amarasinghe √ √ √ √ 4/4
Kapila Jayawardane √ x x √ 2/4
The detailed Related Party Transactions Review Committee Report is given on page 47 of this Annual Report.
The Related Party Transactions Review Committee comprises;
Tissa BandaranayakeChairman /Independent Non-Executive Director
Janaka de SilvaMember/Independent Non-Executive Director
Kalsha AmarasingheMember /Non-Executive Director
Kapila JayawardenaMember/Non-Executive Director
Business Operations CommitteeThe Business Operations Committee meets in order to discuss strategic investment proposals, evaluating the financing options and other risks associated with such initiatives and recommends the chosen proposals to the Board. The Committee meets at regular intervals depending on the requirement. The Report of the Committee is given on page 48 of this Annual Report.
The Committee comprises of;
Ishara NanayakkaraExecutive Chairman
Kalsha AmarasingheMember/Non-Executive Director
Kapila JayawardenaMember/Non-Executive Director
Management CommitteeThe Group Management Committee is chaired by the Executive Chairman and the Senior Management. The Committee meets every month to review Group, Corporate, Divisional and Departmental performances against pre-determined Annual Business Plans and Budgets. The introduction of peer adjusted organisational ratings in determining pay for performance has resulted in the search by business units, sectors and industry Groups for productivity enhancements, process improvements and cost efficiencies within a framework of better teamwork.
1-C Internal ControlsThe Board is responsible for the Group’s systems of internal control. The internal control framework is designed to facilitate effective and efficient operations, ensure a high quality of
CORPORATE GOVERNANCE REPORT

Annual Report 2020/21 / 29
internal and external reporting, and ensure compliance with applicable laws and regulations. Directors and the Management are committed to maintaining a robust control framework as the foundation for the delivery of effective risk management. Owing to the limitations inherent in any internal control framework, the controls have been designed to manage and mitigate, rather than eliminate, the risks. The Directors acknowledge their responsibilities in relation to the Group’s internal control framework and for reviewing its effectiveness.
The Board confirms that throughout the year and up to the date of approval of this Annual Report & Accounts, there have been rigorous processes in place to identify, evaluate and manage the principal risks faced by the Group, including those that would threaten its business model, future performance, solvency or liquidity, the likelihood of a risk occurring and the costs of control in accordance with the Code of Best Practices on Corporate Governance.
The Audit Committee assists the Board in discharging its responsibilities with regard to external and internal audit activities and controls including reviewing audit reports, internal controls and risk management systems. The Audit Committee is satisfied that the Group’s risk management and internal control framework in relation to the Group’s risk profile and strategy was effective and adequate. The Board therefore remained satisfied that the system of internal control continued to be effective in identifying and assessing the various risks to the Group and in monitoring and reporting progress on their potential impact.
Some of the policies which play a key role in this respect are:
1) Code of Business Conduct and EthicsThis applies to all the employees of the Company. The code ensures that there is no conflict of interest where individuals’ interest conflicts with the interests of the Company, and makes timely disclosure of such situations; maintains confidentiality of information, ensures fair dealing with the Company’s customers and suppliers and refrains from any unfair dealing and manipulations, thereby promoting ethical behaviour within the Company.
2) IT GovernanceThe Company believes that the IT environment and the controls over this are the fundamental building block upon which our internal control environment is built.
The strong IT governance structure in place at Browns ensures that the effective and efficient use of IT enables the Company to create innovations to increase our digital savviness across the business. A thorough review was undertaken of our cyber environment to ensure that we have appropriate data and information governance processes and controls, e-commerce defences, proactive security and strong incident management processes across the business.
LOLC Technology Services Limited (LOITS), a subsidiary of the Parent Company, LOLC Holdings PLC provides the IT related services to the Company.
3) Enterprise Resources Planning (ERP)Browns, adapting to the constantly changing technological world and ever-evolving company trends embarked on the digital transformation journey by launching the company’s third ERP system, Microsoft Dynamics 365 Business Central SaaS. Prior to the newly implemented system, Browns has been using Microsoft Dynamics AX which was implemented in 2012 to accelerate the operational processes. Microsoft Business Central is based on cloud, enabling employees a wide range of capabilities with regard to their everyday work.
With the implementation of ERP, a major change was that the entire organisation was converted to a full time Microsoft ERP platform. The overall business information model has improved tremendously and further improvements were added in the areas of after sales and front-end services. This enhanced the quality of information processes along with the new standard operating procedure and ERP functional user manuals which were developed in order to set the ground rules for continued good administration. The ERP also assisted the organisation in its business expansion programme by providing flexibility in decision making with both speed and volume of data availability.
4) Internal AuditThe Internal Auditors monitor and report on the adequacy of the Financial and Operational systems of the divisions, in order to strengthen internal controls. The Internal Audit team comprises the necessary skills and experience relevant to the operation of each business. All of the internal audit activities are coordinated centrally by the LOLC-Enterprise Risk Management Team.
All Group businesses are required to comply with the Group’s financial control framework that sets out minimum control standards. A key function of the Group’s internal audit resources is to undertake audits to ensure compliance with the financial control framework and make recommendations for improvement in controls where appropriate. Internal Audit also conducts regular reviews to ensure that risk management procedures and controls are observed. The Audit Committee receives regular reports on the results of Internal Audit’s work and monitors the status of recommendations arising. The Committee reviews the nature and scope of the Internal Audit activity in the overall context of the Group’s risk management system.
2. ASSURANCE OF COMPLIANCEThe Board, through the Group Legal and Secretarial Division, the Group Finance Division and its other operating structures, monitors and assesses the level of compliance of the Company with laws and regulations. It also reviews the changes in regulations and strives to ensure that the Company is in compliance with the regulatory requirements of the country. The Board receives updated reports on compliance at each Board meeting held after a Financial Quarter with regard to the significant legal and regulatory frameworks that are applicable to its operations.

30 / BROWN AND COMPANY PLC
When carrying out the function of compliance, the Internal and External audit as well as Board Committees also play a vital role in the governance structure of the Company.
AccountabilityThe Board recognises its responsibility to present a fair, balanced and understandable assessment of the Company’s position, performance, business model and strategy. This extends to interim and other price-sensitive public reports, reports to regulators, and information required to be presented by statutory regulations. In relation to this, reference is made to the Statement of Directors’ Responsibility for preparing the Financial Statements set out on page 55 of this Annual Report and Accounts. A description of the Company’s business model for sustainable growth is set out in the Management Discussion & Analysis on pages 5 to 17. This section provides an explanation of the basis on which the Group generates value and preserves it over the long term and its strategy for delivering its objectives.
External AuditM/s. PricewaterhouseCoopers, Chartered Accountants acted as the External Auditors of the Company for the reporting year. The Company has the necessary mechanisms in place to ensure the independence of the External Auditors, and the Audit Committee verifies that the services provided by the Auditors comply with applicable legislation.
Going ConcernThe Board of Directors, after reviewing the financial position and the cash flow of the Company are of the belief that the Company has adequate resources to continue operations well into the foreseeable future. Therefore the Board adopts the going concern basis in preparing financial statements.
Ethical StandardsThe Board is committed to maintaining high ethical standards in conducting its business and to communicate its values to its employees and agents and ensure their conduct is based on such values.
Stakeholder EngagementOur Board is committed to engaging with stakeholders directly wherever possible. Decisions are made by the Board which can impact one or more of our key stakeholder groups in quite different ways. This requires a considered and balanced approach to decision-making, ensuring high-quality information is provided to the Board in a timely manner, and diversity of thought and open discussions during meetings. Our internal effectiveness review concluded that high-quality information was received by the Board and appropriate time was allowed for Board discussion. Our key stakeholder groups are identified as most likely to be affected by the principal decisions of the Board and include our customers, our people, our suppliers, our local communities and non-governmental organisations, regulators and governments and our investors.
ShareholdersThe Company is committed to enhance long term shareholder value and facilitate existing shareholder rights
Customers/CommunityThe Company is committed to maintain and enhance its public reputation and to meet its CSR obligations
RegulatorsThe Company is committed to ensure the fulfilment of all regulatory requirements fulfilling the legal and good governance practices adopted by the Company
EmployeesThe Company is committed to build a convenient and conclusive work environment
STAKEHOLDERS’ RIGHTS FRAMEWORK
STAKEHOLDERS’ RIGHTS
CORPORATE GOVERNANCE REPORT

Annual Report 2020/21 / 31
Shareholder RelationsThe Company reports formally to shareholders in a number of ways. Significant matters relating to trading or development of the business, and routine reporting obligations, are disseminated by way of Stock Exchange announcements and by press releases. The Board considers the Annual General Meeting as a prime opportunity to communicate with shareholders. Shareholders are given the opportunity of exercising their rights at the Annual General Meeting. Each resolution brought before the shareholders at the Annual General Meeting is voted on separately by them. The notice of the Annual General Meeting and the relevant documents required are published and sent to the shareholders within the statutory period. The Annual General Meeting provides an opportunity for shareholders to seek and obtain clarifications and information on the performance of the Company and to formally meet the Directors. The External Auditors are also present at the Annual General Meeting to render any professional assistance that may be required. Shareholders who are not in a position to attend the Annual General Meeting in person are entitled to have their voting rights exercised by a proxy of their choice.
The Company publishes Interim Financial Statements in a timely manner. This enables the stakeholders to make a rational judgement of the Company.
Shareholders can also contact the Company directly via a dedicated email address or via dedicated telephone numbers, provided on the inside back cover of this report. The Company’s website also contains information for institutional and retail shareholders alike. The Company’s Registrars provides access facility for registered shareholders, providing details of their shareholdings. Facilities are also provided for shareholders to lodge proxy appointments electronically.
Corporate Social ResponsibilityThe Board actively takes part in defining and overseeing the corporate culture and values, particularly in the corporate social responsibility policy. The Board continuously reviews the policies for sustainability, corporate culture and values, and on relations with stakeholders, especially employees, customers and consumers in countries where the Group operates. The corporate social responsibility policy is structured in line with the business strategy and risk appetite and putting into place mechanisms to ensure that all Group entities know how they fit into these strategies and that their processes and mechanisms are consistent with those of the policy of the Ultimate Parent.
3. REGULATORY FRAMEWORKThis refers to the regulatory structure within which the Group operates in conforming to established governance related laws, regulations and best practice. This comprises, among others, the Companies Act No 07 of 2007, Listing Rules of the CSE, rules of the SEC and the benchmarks set for the Group in working towards local and global best practices.
OUR BUSINESS MODELWe create long-term value through the effective use of our resources and relationships. We manage these in line with our core values of Inspiration, Innovation and Integrity.
Self-Governance Practices by the CompanyOur Group has grown and evolved considerably since its formation and a great deal has changed, but the essence of what we do has remained a constant. Operating ethically is a core value at the heart of our Group and our intention has always been to do the right thing for our people and the wider community. Our approach to ensuring that this is sustained is described in the Management Discussion & Analysis section of this Report.
The Solvency Statements prepared by the Group Chief Financial Officer are tabled every quarter at the Board Meeting in order to ascertain whether the Company is solvent. As provided by the Companies Act No.7 of 2007, the Company has in place appropriate Directors’ and Officers’ liability insurance cover in respect of legal action against its Executive and Non-Executive Directors, amongst others.
The rules of Corporate Governance and disclosure requirements for listed companies as mandated by the Securities & Exchange Commission of Sri Lanka and also in the requirements of the listing rules of the Colombo Stock Exchange are complied with, as this helps to build an ethical environment in the Company.

32 / BROWN AND COMPANY PLC
CORPORATE GOVERNANCE REPORT
STATEMENT OF COMPLIANCE UNDER SECTION 7.10 OF THE RULES OF THE COLOMBO STOCK EXCHANGE (CSE) ON CORPORATE GOVERNANCE. (IMPLEMENTED ON 1ST APRIL 2009 AND INCLUDES AMENDMENTS TO DATE)
CSE RULE Compliance status
Company’s action
7.10 COMPLIANCECompliance with Corporate Governance Rules √ The Company is in compliance with the Corporate
Governance Rules and any deviations are explained where applicable
7.10.1 Non-Executive Directors (NED)At least 2 members or 1/3 of the Board, whichever is higher should be NEDs
√ 4 out of the 6 Board members are NEDs. The Company is conscious of the need to maintain an appropriate mix of skills and experience in the Board and to refresh progressively its composition over time, in line with needs.
7.10.2 Independent Directors a. 2 or 1/3 of NEDs, whichever is higher shall be
“independent”√ 2 out of the 4 NEDs are independent
b. Each NED to submit a signed and dated declaration of his/her independence or non-independence
√ Independence of the Directors has been determined in accordance with CSE Listing Rules based on a signed confirmation obtained from the Non-Executive Directors during the year under review
7.10.3 Disclosures relating to Directorsa. Names of the independent Directors should be
disclosed in the Annual Report√ The Company’s Independent Non-Executive Directors are:
Janaka de Silva
Tissa Bandaranayake
b. The Board shall annually determine the independence or otherwise of NEDs.
√ Based on the declarations received from the Non Executive Directors the Board has determined that the above two Directors are independent.
c. A brief resume of each Director should be included in the Annual Report including the Director’s experience.
√ Complied. Refer the Board of Directors section of this Annual Report.
d. Provide a resume of new Directors appointed to the Board along with details
√ Complied. Refer the Board of Directors section of this Annual Report.
7.10.4 Criteria for defining the Independence of DirectorsRequirements for meeting the criteria to be an Independent Director
√ All of the Independent Directors of the Company met the criteria for independency specified in this rule.
7.10.5 Remuneration Committeea.1 Remuneration Committee shall comprise of
NEDs, a majority of whom will be independent√ The Remuneration Committee comprises of two
Independent Non-Executive Directors and one Non-Executive Director.
a.2 One NED shall be appointed as the Chairman of the Committee by the Board of Directors.
√ A Non-Executive Director is the Chairman of the Committee.
b. The Remuneration Committee shall recommend the remuneration of the Executive Directors
√ The remuneration of the Chairman/ Executive Director is determined as per the remuneration principles of the Group and recommended by the Remuneration Committee.

Annual Report 2020/21 / 33
CSE RULE Compliance status
Company’s action
c.1 Names of Remuneration Committee members √ Refer the Board Committees section of this Annual Report.
c.2 Statement of Remuneration Policy √ Refer Remuneration Committee Report
c.3 Aggregate remuneration paid to EDs and NEDs. √ Aggregate remuneration - Company
EDs - Rs. 2.9 Mn
NEDs - Rs. 2.9 Mn
7.10.6 Audit Committeea.1 The Audit Committee (AC) shall comprise
of NEDs, a majority of whom should be independent
√ The Audit Committee comprises two Independent Non-Executive Directors and one Non- Executive Director.
a.2 A Non-Executive Director shall be the Chairman of the Committee
√ The Chairman of the Audit Committee is an Independent Non-Executive Director.
a.3 The CFO should attend AC meetings √ The Group Chief Financial Officer attended Audit Committee meetings by invitation.
a.4 The Chairman of the Audit Committee or one member should be a member of a professional accounting body.
√ The Chairman of the Audit Committee is a member of a professional accounting body
b. Functions of the AC √ The Audit Committee carries out all the functions stated in the Audit Committee Report section
b.1 Overseeing the preparation, presentation and adequacy of disclosures in the financial statements in accordance with SLFRS/LKAS
√ The Audit Committee assists the Board in fulfilling its oversight responsibilities regarding the integrity of the financial statements of the Company and the Group
b.2 Overseeing the compliance with financial reporting requirements, information requirements as per the laws and regulations.
√ The Audit Committee has overall responsibility for overseeing the preparation of financial statements in accordance with the laws and regulations of the country and also for recommending to the Board, the adoption of best accounting policies
b.3 Ensuring that the internal controls and risk management are adequate to meet the requirements of the SLFRS/LKAS.
√ The Audit Committee assesses the role and effectiveness of the Group Business Process which is largely responsible for internal controls and risk management
b.4 Make recommendations to the Board pertaining to External Auditors
√ The Committee is responsible for appointment, re-appointment, removal of External Auditors and also the approval of remunerations and terms of engagements
c.1 Names of the Audit Committee members shall be disclosed
√ Refer the Board Committee section in this Annual Report
c.2 Audit Committee shall make a determination of the independence of the External Auditors
√ Refer the Report of the Audit Committee in this Annual Report
c.3 Report on the manner in which the Audit Committee carried out its functions
√ Refer the Report of the Audit Committee in this Annual Report

34 / BROWN AND COMPANY PLC
CORPORATE GOVERNANCE REPORT
CODE OF BEST PRACTICES OF CORPORATE GOVERNANCE JOINTLY ISSUED BY THE SECURITIES AND EXCHANGE COMMISSION OF SRI LANKA (SEC) AND THE INSTITUTE OF CHARTERED ACCOUNTANTS OF SRI LANKA (CA SRI LANKA) (ISSUED ON 1ST JULY 2008 AND INCLUDES AMENDMENTS TO DATE)
Section Compliance status
Company’s Action
A. DIRECTORSA.1 The BoardA.1 The Company to be headed by an effective
Board to direct, lead and control the Company
√ The Company is headed by an effective Board of Directors who are responsible and accountable for the stewardship function of the Company.
A.1.1. Regular Board meetings √ The Board meets quarterly and as and when required
A.1.2 The Board should be responsible for matters including implementation of business strategy, skills and succession of the management team, integrity of information, internal controls and risk management, compliance with laws and ethical standards, stakeholder interests, adopting appropriate accounting policies and fostering compliance with financial regulations and fulfilling other Board functions
√ Powers specifically vested in the Board to execute their responsibility include:
Providing direction and guidance to the Company in the formulation of its strategies, with emphasis on the medium and long term, in the pursuance of its operational and financial goals.
Reviewing and approving annual budget plans. Reviewing HR processes with emphasis on top
management succession planning. Monitoring systems of governance and compliance Overseeing systems of internal control and risk
management. Determining any changes to the discretions/ authorities
delegated from Board to executive levels. Reviewing and approving major acquisitions, disposals and
capital expenditure. Approving any amendments to constitutional documents.
A.1.3 Act in accordance with the laws of the country and obtain professional advice as and when required
√ The Board seeks independent professional advice when deemed necessary. During the year under review, professional advice was sought on various matters, including the following: Impacts on BCL’s business operations as a result of the
current and future economic and geo-political shifts. An employee satisfaction survey and participation in
employee compensation and benefit surveys done to ensure that BCL is more than just a workplace of the highest standards.
Legal, tax and accounting aspects, particularly where independent external advice was deemed necessary in ensuring the integrity of the subject decision.
Market surveys, as necessary for business operations. Valuation of property including that of investment property. Specific technical know-how and domain knowledge
required for identified project feasibilities and evaluations.

Annual Report 2020/21 / 35
Section Compliance status
Company’s Action
A.1.4 Access to advice and services of the Company Secretary.
Appropriate insurance cover as recommended by the Nominations Committee for the Board, Directors and KMPs
√ To ensure robust deliberation and optimum decision making, the Directors have access to the services of the Company Secretaries whose appointment and/or removal is the responsibility of the Board.
The Company has appropriate insurance cover for KMPs according to the Group policy.
A.1.5 Bring independent judgment on various business issues and standard of business conduct
√ Collectively, the Non-Executive Directors bring a wealth of value adding knowledge, ranging from domestic and international experience to functional know-how, thus ensuring adequate Board diversity in accordance with principles of Corporate Governance. Furthermore, every member of the Board brings independent judgment on various business issues
A.1.6 Dedication of adequate time and effort √ Allowing for Non-Executive Director’s involvement in various Board Committees and time spent by them in considering various matters that require discussion and decision in between the formal Board meetings, the Company estimates that Non-Executive Directors devoted sufficient time for the Group during the year, with more than 15 per cent of the time devoted to strategy formulation.
A.1.7 One third of Directors can call for a resolution to be presented to the Board in the best interests of the Company.
√ All Directors are encouraged to submit any items/proposals to the agendas of the Board meetings.
A.1.8 Board induction and training √ In instances where Non-Executive Directors are newly appointed to the Board, they are apprised of the: Values and culture Operations of the Group and its strategies Operating model Policies, governance framework and processes Responsibilities as a Director in terms of prevailing
legislation Important developments in the business activities of the
Group
A.2 The ChairmanA.2.1 Maintain a clear division between Chairman
and the Chief Executive OfficerNot
applicablePresently the Company has an Executive Chairman. The appropriateness of having only the Executive Chairman was established after rigorous evaluation and debate both internally and externally. The appropriateness continues to be discussed periodically, and at least, once a year.
A.3 The Chairman’s roleA.3.1 The Chairman should ensure Board
proceedings are conducted in a proper manner
√ Refer Chairman’s role in Corporate Governance section in this Annual Report
A.4 Financial acumenA.4 The Board should ensure the availability
within it of those with sufficient financial acumen and knowledge to offer guidance on matters of finance
√ Two Board members hold membership in professional accounting bodies. Refer Board Member Profiles for more information

36 / BROWN AND COMPANY PLC
CORPORATE GOVERNANCE REPORT
Section Compliance status
Company’s Action
A.5 Board balanceA.5.1 The Board should include Non-Executive
Directors of sufficient calibre. √ Refer Board Member Profiles section
A.5.2 Three or two third of Non-Executive Directors appointed to the Board of Directors whichever is higher should be “independent”
Not applicable
Two out of the four Non-Executive Directors are independent
A.5.3 Definition of Independent Directors √ Both the Independent Directors of the Company are independent of management and free of any business or other relationship that could materially interfere with or could reasonably be perceived to materially interfere with the exercise of their unfettered and independent judgement.
A.5.4 Declaration of Independent Directors √ Each Non-Executive Director has submitted a signed and dated declaration of his independence.
A.5.5 Board determinations on independence or non-independence of Non-Executive Directors on annual basis
√ Both of the Independent Directors of the Company meet the criteria for independence specified in this rule.
A.5.6 Alternate Director Complied with
A.5.7 In the event the Chairman and the CEO are the same person, the Board should appoint one of the Independent Non-Executive Directors to be the ‘Senior Independent Director’ (SID)
Not Applicable
A.5.8 The Senior Independent Director should make himself available for confidential discussions with other Directors who may have concerns
Not Applicable
A.5.9 The Chairman should hold meetings with the Non-Executive Directors only, without the Executive Directors being present, at least once each year.
√ Informal discussions have been held with the Non-Executive Directors without the Executive Director being present.
A.5.10 Where Directors have concerns about the matters of the Company which cannot be unanimously resolved, they should ensure their concerns are recorded in the Board Minutes
√ All the Board meeting proceedings are comprehensively recorded in the Board minutes.
A.6 Supply of informationA.6.1 Board should be provided with timely
information to enable it to discharge its duties
√ The Board is provided with: Information as is necessary to carry out their duties and
responsibilities effectively and efficiently. Information updates from management on topical matters,
new regulations and best practices as relevant to the Group’s business
External and Internal Auditors’ opinions Experts and other external professional services The services of the Company Secretaries. Periodic performance reports.

Annual Report 2020/21 / 37
Section Compliance status
Company’s Action
A.6.2 Timely submission of the minutes, agenda and papers required for the Board meeting
√ Board agendas and necessary Board Papers and minutes are dispatched in advance of the Board meetings
A.7 Appointment to the BoardA.7.1 Formal and transparent procedure for Board
appointments√ Board appointments follow a transparent and formal process.
A.7.2 Assessment of the capability of Board to meet strategic demands of the Company
√ The Board as a whole assesses its own composition to ascertain whether the experience and exposure of the Board members are adequate to meet the strategic demands faced by the Company.
Currently, the Board members have varying qualifications in economic, environmental and social topics and are involved in many committees and associations that serve the business community as a whole.
A.7.3 Disclosure of new Board member profile and interests
√ All appointments of new Directors are informed to the shareholders via the Colombo Stock Exchange.
A.8 Re-electionA.8.1/ A.8.2
Re-election at regular intervals and should be subject to election and re-election by shareholders
√ The Directors are subject to re-election on the basis of ‘longest in the office’ as provided in the Articles of Association.
One Director shall retire by rotation on the basis prescribed in the Articles of the Company. A Director who is subject to appointment or a Director retiring by rotation is eligible for election and re-election by a shareholder resolution at the AGM.
A.8.3 In the event of a Director resigns prior to his appointed term, shall give reasons for resignation
Not adopted
A.9 Appraisal of Board performanceA.9.1. The Board should annually appraise itself on
its performance in the discharge of its key responsibilities
√ The Board continued with its annual Board performance appraisal. This is a formalised process of self-appraisal, whereby each member assesses, on an anonymous basis, the performance of the Board
A.9.2. The Board should also undertake an annual self-evaluation of its performance and that of its Committees.
√ Evaluations were carried out under the areas of: Role clarity and effective discharge of responsibilities People mix and structures Systems and procedures Quality of participation Board image
A.9.3. The Board should review the performance of each Director at the time of re-election
Not adopted
Reviews are conducted annually according to the Constitution of the Company.
A.9.4 The Board should state how such performance evaluations have been conducted
√ The performance evaluation is analysed to give the Board an indication of its effectiveness as well as areas that required addressing and/or strengthening. Despite the original anonymity of the remarks, the open and frank discussions that follow, including some Directors identifying themselves as the person making the remark, reflects the keenness of the Board.

38 / BROWN AND COMPANY PLC
CORPORATE GOVERNANCE REPORT
Section Compliance status
Company’s Action
A.10 Disclosure of information in respect of DirectorsA.10.1 Profiles of the Board of Directors
Directors’ interests Board meeting attendance Board Committee memberships
√ Refer Board profiles and Corporate Governance sections
A 11 Appraisal of CEO Not applicable
B. DIRECTORS REMUNERATIONB.1 Remuneration procedureB.1.1 The Board of Directors should set up a
Remuneration Committee√ Refer Corporate Governance Section
B.1.2. Remuneration Committee should consist exclusively of Non–Executive Directors
√ All members of the Remuneration Committee are Non-Executive Directors
B.1.3. The Chairman and members of the Remuneration Committee should be listed in the Annual Report each year
√ Refer Board Committees
B.1.4. Determination of the remuneration of Non-Executive Directors
√ Compensation is determined in reference to fees paid to other NEDs of comparable companies. NEDs receive a fee for devoting time and expertise for the benefit of the Group in their capacity as Directors and additional fees for either chairing or being a member of a Committee.
B.1.5 The Remuneration Committee should consult the Chairman about its proposals relating to the remuneration of other Executive Directors
Not adopted
Remuneration of the Executive Director is governed by the Remuneration Policy of the Group
B.2 The level and make up of remuneration B.2.1/ B.2.2
B.2.3
The Remuneration Committee should provide the packages needed to attract, retain and motivate Executive Directors and designed to promote the long term success of the Company
The Remuneration Committee should judge where to position levels of remuneration of the Company, relative to other companies
√
√
The Remuneration Committee as a whole is aware that the reward structure should be designed to attract and motivate high calibre people in a highly competitive environment.
B.2.4 / B.2.5
Comparison of remuneration with other Companies in the Group
√ Having taken into account the complexities associated with the Group, it was established that the compensation is in line with the market. Benchmarking exercises of this nature will continue to take place in the future at regular intervals.
B.2.6 Executive share options not to be offered at a discount
Not applicable
No share options were given during the year under review.
B.2.7 Remuneration Committee should follow schedule E in designing schemes of performance-related remuneration
Not adopted
The remuneration scheme is in line with the Group policies.
B.2.8/ B.2.9
Compensation for termination of contracts of Directors
Not adopted
The compensation scheme is in line with the Group policies.
B.2.10 Level of remuneration of NEDs √ The fees received by NEDs are determined by the Board and reviewed annually.

Annual Report 2020/21 / 39
Section Compliance status
Company’s Action
B.3 Disclosure of remuneration B.3 Disclosure of remuneration policy and
aggregate remuneration √ Please refer Annual Report of the Directors & the Remuneration
Committee Report
C. RELATIONS WITH SHAREHOLDERSC.1 Constructive use of the Annual General Meeting (AGM) and conduct of General MeetingsC.1.1 The Notice of AGM and related papers to be
sent to shareholders as determined by the Statute, before the meeting.
√ Notice of the AGM and related documents are sent to shareholders along with the Annual Report within the specified period. The contents of this Annual Report will enable existing and prospective stakeholders to make better informed decisions in their dealings with the Company.
C.1.2 Separate resolution to be proposed for each item and the proxy appointment forms to have options to vote for or against each of the item
√ Two-way proxy forms are provided
C.1.3. Counting of proxy votes √ As a matter of practice, proxy votes together with the votes of the shareholders present at the AGM are considered for each resolution.
C.1.4. Heads of Board Committees to be available to answer queries
√ All the NEDs who are the Heads of Board Committees are available at the Meeting to answer queries.
C.1.5 Summary of procedures governing voting at General meetings to be informed
√ Refer Form of Proxy
C.2 Communication with ShareholdersC.2.1 – C.2.7
Effective communication with shareholders √ Refer Shareholder Relations section in the Corporate Governance Section
C.3 Major and Material TransactionsC.3.1
C.3.2
Disclosure of all material facts involving any proposed acquisition, sale or disposition of assets
Compliance with the disclosure requirements and shareholder approval by special resolution as required by the rules and regulations of the SEC/CSE for listed companies
√
√
All material and price sensitive information about the Company is promptly communicated to the Colombo Stock Exchange where the shares of the Company are listed, and released to the employees, press and shareholders.
D. ACCOUNTABILITY AND AUDITD.1. Financial reportingD.1.1. The Board should present an annual report
including financial statements that is true and fair, balanced and understandable and prepared in accordance with the relevant laws and regulations and any deviation being clearly explained.
√ Refer Corporate Governance Section and Statement of Directors’ Responsibility
D.1.2. Disclosure of interim and other price sensitive and statutorily mandated reports to regulators
√ The Audit Committee together with the Board of Directors have taken all reasonable steps to ensure accuracy and timeliness of published information with a view of presenting the true and fair view of the interim and annual financial statements.

40 / BROWN AND COMPANY PLC
CORPORATE GOVERNANCE REPORT
Section Compliance status
Company’s Action
D.1.3 The Board should obtain compliance statements and declarations from the CEO and the CFO before approving the financial statements
√ Declarations are obtained from the Group CFO that in his opinion the financial statements comply with the appropriate accounting standards and give a true and fair view of the financial position and performance of the Company.
D.1.4 Declaration by the Directors that the Company has not engaged in any activities, which contravene laws and regulations, declaration of all material interests in contracts, equitable treatment of shareholders and going concern with supporting assumptions or qualifications as necessary
√ Refer Corporate Governance and Annual Report of the Board of Directors
D.1.5. Statement of Directors’ Responsibility √ Refer Statement of Directors’ ResponsibilityD.1.6. Management Discussion and Analysis √ Refer Management Discussion and Analysis.D.1.7. Remedial action at Extraordinary General
Meeting (EGM) if net assets fall below half of value of shareholders funds
√ In the unlikely event that the net assets of the Company fall below a half of shareholders funds, shareholders would be notified and the requisite resolution would be passed on the proposed way forward.
D.1.8 Disclosure of Related party Transactions √ Refer Notes to the Financial StatementsD.2 Risk Management and Internal ControlD.2.1 Annual review of effectiveness of system of
risk management and internal control and report to shareholders as required
√ The Board has taken the necessary steps to ensure the integrity of the Group’s accounting and financial reporting systems and internal control systems that remain effective via the review and monitoring of such systems on a periodic basis.
D.2.2 Robust assessment of the principal risks faced by the Company
√ Refer Management Discussion & Analysis
D.2.3. Internal Audit Function √ The Internal Audit function of the Company is not outsourced to the External Auditors of the Company to ensure the independence of the External Auditors of the Company. The Auditors’ report on the Financial Statements of the Company for the year under review is found in the financial information section of this Annual Report.
D.2.3/ D.2.4
Maintaining sound system of internal control √ Refer Corporate Governance Report
D.3 Audit CommitteeD.3.1. The Audit Committee should comprise a
minimum of three Non-Executive Directors of whom at least two should be Independent. The Chairman of the Committee should be an Independent Non-Executive Director. At least one member should have recent and relevant experience in financial reporting and control.
√ The Audit Committee comprises two Independent Non-Executive Directors and one Non-Executive Director. The Committee is chaired by an Independent Non-Executive Director who is a member of a professional accounting body.
D.3.2. The Audit Committee to have written terms of reference covering the salient aspects as stipulated in the section
√ The Audit Committee has written terms of reference outlining the Scope.
D.3.3. Duties and responsibilities of the Committee √ The Audit Committee has the overall responsibility for overseeing the preparation of Financial Statements in accordance with the laws and regulations of the country and also recommending to the Board, on the adoption of best accounting policies. The Committee is also responsible for maintaining the relationship with the External Auditors. Refer Audit Committee Report

Annual Report 2020/21 / 41
Section Compliance status
Company’s Action
D.4 Related Party Transactions Review Committee (RPTR Committee) D.4.1 Definition of a Related Party and Related
Party Transactions√ Refer Notes to the Financial Statements
D.4.2 The RPTR Committee should comprise exclusively of Non-Executive Directors with a minimum of three. Majority should be independent. The Chairman of the Committee should be an Independent Non-Executive Director.
√ The Committee comprises of four Non-Executive Directors out of which two are independent. One Independent Non-Executive Director acts as the Chairman of the Committee.
D.4.3. The RPTR Committee to have written terms of reference covering the salient aspects as stipulated in the section
√ The RPTR Committee has written terms of reference outlining the Scope.
D.5. Code of Business Conduct and Ethics √ Business ethics at the Company ensure the business is carried out in an ethical manner.
D.6 Corporate Governance disclosureD.6.1. The Directors should include in the Company’s
Annual Report a Corporate Governance Report√ Refer the Corporate Governance Section
E. INSTITUTIONAL INVESTORSE.1 Shareholder votingE.1.1 A listed Company should conduct a regular
and structured dialogue with shareholders based on a mutual understanding of objectives.
√ The Company has a well-developed investor relations programme to address the information needs of investment institutions and analysts regarding the Company, its strategy, performance and competitive position
E.2 Evaluation of governance disclosuresE.2.1. When evaluating the company’s governance
arrangements, particularly those relating to the Board structure and composition, institutional investors should be encouraged to give due weight to all relevant factors drawn to their attention
√ Institutional investors are informed of any changes to the governance structure.
F. OTHER INVESTORSF.1 Investing/divesting decisionsF.1.1. Individual shareholders, investing directly in
shares of companies should be encouraged to carry out adequate analysis or seek independent advice in investing or divesting decisions
√ The Company maintains an active dialogue with shareholders, potential investors, investment banks, stock brokers and other interested parties. Any concerns raised by a shareholder are addressed promptly and forwarded, when necessary, to the Company Secretaries for consideration and advice.
F.2. Shareholder votingF.2.1 Individual shareholders should be
encouraged to participate in General Meetings of Companies and exercise their voting rights.
√ All steps are taken to facilitate the exercise of shareholder rights at AGMs, including the receipt of notice of the AGM and related documents within the specified period. Shareholders exercise their voting rights for each resolution passed at the AGM.
G. INTERNET OF THINGS AND CYBER SECURITY G.1. – G.5 A review with regard to the cyber
environment to ensure that appropriate data and information governance processes and controls, e-commerce defences, proactive security and strong incident management processes across the business are in place.
√ LOITS, a subsidiary of the Parent Company, LOLC Holdings PLC manages the cyber security of the Company and the Parent Company reviews and monitors the cyber environment of the Group.
H. ENVIRONMENT, SOCIETY AND GOVERNANCEH.1 – H.5. Adherence to the ESG principles √ Refer Management Discussion and Analysis Section

42 / BROWN AND COMPANY PLC
AUDIT COMMITTEE REPORT
The Audit Committee plays a vital role in the strong governance framework in place at Browns by providing independent challenge and oversight to significant matters including external disclosures and the Group’s internal control environment
We are pleased to present the report of the Audit Committee (the Committee) for the year ended 31st March 2021. The report that follows details the role of the Committee, the significant matters considered during the year and how the Committee has carried out its responsibilities.
COMMITTEE MEMBERSHIP, INDEPENDENCE AND EXPERIENCEThe Committee membership is solely comprised of Non-Executive Directors namely:
Mr. Tissa Bandaranayake Independent Non-Executive Director - Chairman
Mr. Janaka De Silva Independent Non-Executive Director - Member
Mrs. Kalsha Amarasinghe Non-Executive Director - Member
Two Committee members have recent and relevant financial experience as required by the Code. The Board is satisfied that majority of the members of the Committee are independent in judgement and have the broad commercial knowledge and competence in the specialist industries and markets in which Browns operates. The Committee members provide a mix of financial and business experience that allows for effective discussion, challenge where appropriate and oversight of critical financial matters, enabling each member to fulfill their responsibilities.
MEETINGS See page 27 for number of meetings and details of attendance during the year.
All Directors of the Board have access to Committee papers and an open invitation to attend Committee meetings. All Directors are particularly encouraged to attend those meetings at which the full-year and quarterly results are considered. Members of Senior Management, including the Chief Operating Officer and Chief Finance Officer of the Group, Chief Manager of the Enterprise Risk Management Division and Head of IT are invited to attend each meeting. During the year under review, the Heads of relevant Business Units and representatives of the External
Auditors attended one or more meetings to facilitate information-sharing and discussion.
Regular discussions are held with the Group Chief Finance Officer to obtain a good understanding of issues affecting the Group and to identify matters which require meaningful discussion at Committee meetings. Private meetings were also held between the members and, either jointly or separately, with the External Auditors and Internal Auditors to discuss any matter they wish to raise or concerns they may have. No member of management was present during these discussions.
REPORTING The Committee members received updates on legal and governance changes on an ongoing and timely basis. The members of the Committee are able to obtain independent legal and professional advice at the Company’s expense. No such advice was obtained during the year under review.
ROLE OF THE COMMITTEEThe principal responsibilities of the Committee are:
Financial reporting: to monitor the integrity of the Company and the Group’s financial statements, review significant financial reporting judgements, issues and estimates, and confirm whether, taken as a whole, the Annual Report and financial statements is fair, balanced and understandable.
Risk management and internal controls: on behalf of the Board, to review and monitor the effectiveness of the Group’s internal financial controls and risk management systems and procedures.
External audit: to assess the effectiveness of the External Audit process, review and monitor the External Auditor’s independence and objectivity, develop and implement a policy on the supply of non-audit services by the External Auditors and make recommendations to the Board about the appointment, re-appointment and removal of the External Auditors and the remuneration and terms of engagement.
Internal audit: to monitor and review the effectiveness of the Internal Audit function and the annual Internal Audit Plan.

Annual Report 2020/21 / 43
The Board of Directors is responsible for preparing the Annual Report and financial statements for the Group, and the Directors’ Responsibility Statement includes an explanation of how the Board has ensured that the Annual Report for the year ended 31st March 2021 is fair, balanced and understandable. The Management Discussion & Analysis Report provides details of the business model and how the Company generates value for stakeholders.
The Committee’s main areas of activity during the year under review are set out below:
FINANCIAL REPORTINGThe Board of Directors of the Company has delegated authority to the Committee to review the Annual and quarterly financial statements. Drafts of these financial statements were reviewed by the Committee, prior to formal consideration and approval by the Board.
FAIR, BALANCED AND UNDERSTANDABLE REPORTINGThe Committee considered whether the overall reporting was consistent with the quarterly financial statements, the industry as a whole and the wider economic environment.
In addition, the Committee assessed whether suitable accounting policies had been adopted by the Group and reviewed papers prepared by the Senior Management on the main financial reporting judgements as well as the External Auditor’s reports on the yearly results.
RISK MANAGEMENT AND INTERNAL CONTROLSThe Board has delegated responsibility for overseeing the effectiveness of the Group’s risk management and internal control systems to the Committee. Internal control and financial risk management systems and procedures include:
Business planning: each Division produces and agrees an annual business plan against which the performance of the business is regularly monitored;
Financial analysis: each Division’s operating profitability and capital expenditure are closely monitored;.
Management incentives are tied to annual and longer-term financial results. These results include explanations of variance between forecast and budgeted performance and are reviewed periodically. Key financial information is regularly reported to the Board;
Group Authority Framework: the framework provides clear guidelines on approval limits for capital and operating expenditure and other key business decisions for all Divisions;
Risk assessment: risk assessment is embedded into the operations of the Group and reports are provided to the Audit Committee and the Board;
Compliance: compliance policies address the wide variety of legislature and other requirements with which the Group has to comply. Regular reports are provided to the Board, and to the Committee.
The Board recognises that risks must be taken to achieve the Group’s business objectives and is responsible for ensuring that a sound system of internal controls is maintained and that regular reviews are undertaken to ensure their effectiveness. This includes consideration of financial, operational and compliance controls, risk management and the Group’s high level internal control arrangements.
The system of internal controls is designed to manage material risks, by addressing their cause and mitigating their potential impact, and can only provide reasonable, rather than absolute, assurance against material misstatement or loss, recognising that expected benefits should not exceed the cost of the control procedures. The Senior Management led by Group Chief Operating Officer, meets regularly to consider and review the Group’s overall operational and financial performance and material risks and mitigating actions, with each Division given operational autonomy within a robust internal control framework.
The Board has adopted a risk management framework to identify, evaluate and manage the Group’s significant risks which is overseen by the Enterprise Risk Management. They provide guidance to the Board and the Committee regarding the Group’s overall risk appetite, tolerance and strategy:
Ensuring that a regular robust assessment of the principal risks facing the Group is undertaken, including those risks that would threaten its business model, future performance, solvency or liquidity;
Reviewing the Group’s overall risk assessment processes, the parameters of the qualitative and quantitative metrics used to review the Group’s risks, and monitoring mitigating actions;
Reviewing the effectiveness of the Group’s internal control and risk management systems, including all material operational and compliance controls;
Reviewing the Group’s instances of fraud, if any, and fraud reporting to the Committee.
During the year under review, the Committee also reviewed the effectiveness of the Group’s response to the COVID-19 pandemic, including the challenges arising from working from home, postponement and cancellation of events, digital transformation, colleague wellbeing and supply chain disruption.
EXTERNAL AUDITORSM/s. PricewaterhouseCoopers (PwC) continues as the Group’s External Auditors. PwC was first appointed in 2018 and re-appointed each year at the AGM. The Committee reviews the re-appointment of the External Auditors annually. The Committee

44 / BROWN AND COMPANY PLC
takes its responsibility for monitoring independence, objectivity and compliance with ethical and regulatory requirements to the Committee. The External Auditors are jointly responsible to the Board and the Committee, with the Committee as the primary contact. The Group policy sets out which categories of non-audit services the External Auditors will and will not be allowed to provide to the Group, within permissible materiality levels.
Details of all fees charged by the External Auditors during the year ended 31st March 2021 are set out in Note 8 to the Consolidated Financial Statements.
The performance of the External Auditors continue to be reviewed annually, in accordance with best practice, to assess the delivery of the External Audit service. The review takes into account the quality of planning, delivery and execution of the audit, the technical competence and strategic knowledge of the audit team and the effectiveness of reporting and communication between the audit team and management.
Having considered the matters detailed above, the Committee recommended to the Board the re-appointment of PwC as the Auditors of the Company for the financial year ending 31st March 2022 subject to the approval of the shareholders, at a remuneration to be agreed by the Board.
Tissa BandaranayakeChairman - Audit Committee
30th August 2021
AUDIT COMMITTEE REPORT

Annual Report 2020/21 / 45
REMUNERATION COMMITTEE REPORTThe onset of COVID-19 has presented a unique series of challenges for all stakeholders and the work of the Committee. This year has focused on managing remuneration decisions in light of the experiences of all stakeholders. That said, nothing should detract from the heroic work of all colleagues in the Group in continuing to smoothly deliver services to our customers in these exceptional circumstances. The Committee has not recommended any changes to structure, but continue to explore ongoing developments to our remuneration model.
In the context of the economic impact resulting from the current pandemic, the Committee is challenged – like many of our counterparts nationally and internationally to strike a balance in its approach to remuneration; taking heed of the impact of the pandemic on business performance and shareholders, while recognising the significant efforts and sacrifices that the Group’s workforce has made during the year and the need to retain and incentivise colleagues going forward. The annual bonus pool is determined based on performance against the Group’s scorecard with targets set at the beginning of the year. During the year under review, a strong outcome was recorded against the scorecard measure despite the environment.
The Committee has taken account of the Code in its approach to the Group’s remuneration practices. The Committee’s approach is to adhere to best practice reporting standards, disclosure and transparency and for consistent treatment of executive remuneration when compared with the treatment of the wider workforce. As the Group navigates the impact of the current pandemic, these guiding principles remain as important as ever.
COMPOSITIONThe Committee comprises of two Independent Non-Executive Directors and one Non-Executive Director. The Human Resources Manager and other senior officers of the Company are invited as and when required, with the Company Secretaries functioning as its Secretary.
The members of the Remuneration Committee are:
Mrs. Kalsha Amarasinghe Chairperson/Non-Executive Director
Tissa Bandaranayake Member/Independent Non - Executive Director
Janaka de Silva Member/Independent Non-Executive Director
HIGHLIGHTS OF THE REMUNERATION POLICY: To attract, motivate and retain high calibre individuals,
while not overpaying;
To provide a satisfactory base salary within a total package comprising salary and performance-related pay;
The level of salary broadly to incentivise delivery of stretching annual goals;
To provide focus on the Company’s key financial objectives;
To provide market competitive cash and non-cash benefits to attract and retain high calibre individuals;
Consistent with market practice, to ensure Browns can recruit and retain key executives, whilst protecting the Company from making payments for failure.
ROLE AND WORK OF REMUNERATION COMMITTEEThe Committee reviews the policies with regard to the remuneration of the Group’s employees and Senior Management. It is also responsible for reviewing policies with regard to performance-related pay schemes, and oversees any major changes in employee benefit structures.
The Committee members have no conflicts of interest arising from cross-directorships and no director is permitted to be involved in any decisions as to his or her own remuneration. The remuneration of Non-Executive Directors is decided by the Board of Parent Company.
The Committee’s objective is to ensure that the remuneration paid to senior executives is appropriate in both amount and structure, is directly linked to the Company’s annual and longer term performance and is aligned with the interests of shareholders. Careful consideration is given to ensuring there is an appropriate balance in the remuneration structure between annual and long term rewards, as well as between cash and other payments. Variable pay is linked to measures which are aligned with the Company’s long term strategy and objectives.
ACTIVITIES FOR THE YEAR UNDER REVIEWThe Remuneration Committee met primarily to review the remuneration policy of the Group. During the period the Committee received input from the Group Head of HR, the Group Chief Operating Officer and the Group Chief Financial Officer.

46 / BROWN AND COMPANY PLC
Redundancy policy especially at the senior Management Level was reviewed in line with cost cutting measures. It was witnessed the performance increased as a result of this exercise. Instead of increments, the Committee considered to re-adjust allowance for the Senior Management as proposed by the HR.
Pay structures and employment conditions for Group employees were driven by market and role comparatives. No pay cuts were noticed across the Group due to the prevailing COVID-19 pandemic situation.
The Committee recommended to the Board to focus on succession planning. Development of subordinates were introduced as a KPI for the top management. Training was focused on this aspect. In-house training sessions were conducted for staff wherever possible.
The Committee was satisfied that the existing Policies, which remains aligned to the business strategy and current best market practice and therefore no material changes were proposed. The Committee will continue to maintain the link between pay and performance and remains committed to doing so in the future.
Kalsha AmarasingheChairperson - Remuneration Committee
30th August 2021
REMUNERATION COMMITTEE REPORT

Annual Report 2020/21 / 47
THE RELATED PARTY TRANSACTIONS REVIEW COMMITTEE REPORTThe Board has established Related Party Transactions Review Committee (RPTR Committee) in order to review the related party transactions of Brown and Company PLC and its subsidiaries.
COMPOSITION The Committee is appointed by the Board and comprises four Non-Executive Directors out of which two are independent. One Independent Non-Executive Director acts as the Chairman of the Committee.
The members are;
Tissa Bandaranayake Chairman/Independent Non-Executive Director
Janaka de Silva Member/Independent Non-Executive Director
Mrs. Kalsha Amarasinghe Member/Non-Executive Director
Kapila Jayawardena Member/Non-Executive Director
The Chief Operating Officer and Chief Financial Officer of the Group attend the meetings by invitation.
The Company Secretaries provide assistance to the members of the Committee, including but not limited to assisting the Committee Chair in planning the work of the Committee, formulating meeting agendas, maintenance of committee minutes, collation and distribution of information required by the Committee and providing practical support, as and when needed.
COMMITTEE MEETINGSThe Committee met four times during the year under review. The minutes of all meetings were properly documented and communicated to the Board of Directors.
See page 28 for details of attendance during the year.
Any member of the Committee who has a potential interest in any Related Party Transaction will disclose his/her interests therein and excuse and abstain from discussions leading to the eventual voting and approval of the Related Party Transaction/s. The RPTR Committee considers all relevant facts and circumstances respecting such transaction/s.
ROLE OF THE COMMITTEEThe RPTR Committee is tasked with reviewing all Related Party Transactions of the Company and ensuring that they comply with the Listing Rules of the Colombo Stock Exchange (CSE). The Committee reviews and pre-approves all proposed non-recurrent Related Party Transactions of the Company. Further, the Committee reviews all recurrent Related Party Transactions on a quarterly basis and annually to ensure compliance with the limits and reporting guidelines specified by the Listing Rules of CSE.
REVIEW OF THE YEAR The Committee reviewed all related party transactions, and
ensured there were neither any non-recurrent transaction nor transactions that require the approval of shareholders of the Company (except for the exempted transactions under Rule 9.5 of the CSE Listing Rules);
Obtained required information from the management, employees or external parties with regard to any transaction entered into with a related party;
After each meeting, the Committee updated the Board on any disclosures that need to be made in Quarterly Financial Statements or the Annual Report, any other market disclosures with regard to any particular related party transaction and any other observations or comments that may require the attention of the Board;
Ensured that no Director of the Company participated in any discussion of a proposed Related Party Transaction for which he or she is a related party, unless such Director was requested to do so by the Committee for the express purpose of providing information concerning the Related Party Transaction to the Committee;
Established guidelines and policies for the management and reporting of related party transactions. The Committee also considered the necessary market disclosures in a timely and detailed manner and disclosures in the Annual Report as required by the applicable rules/regulations;
Assessed the adequacy of related party reporting systems along with the advice of the External Auditors;
Ensured that all reporting requirements of the CSE Listing Rules and other relevant statutes and regulations are met;
The Committee was satisfied that all related party transactions of the entity were transacted on normal commercial terms and were not prejudicial to the interests of the entity and its minority shareholders.
DECLARATIONThe Committee has reviewed all related party transactions during the period and has established that they are in the best interest of the Company and comply with all standards of best practice and reporting. The related party transactions of the Company are given in detail on pages 152 to 160.
Tissa BandaranayakeChairman - Related Party Transactions Review Committee
30th August 2021

48 / BROWN AND COMPANY PLC
BUSINESS OPERATIONS COMMITTEE REPORTThe Committee presently comprises of the Executive Chairman and two Non-Executive Directors namely,
Ishara Nanayakkara Executive Chairman
Kalsha Amarasinghe Non-Executive Director
Kapila Jayawardena Non-Executive Director
The primary responsibility of this Committee is to look at strategic directives and investments for the Group, prior to being ratified by the Board, so as to have a better representation in this process and to expedite decisions.
The Committee meets depending on need and urgency.
The Browns Group is in the process of expanding, which includes not only investments into the existing manufacturing and trading operations but also in areas that are strategic and would complement the core growth strategies of the organization. The Committee also evaluates the pros and cons of such substantial investments and the related opportunity costs of funds, to have a better balance between the growth strategies and stakeholder requirements. In such evaluations the Committee endeavours to strike a balance between the short, medium and long-term investments in order to post continuous and harmonious growth without interruption.
Ishara Nanayakkara Executive Chairman
30th August 2021

FINANCIAL INFORMATIONAnnual Report of the Board of Directors 50Statement of Directors’ Responsibility 55Independent Auditor’s Report 56Statement of Profit or Loss 64Statement of Comprehensive Income 65Statement of Financial Position 66Statement of Changes in Equity - Group 68Statement of Changes in Equity - Company 69Statements of Cash Flows 70Notes to the Financial Statements 72
56
64
72
CONTENTINDEPENDENT AUDITOR’S REPORT
STATEMENT OF PROFIT OR LOSS
NOTES TO THE FINANCIAL STATEMENTS

50 / BROWN AND COMPANY PLC
ANNUAL REPORT OF THE BOARD OF DIRECTORS
The Directors of Brown and Company PLC have pleasure in presenting to members their Report and the Audited Consolidated Financial Statements for the year ended 31st March 2021.
The Financial Statements and the disclosures made herein conform to the requirements of the Companies Act No. 7 of 2007. The Report also includes relevant disclosures required to be made under the Listing Rules of the Colombo Stock Exchange and is guided by the recommended best practices on accounting and corporate governance.
BROWN AND COMPANY PLCBrown and Company PLC is a public limited liability Company incorporated in Sri Lanka on 17th August 1892 under the Joint Stock Companies Ordinance 1861 and the Company was re-registered as required under the provisions of the Companies Act No. 07 of 2007 on 25th July 2007. The Company was listed on the Main Board of the Colombo Stock Exchange on 25th April 1991 and was transferred to Diri Savi Board with effect from 15th October 2018. The Registered Office of the Company is No. 481, T.B. Jayah Mawatha, Colombo 10. The Business Office is situated at No. 34, Sir Mohamed Macan Markar Mawatha, Colombo 3.
VISION, MISSION AND CORPORATE CONDUCT The Vision and Mission statements are given on inner cover of this Annual Report.
The Company conducts its business activities at a high level and maintains ethical standards in achieving its vision and mission. The Board of Directors of the Company as well as its employees have pledged to abide by and comply with the respective Codes of Conduct and Ethics.
PRINCIPAL ACTIVITIESBrowns Group consists of a portfolio of diverse business operations in the commercial market today by continuously expanding in all business segments in line with the core strategy of creating wealth for all stakeholders.
The principal activities of Brown and Company PLC and the review of the Group’s progress and performance during the year with comments on the financial results and prospects are given in the Management Discussion and Analysis section on pages 5 to 17 of this Report.
REVIEW OF BUSINESS AND FUTURE DEVELOPMENTSThe Browns Group will continue to align itself with strategic areas in the national economy, with Sri Lanka well positioned to grow in sectors such as leisure and tourism, construction, agri-business and healthcare, among others. Large construction projects that are in the pipeline offer significant potential for related goods and services marketed by the organization.
GROUP REVENUEThe Revenue of the Group was Rs. 29 Bn as compared with Rs. 20 Bn in the previous year. A detailed analysis of the Group Revenue is given in Note No. 4 of the Financial Statements.
GROSS PROFITThe Group’s Gross Profit for the year was Rs. 7 Bn compared with the Group’s Gross Profit of Rs. 5 Bn for the previous year.
GROUP INVESTMENTSInvestments of the Group and the Company in subsidiaries, associates, joint ventures, long term and short term investments amounted to Rs. 11 Bn (2020 - Rs. 9 Bn) and Rs. 26 Bn (2020 - Rs. 13 Bn) respectively. A detailed description of the subsidiaries, associates, joint ventures, long term and short term investments are fully described in Notes 17 to 19 and Note 26 respectively.
PROPERTY, PLANT AND EQUIPMENTInformation relating to the movement in Property, Plant and Equipment is given in Note 11 of this Financial Statements.
MARKET VALUE OF PROPERTIESRevaluations are made with sufficient regularity for land and buildings owned by the Group and the Company by independent professional valuers. A detailed description is given in Notes 11 to 13 to the Financial Statements.
STATED CAPITAL The Stated Capital of the Company as at the date of this Report is Rs. 9 Bn which consists of 212,625,000 ordinary shares (2020 - Rs. 9 Bn consisting of 212,625,000 ordinary shares).
RESERVESThe total Group Reserves as at 31st March 2021 amounts to Rs. 38 Bn as compared with Rs. 21 Bn in the previous year.
SEGMENT REPORTINGSegment wise contribution to the Group revenue, results, assets and liabilities is provided in Note 46 to the Financial Statements.
TAXATIONIncome tax expense for the Group is Rs. 561 Mn compared to Rs. 544 Mn in the previous year. Income tax expense for the Company is Rs. 311 Mn compared to Income Tax Charge of Rs. 214 Mn in the previous year. Taxation has been provided at the appropriate rates indicated in Note No 9 of the Financial Statements.

Annual Report 2020/21 / 51
SHARE HOLDINGS / SHARE INFORMATIONThe market value of an ordinary share of the Company as at 31st March 2021 was Rs. 155.25 (31st March 2020 - Rs. 42.00). The number of shareholders as at 31st March 2021 was 3,047 (31st March 2020 – 2,529). An analysis of shareholders based on shares held, the distribution of ownership and market values for the last five years are provided on pages 178 to 179.
The information in respect of earnings, dividends, net assets per share is given on page 2.
SHAREHOLDERSIt is the Group’s policy to treat its shareholders equitably and maximize shareholder wealth. Quarterly returns of financial results with any developments or changes are hosted on the CSE website.
EVENTS OCCURRING AFTER THE BALANCE SHEET DATEEvents Occurring after the Balance Sheet Date are disclosed in Note No 45 to the Financial Statements.
EMPLOYMENT POLICIESThe Group employment policies respect the individuals and offer equal career opportunities, regardless of sex, race or religion and consider the relationship with the employees to be good. The number of persons employed in Brown and Company PLC as at 31st March 2021 was 508 (31st March 2020 was 501).
The Company promotes a culture of teamwork, integrity and dedication and remuneration is linked to performance by annual appraisals of both qualitative and quantitative performance of all employees.
CUSTOMERSThe Group firmly believes in investing time and effort in discovering exactly what the customer wants and then giving it to them at the best price and building relationship and loyalty by supplying the demand in the best manner possible every single time. In other words, we believe in selling customer excellence. In addition the Company also carries out customer awareness programmes and customer service campaigns. The Company deals with both corporate and retail customers.
SUPPLIER POLICYThe Group places great emphasis on the importance of suppliers to the Group and building loyalty and ensure payments promptly. Further a clear communication terms of payment as part of commercial agreements is being maintained.
STATUTORY PAYMENTS The Directors confirm that to the best of their knowledge, all taxes, duties and levies payable by the Company and its Group Companies, all contributions, levies and taxes payable on behalf of, and in respect of the employees of the Company and its Group Companies and all other known statutory dues as were due and payable by the Company and Group Companies as at the Statement of Financial Position date have been paid or, where relevant provided for.
ENVIRONMENTAL PROTECTIONIt is the Group policy to keep the adverse effect on the environment to a minimum and to promote co-operation and compliance with the relevant authorities and regulations.
CORPORATE GOVERNANCE & INTERNAL CONTROL The information called for by this item with respect to the practice followed by the Group is set out in the Corporate Governance Report on pages 18 to 41.
GOING CONCERNAs in the Statement of Directors’ Responsibility given on page 55 the Directors are satisfied that the Company, its subsidiaries and associates have adequate resources to continue in operational existence for the foreseeable future to justify in adopting the going concern basis in preparing the Financial Statements.
PROFIT AND APPROPRIATIONS
Group 2021 2020
Rs.000 Rs.000
Retained profit brought forward 16,520,105 12,753,386
Impact of SLFRS 16 - 3,177
Profit /(Loss) for the year (16,046) 3,620,315
Total Other Comprehensive Income 12,913 112,647
Change in Group Holding 3,450,884 3,700
Forfeited Dividend 17,600 26,880
Retained profit Carried forward 19,985,456 16,520,105

52 / BROWN AND COMPANY PLC
Company 2021 2020
Rs.000 Rs.000
Retained profit brought forward 16,241,239 15,237,414
Profit for the year 1,760,968 982,759
Total Other Comprehensive Income (7,471) (5,814)
Forfeited Dividend 16,588 26,880
Retained profit Carried forward 18,011,324 16,241,239
DIRECTORATEThe Directors of the Company during the year under review were as follows:
Ishara Nanayakkara Executive Chairman
Kapila Jayawardena Non-Executive Director
Kalsha Amarasinghe Non-Executive Director
Danesh AbeyrathneExecutive Director
Janaka de SilvaIndependent Non-Executive Director
Tissa BandaranayakeIndependent Non-Executive Director
Ms. D. E. AmarasingheWas appointed as the Alternate Director to Mrs. K. U. Amarasinghe with effect from 12th May 2020.
APPOINTMENT OF EXECUTIVE DIRECTOR Mr. Danesh Abeyrathne, former Chief Operating Officer of Browns Group was appointed as an Executive Director of Brown and Company PLC with effective from 18th November 2020. Due announcement was made to the Colombo Stock Exchange in this regard.
DIRECTORS’ MEETINGSThe Directors conduct Board Meetings at least once in a Quarter and as and when necessary. Board decisions are resolved by resolutions at meetings, by circulation and also through circular Board papers which are approved and signed by all the Directors and tabled at the Board Meetings. The Minutes of the Board Meetings, the Agenda for the next meeting and the monthly Management Reports are circulated to all the Directors in advance of the meetings.
The schedules of Directors’ attendance at Board Meetings and at the Board Committee Meetings are appended in the Corporate Governance Report on pages 18 to 41.
RE-ELECTION OF DIRECTORSIn accordance with Article No. 24(6) of the Articles of Association of the Company Mr. Ishara Nanayakkara, Executive Chairman retires by rotation and being eligible offers himself for re-election.
In accordance with Article No. 24(2) of the Articles of Association of the Company Mr. Danesh Abeyrathne be elected as an Executive Director with the approval of the shareholders at the forthcoming Annual General Meeting.
Directors hereby recommend that Mr. Janaka de Silva and Mr. Tissa Bandaranayake, who vacate office in terms of Section 210 (2) (b) of the Companies Act, be re-appointed as the Independent Non-Executive Directors of the Company, in terms of Section 211 of the Companies Act No. 7 of 2007 for a period of one year or until the conclusion of the next Annual General Meeting whichever occurs first and it is hereby declared that the age limit of 70 years referred to in Section 210 of the Companies Act No. 7 of 2007 shall not apply to the said Directors.
BOARD COMMITTEES The Board has established committees for better monitoring and guidance of different aspects of operations and control.
Audit Committee Tissa BandaranayakeChairman/Independent Non-Executive Director
Janaka de Silva Member/Independent Non-Executive Director
Kalsha Amarasinghe Member/Non-Executive Director
The report of the Audit Committee is given on pages 42 to 44.
Remuneration CommitteeKalsha Amarasinghe Chairperson/Non-Executive Director
Tissa BandaranayakeMember/Independent Non-Executive Director
Janaka de SilvaMember/Independent Non-Executive Director
The report of the Remuneration Committee is given on page 45 to 46.
Related Party Transactions Review CommitteeTissa Bandaranayake Chairman/Independent Non-Executive Director
Janaka De Silva Member/Independent Non-Executive Director
Kapila JayawardenaMember/Non-Executive Director
Kalsha Amarasinghe Member/Non-Executive Director
ANNUAL REPORT OF THE BOARD OF DIRECTORS

Annual Report 2020/21 / 53
The report of the Related Party Transactions Review Committee is given on page 47.
The Related Party Transactions of the Company during the Financial Year have been reviewed by the RPTR Committee and are in compliance with Section 9 of the Listing Rules to the CSE.
Business Operations Committee Ishara Nanayakkara Executive Chairman
Kalsha Amarasinghe Non-Executive Director
Kapila Jayawardena Non-Executive Director
The report of the Business Operations Committee is given on page 48.
Group Management CommitteeIshara NanayakkaraExecutive Chairman
The Members of the Senior Management
INTEREST REGISTER The Directors have made the declarations required by the Companies Act No. 7 of 2007. These have been entered into the Interest Register which is maintained by the Company.
The Company carried out transactions in the ordinary course of business with entities in which a Director of the Company is a Director. The transactions with entities where a Director of the Company either has control or exercises significant influence have been classified as related party transactions and disclosed in Note No 41 to the Financial Statements.
RELATED PARTY TRANSACTIONSIn terms of Section 9 of the Listing Rules of the CSE, there were no any related party transactions that required shareholder approval or non-recurrent related party transactions that required immediate market disclosures during the year under review except those which were duly disclosed by way of market announcements via CSE website.
The Directors declare that the Company has complied with Section 9 of the Listing Rules of the CSE.
DIRECTORS’ SHAREHOLDINGSThe Directors’ interests in shares as at 31st March 2021 and 31st March 2020 were as follows:-
As at 31st March 2021
As at 31st
March 2020
Ishara Nanayakkara 299,700 299,700
Kapila Jayawardena Nil Nil
Kalsha Amarasinghe Nil Nil
Janaka de Silva Nil Nil
Tissa Bandaranayake Nil Nil
Danesh Abeyrathne Nil Nil
REMUNERATION OF DIRECTORSThe Directors’ emoluments are disclosed in Note No 8 to the Financial Statements.
LIST OF MAJOR SHAREHOLDERSThe list of 20 major shareholders and the percentage held by each as at 31st March 2021 is given on page 179 of the Financial Statements.
PARENT, SUBSIDIARY AND ASSOCIATE COMPANIES AND ITS DIRECTORSThe Directors of parent, subsidiary and associate companies as at date are given on pages 180 to 184 of this Annual Report.
AUDITORS’ REPORTThe Auditors of the Company Messrs PricewaterhouseCoopers, Chartered Accountants have carried out the audit of the Consolidated Financial Statements for the financial year ended 31st March 2021 and their Report on the Financial Statements appear on pages 56 to 63 of this Annual Report.
ACCOUNTING POLICIESThe accounting policies adopted in the preparation of the Financial Statements are given on pages 72 to 93.
COMPANY SECRETARIESL O L C Corporate Services (Private) Limited serves as the Company Secretaries of the Company.
ANNUAL REPORTThe Board of Directors approved the Consolidated Financial Statements on 30th August 2021. The appropriate number of copies of this report will be submitted to the Colombo Stock Exchange and to the Sri Lanka Accounting and Auditing Standards Monitoring Board on or before 31st August 2021.

54 / BROWN AND COMPANY PLC
ANNUAL GENERAL MEETINGThe 129th Annual General Meeting of the Company will be held on Thursday, 23rd September 2021 at 12.30 p.m. as an on-line audio-visual meeting with arrangements for the online meeting platform made at LOLC Holdings PLC, No.100/1, Sri Jayawardenapura Mawatha, Rajagiriya. The Notice of the Annual General Meeting is given on page 186.
AUDITORSIn accordance with Section 154 (1) of the Companies Act No. 7 of 2007 a resolution proposing the re-appointment of Messrs. PricewaterhouseCoopers, Chartered Accountants as the Auditors of the Company for the ensuing year will be proposed at the Annual General Meeting.
In terms of Section 155 (a) of the Companies Act No. 7 of 2007 a resolution authorizing the Directors to fix the remuneration of the Auditors Messrs. PricewaterhouseCoopers, Chartered Accountants for the ensuing year will be proposed at the Annual General Meeting.
The fees paid to the Auditors are disclosed in Note 8 to the financial statements.
As far as the Directors are aware, the Auditors do not have any relationship (other than that of an Auditor) with the Company or any of its subsidiaries other than those disclosed above. The Auditors also do not have any interest in the Company or any of its Group Companies.
For and on behalf of the Board
Ishara Nanayakkara Executive Chairman
Kapila JayawardenaDirector
SecretariesL O L C Corporate Services (Private) Limited
Colombo30th August 2021
ANNUAL REPORT OF THE BOARD OF DIRECTORS

Annual Report 2020/21 / 55
STATEMENT OF DIRECTORS’ RESPONSIBILITY
The responsibility of the Directors in relation to the Financial Statements for the year ended 31st March 2021 which have been prepared and presented in conformity with the requirements of the Sri Lanka Accounting Standards, the Listing Rules of the Colombo Stock Exchange and the Companies Act No.7 of 2007, is set out in the following statement.
The responsibility of the Auditors in relation to the Financial Statements is set out in the Report of the Auditors on pages 56 to 63 of the Report. As per the provisions of the Companies Act No. 7 of 2007, the Directors are required to prepare Financial Statements, for each financial year and place before a General Meeting which comprise of:
1) An Income Statement, which presents a true and fair view of the profit and loss of the Company and its subsidiaries for the financial year;
2) A Statement of Financial Position, which presents a true and fair view of the state of affairs of the Company and its subsidiaries as at the end of the financial year;
3) A Statement of Changes in Equity which presents a true and fair view of the changes in the Company’s and its Subsidiaries retained earnings for the financial year;
4) A Statement of Cash Flow which presents a true and fair view of the flow of cash in and out of the business for the financial year and which comply with the requirements of the Act.
The Directors are of the view that, in preparing these Financial Statements:
The appropriate accounting policies have been selected and applied in a consistent manner. Material deviations, if any have been disclosed and explained;
All applicable Accounting Standards, as relevant, have been followed.
Judgements and estimates have been made which are reasonable and prudent.
The Directors are also of the view that the Company has adequate resources to continue in operation and have applied the going concern basis in preparing these Financial Statements.
Further, the Directors have a responsibility to ensure that the Company maintains sufficient accounting records to disclose, with reasonable accuracy the financial position of the Company and of the Group, also to reflect the transparency of transactions and to ensure that the Financial Statements presented comply with the requirements of the Companies Act.
The Directors are also responsible for taking reasonable steps to safeguard the Assets of the Company and that of the Group and in this regard to give proper consideration to the establishment of appropriate internal control systems with a view to preventing and detecting fraud and other irregularities.
The Directors are required to prepare the Financial Statements and to provide the Auditors with every opportunity to take whatever steps and undertake whatever inspections they may consider to be appropriate to enable them to give their Audit Opinion.
The Directors are of the view that they have discharged their responsibilities as set out in this statement.
COMPLIANCE REPORTThe Directors confirm that to the best of their knowledge, all taxes, duties and levies payable by the Company and its subsidiaries, all contributions levies and taxes payable on behalf of and in respect of the employees of the Company and its subsidiaries, and all other known statutory dues as were due and payable by the Company and its subsidiaries as at the Balance Sheet date have been paid or, where relevant provided for.
The Board of Directors confirms that the Company, based on the information available, satisfies the Solvency test as and when required according to the Section 56(2) of the Companies Act No 07 of 2007.
By order of the Board
Ishara NanayakkaraExecutive Chairman
30th August 2021

56 / BROWN AND COMPANY PLC
INDEPENDENT AUDITOR’S REPORT
To the Shareholders of Brown and Company PLC
REPORT ON THE AUDIT OF THE FINANCIAL STATEMENTS Our opinion In our opinion, the financial statements of Brown and Company PLC (“the Company”) and the consolidated financial statements of the Company and its subsidiaries (“the Group”) give a true and fair view of the financial position of the Company and the Group as at 31 March 2021, and of their financial performance and cash flows for the year then ended in accordance with Sri Lanka Accounting Standards.
What we have auditedThe financial statements of the Company and the consolidated financial statements of the Group, which comprise: the statement of financial position as at 31 March 2021;
the statement of profit or loss for the year then ended;
the statement of comprehensive income for the year then ended;
the statement of changes in equity for the year then ended;
the statement of cash flows for the year then ended; and
the notes to the financial statements, which include a summary of significant accounting policies.
Basis for opinion We conducted our audit in accordance with Sri Lanka Auditing Standards (SLAuSs). Our responsibilities under those standards are further described in the Auditor’s Responsibilities for the Audit of the Financial Statements section of our report.
We believe that the audit evidence we have obtained is sufficient and appropriate to provide a basis for our opinion.
IndependenceWe are independent of the Group in accordance with the Code of Ethics issued by CA Sri Lanka (Code of Ethics), and we have fulfilled our other ethical responsibilities in accordance with the Code of Ethics.
Key audit matters Key audit matters are those matters that, in our professional judgment, were of most significance in our audit of the financial statements of the current period. These matters were addressed in the context of our audit of the financial statements as a whole, and in forming our opinion thereon, and we do not provide a separate opinion on these matters.

Annual Report 2020/21 / 57
The Company:
Key audit matter How our audit addressed the Key audit matter
Recoverability of investments in subsidiaries See notes 3.2.1, 3.13 and 17 of the consolidated financial statements for disclosures of related accounting policies, judgments, estimates and balances.
The carrying value of the investments in subsidiaries amounting to Rs. 23,359 Mn as at 31 March 2021, is significant to the Company’s total assets.
In determining the recoverability of the investments in subsidiaries management has also considered the impact of the COVID-19 virus on the operational cash flows of the subsidiaries and performed sensitivity analysis over their cash flow forecasts.
During the year ended 31 March 2021, the Company has recognised Rs. 14 Mn as an additional provision for impairment of investments in subsidiaries.
We focused on this matter because of the: Value of the investments in subsidiaries in the statement of
financial position is significant; and
Inherently subjective nature of estimating the recoverable amounts due to the use of estimates and judgments in the valuation methodology.
Our audit procedures included the following: Obtaining an understanding of the process by which
management evaluates the recoverability of investments in subsidiaries;
Evaluating management’s assessment in determining whether there are any indicators that the carrying amount of investments in subsidiaries may not be recoverable;
Where impairment indicators were noted by management, satisfying ourselves that the final impairment calculations, including the final assumptions used, were approved by senior management;
Checking the appropriateness of the selection of the impairment testing technique;
Obtaining management’s impairment calculations and testing the reasonableness of the key assumptions as detailed below, in respect of the discounted cash flow model used: Agreeing the forecasted information to management
approved budgets and business plans;
Testing the reliability of management’s projections, by comparing actual results for 2020/ 2021 to the forecasts prepared for 2020/ 2021 in the previous year;
Checking the reasonability of the calculation of the discount rate including agreeing inputs used in the calculation to external data, where available;
Checking the mathematical accuracy of the discounted cash flow model; and
Re-performing the sensitivity analysis performed by management by stress-testing the discount rate and terminal growth rate.
Based on the work performed, we found the estimation of recoverable amounts of investment in subsidiaries by management was based upon reasonable assumptions and appropriate methodology.

58 / BROWN AND COMPANY PLC
INDEPENDENT AUDITOR’S REPORT
The Group and the Company:
Key audit matter How our audit addressed the Key audit matter
Revaluation of freehold land, buildings and reclaimed land See notes 3.8.1 and 11 of the consolidated financial statements for disclosures of related accounting policies, judgments, estimates and balances.
As at 31 March 2021, carrying value of freehold land, buildings and reclaimed land classified as property, plant and equipment of the Company and Group amounted to Rs. 2,310 Mn and Rs. 41,500 Mn respectively.
During the year, the Group capitalised the reclaimed land and adopted the revaluation model in line with the accounting policy adopted for its freehold land and buildings. Accordingly, the Group revalue its freehold land, buildings and reclaimed land, which are measured at their fair value with sufficient regularity, to ensure that the carrying amounts do not materially differ from that which would be determined using fair values at the reporting date. The Group engaged independent valuation experts to measure the value of freehold land, buildings and reclaimed land.
During the year ended 31 March 2021, the Company reported a gain on revaluation of freehold land and buildings of Rs. 678 Mn and the Group reported a gain on revaluation of freehold land, buildings and reclaimed land of Rs. 13,476 Mn.
Freehold land, buildings and reclaimed land are valued at their fair values at reporting date using the market value approach for freehold and reclaimed land and the replacement cost approach for buildings. The fair values of freehold land, buildings and reclaimed land are dependent on the valuation methodology adopted and the inputs into the valuation model. Factors such as prevailing market conditions, the individual nature, condition and location of each property (freehold and reclaimed land and buildings) and recent comparable transactions for each category of property at different locations directly impact fair values.
We focused on this matter because of the: Relative size of the freehold land, building and reclaimed land
balances in the Company’s and consolidated statement of financial position;
Quantum of revaluation gains recognized by the Company and Group, that directly impact the Company’s and consolidated statement of other comprehensive income; and
Inherently subjective nature of freehold land, buildings and reclaimed land valuations due to use of estimates and judgment in the valuation methodology.
Our audit approach mainly included substantive audit procedures as follows: Obtaining the latest independent property market rates for
freehold land, buildings and reclaimed land to understand the prevailing market for comparable properties in similar conditions and locations;
Comparing historical valuations in relation to freehold land and buildings against current year valuations, and noted that the movements appear to be in line with overall movement in the market;
Meeting with management’s external valuation experts, who performed the freehold land, buildings and reclaimed land valuations for the Group, to discuss the appropriateness of the methodologies adopted and reasonability of assumptions used in the valuations;
Assessing the qualifications and experience of the valuation experts of the Group;
Verifying the completeness and accuracy of the information provided to the valuation experts of the Group;
Comparing samples of recent transactions of freehold land and reclaimed land listed by the valuation experts with other similar sales transaction information available in the market and sales listings;
Comparing estimated price per perch of freehold and reclaimed land and cost per square foot of building by location to a reasonable range determined based on benchmark market data. Where the prices/costs fell outside of the anticipated ranges, we discussed with the management the reasons to support the variances. The variances related to the relative age of building or size/location of both freehold and reclaimed land and buildings. In the context of the specific properties identified, the reasons for variances were appropriate;
Inspecting the final valuation reports and agreeing the fair values to the Group’s accounting records and financial statements;
Discussing with and obtaining information from the valuation experts of the Group to understand the extent to which the impact of COVID-19 pandemic had been considered in their valuations; and
Checking the adequacy and appropriateness of management’s disclosures in the financial statements.
Based on the work performed, we found the valuation of freehold land, buildings and reclaimed land by management to be based upon reasonable assumptions and appropriate methodology.

Annual Report 2020/21 / 59
Key audit matter How our audit addressed the Key audit matter
Valuation of investment property See notes 3.10 and 13 of the consolidated financial statements for disclosures of related accounting policies, judgments, estimates and balances.
As at 31 March 2021, the carrying value of the land and buildings, classified as investment properties of the Company and Group amounted to Rs. 12,535 Mn and Rs. 23,897 Mn respectively.
The Group determines the fair value of its investment property portfolio in accordance with the Group’s valuation policy. This policy requires all investment properties to be valued by an independent valuation expert at least, annually.
During the year ended 31 March 2021, the Company and the Group reported gains on changes in fair values of investment property of Rs. 454 Mn and Rs. 707 Mn respectively.
The fair values of investment properties are dependent on the valuation methodology adopted by the valuation expert and the inputs into the valuation model. Factors such as prevailing market conditions, the nature, condition and location of each individual property and the expected future income from each property directly impact fair values.
We focused on this matter because the: Investment property balances in the Company’s and
consolidated statement of financial position are significant;
Quantum of fair value gains reported in the Company’s and consolidated financial statements; and
Inherently subjective nature of investment property valuations due to the use of estimates and judgments in the valuation methodology.
Our audit approach mainly included substantive audit procedures as follows: Through discussions with management, obtaining an
understanding of the specific characteristics of selected individual properties including, amongst other things, any properties acquired during the year and change, if any, in the use of the respective properties;
Meeting with management’s external valuation expert, who performed the investment property valuations for the Group, to discuss the appropriateness of the methodologies adopted and reasonability of assumptions used in the valuations;
Assessing the qualifications and experience of the valuation expert of the Group;
Verifying the completeness and accuracy of the information provided to the valuation expert of the Group;
Comparing a sample of the recent transactions used by the valuation expert to ascertain the valuation of the Group’s properties with other publicly available sales transactions and sales listings;
Inspecting the final valuation reports and agreeing the fair values to the Group’s accounting records and financial statements;
Discussing with and obtaining information from the valuation expert of the Group to understand the extent to which the impact of COVID -19 pandemic on the leisure sector and economy at macro level had been considered in his valuations; and
Reviewing the adequacy and appropriateness of management’s disclosures in the financial statements.
Based on the work performed, we found the valuation of investment property of the Group by management was based upon reasonable assumptions and appropriate methodology.

60 / BROWN AND COMPANY PLC
INDEPENDENT AUDITOR’S REPORT
The Group:
Key audit matter How our audit addressed the Key audit matter
Valuation of right-of-use assets relating to leasehold land See notes 3.11 and 12 of the consolidated financial statements for disclosures of related accounting policies, judgments, estimates and balances.
During the year, the Group changed its accounting policy for measurement of right-of-use assets relating to leasehold land from ‘cost model’ to ‘revaluation model’.
As at 31 March 2021, the carrying value of right-of-use assets relating to leasehold land of the Group amounted to Rs. 18,924 Mn.
The Group revalue its right-of-use assets relating to leasehold land which are measured at their fair value to ensure that the carrying amounts do not materially differ from that which would be determined using fair values at the reporting date. The Group engaged an independent valuation expert to measure the value of right-of-use assets relating to leasehold land.
During the year ended 31 March 2021, the Group reported a gain on revaluation of right-of-use assets relating to leasehold land of Rs. 11,778 Mn.
Right-of-use assets relating to leasehold land are valued at fair value at reporting date using the market value approach for land. The fair values of right-of-use assets relating to leasehold land are dependent on the valuation methodology adopted and the inputs into the valuation model. Factors such as prevailing market conditions, the individual nature, condition and location of each right-of-use assets relating to leasehold land and recent comparable transactions for such land directly impact fair values.
We focused on this matter because of the: Size of the right-of-use assets relating to leasehold land
balance in the consolidated statement of financial position;
Quantum of revaluation gain that directly impact the consolidated statement of other comprehensive income; and
Inherently subjective nature of right-of-use assets relating to leasehold land valuations due to use of estimates and judgment in the valuation methodology.
Our audit approach mainly included substantive audit procedures as follows: Assessing the qualifications and experience of the valuation
experts of the Group; Verifying the completeness and accuracy of the information
provided to the valuation experts of the Group; Obtaining the latest independent property market rates for
both freehold and leasehold land to understand the prevailing market for comparable properties in similar conditions and locations;
Meeting with management’s external valuation expert, who performed the valuations for right-of-use assets relating to leasehold land valuations for the Group, to discuss the appropriateness of the methodology adopted and reasonability of assumptions used in the valuations;
Comparing estimated price per perch of freehold land and leasehold land by location to a reasonable range determined based on benchmark market data. Where the prices fell outside of the anticipated ranges, we discussed with the management the reasons to support the variances. The variances mainly related to the different location of land. In the context of the specific properties identified, the reasons for variances were appropriate;
Inspecting the final valuation reports and agreeing the fair values to the Group’s accounting records and financial statements;
Discussing with and obtaining information from the external valuation expert of the Group to understand the extent to which the impact of COVID-19 pandemic had been considered in his valuations;
Checking the work performed by the component auditors in relation to valuation of right-of-use assets relating to leasehold land in the respective component financial statements; and
Checking the adequacy and appropriateness of management’s disclosures in the financial statements.
Based on the work performed, we found the valuation of the right-of-use assets relating to leasehold land by management was based upon reasonable assumptions and appropriate methodology.

Annual Report 2020/21 / 61
Key audit matter How our audit addressed the Key audit matter
Impairment assessment on the Group’s goodwillSee notes 3.12.1 and 14.1 of the consolidated financial statements for disclosures of related accounting policies, judgments, estimates and movement in balance.
As at 31 March 2021, the Group has goodwill aggregating to Rs. 1,473 Mn in the consolidated financial statements. As required by Sri Lanka Accounting Standard LKAS 36 Impairment of Assets, management performed an impairment assessment over the goodwill balance by calculating the recoverable amount for each Cash Generating Unit (“CGU”) in respect of which goodwill had been recognised in the financial statements.
Management used the discounted cash flow model (“DCF”) to determine the recoverable amounts of each CGU, where necessary. In preparing the discounted cash flows, management also considered the impact of the COVID-19 pandemic on each CGUs’ operational cash flows.
We identified the impairment assessment on the Group’s goodwill as a key audit matter because of the following: the value of the Group’s goodwill is significant; and the use of the discounted cash flow model in determining the
recoverable amounts of each CGU involves a number of key assumptions and estimates in relation to projections on earnings based on future economic and market conditions and cash flow forecasts, which require significant management judgment.
Our audit procedures included the following: Obtaining an understanding of the process by which
management assesses the impairment of the Group’s goodwill;
Satisfying ourselves that the final impairment calculations, including the final assumptions used, were approved by senior management;
Checking the appropriateness of the selection of the impairment testing technique and checking its mathematical accuracy;
Obtaining management’s impairment calculations and testing the reasonableness of the key assumptions as detailed below, in respect of the discounted cash flow model used:
Agreeing the forecasted information to management approved budgets and business plans;
Assessing the reliability of management’s projected future cash flows, operating margins and working capital requirements, by comparing actual results for 2020/ 2021 to the forecasts prepared for 2020/ 2021 in the previous year;
Checking the accuracy of the calculation of the discount rate including agreeing inputs used in the calculation to external data, where available; and
Re-performing the sensitivity analysis performed by management by stress-testing the discount rate, guest occupancy, where applicable, and terminal growth rate.
Based on the work performed, we found that the impairment assessment on the Group’s goodwill by management was based upon appropriate methodologies and reasonable assumptions.
Valuation of consumable biological assetsSee notes 3.14.2 and 16.1 of the consolidated financial statements for disclosures of related accounting policies, judgments, estimates and movements in the balance.
The Group recorded consumable biological assets amounting to Rs. 4,007 Mn in the consolidated financial statements as at 31 March 2021 and recognised gains on change in fair values of such biological assets of Rs.560 Mn for the year then ended.
Consumable biological assets include managed timber trees that are to be harvested as agricultural produce or sold as biological assets and are stated at fair value less estimated point-of-sale cost at harvest. Management engaged an independent external valuation expert to assist them in determining the fair value of the consumable biological assets.
We focused on the valuation of biological assets since it requires significant levels of judgment and technical expertise in selecting appropriate valuation models and assumptions. Further, changes in key assumptions such as discount rate, value of timber per cubic meter and available timber quantity, used for the estimation may have a material impact on the carrying value of biological assets recognised in the consolidated statement of financial position and the quantum of gain recognised in the consolidated statement of profit or loss.
Our audit procedures included the following: Assessing the competence and independence of the external
valuation expert engaged by the Group;
Meeting with management and the valuation expert to understand the valuation models and assumptions used in the valuation;
Verifying the completeness and accuracy of the information provided to the external valuation expert;
Comparing historical valuations against current year valuations and checking whether the changes in pricing were in line with the overall movement in the market and the actual sales during the year;
Checking the reasonability of the cubic meter quantity and growth considered for the valuation, by selecting a sample, and comparing to the historical timber content and growth; and
Obtaining the valuation calculation and testing the mathematical accuracy.
We found the consumable biological assets valuation made by management with assistance from an external valuation expert to be based upon reasonable assumptions and appropriate methodology.

62 / BROWN AND COMPANY PLC
Key audit matter How our audit addressed the Key audit matter
Valuation of unquoted equity securities See notes 3.15.1 and 19.2 of the consolidated financial statements for disclosures of related accounting policies, judgments, estimates and carrying value.
As at 31 March 2021, the Group’s investment in unquoted equity securities amounted to Rs. 1,083 Mn.
The Group measures these investments at fair value through other comprehensive income.
During the year ended 31 March 2021, the Group reported gains on changes in fair values of unquoted equity securities of Rs. 292 Mn.
The measurement of unquoted equity securities at fair value involves significant judgment over the valuation technique to be applied. The key judgments made in determining the inputs for valuation include: Recent share transactions of the relevant unquoted equity
securities that can be considered as reference points for valuation; and
Adjusted net assets per share in relation to the unquoted equity securities, where there were no recent share transactions to estimate the fair values.
We focused on this matter because of the: Relative size of the investment in unquoted equity securities in
the consolidated statement of financial position;
Quantum of fair value gains recognised in the financial statements; and
Inherently subjective nature of valuation due to the use of estimates and judgment.
Our audit procedures included the following: Obtaining an understanding of the process by which fair value
calculations are performed;
Checking whether the fair value calculations, including judgments made, were approved by senior management;
Testing the reasonableness of the significant judgments made in determining the inputs for valuation as detailed below: Corroborating information on recent share transactions
used in the valuation with independent sources; and
For investments, where there were no recent share transactions, assessment of the fair value through adjusted financial statements were verified including assumptions used in determining the adjusted net assets per share.
Based on the work performed, we found that the estimation of the fair value of unquoted equity securities by management to be based upon appropriate valuation techniques and reasonable assumptions.
INDEPENDENT AUDITOR’S REPORT
Other information Management is responsible for the other information. The other information comprises the Brown and Company PLC Annual Report 2020/2021 (but does not include the financial statements and our auditor’s report thereon).
Our opinion on the financial statements does not cover the other information and we do not and will not express any form of assurance conclusion thereon.
In connection with our audit of the financial statements, our responsibility is to read the other information identified above and, in doing so, consider whether the other information is materially inconsistent with the financial statements or our knowledge obtained in the audit, or otherwise appears to be materially misstated.
If, based on the work we have performed on the other information that we obtained prior to the date of this auditor’s report, we conclude that there is a material misstatement of this
other information, we are required to report that fact. We have nothing to report in this regard.
Responsibilities of management and those charged with governance for the financial statementsManagement is responsible for the preparation of financial statements that give a true and fair view in accordance with Sri Lanka Accounting Standards and for such internal control as management determines is necessary to enable the preparation of financial statements that are free from material misstatement, whether due to fraud or error.
In preparing the separate/ consolidated financial statements, management is responsible for assessing the Company’s/ Group’s ability to continue as a going concern, disclosing, as applicable, matters related to going concern and using the going concern basis of accounting unless management either intends to liquidate the Company/ Group or to cease operations, or has no realistic alternative but to do so.

Annual Report 2020/21 / 63
Those charged with governance are responsible for overseeing the Company’s and the Group’s financial reporting process.
Auditor’s responsibilities for the audit of the financial statementsOur objectives are to obtain reasonable assurance about whether the financial statements as a whole are free from material misstatement, whether due to fraud or error, and to issue an auditor’s report that includes our opinion. Reasonable assurance is a high level of assurance, but is not a guarantee that an audit conducted in accordance with SLAuSs will always detect a material misstatement when it exists. Misstatements can arise from fraud or error and are considered material if, individually or in the aggregate, they could reasonably be expected to influence the economic decisions of users taken on the basis of these financial statements.
As part of an audit in accordance with SLAuSs, we exercise professional judgment and maintain professional skepticism throughout the audit. We also: Identify and assess the risks of material misstatement of the
financial statements, whether due to fraud or error, design and perform audit procedures responsive to those risks, and obtain audit evidence that is sufficient and appropriate to provide a basis for our opinion. The risk of not detecting a material misstatement resulting from fraud is higher than for one resulting from error, as fraud may involve collusion, forgery, intentional omissions, misrepresentations, or the override of internal control.
Obtain an understanding of internal control relevant to the audit in order to design audit procedures that are appropriate in the circumstances, but not for the purpose of expressing an opinion on the effectiveness of the Company’s and the Group’s internal control.
Evaluate the appropriateness of accounting policies used and the reasonableness of accounting estimates and related disclosures made by management.
Conclude on the appropriateness of management’s use of the going concern basis of accounting and, based on the audit evidence obtained, whether a material uncertainty exists related to events or conditions that may cast significant doubt on the Company’s/ Group’s ability to continue as a going concern. If we conclude that a material uncertainty exists, we are required to draw attention in our auditor’s report to the related disclosures in the separate/ consolidated financial statements or, if such disclosures are inadequate, to modify our opinion. Our conclusions are based on the audit evidence obtained up to the date of our auditor’s report. However, future events or conditions may cause the Company/ Group to cease to continue as a going concern.
Evaluate the overall presentation, structure and content of the financial statements, including the disclosures, and whether the financial statements represent the underlying transactions and events in a manner that achieves fair presentation.
Obtain sufficient appropriate audit evidence regarding the financial information of the entities or business activities within the Group to express an opinion on the consolidated financial statements. We are responsible for the direction, supervision and performance of the Group audit. We remain solely responsible for our audit opinion.
We communicate with those charged with governance regarding, among other matters, the planned scope and timing of the audit and significant audit findings, including any significant deficiencies in internal control that we identify during our audit.
We also provide those charged with governance with a statement that we have complied with ethical requirements in accordance with the Code of Ethics regarding independence, and to communicate with them all relationships and other matters that may reasonably be thought to bear on our independence, and where applicable, related safeguards.
From the matters communicated with those charged with governance, we determine those matters that were of most significance in the audit of the financial statements of the current period and are therefore the key audit matters. We describe these matters in our auditor’s report unless law or regulation precludes public disclosure about the matter or when, in extremely rare circumstances, we determine that a matter should not be communicated in our report because the adverse consequences of doing so would reasonably be expected to outweigh the public interest benefits of such communication.
Report on other legal and regulatory requirements As required by section 163 (2) of the Companies Act, No. 07 of 2007, we have obtained all the information and explanations that were required for the audit and, as far as appears from our examination, proper accounting records have been kept by the Company.
CHARTERED ACCOUNTANTSCA Sri Lanka membership number 2857
COLOMBO 30 August 2021

64 / BROWN AND COMPANY PLC
STATEMENT OF PROFIT OR LOSS
Group Company
For the year ended 31st March 2021 2020 2021 2020
Notes Rs.000 Rs.000 Rs.000 Rs.000
Revenue from Contracts with Customers 4 29,391,036 20,438,843 16,451,336 11,343,738
Cost of Sales (22,091,460) (15,456,952) (12,831,377) (8,880,927)
Gross Profit 7,299,576 4,981,891 3,619,959 2,462,811
Other Income/ (Expenses) 5 558,602 173,072 462,214 (251,054)
Distribution Expenses (984,520) (1,687,440) (569,683) (1,241,337)
Administrative Expenses (5,927,072) (5,786,420) (933,785) (1,122,850)
Finance Income 6 542,923 420,718 885,548 1,309,898
Finance Costs 7 (5,582,525) (5,418,665) (1,846,463) (1,951,805)
Net Finance Cost (5,039,602) (4,997,947) (960,915) (641,907)
Change in Fair Value of Investment Properties 13 706,916 1,911,951 453,809 1,843,783
Change in Fair Value of Consumable Biological Assets 16 560,453 (136,816) - -
Gain on Disposal of Investment in Subsidiaries - 256,989 - 147,800
Gain on Bargain Purchase 17 165,154 4,593,221 - -
Share of Loss of Equity Accounted Investees (Net of Tax) 18 (122,597) (278,942) - -
Profit/ (Loss) before Taxation 8 (2,783,090) (970,441) 2,071,599 1,197,246
Income Tax Expense 9 (561,334) (544,230) (310,631) (214,487)
Profit/ (Loss) for the Year (3,344,424) (1,514,671) 1,760,968 982,759
Profit/ (Loss) Attributable to:
Equity holders of the Company (16,046) 3,620,315 1,760,968 982,759
Non-Controlling Interests (3,328,378) (5,134,986) - -
Profit/ (Loss) for the Year (3,344,424) (1,514,671) 1,760,968 982,759
Basic Earnings/ (Loss) per Share (Rs.) 10.1 (0.08) 17.03 8.28 4.62
Diluted Earnings/ (Loss) per Share (Rs.) 10.2 (0.08) 17.03 8.28 4.62
The Notes as set out in Pages 72 to 174 form an integral part of these Financial Statements.
The figures in brackets indicate deductions.

Annual Report 2020/21 / 65
STATEMENT OF COMPREHENSIVE INCOME
Group Company
For the year ended 31st March 2021 2020 2021 2020
Rs.000 Rs.000 Rs.000 Rs.000
Profit/(Loss) for the Year (3,344,424) (1,514,671) 1,760,968 982,759
Other Comprehensive Income
Items that will not be Reclassified to Profit or Loss
Revaluation of Property, Plant and Equipment 13,543,807 453,242 678,028 -
Revaluation of Right-of-Use Assets 11,778,032 - - -
Deferred Tax impact on Revaluation (2,444,476) (5,374) (162,727) -
Actuarial Gain/ (Loss) on Retirement Benefit Obligation 65,682 (42,091) (9,831) (8,074)
Deferred Tax impact on Actuarial Gain/ (Loss) on Retirement Benefit Obligation (7,295) 5,853 2,359 2,261
Share of Other Comprehensive Income of Equity Accounted Investees (Net of Tax) 289,221 298,518 - -
Change in Fair Value of FVOCI Financial Assets 610,165 468,855 - -
Deferred Tax impact on Change in Fair Value of FVOCI Financial Assets 68,106 (33,909) - -
Items that may be Reclassified to Profit or Loss
Exchange Differences on Translation of Foreign Operations 5,274,348 2,376,428 - -
Other Comprehensive Income for the Year 29,177,591 3,521,522 507,830 (5,814)
Total Comprehensive Income for the Year (Net of Tax) 25,833,167 2,006,850 2,268,798 976,945
Attributable to:
Equity holders of the Company 13,162,197 4,521,537 2,268,798 976,945
Non-Controlling Interests 12,670,970 (2,514,687) - -
Total Comprehensive Income for the Year 25,833,167 2,006,850 2,268,798 976,945
The Notes as set out in Pages 72 to 174 form an integral part of these Financial Statements.
The figures in brackets indicate deductions.

66 / BROWN AND COMPANY PLC
STATEMENT OF FINANCIAL POSITION
Group Company
As at 31st March 2021 2020 2021 2020
Notes Rs.000 Rs.000 Rs.000 Rs.000
ASSETS
Non-Current Assets
Property, Plant and Equipment 11 105,513,324 79,958,922 2,488,075 1,846,561
Right-of-Use Assets 12 19,575,908 6,980,585 397,359 435,755
Investment Properties 13 23,896,929 22,616,054 12,534,776 12,069,952
Intangible Assets 14 1,687,392 1,690,741 3,226 5,816
Bearer Biological Assets 15 2,423,961 2,144,550 - -
Consumable Biological Assets 16 4,007,383 3,642,998 - -
Investments in Subsidiaries 17 - - 23,358,633 10,295,319
Investments in Equity Accounted Investees 18 6,396,386 6,229,761 1,227,958 1,227,958
Other Financial Assets 19 1,609,585 869,176 55,000 55,000
Deferred Tax Assets 20 48,691 482,741 - -
Total Non-Current Assets 165,159,559 124,615,528 40,065,027 25,936,361
Current Assets
Inventories 21 8,960,060 6,686,405 2,268,847 2,845,294
Trade and Other Receivables 22 13,050,310 10,257,420 3,253,431 3,746,453
Loans to Related Parties 23 1,985,921 1,875,235 6,026,783 10,123,408
Amounts due from Related Parties 24 285,133 528,521 1,017,733 1,127,174
Income Tax Recoverable 25 150,391 55,965 115,106 160,111
Other Financial Assets 26 3,191,482 2,006,642 1,814,175 1,609,521
Cash and Cash Equivalents 27 2,978,887 1,647,089 172,471 81,085
Total Current Assets 30,602,185 23,057,277 14,668,547 19,693,046
Total Assets 195,761,744 147,672,805 54,733,574 45,629,407
EQUITY AND LIABILITIES
Equity
Stated Capital 28 9,093,101 9,093,101 9,093,101 9,093,101
Capital Reserves 29 17,809,193 4,643,864 3,173,841 2,658,540
Revenue Reserve 30 19,985,456 16,520,105 18,011,324 16,241,239
Equity Attributable to Equity holders of the Company 46,887,750 30,257,070 30,278,266 27,992,880
Non-Controlling Interests 50,180,938 46,497,651 - -
Total Equity 97,068,688 76,754,721 30,278,266 27,992,880

Annual Report 2020/21 / 67
Group Company
As at 31st March 2021 2020 2021 2020
Notes Rs.000 Rs.000 Rs.000 Rs.000
Non-Current Liabilities
Loans and Borrowings 31 17,597,510 12,481,214 2,394,972 2,169,815
Lease Liabilities 32 6,786,368 5,712,526 376,251 377,761
Retirement Benefit Obligations 33 973,087 898,354 112,515 93,646
Deferred Tax Liabilities 34 4,981,695 2,192,787 710,410 284,798
Deferred Income 35 143,176 161,509 14,080 16,050
Loans from Related Parties 37 4,837,781 4,099,590 - -
Total Non-Current Liabilities 35,319,617 25,545,980 3,608,228 2,942,070
Current Liabilities
Trade and Other Payables 36 14,284,748 9,366,269 3,434,539 2,579,381
Loans and Borrowings 31 3,053,794 2,244,541 2,872,585 1,555,831
Lease Liabilities 32 296,842 370,426 65,587 71,215
Loans from Related Parties 37 16,130,932 360,490 1,956,904 203,704
Amounts due to Related Parties 38 14,730,241 18,932,413 843,875 474,189
Income Tax Payable 39 258,948 216,148 - -
Dividend Payable 10,818 25,695 5,912 22,504
Short Term Borrowings 14,299,903 12,677,959 11,567,041 8,986,384
Bank Overdrafts 27 307,213 1,178,163 100,637 801,250
Total Current Liabilities 63,373,439 45,372,104 20,847,080 14,694,457
Total Equity and Liabilities 195,761,744 147,672,805 54,733,574 45,629,407
The Notes as set out in Pages 72 to 174 form an integral part of these Financial Statements.
I certify that these Financial Statements have been prepared and presented in compliance with the requirements of the Companies Act No.7 of 2007.
Thamotharampillai SanakanGroup Chief Financial Officer
The Board of Directors is responsible for the Preparation and Presentation of these Financial Statements.
Signed for and on behalf of the Board,
Ishara Nanayakkara Kapila JayawardenaExecutive Chairman Director
Colombo 30th August 2021

68 / BROWN AND COMPANY PLC
STATEMENT OF CHANGES IN EQUITY - GROUP
Equi
ty A
ttrib
utab
le to
Equ
ity h
olde
rs o
f the
Com
pany
Stat
ed
Capi
tal
Reva
luat
ion
Rese
rve
Fair
Valu
e th
roug
h Ot
her
com
preh
ensi
ve i
ncom
e Re
serv
e
Fore
ign
Curr
ency
Tran
slat
ion
Rese
rve
Reta
ined
Earn
ings
Tota
lN
on-
Cont
rolli
ngIn
tere
sts
Tota
l Eq
uity
Rs.0
00Rs
.000
Rs.0
00Rs
.000
Rs.0
00Rs
.000
Rs.0
00Rs
.000
Bala
nce
as a
t 1st
Apr
il 20
19 9
,093
,101
3
,488
,366
(2
98,6
17)
684
,179
1
2,75
3,38
6 2
5,72
0,41
5 2
0,47
1,34
3 4
6,19
1,75
8
Impa
ct o
f ado
ptin
g SL
FRS
16 -
(1
8,63
7) -
-
3
,177
(1
5,46
0) (2
5,31
1) (4
0,77
1)
Profi
t/(L
oss)
for t
he y
ear
-
-
-
-
3,6
20,3
15
3,6
20,3
15
(5,1
34,9
86)
(1,5
14,6
71)
Oth
er C
ompr
ehen
sive
inco
me
-
134
,462
3
5,66
6 6
18,4
46
112
,647
9
01,2
21
2,6
20,3
00
3,5
21,5
22
Tota
l Com
preh
ensi
ve in
com
e fo
r the
yea
r -
1
34,4
62
35,
666
618
,446
3
,732
,962
4
,521
,536
(2
,514
,686
) 2
,006
,850
Tran
sact
ions
with
ow
ners
dire
ctly
reco
rded
in
the
Equi
tyAd
just
men
ts d
ue to
cha
nge
in g
roup
hol
ding
s an
d ot
her a
djus
tmen
ts -
-
-
-
3
,700
3
,700
(2
,200
) 1
,500
On
acqu
isiti
on o
f sub
sidi
arie
s -
-
-
-
-
-
2
8,56
8,50
5 2
8,56
8,50
5 Fo
rfeite
d Di
vide
nd -
-
-
-
2
6,88
0 2
6,88
0 -
2
6,88
0 Ba
lanc
e as
at 3
1st M
arch
202
0 9
,093
,101
3
,604
,190
(2
62,9
51)
1,3
02,6
25
16,
520,
105
30,
257,
070
46,
497,
651
76,
754,
721
Loss
for t
he y
ear
-
-
-
-
(16,
046)
(16,
046)
(3,3
28,3
78)
(3,3
44,4
24)
Oth
er C
ompr
ehen
sive
inco
me
-
10,
810,
684
441
,384
1
,913
,260
1
2,91
3 1
3,17
8,24
1 1
5,99
9,35
0 2
9,17
7,59
1 To
tal C
ompr
ehen
sive
inco
me
for t
he y
ear
-
10,
810,
684
441
,384
1
,913
,260
(3
,133
) 1
3,16
2,19
5 1
2,67
0,97
1 2
5,83
3,16
7
Tran
sact
ions
with
ow
ners
dire
ctly
reco
rded
in th
e Eq
uity
Adju
stm
ents
due
to c
hang
e in
gro
up h
oldi
ngs
and
othe
r adj
ustm
ents
-
-
-
-
3,4
50,8
84
3,4
50,8
84
(20,
457,
608)
(17,
006,
724)
On
acqu
isiti
on o
f sub
sidi
arie
s -
-
-
-
-
-
2
,091
,380
2
,091
,380
Sh
are
issu
e by
sub
sidi
arie
s to
non
-con
trolin
g in
tere
st -
-
-
-
-
-
9
,378
,545
9
,378
,545
Forfe
ited
Divi
dend
-
-
-
-
17,
600
17,
600
-
17,
600
Bala
nce
as a
t 31s
t Mar
ch 2
021
9,0
93,1
01
14,
414,
874
178
,434
3
,215
,885
1
9,98
5,45
6 4
6,88
7,75
0 5
0,18
0,93
8 9
7,06
8,68
8
The
Not
es a
s se
t out
in P
ages
72
to 1
74 fo
rm a
n in
tegr
al p
art o
f the
se F
inan
cial
Sta
tem
ents
.
The
figur
es in
bra
cket
s in
dica
te d
educ
tions
.

Annual Report 2020/21 / 69
STATEMENT OF CHANGES IN EQUITY - COMPANY
For the year ended 31st March Stated Revaluation Retained Total
Capital Reserve Earnings Equity
Rs.000 Rs.000 Rs.000 Rs.000
Balance as at 01st April 2019 9,093,101 2,658,540 15,237,414 26,989,055
Profit for the year - - 982,759 982,759
Other Comprehensive Income for the year - - (5,814) (5,814)
Total Comprehensive income for the year - - 976,945 976,945
Transactions with owners directly recorded in the Equity
Forfeited Dividend - - 26,880 26,880
Balance as at 31st March 2020 9,093,101 2,658,540 16,241,239 27,992,880
Profit for the year - - 1,760,968 1,760,968
Other Comprehensive Income for the year - 515,301 (7,471) 507,830
Total Comprehensive income for the year - 515,301 1,753,497 2,268,798
Transactions with owners directly recorded in the Equity
Forfeited Dividend - - 16,588 16,588
Balance as at 31st March 2021 9,093,101 3,173,841 18,011,324 30,278,266
The Notes as set out in Pages 72 to 174 form an integral part of these Financial Statements.
The figures in brackets indicate deductions.

70 / BROWN AND COMPANY PLC
STATEMENTS OF CASH FLOWS
Group Company For the year ended 31st March 2021 2020 2021 2020
Notes Rs.000 Rs.000 Rs.000 Rs.000
Cash flows from Operating ActivitiesProfit/(Loss) before Taxation (2,783,090) (970,441) 2,071,599 1,197,246
Adjustments for:Share of Loss of Equity Accounted Investees (Net of Tax) 18 122,597 278,942 - -
Depreciation on Property Plant and Equipment 11 2,109,372 1,563,122 78,504 83,042 Amortisation of ROU Assets 12 345,964 87,139 54,070 51,434 Amortisation of Bearer Biological Assets 15 355,104 297,940 - - Amortisation of Intangible Assets 14 25,364 13,041 2,749 2,618 Amortisation of Deferred Income 35 (51,749) (35,170) (45,009) (26,736)Provision for Retirement Benefit Obligations 33 177,809 142,354 20,822 19,331 Provision/ (Reversal of Provision) for Bad and Doubtful Debts 8 (172,667) 309,276 41,085 258,455 Provision for Other Receivables 8 62,376 - 26,113 - Provision for Impairment of Investment in Subsidiaries 17 - - 14,241 - Reversal of Provision for Related Party Receivables 24 - - (115,000)Provision/ (Reversal of Provision) for Impairment Losses for Inventories 8 (150,474) 438,759 (98,267) 371,541 Gain on Bargain Purchase 17 (165,154) (4,593,221) - - Dividend Income 5 (38,389) (7,861) (34,893) (1)Interest Income 6 (542,923) (420,718) (885,548) (1,309,898)Change in Fair Value of Investment Properties 13 (706,916) (1,911,951) (453,809) (1,843,783)Change in Fair Value of Consumable Biological Assets 16 (560,453) 136,816 - - Gain on Disposal of Subsidiary/ Group Investments - (256,989) - (147,800)Impairment Losses on Property, Plant and Equipment, Bearer Biological Assets 59,458 139,872 - - (Gain)/ Loss on Changes in Fair Value of Short term Investments 5 (198,935) 433,858 (204,582) 433,478 Loss/(Gain) on Disposal of Property, Plant and Equipment 5 (25,542) (48) 1,142 (44)Gain on Disposal of Bearer Biological assets 5 (27,064) (41,511) - - Interest Expense 7 5,582,525 5,418,665 1,846,463 1,951,805 Operating Profit before Working Capital Changes 3,417,212 1,021,876 2,319,680 1,040,688
Changes inInventories (2,087,277) (1,889) 674,713 968,026 Trade and Other Receivables (2,649,897) 3,055,164 (365,765) 105,496 Amounts due from Related Companies 298,081 96,143 238,383 (179,413)Trade and Other Payables 4,521,730 812,937 1,646,399 (521,850)Amounts due to Related Companies (4,256,866) 9,225,266 355,744 (35,883)Cash Generated from/ (Used in) Operations (757,017) 14,209,498 4,869,153 1,377,065
Interest Paid (4,969,018) (4,890,291) (1,793,942) (1,923,318)Income Tax / ESC Paid 25,39 (74,835) (243,621) (30) (75,781)Retiring Gratuity Paid 33 (120,168) (152,930) (11,784) (26,105)Net Cash Generated from/(Used in) Operating Activities (5,921,038) 8,922,656 3,063,397 (648,140)

Annual Report 2020/21 / 71
Group Company For the year ended 31st March 2021 2020 2021 2020
Notes Rs.000 Rs.000 Rs.000 Rs.000
Cash flows from Investing ActivitiesAcquisition of Property, Plant and Equipment 11 (4,780,536) (7,302,938) (51,051) (103,325)Investment in Bearer Biological Assets 15 (517,695) (556,318) - - Proceeds from Disposal of Bearer Biological Assets 29,982 27,145 - - Acquisition of Investment Properties 13 (261,903) (186,181) (15,515) (182,937)Proceeds from Disposal of Subsidiaries - 1,597,438 - 1,600,000 Proceeds from Disposal of Investment Properties 4,500 - 4,500 - Acquisition of Intangible Assets 14 (9,409) (86,209) (159) (726)Investment in Subsidiaries 17 (497,176) (4,521,461) (13,077,556) (45,000)Net Investment in Equity Accounted Investees 18 - (1,139,289) - (55,000)Net Investment in Financial Assets (987,758) (561,142) (74) (394,720)Deferred income Received 35 33,416 43,022 43,039 23,016 Proceeds from consumable biological assets 196,068 8,726 - - Net Movement in Loans Given to Related Parties 957,424 (1,184,540) - - Proceeds from Loans Given to Related Parties - - 11,199,775 4,791,727 Loans Granted to Related Parties - - (7,103,149) (4,053,749)Proceeds from Disposal of Property, Plant and Equipment 38,823 7,136 7,919 157 Dividend Income Received 38,389 7,861 34,893 1 Interest Income Received 6 542,923 420,718 885,548 1,309,898 Net Cash Generated from/(Used) in Investing Activities (5,212,951) (13,426,033) (8,071,830) 2,889,344
Cash flows from Financing ActivitiesProceeds from Interest Bearing Liabilities 31 7,193,945 7,468,389 2,916,600 1,682,235 Repayment of Interest Bearing Liabilities 31 (2,764,796) (3,667,427) (1,374,689) (1,367,645)Net movement in short term borrowings 1,381,558 2,311,974 2,580,656 938,735 Lease Rentals Paid 32 (286,318) (186,250) (75,333) (66,701)Loans Obtained from Related Parties - - 7,420,700 4,252,695 Repayment of Loans from Related Parties - - (5,667,500) (7,356,277)Net movement in Loans from Related Parties 15,440,527 (505,532) - - Issue of Ordinary shares by Subsidiaries - 1,500 - - Shares purchased from Non-controlling Interests (17,006,724) - - - Shares Issued by Subsidiaries to Non-Controling interest 9,378,545 - - - Net Cash Generated from/(Used In) Financing Activities 13,336,737 5,422,655 5,800,434 (1,916,958)
Net Increase/(Decrease) in Cash and Cash Equivalents during the year 2,202,747 919,278 791,999 324,247 Cash and Cash Equivalents at the beginning of the year 468,926 (450,352) (720,166) (1,044,413)Cash and Cash Equivalents at the end of the year 2,671,674 468,926 71,835 (720,166)
Analysis of Cash and Cash Equivalents at the end of the yearCash at Bank and in Hand 2,978,887 1,647,089 172,471 81,085 Bank Overdrafts (307,213) (1,178,163) (100,637) (801,250)
27 2,671,674 468,926 71,835 (720,166)
The Notes as set out in Pages 72 to 174 form an integral part of these Financial Statements.
The figures in brackets indicate deductions.

72 / BROWN AND COMPANY PLC
Note No Note Name
Note 01 Reporting Entity
Note 02 Basis of Preparation
Note 03 Significant Accounting Policies
Note 04 Revenue from Contracts with Customers
Note 05 Other Income/ (Expenses)
Note 06 Finance Income
Note 07 Finance Cost
Note 08 Profit/ (Loss) Before Taxation
Note 09 Income Tax Expenses
Note 10 Earnings/ (Loss) Per Share
Note 11 Property, Plant and Equipment
Note 12 Right-of-Use Assets
Note 13 Investment Properties
Note 14 Intangible Assets
Note 15 Bearer Biological Assets
Note 16 Consumable Biological Assets
Note 17 Investments In Subsidiaries
Note 18 Investments In Equity Accounted Investees
Note 19 Other Non-Current Financial Assets
Note 20 Deferred Tax Assets
Note 21 Inventories
Note 22 Trade and Other Receivables
Note 23 Loans to Related Parties
Note 24 Amounts due from Related Parties
Note No Note Name
Note 25 Income Tax Recoverable
Note 26 Other Current Financial Assets
Note 27 Cash and Cash Equivalents
Note 28 Stated Capital
Note 29 Capital Reserves
Note 30 Revenue Reserve
Note 31 Loans and Borrowings
Note 32 Lease Liabilities
Note 33 Retirement Benefits Obligations
Note 34 Deferred Tax Liabilities
Note 35 Deferred Income
Note 36 Trade and Other Payables
Note 37 Loans from Related Parties
Note 38 Amounts due to Related Parties
Note 39 Income Tax Payables
Note 40 Net Assets per Share
Note 41 Related Party Disclosures
Note 42 Financial Instruments - Fair Value and Risk Management
Note 43 Commitments and Contingent Liabilities
Note 44 Comparative Information
Note 45 Subsequent Events
Note 46 Segmental Information
Note 47 Non-Controlling Interests
NOTES TO THE FINANCIAL STATEMENTS

Annual Report 2020/21 / 73
1. REPORTING ENTITY1.1 General Brown and Company PLC (‘the Company’) is a public
quoted company incorporated on 17th August 1892 and domiciled in Sri Lanka. The address of the Company’s registered office is at No. 481, T. B. Jayah Mawatha, Colombo 10, Sri Lanka and the business office is situated at No. 34, Sir Mohamed Macan Markar Mawatha, Colombo 3.
The financial statements as at, and for the year ended 31st March 2021 comprise the separate financial statements of Company and consolidated financial statements of the Company and its subsidiaries (together referred to as the “Group” and individually as “Group entities”) and the Group’s interest in equity-accounted investees.
Ordinary shares of the Company are listed on the Diri Savi Board of the Colombo Stock Exchange (CSE).
1.2 Principal activities and nature of operations Principal activities of the Company and the Group are
described in the ‘Management Discussion and Analysis’ in pages 5 to 17 of this report.
1.3 Parent entity and ultimate parent entity In the opinion of the Board of Directors, the Group’s
ultimate parent undertaking and controlling party as at the date of financial position is LOLC Holdings PLC, a Company incorporated and domiciled in Sri Lanka.
2. BASIS OF PREPARATION2.1 Statement of compliance The consolidated financial statements of the Group
and the separate financial statements of the Company have been prepared in accordance with the Sri Lanka Accounting Standards (herein referred to as SLFRSs/LKASs) , which comprise Sri Lanka Financial Reporting Standards (“SLFRS”s), Sri Lanka Accounting Standards (“LKAS”s), relevant interpretations of the Standing Interpretations Committee (“SIC”) and International Financial Reporting Interpretations Committee (“IFRIC”). Sri Lanka Accounting Standards further comprises of Statements of Recommended Practices (SoRPs), Statements of Alternate Treatments (SoATs) and Financial Reporting Guidelines issued by the Institute of Chartered Accountants of Sri Lanka , and in compliance with the requirements of the Companies Act No. 07 of 2007 and the Sri Lanka Accounting and Auditing Standards Act No. 15 of 1995. These financial statements also provide appropriate disclosures as required by the listing rules of the Colombo Stock Exchange.
2.2 Historical cost convention The financial statements have been prepared on a
historical cost basis, except for:
Certain financial assets, certain classes of property, plant and equipment and investment properties measured at fair value;
Biological assets are measured at fair value less costs to sell on initial recognition and at the end of each reporting period, and
Agricultural produce harvested from biological assets are measured at its fair value less costs to sell at the point of harvest.
2.3 Directors’ Responsibility for Financial Reporting The Board of Directors is responsible for the preparation
and fair presentation of these financial statements in accordance with Sri Lanka Accounting Standards and as per the provisions of the Companies Act No. 07 of 2007. This responsibility includes: designing, implementing and maintaining internal controls relevant to the preparation and fair presentation of financial statements that are free from material misstatement, whether due to fraud or error; selecting and applying appropriate accounting policies; and making accounting estimates that are reasonable in the circumstances.
The Board of Directors acknowledges their responsibility as set out in the “Annual Report of the Board of Directors on the Affairs of the Company” and “Director’s Responsibility for Financial Reporting”.
These Financial Statements include the following components:
A Statement of Profit or Loss providing the information on the financial performance of the Group and the Company for the year under review;
A Statement of Other Comprehensive Income providing the information of the other comprehensive income of the Group and the Company;
A Statement of Financial Position providing the information on the financial position of the Group and the Company as at the yearend;
A Statement of Changes in Equity depicting all changes in shareholders’ funds during the year under review of the Group and the Company;
A Statement of Cash Flows providing the information to the users, on the ability of the Group and the Company to generate cash and cash equivalents and the needs of entities to utilize those cash flows; and
Notes to the Financial Statements comprising Accounting Policies and other explanatory information.

74 / BROWN AND COMPANY PLC
2.4 Approval of financial statements by the Board of Directors
The consolidated financial statements of the Group and the separate financial statements of the Company for the year ended 31st March 2021 were approved and authorized for issue by the Board of Directors on 30th August 2021. The directors have the power to amend and reissue the financial statements.
2.5 Functional currency and presentation currency Items included in the financial statements of each of
the Group’s entities are measured using the currency of the primary economic environment in which the entity operates (‘the functional currency’). The financial statements are presented in Sri Lankan Rupee (Rs.), which is Company’s functional and Group’s presentation currency.
Functional currency of all the Group companies is Sri Lankan Rupees, other than the following companies whose functional currency is given below.
Company Country of Incorporation Functional Currency
Bodufaru Beach Resorts (Private) Limited Maldives United States Dollar
NPH Investments (Private) Limited Maldives United States Dollar
Browns Ari Resorts (Private) Limited Maldives United States Dollar
Browns Raa Resorts (Private) Limited Maldives United States Dollar
Browns Kaafu N Resorts (Private) Limited Maldives United States Dollar
LOLC Asia (Private) Limited Singapore United States Dollar
B Commodities ME (FZE) United Arab Emirates (U.A.E.) United States Dollar
Sunbird Bioenergy (SL) Limited Sierra Leone Euro
Grey Reach Investments Limited British Virgin Islands United States Dollar
2.5.1 Foreign currency translation Foreign currency transactions are translated into the
functional currency using the exchange rates at the dates of the transactions. Foreign exchange gains and losses resulting from the settlement of such transactions and from the translation of monetary assets and liabilities denominated in foreign currencies at year end exchange rates are generally recognised in profit or loss.
Foreign exchange gains and losses are presented in the statement of profit or loss on a net basis within other income/other expenses.
Non-monetary items that are measured at fair value in a foreign currency are translated using the exchange rates at the date when the fair value was determined. Translation differences on assets and liabilities carried at fair value are reported as part of the fair value gain or loss. For example, translation differences on non-monetary assets and liabilities such as equities held at fair value through profit or loss are recognised in profit or loss as part of the fair value gain or loss and translation differences on non-monetary assets such as equities classified as at fair value through other comprehensive income are recognised in other comprehensive income.
2.5.2 Group companies The results and financial position of foreign operations
(none of which has the currency of a hyperinflationary
economy) that have a functional currency different from the presentation currency are translated into the presentation currency as follows:
assets and liabilities for each statement of financial position presented are translated at the closing rate at the date of that statement of financial position;
income and expenses for each statement of profit or loss and statement of comprehensive income are translated at average exchange rates (unless this is not a reasonable approximation of the cumulative effect of the rates prevailing on the transaction dates, in which case income and expenses are translated at the dates of the transactions); and
all resulting exchange differences are recognised in statement of comprehensive income.
On consolidation, exchange differences arising from the translation of any net investment in foreign entities are recognised in other comprehensive income. When a foreign operation is sold the associated exchange differences are reclassified to profit or loss, as part of the gain or loss on sale.
Goodwill and fair value adjustments arising on the acquisition of a foreign operation are treated as assets and liabilities of the foreign operation and translated at the closing rate.
NOTES TO THE FINANCIAL STATEMENTS

Annual Report 2020/21 / 75
2.6 Comparative information Comparative information including quantitative, narrative
and descriptive information is disclosed in respect of the previous period in the financial statements in order to enhance the understanding of the current period’s financial statements and to enhance the inter period comparability. The presentation and classification of the financial statements of the previous year are amended, where relevant for better presentation and to be comparable with those of the current year.
2.7 Materiality and aggregation Each material class of similar items is presented
separately in the financial statements. Items of dissimilar nature or function are presented separately unless they are immaterial as permitted by the Sri Lanka Accounting Standard - LKAS 1 on ‘Presentation of Financial Statements’ .
Notes to the financial statements are presented in a systematic manner which ensures the understandability and comparability of financial statements of the Group and the Company. Understandability of the financial statements is not compromised by obscuring material information with immaterial information or by aggregating material items that have different natures or functions.
All amounts disclosed in the financial statements and notes have been rounded off to the nearest thousand currency units unless otherwise stated.
2.8 Offsetting Financial assets and financial liabilities are offset and
the net amount reported in the statement of financial position, only when there is a legally enforceable right to offset the recognised amounts and there is an intention to settle on a net basis or to realise the assets and settle the liabilities simultaneously. Income and expenses are not offset in the statement of profit or loss, unless required or permitted by Sri Lanka Accounting Standards and as specifically disclosed in the significant accounting policies.
2.9 Going concern The Directors have made an assessment of the
Company’s ability to continue as a going concern and are satisfied that it has the resources to continue in business for the foreseeable future. Furthermore, the Board is not aware of any material uncertainties that may cast significant doubt upon the Company’s ability to continue as a going concern and they do not intend either to liquidate or to cease operations of the Company. Therefore, the financial statements continue to be prepared on the going concern basis.
2.10 Current versus non-current classification The Group presents assets and liabilities in the statement
of financial position based on current / non-current classification.
An asset is current when it is expected to be realised or intended to be sold or consumed in the normal operating cycle and held primarily for the purpose of trading.
Or
Is cash or cash equivalent unless restricted from being exchanged or used to settle a liability for at least twelve months after the reporting period.
All other assets are classified as non-current.
A liability is current when it is expected to be settled in the normal operating cycle and is held primarily for the purpose of trading and is due to be settled within twelve months after the reporting period
Or
There is no unconditional right to defer the settlement of the liability for at least twelve months after the reporting period.
The Group classifies all other liabilities as non-current.
2.11 Use of accounting estimates and judgements The preparation of the financial statements of the
Group and Company in conformity with SLFRSs/LKAS’s requires management to make judgments, estimates and assumptions that affect the application of accounting policies and the reported amounts of assets, liabilities, income and expenses. Actual results may differ from these estimates.
The Estimates and underlying assumptions are based on historical experience and various other factors that are believed to be reasonable under the circumstances, the results which form the basis of making the judgments about the carrying amount of assets and liabilities that are not readily apparent from other sources.
Estimates and underlying assumptions are reviewed on an ongoing basis. Revisions to accounting estimates are recognized in the period in which the estimates are revised and in any future periods affected.
Information about critical judgments in applying accounting policies that have the most significant effect on the amounts recognized in the financial statements

76 / BROWN AND COMPANY PLC
NOTES TO THE FINANCIAL STATEMENTS
are included in the following notes to these financial statements.
Critical accounting estimate/judgement Note
Useful lives of bearer biological assets 15
Fair value of consumable biological assets 16
Determination of fair value of Investment Properties 13
Revaluation of Land and Buildings 11
Goodwill on Acquisition 14
Retirement Benefit Obligations 33
Deferred Tax Assets/ Liabilities 20 & 34
Useful lives of Property, Plant and Equipment 11
Useful lives of Intangible Assets 14
Provisions and contingencies 43
Fair Value of Financial Assets 3.29
Leases 3.11 & 12
3. SUMMARY OF SIGNIFICANT ACCOUNTING POLICIES
This note provides a list of the significant accounting policies adopted in the preparation of these financial statements. These policies have been consistently applied to all the years presented, unless otherwise stated. The financial statements are for the Group consisting of Brown and Company PLC and its subsidiaries.
3.1 Changes in accounting policies3.1.1 Valuation of Right-of-Use Assets The Company/Group has voluntarily changed the
accounting policy on Right-Of-Use Assets relating to Lands which meets the definition of a property, plant and equipment from cost model to revaluation model with effect from 1 October 2020, by carrying out a valuation by an independent valuer who holds a recognised and relevant professional qualification and has recent experience in the location and category of the lands being valued. This is done to provide reliable and more relevant information.
The change in accounting policy from cost model to revaluation model has not led for a retrospective restatement due to the exemption available in the Paragraph 17 of LKAS 8 “Accounting Policies, Change in Accounting Estimates and Errors”. As per Paragraph 17 of LKAS 8, the initial application of a policy to revalue assets in accordance with LKAS 16 “Property, Plant and Equipment” is a change in an accounting policy to be dealt with as a revaluation in accordance with LKAS 16, rather than in accordance with LKAS 8. LKAS 16 provides
that when an item of property, Plant and equipment is revalued, the carrying amount of that asset is adjusted to the revalued amount at the date of revaluation.
3.1.2. New standards and amendments – applicable after 1 April 2020
The Company/Group has applied the following standards and amendments for the first time for their reporting period commencing 1 April 2020:
(a) Definition of Material - Amendments to LKAS 1 and LKAS 8
The amendments to LKAS 1 Presentation of Financial Statements and LKAS 8 Accounting Policies, Changes in Accounting Estimates and Errors which use a consistent definition of materiality throughout Sri Lanka Financial Reporting Standards and the Conceptual Framework for Financial Reporting, clarify when information is material and incorporate some of the guidance in LKAS 1 about immaterial information.
In particular, the amendments clarify:
That the reference to obscuring information addresses situations in which the effect is similar to omitting or misstating that information, and that an entity assesses materiality in the context of the financial statements as a whole, and
The meaning of ‘primary users of general-purpose financial statements’ to whom those financial statements are directed, by defining them as ‘existing and potential investors, lenders and other creditors’ that must rely on general purpose financial statements for much of the financial information they need
This amendment is effective for the annual periods beginning on or after 1 January 2020.
(b) Definition of a Business –Amendments to SLFRS 3 The amended definition of a business requires an
acquisition to include an input and a substantive process that together significantly contribute to the ability to create outputs. The definition of the term ‘outputs’ is amended to focus on goods and services provided to customers, generating investment income and other income, and it excludes returns in the form of lower costs and other economic benefits. The amendments will likely result in more acquisitions being accounted for as asset acquisitions. This amendment is effective for the annual periods beginning on or after 1 January 2020.

Annual Report 2020/21 / 77
(c) Revised Conceptual Framework for Financial Reporting The revised Conceptual Framework which will be used
in standard-setting decisions with immediate effect. Key changes include:
increasing the prominence of stewardship in the objective of financial reporting
reinstating prudence as a component of neutrality
defining a reporting entity, which may be a legal entity, or a portion of an entity
revising the definitions of an asset and a liability
removing the probability threshold for recognition and adding guidance on derecognition
adding guidance on different measurement basis, and
stating that profit or loss is the primary performance indicator and that, in principle, income and expenses in other comprehensive income should be recycled where this enhances the relevance or faithful representation of the financial statements.
No changes will be made to any of the current accounting standards. However, entities that rely on the Framework in determining their accounting policies for transactions, events or conditions that are not otherwise dealt with under the accounting standards will need to apply the revised Framework from 1 January 2020. These entities will need to consider whether their accounting policies are still appropriate under the revised Framework.
This amendment is effective for the annual periods beginning on or after 1 January 2020.
(d) COVID-19 - related Rent Concessions - Amendments to SLFRS 16
As a result of the COVID-19 pandemic, rent concessions have been granted to lessees. Such concessions might take a variety of forms, including payment holidays and deferral of lease payments. According to the amendment to SLFRS 16 Leases which provides lessees with an option to treat qualifying rent concessions in the same way as they would if they were not lease modifications. In many cases, this will result in accounting for the concessions as variable lease payments in the period in which they are granted.
Entities applying the practical expedients must disclose this fact, whether the expedient has been applied to all qualifying rent concessions or, if not, information about the nature of the contracts to which it has been applied, as well as the amount recognised in profit or loss arising from the rent concessions.
This amendment is effective for the annual periods beginning on or after 1 June 2020.
The amendments listed above did not have any impact on the amounts recognised in prior periods and are not expected to significantly affect the current or future periods
3.1.3. New standards and amendments not adopted in 2020 by the Company/Group
The following standards and interpretations had been issued by International Accounting Standards Board (IASB) (not yet adopted by Institute of Chartered Accountants of Sri Lanka) but not mandatory for annual reporting periods ending 31 March 2021.
(a) Classification of Liabilities as Current or Non-current – Amendments to IAS 1
The narrow-scope amendments to IAS 1 Presentation of Financial Statements clarify that liabilities are classified as either current or non-current, depending on the rights that exist at the end of the reporting period. Classification is unaffected by the expectations of the entity or events after the reporting date (eg the receipt of a waver or a breach of covenant). The amendments also clarify what IAS 1 means when it refers to the ‘settlement’ of a liability. The amendments could affect the classification of liabilities, particularly for entities that previously considered management’s intentions to determine classification and for some liabilities that can be converted into equity.
They must be applied retrospectively in accordance with the normal requirements in IAS 8 Accounting Policies, Changes in Accounting Estimates and Errors.
In May 2020, the IASB issued an Exposure Draft proposing to defer the effective date of the amendments to 1 January 2023.
(b) Property, Plant and Equipment: Proceeds before intended use - Amendments to IAS 16
The amendment to IAS 16 Property, Plant and Equipment (PP&E) prohibits an entity from deducting from the cost of an item of PP&E any proceeds received from selling items produced while the entity is preparing the asset for its intended use. It also clarifies that an entity is ‘testing whether the asset is functioning properly’ when it assesses the technical and physical performance of the asset. The financial performance of the asset is not relevant to this assessment.
Entities must disclose separately the amounts of proceeds and costs relating to items produced that are not an output of the entity’s ordinary activities.
This amendment is effective for the annual periods beginning on or after 1 January 2022.

78 / BROWN AND COMPANY PLC
(c) Annual Improvements to IFRS Standards 2018–2020 The following improvements were finalised in May 2020:
IFRS 9 Financial Instruments – clarifies which fees should be included in the 10% test for derecognition of financial liabilities.
IFRS 16 Leases – amendment of illustrative example 13 to remove the illustration of payments from the lessor relating to leasehold improvements, to remove any confusion about the treatment of lease incentives.
IFRS 1 First-time Adoption of International Financial Reporting Standards – allows entities that have measured their assets and liabilities at carrying amounts recorded in their parent’s books to also measure any cumulative translation differences using the amounts reported by the parent. This amendment will also apply to associates and joint ventures that have taken the same IFRS 1 exemption.
IAS 41 Agriculture – removal of the requirement for entities to exclude cash flows for taxation when measuring fair value under IAS 41. This amendment is intended to align with the requirement in the standard to discount cash flows on a post-tax basis.
This amendment is effective for the annual periods beginning on or after 1 January 2022.
(d) Reference to the Conceptual Framework - Amendments to IFRS 3 Minor amendments were made to IFRS 3 Business
Combinations to update the references to the Conceptual Framework for Financial Reporting and add an exception for the recognition of liabilities and contingent liabilities within the scope of IAS 37 Provisions, Contingent Liabilities and Contingent Assets and Interpretation 21 Levies. The amendments also confirm that contingent assets should not be recognised at the acquisition date.
This amendment is effective for the annual periods beginning on or after 1 January 2022.
(e) Onerous Contracts - Cost of Fulfilling a Contract Amendments to IAS 37
The amendment to IAS 37 clarifies that the direct costs of fulfilling a contract include both the incremental costs of fulfilling the contract and an allocation of other costs directly related to fulfilling contracts. Before recognising a separate provision for an onerous contract, the entity recognises any impairment loss that has occurred on assets used in fulfilling the contract.
This amendment is effective for the annual periods beginning on or after 1 January 2022.
3.2 Principles of consolidation and equity accounting3.2.1 Subsidiaries Subsidiaries are all entities (including structured entities)
over which the Group has control. The Group controls an entity when the Group is exposed to, or has rights to, variable returns from its involvement with the entity and has the ability to affect those returns through its power to direct the activities of the entity. Subsidiaries are fully consolidated from the date on which control is transferred to the Group. They are deconsolidated from the date that control ceases.
The acquisition method of accounting is used to account for business combinations by the Group (refer to note 3.2.6).
Intercompany transactions, balances and unrealised gains on transactions between Group companies are eliminated. Unrealised losses are also eliminated unless the transaction provides evidence of an impairment of the transferred asset. Accounting policies of subsidiaries have been changed where necessary to ensure consistency with the policies adopted by the Group.
Non-controlling interests in the results and equity of subsidiaries are shown separately in the consolidated statement of profit or loss, comprehensive income, statement of changes in equity and statement of financial position respectively.
3.2.2 Associates Associates are all entities over which the Group has
significant influence but not control or joint control. This is generally the case where the Group holds between 20% and 50% of the voting rights. Investments in associates are accounted for using the equity method of accounting (see (3.2.4) below), after initially being recognised at cost.
3.2.3 Joint arrangements Under SLFRS 11 Joint Arrangements investments in joint
arrangements are classified as either joint operations or joint ventures. The classification depends on the contractual rights and obligations of each investor, rather than the legal structure of the joint arrangement. Interests in joint ventures are accounted for using the equity method (see (3.2.4) below), after initially being recognised at cost in the consolidated statement of financial position.
3.2.4 Equity method Under the equity method of accounting, the investments
are initially recognised at cost and adjusted thereafter to recognise the Group’s share of the post-acquisition profits or losses of the investee in profit or loss, and the Group’s share of movements in other comprehensive income of the investee in statement of comprehensive
NOTES TO THE FINANCIAL STATEMENTS

Annual Report 2020/21 / 79
income. Dividends received or receivable from associates and joint ventures are recognised as a reduction in the carrying amount of the investment.
When the Group’s share of losses in an equity-accounted investment equals or exceeds its interest in the entity, including any other unsecured long-term receivables, the Group does not recognise further losses, unless it has incurred obligations or made payments on behalf of the other entity.
Unrealised gains on transactions between the Group and its associates and joint ventures are eliminated to the extent of the Group’s interest in these entities. Unrealised losses are also eliminated unless the transaction provides evidence of an impairment of the asset transferred. Accounting policies of equity accounted investees have been changed where necessary to ensure consistency with the policies adopted by the Group.
The carrying amount of equity-accounted investments is tested for impairment in accordance with the policy described in note 3.13.
3.2.5 Changes in ownership interests The Group treats transactions with non-controlling
interests that do not result in a loss of control as transactions with equity owners of the Group. A change in ownership interest results in an adjustment between the carrying amounts of the controlling and non-controlling interests to reflect their relative interests in the subsidiary. Any difference between the amount of the adjustment to non-controlling interests and any consideration paid or received is recognised within equity attributable to owners of Company.
When the Group ceases to consolidate or equity account for an investment because of a loss of control, joint control or significant influence, any retained interest in the entity is remeasured to its fair value with the change in carrying amount recognised in statement of profit or loss. This fair value becomes the initial carrying amount for the purposes of subsequently accounting for the retained interest as an associate, joint venture or financial asset. In addition, any amounts previously recognised in statement of comprehensive income in respect of that entity are accounted for as if the Group had directly disposed of the related assets or liabilities. This may mean that amounts previously recognised in statement of comprehensive income are reclassified to profit or loss.
If the ownership interest in a joint venture or an associate is reduced but joint control or significant influence is retained, only a proportionate share of the amounts previously recognised in statement of comprehensive income are reclassified to profit or loss where appropriate.
3.2.6 Business combinations The acquisition method of accounting is used to
account for all business combinations, regardless of whether equity instruments or other assets are acquired. The consideration transferred for the acquisition of a subsidiary comprises the:
fair values of the assets transferred;
liabilities incurred to the former owners of the acquired business;
equity interests issued by the Group;
fair value of any asset or liability resulting from a contingent consideration arrangement; and
fair value of any pre-existing equity interest in the subsidiary.
Identifiable assets acquired and liabilities and contingent liabilities assumed in a business combination are, with limited exceptions, measured initially at their fair values at the acquisition date. The Group recognises any non-controlling interest in the acquired entity on an acquisition-by-acquisition basis either at fair value or at the non-controlling interest’s proportionate share of the acquired entity’s net identifiable assets.
Acquisition-related costs are expensed as incurred.
The excess of the
consideration transferred,
amount of any non-controlling interest in the acquired entity, and
acquisition-date fair value of any previous equity interest in the acquired entity
over the fair value of the net identifiable assets acquired is recorded as goodwill. If those amounts are less than the fair value of the net identifiable assets of the business acquired, the difference is recognised directly in profit or loss as a bargain purchase.
Where settlement of any part of cash consideration is deferred, the amounts payable in the future are discounted to their present value as at the date of exchange. The discount rate used is the entity’s incremental borrowing rate, being the rate at which a similar borrowing could be obtained from an independent financier under comparable terms and conditions.
Contingent consideration is classified either as equity or a financial liability. Amounts classified as a financial liability are subsequently remeasured to fair value with changes in fair value recognised in profit or loss.
If the business combination is achieved in stages, the acquisition date carrying value of the acquirer’s previously

80 / BROWN AND COMPANY PLC
held equity interest in the acquiree is remeasured to fair value at the acquisition date. Any gains or losses arising from such remeasurement are recognised in profit or loss.
3.3 Segment reporting Operating segments are reported in a manner consistent
with the internal reporting provided to the chief operating decision maker.
The Board of Directors of the Company which assesses the financial performance and position of the Group, and makes strategic decisions has been identified as being the chief operating decision maker.
The Group’s reportable segments comprise of Trading, Manufacturing & Construction, Plantation, Investments, Leisure, Real Estate, Health Care and others.
Segment results, assets and liabilities include items directly attributable to a segment as well as those that can be allocated on a reasonable basis. Segment capital expenditure is the total cost incurred during the period to acquire segment assets that are expected to be used for more than one period.
Expenses that cannot be directly identified to a particular segment are allocated on bases decided by the management and applied consistently throughout the year.
3.4 Revenue from Contracts with Customers 3.4.1 Sale of goods - wholesale The Group imports / manufactures and sells a range of
products in the wholesale market. Sales are recognised when control of the products has transferred, being when the products are delivered to the wholesaler / dealer, the wholesaler / dealer has full discretion over the channel and price to sell the products, and there is no unfulfilled obligation that could affect the wholesaler’s / dealer’s acceptance of the products. Delivery occurs when the products have been shipped to the specific location, the risks of obsolescence and loss have been transferred to the wholesaler / dealer, and either the wholesaler / dealer has accepted the products in accordance with the sales contract, the acceptance provisions have lapsed, or the Group has objective evidence that all criteria for acceptance have been satisfied. The Group’s obligation to repair or replace faulty products under the standard warranty terms is recognised as a provision, see note 3.22.1.
A receivable is recognised when the goods are delivered as this is the point in time that the consideration is unconditional because only the passage of time is required before the payment is due.
Payment of the transaction price is due immediately when the customer purchases the products and takes delivery in store.
3.4.2 Sale of goods - retail The Group operates retail stores selling range of
products. Revenue from the sale of goods is recognised when a Group entity sells a product to the customer.
Payment of the transaction price is due immediately when the customer purchases the products and takes delivery in store. The Group’s obligation to repair or replace faulty products under the standard warranty terms is recognised as a provision, see note 3.22.1.
3.4.3 Sale of services Revenue from providing services is recognised in the
accounting period in which the services are rendered. All revenues are recognised on an accrual basis over the time duration of the providing of the services to the customer. Payment of the transaction price is due immediately when the customer receives the services.
3.4.4 Construction contracts Revenue from construction-related contracts is
recognised upon satisfaction of a performance obligation agreed in the contract. At contract inception, the Group determines whether it satisfies the performance obligation over time or at a point in time. The revenue recognition occurs at a point in time when control of the asset is transferred to the customer. For each performance obligation satisfied over time, the Group recognises the revenue over time by measuring the progress towards complete satisfaction of that performance obligation.
The progress is assessed based on surveys of work performed. When the outcome of construction contract can not be estimated reliably, contract revenue is recognised only to the extent of contract costs incurred that are likely to be recoverable.
The Group provides aluminium fabricators, doors and windows design, manufacturing, civil, telecommunication, engineering, installation and support services under fixed-price and variable price contracts. Revenue from providing services is recognised in the accounting period in which the services are rendered. For fixed-price contracts, revenue is recognised based on the actual service provided to the end of the reporting period as a proportion of the total services to be provided because the customer receives and uses the benefits simultaneously. This is determined based on the actual costs spent relative to the total expected costs.
Some contracts include multiple deliverables, such as the sale of products and related installation services. However, the installation is simple, does not include an integration service and could be performed by another party. It is therefore accounted for as a separate performance obligation. Where the contracts include
NOTES TO THE FINANCIAL STATEMENTS

Annual Report 2020/21 / 81
multiple performance obligations, the transaction price will be allocated to each performance obligation based on the stand-alone selling prices. Where these are not directly observable, they are estimated based on expected cost plus margin. If contracts include the installation of products, revenue for the products is recognised at a point in time when the products are delivered, the legal title has passed, and the customer has accepted the products.
Estimates of revenues, costs or extent of progress toward completion are revised if circumstances change. Any resulting increases or decreases in estimated revenues or costs are reflected in profit or loss in the period in which the circumstances that give rise to the revision become known by management.
In case of fixed-price contracts, the customer pays the fixed amount based on a payment schedule. If the services rendered by the Group exceed the payment, a contract asset is recognised. If the payments exceed the services rendered, a contract liability is recognised.
If the contract includes an hourly fee, revenue is recognised in the amount to which the Group has a right to invoice. Customers are invoiced based on actual services provided and consideration is payable when invoiced.
3.4.5 Hotel Operations Apartment revenue is recognised for the rooms occupied
on a daily basis. All revenues are recognised on an accrual basis over the time of the duration of the stay of the customer and matched with the related expenditure where they simultaneously receive and consumes the benefits of the services rendered.
Restaurant revenue includes the revenue recognized on the sale food and beverage. All revenue is accounted for at the time of sale.
Bar revenue are accounted for at the time of sale.
Spa is operated by a third party and invoices are raised together with the spa bills. Spa related revenue is recognized gross after completion of service/treatments.
Transfers and excursions include the consideration earned from providing excursions to customers. Revenue is recognised for at the time of rendering the service.
Telephone, laundry, and diving represents the services provided to customers which are implied as business practice in the industry. All revenue is recognised for at the time of rendering the service.
3.4.6 Sale of live timber trees and rubber trees Revenue from the sale of live timber trees and Rubber
trees is recognised at the point that the legal ownership, risk of loss and the rewards have been passed to the purchaser and the quantity sold is determinable. Revenue on harvesting of live timber trees and Rubber trees is recognised when the purchaser acquires the right to harvest specified no of trees on a tract of land, at an agreed-to price by entering into a contractual agreement at which point the risk and rewards are transferred. Those revenue are deducted from the relevant biological assets to arrive at gain/ (loss) on valuation in statement of profit or loss.
Payment of the sale of the timber trees is due at the time of entering an agreement with the customer for the sale of timber.
3.4.7 Energy Supplied Revenue from energy supplied is recognised upon
delivery of energy. Delivery of electrical energy shall be completed when electrical energy meets the specifications as set out in Power Purchase Agreements (PPA) is received at the metering point.
Payment for the energy supplied is due when invoiced on a monthly basis.
3.4.8 Commission income When the Group acts in the capacity of an agent
rather than the principal in a transaction, the revenue recognition is the net amount of commission earned by the Group.
Payment of the commission price is due when invoiced on pre-agreed terms.
3.4.9 Other Income Rent income is accounted for on accrual basis.
Dividend income is recognized when the right to receive payment is established.
Interest income is recognized in profit or loss as it accrues, using the effective interest method.
Gain on disposal of property, plant and equipment and other non-current assets, including investments held by the Group have been accounted for in the Statement of profit or loss, after deducting from the net sales proceeds on disposal of the carrying amount of such assets.
3.4.10 Financing components The Group does not expect to have any contracts where
the period between the transfer of the promised goods or services to the customer and payment by the customer

82 / BROWN AND COMPANY PLC
exceeds one year. As a consequence, the Group does not adjust any of the transaction prices for the time value of money.
3.5 Government grants and subsidies Government grants are recognized where there is
reasonable assurance that the grant will be received and all attached conditions will be compiled with. When the grant relates to an expense item, it is recognized as income over the period necessary to match the grant on a systematic basis to the costs that it is intended to compensate. Where the grant relates to an asset, it is recognized as deferred income and released to income in equal amounts over the expected useful life of the related asset.
Where the Company receives non-monetary grants, the asset and the grant are recorded gross at nominal amounts and released to the Profit or loss over the expected useful life and pattern of consumption of the benefit of the underlying asset by equal annual instalments.
Where loans or similar assistance are provided by governments or related institutions with an interest rate below the current applicable market rate, the effect of this favourable interest is regarded as additional government grant.
Grants related to property, plant and equipment and bearer biological assets are initially deferred and allocated to the Profit or loss on a systematic basis over the useful life of the related property, plant and equipment.
Revenue grants are recognized in the profit or loss in the period in which they are receivable.
3.6 Expenses recognition Expenses are recognized in the statement of profit or
loss on the basis of a direct association between the cost incurred and the earning of specific items of income. All expenditure incurred in the running of the business and in maintaining the property, plant and equipment in a state of efficiency has been charged to income in arriving at the profit for the year.
For the presentation of the statement of profit or loss the Directors are of the opinion that the function of the expenses method present fairly the elements of the Group’s performance, and hence such a presentation method is adopted.
Preliminary and pre-operational expenditure is recognized in the statement of profit or loss.
Repairs and renewals are charged to the Statement of profit or loss in the year in which the expenditure is incurred.
3.7 Income tax The income tax expense or credit for the period is the tax
payable on the current period’s taxable income based on the applicable income tax rate for each jurisdiction adjusted by changes in deferred tax assets and liabilities attributable to temporary differences and to unused tax losses.
The current income tax charge is calculated on the basis of the tax laws enacted or substantively enacted at the end of the reporting period in the countries where the Company and its subsidiaries and associates operate and generate taxable income. Management periodically evaluates positions taken in tax returns with respect to situations in which applicable tax regulation is subject to interpretation. It establishes provisions where appropriate on the basis of amounts expected to be paid to the tax authorities.
Deferred income tax is provided in full, using the liability method, on temporary differences arising between the tax bases of assets and liabilities and their carrying amounts in the consolidated financial statements. However, deferred tax liabilities are not recognised if they arise from the initial recognition of goodwill. Deferred income tax is also not accounted for if it arises from initial recognition of an asset or liability in a transaction other than a business combination that at the time of the transaction affects neither accounting nor taxable profit or loss. Deferred income tax is determined using tax rates (and laws) that have been enacted or substantially enacted by the end of the reporting period and are expected to apply when the related deferred income tax asset is realised or the deferred income tax liability is settled.
The deferred tax liability in relation to investment property that is measured at fair value is determined assuming the property will be recovered entirely through sale.
Deferred tax assets are recognised only if it is probable that future taxable amounts will be available to utilise those temporary differences and losses.
Deferred tax liabilities and assets are not recognised for temporary differences between the carrying amount and tax bases of investments in foreign operations where the company is able to control the timing of the reversal of the temporary differences and it is probable that the differences will not reverse in the foreseeable future.
Deferred tax assets and liabilities are offset when there is a legally enforceable right to offset current tax assets and liabilities and when the deferred tax balances relate to the same taxation authority. Current tax assets and tax liabilities are offset where the entity has a legally enforceable right to offset and intends either to settle on a net basis, or to realise the asset and settle the liability simultaneously.
NOTES TO THE FINANCIAL STATEMENTS

Annual Report 2020/21 / 83
Current and deferred tax is recognised in profit or loss, except to the extent that it relates to items recognised in statement of comprehensive income or directly in equity. In this case, the tax is also recognised in other comprehensive income or directly in equity, respectively.
Companies enjoying tax holidays Group companies enjoying a tax exemption period shall
only recognize deferred tax in their financial statements for temporary differences, where reversals of such differences extend beyond the tax exemption period.
Deferred Tax shall not be considered nor provided for assets / liabilities for which tax impacts and reversals take place within the tax exemption period. If there will be no tax implications that take place after the expiration of the tax exemption period for such assets.
Where a Company is entitled to claim the total value or any part of expenditure made during the tax holiday period, as deductions for tax purposes after the tax holiday period, such an entity will treat such amount of expenditure as part of the tax base throughout the tax holiday period in the purpose of recognizing deferred tax.
3.8 Property, plant and equipment 3.8.1 Freehold property, plant and equipmenti) Basis of recognition Property, plant and equipment are recognized if it is
probable that future economic benefits associated with the assets will flow to the Group and cost of the asset can be reliably measured.
ii) Basis of measurement Items of property, plant and equipment other than
freehold land and building, are measured at cost less accumulated depreciation and any impairment losses.
Cost includes expenditure that is directly attributable to the acquisition of the asset. The cost of self-constructed assets includes the cost of materials and direct labour, any other costs directly attributable to bringing the assets to a working condition for their intended use, the costs of dismantling and removing the items and restoring the site at which they are located and capitalized borrowing costs.
When parts of an item of property, plant and equipment have different useful lives, they are accounted for as separate items of property, plant and equipment.
iii) Cost model The Group applies the cost model to all property, plant
and equipment except freehold land and buildings which are recorded at cost of purchase together with
any incidental expenses thereon less accumulated depreciation and any accumulated impairment losses.
iv) Revaluation model The Group revalues its freehold land and buildings which
are measured at its fair value at the date of revaluation less any subsequent accumulated depreciation and any accumulated impairment losses. Revaluations are made with sufficient regularity to ensure that the carrying amount does not differ materially from that which would be determined using fair value at the reporting date.
On revaluation of land and buildings, any increase in the revaluation amount is credited to the revaluation reserve in shareholder’s equity unless it offsets a previous decrease in value of the same asset that was recognized in profit or loss. A decrease in value is recognized in profit or loss where it exceeds the increase previously recognized in the revaluation reserve. Upon disposal, any related revaluation reserve is transferred from the revaluation reserve to retained earnings and is not taken into account in arriving at the gain or loss on disposal.
v) Subsequent costs The cost of replacing part of an item of property, plant
and equipment is recognized in the carrying amount of the item if it is probable that the future economic benefits embodied within the part will flow to the Group and its cost can be measured reliably. The carrying amount of the replaced part is de-recognized. The costs of the day-to-day servicing of property, plant and equipment are expensed as incurred.
vi) Depreciation Depreciation is based on the cost / revalued amount of
an asset less its residual value. Significant components of individual assets are assessed and if a component has a useful life that is different from the remainder of that asset, that component is depreciated separately.
Depreciation is recognized in profit or loss on a straight-line basis over the estimated useful life of each component of an item of property, plant and equipment. Land is not depreciated.
Depreciation of an asset begins when it is available for use and ceases at the earlier of the date that the asset is classified as held for sale and the date that the asset is de-recognized.
Depreciation methods, useful lives, residual values are assessed at the reporting date and adjusted if appropriate.

84 / BROWN AND COMPANY PLC
vii) De-recognition An item of property, plant and equipment is de-recognized
upon disposal or when no future economic benefits are expected from its use or disposal.
The gain or loss on disposal of an item of property, plant and equipment is determined by comparing the proceeds from disposal with the carrying amount of the property, plant and equipment, and is recognized net within other income/other expenses in the Statement of profit or loss. When revalued assets are sold, the amounts included in the revaluation surplus reserve are transferred to retained earnings.
3.9 Capital work-in progress Capital work-in-progress is stated at cost. These are
expenses of a capital nature directly incurred in the construction of capital assets.
3.10 Investment properties 3.10.1 Basis of recognition Investment property is a property held either to earn
rental income or for capital appreciation or for both, but not for sale in the ordinary course of business, use in the production or supply of goods or services or for administrative purposes.
3.10.2 Basis of measurementi) Fair value model Investment properties are initially recognized at cost.
Subsequent to initial recognition the investment properties are stated at fair values, which reflect market conditions at the reporting date. Gains or losses arising from changes in fair value are included in profit or loss in the year in which they arise.
NOTES TO THE FINANCIAL STATEMENTS
The estimated useful lives for the current year are listed below.
Property, Plant & Equipment No. of years range Rate range
Building 20-60 Years 2% to 5%
Plant and Machinery 5-30 Years 3.33% to 20%
Motor Vehicles 1-15 Years 6.66% to 100%
Furniture and Office Equipment 5-20 Years 5% to 20%
Ergonomic Equipment 25 Years 4%
Land Preparation/Land Improvements 20-30 Years 3%-5%
Sugar Cane Roots 20 Years 20%
Pivots and Pump Stations in Plantations 5-25 Years 4% to 20%
Water, Sanitation and Others 20 Years 5%
Roads and Bridges 50 Years 2%
Penstock Pipeline 20 Years 5%
Security Fences 3 Years 33.33%
Air Conditioners 5 Years 20%
Generator 8 Years 12.5%
Cutlery, Crockery and Glassware 2-5 Years 20%
Linen 3 Years 33.33%
Sewage System 20 Years 5%
Solar Power Plant 10 - 20 Years 5-10%
Surge Arrestors 33 kv 20 Years 5%
The cost of areas coming into bearing are transferred to mature plantations and depreciated as follows.
Bearer Biological Assets No. of years range Rate range
Tea 30 to 33 1/3 years 3% to 3.33%
Mixed/Other Crops 10 to 15 years 6.66% to 10%

Annual Report 2020/21 / 85
Where Group companies occupy a significant portion of the investment property of a subsidiary, such investment properties are treated as property, plant and equipment in the consolidated financial statements, and accounted for as per LKAS 16 - Property, Plant and Equipment.
ii) De-recognition Investment properties are de-recognized when either they
have been disposed of or when the investment property is permanently withdrawn from use and no future economic benefit is expected from its disposal. Any gains or losses on the retirement or disposal of an investment property are recognized in profit or loss in the year of retirement or disposal.
iii) Subsequent transfers to / from investment property Transfers are made to investment property when, and
only when, there is a change in use, evidenced by the end of owner occupation, commencement of an operating lease to another party or completion of construction or development.
For a transfer from investment property to owner occupied property or inventories, the deemed cost of property for subsequent accounting is its fair value at the date of change in use. If the property occupied by the Group as an owner occupied property becomes an investment property, the Group, accounts for such property in accordance with the policy stated under property, plant and equipment up to the date of change in use.
iv) Determining Fair Value External and independent valuers, having appropriate
recognized professional qualifications and recent experience in the location and category of property being valued, values the investment property portfolio every year.
The fair values are based on market values, being the estimated amount for which a property could be exchanged on the date of the valuation between a willing buyer and a willing seller in an arm’s length transaction after proper marketing wherein the parties had each acted knowledgeably.
3.11 Leases The Group leases various offices, warehouses, equipment
and vehicles.
Contracts may contain both lease and non-lease components. The Group allocates the consideration in the contract to the lease and non-lease components based on their relative stand-alone prices. However, for leases of real estate for which the Group is a lessee, it has elected not to separate lease and non-lease components and instead accounts for these as a single lease component.
Lease terms are negotiated on an individual basis and contain a wide range of different terms and conditions. The lease agreements do not impose any covenants other than the security interests in the leased assets that are held by the lessor. Leased assets may not be used as security for borrowing purposes.
Assets and liabilities arising from a lease are initially measured on a present value basis. Lease liabilities include the net present value of the following lease payments:
fixed payments (including in-substance fixed payments), less any lease incentives receivable
Lease payments to be made under reasonably certain extension options are also included in the measurement of the liability.
The lease payments are discounted using the interest rate implicit in the lease. If that rate cannot be readily determined, which is generally the case for leases in the Group, the lessee’s incremental borrowing rate is used, being the rate that the individual lessee would have to pay to borrow the funds necessary to obtain an asset of similar value to the right-of-use asset in a similar economic environment with similar terms, security and conditions.
To determine the incremental borrowing rate, the Group:
where possible, uses recent third-party financing received by the individual lessee as a starting point, adjusted to reflect changes in financing conditions since third party financing was received;
uses a build-up approach that starts with a risk-free interest rate adjusted for credit risk for leases held by the Group, which does not have recent third-party financing; and
makes adjustments specific to the lease, e.g. term, country, currency and security.
Lease payments are allocated between principal and finance cost. The finance cost is charged to profit or loss over the lease period so as to produce a constant periodic rate of interest on the remaining balance of the liability for each period.
Right-of-use assets are measured at cost comprising the following:
the amount of the initial measurement of lease liability;
any lease payments made at or before the commencement date less any lease incentives received;
any initial direct costs; and
restoration costs.

86 / BROWN AND COMPANY PLC
Right-of-use assets are generally depreciated over the shorter of the asset’s useful life and the lease term on a straight-line basis. While the Group revalues its land and buildings that are presented within property, plant and equipment, it has chosen not to do so for the right-of-use buildings held by the Group.
Payments associated with short-term leases of equipment and vehicles and all leases of low-value assets are recognised on a straight-line basis as an expense in profit or loss. Short-term leases are leases with a lease term of 12 months or less. Low-value assets comprise IT equipment and small items of office furniture.
The Company/Group has voluntarily changed the accounting policy on Right-Of-Use Assets relating to Lands which meets the definition of a property, plant and equipment from cost model to revaluation model with effect from 1 October 2020, by carrying out a valuation by an independent valuer who holds a recognised and relevant professional qualification and has recent experience in the location and category of the lands being valued. This is done to provide reliable and more relevant information. These assets are presented under property, plant and equipment in the statement of financial position.
3.11.1 Permanent land development costs Permanent land development costs are those costs
incurred making significant infrastructure development and building new access roads on leasehold lands.
These costs have been capitalized and amortised over the remaining lease period.
Permanent impairments to land development costs are charged to the Profit or loss in full or reduced to the net carrying amounts of such assets in the year of occurrence after ascertaining the loss.
3.12 Intangible assets 3.12.1 Goodwill Goodwill is measured as described in note (3.2.6).
Goodwill on acquisitions of subsidiaries is included in intangible assets. Goodwill is not amortised but it is tested for impairment annually, or more frequently if events or changes in circumstances indicate that it might be impaired, and is carried at cost less accumulated impairment losses. Gains and losses on the disposal of an entity include the carrying amount of goodwill relating to the entity sold.
Goodwill is allocated to cash-generating units for the purpose of impairment testing. The allocation is made to those cash-generating units or groups of cash-generating units that are expected to benefit from the business combination in which the goodwill arose. The units or
groups of units are identified at the lowest level at which goodwill is monitored for internal management purposes, being the operating segments.
3.12.2 Right to Generate Solar Power Separately acquired Right to Generate Solar Power are
shown at historical cost. They have a finite useful life and are subsequently carried at cost less accumulated amortisation and impairment losses.
3.12.3 Software Costs associated with maintaining software programmes
are recognised as an expense as incurred. Development costs that are directly attributable to the design and testing of identifiable and unique software products controlled by the Group are recognised as intangible assets when the following criteria are met:
it is technically feasible to complete the software so that it will be available for use;
management intends to complete the software and use or sell it;
there is an ability to use or sell the software;
it can be demonstrated how the software will generate probable future economic benefits;
adequate technical, financial and other resources to complete the development and to use or sell the software are available; and
the expenditure attributable to the software during its development can be reliably measured.
Directly attributable costs that are capitalised as part of the software include employee costs and an appropriate portion of relevant overheads.
Capitalised development costs are recorded as intangible assets and amortised from the point at which the asset is ready for use.
3.12.4 Subsequent expenditure Subsequent expenditure on intangible assets is
capitalized only when it increases the future economic benefits embodied by these assets. All other expenditure is expensed when incurred.
3.12.5 De-recognition Intangible assets are de-recognized on disposal or when
no future economic benefits are expected from its use. The gain or loss arising from de-recognition of intangible assets are measured as the difference between the net disposal proceeds and the carrying amount of the asset.
3.12.6 Amortization Amortization is recognized in profit or loss on a straight-
line basis over the estimated useful lives of intangible
NOTES TO THE FINANCIAL STATEMENTS

Annual Report 2020/21 / 87
assets, other than goodwill, from the date that they are available for use.
The estimated useful life of each intangible asset is as follows;
Computer Software 3 - 8 years
Right to Generate Solar Power 20 years
Amortization methods, useful lives and residual values are reviewed at each reporting date and adjusted if appropriate.
3.13 Impairment of assets Goodwill and intangible assets that have an indefinite
useful life are not subject to amortisation and are tested annually for impairment, or more frequently if events or changes in circumstances indicate that they might be impaired. Other assets are tested for impairment whenever events or changes in circumstances indicate that the carrying amount may not be recoverable. An impairment loss is recognised for the amount by which the asset’s carrying amount exceeds its recoverable amount. The recoverable amount is the higher of an asset’s fair value less costs of disposal and value in use. For the purposes of assessing impairment, assets are grouped at the lowest levels for which there are separately identifiable cash inflows which are largely independent of the cash inflows from other assets or groups of assets (cash-generating units). Non-financial assets other than goodwill that suffered an impairment are reviewed for possible reversal of the impairment at the end of each reporting period.
3.14 Biological assets Biological assets are classified in to mature biological
assets and immature biological assets. Mature biological assets are those that have attained harvestable specifications or are able to sustain regular harvests. Immature biological assets are those that have not yet attained harvestable specifications. Tea, rubber, standing sugar cane, commercial grass, other plantations and nurseries are classified as biological assets.
Biological assets are further classified as bearer biological assets and consumable biological assets. Bearer biological asset includes tea and rubber trees, those that are not intended to be sold or harvested, however used to grow for harvesting agricultural produce from such biological assets. Consumable biological assets include managed timber trees those that are to be harvested as agricultural produce or sold as biological assets.
The entity recognize the biological assets when, and only when, the entity controls the assets as a result of past event, it is probable that future economic benefits
associated with the assets will flow to the entity and the fair value or cost of the assets can be measured reliably.
3.14.1 Bearer biological assets The cost of land preparation, rehabilitation, new planting,
replanting, crop diversification, inter-planting and fertilizing, etc., incurred between the time of planting and harvesting (when the planted area attains maturity), are classified as immature plantations. These immature plantations are shown at direct costs plus attributable overheads, including interest attributable to long-term loans used for financing immature plantations. The expenditure incurred on bearer plants (Tea, Rubber & Coconut fields), which come into bearing during the year, has been transferred to mature bearer biological assets and depreciated over their useful life in accordance with the LKAS16 – Property, Plant and Equipment.
i) Agricultural produce attached to bearer biological assets The fair value of produce growing on trees prior to year
end is classified as agricultural produce attached to bearer biological assets. Such agricultural produce prior to harvest continues to be in the scope of LKAS 41 - Agriculture and measured at fair value less cost to sell.
When deriving the estimated quantity, the Group limits to one harvesting cycle and measured based on the last day of the harvest in the immediately preceding cycle.
In order to ascertain the fair value of produce growing on trees, 50% of estimated crop in that harvesting cycle is used for the valuation as follows,
Tea - 3 days crop (50% of 6 days Cycle)
Rubber 1 day Crop (50% of 2 days Cycle)
Coconut 1 months (50% of 2 months Cycle)
For the valuation of the produce it was agreed to use the farm gate price of the produce adjusted for the cost of harvest. Hence market value on the crop in the bush should be based on the selling value of agricultural produce adjusted for the cost of harvesting and transport.
Tea - Bought Leaf rate (current month) less cost of harvesting & transport
Rubber - latex Price (95% of current RSS1 Price) less cost of tapping & transport
Further it was not considered the risk adjustments for weather and other factors of the plant in to biological transformation in the valuation.
ii) Immature and Mature Plantations The cost of replanting and new planting are classified as
immature plantations up to the time of being ready for harvesting.

88 / BROWN AND COMPANY PLC
Further, the general charges incurred on the plantation are apportioned based on the labour days spent on respective replanting and new planting areas and capitalized on the immature areas. The remaining portion of the general charges is expensed in the accounting period in which it is incurred.
The cost of areas coming into bearing is transferred to mature plantations at end of the financial year.
iii) Growing Crop Nurseries Nursery cost includes the cost of direct materials,
direct labour and an appropriate proportion of directly attributable overheads.
iv) Infilling Costs on Bearer Biological Assets The land development costs incurred in the form of
infilling have been capitalized to the relevant mature field, only where the number of plants per hectare exceeded 3,000 plants and, also if it increases the expected future benefits from that field, beyond its pre-infilling standard of performance assessment. Infilling costs so capitalized are depreciated over the newly assessed remaining useful life of the relevant mature plantation or the unexpired lease period, whichever is lower.
Infilling cost that are not capitalized have been charged to the Profit or loss for the year in which they are incurred.
v) Amortization The cost of areas coming into bearing are transferred to
mature plantations and depreciated as follows.
Bearer Biological Assets (Mature Plantations) at Cost - Replanting and New Planting.
Category No. of Years
Tea 30 Years
Rubber 20 Years
Coconut 50 Years
Cinnamon 30 Years
Other Crops 15 – 30 Years
No amortization is provided for immature plantations.
3.14.2 Consumable Biological Assets Consumable biological assets include managed timber
trees that are to be harvested as agricultural produce or sold as biological assets.
The managed timber trees of the Group are measured on initial recognition and at the end of each reporting period at its fair value less costs to sell in terms of LKAS 41 – Agriculture. The cost of young plants which are below 4 years is treated as an approximation to the fair value as
the impact on biological transformation of such plants to price during the period is immaterial. All assumptions and sensitivity analysis are given in note 16.
Nursery cost includes the cost of direct materials, direct labour and an appropriate proportion of directly attributable overheads, less provision for overgrown plants.
The gain or loss arising on initial recognition of biological assets at fair value less cost to sell and from a change in fair value less cost to sell of biological assets are included in the profit or loss for the period in which it arises.
3.15 Investments and other financial assets and liabilities
3.15.1 Investments and other financial assets(i) Classification The Group classifies its financial assets in the following
measurement categories:
those to be measured subsequently at fair value (either through OCI or through profit or loss); and
those to be measured at amortised cost.
The classification depends on the entity’s business model for managing the financial assets and the contractual terms of the cash flows.
For assets measured at fair value, gains and losses will either be recorded in profit or loss or OCI. For investments in equity instruments that are not held for trading, this will depend on whether the Group has made an irrevocable election at the time of initial recognition to account for the equity investment at fair value through other comprehensive income (FVOCI).
The Group reclassifies debt investments when and only when its business model for managing those assets changes.
(ii) Recognition and derecognition Regular way purchases and sales of financial assets are
recognised on trade-date, the date on which the Group commits to purchase or sell the asset. Financial assets are derecognised when the rights to receive cash flows from the financial assets have expired or have been transferred and the Group has transferred substantially all the risks and rewards of ownership.
(iii) Measurement At initial recognition, the Group measures a financial
asset at its fair value plus, in the case of a financial asset not at fair value through profit or loss (FVPL), transaction costs that are directly attributable to the acquisition of the financial asset. Transaction costs of financial assets carried at FVPL are expensed in profit or loss.
NOTES TO THE FINANCIAL STATEMENTS

Annual Report 2020/21 / 89
Financial assets with embedded derivatives are considered in their entirety when determining whether their cash flows are solely payment of principal and interest.
Debt instruments Subsequent measurement of debt instruments depends
on the Group’s business model for managing the asset and the cash flow characteristics of the asset. There are three measurement categories into which the Group classifies its debt instruments:
Amortised cost: Assets that are held for collection of contractual cash flows where those cash flows represent solely payments of principal and interest are measured at amortised cost. Interest income from these financial assets is included in finance income using the effective interest rate method. Any gain or loss arising on derecognition is recognised directly in profit or loss and presented in other gains/(losses) together with foreign exchange gains and losses. Impairment losses are presented as separate line item in the statement of profit or loss.
FVOCI: Assets that are held for collection of contractual cash flows and for selling the financial assets, where the assets’ cash flows represent solely payments of principal and interest, are measured at FVOCI. Movements in the carrying amount are taken through OCI, except for the recognition of impairment gains or losses, interest income and foreign exchange gains and losses which are recognised in profit or loss. When the financial asset is derecognised, the cumulative gain or loss previously recognised in OCI is reclassified from equity to profit or loss and recognised in other gains/(losses). Interest income from these financial assets is included in finance income using the effective interest rate method. Foreign exchange gains and losses are presented in other gains/(losses) and impairment expenses are presented as separate line item in the statement of profit or loss.
FVPL: Assets that do not meet the criteria for amortised cost or FVOCI are measured at FVPL. A gain or loss on a debt investment that is subsequently measured at FVPL is recognised in profit or loss and presented net within other gains/(losses) in the period in which it arises.
Equity instruments The Group subsequently measures all equity investments
at fair value. Where the Group’s management has elected to present fair value gains and losses on equity investments in OCI, there is no subsequent reclassification of fair value gains and losses to profit or loss following the derecognition of the investment. Dividends from such investments continue to be
recognised in profit or loss as other income when the Group’s right to receive payments is established.
Changes in the fair value of financial assets at FVPL are recognised in other income/ (expenses) in the statement of profit or loss as applicable. Impairment losses (and reversal of impairment losses) on equity investments measured at FVOCI are not reported separately from other changes in fair value.
(iv) Impairment The Group assesses on a forward looking basis
the expected credit losses associated with its debt instruments carried at amortised cost and FVOCI. The impairment methodology applied depends on whether there has been a significant increase in credit risk.
For trade receivables, the Group applies the simplified approach permitted by SLFRS 9, which requires expected lifetime losses to be recognised from initial recognition of the receivables.
3.15.2 Non-derivative financial liabilitiesi) Other financial Liabilities All financial liabilities other than those at fair value
through profit and loss are classified as other financial liabilities.
All other financial liabilities are recognised initially at fair value plus directly attributable transaction costs. Subsequent to initial recognition these financial liabilities are measured at amortised cost using the effective interest rate method. The financial liabilities include trade and other payables, bank overdrafts, loans and borrowings.
Bank overdrafts that are repayable on demand and form an integral part of the Group’s cash management are included as a component of cash and cash equivalents for the purpose of the statement of cash flows.
Subsequent to initial recognition, these financial liabilities are measured at amortised cost using the effective interest method.
ii) Derecognition of financial liabilities The Group derecognises a financial liability when its
contractual obligations are discharged, cancelled or expired.
3.15.3 Offsetting of financial instruments Financial assets and financial liabilities are offset and the
net amount reported in the statement of financial position if, and only if, there is a currently enforceable legal right to offset the recognised amounts and there is an intention to settle on a net basis, or to realise the assets and settle the liabilities simultaneously.

90 / BROWN AND COMPANY PLC
3.16 Inventories Raw materials, work in progress and finished goods
are stated at the lower of cost and net realisable value. Cost comprises direct materials, direct labour and an appropriate proportion of variable and fixed overhead expenditure, the latter being allocated on the basis of normal operating capacity. Costs are assigned to individual items of inventory on the basis of weighted average costs. Costs of purchased inventory are determined after deducting rebates and discounts. Net realisable value is the estimated selling price in the ordinary course of business less the estimated costs of completion and the estimated costs necessary to make the sale.
The cost incurred in bringing inventories to its present location and condition is accounted using the following cost formula:
Agricultural Produce Harvested from Biological Assets
Agricultural produce harvested from the Group’s biological assets is measured at its fair value less cost to sell at the point of harvest. Such measurement is deemed to be the cost at the time of transferring the harvested crop to inventories.
Finished goods manufactured from agricultural produce of biological assets
These are valued at the lower of cost and estimated net realizable value, after making due allowance for obsolete and slow moving items.
Input Material, Spares and Consumables At actual cost on weighted average basis.
Finished Goods First In First Out (FIFO) basis.
Food and Beverages Weighted average cost basis.
3.17 Trade receivables Trade receivables are recognised initially at fair value
and subsequently measured at amortised cost using the effective interest method, less loss allowance.
Trade receivables are amounts due from customers for goods sold or services performed in the ordinary course of business. They are generally due for settlement within 180 days and therefore are all classified as current. Trade receivables are recognised initially at the amount of consideration that is unconditional unless they contain significant financing components, when they are recognised at fair value. The Group holds the trade receivables with the objective to collect the contractual cash flows and therefore measures them subsequently at amortised cost using the effective interest method.
The Group applies the SLFRS 9 simplified approach to measuring expected credit losses which uses a lifetime
expected loss allowance for all trade receivables and contract assets.
To measure the expected credit losses, trade receivables and contract assets have been grouped based on shared credit risk characteristics and the days past due. The contract assets relate to unbilled work in progress and have substantially the same risk characteristics as the trade receivables for the same types of contracts. The Group has therefore concluded that the expected loss rates for trade receivables are a reasonable approximation of the loss rates for the contract assets.
The expected loss rates are based on the payment profiles of sales over a period of 36 month before 31 March 2021 and the corresponding historical credit losses experienced within this period. The historical loss rates are adjusted to reflect current and forward-looking information on macroeconomic factors affecting the ability of the customers to settle the receivables.
Trade receivables and contract assets are written off when there is no reasonable expectation of recovery. Indicators that there is no reasonable expectation of recovery include, amongst others, the failure of a debtor to engage in a repayment plan with the Group, and a failure to make contractual payments according an agreed repayment plan with the Group.
Impairment losses on trade receivables and contract assets are presented as net impairment losses within operating profit. Subsequent recoveries of amounts previously written off are credited against the same line item.
3.18 Cash and cash equivalents For the purpose of presentation in the statement of
cash flows, cash and cash equivalents includes cash on hand, deposits held at call with financial institutions, other short-term, highly liquid investments with original maturities of three months or less that are readily convertible to known amounts of cash and which are subject to an insignificant risk of changes in value, and bank overdrafts. Bank overdrafts are shown within borrowings in current liabilities in the statement of financial position.
3.19 Trade and other payables Trade and other payables represent liabilities for
goods and services provided to the Group prior to the end of financial year which are unpaid. The amounts are unsecured and are usually paid within 90 days of recognition. Trade and other payables are presented as current liabilities unless payment is not due within 12 months after the reporting period. They are recognised initially at their fair value and subsequently measured at amortised cost using the effective interest method.
NOTES TO THE FINANCIAL STATEMENTS

Annual Report 2020/21 / 91
3.20 Borrowings Borrowings are initially recognised at fair value, net of
transaction costs incurred. Borrowings are subsequently measured at amortised cost. Any difference between the proceeds (net of transaction costs) and the redemption amount is recognised in profit or loss over the period of the borrowings using the effective interest method. Fees paid on the establishment of loan facilities are recognised as transaction costs of the loan to the extent that it is probable that some or all of the facility will be drawn down. In this case, the fee is deferred until the draw down occurs. To the extent there is no evidence that it is probable that some or all of the facility will be drawn down, the fee is capitalised as a prepayment for liquidity services and amortised over the period of the facility to which it relates.
Borrowings are removed from the statement of financial position when the obligation specified in the contract is discharged, cancelled or expired. The difference between the carrying amount of a financial liability that has been extinguished or transferred to another party and the consideration paid, including any non-cash assets transferred or liabilities assumed, is recognised in profit or loss as other income or finance costs.
Where the terms of a financial liability are renegotiated and the entity issues equity instruments to a creditor to extinguish all or part of the liability (debt for equity swap), a gain or loss is recognised in profit or loss, which is measured as the difference between the carrying amount of the financial liability and the fair value of the equity instruments issued.
Borrowings are classified as current liabilities unless the Group has an unconditional right to defer settlement of the liability for at least 12 months after the reporting period.
3.21 Borrowing costs General and specific borrowing costs that are directly
attributable to the acquisition, construction or production of a qualifying asset are capitalised during the period of time that is required to complete and prepare the asset for its intended use or sale. Qualifying assets are assets that necessarily take a substantial period of time to get ready for their intended use or sale.
Investment income earned on the temporary investment of specific borrowings pending their expenditure on qualifying assets is deducted from the borrowing costs eligible for capitalisation.
Other borrowing costs are expensed in the period in which they are incurred.
3.22 Provisions Provisions for legal claims, service warranties and make
good obligations are recognised when the Group has a present legal or constructive obligation as a result of past events, it is probable that an outflow of resources will be required to settle the obligation and the amount can be reliably estimated. Provisions are not recognised for future operating losses.
Where there are a number of similar obligations, the likelihood that an outflow will be required in settlement is determined by considering the class of obligations as a whole. A provision is recognised even if the likelihood of an outflow with respect to any one item included in the same class of obligations may be small.
Provisions are measured at the present value of management’s best estimate of the expenditure required to settle the present obligation at the end of the reporting period. The discount rate used to determine the present value is a pre-tax rate that reflects current market assessments of the time value of money and the risks specific to the liability. The increase in the provision due to the passage of time is recognised as interest expense.
3.22.1 Warranties A provision for warranties is recognized when the
underlying products or services are sold. The provision is based on historical warranty data and a weighting of all possible outcomes against their associated probabilities.
3.23 Deferred income 3.23.1 PHDT Lease Rentals Premises at St. Andrew’s Drive in Nuwara Eliya has
been leased out to Plantation Human Development Trust (PHDT) for a period of 20 years commencing from August 2005 at a total lease rental of Rs.10,734,696/-.
Lease Rentals received are deferred and amortised over the lease period commenced from August 2005.
3.23.2 Rain Forest Eco Loge (Private) Limited (RFELL) Value of 6,399,375 Ordinary Shares received by Maturata
Plantations Limited, which is equivalent to 14.5% of the issued Ordinary Shares of RFELL at Rs.10/= each in lieu of releasing the company’s right to use the leasehold land of 488 Hectares in Enselwatte, Deniyaya to RFELL for Eco Tourism Project is deferred and amortised as income to the statement of profit or loss over the unexpired balance lease period.
3.24 Employee benefits3.24.1 Defined contribution plans A Defined Contribution Plan is a post-employment benefit
plan under which an entity pays fixed contributions into a separate entity and will have no legal or constructive obligation to pay further amounts. Obligations for contributions to Defined Contribution Plans are

92 / BROWN AND COMPANY PLC
recognized as an employee benefit expense to profit or loss in the periods during which services are rendered by employees.
i) Employee provident fund and employee trust fund – Sri Lanka
For employees in Sri Lanka the Group contributes a sum not less than 12% of the gross emoluments as provident fund benefits and a sum equivalent 3% of the gross emoluments as trust fund benefits.
ii) Employees pension scheme – Maldives All Maldivian employees of the Group are members of the
retirement pension scheme established in the Maldives. The Group contributes 7% of the pensionable wage of such employees to this scheme.
iii) Voluntary Pension – Sierra Leone The Sierra Leone employees of the Group, makes a
voluntary contribution towards the retirement of its employees at a rate of 5% of employees’ basic salary on a monthly basis. These contributions are kept in a separate fund account and are paid to employees upon their retirement.
3.24.2 Defined benefit plans A defined benefit plan is a post-employment benefit plan
other than a defined contribution plan. The Company’s net obligation in respect of defined benefit pension plans is calculated by estimating the amount of future benefit that employees have earned in return for their service in the current and prior periods; that benefit is discounted to determine its present value. Any unrecognised past service costs are deducted.
The calculation is performed every year by a qualified actuary using the projected unit credit method. For the purpose of determining the charge for any period before the next regular actuarial valuation falls due, an approximate estimate provided by the qualified actuary is used.
The Group recognizes all actuarial gains and losses arising from the defined benefit plan in Statement of Comprehensive Income and all other expenses related to defined benefit plans are recognized in profit loss. The retirement benefit obligation is not externally funded.
3.24.3 Short-term employee benefits Short-term employee benefit obligations are measured
on an undiscounted basis and are expensed as the related service is provided. A liability is recognized for the amount expected to be paid under short-term cash bonus if the company has a present legal or constructive obligation to pay this amount as a result of past service provided by the employee, and the obligation can be estimated reliably.
3.25 Stated capital and equity Ordinary shares are classified as equity.
Incremental costs directly attributable to the issue of new shares or options are shown in equity as a deduction, net of tax, from the proceeds.
3.26 Dividends Provision is made for the amount of any dividend
declared, being appropriately authorised and no longer at the discretion of the entity, on or before the end of the reporting period but not distributed at the end of the reporting period.
3.27 Related party transactions The Group carries out transactions in the ordinary
course of its business with parties who are defined as related parties in LKAS 24 - “Related Party Disclosures”. Disclosure has been made in respect of the related party transactions in which one party has the ability to control or exercise significant influence over the financial and operating policies / decisions of the other, irrespective of whether a price is being charged or not.
3.27.1 Transactions with key management personnel According to LKAS 24 - Related Party Disclosures, Key
Management Personnel, are those having authority and responsibility for planning, directing and controlling the activities of the entity.
3.28 Earnings per share 3.28.1 Basic earnings per share Basic earnings per share is calculated by dividing:
the profit attributable to owners of the company, excluding any costs of servicing equity other than ordinary shares
by the weighted average number of ordinary shares outstanding during the financial year, adjusted for bonus elements in ordinary shares issued during the year.
3.28.2 Diluted earnings per share Diluted earnings per share adjusts the figures used in the
determination of basic earnings per share to take into account:
the after income tax effect of interest and other financing costs associated with dilutive potential ordinary shares, and
the weighted average number of additional ordinary shares that would have been outstanding during the financial year.
3.29 Determination of fair values A number of the Group’s accounting policies and
disclosures require the determination of fair values, for both financial and non-financial assets and liabilities.
NOTES TO THE FINANCIAL STATEMENTS
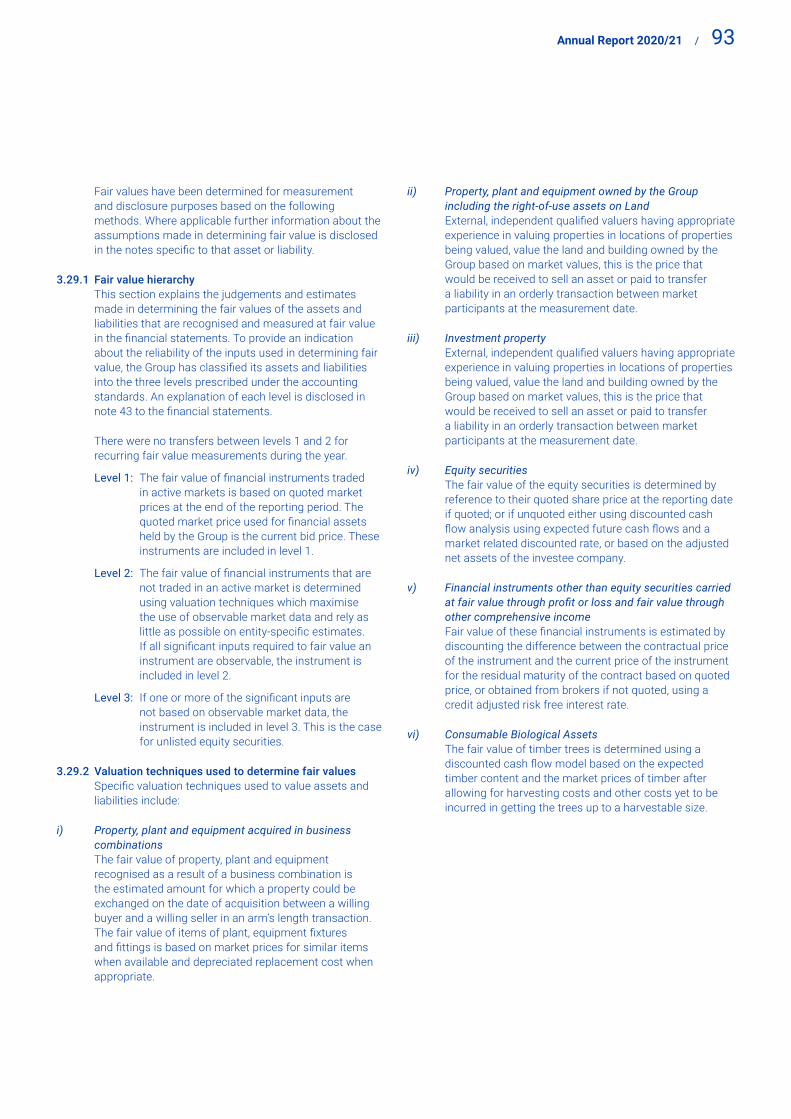
Annual Report 2020/21 / 93
Fair values have been determined for measurement and disclosure purposes based on the following methods. Where applicable further information about the assumptions made in determining fair value is disclosed in the notes specific to that asset or liability.
3.29.1 Fair value hierarchy This section explains the judgements and estimates
made in determining the fair values of the assets and liabilities that are recognised and measured at fair value in the financial statements. To provide an indication about the reliability of the inputs used in determining fair value, the Group has classified its assets and liabilities into the three levels prescribed under the accounting standards. An explanation of each level is disclosed in note 43 to the financial statements.
There were no transfers between levels 1 and 2 for recurring fair value measurements during the year.
Level 1: The fair value of financial instruments traded in active markets is based on quoted market prices at the end of the reporting period. The quoted market price used for financial assets held by the Group is the current bid price. These instruments are included in level 1.
Level 2: The fair value of financial instruments that are not traded in an active market is determined using valuation techniques which maximise the use of observable market data and rely as little as possible on entity-specific estimates. If all significant inputs required to fair value an instrument are observable, the instrument is included in level 2.
Level 3: If one or more of the significant inputs are not based on observable market data, the instrument is included in level 3. This is the case for unlisted equity securities.
3.29.2 Valuation techniques used to determine fair values Specific valuation techniques used to value assets and
liabilities include:
i) Property, plant and equipment acquired in business combinations
The fair value of property, plant and equipment recognised as a result of a business combination is the estimated amount for which a property could be exchanged on the date of acquisition between a willing buyer and a willing seller in an arm’s length transaction. The fair value of items of plant, equipment fixtures and fittings is based on market prices for similar items when available and depreciated replacement cost when appropriate.
ii) Property, plant and equipment owned by the Group including the right-of-use assets on Land
External, independent qualified valuers having appropriate experience in valuing properties in locations of properties being valued, value the land and building owned by the Group based on market values, this is the price that would be received to sell an asset or paid to transfer a liability in an orderly transaction between market participants at the measurement date.
iii) Investment property External, independent qualified valuers having appropriate
experience in valuing properties in locations of properties being valued, value the land and building owned by the Group based on market values, this is the price that would be received to sell an asset or paid to transfer a liability in an orderly transaction between market participants at the measurement date.
iv) Equity securities The fair value of the equity securities is determined by
reference to their quoted share price at the reporting date if quoted; or if unquoted either using discounted cash flow analysis using expected future cash flows and a market related discounted rate, or based on the adjusted net assets of the investee company.
v) Financial instruments other than equity securities carried at fair value through profit or loss and fair value through other comprehensive income
Fair value of these financial instruments is estimated by discounting the difference between the contractual price of the instrument and the current price of the instrument for the residual maturity of the contract based on quoted price, or obtained from brokers if not quoted, using a credit adjusted risk free interest rate.
vi) Consumable Biological Assets The fair value of timber trees is determined using a
discounted cash flow model based on the expected timber content and the market prices of timber after allowing for harvesting costs and other costs yet to be incurred in getting the trees up to a harvestable size.

94 / BROWN AND COMPANY PLC
NOTES TO THE FINANCIAL STATEMENTS
4. REVENUE FROM CONTRACTS WITH CUSTOMERS
Group Company
For the year ended 31st March 2021 2020 2021 2020
Rs.000 Rs.000 Rs.000 Rs.000
Gross Revenue (Note 4.1) 29,391,036 20,438,843 16,451,336 11,343,738
4.1 RevenueManufacturing 451,509 300,879 - -
Trading 20,804,047 13,920,788 16,451,336 11,343,738
Hotelier revenue 1,219,706 1,242,471 - -
Provision of services 2,997,509 2,729,980 - -
Plantation 3,492,828 1,814,104 - -
Renewable Energy 425,437 430,621 - -
Total Revenue 29,391,036 20,438,843 16,451,336 11,343,738
5. OTHER INCOME/(EXPENSES)
Group Company
For the year ended 31st March 2021 2020 2021 2020
Rs.000 Rs.000 Rs.000 Rs.000
Rent Income 163,153 224,508 136,836 153,574
Gain/ (Loss) on Disposal of Property, Plant and Equipment 25,542 48 (1,142) 44
Gain/ (Loss) on Translation of Foreign Currency 151,036 128,559 9,353 25,069
Change in Fair Value of Other Financial Assets 198,935 (433,858) 204,582 (433,478)
Dividend Income 38,389 7,861 34,893 1
Provision Reversal for Inter Company Receivables - - 115,000 -
Provision for Investment in Subsidiaries - - (14,242) -
Gain on Disposal of Bearer Biological assets 27,064 41,511 - -
Impairment Provision on Bearer Biological assets (56,271) (124,979) - -
Miscellaneous Income/ (Expenses) 10,754 329,423 (23,066) 3,736
558,602 173,072 462,214 (251,054)
6. FINANCE INCOME
Group Company
For the year ended 31st March 2021 2020 2021 2020
Rs.000 Rs.000 Rs.000 Rs.000
Interest Income 542,923 420,718 885,548 1,309,898
542,923 420,718 885,548 1,309,898

Annual Report 2020/21 / 95
7. FINANCE COST
Group Company
For the year ended 31st March 2021 2020 2021 2020
Rs.000 Rs.000 Rs.000 Rs.000
Interest on Borrowings (4,969,018) (4,890,290) (1,793,941) (1,923,318)
Interest on Lease Assets (613,507) (528,375) (52,521) (28,487)
(5,582,525) (5,418,665) (1,846,463) (1,951,805)
Net Finance Cost (5,039,602) (4,997,947) (960,915) (641,907)
8. PROFIT/(LOSS) BEFORE TAXATION
Group Company
For the year ended 31st March 2021 2020 2021 2020
Rs.000 Rs.000 Rs.000 Rs.000
Profit/(Loss) before Taxation is stated after charging / (crediting) all expenses / (income) including the following:
Directors’ Emoluments 53,632 52,477 5,716 5,716
Auditors’ Remuneration 23,590 21,184 2,400 2,250
Depreciation on Property, Plant and Equipment 2,109,372 1,563,122 78,504 83,042
Amortisation of Finite Life Intangible Assets 25,364 13,041 2,749 2,618
Provision/ (Reversal of Provision) for Bad and Doubtful Debts (172,667) 309,276 41,085 258,455
Provision/ (Reversal of Provision) for Impairment Losses for Inventories (150,474) 438,759 (98,267) 371,541
Amortisation of Right-of-Use Assets (345,964) (87,139) (54,070) (51,434)
Amortisation of Deferred Income (51,749) (35,170) (45,009) (26,736)
Amortisation of Bearer Biological Assets 355,104 297,940 - -
Salaries and Wages 2,643,534 2,564,232 317,694 343,518
Defined Contribution Plan Cost- EPF and ETF 254,645 266,717 52,212 66,034
Defined Benefit Plan Cost- Retiring Gratuity 177,809 142,354 20,822 19,331

96 / BROWN AND COMPANY PLC
NOTES TO THE FINANCIAL STATEMENTS
9. INCOME TAX EXPENSE The Company and its Subsidiaries operating in Sri Lanka, are liable to taxation at the rate of 24% and 14% in accordance with
the provisions of Inland Revenue Act No. 24 of 2017 and subsequent amendments there to.
Group Company
For the year ended 31st March 2021 2020 2021 2020
Rs.000 Rs.000 Rs.000 Rs.000
9.1 Income Tax ExpenseCurrent Tax Expense
Income Tax on current year profits (Note 9.2) 207,930 90,063 95,080 -
Under/ (Over) Provision in respect of previous years (55,826) 72,216 (49,695) 76,545
Irrecoverable economic service charge 3,180 1,256 - -
155,284 163,535 45,385 76,545
Deferred Tax
Origination and (Reversal) of Temporary Difference (Note 9.4) 406,050 380,695 265,246 137,943
561,334 544,230 310,631 214,487
9.2 Reconciliation of Accounting Profit/(Loss) to Income TaxAccounting Profit/(Loss) before Taxation (2,783,090) (970,441) 2,071,599 1,197,246
Consolidation Adjustments (300,050) (4,803,853) - -
Adjustment on Disallowable Expenses 5,650,527 7,878,167 338,925 1,296,744
Adjustment on Allowable Expenses (1,491,164) (2,322,914) (169,248) (172,277)
Income from Other Sources and Exempt Income (2,212,691) (2,440,558) (785,520) (1,854,107)
Tax Losses Utilized (Note 9.3) (3,049,211) (1,774,242) (1,008,248) (1,611,228)
Tax Loss incurred for the year (Note 9.3) 5,266,533 4,776,923 - 1,116,742
Taxable Income 1,080,854 343,082 447,507 -
Income Tax @ 28% - 75,590 - -
Income Tax @ 24% 135,865 10,168 77,830 -
Income Tax @ 14% 72,065 4,305 17,250 -
Income Tax on Current year Profits 207,930 90,063 95,080 -
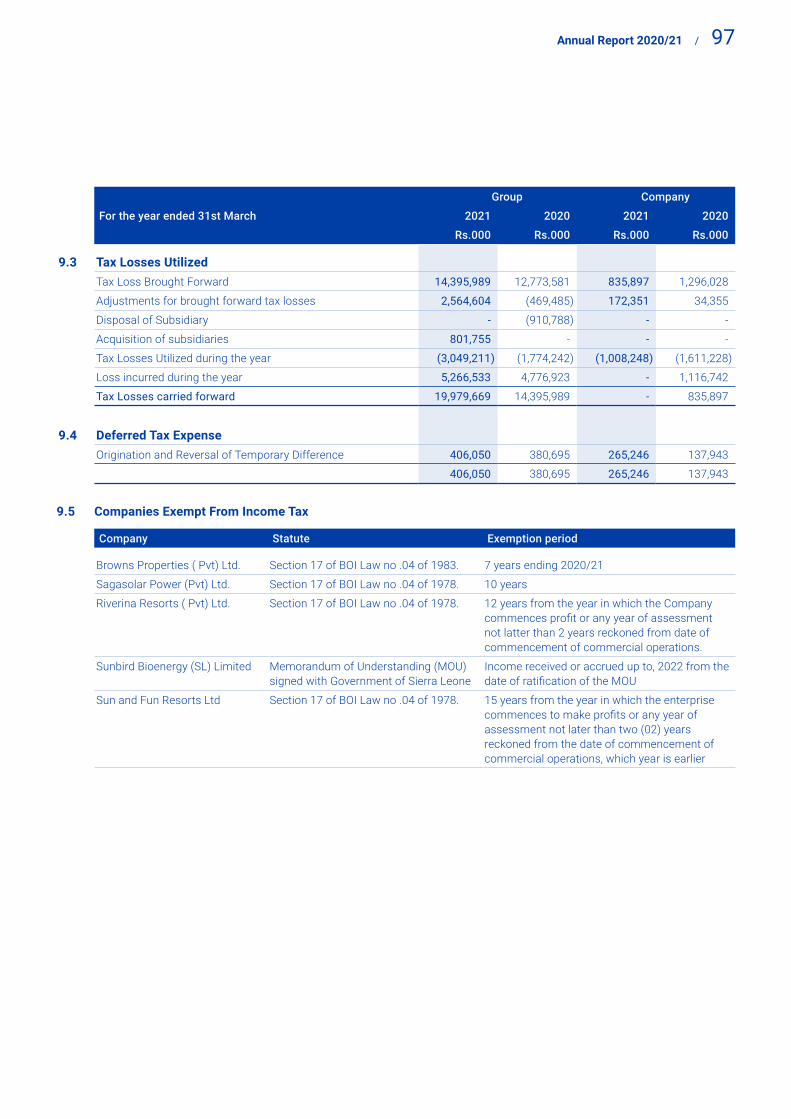
Annual Report 2020/21 / 97
Group Company
For the year ended 31st March 2021 2020 2021 2020
Rs.000 Rs.000 Rs.000 Rs.000
9.3 Tax Losses UtilizedTax Loss Brought Forward 14,395,989 12,773,581 835,897 1,296,028
Adjustments for brought forward tax losses 2,564,604 (469,485) 172,351 34,355
Disposal of Subsidiary - (910,788) - -
Acquisition of subsidiaries 801,755 - - -
Tax Losses Utilized during the year (3,049,211) (1,774,242) (1,008,248) (1,611,228)
Loss incurred during the year 5,266,533 4,776,923 - 1,116,742
Tax Losses carried forward 19,979,669 14,395,989 - 835,897
9.4 Deferred Tax ExpenseOrigination and Reversal of Temporary Difference 406,050 380,695 265,246 137,943
406,050 380,695 265,246 137,943
9.5 Companies Exempt From Income Tax
Company Statute Exemption period
Browns Properties ( Pvt) Ltd. Section 17 of BOI Law no .04 of 1983. 7 years ending 2020/21
Sagasolar Power (Pvt) Ltd. Section 17 of BOI Law no .04 of 1978. 10 years
Riverina Resorts ( Pvt) Ltd. Section 17 of BOI Law no .04 of 1978. 12 years from the year in which the Company commences profit or any year of assessment not latter than 2 years reckoned from date of commencement of commercial operations.
Sunbird Bioenergy (SL) Limited Memorandum of Understanding (MOU) signed with Government of Sierra Leone
Income received or accrued up to, 2022 from the date of ratification of the MOU
Sun and Fun Resorts Ltd Section 17 of BOI Law no .04 of 1978. 15 years from the year in which the enterprise commences to make profits or any year of assessment not later than two (02) years reckoned from the date of commencement of commercial operations, which year is earlier

98 / BROWN AND COMPANY PLC
NOTES TO THE FINANCIAL STATEMENTS
9. INCOME TAX EXPENSE CONTD.9.6 Companies Incorporated and Operating Outside Sri Lanka
Company Country Statute Rate
Bodufaru Beach Resort (Pvt) Ltd. Republic of Maldives Business Profit Tax Act of Republic of Maldives 15%
NPH Investments (Pvt) Ltd. Republic of Maldives Business Profit Tax Act of Republic of Maldives 15%
Browns Ari Resorts ( Pvt) Ltd. Republic of Maldives Business Profit Tax Act of Republic of Maldives 15%
Browns Raa Resorts ( Pvt) Ltd. Republic of Maldives Business Profit Tax Act of Republic of Maldives 15%
Browns Kaafu N Resorts ( Pvt) Ltd. Republic of Maldives Business Profit Tax Act of Republic of Maldives 15%
Sunbird Bioenergy (SL) Limited Republic of Sierra Leone Business Profit Tax Act of Republic of Sierra Leone 30%
9.7 Companies Liable to Tax at Concessionary Rates
Company Concessionary rate and statute
Maturata Plantations Ltd. 14% under Inland Revenue Act No 24 of 2017.
FLPC Management (Pvt) Ltd. 14% under Inland Revenue Act No 24 of 2017.
Ajax Engineers ( Pvt) Ltd. 14% under Inland Revenue Act No 24 of 2017.
Eden Hotel Lanka PLC 14% under Inland Revenue Act No 24 of 2017.
Palm Garden Hotels PLC 14% under Inland Revenue Act No 24 of 2017.
Tropical Villas ( Pvt) Ltd. 14% under Inland Revenue Act No 24 of 2017.
Dickwella Resorts ( Pvt) Ltd. 14% under Inland Revenue Act No 24 of 2017.
BG Air Services (Pvt) Ltd. 14% under Inland Revenue Act No 24 of 2017.
Creations Wooden Fabricators (Pvt) Ltd. 14% under Inland Revenue Act No 24 of 2017.
Excel Restaurants (Pvt) Ltd. 14% under Inland Revenue Act No 24 of 2017.
Green Paradise ( Pvt) Ltd. 14% under Inland Revenue Act No 24 of 2017.
10. EARNINGS/(LOSS) PER SHARE 10.1 Basic Earnings/(Loss) per Share The calculation of basic earnings/(loss) per share is based on the profit/(loss) attributable to ordinary shareholders and the
weighted average number of ordinary shares outstanding during the year.
Basic Earnings/(Loss) per share is calculated as follows:
Group Company
2021 2020 2021 2020
Rs.000 Rs.000 Rs.000 Rs.000
Profit/(Loss) Attributable to Equity holders of the Company (Rs.000) (16,046) 3,620,315 1,760,968 982,759
Weighted Average Number of Ordinary Shares in Issue (‘000) 212,625 212,625 212,625 212,625
Basic Earnings/(Loss) per Share (Rs.) (0.08) 17.03 8.28 4.62
10.2 Diluted Earnings/(Loss) Per Share There were no potentially dilutive ordinary shares outstanding at any time during the year / previous year, hence diluted
earnings/(loss) per share is equal to the basic earnings/(loss) per share.

Annual Report 2020/21 / 9911
.
PR
OP
ERT
Y, P
LAN
T A
ND
EQ
UIP
MEN
T11
.1
Prop
erty
, Pla
nt a
nd E
quip
men
t - G
roup
As
at 3
1st M
arch
Imm
ovab
le (J
EDB/
SLSP
C) A
sset
s on
Fin
ance
Lea
se
Free
hold
Land
Recl
aim
edLa
ndFr
eeho
ldBu
ildin
gsBu
ildin
gs on
leas
ehol
d la
nd
Plan
t and
Mac
hine
ryFu
rnitu
rean
d Offi
ceEq
uipm
ents
Free
hold
Mot
orVe
hicl
es
Leas
ehol
dM
otor
Vehi
cles
Loos
eTo
ols
&Co
mpu
ters
Othe
rTa
ngib
leAs
sets
Capi
tal
Wor
k-in
-pro
gres
s(N
ote
-11.
6)
Tota
l20
21To
tal
2020
Rs.0
00Rs
.000
Rs.0
00Rs
.000
Rs.0
00Rs
.000
Rs.0
00Rs
.000
Rs.0
00Rs
.000
Rs.0
00Rs
.000
Rs.0
00Rs
.000
Cost
/Val
uatio
nBa
lanc
e at
the
begi
nnin
g of
the
year
140
,509
9
,294
,210
-
11,
991,
666
417
,057
32
,151
,385
1
,214
,458
1
,839
,519
6
4,20
4 2
62,8
62
36,4
91,9
97
16,9
18,4
74 1
10,7
86,3
37 3
9,07
5,38
3 On
Acq
uisit
ion
of s
ubsid
iary
- 1
,100
,958
-
2,4
51,6
93
- 6
70,1
70
426
,836
1
0,90
6 -
119
,160
1
05,2
94
23,
229
4,9
08,2
44
62,3
19,6
36
Addi
tions
77
201
,492
-
139
,754
1
2,30
1 1
54,1
12
78,
998
53,
332
- 3
9,70
3 9
6,66
8 4
,004
,099
4
,780
,538
7
,302
,938
Re
valu
atio
n -
1,9
99,4
26
4,4
34,4
84
37,
543
- -
- -
- -
21,
303
6,6
45,2
93
13,1
38,0
49
447
,868
Di
spos
als/
Der
ecog
nitio
ns -
- -
- -
(9,4
23)
(2,7
96)
(20,
339)
(2,3
50)
(2,5
14)
- -
(37,
422)
(38,
975)
Impa
irmen
t Los
ses
- -
- -
- -
- -
- -
- (5
6,27
1) (5
6,27
1) (1
4,89
3)On
Disp
osal
of s
ubsid
iary
- -
- -
- -
- -
- -
- -
- (1
,826
,083
)Tr
ansf
ers
from
/(to)
PPE
/ WIP
/ROU
- -
10,
401,
439
(1,8
79)
31,
348
(4,2
32)
(329
) -
- -
1,5
50 (
10,6
73,5
95)
(245
,698
) (4
64,9
56)
Tran
sfer
s fro
m/(t
o) In
vest
men
t Pr
oper
ties
- (1
12,3
00)
- -
- -
- -
- -
- (1
98,6
71)
(310
,971
) (3
1,79
6)
Exch
ange
Tra
nsla
tion
Diffe
renc
e -
- 6
64,6
23
220
,608
-
3,6
26,9
00
183
1
84,9
67
- 1
0 3
,992
,844
6
27,5
74
9,3
17,7
10
4,0
17,2
16
Bala
nce
at th
e en
d of
the
year
140
,586
12
,483
,786
15
,500
,546
14
,839
,384
4
60,7
05
36,5
88,9
13
1,7
17,3
50
2,0
68,3
84
61,
854
419
,221
40
,709
,655
17
,290
,132
142
,280
,515
110
,786
,337
Accu
mul
ated
Dep
reci
atio
nBa
lanc
e at
the
begi
nnin
g of
the
year
113
,322
-
- 1
,370
,134
2
71,1
12
11,6
81,8
46
643
,217
1
,795
,787
2
3,70
1 1
28,8
94
14,7
99,4
02
- 3
0,82
7,41
5 3
,773
,042
On
Acq
uisit
ion
of s
ubsid
iary
- -
- (1
2,35
6) -
475
,818
3
48,6
74
4,1
01
- 1
01,8
06
26,
597
- 9
44,6
39
24,8
93,4
42
Char
ge fo
r the
year
2,2
07
- -
241
,432
3
5,72
2 7
29,8
15
116
,849
2
5,74
2 1
,549
3
4,12
2 9
21,9
35
- 2
,109
,372
1
,563
,122
Di
spos
als
- -
- -
- (5
,940
) (1
,206
) (1
3,57
0) (9
84)
(2,4
42)
- -
(24,
142)
(31,
887)
On R
eval
uatio
n (9
11)
- -
(359
,478
) -
- -
- -
- (4
5,36
9) -
(405
,758
) -
On D
ispos
al o
f sub
sidia
ry -
- -
- -
- -
- -
- -
- -
(396
,480
)Ex
chan
ge T
rans
latio
n Di
ffere
nce
- -
- 8
3,81
8 1
,061
1
,317
,467
1
66
183
,482
-
5
1,7
29,6
65
- 3
,315
,665
1
,026
,177
Ba
lanc
e at
the
end
of th
e ye
ar 1
14,6
18
- -
1,3
23,5
51
307
,895
14
,199
,005
1
,107
,700
1
,995
,542
2
4,26
6 2
62,3
85
17,4
32,2
29
- 3
6,76
7,19
2 3
0,82
7,41
5
Carry
ing
Valu
eAs
at 3
1st M
arch
202
1 2
5,96
8 1
2,48
3,78
6 1
5,50
0,54
6 1
3,51
5,83
4 1
52,8
10
22,3
89,9
08
609
,650
7
2,84
2 3
7,58
8 1
56,8
36
23,2
77,4
26
17,2
90,1
32 1
05,5
13,3
24
As a
t 31s
t Mar
ch 2
020
27,
186
9,2
94,2
10
- 1
0,62
1,53
2 1
45,9
44
20,4
69,5
40
571
,241
4
3,73
1 4
0,50
3 1
33,9
68
21,6
92,5
95
16,9
18,4
74
79,9
58,9
22
11.1
.1 T
he fu
lly d
epre
ciat
ed P
rope
rty,
Plan
t and
Equ
ipm
ent o
f the
gro
up, w
hich
are
stil
l in
use
as a
t the
repo
rtin
g da
te is
Rs.
9,7
61 M
n (2
019/
20 -
Rs. 7
,856
Mn)
.And
the
com
pany
whi
ch a
re s
till i
n us
e as
at t
he re
port
ing
date
is R
s. 3
18 M
n (2
019/
20 -
Rs. 2
98 M
n).
11.1
.2 D
urin
g th
e ye
ar th
e gr
oup
capi
talis
ed b
orro
win
g co
st a
mou
ntin
g to
Rs.
822
Mn
(201
9/20
- Rs
. 335
Mn)
.

100 / BROWN AND COMPANY PLC
NOTES TO THE FINANCIAL STATEMENTS
11.
P
RO
PER
TY,
PLA
NT
AN
D E
QU
IPM
ENT
CO
NT
D.11
.2
Prop
erty
, Pla
nt a
nd E
quip
men
t - C
ompa
ny
As
at 3
1st M
arch
,Fr
eeho
ldLa
ndFr
eeho
ldBu
ildin
gsBu
ildin
gs o
n le
aseh
old
land
Plan
t and
Mac
hine
ryFu
rnitu
rean
d O
ffice
Equi
pmen
ts
Free
hold
Mot
orVe
hicl
es
Leas
ehol
dM
otor
Vehi
cles
Com
pute
rsCa
pita
lW
ork-
in-p
rogr
ess
(Not
e - 1
1.6)
Tota
l20
21To
tal
2020
Rs.0
00Rs
.000
Rs.0
00Rs
.000
Rs.0
00Rs
.000
Rs.0
00Rs
.000
Rs.0
00Rs
.000
Rs.0
00
Cost
/Val
uatio
nBa
lanc
e at
the
begi
nnin
g of
the
year
1,5
14,4
52
127
,448
3
30,3
43
112
,677
1
17,0
48
42,
761
11,
187
74,
201
-
2,3
30,1
17
2,2
86,9
27
Addi
tions
1,5
00
492
8
,113
3
,731
5
,966
1
5,65
0 -
2
,427
1
3,17
2 5
1,05
1 1
03,3
25
On
Reva
luat
ion
650
,098
2
5,54
5 -
-
-
-
-
-
-
6
75,6
44
-
Tran
sfer
s to
Inve
stm
ent
Prop
erty
-
-
-
-
-
-
-
-
-
-
(31,
796)
Disp
osal
s -
-
(3
,003
) -
(1
0,70
0) -
(2
27)
-
(13,
930)
(28,
339)
Bala
nce
at th
e en
d of
the
year
2,1
66,0
50
153
,486
3
38,4
55
113
,405
1
23,0
14
47,
711
11,
187
76,
400
13,
172
3,0
42,8
81
2,3
30,1
17
Accu
mul
ated
Dep
reci
atio
nBa
lanc
e at
the
begi
nnin
g of
the
year
-
8,9
30
253
,364
3
3,04
5 9
0,06
4 3
2,28
7 1
1,16
6 5
4,70
0 -
4
83,5
56
428
,741
Ch
arge
for t
he y
ear
-
3,2
49
30,
089
17,
388
13,
262
4,1
90
-
10,
326
-
78,
504
83,
042
On
Disp
osal
s -
-
-
(7
12)
-
(3,9
31)
-
(227
) -
(4
,870
) (2
8,22
6)O
n Re
valu
atio
n -
(2
,385
) -
-
-
-
-
-
-
(2
,385
) -
Ba
lanc
e at
the
end
of th
e ye
ar -
9
,795
2
83,4
52
49,
721
103
,326
3
2,54
6 1
1,16
6 6
4,79
9 -
5
54,8
06
483
,556
Carr
ying
Val
ueAs
at 3
1st M
arch
202
12,
166,
050
143,
692
55,0
0363
,684
19,6
8815
,164
2111
,601
13,
172
2,
488,
075
As a
t 31s
t Mar
ch 2
020
1,51
4,45
211
8,51
876
,979
79,6
3226
,984
10,4
7321
19,5
01 -
1,
846,
561
11.3
Th
e ca
rryi
ng v
alue
of t
he c
ompa
ny’s
land
and
bui
ldin
g th
at w
ould
hav
e be
en re
cogn
ized
had
the
asse
ts b
een
carr
ied
out u
nder
cos
t mod
el a
mou
nts
to
Rs.
1,0
97 M
n.
Lan
d an
d Bu
ildin
gs20
21
Rs.0
00
Cost
2,3
09,7
42
Accu
mul
ated
dep
reci
atio
n 1
,212
,673
Net
boo
k am
ount
1,09
7,06
9

Annual Report 2020/21 / 101
11.4 Property, Plant and Equipment - Group11.4.1 Revaluation of Land and Buildings Details of Group’s land and building stated at valuation are indicated below;
Company Property Effective Date Total Land Main Land andof Valuation Extent Building Building
Sq.Ft. Rs.000
Brown & Company PLC Land & BuildingAt No. 75, Devanampiyatissa Mawatha, Colombo-10 31st March 2021 A1-R0-P30.9 9,767 1,990,763
Brown & Company PLC Land & BuildingAt Dambulla 31st March 2021 A0-R3-P00 3,842 228,000
Brown & Company PLC Land At Palle Bogala, Kegalle 31st March 2021 A0-R1-P16.5 - 800
Brown & Company PLC Land & BuildingAt Ranala 31st March 2021 A0-R3-P27.25 14,254 90,178
Browns Investments PLC LandAt Hiddaruwa, Kosgoda 31st March 2021 A0-R1-P36.7 - 23,000
Browns Investments PLC Land & BuildingAt Batawala Road, Meegoda 31st March 2021 A2-R3-P12.9 28,872 138,235
Samudra Beach Resorts (Pvt) Ltd. LandAt Okade Road, Kosgoda 31st March 2021 A5-R1-P0.5 244,126 5,404,284
Samudra Beach Resorts (Pvt) Ltd. Land & BuildingAt Okade Road, Kosgoda 31st March 2021 A0-R1-P17 900 16,500
Samudra Beach Resorts ( Pvt) Ltd. LandOkade Road, Kosgoda 31st March 2021 A0-R3-P6.5 - 82,225
Samudra Beach Resorts ( Pvt) Ltd. LandOkade Road, Kosgoda 31st March 2021 A0-R1-P32 280 55,360
Samudra Beach Resorts ( Pvt) Ltd. Land & BuildingOkade Road, Kosgoda 31st March 2021 A0-R1-P10. 5 - 16,412
Samudra Beach Resorts ( Pvt) Ltd. Land & BuildingOkade Road, Kosgoda 31st March 2021 A0-R0-P15. 7 1,730 19,720
Samudra Beach Resorts ( Pvt) Ltd. Land & BuildingOkade Road, Kosgoda 31st March 2021 A0-R1-P16.3 - 28,150
Samudra Beach Resorts ( Pvt) Ltd. Land & BuildingOkade Road, Kosgoda 31st March 2021 A0-R1-P4 - 35,200
Samudra Beach Resorts ( Pvt) Ltd. BuildingAt Okade Road, Kosgoda 31st March 2021 A0-R0-P9.9 - 6,400
Green Paradise (Pvt) Ltd. Land & BuildingAt Kubukkandanwala, Dambulla 31st March 2021 A11-R0-P13.27 115,216 1,194,888
Palm Garden Hotels PLC LandAt Kaluwamodara, Aluthgama 31st March 2021 A17-R3-P32.54 - 3,333,000
Eden Hotels Lanka PLC Land & BuildingAt Kaluwamodara, Aluthgama 31st March 2021 A6-R1-P20 251,615 3,207,927
Tropical Villas (Pvt) Ltd. LandAt Moragalle, Beruwala 31st March 2021 A2-R1-P27 - 449,000
Dickwella Resorts (Pvt) Ltd. Land & BuildingAt Batheegama, Dickwella 31st March 2021 A6-R2-P3.93 100,648 1,861,804
Dickwella Resorts (Pvt) Ltd. LandAt Batheegama, Dickwella 31st March 2021 A1-R3-P29.25 - 185,550
Maturata Plantations Limited. Building 31st March 2021 - - 82,783 Browns Properties (Pvt) Ltd. Building
No.19,Dudley Senanayake Mw,Colombo 08 31st March 2021 - - 450,819
BI Commodities & Logistics (Pvt) Ltd. LandNagoda Village, Ja-ela 31st March 2021 A3-R1-P30.46 - 183,834

102 / BROWN AND COMPANY PLC
NOTES TO THE FINANCIAL STATEMENTS
11. PROPERTY, PLANT AND EQUIPMENT CONTD.11.4 Property, Plant and Equipment - Group Contd.11.4.1 Revaluation of Land and Buildings Contd.
Company Property Effective Date Total Land Main Land andof Valuation Extent Building Building
Sq.Ft. Rs.000
BI Commodities & Logistics (Pvt) Ltd.
Land & Building105/4, Etampolawatta Road,Hendala, Wattala, 31st March 2021 A3-R0-P30.1 19,150 387,093
Sun & Fun Resorts Ltd. BuildingAt Pasikuda Village, Kalkuda 31st March 2021 - 121,655 778,262
Browns Engineering & Construction (Pvt) Ltd.
LandNo 251, 253,& 253/3, Ethul Kotte Road, Baththaramulla 31st March 2021 A0-R01-P36.30 - 763,545
Sagasolar Power (Pvt) Ltd. BuildingAt Walsapugala, Sooriyawewa,Baruthankanda, Hambantota. 31st March 2021 - 673 1,546
Sunbird Bioenergy (SL) Limited Sierra Leone ha 23,500 257,110 1,231,697 Serendib Hotels PLC Building
Bentota 31st March 2021 72,532 565,004 Hotel Sigiriya PLC Building
Sigiriya 31st March 2021 65,763 313,334 Dolphin Hotels PLC Land and Building
Waikkala 31st March 2021 A14-R2-P10 220,339 1,787,932 Frontier Capital Lanka (Pvt) Limited
Land and Building Mirissa 31st March 2021 A1-R2-P31.64 21,705 886,381
Browns Metal & Sands (Pvt) Ltd. LandNeebada, Mathugama Cost* A150-R0-P11 - 199,992
Browns Ari Resort (Pvt) Ltd. Reclaimed LandSouth Ari Atoll in Republic of Maldives
30th September 2020 69,550 sqm - 4,791,040
Bodufaru Beach Resort (Pvt) Ltd. Reclaimed LandNorth Male Atoll in Maldives
30th September 2020 299,000 sqm - 9,934,643
Browns Raa Resort (Pvt) Ltd. Reclaimed LandRaa atoll in Republic of Maldives
30th September 2020 52,500 sqm - 774,864
41,500,166
* Year of acquisition is 2020/21
The above land and buildings have been revalued by qualified valuers, who hold recognised and relevant professional qualifications and have recent experience in the location and category of the revalued properties on the basis of current market value method of valuation.
The outbreak of COVID-19, declared by the World Health Organisation as a “Global Pandemic” has impacted both local and global markets. The pandemic condition continues to evolve and in the valuers’ opinion, the value reflected as of 31 March 2021 represents the best estimate, which meets the requirements of SLFRS-13 Fair Value Measurement.
Land and buildings are considered under Level 03 of the fair value hierarchy.

Annual Report 2020/21 / 103
Significant unobservable inputs used as follows;
Property Method ofvaluation
Significant unobservable inputs
Estimated priceper perch
Estimated price persquare foot
Correlation to fair value
Land and Buildings
Brown & Company PLC DCC / CM Rs.300,000 - Rs.12,500,000 Rs.900-Rs. 7,350 Positive
Browns Investments PLC DCC/CM Rs.200,000 - Rs.300,000 Rs.1,300 - Rs.2,750 Positive
Samudra Beach Resorts ( Pvt) Ltd. DCC/CM Rs.100,000 - Rs.800,000 Rs.750 - Rs.13,500 Positive
Green Paradise (Pvt) Ltd. DCC Rs. 100,000 Rs.1,500 - Rs.15,000 Positive
Palm Garden Hotels PLC DCC Rs.1,100,000 - Rs.1,225,000 - Positive
Eden Hotels Lanka PLC DCC/CM Rs.550,000 - Rs.1,200,000 Rs.4,500 - Rs.13,500 Positive
Tropical Villas (Pvt) Ltd. DCC Rs.1,162,500 - Positive
Dickwella Resorts (Pvt) Ltd. DCC/CM Rs. 600,000 - Rs. 1,200,000 Rs.500 - Rs.13,500 Positive
BI Commodities & Logistics (Pvt) Ltd. DCC/CM Rs.350,000 - Rs.650,000 Rs.1,000 - Rs.3,000 Positive
Sun & Fun Resorts Ltd. DCC/CM - Rs.500 - Rs.11,200 Positive
Browns Engineering & Construction (Pvt) Ltd. DCC Rs. 10,000,000 - Positive
Serendib Hotels PLC DCC/CM Rs. 300,000 Rs. 1,500 - Rs .8,500 Positive
Hotel Sigiriya PLC CM - Rs. 200 - Rs. 10,000 Positive
Dolphin Hotels PLC DCC/CM Rs. 220,000 Rs. 2,000 - Rs. 9,000 Positive
Frontier Capital Lanka (Pvt) Limited. DCC/CM Rs. 1,950,000 - Rs. 2,000,000 Rs. 3,000 - Rs. 12,500 Positive
Property Method ofvaluation
Significant unobservable inputs
Estimated priceper square meter
Correlation to fair value
Browns Ari Resort (Pvt) Ltd. CM US$ 350 Positive
Bodufaru Beach Resort (Pvt) Ltd. CM US$ 190 Positive
Browns Raa Resort (Pvt) Ltd. CM US$ 75 Positive
Summary description of valuation methodologies; Open market value method (OMV) Open market value method uses prices and other relevant information generated by market transactions involving identical or
comparable assets, liabilities or a group of assets and liabilities, such as a business.
Direct capital comparison method (DCC) This method may be adopted when the rental value is not available from the property concerned, but there are evidences
of sale price of properties as a whole. In such cases, the capitalized value of the property is fixed by direct comparison with capitalized value of similar property in the locality.
Contractors method (CM) The replacement cost (contractor’s) method is used to value properties which do not generally exchange on the open market
and for which comparable evidence therefore does not exist. The valuations are based on two components: the depreciated cost of the building element and the market value of the land. Current building costs and often the land price will be established by comparison.
Investment method (IM) The investment method is used to value properties which are let to produce an income for the investor. Conventionally,
investment value is a product of rent and yield. Each of these elements is derived using comparison techniques.

104 / BROWN AND COMPANY PLC
NOTES TO THE FINANCIAL STATEMENTS
11. PROPERTY, PLANT AND EQUIPMENT CONTD.11.5 Property, Plant and Equipment - Company11.5.1 Revaluation of Land and Buildings - Company
Property Effective Dateof Valuation
Total ExtentLand
Main BuildingSq.Ft.
Carrying Value ofLand & Building
No of Buildings
Rs.000
Land & BuildingAt No. 75, Devanampiyatissa Mawatha, Colombo-10 31st March 2021 A1-R0-P30.9 9,767 1,990,763 1
Land & BuildingAt Dambulla 31st March 2021 A0-R3-P00 3,842 228,000 1
Land At Palle Bogala, Kegalle Cost* A0-R1-P16.5 - 800 -
Land & BuildingAt Ranala 31st March 2021 A0-R3-P27.25 14,254 90,178 6
2,309,741 8
* Year of acquisition is 2014/15.
Property Method ofvaluation
Significant unobservable inputs
Estimated priceper perch
Estimated price persquare foot
Correlation to fair value
Land and Building
Brown & Company PLC DCC/CM Rs.300,000 - Rs.12,500,000 Rs.900-Rs. 7,350 Positive
11.5.2 Summary description of valuation methodologies; Open market value method (OMV) Open market value method uses prices and other relevant information generated by market transactions involving identical or
comparable assets, liabilities or a group of assets and liabilities, such as a business.
Direct capital comparison method (DCC) This method may be adopted when the rental value is not available from the property concerned, but there are evidences
of sale price of properties as a whole. In such cases, the capitalized value of the property is fixed by direct comparison with capitalized value of similar property in the locality.
Contractors method (CM) The replacement cost (contractor’s) method is used to value properties which do not generally exchange on the open market
and for which comparable evidence therefore does not exist. The valuations are based on two components: the depreciated cost of the building element and the market value of the land. Current building costs and often the land price will be established by comparison.
Investment method (IM) The investment method is used to value properties which are let to produce an income for the investor. Conventionally,
investment value is a product of rent and yield. Each of these elements is derived using comparison techniques.
11.6 Capital Work in Progress Capital Work in Progress includes the construction of capital assets which mainly consists of buildings and plant & machinery.

Annual Report 2020/21 / 105
12. RIGHT-OF-USE-ASSETS
Group Company
As at 31st March 2021 2020 2021 2020
Rs.000 Rs.000 Rs.000 Rs.000
Balance at the beginning of the year 6,980,585 - 435,755 -
SLFRS 16 Impact on Initial Recognition - 6,065,092 - 207,140
Additions 177,559 285,864 15,674 280,049
Amortisation expense (345,964) (87,139) (54,070) (51,434)
Transferred from Property, Plant and Equipment 245,698 - - -
Acquisition of Subsidiaries 324,396 435,282 - -
Disposal of Subsidiaries - (1,131) - -
Other Adjustments (13,699) - - -
Revaluation gain during the year 11,778,032 - - -
Exchange difference 429,301 282,617 - -
As at 31 March 19,575,908 6,980,585 397,359 435,755
12.1 Right-Of-Use-Assets of the Group Include the Following
2021
Rs.000
Land 18,924,444
Buildings 557,316
Vehicles 94,148
19,575,908
Company Property Effective Date Total Currency Carrying
Location of Valuation Land Extent Value
Ajax Engineers (Private) Limited Minuwangoda, Sri Lanka 01 Octorber 2020 A1-R3-P36.28 LKR 104,848,993 Gurind Accor (Pvt) Ltd. Kadawatha, Sri Lanka 01 October 2020 A1-R1-P28.95 LKR 78,564,506 Green Paradise (Private) Limited Dambulla, Sri Lanka 01 October 2020 A11-R0-P13.27 LKR 18,838,266 Sagasolar Power (Pvt) Ltd. Bolhinda Village, Sri Lanka 01 October 2020 A44-R3-P36.947 LKR 55,640,790 Sunbird Bioenergy (SL) Ltd. Bombali Sebora, Siera Leone 01 October 2020 23,791 Ha EURO 42,308,213 Sun & Fun Resorts Limited Kalkudah, Sri Lanka 01 Octorber 2020 A7-R1-P27.43 LKR 196,004,700 Maturata Plantations Ltd. In 19 Estates, Sri Lanka 01 October 2020 - LKR 2,740,494,950 NPH Investments Pvt Ltd. Hulhumale, Maldives 01 October 2020 A0-R3-P18.32 USD 9,414,430 Browns Ari Resort (Pvt) Ltd. Bodufinolu island in South
Ari Atoll, Maldives 01 October 2020 A17-R0-P18.125 USD 5,308,200 Bodufaru Beach Resort (Pvt) Ltd. Kaafu islands (3) located at
North Male Atoll, Maldives 01 October 2020 A73-R2-P8.125 USD 9,109,141 Browns Raa Resort (Pvt) Ltd. Bodufarufinolhu island in
Raa Atoll, Maldives 01 October 2020 A12-R2-P16.875 USD 4,535,165

106 / BROWN AND COMPANY PLC
NOTES TO THE FINANCIAL STATEMENTS
12. RIGHT-OF-USE-ASSETS CONTD.
Company Currency Carrying Sensitivity AnalysisCapitalization Rate Per Perch Value
Value 1% Increase 1% Decrease 10% Increase 10% Decrease
Ajax Engineers (Private) Limited LKR 104,848,993 7,000,000 (10,000,000) 3,000,000 (4,000,000)Gurind Accor (Pvt) Ltd. LKR 78,564,506 13,000,000 (14,000,000) 5,000,000 (6,000,000)Green Paradise (Private) Limited LKR 18,838,266 2,300,000 (1,600,000) 2,400,000 (1,500,000)Sagasolar Power (Pvt) Ltd. LKR 55,640,790 12,000,000 (14,000,000) 6,000,000 (6,000,000)Sunbird Bioenergy (SL) Ltd. EURO 42,308,213 4,800,000 (4,000,000) 5,000,000 (4,000,000)Sun & Fun Resorts Limited LKR 196,004,700 16,000,000 (19,000,000) 10,000,000 (10,000,000)Maturata Plantations Ltd. LKR 2,740,494,950 563,000,000 (561,000,000) 433,000,000 (505,000,000)NPH Investments Pvt Ltd. USD 9,414,430 - - 980 (980)Browns Ari Resort (Pvt) Ltd. USD 5,308,200 - - 539,012 (539,013)Bodufaru Beach Resort (Pvt) Ltd. USD 9,109,141 - - 926,900 (926,900)Browns Raa Resort (Pvt) Ltd. USD 4,535,165 - - 462,000 (462,000)
13. INVESTMENT PROPERTIES
Group Company
As at 31st March 2021 2020 2021 2020
Rs.000 Rs.000 Rs.000 Rs.000
Balance at the beginning of the year 22,616,054 19,993,337 12,069,952 10,011,436
Additions 267,488 674,968 15,515 182,937
Disposals (4,500) - (4,500) -
Transfers from Property, Plant and Equipment, Prepaid Lease Rentals 310,971 35,796 - 31,796
Change in Fair Value 706,916 1,911,951 453,809 1,843,783
Balance at the end of the year 23,896,929 22,616,054 12,534,776 12,069,952
13.1 Income Earned from Investment Properties
Group Company
For the year ended 31st March 2021 2020 2021 2020
Rs.000 Rs.000 Rs.000 Rs.000
Rental income 409,190 471,030 124,293 139,766
Direct Operating expenses (17,096) (20,378) - -
13.2 Details of investment properties
Group Company
For the year ended 31st March 2021 2020 2021 2020
Rs.000 Rs.000 Rs.000 Rs.000
Owned properties 16,412,556 15,339,003 11,980,776 11,612,952
Properties held under operating leases 7,484,373 7,277,051 554,000 457,000
23,896,929 22,616,054 12,534,776 12,069,952

Annual Report 2020/21 / 107
13.3 Investment Properties of the Group Include the Following
Company Property Effective Date Total Land Land Buildingsof Valuation Extent
Rs.000 Rs.000
Brown & Company PLC Land & BuildingAt No. 481, T.B. Jayah Mawatha, Colombo-10 31st March 2021 A1-R2-P3.20 4,012,464 508,536
Brown & Company PLC LandAt Dunbar Rd, Dumburugiriya, Hatton 31st March 2021 A1-R1-P0 55,000 -
Brown & Company PLC LandAt Negombo-Divulapitiya Road, Demanhandiya 31st March 2021 A25-R1-P15 436,000 -
Brown & Company PLC LandAt Main Street, Ambalantota 31st March 2021 A0-R1-P24.8 107,000 -
Brown & Company PLC Land At Glennie Street, Colombo-02 31st March 2021 A0-R2-P18.59 1,823,000 -
Brown & Company PLC Land At T.B. Jayah Mawatha, Colombo-10 31st March 2021 A2-R2-P3 5,038,776 -
Brown & Company PLC Land & BuildingAt Orugodawatta 31st March 2021 A1-R0-P6.77 513,000 41,000
S. F. L. Services (Pvt) Ltd. LandAt Glennie Street, Colombo-02 31st March 2021 A0 -R2-P30.50 610,000 -
S. F. L. Services (Pvt) Ltd. LandAt Malabe Rd, Malabe 31st March 2021 A0 -R2-P33.0 235,500 -
Browns Group Industries (Pvt) Ltd. LandAt Shantha Sebastiyan Mw,Mudungoda, Kadawatha 31st March 2021 A0-R1-P25 24,300 -
Browns Industrial Park Ltd. Land & BuildingAt Gonawila, Markandura 31st March 2021 A25-R2-P0 206,585 1,276,000
Millennium Development (Pvt) Ltd. Land & BuildingAt No. 381, T.B. Jayah Mawatha, Colombo-10 31st March 2021 A5-2R-P17.17 5,188,256 259,512
Browns Properties (Pvt) Ltd. Land & BuildingAt Dudley Senanayake Mawatha, Colombo-08 31st March 2021 A0-R1-P9.5 653,156 673,844
Browns Properties (Pvt) Ltd. LandAt No.05, Summer Place,Colombo 08. 31st March 2021 A0-R0-P33.75 286,000 -
Browns Investments PLC LandAt Kuchchaveli, Trincomalee 31st March 2021 A5-R0-P14.5 118,000 -
Browns Investments PLC LandAt Nalluruwa, Panadura 31st March 2021 A0-R1-P38.87 137,000 -
Browns Investments PLC LandAt Kaduwela Rd, Malabe 31st March 2021 A0-R2-P5.05 408,000 -
Browns Investments PLC LandAt Egoda Uyana, Moratuwa 31st March 2021 A1-R2-P32.78 231,000 -
Browns Investments PLC Land“Nadungahalanda”, Dampe, off Diggala Piliyandala road, Kesbewa 31st March 2021 A3-R0-P5 425,000 26,000
Browns Investments PLC LandYagoda, Gampaha 31st March 2021 A0- R1 - P0.05 13,000 6,000
Browns Investments PLC LandKohuwala, Nugegoda Cost* A0 - R2 - P1.81 286,000 -

108 / BROWN AND COMPANY PLC
NOTES TO THE FINANCIAL STATEMENTS
13. INVESTMENT PROPERTIES CONTD.13.3 Investment Properties of the Group Include the Following Contd.
Company Property Effective Date Total Land Land Buildingsof Valuation Extent
Rs.000 Rs.000
Browns Hotels & Resorts Ltd. LandDuwemodara, Kosgoda 31st March 2021 A1-R0-P16.98 65,000 -
Browns Health Care Negombo (Pvt) Ltd.
Land At St Joseph Rd, Negombo 31st March 2021 A0-R1-P16.15 112,300 70,700
Eden Hotels Lanka PLC LandWatthala, Gampaha 31st March 2021 A0-R1-P25.66 51,000 -
21,035,336 2,861,593
* Year of acquisition is 2020/21.
The above Investment Properties have been revalued by qualified valuers, who hold recognised and relevant professional qualifications and have recent experience in the location and category of the revalued properties on the basis of current market value method of valuation.
The outbreak of COVID-19, declared by the World Health Organisation as a “Global Pandemic” has impacted both local and global markets. The pandemic condition continues to evolve and in the valuers’ opinion, the value reflected as of 31 March 2021 represents the best estimate, which meets the requirements of SLFRS-13 Fair Value Measurement.
Investment Properties are considered under Level 3 of the fair value hierarchy.
Significant unobservable inputs used as follows;
Property Method ofvaluation
Significant unobservable inputs
Estimated priceper perch
Estimated price persquare foot
Correlation to fair value
Land and Building
Brown & Company PLC DCC / CM Rs.45,000 - Rs.18,500,000 Rs.1,250 - Rs.8,000 Positive
S. F. L. Services (Pvt) Ltd. DCC Rs.1,300,000 - Rs.20,000,000 - Positive
Browns Group Industries (Pvt) Ltd. DCC Rs.375,000 - Positive
Browns Industrial Park Ltd. CM Rs.85,500 - Rs 117,500 Rs.400- Rs.10,000 Positive
Browns Health Care Negombo (Pvt) Ltd. DCC/CM Rs. 2,000,000 Rs. 5,000- Rs. 6,500 Positive
Millennium Development (Pvt) Ltd. DCC / CM Rs.13,700,000 Rs.1,000- Rs.4,750 Positive
Browns Properties (Pvt) Ltd. DCC / CM Rs.8,500,000 - Rs 16,500,000 Rs.12,500 Positive
Brown & Company PLC DCC / CM Rs.155,000 - Rs 4,800,000 Rs.1,500- Rs.5,000 Positive
Browns Hotels & Resorts Ltd. DCC Rs.60,000 - Rs 400,000 - Positive
Eden Hotels Lanka PLC DCC Rs.600,000 - Rs 900,000 - Positive
13.3.1 Summary description of valuation methodologies; Open market value method (OMV) Open market value method uses prices and other relevant information generated by market transactions involving identical or
comparable assets, liabilities or a group of assets and liabilities, such as a business.
Direct capital comparison method (DCC) This method may be adopted when the rental value is not available from the property concerned, but there are evidences
of sale price of properties as a whole. In such cases, the capitalized value of the property is fixed by direct comparison with capitalized value of similar property in the locality.

Annual Report 2020/21 / 109
Contractors method (CM) The replacement cost (contractor’s) method is used to value properties which do not generally exchange on the open market
and for which comparable evidence therefore does not exist. The valuations are based on two components: the depreciated cost of the building element and the market value of the land. Current building costs and often the land price will be established by comparison.
Investment method (IM) The investment method is used to value properties which are let to produce an income for the investor. Conventionally,
investment value is a product of rent and yield. Each of these elements is derived using comparison techniques.
13.4 Summary of Investment Properties - Group
Group
As at 31st March 2021 2020
Rs.000 Rs.000
Land 21,035,336 20,004,836
Buildings 2,861,593 2,611,218
23,896,929 22,616,054
13.5 Investment Properties of the Company Include the Following
Company Property Effective Date Total Land Land Building No ofBuildings
in Each Location
of Valuation Extent
Rs.000 Rs.000
Brown & Company PLC Land & BuildingAt No. 481, T.B. Jayah Mawatha, Colombo-10 31st March 2021 A1-R2-P3.20 4,012,464 508,536 5
Brown & Company PLC LandAt Dunbar Rd, Dumburugiriya, Hatton 31st March 2021 A1-R1-P0 55,000 - -
Brown & Company PLC LandAt Negombo-Divulapitiya Road, Demanhandiya 31st March 2021 A25-R1-P15 436,000 - -
Brown & Company PLC LandAt Main Street, Ambalantota 31st March 2021 A0-R1-P24.8 107,000 - -
Brown & Company PLC Land At Glennie Street, Colombo-02 31st March 2021 A0-R2-P18.59 1,823,000 - -
Brown & Company PLC Land At T.B. Jayah Mawatha, Colombo-10 31st March 2021 A2-R2-P3 5,038,776 - -
Brown & Company PLC Land & BuildingAt Orugodawatta 31st March 2021 A1-R0-P6.77 513,000 41,000 1
11,985,240 549,536 6

110 / BROWN AND COMPANY PLC
NOTES TO THE FINANCIAL STATEMENTS
13. INVESTMENT PROPERTIES CONTD.13.5 Investment Properties of the Company Include the Following Contd. Significant unobservable inputs used as follows;
Property Method ofvaluation
Significant unobservable inputs
Estimated priceper perch
Estimated price persquare foot
Correlation to fair value
Land and Building
Brown & Company PLC DCC / CM Rs.45,000 - Rs.18,500,000 Rs.1,250 - Rs.8,000 Positive
13.5.1 Summary description of valuation methodologies; Open market value method (OMV) Open market value method uses prices and other relevant information generated by market transactions involving identical or
comparable assets, liabilities or a group of assets and liabilities, such as a business.
Direct capital comparison method (DCC) This method may be adopted when the rental value is not available from the property concerned, but there are evidences
of sale price of properties as a whole. In such cases, the capitalized value of the property is fixed by direct comparison with capitalized value of similar property in the locality.
Contractors method (CM) The replacement cost (contractor’s) method is used to value properties which do not generally exchange on the open market
and for which comparable evidence therefore does not exist. The valuations are based on two components: the depreciated cost of the building element and the market value of the land. Current building costs and often the land price will be established by comparison.
Investment method (IM) The investment method is used to value properties which are let to produce an income for the investor. Conventionally,
investment value is a product of rent and yield. Each of these elements is derived using comparison techniques.
13.6 Summary of Investment Properties - Company
Group
As at 31st March 2021 2020
Rs.000 Rs.000
Land 11,985,240 11,554,226
Buildings 549,536 515,726
12,534,776 12,069,952

Annual Report 2020/21 / 111
14. INTANGIBLE ASSETS
Group Company
As at 31st March 2021 2020 2021 2020
Rs.000 Rs.000 Rs.000 Rs.000
Gross Value
Balance at the beginning of the year 2,053,790 1,791,383 127,870 127,144
On Acquisition of Subsidiary 17,082 179,000 - -
Additions/ Adjustments during the year 9,409 86,209 159 726
On Disposal of Subsidiary - (9,921) - -
Exchange Difference 22,496 7,120 - -
Balance at the end of the year 2,102,777 2,053,790 128,029 127,870
Amortisation and impairment
Balance at the beginning of the year 363,050 173,450 122,054 119,436
Amortisation during the year 25,364 13,041 2,749 2,618
On Acquisition of Subsidiary 4,475 179,000 - -
On Disposal of Subsidiary - (9,562) - -
Exchange Difference 22,496 7,120 - -
Balance at the end of the year 415,385 363,050 124,803 122,054
Carrying Value 1,687,392 1,690,741 3,226 5,816
14.1 Summary of Intangible Assets - Group
31st March 2021 31st March 2020
Goodwill Software Right to Generate
Solar Power
Total Goodwill Software Right to Generate
Solar Power
Total
Rs.000 Rs.000 Rs.000 Rs.000 Rs.000 Rs.000 Rs.000 Rs.000
Gross value
Balance at the beginning of the year 1,481,914 417,837 146,919 2,053,790 1,481,914 162,550 146,919 1,791,383
Additions/ Adjustments during the year - 9,409 - 9,409 - 86,209 - 86,209
Acquisition of subsidiary - 17,082 - 17,082 - 179,000 - 179,000
On Disposal of Subsidiary - - - - - (9,921) - (9,921)
Exchange Difference - 22,496 - 22,496 - 7,120 - 7,120
Balance at the end of the year 1,481,914 466,824 146,919 2,102,777 1,481,914 417,837 146,919 2,053,790
Amortisation and impairment
Balance at the beginning of the year 8,673 322,056 25,201 363,050 8,673 146,922 17,855 173,450
Amortisation during the year - 18,018 7,346 25,364 - 5,695 7,346 13,041
On Acquisition of Subsidiary - 4,475 - 4,475 - 179,000 - 179,000
On Disposal of Subsidiary - - - - - (9,562) - (9,562)
Exchange Difference - 22,496 - 22,496 - 7,120 - 7,120
Balance at the end of the year 8,673 344,549 32,547 415,385 8,673 322,056 25,201 363,050
Carrying Value 1,473,241 122,275 114,372 1,687,392 1,473,241 95,782 121,718 1,690,741

112 / BROWN AND COMPANY PLC
NOTES TO THE FINANCIAL STATEMENTS
14. INTANGIBLE ASSETS CONTD.14.2 Summary of Intangible Assets - Company
31st March 2021 31st March 2020
For the year ended 31st March Software Total Software Total
Rs.000 Rs.000 Rs.000 Rs.000
Gross value
Balance at the beginning of the year 127,870 127,870 127,144 127,144
Additions/ Adjustments during the year 159 159 726 726
Balance at the end of the year 128,029 128,029 127,870 127,870
Amortisation and impairment
Balance at the beginning of the year 122,054 122,054 119,436 119,436
Amortisation during the year 2,749 2,749 2,618 2,618
Balance at the end of the year 124,803 124,803 122,054 122,054
Carrying Value 3,226 3,226 5,816 5,816
14.3 Summary of Goodwill - Group
Carrying Value
As at 31st March 31st March 2021
31st March 2020
Rs.000 Rs.000
Klevenberg (Pvt) Ltd. 51,805 51,805
Browns Healthcare Negombo (Pvt) Ltd. 250 250
Browns Investments PLC 9,564 9,564
Ajax Engineers (Pvt) Ltd. 25,057 25,057
Excel Restaurants (Pvt) Ltd. 20,524 20,524
Browns Hotels & Resorts Ltd. 1,205,258 1,205,258
Sun & Fun Resorts Ltd. 57,641 57,641
Sagasolar Power (Pvt) Ltd. 17,053 17,053
NPH Investments (Pvt) Ltd. 77,599 77,599
Gurind Accor (Pvt) Ltd. 8,490 8,490
1,473,241 1,473,241
14.4 Goodwill as at the reporting date has been tested for impairment and appropriate adjustments has been made for the impairment loss for the year.
The recoverable amount of goodwill is determined based on value-in-use calculations. These calculations use cash flow projections based on financial budgets approved by management. The key assumptions used are given below;
Business growth rate – Based on the long term average growth rate for each business unit.
Inflation rate – Based on current inflation rate.
Discount rate – Risk free rate adjusted for the specific risk relating to the industry.
The Group has not determined impairment of goodwill as at the reporting date impact from COVID-19 pandemic.

Annual Report 2020/21 / 113
14.5 Software with a finite life is amortized over the period of the expected economic benefit. As per the Group policy, software is amortized over 3 to 8 years.
14.6 The right to generate solar power represents the approvals and licenses obtained by Sagasolar Power (Pvt) Ltd. for the solar power project. The Company has obtained these approvals and right to generate solar power from the initial shareholders of the Company and these rights are ammortized over 20 years.
15. BEARER BIOLOGICAL ASSETS
Group
As at 31st March 2021 2020
Rs.000 Rs.000
On Finance Lease (Note 15.1) 18,986 26,350
Investments after formation of the Company (Note 15.2) 2,400,980 2,113,990
Growing Crop Nurseries (Note 15.3) 3,995 4,210
2,423,961 2,144,550
At Cost On Finance Lease
Investments after
formation of the
Company
Growing Crop
Nurseries
Total2021
On Finance Lease
Investments after
formation of the
Company
Growing Crop
Nurseries
Total2020
Cost 211,770 7,367,805 3,995 7,583,569 213,874 6,268,019 4,210 6,486,103
Accumulated amortisation (192,784) (4,966,825) - (5,159,609) (187,523) (4,154,029) - (4,341,552)
18,986 2,400,980 3,995 2,423,961 26,350 2,113,990 4,210 2,144,550
15.1 On Finance Lease
Mature Plantations Tea
Mature Plantations Rubber
Mature Plantations Coconut
Total Total
As at 31 March 2021 2020 2021 2020 2021 2020 2021 2020
Cost
Balance as at the beginning of the year 203,272 203,272 2,332 7,273 8,269 8,269 213,874 218,814
Written Off (Immature Plants) - - (2,105) (4,940) - - (2,105) (4,940)
Balance as at the end of the year 203,272 203,272 227 2,332 8,269 8,269 211,770 213,875
Accumulated Amortisation
Balance as at the beginning of the year 178,293 171,492 2,026 6,048 7,204 6,928 187,523 184,468
Charge for the year 6,801 6,801 20 117 276 276 7,097 7,194
On disposals - - (1,836) (4,139) - - (1,836) (4,139)
Balance as at the end of the year 185,094 178,293 210 2,026 7,480 7,204 192,784 187,523
Carrying amount
As at 31st March 2021 18,178 24,979 17 306 790 1,066 18,986
As at 31st March 2020 24,979 31,780 306 1,225 1,066 1,341 26,350

114 / BROWN AND COMPANY PLC
NOTES TO THE FINANCIAL STATEMENTS
15.
B
EAR
ER B
IOLO
GIC
AL
ASS
ETS
CO
NT
D.15
.2
Inve
stm
ents
aft
er fo
rmat
ion
of S
ubsi
diar
ies
Imm
atur
e Pl
anta
tions
Mat
ure
plan
tatio
nsTo
tal
Tota
l
Tea
Rubb
erCo
conu
tM
ixed
Cr
ops
Tota
lTe
aRu
bber
Coco
nut
Mix
ed C
rops
Suga
r ca
neTo
tal
2021
2020
Rs.0
00Rs
.000
Rs.0
00Rs
.000
Rs.0
00Rs
.000
Rs.0
00Rs
.000
Rs.0
00Rs
.000
Rs.0
00Rs
.000
Rs.0
00
Cost
/Val
uatio
n
Bala
nce
as a
t the
be
ginn
ing
of th
e ye
ar 1
6,49
6 6
9,27
7 1
,437
1
31,6
16
218,
827
742
,558
3
70,6
17
15,
647
279
,744
4
,640
,626
6
,049
,191
6
,268
,019
1
,650
,509
Addi
tions
4,2
96
-
513
6
6,44
1 7
1,25
0 -
-
-
1
00,4
60
445
,741
5
46,2
01
617
,451
5
56,5
22
Disp
osal
s/ W
ritte
n of
f (4
,919
) -
-
-
(4
,919
) -
-
-
-
-
-
(4
,919
) (1
33,8
33)
Tran
sfer
s (7
,714
) -
-
(1
00,4
60)
(108
,174
) 7
,714
-
-
-
-
7
,714
(1
00,4
60)
-
Chan
ges
due
to B
usin
ess
Com
bina
tions
-
-
-
-
-
-
-
-
-
-
-
-
4,00
8,32
3
Exch
ange
Diff
eren
ces
-
-
-
-
-
-
-
-
-
587
,715
5
87,7
15
587
,715
1
86,4
98
Bala
nce
as a
t the
end
of
th
e ye
ar8,
159
69,2
771,
950
97,5
9717
6,98
475
0,27
237
0,61
715
,647
380,
204
5,6
74,0
82
7,19
0,82
17,
367,
805
6,26
8,01
9
Accu
mul
ated
Dep
reci
atio
n
Bala
nce
as a
t the
begi
nnin
g of
the
year
-
-
-
-
-
336
,829
9
2,17
3 5
,230
2
0,74
5 3
,699
,051
4,
154,
029
4,1
54,0
29
428
,588
Char
ge fo
r the
yea
r -
-
-
-
-
2
4,73
6 1
8,32
3 4
12
10,
431
294
,105
3
48,0
07
348
,007
2
90,7
46
Disp
osal
s -
-
-
-
-
-
-
-
-
-
-
-
(2
3,22
0)
Chan
ges
due
to B
usin
ess
Com
bina
tions
-
-
-
-
-
-
-
-
-
-
-
-
3,31
6,40
6
Exch
ange
Diff
eren
ces
-
-
-
-
-
-
-
-
-
464
,789
4
64,7
89
464
,789
1
41,5
09
Bala
nce
as a
t the
end
of
th
e ye
ar -
-
-
-
-
3
61,5
65
110
,496
5
,642
3
1,17
6 4
,457
,945
4
,966
,825
4
,966
,825
4
,154
,029
Carry
ing
amou
nt
As a
t 31s
t Mar
ch 2
021
8,15
969
,277
1,95
097
,597
176,
984
388,
707
260,
121
10,0
04 3
49,0
28
1,2
16,1
37
2,2
23,9
96
2,4
00,9
80
As a
t 31s
t Mar
ch 2
020
16,4
9669
,277
1,43
713
1,61
621
8,82
740
5,72
927
8,44
410
,416
258
,999
9
41,5
75
1,8
95,1
62
2,1
13,9
90

Annual Report 2020/21 / 115
15.3 Growing Crop Nurseries
2021 2020
Tea Mixed crops Total Tea Mixed crops Total
Cost
Balance as at the beginning of the year 4,026 183 4,209 1,625 1,987 3,612
Additions 2,152 552 2,704 2,401 (805) 1,596
Disposals/ Written off (2,918) - (2,918) - (999) (999)
Balance as at the end of the year 3,260 735 3,995 4,026 183 4,210
Amortization/ Depreciation for the year recognized for bearer biological assets
For the year ended 31 March 2021 2020
Rs.000 Rs.000
On Finance Lease 7,097 7,194
Investments after formation of the Company 348,007 290,746
355,104 297,940
These are investments in bearer biological assets carried at cost (Tea, Rubber, Coconut,Cinnamon and Mixed Crop) which comprises of immature/mature plantations since the formation of the Company. Further, investment in immature plantations taken over by way of leases are shown in this note. When such plantations become mature, the additional investments since, taken over to bring them to maturity will be moved from immature to mature under this note. A corresponding movement from immature to mature of the investment undertaken by JEDB/SLSPC on the same plantation prior to the lease will also be carried out.
16. CONSUMABLE BIOLOGICAL ASSETS
Group
As at 31st March 2021 2020
Rs.000 Rs.000
Balance as at the beginning of the year 3,642,998 3,788,540
Increase due to new planting 33,760 53,700
Net increase due to births/deaths (Growing Crop Nurseries) (8,851) (4,426)
Decrease due to harvesting of timber trees (220,977) (58,000)
Change in fair value less estimated costs to sell 560,453 (136,816)
Balance as at the end of the year 4,007,383 3,642,998
16.1 The carrying value of timber as at the year end has been computed as follows;
Group
As at 31st March 2021 2020
Rs.000 Rs.000
Valuation of consumable biological assets 3,799,462 3,422,004
Cost of timber plant below three years of age, not considered for valuation (Note 16.1.1) 204,046 208,202
Growing Crop Nurseries 3,875 12,792
4,007,383 3,642,998

116 / BROWN AND COMPANY PLC
NOTES TO THE FINANCIAL STATEMENTS
16. CONSUMABLE BIOLOGICAL ASSETS CONTD.16.1.1 Carrying value of Immature timber trees as at the reporting date is made-up as follows.
Group
As at 31st March 2021 2020
Rs.000 Rs.000
Balance as at the beginning of the year 208,202 161,649
Additions for the year 33,759 53,700
Transfers to mature (37,915) (7,147)
Carrying value 204,046 208,202
16.2 The valuation of consumable biological assets was carried by Mr. W. M. Chandrasena, an independent Chartered Valuation Surveyor, using Discounted Cash Flow (DCF) methods. In ascertaining the fair value of timber, a physical verification was carried covering all the estates.
a. Fair value hierarchy The fair value measurement for the bearer biological assets has been categorized as Level 3 fair value based on the inputs to
the valuation technique used.
b. Level 3 fair value Breakdown of the total gains recognized in respect of Level 3 fair values of consumable biological assets namely, managed
timber plantation, are given below.
Group
As at 31st March 2021 2020
Rs.000 Rs.000
(Loss)/ Gain included in Profit or Loss
Change in fair value 560,453 (136,816)
Total (Loss)/ Gain for the year 560,453 (136,816)
16.3 Managed timber trees include commercial timber plantations cultivated on estates. The above carrying amount as at 31st March 2021 includes a sum of Rs.204,046,279/- (As at 31st March 2020 - Rs.208,202,000/-) which is the cost of immature trees up to the age of 4 years which is treated as approximate fair value particularly on the ground of little biological transformation taking place and impact of such transformation on price is expected to be immaterial.
16.4 Borrowing costs of Rs 15,052,309/- (Previous year - Rs.23,296,228/-) have been capitalized during the year in to immature fields.

Annual Report 2020/21 / 117
16.5 Valuation techniques and significant unobservable inputs Following table shows the valuation techniques in measuring Level 3 fair value of Consumable Biological Assets as well as the
significant unobservable inputs used.
Type Valuation technique used Significant Unobservable Inputs Inter-relationship between key unobservable inputs and fair value measurement
Standing timber older than 4 years.
Discounted cash flowsThe valuation model considers present value of future net cash flows expected to be generated by the plantation from the timber content of managed timber plantation on a tree-per-tree basis.
Expected cash flows are discounted using a risk-adjusted discount rate of 12% comprising a risk premium of 4%.
Determination of Timber ContentTimber trees in inter-crop areas and pure crop areas have been identified field-wise and spices were identified and harvestable trees were separated, according to their average girth and estimated age.
Timber trees that have not come up to a harvestable size are valued working out the period that would take for those trees to grow up to a harvestable size.
Determination of Price of Timber Trees have been valued as per the current timber prices per cubic meter based on the price list of the State Timber Corporation and prices of timber trees sold by the estates and prices of logs sawn timber at the popular timber traders in Sri Lanka.
In this exercise, following factors have been taken into consideration.
a) Cost of obtaining approval of felling.
b) Cost of felling and cutting into logs.
c) Cost of transportation.
d) Sawing cost.
Risk-adjusted discount rate.- 2020/2021
12% (risk premium - 4%).
- 2019/2020 14.5% (risk premium - 4%).
The estimated fair value would increase/(decrease) if;
- the estimated timber content were higher/(lower).
- the estimated timber prices per cubic meter were higher/(lower).
- the estimated selling related costs were lower/(higher).
- the estimated maturity age were higher/(lower).
- the risk-adjusted discount rate were lower/(higher).

118 / BROWN AND COMPANY PLC
NOTES TO THE FINANCIAL STATEMENTS
16. CONSUMABLE BIOLOGICAL ASSETS CONTD.16.6 Sensitivity Analysis for biological assets16.6.1 Sensitivity variation sales price Values as appearing in the Statement of Financial Position are very sensitive to price changes with regard to the average sales
prices applied. Simulations made for rubber, coconut and timber show that a rise or decrease by 10% of the estimated future selling price has the following effect on the net present value of biological assets:
2021 2020
As at 31st March 10% -10% 10% -10%
Variance Rs. Variance Rs. Variance Rs. Variance Rs.
Managed Timber 379,946 (379,946) 342,207 (342,207)
16.6.2 Sensitivity Variation on Discount Rate Values as appearing in the Statement of Financial Position are very sensitive to changes of the discount rate applied.
Simulations made for timber show that a rise or decrease by 1% of the estimated future discount rate has the following effect on the net present value of biological assets;
2021 2020
As at 31st March 10% -10% 10% -10%
Variance Rs. Variance Rs. Variance Rs. Variance Rs.
Managed Timber (147,779) 166,098 (77,573) 85,899
The Group is exposed to a number of risks related to its timber plantations;
Regulatory and environmental risks The Group is subject to laws and regulations imposed by the environmental authorities of Sri Lanka. The Group has established
environmental policies and procedures aimed at compliance with local environmental and other laws. Management performs regular reviews to identify environmental risks and to ensure that the systems in place are adequate to manage those risks.
Supply and demand risk The Group is exposed to risks arising from fluctuations in the price and sales volume of timber. When possible the Group
manages this risk by aligning its harvest volume to market supply and demand. Management performs regular industry trend analyses to ensure that the Group’s pricing structure is in line with the market and to ensure that projected harvest volumes are consistent with the expected demand.
Climate and other risks The Group’s timber plantations are exposed to the risk of damage from climatic changes, diseases, forest fires and other
natural forces. The Group has extensive processes in place aimed at monitoring and mitigating those risks, including regular forest health inspections and industry pest and disease surveys.

Annual Report 2020/21 / 119
17. INVESTMENTS IN SUBSIDIARIES
Company
Holding % No. of shares Amount
As at As at As at As at As at As at
31st March 31st March 31st March 31st March 31st March 31st March
As at 31st March 2021 2020 2021 2020 2021 2020
Rs.000 Rs.000
Browns Group Motels Ltd. 99.37% 99.37% 15,762,359 15,762,359 160,364 160,364 CFT Engineering Ltd. 99.99% 99.99% 3,075,950 3,075,950 307,698 307,698 The Hatton Transport & Agency Co. (Pvt) Ltd. 100% 100% 1,537,250 1,537,250 153,835 153,835 S.F.L. Services (Pvt) Ltd. 100% 100% 31,711,591 31,711,591 939,448 939,448 Browns Group Industries (Pvt) Ltd. 100% 100% 18,162,500 18,162,500 275,744 275,744 Browns Thermal Engineering (Pvt) Ltd. 100% 100% 16,862,497 16,862,497 269,913 269,913 Snowcem Products Lanka (Pvt) Ltd. 100% 100% 15,762,500 15,762,500 156,999 156,999 Klevenberg (Pvt) Ltd. 100% 100% 30,962,500 30,962,500 358,889 358,889 Browns Healthcare Negombo (Pvt) Ltd. 100% 100% 15,862,500 15,862,500 158,625 158,625 Walker & Greig (Pvt) Ltd. 100% 100% 15,362,501 15,362,501 192,263 192,263 Browns Investments PLC 46.06% 32.98% 6,618,280,773 1,579,502,611 17,051,228 6,973,672 Browns Pharma Ltd. 100% 100% 25,362,500 25,362,500 253,625 253,625 BI Holdings (Pvt) Ltd. 100% 100% 301,000,000 1,000,000 3,010,000 10,000 Browns Agri Solutions (Pvt) Ltd. 100% 100% 25,000,010 25,000,010 25,000 25,000 Browns Global Farm (Pvt) Ltd. 20% 20% 11,837,608 11,837,608 56,702 56,702 Browns Leisure (Pvt) Ltd. 90% 90% 4,500,000 4,500,000 45,000 45,000
23,415,335 10,337,778 Provision for fall in value of Investments (Note 17.1) (56,702) (42,460)
23,358,633 10,295,319
17.1 Provision for fall in value of Investments
Snowcem Products Lanka (Pvt) Ltd. - 3,374 Walker & Greig (Pvt) Ltd. - 38,638 CFT Engineering Ltd. - 448 Browns Global Farm (Pvt) Ltd. 56,702 -
56,702 42,460
Investments in subsidiaries are carried at cost less any accumulated impairment losses. An impairment assessment was carried out considering the impact of COVID-19 on investments in subsidiaries and it was concluded that net realisable value of all the investments included under unquoted investments exceeded its carrying value.

120 / BROWN AND COMPANY PLC
NOTES TO THE FINANCIAL STATEMENTS
17. INVESTMENTS IN SUBSIDIARIES CONTD.17.2 During the year, company has made following additional investments
2021 Company Name No of Shares Rs.000
BI Holding Ltd. 300,000,000 3,000,000 Browns Investments PLC 5,038,778,162 10,077,556
13,077,556
17.3 Group Holdings in Subsidiaries
As at31 March 2021 2021 Subsidiary Principal Activity No of
SharesControl
Holding %
No of Shares
Control Holding
%
Ajax Engineers (Pvt) Ltd. Aluminium Fabrication 469,987 100% 469,987 100%B G Air Services (Pvt) Ltd. Travel 50,000 100% 50,000 100%BI Commodities and Logistics (Pvt) Ltd. Manufacturing 35,500,250 100% 35,500,250 100%BI Zhongtian Holdings (Pvt) Ltd. Pre-Operational 25,500,000 51% 25,500,000 51%Bodufaru Beach Resort (Pvt) Ltd. Hotelier - Pre operational 235,800 88.32% 235,800 88.32%Browns Agri Solutions (Pvt) Ltd. Trading 25,000,000 100% 25,000,000 100%Browns Ari Resort (Pvt) Ltd. Hotelier - Pre operational 40,100 100% 40,100 100%Browns Kaafu N Resort (Pvt) Ltd. Hotelier - Pre operational 100 99.96% 100 99.96%Browns Raa Resort (Pvt) Ltd. Hotelier - Pre operational 100 99.96% 100 99.96%Browns Engnieering and Construction ( Pvt) Ltd. Construction and Engineering 45,000,000 50% 45,000,000 50%Browns Metal and Sands ( Pvt) Ltd. Pre-Operational 1 100% 1 100%B Commodities ME(FZE). Pre-Operational 150,000 100% 150,000 100%Browns Teas ( Pvt) Ltd. Pre-Operational 1 100% 1 100%Browns Global Farm (Pvt) Ltd. Agriculture 58,295,328 100% 58,295,328 100%Browns Group Industries (Pvt) Ltd. Trading 18,162,500 100% 18,162,500 100%Browns Group Motels Ltd. Non-operating 15,762,359 99.37% 15,762,359 99.37%Browns Hotels and Resorts Ltd. Holding Company 1,191,919,624 100% 1,191,919,624 100%Browns Industrial Park Ltd. Renting Premises 30,767,637 100% 30,767,637 100%Browns Investments PLC Holding Company 9,275,581,367 64.55% 1,579,502,611 32.98%Browns Healthcare Negambo (Pvt) Ltd. Pre-Operational 158,625,000 100% 158,625,000 100%Browns Leisure (Pvt) Ltd. Leisure 4,500,000 90% 4,500,000 90%Browns Pharma Ltd. Pre-Operational 25,362,500 100% 25,362,500 100%BI Holding Ltd. Holding Company 301,000,000 100% 1,000,000 100%Browns Thermal Engineering (Pvt) Ltd. Trading 16,862,497 100% 16,862,497 100%CFT Engineering Ltd. Non-operating 3,076,130 99.99% 3,076,130 99.99%Creations Wooden Fabricators (Pvt) Ltd. Wooden Fabrication 18,000 90% 18,000 90%Ceylon Roots Lanka (Pvt) Ltd. Pre-Operational 12,000,000 60% 12,000,000 60%Dickwella Resorts (Pvt) Ltd. Hotelier 481,314 100% 481,314 100%Eden Hotels Lanka PLC Hotelier 528,000,000 89.38% 93,793,173 88.82%Excel Global Holdings (Pvt) Ltd. Holding Company 53,448,329 100% 53,448,329 100%Excel Restaurants (Pvt) Ltd. Food & beverages 10,004 100% 10,004 100%F L C Estates Bungalows (Pvt) Ltd. Pre-Operational 100,000 100% 100,000 100%

Annual Report 2020/21 / 121
As at31 March 2021 2021 Subsidiary Principal Activity No of
SharesControl
Holding %
No of Shares
Control Holding
%
Browns Power Holdings (Pvt) Ltd. Investing 100,000,000 100% 100,000,000 100%Browns Properties (Pvt) Ltd. Real estate 82,500,000 100% 82,500,000 100%F L P C Management (Pvt) Ltd. Plantation management 92,052,838 95.34% 92,052,838 95.34%Green Paradise (Pvt) Ltd. Hotelier 5,000,007 100% 5,000,007 100%General Accessories and Coating (Pvt) Ltd. Manufacturing 18,000 90% 18,000 90%Gurind Accor (Private) Limited Manufacturing 10,761,000 85% 10,761,000 85%Klevenberg (Pvt) Ltd. Trading 30,962,500 100% 30,962,500 100%Maturata Plantations Ltd. Plantations 25,200,000 72% 25,200,000 72%Millennium Development (Pvt) Ltd. Renting Premises 44,390,823 100% 44,390,823 100%NPH Investments (Pvt) Ltd. Investing 141,555,600 51% 141,555,600 51%Palm Garden Hotels PLC Holding Company 38,671,013 89.38% 38,671,013 89.38%Riverina Resorts (Pvt) Ltd. Hotelier - Pre operational 35,050,000 100% 35,050,000 100%S.F.L. Services (Pvt) Ltd. Intra-Group Funding 31,711,591 100% 31,711,591 100%Sagasolar Power (Pvt) Ltd. Solar power generation 38,703,370 50.10% 38,703,370 50.10%Sifang Lanka (Pvt) Ltd. Trading 17,362,500 100% 17,362,500 100%Sifang Lanka Trading (Pvt) Ltd. Non-operating 2,997,750 100% 2,997,750 100%Snowcem Products Lanka (Pvt) Ltd. Non-operating 15,762,500 100% 15,762,500 100%Samudra Beach Resorts (Pvt) Ltd. Hotelier 219,027,500 100% 219,027,500 100%Sun & Fun Resorts Ltd. Hotelier 16,287,848 51% 16,287,848 51%Sunbird Bioenergy (SL) Limited Plantations 2,816 75.10% 2,816 75.10%Serendib Hotels PLC Hotelier 111,525,794 55.75% - - Dolphin Hotels PLC Hotelier 31,621,477 65.18% - - Hotel Sigiriya PLC Hotelier 5,859,000 63.08% - - Frontier Capital Lanka (Pvt) Ltd. Hotelier 3,216,295 100% - - Serendib Leisure Mgt Ltd. Holding Company 6,050,000 100% - - Sanctuary Resorts Lanka (Pvt) Ltd. Hotelier 2 100% - - Grey Reach Investment Limited Investing 20,000 66.67% 20,000 66.67%The Tea Leaf Resort Holding (Pvt) Ltd. Leisure 250,000 50% 250,000 50%The Hatton Transport & Agency Company (Pvt) Ltd. Non-operating 153,725,000 100% 153,725,000 100%Tropical Villas (Pvt) Ltd. Non-operating 14,959,232 100% 14,959,232 100%Walker & Greig (Pvt) Ltd. Non-operating 15,362,501 100% 15,362,501 100%

122 / BROWN AND COMPANY PLC
NOTES TO THE FINANCIAL STATEMENTS
17. INVESTMENTS IN SUBSIDIARIES CONTD.17.4 Acquisition of Subsidiaries17.4.1 Acquisition of Serandib Hotels PLC In December 2020, Eden Hotel Lanka PLC, a subsidiary of the Group acquired 56.59% voting shares in Serendib Hotels PLC
whose principal activity is operating as hotelier. With this acquisition Dolphin Hotels PLC, Hotel Sigiriya PLC, Serendib Leisure Management Ltd., Sanctuary Resorts Lanka (Pvt) Ltd., Frontier Capital Lanka (Pvt) Ltd. became subsidiaries of the Group. The acquisition has been accounted for using acquisition method.
The provisional fair values of the identifiable assets and liabilities (based on un-audited financial statements) as at the date of acquisition were;
Rs.000
Property, plant and equipment 3,963,605
Intangible assets 12,607
Right-of-use assets 324,396
Other Financial Assets 128,393
Loans to Related Parties 1,068,109
Inventories 35,905
Trade and other receivables 169,603
Amounts due from Related Parties 54,694
Income tax recoverable 8,860
Cash and cash equivalents 316,936
Loans and borrowings (901,992)
Lease Liabilities (173,097)
Retirement benefit obligations (80,321)
Deferred tax liabilities (340,506)
Trade and other payable (380,057)
Loans from Related Parties (1,068,109)
Amounts due to Related Parties (54,694)
Income tax payable (13,686)
Bank overdrafts (19,632)
Carrying amount of identifiable net assets 3,051,014
Non controlling interests, based on their proportionate interest (2,091,380)
Cash paid on acquisition 794,480
Gain on bargain purchase 165,154
Cash paid on acquisition 794,480
Cash and cash equivalents of subsidiaries acquired (297,304)
Net cash outflow 497,176

Annual Report 2020/21 / 123
18 INVESTMENTS IN EQUITY ACCOUNTED INVESTEES18.1 Investments in Equity Accounted Investees - Group
Group
Holding % No. of shares
As at 31st March 2021 2020 2021 2020
Unquoted Investments
Gal Oya Holdings (Pvt) Ltd. (GHPL) 50% 50% 1,300,000 1,300,000
Associated Battery Manufacturers (Cey) Ltd. (ABM) 38.50% 38.50% 2,439,355 2,439,355
Gal Oya Plantations (Pvt) Ltd.(GPPL) 22.10% 22.10% 22,309,412 22,309,412
Verginia International Investments Ltd. (VIIL) 40% 40% 800,000 800,000
NPH Developments (Pvt) Ltd. (NPHD) 50% 50% 999 999
LOLC Asia (Pvt) Ltd. 43.08% 43.08% 19,000,000 19,000,000
Sierra Construction Limited (SCL) 20% 20% 199,812,000 199,812,000
Sierra Holdings (Pvt) Limited (SHL) 20% 20% 8,988,984 8,988,984
18.1.1 Group share of Net Assets of Equity Accounted Investees
Equity Value of Investment in Equity Accounted Investees - Group
LOLC ASIA VIIL NPHD ABM SCL SHL Total
Rs.000 Rs.000 Rs.000 Rs.000 Rs.000 Rs.000 Rs.000
Equity Value of Investment as at 1st April 2019 3,349,508 5,138 159,302 417,659 - - 3,931,607
Investment made - - - - 649,390 489,899 1,139,289
Share of Profit/(Loss) of Equity Accounted Investees (Net of Tax) (11,756) - (24,328) (241,865) (87,253) 86,260 (278,942)
Share of other comprehensive income of equity accounted investees (Net of Tax) 205,405 - 17,640 - 21,160 54,313 298,518
Transfers - - - - 649,390 489,899 1,139,289
Equity Value of Investment as at 31st March 2020 3,543,157 5,138 152,614 175,794 1,232,687 1,120,371 6,229,761
Share of Profit/(Loss) of Equity Accounted Investees (Net of Tax) 11,148 - (50,084) (70,931) (63,884) 51,154 (122,597)
Share of other comprehensive income of equity accounted investees (Net of Tax) - - - - (7,322) 79,009 71,687
Exchange differences on translation of foreign operations 197,594 - 14,704 - 3,559 1,677 217,535
Equity Value of Investment as at 31st March 2021 3,751,900 5,138 117,234 104,863 1,165,039 1,252,211 6,396,386
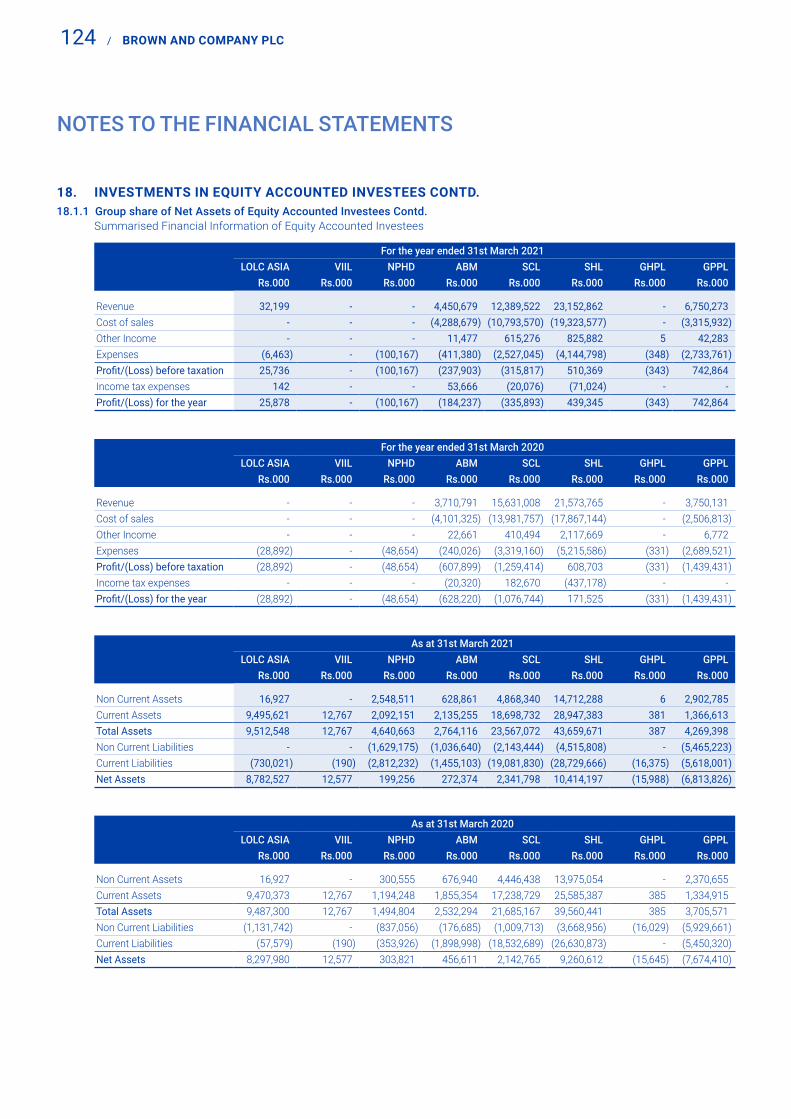
124 / BROWN AND COMPANY PLC
NOTES TO THE FINANCIAL STATEMENTS
18. INVESTMENTS IN EQUITY ACCOUNTED INVESTEES CONTD.18.1.1 Group share of Net Assets of Equity Accounted Investees Contd. Summarised Financial Information of Equity Accounted Investees
For the year ended 31st March 2021LOLC ASIA VIIL NPHD ABM SCL SHL GHPL GPPL
Rs.000 Rs.000 Rs.000 Rs.000 Rs.000 Rs.000 Rs.000 Rs.000
Revenue 32,199 - - 4,450,679 12,389,522 23,152,862 - 6,750,273 Cost of sales - - - (4,288,679) (10,793,570) (19,323,577) - (3,315,932)Other Income - - - 11,477 615,276 825,882 5 42,283 Expenses (6,463) - (100,167) (411,380) (2,527,045) (4,144,798) (348) (2,733,761)Profit/(Loss) before taxation 25,736 - (100,167) (237,903) (315,817) 510,369 (343) 742,864 Income tax expenses 142 - - 53,666 (20,076) (71,024) - - Profit/(Loss) for the year 25,878 - (100,167) (184,237) (335,893) 439,345 (343) 742,864
For the year ended 31st March 2020LOLC ASIA VIIL NPHD ABM SCL SHL GHPL GPPL
Rs.000 Rs.000 Rs.000 Rs.000 Rs.000 Rs.000 Rs.000 Rs.000
Revenue - - - 3,710,791 15,631,008 21,573,765 - 3,750,131 Cost of sales - - - (4,101,325) (13,981,757) (17,867,144) - (2,506,813)Other Income - - - 22,661 410,494 2,117,669 - 6,772 Expenses (28,892) - (48,654) (240,026) (3,319,160) (5,215,586) (331) (2,689,521)Profit/(Loss) before taxation (28,892) - (48,654) (607,899) (1,259,414) 608,703 (331) (1,439,431)Income tax expenses - - - (20,320) 182,670 (437,178) - - Profit/(Loss) for the year (28,892) - (48,654) (628,220) (1,076,744) 171,525 (331) (1,439,431)
As at 31st March 2021LOLC ASIA VIIL NPHD ABM SCL SHL GHPL GPPL
Rs.000 Rs.000 Rs.000 Rs.000 Rs.000 Rs.000 Rs.000 Rs.000
Non Current Assets 16,927 - 2,548,511 628,861 4,868,340 14,712,288 6 2,902,785 Current Assets 9,495,621 12,767 2,092,151 2,135,255 18,698,732 28,947,383 381 1,366,613 Total Assets 9,512,548 12,767 4,640,663 2,764,116 23,567,072 43,659,671 387 4,269,398 Non Current Liabilities - - (1,629,175) (1,036,640) (2,143,444) (4,515,808) - (5,465,223)Current Liabilities (730,021) (190) (2,812,232) (1,455,103) (19,081,830) (28,729,666) (16,375) (5,618,001)Net Assets 8,782,527 12,577 199,256 272,374 2,341,798 10,414,197 (15,988) (6,813,826)
As at 31st March 2020LOLC ASIA VIIL NPHD ABM SCL SHL GHPL GPPL
Rs.000 Rs.000 Rs.000 Rs.000 Rs.000 Rs.000 Rs.000 Rs.000
Non Current Assets 16,927 - 300,555 676,940 4,446,438 13,975,054 - 2,370,655 Current Assets 9,470,373 12,767 1,194,248 1,855,354 17,238,729 25,585,387 385 1,334,915 Total Assets 9,487,300 12,767 1,494,804 2,532,294 21,685,167 39,560,441 385 3,705,571 Non Current Liabilities (1,131,742) - (837,056) (176,685) (1,009,713) (3,668,956) (16,029) (5,929,661)Current Liabilities (57,579) (190) (353,926) (1,898,998) (18,532,689) (26,630,873) - (5,450,320)Net Assets 8,297,980 12,577 303,821 456,611 2,142,765 9,260,612 (15,645) (7,674,410)

Annual Report 2020/21 / 125
18.2 Investments in Equity Accounted Investees - Company
Holding % No. of shares Company
As at 31st March 2021 2020 2021 2020 2021 2020
Rs.000 Rs.000
Unquoted Investments
Gal Oya Plantations (Pvt) Ltd. 22.10% 22.10% 22,309,412 22,309,412 248,998 248,998
Gal Oya Holdings (Pvt) Ltd. 50% 50% 1,300,000 1,300,000 13,000 13,000
LOLC Asia (Pvt) Ltd. 13.60% 13.60% 6,000,000 6,000,000 965,960 965,960
1,227,958 1,227,958
Gal Oya Plantations (Pvt) Ltd. is the private public partnership entered into by the Group where a total of 49% of the Company is held by LOLC Holdings PLC and Brown & Company PLC.
Gal Oya Holdings (Pvt) Ltd. is the management company of Gal Oya Plantations (Pvt) Ltd.
19. OTHER NON CURRENT FINANCIAL ASSETS
Group Company
As at 31st March 2021 2020 2021 2020
Rs.000 Rs.000 Rs.000 Rs.000
Quoted Investments (Notes 19.1) 515,640 197,613 - -
Unquoted/ Other Investments (Notes 19.2, 19.3) 1,093,945 671,563 55,000 55,000
1,609,585 869,176 55,000 55,000
19.1 Quoted Investments - Group
Holding % No. of shares Fair Value
As at 31st March 2021 2020 2021 2020 2021 2020
Rs.000 Rs.000
Fair Value Through OCI
Commercial Leasing & Finance PLC 0.63% 0.63% 40,000,000 40,000,000 232,000 72,000
Agstar PLC 13.18% 13.18% 40,520,061 40,520,061 283,640 125,613
515,640 197,613

126 / BROWN AND COMPANY PLC
NOTES TO THE FINANCIAL STATEMENTS
19. OTHER NON CURRENT FINANCIAL ASSETS CONTD.19.2 Unquoted/ Other Investments - Group
No. of shares Fair Value As at 31st March 2021 2020 2021 2020
Rs.000 Rs.000
Fair Value Through OCIRain Forest Eco Lodge (Pvt) Ltd. 7,683,375 6,483,375 33,357 37,834 LOLC (Pvt) Ltd. 2,826,400 2,826,400 872,386 569,541 Sri Lanka Institute of Nanotechnology 3,810,180 3,810,180 55,000 55,000 Jada Resorts & SPA (Pvt) Ltd. 24,449,480 - 122,137 -
1,082,881 662,375 Investments at amortised costInvestment in Term Deposits 11,064 9,188
1,093,945 671,563
19.3 Unquoted/ Other Investments - Company
No. of shares Carrying Value As at 31st March 2021 2020 2021 2020
Rs.000 Rs.000
Sri Lanka Institute of Nanotechnology 3,810,180 3,810,180 55,000 55,000 55,000 55,000
19.4 Movement of Unquoted Investments - Fair Value Through OCI
No. of shares Carrying Value As at 31st March 2021 2020 2021 2020
Rs.000 Rs.000
Balance at the beginning of the year 662,375 1,209,340 55,000 - Additions during the year - 55,000 - 55,000 Transfers - (1,139,289) - - Acquisition of Subsidiaries 128,393 - - - Fair Value Gain during the year 292,113 537,324 - - Balance at the end of the year 1,082,881 662,375 55,000 55,000
20. DEFERRED TAX ASSETS
Group As at 31st March 2021 2020
Rs.000 Rs.000
Balance at the beginning of the year 482,741 545,777 Transfer from Deferred Tax Liabilities (432,979) 39,706
Deferred Tax Impact on SLFRS 16 transition - 13,533
Origination/ (reversal) of temporary differences recognised in,
- income statement (8,234) (119,389)
- other comprehensive income 6,916 3,115
Exchange differences on translation of foreign operations 247 -
Balance at the end of the year 48,691 482,741

Annual Report 2020/21 / 127
20.1 The Closing Deferred Tax Asset relates to the following Temporary Differences;
Group
As at 31st March 2021 2020
Rs.000 Rs.000
Property, Plant & Equipment / Investment Properties/ROU Assets 31,518 (96,777)
Employee Benefit Liabilities 18,323 736,075
Losses available for offset against future Taxable Income 2,542,377 2,799,391
Provision for Slow Moving Stocks - 3,647
Provision for Bad and Doubtful Debts - 5,406
Other - (65,741)
2,592,218 3,382,002
Deferred tax asset is recognised only to the extent that it is probable that future taxable profits will be available against which they can be used. The Directors have assessed the post- lockdown economic implications of COVID-19 pandemic on the Group and is of the view that future taxable profits will be available against which the unused tax losses and unused tax credits can be utilized.
21. INVENTORIES
Group Company
As at 31st March 2021 2020 2021 2020
Rs.000 Rs.000 Rs.000 Rs.000
Raw Material 1,397,598 591,239 475 215
Work-in-Progress 1,709,667 447,222 69,570 64,221
Finished Goods 3,027,355 3,631,219 2,542,851 3,225,351
Ethanol 1,555,506 1,038,930 - -
Input Material 35,412 32,072 - -
Harvested crops
- Tea 345,186 161,371 - -
- Rubber 716 6,842 - -
- Coconut 15 4 - -
- Other 80,600 89,233 - -
Consumables and Spares 1,230,587 1,260,260 - -
Goods - in - Transit 218,876 219,946 211,380 209,601
9,601,518 7,478,337 2,824,276 3,499,388
Less: Impairment of Inventories (641,459) (791,932) (555,428) (654,093)
8,960,060 6,686,405 2,268,847 2,845,294
The stock-in-trade of each category has been shown after netting off the provision made for NRV adjustments in respect of each category. In doing so, management has considered the impact of COVID-19 on the future selling prices.

128 / BROWN AND COMPANY PLC
NOTES TO THE FINANCIAL STATEMENTS
22. TRADE AND OTHER RECEIVABLES
Group Company
As at 31st March 2021 2020 2021 2020
Rs.000 Rs.000 Rs.000 Rs.000
Trade Receivables 7,864,341 6,859,834 3,671,415 3,474,732
Other Receivables (Note 22.1) 6,095,940 4,417,849 352,459 974,966
13,960,281 11,277,683 4,023,874 4,449,698
Less: Impairment of Trade Receivables (847,596) (1,020,263) (744,330) (703,245)
Less: Provision For other Receivables (62,376) - (26,113) -
13,050,310 10,257,420 3,253,431 3,746,453
22.1 Other Receivables
Group Company
As at 31st March 2021 2020 2021 2020
Rs.000 Rs.000 Rs.000 Rs.000
Value Added Tax Recoverable 231,449 181,068 7,547 20,739
Economic Service Charge Recoverable 49,848 165,166 - -
Staff Loan 8,255 4,883 576 935
Withholding Tax Recoverable 86,225 142,460 - -
Deposits, Advances and prepayments 1,736,078 1,861,805 84,228 504,094
Mobilisation Advances 577,880 474,060 - -
Reimbursement of expenses 107,509 206,054 106,088 197,663
Other Tax Recoverable 398,176 365,522 - -
Others 2,900,520 1,016,831 154,020 251,536
6,095,940 4,417,849 352,459 974,966

Annual Report 2020/21 / 129
23. LOANS TO RELATED PARTIES
Group Company As at 31st March 2021 2020 2021 2020
Rs.000 Rs.000 Rs.000 Rs.000
Browns Investments PLC - - 3,599,602 243,414 Gal Oya Plantations (Pvt) Ltd. 686,380 712,775 686,380 712,775 S.F.L.Services (Pvt) Ltd. - - 572,232 2,638,163 Browns Thermal Engineering (Pvt) Ltd. - - 332,389 239,158 Riverina Resorts (Pvt) Ltd. - - 155,371 138,163 Dickwella Resorts (Pvt) Ltd. - - 413,820 367,988 Browns Hotels and Resorts Ltd. - - 12,188 3,848,982 Browns Group Industries (Pvt) Ltd. - - 149,768 119,670 Klevenberg (Pvt) Ltd. - - - 1,284 Eden Hotels Lanka PLC - - 105,033 1,813,809 NPH Development Pvt Ltd. 201,050 190,531 - - Don & Don Holdings (Pvt) Ltd. 637,103 566,542 - - INK Investments Pvt Ltd. 461,388 405,388 - -
1,985,921 1,875,235 6,026,783 10,123,408
23.1 Security and Repayment Terms of Related Party Loans
Outstanding 31 st March 2021
Name of the Company Repayment Security Group Company
Rs.000 Rs.000
Browns Investments PLC On demand Unsecured - 3,599,602
Gal Oya Plantations (Pvt) Ltd. On demand Unsecured 686,380 686,380
S.F.L.Services (Pvt) Ltd. On demand Unsecured - 572,232
Browns Thermal Engineering (Pvt) Ltd. On demand Unsecured - 332,389
Riverina Resorts (Pvt) Ltd. On demand Unsecured - 155,371
Dickwella Resorts (Pvt) Ltd. On demand Unsecured - 413,820
Browns Hotels and Resorts Ltd. On demand Unsecured - 12,188
Eden Hotels Lanka PLC On demand Unsecured - 105,033
Browns Group Industries Ltd. On demand Unsecured - 149,768
NPH Development Pvt Ltd. On demand Unsecured 201,050 -
Don & Don Holdings (Pvt) Ltd. On demand Unsecured 637,103 -
INK Investments Pvt Ltd. On demand Unsecured 461,388 -
1,985,921 6,026,783

130 / BROWN AND COMPANY PLC
24. AMOUNTS DUE FROM RELATED PARTIES24.1 Amounts due from Related Parties - Due within One Year
Group Company As at 31st March 2021 2020 2021 2020
Rs.000 Rs.000 Rs.000 Rs.000
Associated Battery Manufacturers (Cey) Ltd. 996 996 - - Commercial Leasing & Finance PLC 237 359 237 359 BG Air Services (Pvt) Ltd. - - 76,826 63,384 Browns Group Industries (Pvt) Ltd. - - 26,117 33,221 Browns Industrial Park Ltd. - - 37,355 18,520 Browns Thermal Engineering (Pvt) Ltd. - - 72,181 108,851 Browns Global Farm (Pvt) Ltd. - - 178 177 Browns Tours (Pvt) Ltd. 48,964 43,557 - - C.F.T. Engineering Ltd. - - 8,844 8,844 Engineering Services (Pvt) Ltd. 24,234 24,134 24,234 24,134 Gal Oya Holdings (Pvt) Ltd. 72 121 72 72 Gal Oya Plantations (Pvt) Ltd. 12,447 15,690 12,382 15,684 Klevenberg (Pvt) Ltd. - - 43,211 60,697 Masons Mixture Ltd. 10,160 10,071 9,942 9,876 Sifang Lanka (Pvt) Ltd. - - - 355,231 Sifang Lanka Trading (Pvt) Ltd. - - 3 3 Browns Holdings Limited. 100 100 - - Snowcem Products Lanka (Pvt) Ltd. - - 27,026 27,026 LOLC Holdings PLC 17,356 3,494 - - Sierra Construction Ltd. - 6,224 - - Taprobane Plantations Ltd. 124,760 95,586 - - Browns Hotels & Resorts Ltd. - - - 588 Browns Health Care Negombo (Pvt) Ltd. - - 127,977 126,620 LOLC Advanced Technologies (Pvt) Ltd. 766 3,935 766 35 Browns Agri Solutions (Pvt) Ltd. - - 375,162 285,213 Sun & Fun Resorts Ltd. - - 3,000 3,000 Ishara Traders (Pvt) Ltd. 281 344 - - Lanka Orix Finance PLC 364 2,118 - - INK Investments (Pvt) Ltd. 50,033 327,429 - - East Coast Land Holdings (Pvt) Ltd. 984 984 - - Walker & Greig (Pvt) Ltd. - - 2,050 2,050 The Hatton Transport Agency Company Ltd. - - 1,055 1,055 Samudra Beach Hotels (Pvt) Ltd. - - 2 2 S.F.L.Services (Pvt) Ltd. - - 18 - Maturata Plantations Ltd. - - 4,765 - Browns Leisure (Pvt) Ltd. - - 195,549 128,749
291,754 535,142 1,048,951 1,273,392 Less: Provision for Intercompany Receivables (Note 24.2) (6,621) (6,621) (31,218) (146,218)
285,133 528,521 1,017,733 1,127,174
NOTES TO THE FINANCIAL STATEMENTS

Annual Report 2020/21 / 131
24.2 Provision for Intercompany Receivables
Group Company
As at 31st March 2021 2020 2021 2020
Rs.000 Rs.000 Rs.000 Rs.000
Snowcem Products Lanka (Pvt) Ltd. - - 24,597 24,597
Masons Mixture Ltd. 6,621 6,621 6,621 6,621
Sifang Lanka (Pvt) Ltd. - - - 115,000
6,621 6,621 31,218 146,218
25. INCOME TAX RECOVERABLE
Group Company
As at 31st March 2021 2020 2021 2020
Rs.000 Rs.000 Rs.000 Rs.000
Balance at the beginning of the year 55,965 33,571 160,111 100,377
Transfer from /(to) Income Tax payables (2,611) (81) 380 60,498
Under /(Over) provision in respect of previous years 49,544 (74,186) 49,695 (76,545)
Provision for the year (95,089) 13,607 (95,080) -
Other transfers 133,723 - - -
Acquisition of Subsidiaries 8,860 - - -
On Disposal of Subsidiary - (242) - -
Payments made during the year - 83,297 - 75,781
Balance at the end of the year 150,391 55,965 115,106 160,111
26. OTHER CURRENT FINANCIAL ASSETS
Group Company
As at 31st March 2021 2020 2021 2020
Rs.000 Rs.000 Rs.000 Rs.000
Fixed deposits and Commercial Papers 1,165,105 387,228 - -
Investment in Treasury Bills 7,443 6,932 - -
Investment in Quoted Shares (Notes 26.1, 26.2) 2,018,934 1,612,483 1,814,175 1,609,521
3,191,482 2,006,642 1,814,175 1,609,521

132 / BROWN AND COMPANY PLC
26. OTHER CURRENT FINANCIAL ASSETS CONTD.26.1 Investments in Quoted Shares
Group
Number of Shares Cost Carrying Values
As at 31st March 2021 2020 2021 2020 2021 2020
Rs.000 Rs.000 Rs.000 Rs.000
Fair Value through profit or loss
John Keells Holdings PLC 343 343 26 26 40 39
Seylan Bank PLC- Voting 36,666,944 24,921,282 2,122,020 2,122,020 1,796,680 1,605,050
Hayleys PLC 287,050 28,705 11,314 11,314 17,518 4,443
Ambeon Holdings PLC 100 100 - - 1 1
CT Land Development PLC 19,500 19,500 470 470 523 398
Vallibel Finance PLC 33,900 33,900 497 497 3,568 1,817
Raigam Wayamba Salters PLC 26,200 26,200 66 66 136 47
DFCC Bank PLC 3,810 3,810 267 267 227 231
Hapugastenna Plantation PLC 100 100 1 1 1 1
Lanka Indian Oil Company PLC 27,800 27,800 751 751 528 439
Sierra Cables PLC 7,400 7,400 12 12 42 16
Overseas Reality PLC 12,877,626 - 206,110 - 199,603
Colombo Land and Development Company PLC 2,722 - 74 - 65 -
2,341,607 2,135,423 2,018,934 1,612,483
26.2 Investments in Quoted Shares
Company
Number of Shares Cost Carrying Values
As at 31st March 2021 2020 2021 2020 2021 2020
Rs.000 Rs.000 Rs.000 Rs.000
Fair Value through profit or loss
John Keells Holdings PLC 343 343 26 26 40 39
Seylan Bank PLC- Voting 36,666,944 24,921,282 2,122,020 2,122,020 1,796,680 1,605,050
Hayleys PLC 286,000 28,600 11,279 11,279 17,389 4,430
Colombo Land and Development Company PLC 2,722 - 74 - 65 -
Ambeon Holdings PLC 100 100 - - 1 1
2,133,399 2,133,325 1,814,175 1,609,521
NOTES TO THE FINANCIAL STATEMENTS

Annual Report 2020/21 / 133
27. CASH AND CASH EQUIVALENTS
Group Company
As at 31st March 2021 2020 2021 2020
Rs.000 Rs.000 Rs.000 Rs.000
Cash at Bank 2,082,011 1,178,066 170,225 77,338
Cash in Hand 25,244 35,152 2,246 3,746
Short Term Deposits 871,632 433,871 - -
2,978,887 1,647,089 172,471 81,085
Bank Overdraft (307,213) (1,178,163) (100,637) (801,250)
Cash and Cash Equivalents for the purpose of Statement of Cash Flows 2,671,674 468,926 71,834 (720,166)
28. STATED CAPITAL
Number of Shares Group Company
As at 31st March 2021 2020 2021 2020 2021 2020
Rs.000 Rs.000 Rs.000 Rs.000
Ordinary Shares 212,625,000 212,625,000 9,093,101 9,093,101 9,093,101 9,093,101
The holders of ordinary shares are entitled to receive dividends as declared from time to time and are entitled to one vote per individual present at meetings of the shareholders.
29. CAPITAL RESERVES
Group Company
As at 31st March 2021 2020 2021 2020
Rs.000 Rs.000 Rs.000 Rs.000
Revaluation Reserve 14,414,874 3,604,190 3,173,841 2,658,540
Fair Value through Other Comprehensive Income Reserve 178,434 (262,951) - -
Foreign Currency Translation Reserve 3,215,885 1,302,625 - -
17,809,193 4,643,864 3,173,841 2,658,540
29.1 Revaluation Reserve The Revaluation reserve relates to the revaluation surplus of property, plant & equipment. Once the respective revalued items
have been disposed, the relevant portion of the revaluation surplus is transfered to retained earnings.
29.2 Fair Value through Other Comprehensive Income Reserve - FVOCI Reserve The FVOCI reserve comprises the cumulative net changes in the fair value through OCI financial assets until the assets are
derecognised or impaired.
29.3 Foreign Currency Translation Reserve The Foreign Currency Translation Reserve comprises the cumulative net change in foreign currency translation.

134 / BROWN AND COMPANY PLC
30. REVENUE RESERVE
Group Company
As at 31st March 2021 2020 2021 2020
Rs.000 Rs.000 Rs.000 Rs.000
Retained Earnings 19,985,456 16,520,105 18,011,324 16,241,239
19,985,456 16,520,105 18,011,324 16,241,239
31. LOANS AND BORROWINGS
Group Company
As at 31st March 2021 2020 2021 2020
Rs.000 Rs.000 Rs.000 Rs.000
Balance at the beginning of the year 14,725,756 10,542,011 3,725,646 3,411,057
Obtained during the year 7,193,945 7,468,389 2,916,600 1,682,235
Exchange translation difference 594,406 382,782 - -
Acquisition of subsidiaries 901,992 - - -
Repayments (2,764,796) (3,667,426) (1,374,689) (1,367,645)
Balance at the end of the year 20,651,303 14,725,756 5,267,557 3,725,646
Due after one Year 17,597,510 12,481,214 2,394,972 2,169,815
Due within one Year 3,053,794 2,244,541 2,872,585 1,555,831
20,651,303 14,725,756 5,267,557 3,725,646
31.1 Analysis of Loans and Borrowings - Company
Payable Payable after One year As at As at
Within Payable Payable More than 31st March 31st March
Name of the Lending Institution One year 1-2 years 2-5 Years 5 Years 2021 2020
Rs.000 Rs.000 Rs.000 Rs.000 Rs.000
Commercial Bank of Ceylon PLC 41,630 - - - 41,630 91,634
Sampath Bank PLC 585,600 585,600 699,400 - 1,870,600 1,143,000
Seylan Bank PLC 200,040 200,040 349,870 - 749,950 949,990
DFCC Bank PLC 205,271 128,062 - - 333,333 491,228
Hatton National Bank PLC - Trustee Loans 1,568,000 432,000 - - 2,000,000 -
Hatton National Bank PLC - Trustee Loans 31,544 - - - 31,544 399,794
Hatton National Bank PLC - Trustee Loans 240,500 - - - 240,500 650,000
Total 2,872,585 1,345,702 1,049,270 - 5,267,557 3,725,646
NOTES TO THE FINANCIAL STATEMENTS

Annual Report 2020/21 / 135
31.2 Analysis of Short Term Loans - Company
Name of the Lending Institution As at As at31st March 31st March
2021 2020Rs.000 Rs.000
Amana Bank PLC 520,000 -
Cargils Bank PLC 150,000 150,000
Commercial Leasing & Finance PLC 1,650,000 1,000,000
Commercial Bank of Ceylon PLC - 635,000
DFCC Bank PLC 756,357 355,373
Hatton National Bank PLC 436,106 558,422
ICICI BanK 543,066 -
LOLC Finance PLC 1,068,602 1,494,270
MCB Bank Limited 179,734 53,660
Nations Trust Bank PLC 250,000 -
Pan Asia Bank PLC 500,000 495,000
Peoples Bank 717,649 582,000
Sampath Bank PLC 2,446,526 1,052,614
Seylan Bank PLC 518,934 719,396
Standard Chartered Bank 1,000,000 1,000,000
The National Development Bank PLC 530,067 590,649
Union Bank PLC 300,000 300,000
Total 11,567,041 8,986,384

136 / BROWN AND COMPANY PLC
31. LOANS AND BORROWINGS CONTD.31.3 Security and Repayment Terms - Company
Name of the Lending Nature of Repayment Security Outstanding Institution facility Terms Balance as at
31st March 2021
Rs.000
Commercial Bank of Ceylon PLC
Term Loan 60 monthly installments Mortgage over Land and Buildings at Dambulla and stocks of Brown & Company PLC.
41,630
Sampath Bank PLC Term Loan 71 monthly installments Lien Over Shares Owned by Mr.I C Nanayakkara held in Sampath Bank PLC Custodial/Collateral account.
954,000
Sampath Bank PLC Term Loan 36 monthly installments Lien Over shares owned by Director hled in seylan Bank PLC custodial/Collateral account.
916,600
Seylan Bank PLC Term Loan 60 monthly installments Mortgage over Land at Glennie Street.
749,950
DFCC Bank PLC Term Loan 60 monthly installments Mortgage over 20 Mn ordinary shares of Seylan Bank PLC held by the Brown & Company PLC in favour of DFCC Bank PLC.
228,070 DFCC Bank PLC Term Loan 57 monthly installments 105,263
Hatton National Bank PLC - Trustee Loans
Term Loan 24 monthly installments Trade Debtors of the Company 31,544 Repayment after 11 months grace period is as follows,1) For the first month X Rs 21.838 Mn + interest 2) For the next month X Rs 22.037 Mn + interest 3) For the next month X Rs 22.603 Mn + interest 4) For the next month X Rs 22.332 Mn + interest 5) For the next month X Rs 22.058 Mn + interest 6) For the next month X Rs 21.788 Mn + interest 7) For the next month X Rs 34.452 Mn + interest 8) For the next month X Rs 46.192 Mn + interest 9) For the next month X Rs 45.656 Mn + interest 10) For the next month X Rs 45.111 Mn + interest 11) For the next month X Rs 32.259 Mn + interest 12) For the next month X Rs 31.918 Mn + interest 13) For the next month X Rs 31.544 Mn + interest
Hatton National Bank PLC - Trustee Loans
Term Loan 24 monthly installments Trade debtors of the Company 240,500 Repayment after 6 months grace period is as follows,1) For the first 6 months X Rs 32.5 Mn + interest 2) For the next 4 months X Rs 34.125 Mn + interest 3) For the next 4 months X Rs 39 Mn + interest 4) For the next 4 months X Rs 40.625 Mn + interest
NOTES TO THE FINANCIAL STATEMENTS

Annual Report 2020/21 / 137
Name of the Lending Nature of Repayment Security Outstanding Institution facility Terms Balance as at
31st March 2021
Rs.000
Hatton National Bank PLC - Trustee Loans
Term Loan 17 monthly installment Trade debtors of the Company 857,000 1) For the first month X Rs 37 Mn + interest 2) For the next 4 months X Rs 30 Mn + interest 3) For the next month X Rs 55 Mn + interest 4) For the next month X Rs 65 Mn + interest 5) For the next month X Rs 145 Mn + interest 6) For the next month X Rs 110 Mn + interest 7) For the next month X Rs 50 Mn + interest 8) For the next month X Rs 90 Mn + interest 9) For the next month X Rs 50 Mn + interest 10) For the next month X Rs 60 Mn + interest 11) For the next month X Rs 30 Mn + interest 12) For the next month X Rs 20 Mn + interest 13) For the next month X Rs 15 Mn + interest 14) For the next month X Rs 10 Mn + interest
Hatton National Bank PLC - Trustee Loans
Term Loan 16 monthly installment Trade debtors of the Company 756,000 1) For the first month X Rs 28 Mn + interest 2) For the next month X Rs 23 Mn + interest 3) For the next month X Rs 40 Mn + interest 4) For the next month X Rs 45 Mn + interest 5) For the next month X Rs 35 Mn + interest 6) For the next month X Rs 45 Mn + interest 7) For the next month X Rs 45 Mn + interest 8) For the next month X Rs 30 Mn + interest 9) For the next month X Rs 40 Mn + interest 10) For the next month X Rs 95 Mn + interest 11) For the next month X Rs 38 Mn + interest 12) For the next month X Rs 85 Mn + interest 13) For the next month X Rs 84 Mn + interest 14) For the next month X Rs 73 Mn + interest 15) For the next month X Rs 40 Mn + interest 16) For the next month X Rs 10 Mn + interest
Hatton National Bank PLC - Trustee Loans
Term Loan 13 monthly installment Trade debtors of the Company 387,000 1) For the first month X Rs 24 Mn + interest 2) For the next month X Rs 42 Mn + interest 3) For the next 3 months X Rs 30 Mn + interest 4) For the next month X Rs 36 Mn + interest 5) For the next 2 months X Rs 10 Mn + interest 6) For the next month X Rs 45 Mn + interest 7) For the next month X Rs 40 Mn + interest 8) For the next month X Rs 15 Mn + interest 9) For the next month X Rs 65 Mn + interest 10) For the next month X Rs 10 Mn + interest
Company Total 5,267,557

138 / BROWN AND COMPANY PLC
31. LOANS AND BORROWINGS CONTD.31.4 Security and Repayment Terms - Group
Name of the Lending Nature of Repayment Security Outstanding
Institution facility Terms Balance as at
31st March 2021
Rs.000
Samudra Beach Resorts (Pvt) Ltd.
Bank of Ceylon Term Loan 84 monthly installments Primary Mortgage over property and project assets at Hiddaruwa, Kosgoda.
943,622
Maturata Plantations Ltd.
Sampath Bank PLC Term loan 48 monthly Installments Primary Mortgage Bonds totaling to Rs.940,000,000/-and Rs.185,000,000/- over Land & Building owned by Browns Properties Ltd.
636,700
636,700
Sun & Fun Resorts Ltd.
Sampath Bank PLC Term loan 72 monthly Installments For the next month X Rs 31.544 Mn + interest
138,983
138,983
Eden Hotels Lanka PLC
Seylan Bank PLC Term loan 10 Bi-annually installments Primary floating mortgage bond over freehold property at Kaluwamodera, Aluthgama.
790,848
790,848
Creations Wooden Fabricators (Pvt) Ltd.
Commercial Bank of Ceylon PLC
Term loan 60 monthly installments Mortgage over the property depicted as assessment No. 186/164, Millagahawatta, Kahapola, Piliyandala for Rs.12mn.
3,455
Term loan 20 equal monthly installments Rs. 476,200/- and final installment of Rs. 476,000/-
Rs. 10 Mn Corporate Gurantee by Browns Investments PLC.
8,888
12,343
NPH Investments (Pvt) Ltd.
Bank of Ceylon Term loan 105 monthly installments with 45 months grace period
Mortgage over the lease hold rights of Nasandhura Palace Hotel, Male, Maldives
3,013,928
Joint and Several guarantee of Directors of the subsidiary.
Corporate guarantee obtained from LOLC Holdings PLC.
3,013,928
NOTES TO THE FINANCIAL STATEMENTS

Annual Report 2020/21 / 139
Name of the Lending Nature of Repayment Security Outstanding
Institution facility Terms Balance as at
31st March 2021
Rs.000
Sagasolar Power (Pvt) Ltd.
DFCC Bank PLC Term Loan 108 Equal monthly installments (capital) after a grace period of 12 months from the date of first disbursement.
Primary sum of Rs. 723 Mn to be secured by a concurrent mortgage over the leasehold rights of land together with proposed buildings, Solar Power plant Complete with civil Structures, Solar Panels and the electrical grid station and everything else standing thereon of the 10 MW solar power Plant Located in Baruthankanda Village in Hambanthota together with specific machinery and everything else thereon.
519,396
A sum of Rs. 127,000,000/- to be secured under a Primary Concurrent mortgage over 73,109,000 Ordinary Shares of the Company to the value of Rs. 731,090,000/- held by the Promoters.
Additional primary Concurrent mortgage of project documents.(license/ approvals/ agreements/ contracts/ bonds etc.)
Undertaking by the shareholders that they will meet project cost overrun.
Commercial Bank of Ceylon PLC
Term loan Repayment is as follows, Primary concurrent mortgage bond for Rs.100 Mn over the leasehold rights of land at Baruthakanda village in Hambanthota owned by Mahaweli Authority of Sri Lanka and Immovable Project asset including Plant, Machinery and accessories in favour of DFCC Bank PLC, Commercial Bank Ceylon PLC and Hatton National Bank PLC (participating Lenders) Securing interest of Commercial Bank upto Rs 28 Mn.
382,504
1) For the first 12months X Rs 4.125Mn (10% of Capital)
Primary mortgage for Rs.1,405.5 Mn over Movable project Assets in favour of DFCC Bank PLC, Commercial Bank and HNB PLC Securing interest of Commercial Bank up to Rs. 393 Mn.
2) For the next 12months X Rs 4.5375Mn (11% of Capital)
Primary Concurrent mortgage bond for Rs.264.5 Mn over all Shares of the company securing interest of Commercial Bank up to Rs. 74 Mn.
3) For the next 23 months X Rs 4.74Mn + 01 month X Rs.4.83Mn (11.5% of Capital each year)
Additional Primary mortgage for Rs 264.5 Mn over Book debts, Insurance Proceeds and receivables of the project company in favour of participating lenders securing the interest of Commercial Bank upto Rs. 74 Mn.

140 / BROWN AND COMPANY PLC
Name of the Lending Nature of Repayment Security Outstanding
Institution facility Terms Balance as at
31st March 2021
Rs.000
Commercial Bank of Ceylon PLC Contd.
4) For the next 48 months X Rs 4.95Mn (12% of Capital each year)
Additional Concurrent mortgage over all the project documents (Power Purchase Agreement and other approvals) in favour of the participating lenders and lodging them with one of the banks.
5) For the last 12 months X Rs 3.3Mn (8% of Capital)
Hatton National Bank PLC Term loan 108 monthly installments after a grace period of 12 months from the date of first disbursement.
"Concurrent primary mortgage bond for Rs. 1,446 Mn over the immovable and movable project assets with HNB's share of interest at Rs. 361.5 Mn.
375,977
Concurrent primary mortgage bond for Rs. 254 Mn over all ordinary shares of the company, Special power of Attorney in favour of the lenders with the right to transfer the shares mortgaged, share transfer forms signed in blank and letters from the shareholders informing bank, company secretary and the company that they are mortgaging their shares in the company.
1,277,877
B Commodities ME (FZE)
Peoples Bank Term loan 02 Years from the date of disbursement including 01 year grace period
Personal guarantee by Directors of the Group
2,697,206
Interest to be serviced monthly including grace period commencing one month after the 1st drawdown date
Capital to be settled by 12 monthly installments after the expiry of the grace period as follows: USD 1,250,000*12= 15,000,000
Seylan Bank PLC Term loan To be settled within 12 months. Fixed deposit of Rs. 400 Mn in favor of Browns Investments PLC
547,354
Interest to be serviced monthly.
Leighlin Bridge On demand 1,724,108
4,968,667
31. LOANS AND BORROWINGS CONTD.31.4 Security and Repayment Terms - Group Contd.
NOTES TO THE FINANCIAL STATEMENTS

Annual Report 2020/21 / 141
Name of the Lending Nature of Repayment Security Outstanding
Institution facility Terms Balance as at
31st March 2021
Rs.000
Browns Ari Resort (Pvt) Ltd - Maldives
Peoples Bank Sri Lanka Term Loan 84 monthly installments with 30 Months grace period (Capital repayment moratorium period)
Mortgage over the lease hold rights of Browns Ari Resort Private Limited, Bodufinolhu Island, Maldives
1,990,377
Capital to be repaid over the remaining 60 months
Interest has to be paid in monthly from the date of drawdown the loan
Capital payment will start upon expiration of the grace period 30 months (upon expiration of the grace period) the company has to pay USD 130,000/= per calendar month.
next 4 years the company has agreed to pay USD 175,000/= per calendar month and USD 215,000/= per calendar month for the last year
1,990,377
Browns Engineering and Construction (Pvt) Ltd.
Term Loan 16 quarterly installments of Rs. 93.75 Mn together with interest
Mortgage over the promisory notes amounting to Rs. 965.7 Mn.
690,000
Interest should be serviced quarterly during the grace period
690,000
Serendib Hotels PLC
Hatton National Bank PLC Term Loan 4 quarterly Instalments from September' 2021
50,000
HSBC Term Loan 4 quarterly Instalments from September' 2021
7,243
Hatton National Bank PLC Term Loan 18 Monthly Instalments Commencing January' 2021
20,834
78,077

142 / BROWN AND COMPANY PLC
Name of the Lending Nature of Repayment Security Outstanding
Institution facility Terms Balance as at
31st March 2021
Rs.000
Serendib Leisure Mgt Ltd
Commercial Bank of Ceylon PLC
Term Loan 18 Monthly Instalments Commencing January' 2021
20,833
20,833
Dolphin Hotels PLC
HSBC Term Loan 60 Monthly Instalments Commencing September' 2021
Primary Mortgage Bond No.1425 dated 11/02/2019 for Rs.592,320,000 executed over Club Hotel Dolphin's Hotel premises at Waikkala owned by the Subsidiary to HSBC.
322,411
372,012
Hatton National Bank PLC Term Loan 18 Monthly Instalments Commencing September' 2021
25,000
719,423
Hotel Sigiriya PLC
Commercial Bank PLC Term Loan 18 Monthly Instalments Commencing January' 2021
12,500
12,500
Frontier Capital Lanka (Private) Limited
DFCC Bank PLC Term Loan 30 Monthly Instalments Commencing September' 2021
Further mortgage of Rs. 20 Mn over the allotments of Land marked Lot X depicted in PLan No. 3625B dated 07/12/2010 made by M.L.M Razmi Licensed Surveyor and Lot 1 depicted in Plan No. 21031 dated 28/11/2010 made by M.G.Nazoor Licensed Surveyor together containing in extent A0-R1-P38.4 situated at Kamburugamuwa Village in Weligam Pradeshiya Sabaha in District of Matara together with everything else standing thereon owned by the Subsidiary.
10,000
31. LOANS AND BORROWINGS CONTD.31.4 Security and Repayment Terms - Group Contd.
NOTES TO THE FINANCIAL STATEMENTS

Annual Report 2020/21 / 143
Name of the Lending Nature of Repayment Security Outstanding
Institution facility Terms Balance as at
31st March 2021
Rs.000
DFCC Bank PLC Term Loan 30 Monthly Instalments Commencing September' 2021
Primary Mortgage of Rs.42 Mn over allotments of Land marked Lot X depicted in Plan No. 3625B dated 07/12/2010 made by M.L.M Razmi Licensed Surveyor and Lot 1 depicted in Plan No. 21031 dated 28/11/2010 made by M.G.Nazoor Licensed Surveyor together containing in extent A0-R1-P38.4 situated at Kamburugamuwa Village in Weligam Pradeshiya Sabaha in District of Matara together with everything else standing thereon owned by the Subsidiary.
26,000
DFCC Bank PLC Term Loan 30 Monthly Instalments Commencing September' 2021
Rs.42 Mn Over the allotments of Land marked as Lot 1 and 2 depicted in Plan No. 21031 dated 28/11/2010 made by M.G.Nazoor Licensed Surveyor together containing in extent A0-R1-P34 situated at Kamburugamuwa in Weligam Korale in the District of Matara together with everything else standing thereon owned by the Subsidiary.
25,862
The National Development Bank PLC
Term Loan 25 Monthly Instalments Commencing September' 2021
Primary fixed mortgage of R. 11 Mn over land marked as Lot 1 in zone 3 Cadastral Map No. 820079 made by Surveyor General, situated in Talaramba containing in extent of 0A-0R-19.041P owned by the Subsidiary.
14,706
Primary fixed mortgage of R. 20 Mn over land marked as Lot 0003 in zone 3 Cadastral Map No. 820079 made by Surveyor General, situated in Talaramba containing in extent of 0A-0R-28.05P owned by the Subsidiary.
Hatton National Bank PLC Term Loan 18 Monthly Instalments Commencing September' 2021
13,000
89,568
Group Total 20,651,303
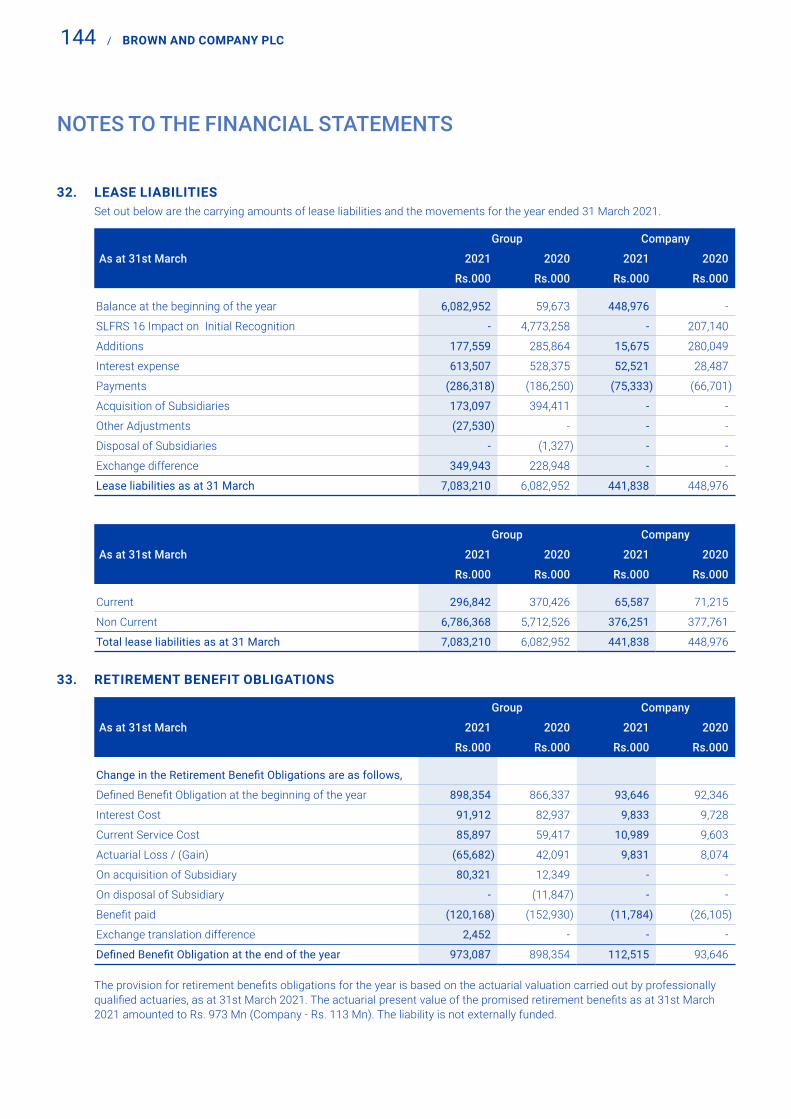
144 / BROWN AND COMPANY PLC
32. LEASE LIABILITIES Set out below are the carrying amounts of lease liabilities and the movements for the year ended 31 March 2021.
Group Company
As at 31st March 2021 2020 2021 2020
Rs.000 Rs.000 Rs.000 Rs.000
Balance at the beginning of the year 6,082,952 59,673 448,976 -
SLFRS 16 Impact on Initial Recognition - 4,773,258 - 207,140
Additions 177,559 285,864 15,675 280,049
Interest expense 613,507 528,375 52,521 28,487
Payments (286,318) (186,250) (75,333) (66,701)
Acquisition of Subsidiaries 173,097 394,411 - -
Other Adjustments (27,530) - - -
Disposal of Subsidiaries - (1,327) - -
Exchange difference 349,943 228,948 - -
Lease liabilities as at 31 March 7,083,210 6,082,952 441,838 448,976
Group Company
As at 31st March 2021 2020 2021 2020
Rs.000 Rs.000 Rs.000 Rs.000
Current 296,842 370,426 65,587 71,215
Non Current 6,786,368 5,712,526 376,251 377,761
Total lease liabilities as at 31 March 7,083,210 6,082,952 441,838 448,976
33. RETIREMENT BENEFIT OBLIGATIONS
Group Company
As at 31st March 2021 2020 2021 2020
Rs.000 Rs.000 Rs.000 Rs.000
Change in the Retirement Benefit Obligations are as follows,
Defined Benefit Obligation at the beginning of the year 898,354 866,337 93,646 92,346
Interest Cost 91,912 82,937 9,833 9,728
Current Service Cost 85,897 59,417 10,989 9,603
Actuarial Loss / (Gain) (65,682) 42,091 9,831 8,074
On acquisition of Subsidiary 80,321 12,349 - -
On disposal of Subsidiary - (11,847) - -
Benefit paid (120,168) (152,930) (11,784) (26,105)
Exchange translation difference 2,452 - - -
Defined Benefit Obligation at the end of the year 973,087 898,354 112,515 93,646
The provision for retirement benefits obligations for the year is based on the actuarial valuation carried out by professionally qualified actuaries, as at 31st March 2021. The actuarial present value of the promised retirement benefits as at 31st March 2021 amounted to Rs. 973 Mn (Company - Rs. 113 Mn). The liability is not externally funded.
NOTES TO THE FINANCIAL STATEMENTS

Annual Report 2020/21 / 145
33.1 The total amount charged to the Income Statement in respect of Retirement Benefit Obligations is made up as follows:
Group Company
As at 31st March 2021 2020 2021 2020
Rs.000 Rs.000 Rs.000 Rs.000
Retiring Gratuity charge for the year
Interest charge for the year 91,912 82,937 9,833 9,728
Current service cost 85,897 59,417 10,989 9,603
177,809 142,354 20,822 19,331
33.2 The principal assumptions used in the actuarial valuation are as follows:33.2.1 Financial Assumptions
Group
As at 31st March 2021 2020
a) Discount rate
(The rate of interest used to discount the future cash flows in order to determine the present value) 8% 10.5%
b) Future salary increase
Executive 6.5% 7%-10%
Non - Executive 6.5% 7%-10%
c) Retirement age 55-60yrs 55-60yrs
d) The Company will continue as a going concern
33.2.2 Demographic Assumptions In addition to the above, demographic assumptions such as mortality, withdrawal and disability, and retirement age were
considered for the actuarial valuation. “A 67/07 mortality table” issued by the Institute of Actuaries, London was used to estimate the gratuity liability of the Company.

146 / BROWN AND COMPANY PLC
33. RETIREMENT BENEFIT OBLIGATIONS CONTD.33.2.3 Sensitivity of assumptions employed in actuarial valuation The following table demonstrates the sensitivity to a reasonable possible change in the key assumptions employed with all
other variables held constant in the employment benefit liability measurement.
Group
Discount rate Future salary increases
As at 31st March 2021 -1% 1% -1% 1%
Rs.000 Rs.000 Rs.000 Rs.000
Impact on profit and loss 38,942 (37,374) (57,888) 63,995
Company
Discount rate Future salary increases
As at 31st March 2021 -1% 1% -1% 1%
Rs.000 Rs.000 Rs.000 Rs.000
Impact on financial position 6,126 (5,555) 6,064 (6,579)
33.2.4 The following payments are expected on employee benefit plan - gratuity in future years.
Company
Within the next 12 months
Between 1 and 2
years
Between 3 and 5
years
Between 6 and 10
years
Beyond 10 years
Total expected
payments
Retirement Benefit Obligation 14,716 24,075 32,207 27,839 13,679 112,515
34. DEFERRED TAX LIABILITIES
Group Company
As at 31st March 2021 2020 2021 2020
Rs.000 Rs.000 Rs.000 Rs.000
Balance at the beginning of the year 2,192,787 1,861,083 284,798 149,117
Transfers to deferred tax Assets (432,979) 39,193 - -
Acquisition of Subsidiaries 340,506 - - -
Origination/ (reversal) of temporary differences recognised in,
- income statement 397,816 261,305 265,246 137,943
- other comprehensive income 2,390,580 31,171 160,367 (2,261)
Other movements - 35 - -
Exchange translation difference 92,983 - - -
Balance at the end of the year 4,981,695 2,192,787 710,410 284,798
NOTES TO THE FINANCIAL STATEMENTS

Annual Report 2020/21 / 147
34.1 The Closing Deferred Tax Liabilities balance relates to the following temporary differences;
Group Company
As at 31st March 2021 2020 2021 2020
Rs.000 Rs.000 Rs.000 Rs.000
Property, Plant & Equipment / Investment Properties/ROU Assets 33,019,937 14,819,326 6,115,076 6,846,419
Bearer Biological Assets 999,606 1,176,624 - -
Consumable Biological Assets 3,473,521 3,643,065 - -
Warranty Provision (81,571) (67,809) (81,571) (67,809)
Provision for Slow Moving Stocks (555,428) (654,093) (555,428) (654,093)
Provision for Bad and Doubtful Debts (769,172) (789,662) (744,330) (703,245)
Employee Benefit Liabilities (912,163) (144,357) (112,515) (93,647)
Losses available for offset against future taxable income (2,677,379) (1,573,180) - (835,896)
Other (60,816) 522,013 (44,478) (448,976)
32,436,534 16,931,927 4,576,752 4,042,754
35. DEFERRED INCOME
Group Company
As at 31st March 2021 2020 2021 2020
Rs.000 Rs.000 Rs.000 Rs.000
Capital Grants (Note 35.1) 70,458 74,799 - -
PHDT Lease Rentals (Note 35.2) 2,337 2,874 - -
Income Received in Advance (Note 35.3) 25,299 36,893 14,080 16,050
Rain Forest Eco Lodge (Pvt) Ltd. (Note 35.4) 45,082 46,943 - -
143,176 161,509 14,080 16,050

148 / BROWN AND COMPANY PLC
35. DEFERRED INCOME CONTD.35.1 Capital Grants
Group
As at 31st March 2021 2020
Rs.000 Rs.000
Gross Value
Balance at the beginning of the year 161,590 161,590
Balance at the end of the year 161,590 161,590
Amortization
Balance at the beginning of the year 86,791 82,101
Amortisation during the year 4,341 4,691
Balance at the end of the year 91,132 86,791
Balance at the end of the year- Net 70,458 74,799
The above represents the following,
Funds received from the Plantation Housing and Human Development Trust (PHDT), MTIP, MPI for the development of workers welfare facilities and improvements to institutional facilities.
Funds received from the Plantation Reform Project for the development of Forestry Plantations.
The amounts spent is capitalized under the relevent classification of Property, Plant and Equipment. The corresponding grant component is reflected under Deferred Income and is being amortized over the useful life span of the related asset.
35.2 PHDT Lease Rentals
Group
As at 31st March 2021 2020
Rs.000 Rs.000
Balance at the beginning of the year 2,874 3,414
Amortisation during the year (537) (540)
Balance at the end of the year 2,337 2,874
Premises at St.Andrew’s Drive in Nuwara Eliya has been leased out to Plantation Human Development Trust (PHDT) for a period of 20 years commencing from August 2005 at a total lease rental of Rs. 10.7 Mn.
Lease rentals received are deferred and amortized over the lease period commencing from August 2005.
Group
As at 31st March 2021 2020
Rs.000 Rs.000
Maturity analysis
Not later than one year 537 537
Later than one year and not later than five years 1,801 2,147
Later than five years - 191
2,337 2,874
NOTES TO THE FINANCIAL STATEMENTS

Annual Report 2020/21 / 149
35.3 Income Received in Advance
Group Company
As at 31st March 2021 2020 2021 2020
Rs.000 Rs.000 Rs.000 Rs.000
Balance at the beginning of the year 36,893 21,901 16,050 19,770
Additions during the year 48,468 43,022 43,039 23,016
Amortisation during the year (60,063) (28,030) (45,009) (26,736)
Balance at the end of the year 25,299 36,893 14,080 16,050
This represents income received in advance in respect of maintenance agreements with customers.
35.4 Rain Forest Eco Lodge (Pvt) Ltd. (RFELL)
Group
As at 31st March 2021 2020
Rs.000 Rs.000
Balance at the beginning of the year 46,943 48,804
Amortisation during the year (1,861) (1,861)
Balance at the end of the year 45,082 46,943
This represents the value of 6,399,375 No. of Ordinary Shares received by Maturata Plantations Ltd. equivalent to 20% of the issued Ordinary Shares of RFELL at Rs.10/-each in lieu of releasing the leasehold rights of 488, Hectares in Enselwatte , Deniyaya for Eco Tourism Project. The value of Ordinary Shares are deferred and amortized over the unexpired balance lease period. However due to the rights issue shareholdings percentage has come down from 20% to 13.44%.
Group
As at 31st March 2021 2020
Rs.000 Rs.000
Maturity analysis
Not later than one year 1,861 1,861
Later than one year and not later than five years 7,445 7,445
Later than five years 35,776 37,637
45,082 46,943

150 / BROWN AND COMPANY PLC
36. TRADE AND OTHER PAYABLES
Group Company
As at 31st March 2021 2020 2021 2020
Rs.000 Rs.000 Rs.000 Rs.000
Trade payables 6,244,109 4,037,729 2,123,504 1,494,791
Accrued Expenses 3,475,171 2,353,498 762,791 356,299
Value Added Tax Payable 82,585 54,228 - -
Warranty Provision 81,571 123,995 81,571 67,809
Advances from Customers 1,827,851 1,092,960 303,670 198,183
Other Tax Payables 429,660 118,539 - -
Security deposits payable 752,467 720,353 - -
Other Payables 1,391,333 864,966 163,004 462,300
14,284,748 9,366,269 3,434,539 2,579,381
37. LOANS FROM RELATED PARTIES 37.1 Due After One Year
Group
As at 31st March 2021 2020
Rs.000 Rs.000
Don & Don Holdings Pvt Ltd. 3,503,064 3,319,775
LOLC Finance PLC 551 1,894
LOLC Holdings PLC 779,848 405,388
INK Investments Pvt Ltd. 268,701 254,642
LOLC Asia Pvt Ltd. 24,880 23,578
LOLC Financial Sector Holdings Pvt Ltd. 121,413 94,312
Patronus Holdings Pvt Ltd. 139,326 -
4,837,781 4,099,590
37.2 Due Within One Year
Group Company
As at 31st March 2021 2020 2021 2020
Rs.000 Rs.000 Rs.000 Rs.000
Don & Don Holdings (Pvt) Ltd. 65,247 57,087 - -
LOLC Factors Pvt Ltd. - 10,000 - -
LOLC Holdings PLC 1,676,064 173,924 1,661,197 160,712
Klevenberg (Pvt) Ltd. - - 233,378 -
LOLC Finance PLC 1,243 119,479 - -
Ishara Traders (Pvt) Ltd. 14,388,379 - - -
Browns Industrial Park Ltd. - - 62,329 42,993
16,130,932 360,490 1,956,904 203,704
NOTES TO THE FINANCIAL STATEMENTS

Annual Report 2020/21 / 151
37.3 Security and Repayment Terms of Related Party Loans - Due Within One Year
Outstanding Balance as at 31st March 2021
Name of the Company Repayment Terms Security Group Company
Rs.000 Rs.000
Don & Don Holdings (Pvt) Ltd. On demand Unsecured 65,247 -
LOLC Holdings PLC On demand Unsecured 1,676,064 1,661,197
Klevenberg (Pvt) Ltd. On demand Unsecured - 233,378
Browns Industrial Park Ltd. On demand Unsecured - 62,329
LOLC Finance PLC On demand Unsecured 1,243 -
Ishara Traders (Pvt) Ltd. On demand Unsecured 14,388,379 -
16,130,932 1,956,904
38. AMOUNTS DUE TO RELATED PARTIES
Group Company
As at 31st March 2021 2020 2021 2020
Rs.000 Rs.000 Rs.000 Rs.000
Commercial Leasing & Finance Company PLC - 112,579 - -
Taprobane Plantations Ltd. 3,230 3,230 - -
Galaxy Enterprises Maldives (Pvt) Ltd. 127,342 115,072 - -
LOLC General Insurance Company Ltd. 45 - - -
LOLC Motors Ltd. 244 96 - -
LOLC Corporate Services (Pvt) Ltd. 2,827 2,464 375 850
Ishara Traders (Pvt) Ltd. 17 17 - -
LOLC Holdings PLC 14,466,452 18,621,957 309,302 111,823
LOLC Finance PLC 5,283 5,219 - -
LOLC Technology Services Ltd. 87,624 31,620 56,457 9,096
Browns Holdings Ltd. 3,963 3,963 3,963 3,963
Pussellawa Plantation Ltd. - 3,553 - -
Ceylon Roots (Pvt) Ltd. 2,489 - - -
Browns Tours (Pvt) Ltd. 29,084 25,863 - -
Browns Investments PLC - - 42,412 56,709
Browns Group Motels Ltd. - - 6,607 6,607
Browns Pharma Ltd. - - 84,782 84,782
BI Holdings (Pvt) Ltd. - - 4,630 11,998
S. F. L. Services (Pvt) Ltd. - - - 188,361
Sifang Lanka (Pvt) Ltd. - - 335,347 -
LOLC Development Finance PLC 18 - - -
Don & Don Holdings (Pvt) Ltd. 1,623 1,570 - -
NPH Development (Pvt) Ltd. - 5,210 - -
14,730,241 18,932,413 843,875 474,189

152 / BROWN AND COMPANY PLC
39. INCOME TAX PAYABLE
Group
As at 31st March 2021 2020
Rs.000 Rs.000
Balance at the beginning of the year 216,148 215,448
Provision for the year 112,841 103,671
Over Provision in respect of previous years (6,282) (1,970)
Transfer from/ (to) Income Tax Recoverable (2,610) -
Acquisition of Subsidiaries 13,686 59,324
Payments made during the year (74,835) (160,324)
Balance at the end of the year 258,948 216,148
40. NET ASSETS PER SHARE
Group
As at 31st March 2021 2020
Rs.000 Rs.000
Equity Attributable to Equity holders of the Company (Rs.000) 46,887,750 30,257,070
Weighted Average Number of Ordinary Shares in Issue (‘000) 212,625 212,625
Net Assets per Share (Rs.) 220.52 142.30
41. RELATED PARTY DISCLOSURES41.1 Ultimate controlling party The ultimate controlling party of the Group is LOLC Holdings PLC.
41.2 Transactions with key management personnel Key management personnel compensation
According to Sri Lanka Accounting Standard- LKAS 24 “Related Party Disclosures”, Key management personnel are those having authority and responsibility for planning, directing and controlling activities of the entity. Accordingly, the Board of Directors (including executive and Non-executive Directors) has been classified as Key Management Personnel of the Company. Emoluments paid to Key Management Personnel have been disclosed in Note 8.
There were no loans given to the Directors of the company during the financial year or as at the year-end.
This note should be read in conjunction with Note 23 - Loans to Related Parties, Note 24 - Amounts due from Related Parties, Note 37 - Loans from Related Parties and Note 38 - Amounts due to Related Parties.
41.3 Terms and conditions of transactions with Related Parties All related party transactions are carried out in the normal course of business and transacted at normal business terms . The
sales to and purchases from related parties are made on terms equivalent to those that prevail in arm’s length transactions and comparable with those that would have been charged from un-related companies. All related party outstanding balances at the year-end are unsecured and are to be settled in cash. The Group does not have any material commitments to related parties.
NOTES TO THE FINANCIAL STATEMENTS

Annual Report 2020/21 / 153
Transactions of Brown & Company PLC with Related Companies
As at 31st March Note 2021 2020
Rs.000 Rs.000
SUBSIDIARIESPurchase of Goods/ Services 41.3.1 42,871 14,739 Sale of Goods 41.3.1 34,150 41,792 Loan Granted 41.3.2 7,103,149 2,743,179 Recovered 41.3.2 12,024,189 4,678,727 Obtained 41.3.3 566,240 3,970,300 Settled 41.3.3 320,500 6,493,053 Interest Income 41.3.2 740,310 1,175,466 Expense 41.3.3 6,974 190,885 Expenses Transferred To 41.3.4 907,995 914,269 Expenses Transferred From 41.3.5 - 40,051 Shares Investments made 41.3.6 13,077,556 45,000
Rental Income Received 41.3.10 1,501 5,142
ASSOCIATESPurchase of Goods/Services 41.3.1 3,521,264 2,862,707 Sale of Goods 41.3.1 92,557 41,266 Loan Recovered 41.3.2 160,000 113,000 Interest Income 41.3.2 133,605 135,103 Expenses Transferred To 41.3.4 - 1
OTHER RELATED COMPANIESSale of Goods 41.3.1 141,685 111,679 Loan Obtained 41.3.3 6,655,000 1,500,000 Settled 41.3.3 5,347,000 1,590,730 Interest Expense 41.3.3 632,422 440,490 Expenses Transferred To 41.3.4 408 4,142 Expenses Transferred From 41.3.5 245,812 203,128 Dividend Received 41.3.8 34,893 - Rental Income Received 41.3.9 122,793 134,623
Balances of the Brown & Company PLC with Related CompaniesTrade Recievables - Related Parties 41.4 114,846 136,378 Trade Payables - Related Parties 41.5 825,214 440,078

154 / BROWN AND COMPANY PLC
41. RELATED PARTY DISCLOSURES CONTD.41.3.1 Trading Transactions The Company has engaged in the following trading transactions with Related Companies.
2021 2020
Name of the Company Sales Purchases Sales Purchases
Rs.000 Rs.000 Rs.000 Rs.000
SUBSIDIARIES
Browns Thermal Engineering (Pvt) Ltd. 11,069 721 143 201
Browns Group Industries (Pvt) Ltd. 3,232 - 4,052 23
B.G Air Services (Pvt) Ltd. - 600 45 9,854
Browns Industrial Park Ltd. 379 41,010 10 -
Sifang Lanka (Pvt) Ltd. - 540 - 4,653
Klevenberg (Pvt) Ltd. 35 - 219 7
Browns Agri Solutions (Pvt) Ltd. - - 684 -
Browns Engineering & Constructions (Pvt) Ltd. 8,336 - 1,330 -
Browns Health Care (Pvt) Ltd. - - 88 -
Browns Global Farm (Pvt) Ltd. - - 24 -
Browns Properties (Pvt) Ltd. 224 - 280 -
BI Holding Ltd. - - 8,091 -
Ajax Engineers (Pvt) Ltd. 767 - 1,159 -
Dickwella Resorts (Pvt) Ltd. 1,800 - 3,071 -
Eden Hotels Lanka PLC 1,114 - 790 -
Browns Ari Resorts (Pvt) Ltd. 843 - 7,783 -
Green Paradise (Pvt) Ltd. 4 - 423 -
Samudra Beach Resorts (Pvt) Ltd. 3,475 - 4,800 -
Sun & Fun Resorts Ltd. - - 297 -
Millennium Development (Pvt) Ltd. 514 - 6,777 -
Maturata Plantations Ltd. 1,209 - 1,728 -
Gurind Accor (Pvt) Ltd. 49 - - -
General Accessaries & Coating (Pvt) Ltd. 1,083 - - -
Riverina Resorts (Pvt) Ltd. 17 - - -
34,150 42,871 41,792 14,739
ASSOCIATES
Gal Oya Plantations (Pvt) Ltd. 86,037 - 37,818 -
Associated Battery Manufacturers (Cey) Ltd. (Note 42.3.1.1) 5,796 3,521,264 137 2,862,707
Taprobane Plantations Ltd. 49 - - -
Sierra Construction Ltd. 675 - 3,311 -
92,557 3,521,264 41,266 2,862,707
NOTES TO THE FINANCIAL STATEMENTS

Annual Report 2020/21 / 155
2021 2020
Name of the Company Sales Purchases Sales Purchases
Rs.000 Rs.000 Rs.000 Rs.000
OTHER RELATED COMPANIES
AgStar PLC 28 - 122 -
LOLC Development Finance PLC 161 - 1,585 -
Commercial Insurance Brokers (Pvt) Ltd. 80 - 711 -
Commercial Leasing & Finance PLC 81,582 - 35,674 -
LOLC Holdings PLC 13,566 - 33,610 -
LOLC Finance PLC 43,502 - 34,826 -
Seylan Bank PLC 2,588 - 284 -
LOLC Motors Ltd. 50 - 31 -
Ceylone Graphene Technologies (Pvt) Ltd. 95 - - -
LOLC General Insurance Ltd. 32 - - -
LOLC Life Assurance Ltd. - - 3,398 -
LOLC Advanced Technologies (Pvt) Ltd. - - 967 -
LOLC Technology Services Ltd. - - 382 -
LOLC Micro Credit Ltd. - - 9 -
Browns Tours (Pvt) Ltd. - - 19 -
Taprobane Plantations Ltd. - - 61 -
141,685 - 111,679 -
41.3.1.1 Following transactions are made with Associated Battery Manufacturers (Cey) Ltd.
Name of the Company Relationship Nature of the transactions
Aggregate Value
As a % of Gross
Revenue
Terms and Conditions
Associated Battery Manufacturers (Cey) Ltd. Associate Purchases in the normal course of business
3,521,264 21% Arm’s length transactions

156 / BROWN AND COMPANY PLC
41. RELATED PARTY DISCLOSURES CONTD.41.3.2 Loans granted to Related Companies The Company has granted and recovered the following Loan balances during the year.
2021 2020
Loan Interest Loan Loan Interest Loan
Granted Income Recovered Granted Income Recovered
Name of the Company Rs.000 Rs.000 Rs.000 Rs.000 Rs.000 Rs.000
SUBSIDIARIES
Browns Industrial Park Ltd. 65,000 - 65,000 - - -
Klevenberg (Pvt) Ltd. 18,000 175 19,460 4,200 9,190 110,227
Browns Investments PLC (Note 41.3.2.1) 4,812,730 91,662 1,548,204 2,244,029 91,466 2,772,000
S. F. L. Services (Pvt) Ltd.(Note 41.3.2.1) 1,836,919 167,509 4,132,859 - 21,309 -
Eden Hotels Lanka PLC (Note 41.3.2.1) - 168,374 1,877,150 - 342,683 985,000
Dickwella Resorts (Pvt) Ltd. - 45,832 - - 52,084 -
Riverina Resorts (Pvt) Ltd. - 17,208 - - 19,554 -
B.G. Air Services (Pvt) Ltd. - - - - 8,345 -
Browns Hotels & Resorts Ltd. (Note 41.3.2.1) - 198,721 4,035,515 - 600,310 545,000
Browns Thermal Engineering Ltd. 126,000 34,731 115,500 186,500 17,951 -
Browns Group Industries (Pvt) Ltd. 244,500 16,097 230,500 308,450 12,576 266,500
7,103,149 740,310 12,024,189 2,743,179 1,175,466 4,678,727
ASSOCIATES
Gal Oya Plantations (Pvt) Ltd. - 133,605 160,000 - 135,103 113,000
- 133,605 160,000 - 135,103 113,000
41.3.2.1 Following transactions are made with related companies.
Name of the Company Relationship Nature of the transactions
Aggregate Value
As a % ofGross
Revenue
Terms and Conditions
Browns Investments PLC Subsidiary Loans Granted 4,812,730 24% Unsecured loan at interest rate of AWPLR + 4.5%
Browns Investments PLC Subsidiary Loans Recovered 1,548,204 8% Unsecured loan at interest rate of AWPLR + 4.5%
S. F. L. Services (Pvt) Ltd. Subsidiary Loans Granted 1,836,919 9% Unsecured loan at interest rate of AWPLR + 4.5%
S. F. L. Services (Pvt) Ltd. Subsidiary Loans Recovered 4,132,859 20% Unsecured loan at interest rate of AWPLR + 4.5%
Browns Hotel & Resorts Ltd. Subsidiary Loans Recovered 4,035,515 20% Unsecured loan at interest rate of AWPLR + 4.5%
Eden Hotels Lanka PLC Subsidiary Loans Recovered 1,877,150 9% Unsecured loan at interest rate of AWPLR + 4.5%
NOTES TO THE FINANCIAL STATEMENTS

Annual Report 2020/21 / 157
41.3.3 Loans obtained from Related Companies
2021 2020
Loan Interest Loan Loan Interest Loan
Obtained Expense Settled Obtained Expense Settled
Name of the Company Rs.000 Rs.000 Rs.000 Rs.000 Rs.000 Rs.000
SUBSIDIARIES
S. F. L. Services (Pvt) Ltd. - - - 3,900,300 185,615 6,418,800
Klevenberg (Pvt) Ltd. 495,240 4,137 266,000 - - -
Browns Industrial Park Ltd. 71,000 2,837 54,500 70,000 5,269 74,253
566,240 6,974 320,500 3,970,300 190,885 6,493,053
OTHER RELATED COMPANIES
LOLC Holdings PLC (Note 41.3.3.1) 6,655,000 192,486 5,347,000 - 91,512 885,000
LOLC Finance PLC - 252,482 - 1,500,000 149,435 705,730
Commercial Leasing & Finance PLC - 187,454 - - 199,543 -
6,655,000 632,422 5,347,000 1,500,000 440,490 1,590,730
41.3.3.1 Following transactions are made with related companies.
Name of the Company Relationship Nature of the transactions
Aggregate Value
As a % of Gross
Revenue
Terms and Conditions
LOLC Holdings PLC Subsidiary Loans Obtained 6,655,000 33% Unsecured loan at interest rate of AWPLR + 4.5%
LOLC Holdings PLC Subsidiary Loans Settled 5,347,000 26% Unsecured loan at interest rate of AWPLR + 4.5%

158 / BROWN AND COMPANY PLC
41. RELATED PARTY DISCLOSURES CONTD.41.3.4 The Company has incurred Group Expenses on behalf of the Related companies during the year on reimbursement
basis as follows;
2021 2020
Name of the Company Expenses Expenses
Transferred Transferred
to to
Rs.000 Rs.000
SUBSIDIARIES
Browns Group Industries (Pvt) Ltd. 52,896 74,136
Sifang Lanka (Pvt) Ltd. 289,522 119,391
Browns Health Care (Pvt) Ltd. - 254,867
Browns Thermal Engineering (Pvt) Ltd. 89,330 144,379
Klevenberg (Pvt) Ltd. 212,513 96,365
S. F. L.Services (Pvt)Ltd. 19 490
BG Air Services (Pvt) Ltd. 13,442 6,783
Browns Group Motels Ltd. - 2
BI Holdings Ltd. 4,768 727
Browns Investments PLC 14,297 15,165
Browns Industrial Park Ltd. 48,835 54,500
Browns Global Farm (Pvt) Ltd. 1 -
Browns Health Care North Colombo (Pvt) Ltd. - 524
Browns Health Care Negombo (Pvt) Ltd. 1,356 1,854
Browns Leisure (Pvt) Ltd. 66,800 -
Maturata Plantation Ltd. 4,765 -
Browns Pharma Ltd. - 16
Browns Agri Solutions (Pvt) Ltd. 109,449 145,069
907,995 914,269
ASSOCIATES
Gal Oya Plantations (Pvt) Ltd. - 1
- 1
OTHER RELATED COMPANIES
Masons Mixture Ltd. 66 216
Engineering Services (Pvt) Ltd. 100 2,460
Browns Tours (Pvt) Ltd. - 7
Commercial Leasing & Finance PLC 243 1,459
408 4,142
NOTES TO THE FINANCIAL STATEMENTS

Annual Report 2020/21 / 159
41.3.5 Following companies have incurred Expenses on behalf of the company during the year on reimbursement basis as follows;
2021 2020
Name of the Company Expenses Expenses
Transferred Transferred
From From
Rs.000 Rs.000
SUBSIDIARIES
Browns Industrial Park Ltd. - 40,051
- 40,051
OTHER RELATED COMPANIES
LOLC Technology Services Ltd. 47,361 45,827
LOLC Corporate Services (Pvt) Ltd. 972 850
LOLC Holdings PLC 197,479 156,451
245,812 203,128
41.3.6 The Company has made the following new investments during the year.
2021 2020
Rs.000 Rs.000
Investment in Subsidiaries (Note 17.2)
Browns Leisure (Pvt) Ltd. - 45,000
BI Holdings Ltd. 3,000,000 -
Browns Investments PLC 10,077,556 -
13,077,556 45,000
Name of the Company Relationship Nature of the transactions Aggregate Value As a % of Equity
Browns Investments PLC Subsidiary Investment Made 10,077,556 21%
41.3.7 The Company recognised dividends from the following related companies during the year.
2021 2020
Rs.000 Rs.000
OTHER RELATED COMPANIES 34,893 -
Seylan Bank PLC 34,893 -

160 / BROWN AND COMPANY PLC
41. RELATED PARTY DISCLOSURES CONTD.41.3.8 Company earned Rental income from following companies during the year
2021 2020
Name of the Company Rent Income Rent Income
Rs.000 Rs.000
SUBSIDIARIES
BG Air Services (Pvt) Ltd. 1,501 5,142
1,501 5,142
OTHER RELATED COMPANIES
BRAC Lanka Finance PLC - 22,679
LOLC Finance PLC 31,061 29,202
LOLC Securities Ltd. 11,535 10,642
LOLC Life Assurance Ltd. 24,732 29,863
LOLC General Insurance Ltd. 32,610 40,715
LOLC Holdings PLC 1,230 1,522
LOLC Development Finance PLC 21,623 -
122,793 134,623
41.4 Trade Recievables - Related Parties
Company
As at 31st March 2021 2020
Rs.000 Rs.000
Subsidiaries 33,320 47,055
Associates 23,196 38,035
Other Related companies 58,330 51,289
114,846 136,378
41.5 Trade Payables - Related Parties
Company
As at 31st March 2021 2020
Rs.000 Rs.000
Subsidiaries 573 8,293
Associates 824,641 431,785
825,214 440,078
NOTES TO THE FINANCIAL STATEMENTS

Annual Report 2020/21 / 161
42. FINANCIAL INSTRUMENTS - FAIR VALUE AND RISK MANAGEMENT The Group has loans and other receivables, trade and other receivables, and cash and short-term deposits that arise directly
from its operations. The Group also holds FVTPL and fair value through OCI financial investments. The Group’s principal financial liabilities, comprise of loans and borrowings and trade and other payables. The main purpose of these financial liabilities is to finance the Group’s operations and to provide guarantees to support its operations. The Group is exposed to market risk, credit risk and liquidity risk.
42.1 Credit Risk Credit risk is the risk that a counterparty will not meet its obligations under a financial instrument or customer contract, leading
to a financial loss. The Group is exposed to credit risk from its operating activities (primarily trade receivables) and from its financing activities, including deposits with banks and financial institutions, foreign exchange transactions and other financial instruments.
The group manages its operations to avoid any excessive concentration of counterparty risk and the Group takes all reasonable steps to ensure the counterparties fulfill their obligations.
Exposure to credit risk The carrying amount of financial assets represents the maximum credit exposure. The maximum exposure to credit risk at the
reporting date was as follows.
Group Company
Carrying Amount 2021 2020 2021 2020
Rs.000 Rs.000 Rs.000 Rs.000
Trade and other receivables 7,872,596 6,864,716 3,671,991 3,475,667
Loans to related companies 1,985,921 1,875,235 6,026,783 10,123,408
Amount due from Related Companies 285,133 528,521 1,017,733 1,127,174
Cash at Bank 2,953,643 1,611,937 170,225 77,338
13,097,293 10,880,410 10,886,731 14,803,587
Trade and other receivables The Group’s exposure to credit risk is influenced mainly by the individual characteristics of each customer. However,
management also considers the default risk of the industry in which customers operate, as this factor may have an influence on credit risk.
Each new customer is analysed individually for creditworthiness before the Group’s Standard payment and delivery terms and conditions are offered. The Group’s review includes external ratings, when available and in some cases bank references. Sales limits are established for each customer, which represents the maximum open amount without requiring approval from the management. These limits are reviewed periodically. The Group has obtained customer deposits as collateral from major customers by reviewing their past performance and credit worthiness. In addition, receivable balances are monitored on an ongoing basis with the result that Group’s exposure to bad debts is not significant.

162 / BROWN AND COMPANY PLC
NOTES TO THE FINANCIAL STATEMENTS
42. FINANCIAL INSTRUMENTS - FAIR VALUE AND RISK MANAGEMENT CONTD. Trade and other receivables contd.
Expected Loss rate Company
Age analysis of trade receivables: 2021 2020 2021 2020
Rs.000 Rs.000
0-120 1% 1% 2,786,692 2,508,425
120-240 4% 5% 287,274 371,646
240-364 16% 13% 41,402 64,792
Over 365 100% 100% 556,047 529,868
Trade receivables - Gross 3,671,415 3,474,732
Loss allowance 20% 20% (744,330) (703,245)
Trade receivables - Net 2,927,085 2,771,487
Trade receivables and contract assets are written off where there is no reasonable expectation of recovery. Indicators that there is no reasonable expectation of recovery include, amongst others, the failure of a debtor to engage in a repayment plan with the group, and a failure to make contractual payments for a period assessed by the board of directors.
Loans Given to Related Parties The Group’s amount due from related parties consist of the balances from affiliate companies.
Except for the specific provisions identified, the Company believes that there is no credit risk from the receivables from the related parties, because these counterparties are under the control of the Company’s ultimate shareholders, who are financially healthy companies.
These balances represent amount receivable on demand. At Company level these related party exposures are closely monitored to avoid any negative impact by way of credit risk.
Group Company
Carrying Amount 2021 2020 2021 2020
Rs.000 Rs.000 Rs.000 Rs.000
Loans to related companies 1,985,921 1,875,235 6,026,783 10,123,408
Amount due from Related Companies 291,754 535,142 1,048,951 1,273,392
2,277,675 2,410,377 7,075,733 11,396,800
Less: Provision for Intercompany Receivables (6,621) (6,621) (31,218) (146,218)
2,271,054 2,403,756 7,044,515 11,250,582
Cash at Bank The Group held cash at bank of Rs. 2,082 Mn as at the reporting date, which represents its maximum credit exposure on theses
assets. The Cash and cash equivalents are held with bank and financial institution counterparties, with good credit ratings.

Annual Report 2020/21 / 163
Impairment losses The movement in the allowance for impairment in respect of trade and other receivables during the year was as follows.
Carrying Amount Company
Rs.000
Balance at 1 April 2019 446,353
Impairment loss recognised 256,892
Balance at 31 March 2020 703,245
Impairment loss recognised 41,085
Balance at 31 March 2021 744,330
42.2 Liquidity Risk Liquidity risk is the risk that Group will encounter difficulty in meeting the Obligations associated with its financial liabilities that
are settled by delivering cash or another financial assets. The Group’s approach to managing liquidity is to ensure, as far as possible, that it will always have sufficient liquidity to meet its liabilities when due, under both normal and stressed conditions, without incurring unacceptable losses or risking damage to the Group’s reputation.
The Group’s policy is to hold cash and undrawn committed facilities at a level sufficient to ensure that the Group has available funds to meet its short and medium term capital and funding obligations, including organic growth and acquisition activities, and meet any unforeseen obligations and opportunities. The Group hold cash and undrawn committed facilities to enable the group to manage its liquidity risk.
The Group monitors its risk to a shortage of funds using a daily cash management process. This process considers the maturity of both the Group’s financial investments and financial assets (e.g. trade receivable, other financial assets) and projected cash from operations.
The Group objective is to maintain a balance between continuity of funding and flexibility through the use of multiple sources of funding including bank loans, overdrafts and finance leases over a broad spread of maturities.
Maturity Analysis On demand Less than 3 3 to 12 More than 2021months months 1 years Total
Rs.000 Rs.000 Rs.000 Rs.000 Rs.000
GroupInterest bearing borrowings - - 3,350,636 24,383,877 27,734,513 Short term interest bearing borrowings and bank overdrafts - 14,607,116 - - 14,607,116 Trade and Other payables 14,284,748 - - - 14,284,748 Amounts due to related parties 14,730,241 - - - 14,730,241 Loans from related parties 16,130,932 - - 4,837,782 20,968,715 Other payables - 269,765 - - 269,765
45,145,922 14,876,881 3,350,636 29,221,660 92,595,099
CompanyInterest bearing borrowings - - 2,938,173 2,771,223 5,709,397 Short term interest bearing borrowings and bank overdrafts - 11,667,677 - - 11,667,677 Trade and Other payables 3,434,539 - - - 3,434,539 Amounts due to related parties 843,875 - - - 843,875 Loans from related parties 1,956,904 - - - 1,956,904 Other payables - 5,913 - - 5,913
6,235,318 11,673,590 2,938,173 4,915,731 23,618,304

164 / BROWN AND COMPANY PLC
NOTES TO THE FINANCIAL STATEMENTS
42. FINANCIAL INSTRUMENTS - FAIR VALUE AND RISK MANAGEMENT CONTD.42.2.1 Net Debt
Group Company As at 31st March 2021 2020 2021 2020
Rs.000 Rs.000 Rs.000 Rs.000
Other Current Financial Assets 3,191,482 2,006,641 1,814,175 1,609,521 Cash in hand and at bank 2,978,887 1,647,089 172,471 81,085 Total liquid assets 6,170,369 3,653,730 1,986,646 1,690,605 Non current portion of borrowings 17,597,510 12,481,214 2,394,972 2,169,815 Short term borrowings 14,299,903 12,677,958 11,567,041 8,986,384 Current portion of borrowings 3,053,794 2,244,541 2,872,585 1,555,831 Bank overdrafts 307,213 1,178,163 100,637 801,250 Lease Liabilities 7,083,210 6,082,952 441,838 448,976 Loans from Related Parties 16,130,932 360,490 1,956,904 203,704 Total liabilities 58,472,561 35,025,319 19,333,977 14,165,961
Net debt (52,302,193) (31,371,589) (17,347,331) (12,475,356)
42.3 Market Risk Market risk is the risk that the fair value of future cash flows of a financial instrument will fluctuate because of changes in
market prices.
Market risk comprise of the following types of risk: Interest Rate Risk
Currency Risk
Commodity price risk
Equity Price Risk
The objective of market risk management is to manage and control market risk exposures within acceptable parameters, while optimizing the return.
The analysis excludes the impact of movements in market variables on the carrying values of other post-retirement obligations, provisions, and the non-financial assets and liabilities.
42.3.1 Interest Rate Risk Interest rate risk is the risk that the fair value or future cash flows of a financial instrument will fluctuate because of changes in
market interest rates. The Group’s exposure to the risk of changes in market interest rates relates primarily to the Group’s debt obligations with floating interest rates.
Most lenders grant loans under floating interest rates. The management periodically analyse the interest rate movements to manage this risk by taking mitigating actions.
The global outbreak of the novel COVID-19 pandemic has resulted in consecutive reductions in policy rates and monetary easing policies by Central Bank of Sri Lanka to encourage banks and finance companies to reduce lending rates.
42.3.2 Foreign Currency Risk Foreign currency risk is the risk that the fair value or future cash flows of a financial instrument will fluctuate because of changes in
foreign exchange rates. The Group has exposure to foreign currency risk where it has cash flows in overseas operations and foreign currency transactions which are affected by foreign exchange movements. Group treasury analyses the market condition of foreign exchange and provides market updates to the board, with the use of external consultants’ advice. Based on the suggestions made by Group treasury, the board takes decisions on whether to hold, sell, or make forward bookings of foreign currency.

Annual Report 2020/21 / 165
42.3.2.1 Exposure The company’s exposure to foreign currency risk at the end of the reporting period, was as follows:
Company 2021 2020As at 31st March USD LKR Others USD LKR Others
Trade and other receivable 80,358 3,591,422 211 332,834 3,142,697 136 Loans to related companies - 6,026,783 - - 10,123,408 - Amount due from Related Companies - 1,017,733 - - 1,127,174 - Cash at Bank - 170,225 - - 77,338 - Loans and Borrowings - 17,276,436 - - 12,783,245 - Trade and Other Payables 241,713 3,163,112 29,714 20,382 2,533,815 25,183 Loans from Related Parties - 1,956,904 - - 203,704 - Amounts due to Related Parties - 843,875 - - 474,189 - Bank Overdrafts - 100,637 - - 801,250 -
Capital management The board’s policy is to maintain a strong capital base so as to maintain investor, creditor and market confidence and sustain
future development of the business. Capital consist of ordinary share, retained earnings and non- controlling interests of the group. The Board of Directors monitors the return on capital as well as the level of dividends to ordinary share holders.
The Board seeks to maintain a balance between the higher returns that might be possible with the higher levels of borrowings and the advantage and security afforded by a sound capital position.
Group Company2021 2020 2021 2020
Rs.000 Rs.000 Rs.000 Rs.000
Net debt 52,302,193 31,371,589 17,347,331 12,475,356 Total equity 97,068,688 76,754,721 30,278,266 27,992,880 Net debt to equity ratio 54% 41% 57% 45%
42.4.1 Financial Instruments - Group a) The fair value of a financial instrument is the amount at which the instrument could be exchanged or settled between
knowledgeable and willing parties in an arm’s length transaction, other than in a forced liquidation or sale.
(i) Classes of financial instruments that are not carried at fair value and of which carrying amounts are a reasonable approximation of fair value are trade and other receivables, amounts due from related parties, loans given to related parties, loans receivables, cash and cash equivalents, trade and other payables, amount due to related parties, loans from related parties and loans and borrowings.
Financial assets and liabilities in the tables below are split into categories in accordance with SLFRS 9
Financial assets by categories Financial assets at amortised cost
Financial assets at fair value through profit or
loss (FVTPL)
Fair Value through Other comprehensive income
(FVOCI)
Total Fair Value
As at As at As at As at As at As at As at As at31st March 31st March 31st March 31st March 31st March 31st March 31st March 31st March
2021 2020 2021 2020 2021 2020 2021 2020Rs.000 Rs.000 Rs.000 Rs.000 Rs.000 Rs.000 Rs.000 Rs.000
Financial instruments in non-current assetsOther non-current financial assets 11,064 9,188 - - 1,598,521 859,987 1,609,585 869,175
Financial instruments in current assetsTrade and other receivables 7,872,596 6,864,716 - - - - 7,872,596 6,864,716 Loans to Related Parties 1,985,921 1,875,235 - - - - 1,985,921 1,875,235 Amounts due from related parties 285,133 528,521 - - - - 285,133 528,521 Other current financial assets 1,172,548 394,159 2,018,934 1,612,483 - - 3,191,482 2,006,641 Cash at bank 2,953,643 1,611,937 - - - - 2,953,643 1,611,937 Total 14,280,905 11,283,756 2,018,934 1,612,483 1,598,521 859,987 17,898,360 13,756,226
Both carrying amounts and fair value of Fair Value through Other comprehensive income (FVOCI) financial assets and financial assets at fair value through profit or loss are equal.
The fair value of loans and receivables does not significantly vary from the value based on the amortised cost methodology

166 / BROWN AND COMPANY PLC
NOTES TO THE FINANCIAL STATEMENTS
42. FINANCIAL INSTRUMENTS - FAIR VALUE AND RISK MANAGEMENT CONTD.42.4.1 Financial Instruments - Group
Financial liabilities by categories Financial liabilities measured at
amortised cost As at 31st March 2021 2020
Rs.000 Rs.000
Financial instruments in non-current liabilities
Borrowings 17,597,510 12,481,214
Loan from Related parties 4,837,782 4,099,589
Total 22,435,292 16,580,803
Financial instruments in current liabilities
Trade and other payables 14,284,748 9,366,269
Amounts due to related parties 14,730,241 18,932,413
Loans from Related parties 16,130,932 360,490
Short term borrowings 14,299,903 12,677,958
Current portion of borrowings 3,350,636 2,614,968
Other current financial liabilities 269,765 241,843
Bank overdrafts 307,213 1,178,163
Total 63,373,440 45,372,104
The fair value of financial liabilities does not significantly vary from the value based on the amortised cost methodology.
42.4.2 Financial Instruments - Company Financial assets and liabilities in the tables below are split into categories in accordance with SLFRS 9
Financial assets by categories Financial assets at amortised cost
Financial assets at fair value through profit or
loss (FVTPL)
Fair Value through Other comprehensive income
(FVOCI)
Total Fair Value
As at As at As at As at As at As at As at As at31st March 31st March 31st March 31st March 31st March 31st March 31st March 31st March
2021 2020 2021 2020 2021 2020 2021 2020Rs.000 Rs.000 Rs.000 Rs.000 Rs.000 Rs.000 Rs.000 Rs.000
Financial instruments in current assetsTrade and other receivables 3,671,991 3,475,667 - - - - 3,671,991 3,475,667 Loans to related parties 6,026,783 10,123,408 - - - - 6,026,783 10,123,408 Amounts due from related parties 1,017,733 1,127,174 - - - - 1,017,733 1,127,174 Other current financial assets - - 1,814,176 1,609,521 - - 1,814,176 1,609,521 Cash at bank 170,225 77,338 - - - - 170,225 77,338 Total 10,886,731 14,803,587 1,814,176 1,609,521 - - 12,700,907 16,413,108
Both Carrying amounts and fair value of FVOCI financial assets and financial assets at fair value through profit or loss are equal.
The fair value of financial asset and liabilities at amortised cost does not significantly vary from the value based on the amortised cost methodology for the company.

Annual Report 2020/21 / 167
Financial liabilities by categories Financial liabilities measured at
amortised cost As at 31st March 2021 2020
Rs.000 Rs.000
Financial instruments in non-current liabilities
Loans and Borrowings 2,394,972 2,169,815
Total 2,394,972 2,169,815
Financial instruments in current liabilities
Trade and other payables 3,434,539 2,579,381
Amounts due to related parties 843,875 474,189
Loan from Related parties 1,956,904 203,704
Short term borrowings 11,567,041 8,986,384
Current portion of borrowings 2,872,585 1,555,831
Other current financial liabilities 5,913 22,502
Bank overdrafts 100,637 801,250
Total 20,781,494 14,623,241
The Company has not designated financial liabilities upon initial recognition, fair value through profit or loss.
The fair value of financial liabilities does not significantly vary from the value based on the amortised cost methodology.
42.4.3 Financial Assets and Liabilities by Fair Value Hierarchy - Group The Group uses the following hierarchy for determining and disclosing the fair value of financial instruments by valuation
technique:
Level 1: Quoted (unadjusted) prices in active markets for identical assets or liabilities;
Level 2: Other techniques for which all inputs with significant effect on the recorded fair values are observable, either directly or indirectly;
Level 3: Techniques that use inputs that have a significant effect on the recorded fair value that are not based on observable market data
Fair value of financial instruments by classes that are not carried at fair value and of which carrying amounts are reasonable approximation of fair value are current trade and other financial receivables and payables, current and non-current loans and borrowings at floating rate, other bank deposits and cash and bank balances.
The carrying amounts of these financial assets and liabilities are a reasonable approximation of fair value, either due to their short-term nature or that they are floating rate instruments that are re-priced to market interest rates on or near the reporting date.

168 / BROWN AND COMPANY PLC
NOTES TO THE FINANCIAL STATEMENTS
42. FINANCIAL INSTRUMENTS - FAIR VALUE AND RISK MANAGEMENT CONTD.42.4.3 Financial Assets and Liabilities by Fair Value Hierarchy - Group Contd. The Group held the following financial instruments carried at fair value in the statement of financial position:
Level 1 Level 2 Level 3 Maturity Analysis As at As at As at As at As at As at
31st March 31st March 31st March 31st March 31st March 31st March2021 2020 2021 2020 2021 2020
Rs.000 Rs.000 Rs.000 Rs.000 Rs.000 Rs.000
Financial assetsFair value through profit or loss 2,018,934 - - 1,612,483 - - Fair Value through Other comprehensive income - - 515,640 197,612 1,082,881 662,375 Loans & Receivable - - - - 1,183,612 98,430 Total 2,018,934 - 515,640 1,810,095 2,266,493 760,805
For financial assets at fair value through profit or loss and Fair Value through Other comprehensive income financial assets, the carrying amount and fair value are equal.
The fair value of loans and receivables does not significantly vary from the value based on the amortised cost methodology.
42.4.4 Financial Assets and Liabilities by Fair Value Hierarchy - Company The Company uses the following hierarchy for determining and disclosing the fair value of financial instruments by valuation
technique:
Level 1: Quoted (unadjusted) prices in active markets for identical assets or liabilities;
Level 2: Other techniques for which all inputs with significant effect on the recorded fair values are observable, either directly or indirectly;
Level 3: Techniques that use inputs that have a significant effect on the recorded fair value that are not based on observable market data
The company held the following financial instruments carried at fair value in the statement of financial position:
Level 1 Level 2 Level 3As at As at As at As at As at As at
31st March 31st March 31st March 31st March 31st March 31st March2021 2020 2021 2020 2021 2020
Rs.000 Rs.000 Rs.000 Rs.000 Rs.000 Rs.000
Financial assetsFair value through profit or loss 1,814,176 - - 1,609,521 - - Fair Value through Other comprehensive income
- - - - 55,000 55,000
Total 1,814,176 - - 1,609,521 55,000 55,000
42.4.5 Valuation techniques and significant unobservable inputs used as follows Valuation Technique - Net assets basis/ Market return on a comparable investment.
Significant unobservable inputs - Carrying value of assets and liabilities adjusted for market participant assumptions/ Current market interest rates.
Relationship between inputs and fair value measurement - Variability of inputs are insignificant to have an impact on fair values.

Annual Report 2020/21 / 169
43. COMMITMENTS AND CONTINGENT LIABILITIES 43.1 Commitments Company There have been no capital commitments contracted but provided for, or authorized by the board but not contracted for,
outstanding as at the reporting date.
Group Companies There have been no capital commitments contracted but provided for, or authorized by the board but not contracted for,
outstanding as at the reporting date other than followings,
a) Browns Ari Resort (Private) Limited The Board of Directors of Browns Ari Resort Private Limited has approved US$ 3 Mn budget for the construction of a resort in
Bodufinolhu Island in Republic of Maldives.
b) Bodufaru Beach Resort (Private) Limited The Board of Directors of Bodufaru Beach Resort Private Limited has approved US$ 102 Mn budget for the construction of a
tourist resort in in Republic of Maldives.
c) NPH Investment (Private) Limited NPH Investment Private Limited is required to construct and develop a hotel in accordance with development concept
submitted by the management and approved by the Government of Maldives, within a maximum period of thirty Six (36) months from the commencement date of the lease agreement entered. However, said agreement has been amended and has extended the construction period until 7 September 2022. The commitment for construction of the city hotel of NPH Investment Private Limited as at the reporting date is US$ 26 Mn.
d) Riverina Resorts (Private) Limited Capital Commitments of Riverina Resort (Private) Limited as at 31st March amounted to Rs. 4,763 Mn.
43.2 Contingent Liabilities Company a. A corporate guarantee has been issued to Sampath Bank PLC for sum of Rs. 650 Mn for the Banking facilities obtained by
Browns Industrial Park(Pvt) Ltd.
b. A corporate guarantee has been issued to Hatton National Bank PLC for sum of Rs. 50 Mn, for the Banking facilities obtained by BG Air Services (Pvt) Ltd.
c. A corporate guarantee has been issued to Seylan Bank PLC for sum of Rs. 250 Mn for the banking facilities obtained by Gal Oya Plantations (Pvt) Ltd.
d. A corporate guarantee has been issued to People’s Bank for sum of Rs. 400 Mn for the credit facilities obtained by Gal Oya Plantations (Pvt) Ltd.
e. A corporate guarantee has been issued to DFCC Bank for sum of Rs. 525 Mn for the Banking facilities obtained by Browns Agri Solutions (Pvt) Ltd.

170 / BROWN AND COMPANY PLC
NOTES TO THE FINANCIAL STATEMENTS
43. COMMITMENTS AND CONTINGENT LIABILITIES CONTD.
Bank Name Performance/Bid Bond/ Advance
Payment Guarantees
Shipping Guarantees
Letter of Credit
Rs. Rs. Rs.
Hatton National Bank - 147,300,000 479,634,012
MCB Bank - 53,767,049 235,818,591
Sampath Bank 36,561,802 - 12,349,028
National Development Bank - 1,155,790,986 463,603,976
Cargills Bank - - 16,497,113
Standard Chartered Bank - 57,039,212 574,155,724
Group Companies a) Browns Agri Solutions (Pvt) Ltd.
Letter of Credits; Rs.
Letter of credit 97,068,098
b) Browns Investments PLC A corporate guarantee has been given to Peoples Bank for a sum of Rs.360Mn for facilities obtained by Ajax Engineers (Pvt) Ltd.
A corporate guarantee has been given to Sampath Bank for a sum of Rs.100 Mn for facilities obtained by Ajax Engineers (Pvt) Ltd.
A corporate guarantee has been given to Nations Trust Bank PLC for a sum of Rs.160 Mn for facilities obtained by Ajax Engineers (Pvt) Ltd.
A corporate guarantee has been given to DFCC Bank for a sum of Rs.155 Mn for facilities obtained by Ajax Engineers (Pvt) Ltd.
A corporate guarantee has been issued to the Commercial Leasing & Finance PLC for a sum of Rs. 100 Mn for the facility obtained by Ajax Engineers (Pvt) Ltd.
A corporate guarantee has been given to State Bank of India for a sum of USS 400,000 for facilities obtained by Gurind Accor (Pvt) Ltd.
A corporate guarantee has been given to Commercial Leasing & Finance PLC for a sum of Rs.1Bn for facilities obtained by Brown & Company PLC.
A corporate guarantee has been given to MCB Bank for a sum of Rs.700 Mn for facilities obtained by Brown & Company PLC.
A corporate guarantee has been issued to the Commercial Leasing & Finance PLC for a sum of Rs. 49 Mn for the facility obtained by Zhong Tian Ding Hui (Pvt) Ltd.
A corporate guarantee has been issued to the LOLC Finance PLC for a sum of Rs. 200 Mn for the facility obtained by Zhong Tian Ding Hui (Pvt) Ltd.

Annual Report 2020/21 / 171
c) Samudra Baech Resorts ( Pvt) Ltd Guarantees given by Hatton National Bank to Sri Lanka Customs a for VAT department amounting to Rs. 9,302,866/-.
d) BG Air Services (Pvt) Ltd Guarantees given by Hatton National Bank to Civil Aviation Authority of Sri Lanka for Air Transport License amounting to
Rs. 500,000/-.
e) Browns Properties (Pvt) Ltd The Company has issued an indemnity in favor of Colombo Municipal Council against any claims or demands for any damages
to the adjacent structures and movable and immovable properties due to the construction and also relating to boundary disputes and/or ownership disputes including access roads and service lines and issues relating to the height or number of floors issues at the property at No.19, Dudley Senanayake Mawatha., Colombo 08.
f) Maturata Plantations Ltd The contingencies in respect of pending litigations before Labour Tribunals are not expected to crystallize in a material liability
to the Maturata Plantations Ltd.
The 8% cumulative preference dividends computed up to 31st March, 2021 amounted to Rs.61,957,100/= 2019/20 - Rs. 57,900,170/=). However, this amount has not been accrued as payable in the financial statements, since it is classified under Equity of Maturata Plantations Limited.
g) Sun and Fun Resorts Ltd At present, a letter of Demand has been sent by the previous Architect in relation to a balance payment by the company. The
company lawyers of the company are looking to this issue at present.
h) Browns Engineering & Construction (Pvt) Ltd Guarantees given by Seylan Bank PLC to Huawei Technologies (Pvt) Limited for a sum of Rs. 252 Mn.
Guarantees given by Seylan Bank PLC to ZTE Lanka (Pvt) Limited for a sum of Rs. 49 Mn.
Guarantees given by LOLC Finance PLC to Sri Lanka Telecom PLC for a sum of Rs. 137 Mn.
44. COMPARATIVE INFORMATION Comparative information has been reclassified to conform to the current year’s classification and presentation where
necessary.
45. SUBSEQUENT EVENTS Subsequent to the reporting date, no circumstances have arisen which would require adjustments to or disclosure in the
Financial Statements other than following.
a) Investment in Hatton National Bank by Browns Investments PLC On 4th May 2021 Browns Investments PLC, subsidiary of the group acquired 9.99% of the ordinary voting shares of Hatton
National Bank PLC. Total Consideration of the transactions was Rs. 5,526 Mn.
b) Investment in PL Resorts Limited in Mauritius BI Leisure Holdings FZE was incorporated in the UAE, with the objective of acquiring and developing a few Leisure properties
outside Sri Lanka, on 13th July 2021.
BI Leisure Holdings FZE entered into a Share Sale & Purchase Agreement to acquire 21,500,000 shares (100%) of PL Resort Limited, a private limited company incorporated in Mauritius at a value of USD 12 Mn. The purchase consideration of this acquisition is USD 3.7 Mn after deducting the existing debts from the aforesaid value. PL Resort Limited owns a 100-room luxury beach resort in Mauritius which is managed and operated by the famed Radisson hotel management Company under the Radisson Blu brand.

172 / BROWN AND COMPANY PLC
NOTES TO THE FINANCIAL STATEMENTS
46 SEGMENTAL INFORMATION 46.1 Primary Segments (Business Segments) 46.1.1 Group
Trading Manufacturing & Constructions
Investments Plantation Leisure Real Estate Health Care Others Adjustments Group Total
2021 2020 2021 2020 2021 2020 2021 2020 2021 2020 2021 2020 2021 2020 2021 2020 2021 2020 2021 2020
Rs.000 Rs.000 Rs.000 Rs.000 Rs.000 Rs.000 Rs.000 Rs.000 Rs.000 Rs.000 Rs.000 Rs.000 Rs.000 Rs.000 Rs.000 Rs.000 Rs.000 Rs.000 Rs.000 Rs.000
a) Segment Result
Revenue 18,613,162 12,675,381 5,451,406 3,459,310 - - 3,848,352 1,874,340 878,913 1,276,235 280,903 332,052 - 791,804 425,437 430,621 (107,137) (400,899) 29,391,036 20,438,843
Cost of Sales (14,438,540) (9,875,134) (4,010,297) (2,816,857) - - (3,039,057) (2,082,338) (415,305) (545,169) (18,027) (23,832) - (202,054) (186,175) (195,885) 15,941 284,316 (22,091,460) (15,456,951)
Gross Profit/ (Loss) 4,174,622 2,800,247 1,441,109 642,453 - - 809,295 (207,998) 463,609 731,066 262,876 308,221 - 589,750 239,262 234,736 (91,195) (116,583) 7,299,576 4,981,892
Add : Other Income/(Expenses) 273,582 (250,821) 64,340 45,319 143,100 273,035 195,294 114,552 20,183 1,045 (95,475) (85,432) - 8,580 - 133 (42,424) 66,661 558,602 173,072
Share of Loss of Equity Accounted Investees (Net of Income Tax) - - - - - - - - - - - - - - - - (122,597) (278,942) (122,597) (278,942)
Change in fair value of Investment Properties 453,809 1,843,783 900 (11,300) 263,126 128,109 - - 2,500 10,868 (13,419) (59,509) - - - - - - 706,916 1,911,951
Change in fair value of consumable biological assets - - - - - - 560,453 (136,816) - - - - - - - - - - 560,453 (136,816)
Gain on disposal of subsidiaries - - - - - - - - - - - - - - - - - 256,989 - 256,989
Gain on Bargaining Purchases - - - - - - - - - - - - - - - - 165,154 4,593,221 165,154 4,593,221
Less : Expenses (2,908,851) (3,381,072) (914,624) (782,615) (611,366) (1,303,518) (4,564,333) (3,010,910) (3,052,274) (3,242,581) (140,729) (106,882) - (526,352) (140,617) (169,028) 381,600 51,151 (11,951,194) (12,471,807)
Profit/ (Loss) before Taxation 1,993,162 1,012,137 591,725 (106,143) (205,140) (902,373) (2,999,291) (3,241,172) (2,565,982) (2,499,601) 13,253 56,397 - 71,977 98,644 65,841 290,538 4,572,496 (2,783,090) (970,441)
Income Tax Expense (325,383) (218,774) (82,882) (49,892) (22,695) (22,267) (156,018) (162,799) 35,114 (17,742) (9,911) (72,051) - - 441 (704) - - (561,334) (544,230)
Profit/ (Loss) for the Year 1,667,779 793,363 508,843 (156,034) (227,835) (924,641) (3,155,309) (3,403,971) (2,530,867) (2,517,343) 3,342 (15,654) - 71,977 99,085 65,138 290,538 4,572,496 (3,344,424) (1,514,671)
b) Segment Assets
Non-current Assets 41,795,718 27,477,600 2,809,865 2,088,745 71,373,080 30,067,705 70,470,705 54,895,702 73,789,918 47,981,430 9,289,427 9,205,608 - - 2,559,765 4,318,796 (106,928,919) (51,420,059) 165,159,559 124,615,528
Current Assets 15,996,968 20,710,039 10,886,023 5,531,017 28,221,219 22,129,895 4,846,582 4,256,339 6,208,273 4,980,066 1,100,638 875,447 - - 358,069 382,874 (37,015,586) (35,808,399) 30,602,185 23,057,277
57,792,685 48,187,639 13,695,888 7,619,761 99,594,298 52,197,600 75,317,287 59,152,040 79,998,191 52,961,497 10,390,065 10,081,056 - - 2,917,834 4,701,669 (143,944,505) (87,228,458) 195,761,744 147,672,805
c) Segment Liabilities
Non-current Liabilities 5,784,194 2,981,705 2,093,836 1,098,410 11,014,404 9,324,176 5,414,901 4,829,913 11,768,332 7,577,836 862,835 856,534 - - 1,310,468 1,422,243 (2,929,353) (2,544,836) 35,319,617 25,545,980
Current Liabilities 20,232,397 15,719,998 7,683,525 3,541,254 35,211,439 27,881,624 14,710,317 12,204,869 21,540,253 18,545,658 934,330 718,636 - - 265,277 513,381 (37,204,097) (33,753,317) 63,373,439 45,372,104
26,016,591 18,701,703 9,777,361 4,639,663 46,225,843 37,205,800 20,125,218 17,034,782 33,308,584 26,123,494 1,797,165 1,575,170 - - 1,575,744 1,935,624 (40,133,451) (36,298,153) 98,693,057 70,918,084

Annual Report 2020/21 / 173
46 SEGMENTAL INFORMATION 46.1 Primary Segments (Business Segments) 46.1.1 Group
Trading Manufacturing & Constructions
Investments Plantation Leisure Real Estate Health Care Others Adjustments Group Total
2021 2020 2021 2020 2021 2020 2021 2020 2021 2020 2021 2020 2021 2020 2021 2020 2021 2020 2021 2020
Rs.000 Rs.000 Rs.000 Rs.000 Rs.000 Rs.000 Rs.000 Rs.000 Rs.000 Rs.000 Rs.000 Rs.000 Rs.000 Rs.000 Rs.000 Rs.000 Rs.000 Rs.000 Rs.000 Rs.000
a) Segment Result
Revenue 18,613,162 12,675,381 5,451,406 3,459,310 - - 3,848,352 1,874,340 878,913 1,276,235 280,903 332,052 - 791,804 425,437 430,621 (107,137) (400,899) 29,391,036 20,438,843
Cost of Sales (14,438,540) (9,875,134) (4,010,297) (2,816,857) - - (3,039,057) (2,082,338) (415,305) (545,169) (18,027) (23,832) - (202,054) (186,175) (195,885) 15,941 284,316 (22,091,460) (15,456,951)
Gross Profit/ (Loss) 4,174,622 2,800,247 1,441,109 642,453 - - 809,295 (207,998) 463,609 731,066 262,876 308,221 - 589,750 239,262 234,736 (91,195) (116,583) 7,299,576 4,981,892
Add : Other Income/(Expenses) 273,582 (250,821) 64,340 45,319 143,100 273,035 195,294 114,552 20,183 1,045 (95,475) (85,432) - 8,580 - 133 (42,424) 66,661 558,602 173,072
Share of Loss of Equity Accounted Investees (Net of Income Tax) - - - - - - - - - - - - - - - - (122,597) (278,942) (122,597) (278,942)
Change in fair value of Investment Properties 453,809 1,843,783 900 (11,300) 263,126 128,109 - - 2,500 10,868 (13,419) (59,509) - - - - - - 706,916 1,911,951
Change in fair value of consumable biological assets - - - - - - 560,453 (136,816) - - - - - - - - - - 560,453 (136,816)
Gain on disposal of subsidiaries - - - - - - - - - - - - - - - - - 256,989 - 256,989
Gain on Bargaining Purchases - - - - - - - - - - - - - - - - 165,154 4,593,221 165,154 4,593,221
Less : Expenses (2,908,851) (3,381,072) (914,624) (782,615) (611,366) (1,303,518) (4,564,333) (3,010,910) (3,052,274) (3,242,581) (140,729) (106,882) - (526,352) (140,617) (169,028) 381,600 51,151 (11,951,194) (12,471,807)
Profit/ (Loss) before Taxation 1,993,162 1,012,137 591,725 (106,143) (205,140) (902,373) (2,999,291) (3,241,172) (2,565,982) (2,499,601) 13,253 56,397 - 71,977 98,644 65,841 290,538 4,572,496 (2,783,090) (970,441)
Income Tax Expense (325,383) (218,774) (82,882) (49,892) (22,695) (22,267) (156,018) (162,799) 35,114 (17,742) (9,911) (72,051) - - 441 (704) - - (561,334) (544,230)
Profit/ (Loss) for the Year 1,667,779 793,363 508,843 (156,034) (227,835) (924,641) (3,155,309) (3,403,971) (2,530,867) (2,517,343) 3,342 (15,654) - 71,977 99,085 65,138 290,538 4,572,496 (3,344,424) (1,514,671)
b) Segment Assets
Non-current Assets 41,795,718 27,477,600 2,809,865 2,088,745 71,373,080 30,067,705 70,470,705 54,895,702 73,789,918 47,981,430 9,289,427 9,205,608 - - 2,559,765 4,318,796 (106,928,919) (51,420,059) 165,159,559 124,615,528
Current Assets 15,996,968 20,710,039 10,886,023 5,531,017 28,221,219 22,129,895 4,846,582 4,256,339 6,208,273 4,980,066 1,100,638 875,447 - - 358,069 382,874 (37,015,586) (35,808,399) 30,602,185 23,057,277
57,792,685 48,187,639 13,695,888 7,619,761 99,594,298 52,197,600 75,317,287 59,152,040 79,998,191 52,961,497 10,390,065 10,081,056 - - 2,917,834 4,701,669 (143,944,505) (87,228,458) 195,761,744 147,672,805
c) Segment Liabilities
Non-current Liabilities 5,784,194 2,981,705 2,093,836 1,098,410 11,014,404 9,324,176 5,414,901 4,829,913 11,768,332 7,577,836 862,835 856,534 - - 1,310,468 1,422,243 (2,929,353) (2,544,836) 35,319,617 25,545,980
Current Liabilities 20,232,397 15,719,998 7,683,525 3,541,254 35,211,439 27,881,624 14,710,317 12,204,869 21,540,253 18,545,658 934,330 718,636 - - 265,277 513,381 (37,204,097) (33,753,317) 63,373,439 45,372,104
26,016,591 18,701,703 9,777,361 4,639,663 46,225,843 37,205,800 20,125,218 17,034,782 33,308,584 26,123,494 1,797,165 1,575,170 - - 1,575,744 1,935,624 (40,133,451) (36,298,153) 98,693,057 70,918,084

174 / BROWN AND COMPANY PLC
NOTES TO THE FINANCIAL STATEMENTS
47 NON CONTROLLING INTERESTS The following table summarises the information relating to Browns Investments PLC that has material NCI. Inter-company
eliminations have been made to the information for the Browns Investments PLC subgroup in order to show the interests of NCI in that subgroup as a whole.
Browns Investments PLC
As at 31st March 2021 2020
Holding % 64.55% 32.98%
NCI% 35.45% 67.02%
Rs.000 Rs.000
Total assets 163,391,827 116,145,866
Total liabilities (64,356,212) (62,086,402)
Net assets attributable to Equity Holders (48,859,342) (7,567,566)
Carrying value of NCI 50,176,273 46,491,898
Gross income 8,359,853 5,556,739
Profit/(Loss) for the year (4,785,814) (2,150,466)
Profit/(Loss) attributable to Equity Holders (1,458,617) 2,983,427
Profit/(Loss) attributable to NCI (3,327,198) (5,133,893)
OCI for the year 28,408,038 3,334,651
Net cash generated from/ (used in) Operating Activities (12,085,610) 3,824,920
Net cash used in from Investing Activities (6,479,963) (11,062,589)
Net cash generated from Financing Activities 19,840,773 7,991,361
Total net cash inflow 1,275,200 753,692

SUPPLEMENTARY INFORMATIONTen Year Summary 176Economic Value Statement 177Investor Relations 178Parent, Subsidiary and Associate Companies 180Glossary of Financial Terms 185Notice of the Annual General Meeting 186Form of Proxy 187
176
178
187
CONTENTTEN YEAR SUMMARY
INVESTOR RELATIONS
FORM OF PROXY

176 / BROWN AND COMPANY PLC
TEN YEAR SUMMARY
2021 2020 2019 2018 2017 2016 2015 2014 2013 2012
Group revenue 29,391,036 20,438,843 21,193,726 20,554,110 22,648,082 19,890,181 10,072,684 9,749,825 14,183,801 14,387,354 EBIT 2,799,436 4,448,224 3,979,584 5,402,671 7,330,374 133,830 2,083,560 2,834,467 1,525,039 3,880,945 Finance expenses (5,582,525) (5,418,665) (3,861,751) (2,970,629) (2,910,399) (1,370,381) (893,396) (1,023,541) (1,070,375) (418,956)Share of results of Equity Accounted Investees (122,597) (278,942) 56,017 77,845 66,225 53,651 83,718 (37,707) (301,790) (94,931)Profit/(Loss) before tax (2,783,090) (970,441) 117,833 2,432,042 4,419,975 (1,236,551) 1,190,164 1,810,926 454,664 3,461,989 Tax expense (561,334) (544,230) (114,889) (495,569) (458,499) (74,201) (75,793) (137,904) (43,063) (384,638)Profit/(Loss) for the year (3,344,424) (1,514,671) 2,944 1,936,473 3,961,476 (1,310,752) 1,114,371 1,673,022 411,601 3,077,351
Attributable to:Equity holders of the parent (16,046) 3,620,315 1,274,458 813,961 1,897,766 (205,109) 1,331,699 1,674,805 359,963 1,170,876 Non-Controlling interest (3,328,378) (5,134,986) (1,271,514) 1,122,512 2,063,710 (1,105,643) (217,328) (1,783) 51,638 1,906,475
(3,344,424) (1,514,671) 2,944 1,936,473 3,961,476 (1,310,752) 1,114,371 1,673,022 411,601 3,077,351
CAPITAL EMPLOYEDStated capital 9,093,101 9,093,101 9,093,101 2,005,601 2,005,601 2,005,601 2,005,601 2,005,601 2,005,601 2,005,601 Capital reserves 17,809,193 4,643,864 3,873,928 2,454,529 2,080,753 2,010,848 1,282,743 1,072,759 3,987,572 3,465,922 Revenue reserves 19,985,456 16,520,105 12,753,386 14,900,123 14,123,385 11,997,076 12,200,875 10,809,655 9,107,685 8,409,224 Share holders funds 46,887,750 30,257,070 25,720,415 19,360,253 18,209,739 16,013,525 15,489,219 13,888,015 15,100,858 13,880,747 Non-Controlling interests 50,180,938 46,497,651 20,471,343 17,179,560 15,012,565 18,145,838 17,499,633 8,462,687 5,988,139 9,272,243 Total equity 97,068,688 76,754,721 46,191,759 36,539,813 33,222,304 34,159,363 32,988,852 22,350,702 21,088,997 23,152,990 Total debt 63,310,343 39,124,907 26,128,926 18,011,778 15,405,063 16,098,683 14,083,558 10,308,733 7,306,923 5,340,827
160,379,031 115,879,630 72,320,684 54,551,591 48,627,367 50,258,047 47,072,410 32,659,435 28,395,920 28,493,817
ASSETS EMPLOYEDProperty, plant and equipment (PPE) 105,513,324 79,958,922 35,302,341 30,939,740 25,271,442 22,499,974 19,464,012 14,625,051 6,813,396 6,509,437 Non-current assets other than PPE 59,646,235 44,656,606 38,120,004 27,615,835 22,345,198 25,322,724 23,331,866 11,903,802 13,964,693 14,793,014 Current assets 30,602,185 23,057,277 19,313,775 16,706,508 18,438,331 13,715,280 11,989,412 8,731,912 10,211,008 11,528,464 Liabilities other than debt (35,382,713) (31,793,176) (20,415,436) (20,710,492) (17,427,604) (11,279,931) (7,712,880) (2,601,330) (2,593,177) (4,337,098)
160,379,031 115,879,630 72,320,684 54,551,591 48,627,367 50,258,047 47,072,410 32,659,435 28,395,920 28,493,817
CASH FLOWNet cash flows generated from / (used in) operating activities (5,921,038) 8,922,656 (6,327,487) (2,761,368) 6,746,905 714,220 (633,413) (1,347,635) (1,355,187) (588,276)Net cash flows generated from / (used in) investing activities (5,212,951) (13,426,033) (8,870,409) (4,173,486) (5,521,737) (1,826,082) (2,026,387) 87,306 (1,118,345) (2,076,461)Net cash flows generated from / (used in) financing activities 13,336,737 5,422,655 14,785,630 2,185,327 2,335,446 1,890,376 2,995,879 2,157,494 1,351,402 1,851,675 Net Increase / (decrease) in Cash and Cash Equivalents during the year 2,202,747 919,278 (412,265) (4,749,526) 3,560,614 778,514 336,079 897,165 (1,122,130) (813,063)
KEY INDICATORSEarnings/ (Loss) per Share (Rs.) (0.08) 17.03 7.22 11.48 26.78 (2.89) 18.79 23.63 5.08 16.52Net Assets per Share (Rs.) 220.52 142.30 120.97 273.16 256.93 225.94 218.54 195.95 213.06 195.85Market Price per Share (Rs.) 155.2 42.0 48.0 69.0 71.0 79.8 96.5 90 117.9 155.1Market Capitalization 33,005,779 8,930,250 10,206,000 4,890,375 5,032,125 5,655,825 6,839,438 6,378,750 8,356,163 10,992,713Return on Shareholders’ funds (%) (0.03) 11.97 4.96 4.20 10.42 (1.28) 8.6 12.06 2.38 8.44Return on Capital Employed (%) 1.75 3.84 5.50 9.90 15.07 0.27 4.43 8.68 5.37 13.62Price Earnings Ratio (times) (2,056.96) 2.47 6.65 6.01 2.65 (27.57) 5.17 3.81 23.21 9.39Interest Cover (times covered) 0.50 0.82 1.03 1.82 2.52 0.10 2.33 2.77 1.42 9.26Current Ratio (times) 0.48 0.51 0.58 0.57 0.71 0.81 0.92 0.89 1.35 1.8Debt to Equity Ratio (%) 65.22 50.97 56.57 49.29 46.37 47.13 41.22 45.58 34.65 23.07Number of Shares 212,625 212,625 212,625 70,875 70,875 70,875 70,875 70,875 70,875 70,875

Annual Report 2020/21 / 177
Group
2021 2020
Rs.000 Rs.000
Economic Value Generated
Revenue 29,391,036 20,438,843
Interest Income 542,923 420,718
Dividend Income 38,389 7,861
Change in Fair Value of Investment Properties 706,916 1,911,951
Gain on Disposal of Investment in Subsidiaries - 256,989
Other Income 1,302,093 5,317,269
31,981,358 28,353,631
Economic Value Distributed
Operating Costs 23,970,220 19,355,941
Employee Wages and Benefits 3,075,988 2,973,303
Payments to Providers of Funds 5,582,526 5,418,665
Payments to Government 561,334 544,230
33,190,067 28,292,139
Economic Value Retained
Depreciation 2,110,350 1,563,122
Amortization 25,364 13,041
Profit/ (Loss) for the year (3,344,424) (1,514,671)
(1,208,710) 61,492
ECONOMIC VALUE STATEMENT

178 / BROWN AND COMPANY PLC
INVESTOR RELATIONS
SHARE ANALYSIS AS AT 31ST MARCH 2021
TOTAL
NO. OFSHAREHOLDERS
NO. OFSHARES
%
1 to 1,000 shares 1,889 488,639 0.23
1,001 to 10,000 shares 756 2,897,099 1.36
10,001 to 100,000 shares 356 9,347,443 4.40
100,001 to 1,000,000 shares 36 9,384,039 4.41
Over 1,000,000 shares 10 190,507,780 89.60
Total 3,047 212,625,000 100.00
CATEGORIES OF SHAREHOLDERS
NO. OFSHAREHOLDERS
NO. OFSHARES
%
Individual 2,863 16,211,791 7.62
Institutional 184 196,413,209 92.38
Total 3,047 212,625,000 100.00
Resident 2,846 206,611,740 97.17
Non-Resident 201 6,013,260 2.83
Total 3,047 212,625,000 100.00
DIRECTORS’ SHAREHOLDINGS
NO. OF SHARES 31ST MARCH 2021
31ST MARCH 2020
Mr. Ishara Nanayakkara 299,700 299,700
Mr. Kapila Jayawardena Nil Nil
Mrs. Kalsha Amarasinghe Nil Nil
Mr. Janaka de Silva Nil Nil
Mr. Tissa Bandaranayake Nil Nil
Mr. Danesh Abeyrathne Nil Nil
SHARE PRICE INFORMATION ON ORDINARY SHARES OF THE COMPANY FOR FIVE YEARS
Year High Low Close
Rs. Rs. Rs.
2020 - 2021 285.00 35.00 155.25
2019 - 2020 92.30 36.90 42.00
2018 - 2019 74.00 46.50 48.00
2017 - 2018 104.90 68.50 69.00
2016 - 2017 102.00 68.00 71.00

Annual Report 2020/21 / 179
LIST OF 20 MAJOR SHAREHOLDERS
31.03.2021 NO.OF 31.03.2020 NO.OF
NAME SHARES % NAME SHARES %
1 LOLC HOLDINGS PLC 82,092,103 38.61 1 LOLC HOLDINGS PLC 82,092,103 38.61
2 SEYLAN BANK PLC/LOLC HOLDINGS PLC (COLLATERAL)
60,000,000 28.22 2 SEYLAN BANK PLC/LOLC HOLDINGS PLC (COLLATERAL)
60,000,000 28.22
3 ENGINEERING SERVICES (PVT) LIMITED
16,588,962 7.80 3 ENGINEERING SERVICES (PVT) LIMITED
16,588,962 7.80
4 MASONS MIXTURE LIMITED 13,732,632 6.46 4 MASONS MIXTURE LIMITED 13,732,632 6.46
5 EMPLOYEE’S PROVIDENT FUND 6,914,625 3.25 5 EMPLOYEE’S PROVIDENT FUND 6,914,625 3.25
6 BROWNS HOLDINGS LIMITED 4,948,182 2.33 6 BROWNS HOLDINGS LIMITED 4,948,182 2.33
7 MR. SHANKER VARADANANDA SOMASUNDERAM
2,149,067 1.01 7 COMMERCIAL BANK OF CEYLON PLC/S.V.SOMASUNDERAM
4,079,900 1.92
8 ACE BONUS INVESTMENTS LIMITED 1,755,000 0.83 8 ACE BONUS INVESTMENTS LIMITED 1,755,000 0.83
9 COMMERCIAL BANK OF CEYLON PLC/S.V.SOMASUNDERAM
1,171,312 0.55 9 VYJANTHI & COMPANY LTD. 1,155,897 0.54
10 VYJANTHI & COMPANY LTD. 1,155,897 0.54 10 MR. SHANKER VARADANANDA SOMASUNDERAM
978,385 0.46
11 KASHYAPA CAPITAL (PVT) LTD 869,565 0.41 11 KASHYAPA CAPITAL (PVT) LTD 869,565 0.41
12 SRI LANKA INSURANCE CORPORATION LTD - LIFE FUND
786,990 0.37 12 BANK OF CEYLON NO. 1 ACCOUNT 809,616 0.38
13 COMMERCIAL BANK OF CEYLON PLC/S.A.GULAMHUSEIN
716,015 0.34 13 LOLC FINANCE PLC/ J.M.S.ROHINI 807,225 0.38
14 BANK OF CEYLON NO. 1 ACCOUNT 702,946 0.33 14 SRI LANKA INSURANCE CORPORATION LTD - LIFE FUND
786,990 0.37
15 HATTON NATIONAL BANK PLC/SUBRAMANIAM VASUDEVAN
650,606 0.31 15 COMMERCIAL BANK OF CEYLON PLC/S.A.GULAMHUSEIN
716,015 0.34
16 AMANA BANK PLC/MR. MOHAMED NAYAZ DEEN
547,257 0.26 16 NATIONAL SAVINGS BANK 683,016 0.32
17 HATTON NATIONAL BANK PLC/IHALAGAMAGE PUNARJEEVA KARUNANAYAKE
366,281 0.17 17 MRS. PAMELA CHRISTINE COORAY 506,408 0.24
18 HATTON NATIONAL BANK PLC/ARUNASALAM SITHAMPALAM
341,695 0.16 18 MRS. JAYAWEERA MUHANDIRAMGE SUMEDA ROHINI
394,656 0.19
19 MRS. PAMELA CHRISTINE COORAY 331,408 0.16 19 HATTON NATIONAL BANK PLC/ARUNASALAM SITHAMPALAM
307,680 0.14
20 MR. ISHARA CHINTHAKA NANAYAKKARA
299,700 0.14 20 SEYLAN BANK PLC/PUBUDHU SARANGA WIJAYAKUMARI RUPASINGHE
300,000 0.14
TOTAL 196,120,243 92.25 TOTAL 198,426,857 93.33
No. of shares held by public 34,963,421 16.44 No. of shares held by public 34,963,421 16.44
No. of public shareholders 3,041 No. of public shareholders 2,523
Float adjusted market capitalisation - Rs.5,426,849,137.50
The Company complies with minimum public holding requirement under Option 1 as set out in the Listing Rules 7.13.1 (b) as at reporting date.

180 / BROWN AND COMPANY PLC
PARENT, SUBSIDIARY AND ASSOCIATE COMPANIES
COMPANY DIRECTORS
LOLC Holdings PLC Ishara NanayakkaraKapila JayawardenaKalsha AmarasingheDr. Ravi FernandoDeshamanya M. D. D. Peiris F. K. C. P. N. Dias
Browns Holdings Ltd Kalsha AmarasingheKithsiri Gunawardena
Masons Mixture Limited Rohini NanayakkaraKithsiri Gunawardena
Engineering Services (Pvt) Ltd Rohini NanayakkaraKithsiri Gunawardena
Associated Battery Manufacturers (Ceylon) Limited
Arun Mittal Ishara NanayakkaraAsish Kumar MukherjeeThamotharampillai SanakanManju GunawardanaPartha SarkarAniruddha Kannappan
S.F.L. Services (Private) Limited Rohini Nanayakkara Kithsiri Gunawardena
Browns Group Motels Limited Rohini Nanayakkara Thamotharampillai Sanakan
C.F.T. Engineering Limited Rohini Nanayakkara Thamotharampillai Sanakan
Browns Group Industries (Private) Limited Rohini Nanayakkara Thamotharampillai Sanakan
The Hatton Transport and Agency Company (Private) Limited Rohini Nanayakkara Thamotharampillai Sanakan
Walker & Greig (Private) Limited Rohini Nanayakkara Thamotharampillai Sanakan
Browns Investments PLC Ishara Nanayakkara Kamantha AmarasekeraKapila JayawardenaKalsha AmarasingheStefan FurkhanDr. Jayanta Swaminathan
Klevenberg (Private) Limited Danesh Abeyrathne Thamotharampillai Sanakan
Sifang Lanka (Private) Limited Rohini Nanayakkara Thamotharampillai Sanakan
Gal Oya Plantations (Private) Limited Gayan DisanayakaKithsiri GunawardenaDanesh AbeyrathneWasantha BatagodaLional BandaranayakeKeerthi KotagamaDr. Asiri DissanayakeDamitha RathnayakeSanjeewa Dissanayaka
Gal Oya Holdings (Pvt) Ltd Kithsiri Gunawardena Danesh AbeyrathneSanjaya KalidasaNandana Jayasinghe
Browns Thermal Engineering (Pvt) Ltd Rohini Nanayakkara Damascene FernandoAnoj Munidasa
Browns Health Care Negombo (Pvt) Ltd Kithsiri Gunawardena Thamotharampillai Sanakan

Annual Report 2020/21 / 181
COMPANY DIRECTORS
Browns Industrial Park Ltd Rohini Nanayakkara Kithsiri Gunawardena
Snowcem Products Lanka (Private) Limited Thamotharampillai SanakanDanesh Abeyrathne
Browns Pharma Limited Thamotharampillai Sanakan Manju Gunawardena
Browns Agri Solutions (Pvt) Ltd Kithsiri GunawardenaManju GunawardenaDanesh Abeyrathne
B.I. Holdings Ltd Thamotharampillai SanakanMangala Wijesinghe
Browns Leisure (Pvt) Ltd Kithsiri GunawardenaThamotharampillai Sanakan
Ceylon Nano Diagnostics (Pvt) Ltd Danesh AbeyrathneWasantha BatagodaManju GunawardenaNareshkumar HandagamaAzeez MubarakSanjaya Bathige
Ajax Engineers (Private) Limited Kamantha AmarasekeraSunjeevani KotakadeniyaVishwa KumarasingheVermy Gunaratne
Browns Global Farm (Pvt) Ltd Kamantha AmarasekeraKithsiri Gunawardena
B I Commodities and Logistics (Private) Limited Kamantha AmarasekeraKithsiri GunawardenaSunjeevani KotakadeniyaGunendra JayasenaManju GunawardenaDanesh AbeyrathneAnura Vithanage
BI Zhongtian Holdings (Private) Limited Kamantha AmarasekeraKithsiri GunawardenaZhong Shan
B.G.Air Services (Private) Limited Kamantha AmarasekeraKithsiri Gunawardena
Creations Wooden Fabricators (Private) Limited Kamantha AmarasekeraSunjeevani KotakadeniyaAjith WeeratungaVishwa KumarasingheThamotharampillai Sanakan
Excel Global Holdings (Private) Limited Kamantha AmarasekeraThamotharampillai Sanakan
Excel Restaurants (Private) Limited Kamantha AmarasekeraThamotharampillai SanakanEksath Wijeratne
Millennium Development (Private) Limited Kamantha AmarasekeraThamotharampillai SanakanEksath Wijeratne
Samudra Beach Resorts (Pvt) Ltd Kamantha AmarasekeraRohini NanayakkaraKithsiri GunawardenaSunjeevani Kotakadeniya
Browns Teas (Private) Limited Kamantha AmarasekeraKithsiri Gunawardena
Browns Metal & Sands (Private) Limited Kamantha AmarasekeraKithsiri GunawardenaSunjeevani Kotakadeniya

182 / BROWN AND COMPANY PLC
PARENT, SUBSIDIARY AND ASSOCIATE COMPANIES
COMPANY DIRECTORS
Ceylon Roots Lanka (Pvt) Ltd Kithsiri GunawardenaKamantha AmarasekeraNishantha Perera Dishan Perera
General Accessories and Coating (Pvt) Ltd Kithsiri GunawardenaKamantha AmarasekeraSunjeevani Kotakadeniya
Bodufaru Beach Resort Pvt Ltd Mohamed NihamKamantha AmarasekeraKithsiri Gunawardena
Dickwella Resorts (Pvt) Ltd Jayantha KelegamaGunendra Jayasena
Eden Hotels Lanka PLC Kapila JayawardenaKalsha AmarasingheKamantha AmarasekeraAhamed FurkhanJayanta SwaminathanStefan Furkhan
Browns Hotels and Resorts Ltd Kithsiri GunawardenaSunjeevani KotakadeniyaJayantha KelegamaKamantha Amarasekera
Riverina Resorts (Pvt) Ltd Kapila JayawardenaKalsha AmarasingheKamantha AmarasekeraKithsiri Gunawardena
Palm Garden Hotels PLC Kapila JayawardenaKalsha AmarasingheKamantha AmarasekeraJayanta Swaminathan
Tropical Villas (Pvt) Ltd Kamantha AmarasekeraKithsiri GunawardenaJayantha Kelegama
NPH Investments Pvt Ltd Ibrahim MohamedAli NimanKamantha AmarasekeraTilak SelviahKithsiri GunawardenaSunjeevani Kotakadeniya
Green Paradise (Private) Limited Kamantha AmarasekeraKithsiri GunawardenaKalsha Amarasinghe
Sun & Fun Resorts Limited Charkravarthy MelappatiVamsi VemuruKamantha AmarasekeraKithsiri GunawardenaTilak Selviah
Browns Properties (Pvt) Ltd Kamantha AmarasekeraSunjeevani KotakadeniyaKithsiri Gunawardena
F L P C Management (Pvt) Ltd Kamantha AmarasekeraSunjeevani KotakadeniyaKithsiri Gunawardena
Browns Power Holdings (Private) Limited Kamantha AmarasekeraSunjeevani KotakadeniyaKithsiri Gunawardena

Annual Report 2020/21 / 183
COMPANY DIRECTORS
Maturata Plantations Limited Keerthi KotagamaKamantha AmarasekeraKithsiri GunawardenaSunjeevani KotakadeniyaJospeh Puviraj
Sagasolar Power (Private) Limited Kamantha AmarasekeraKithsiri GunawardenaSunjeevani KotakadeniyaRajeeva HettiaratchiAnand RahejaKumara VidanagamagePradeep De Silva (Alt. Dir. to Mr. A. Raheja)Pradeep Gamalath (Alt. Dir. to Mr. K. Vidanagamage)
Taprobane Plantations Limited Nilmini NanayakkaraRohini Jayaweera
Gurind Accor (Pvt) Ltd Gurmeet SinghKithsiri Gunawardena Kamantha Amarasekera Sunjeevani Kotakadeniya
Sunbird Bioenergy (SL) Limited Ishara NanayakkaraKamantha AmarasekeraDanesh AbeyrathneDeepak KohliRichard Bennett
Grey Reach Investments Ltd Ishara NanayakkaraKamantha AmarasekeraDanesh AbeyrathneDeepak KohliRichard BennettLoc D. Nguyen
Browns Ari Resort (Pvt) Ltd Kamantha AmarasekeraKithsiri Gunawardena Ishara NanayakkaraMohamed NihamS. Mohmed
Browns Raa Resort (Pvt) Ltd Kamantha AmarasekeraKithsiri Gunawardena Ishara NanayakkaraMohamed Niham
B Commodities ME FZE BI Commodities & Logistics (Pvt) Ltd.Browns Engineering and Construction (Pvt) Ltd Sunjeevani Kotakadeniya
Kithsiri Gunawardena Jagath PathirenaShantha Kurumbalapitiya
General Accessories and Coating (Pvt) Ltd Kithsiri Gunawardena Kamantha AmarasekeraSunjeevani Kotakadeniya
Ceylon Real Estate Holdings (Pvt) Ltd Ishara NanayakkaraKamantha AmarasekeraKithsiri Gunawardena
Colombo Marina Development (Pvt) Ltd Ishara NanayakkaraKamantha AmarasekeraKithsiri Gunawardena
Marina Hotel Holdings (Pvt) Ltd Ishara NanayakkaraKamantha AmarasekeraKithsiri Gunawardena

184 / BROWN AND COMPANY PLC
PARENT, SUBSIDIARY AND ASSOCIATE COMPANIES
COMPANY DIRECTORS
Serendib Hotels PLC Kapila Jayawardena Kalsha AmarasingheKamantha AmarasekeraJayanta Swaminathan Thilan WijeysingheAndrew ChojnackiShantha KurumbalapitiyaDillip Rajakarier
Dolphin Hotels PLC Kapila Jayawardena Kalsha AmarasingheKamantha AmarasekeraJayanta SwaminathanSarada de SilvaRamani GamageShantha KurumbalapitiyaProf. Lalith Gamage (Alt. Director to Mrs. A. R. Gamage)
Hotel Sigiriya PLC Kapila Jayawardena Kalsha AmarasingheKamantha AmarasekeraJayanta SwaminathanSarada de SilvaRamani GamageShantha KurumbalapitiyaProf. Lalith Gamage (Alt. Director to Mrs. A. R. Gamage)
Frontier Capital Lanka (Pvt) Ltd Kalsha AmarasingheKamantha AmarasekeraJayanta SwaminathanKithsiri GunawardenaShantha Kurumbalapitiya
Sanctuary Resort Lanka (Pvt) Ltd Kalsha AmarasingheKamantha AmarasekeraJayanta SwaminathanKithsiri GunawardenaShantha Kurumbalapitiya
Kammala Hoteliers (Pvt) Ltd Kalsha AmarasingheKamantha AmarasekeraJayanta SwaminathanKithsiri GunawardenaSarada de Silva
Serendib Leisure Management Ltd Kalsha AmarasingheKamantha AmarasekeraJayanta SwaminathanKithsiri GunawardenaDillip RajakarierShantha Kurumbalapitiya

Annual Report 2020/21 / 185
GLOSSARY OF FINANCIAL TERMS
ACCRUAL BASISRecording revenues and expenses in the period in which they are earned or incurred regardless of whether cash is received or disbursed in that period.
CAPITAL EMPLOYEDShareholders’ funds plus non-controlling interests and debt.
CONTINGENT LIABILITIESA condition or situation existing at the balance sheet date due to past events, where the obligation is crystallised by the occurrence or non-occurrence of one or more future events.
CURRENT RATIOCurrent assets divided by current liabilities.
DEBT/EQUITY RATIODebt as a percentage of shareholders’ funds and non-controlling interests.
DIVIDEND PAYABLEFinal dividend per share multiplied by the latest available total number of shares as at the date of the report.
DIVIDEND PAYOUT RATIODividend as a percentage of company profits.
EARNINGS PER SHAREProfit attributable to equity holders of the parent divided by the weighted average number of ordinary shares in issue during the period.
EBITEarnings Before Interest and Tax (includes other income).
INTEREST COVERConsolidated profit before interest and tax over finance expenses.
MARKET CAPITALISATIONNumber of shares in issue at the end of period multiplied by the market price at the end of the period.
NET ASSETSTotal assets minus current liabilities minus long term liabilities minus non-controlling interests.
NET ASSETS PER SHARENet assets as at a particular financial year end divided by the number of shares in issue as at the current financial year end.
PRICE EARNINGS RATIOMarket price per share over earnings per share.
PUBLIC HOLDINGPercentage of shares held by the public calculated as per the Colombo Stock Exchange’s Listing Rules as of the date of the Report.
RETURN ON CAPITAL EMPLOYED (ROCE)Consolidated profit before interest and tax as a percentage of capital employed.
RETURN ON SHAREHOLDERS’ FUNDProfit attributable to shareholders as a percentage of shareholders’ funds.
SHAREHOLDERS’ FUNDSTotal of stated capital, capital reserves and revenue reserves.
TOTAL DEBTLong term loans plus short term loans plus overdrafts.
TOTAL EQUITYShareholders’ funds plus non-controlling interest.

186 / BROWN AND COMPANY PLC
NOTICE OF THE ANNUAL GENERAL MEETING
NOTICE IS HEREBY GIVEN that the 129th ANNUAL GENERAL MEETING of the Company will be held on Thursday, 23rd September 2021 at 12.30 p.m. as an online audio-visual meeting with arrangements for the on-line meeting platform made at LOLC Holdings PLC, No.100/1, Sri Jayawardenapura Mawatha, Rajagiriya.
The business to be brought before the meeting will be:
To receive and consider the Report of the Directors and Statement of Accounts of the Company for the Financial Year ended 31st March 2021 with the Auditors’ Report thereon.
To re-elect Mr. Ishara Nanayakkara as an Executive Chairman who retires by rotation in accordance with Article 24(6) of the Articles of Association of the Company.
To elect Mr. Danesh Abeyrathne as an Executive Director in accordance with Article 24(2) of the Articles of Association of the Company.
To re-appoint Mr. Janaka de Silva as an Independent Non-Executive Director. A Notice has been received from a shareholder in terms of Section 211 of the Companies Act No. 7 of 2007 of the intention to propose the following Resolution as an Ordinary Resolution:
RESOLUTION “ That Mr. Janaka de Silva who has reached the age of 77
years on 24th August 2021 be and is hereby re-appointed as an Independent Non-Executive Director of the Company for a period of one year or until the conclusion of the next Annual General Meeting whichever occurs first and it is hereby declared that the age limit of 70 years referred to in Section 210 of the Companies Act No. 7 of 2007 shall not apply to the said Director”.
To re-appoint Mr. Tissa Bandaranayake as an Independent Non-Executive Director. A Notice has been received from a shareholder in terms of Section 211 of the Companies Act No. 7 of 2007 of the intention to propose the following Resolution as an Ordinary Resolution:
RESOLUTION “ That Mr. Tissa Bandaranayake who has reached the age of
78 years on 3rd January 2021 be and is hereby re-appointed as an Independent Non-Executive Director of the Company for a period of one year or until the conclusion of the next Annual General Meeting whichever occurs first and it is hereby declared that the age limit of 70 years referred to in Section 210 of the Companies Act No. 7 of 2007 shall not apply to the said Director”.
To re-appoint M/s. PricewaterhouseCoopers, Chartered Accountants, as the External Auditors of the Company for the ensuing financial year at a remuneration to be fixed by the Directors.
BROWN AND COMPANY PLC - REG. NO. PQ 25
To approve in terms of the Companies (Donations) Act No. 26 of 1951, the making of donations by the Directors as determined by them for the current Financial Year and until the next Annual General Meeting of the Company.
To approve by Special Resolutions the amendments to the Articles of Association.
Special Resolution No. 1 “By deleting the existing Article 44(6) in its entirety and
substituting therein the following:
Where notice is given by an Advertisement, such advertisement, shall be published in Sinhala, Tamil and English national daily newspapers.”
Special Resolution No. 2 “By including the following new Article No. 46
Notwithstanding anything to the contrary contained in these Articles, so long as the Company is listed on the Colombo Stock Exchange, the Company shall comply with the rules of the Colombo Stock Exchange and the Central Depository System, which shall be in force from time to time.”
By order of the BoardBROWN AND COMPANY PLC
LOLC CORPORATE SERVICES (PRIVATE) LIMITEDSecretaries
30th August 2021

Annual Report 2020/21 / 187
BROWN AND COMPANY PLC - REG. NO. PQ 25
I/We………………………………………………………………….....…………………………………………………………………………………………………...………………………………….......…………………… ……………………………………………………………………....……………………………………………………………………….……… holder of NIC/ Reg. No. ………………………………………….... of………………………………………………………………………………………………………………………………………….....……….....…………………………………………………………………………………… being a member/members of Brown and Company PLC hereby appoint ….……………………………………………………………………………..……………………………... ..........................................……of…………………….…………………………………………………………………………………….……………………...….…………………………….…whom failing
Ishara Nanayakkara or failing himKapila Jayawardena or failing himKalsha Amarasinghe or failing herDanesh Abeyrathne or failing himJanaka de Silva or failing himTissa Bandaranayake or failing him
as my/our proxy to represent me/us and vote on my/our behalf at the Annual General Meeting of the Company to be held as an online meeting on Thursday, 23rd September 2021 at 12.30 p.m. and at any adjournment thereof and at every poll which may be taken in consequence of the aforesaid meeting.
Please indicate your preference by placing an ‘X’ against the Resolution.
For Against
To adopt the Annual Report of the Directors and Statement of Accounts of the Company for the Financial Year ended 31st March 2021 with the Auditors’ Report thereon.
To re-elect Mr. Ishara Nanayakkara as an Executive Chairman, who retires by rotation in accordance with Article 24(6) of the Articles of Association of the Company.
To elect Mr. Danesh Abeyrathne as an Executive Director in accordance with Article 24(2) of the Articles of Association of the Company.
To re-appoint Mr. Janaka de Silva as an Independent Non-Executive Director.
To re-appoint Mr. Tissa Bandaranayake as an Independent Non-Executive Director.
To re-appoint M/s. PricewaterhouseCoopers, Chartered Accountants, as the External Auditors of the Company for the ensuing financial year at a remuneration to be fixed by the Directors.
To authorize the Directors to make donations.
To approve by Special Resolutions the amendments to the Company’s Articles of Association as set out in the Notice of Meeting.
Special Resolution 1
Special Resolution 2
Dated this ............................................................. day of ............................................................. Two Thousand Twenty One
.......................................................................Signature/s of shareholder/s
FORM OF PROXY
Please provide the following details:
Shareholder’s NIC No. : ................................................................................................................................................................................
No. of shares held : ................................................................................................................................................................................
Proxy holder’s NIC No. : ................................................................................................................................................................................(if not a Director of this Company)
(Please delete inappropriate words and refer overleaf for instructions)

INSTRUCTIONS AS TO COMPLETION1. Please return the completed Form of Proxy after filling in legibly your full name
and address, signing on the space provided and filing in the date of signature.
2. The Proxy shall a) In the case of an individual, be under the hand of the shareholder or his or
her attorney, and if signed by an attorney, a notarially certified copy of the Power of Attorney should be attached to the completed Proxy if it has not already been registered with the Company.
b) If the shareholder is a company or a corporation, be either under its common seal or under the hand of an officer or attorney authorized by such organization in that behalf in accordance with its Articles of Association or Constitution.
3. Please indicate with an ‘X’ how the proxy should vote on each Resolution. If no indication is given, the proxy shall exercise his/her discretion and vote as he/she thinks fit.
4. The Completed Form of Proxy should be deposited at LOLC Corporate Services (Private) Limited, Secretaries to Brown and Company PLC, 4th Floor, No.34, Sir Mohamed Macan Markar Mawatha, Colombo 3, or scanned and emailed to [email protected] with the email subject titled “BCL AGM PROXY” not less than 48 hours before the time appointed for the holding of the Meeting.
FORM OF PROXY

Our Vision and Our Mission Inner CoverFinancial Highlights 2Board of Directors 3Management Discussion & Analysis 5Corporate Governance Report 18Audit Committee Report 42Remuneration Committee Report 45The Related Party Transactions Review Committee Report 47Business Operations Committee Report 48
FINANCIAL INFORMATIONAnnual Report of the Board of Directors 50Statement of Directors’ Responsibility 55Independent Auditor’s Report 56Statement of Profit or Loss 64Statement of Comprehensive Income 65Statement of Financial Position 66Statement of Changes in Equity - Group 68Statement of Changes in Equity - Company 69Statements of Cash Flows 70Notes to the Financial Statements 72
SUPPLEMENTARY INFORMATIONTen Year Summary 176Economic Value Statement 177Investor Relations 178Parent, Subsidiary and Associate Companies 180Glossary of Financial Terms 185Notice of the Annual General Meeting 186Form of Proxy 187Corporate Information Inner Back Cover
03
18
65
72
CONTENTBOARD OF DIRECTORS
CORPORATE GOVERNANCE REPORT
STATEMENT OF COMPREHENSIVE INCOME
NOTES TO THE FINANCIAL STATEMENTS
Online References:The PDF version of the Annual Report 2020/21
OUR VISIONTo be a leading Sri Lankan conglomerate excelling through sunrise and sunshine industries with a global presence and cutting edge technology.
OUR MISSIONWith generations of trust and reliability, our aim is to continuously enhance the value propositions to our stakeholders through innovative and customer-centric solutions.
CORPORATE INFORMATION
COMPANY NAMEBROWN AND COMPANY PLC
LEGAL FORM A Public Limited Liability Company incorporated in Sri Lanka on 17th August 1892 under the Joint Stock Companies Ordinance 1861 and re-registered under the Companies Act No. 07 of 2007. The Company was listed on the Colombo Stock Exchange on 25th April 1991.
COMPANY REGISTRATION NO. PQ 25
DIRECTORSIshara Nanayakkara Executive Chairman
Kapila Jayawardena Non-Executive Director
Kalsha Amarasinghe Non-Executive Director
Janaka de SilvaIndependent Non-Executive Director
Tissa BandaranayakeIndependent Non-Executive Director
Danesh AbeyrathneExecutive Director (Appointed wef 18th November 2020)
SECRETARIES LOLC Corporate Services (Private) Limited,No.100/1, Sri Jayewardenepura Mawatha,Rajagiriya. Tel: 011 5063000Fax: 011 2307380
REGISTRARSS S P Corporate Services (Pvt) Ltd101, Inner Flower Road,Colombo 03Tel: 011 2573894Fax: 011 2573609
REGISTERED OFFICE No. 481, T. B. Jayah Mawatha (Darley Road),P. O. Box 200, Colombo 10.Tel: 011 5063000Fax: 011 2307380Website: www.brownsgroup.com
BUSINESS OFFICE No. 34, Sir Mohamed Macan Markar Mawatha, Colombo 3.Tel: 011 5063000.Fax: 011 2307380.Website: www.brownsgroup.com.
AUDITORS Messrs PricewaterhouseCoopers,Chartered Accountants,No. 100, Braybrooke Place, Colombo 02.Tel: 011 7719838Fax: 011 2303197Website: www.pwc.com
BANKERS Amana Bank PLCBank of CeylonCargills Bank Ltd.Commercial Bank of Ceylon PLC DFCC Bank PLCHatton National Bank PLCICICI Bank Ltd.MCB Bank Ltd.National Development Bank PLCNations Trust Bank PLCPan Asia Banking Corporation PLCPeoples BankSampath Bank PLCSeylan Bank PLCStandard Chartered BankUnion Bank of Colombo PLC

ANNUAL REPORT 2020/21
A LEGACY OF TRUST
www.brownsgroup.com
A LEG
AC
Y OF T
RU
ST
BROW
N A
ND
CO
MPA
NY P
LC
| A
NN
UA
L REPO
RT 2020/21