a large scale analysis of the dynamic cell behaviours that...
TRANSCRIPT
UNIVERSIDADE DE LISBOA FACULDADE DE CIÊNCIAS
DEPARTAMENTO DE BIOLOGIA ANIMAL
Dissertação Mestrado em Biologia Evolutiva e do Desenvolvimento
2014
A large scale analysis of the dynamic cell
behaviours that underlie the growth of the
zebrafish posterior body
Fernando António Vinagre Duarte

1
Dissertação Mestrado em Biologia Evolutiva e do Desenvolvimento
2014
UNIVERSIDADE DE LISBOA FACULDADE DE CIÊNCIAS
DEPARTAMENTO DE BIOLOGIA ANIMAL
A large scale analysis of the dynamic cell
behaviours that underlie the growth of the
zebrafish posterior body
Fernando António Vinagre Duarte
Dissertação orientada por:
Doutora Estelle Hirsinger
Professora Doutora Sólveig Thorsteinsdóttir

2

3
Acknowledgements
“For the night is dark and full of terrors”
- George R. R. Martin
Even if fictional and unusual, I start this section with this quote as it captures quite well
this period of my life. Not the writing up of this dissertation, but life as a whole. On that
note, I would like to give my special thanks to my friend Joana Carvalho. For being
there both during the good (and I must admit there were not many), the bad and
specially the ugly moments. We started this journey together and oh girl we know how
long and difficult it turned out to be. We have seen each other growing up so much, and
the same way you were my rock throughout this past two years, I will be there for you if
and when the time comes.
A special thanks to Florian Fabre too, for providing the extra kick of energy and
inspiration when I was needing it the most. Let’s hope it wasn’t too little, too late, and
that three years from now we will be celebrating yet one more phase of our lives. Get
ready!
For not letting me sink and helping me to get back to my feet, I dedicate this dissertation
to you two with love. This obviously extends to all my friends and family; I am grateful
for all your sacrifices and for always being there for me.
For cultivating my interest in Science from an early point of my life, and later in
Developmental Biology, a big thanks to my cousin Fernanda Bajanca and to my
supervisor Professor Sólveig Thorsteinsdóttir, respectively.
Last but not least, I finish with a special thanks to my two supervisors in Paris, Estelle
Hirsinger and Ben Steventon, for taking me as their student, for making my adaptation
to Paris so smooth, for their exemplar professionalism and for all the scientific advice
they provided me, not only regarding the project but about Science and research in
general. To Ben for all I know about microscopy and image analysis, and for all your
enthusiasm, fun conversations and cool ideas on zebrafish tailbud elongation. I hope to
succeed in Science one day and show you two all your hard work in forming me was
worth it.

4
Abstract
As vertebrate embryos develop, their posterior axis undergoes marked changes in size
and tissue architecture. The morphogenetic behaviours underlying the formation of the
posterior trunk and tail are complex. As of today, two models for posterior body
formation have been proposed: the blastema and the “continuity of gastrulation” model.
These two models can be rationalised into two canonical morphogenetic processes: the
blastema model proposing that posterior body elongation is driven by anisotropic
growth, whereas the continuation of gastrulation model postulates it is driven by tissue
deformations. To address the relative contribution of these two mechanisms on posterior
body elongation, we captured confocal stacks of fixed zebrafish embryos at different
developmental stages, labelled with nuclear and membrane markers and performed
surface reconstructions of all the posterior segments to measure their dimensions. Our
morphogenetic analysis revealed not only that tailbud outgrowth undergoes at least two
distinct phases, the first dominated by tissue deformation, the second by growth, but
also that the majority of growth seems to occur in the anterior segments. Furthermore,
we developed retrospective clonal analysis, a genetic single-cell labelling technique, in
the zebrafish embryo, to investigate the identity and growth modes of the posterior axis
precursors. With this method, we found no evidence of the existence of a stem cell pool
resident in the zebrafish tailbud, which lead us to believe that posterior body formation
in this model must be driven mainly by proliferation/dispersion of lineage-restricted
progenitors. This observation was supported by the results we obtained while
monitoring cell cycle progression in tailbud cells in Cecyil fish, a zebrafish transgenic
line harbouring a set of cell cycle markers coupled with different fluorescent molecules,
where we could not detect persistent proliferation in the tailbud.
Keywords: Zebrafish tailbud elongation | Anisotropic growth | Tissue deformation |
Morphometric analysis | Retrospective clonal analysis

5
Resumo
O alongamento de tecidos desempenha um papel crucial durante a morfogénese. Para
além de desempenhar um papel directo ao proporcionar forma aos tecidos, na maioria
dos casos a falha deste processo resulta numa panóplia de defeitos na morfogénese. Um
exemplo claro disso pode ser observado em anomalias existentes na formação do tubo
neural tanto em Xenopus (Wallingford and Harland, 2012), como no ratinho (Ybot-
Gonzalez et al., 2007), e mesmo no humano (Kibar et al., 2007). Além disso, também
foi demonstrado que defeitos no alongamento estão implicados no aparecimento do
lábio leporino, um dos defeitos congénitos mais observados em humanos (Parker et al.,
2010). O alongamento da região posterior do corpo após a gastrulação é um dos
exemplos mais marcáveis de alongamento de tecidos durante o desenvolvimento
embrionário. Ao passo que a região anterior do corpo se desenvolve a partir de células
que migram durante a gastrulação, num processo denominado ingressão (Kinder et al.,
1999), a região posterior do tronco e a cauda formam-se a partir de um grupo de
progenitores localizados na extremidade posterior do embrião numa região denominada
botão caudal. Apesar desta ser uma região bastante restrita em termos de dimensões no
embrião, ela é responsável pela formação de dois terços da porção posterior do eixo
antero-posterior (Kanki and Ho, 1997).
No decorrer do último século, o estudo do desenvolvimento do corpo dos vertebrados
tem sido objecto de controvérsia, devido à incerteza em relação à conservação dos
mecanismos responsáveis pela formação da região anterior e posterior do corpo
(Handrigan, 2003). Neste contexto, duas visões opostas de como o crescimento posterior
ocorre foram propostas. Uma delas (Holmdahl, 1925) propõe que o botão caudal
consiste numa amálgama homogénea de células indiferenciadas, ou blastema,
caracterizada pela combinação de uma elevada taxa de proliferação aliada à capacidade
de gerar vários tipos de tecidos ao longo do eixo antero-posterior. Além disso, este
modelo sugere igualmente que o crescimento do botão caudal ocorre na ausência de
movimentos celulares tipicamente observados durante a gastrulação, e que, ao invés
disso, tem lugar através de desenvolvimento secundário, à semelhança daquilo que
ocorre durante o desenvolvimento do botão do membro. Contrariamente, a outra
(Pasteels, 1943) propõe a noção oposta, ou seja, defende que a formação da região
6
posterior do corpo resulta apenas da continuação dos processos iniciados durante a
gastrulação, que incluem uma série de movimentos celulares.
Tendo em conta ambos os modelos, é possível imaginar que o alongamento da região
posterior do corpo pode ser explicado através de crescimento anisotrópico (proposto
pelo modelo do blastema de Holmdahl), de deformações no tecido (proposto pelo
modelo de continuação da gastrulação de Pasteels), ou pela combinação de ambos.
Avanços recentes nas ferramentas disponíveis para realizar estudos de imaging, como
por exemplo a utilização de técnicas modernas de microscopia confocal para realizar
vídeos em tempo real, possibilitam a aquisição de datasets contínuos durante um longo
período de tempo, permitindo a análise de comportamentos e movimentos
morfogenéticos a nível celular. Juntamente com o aparecimento de software de análise
de imagem mais poderoso, neste momento temos acesso a uma panóplia de métodos de
alta resolução que nos permitem analisar o crescimento do embrião. Neste sentido, uma
espécie opticamente transparente que possua desenvolvimento externo, e que portanto é
facilmente acessível para qualquer tipo de manipulação, como é o caso do embrião de
peixe-zebra, é especialmente indicada para este tipo de estudos. Por este motivo,
seleccionámos o peixe-zebra como organismo modelo para utilizar neste estudo.
Com o objectivo de analisar os comportamentos e movimentos morfogenéticos que
ocorrem ao nível do tecido dos segmentos posteriores do embrião de peixe-zebra, e
assim determinar a contribuição relativa dos dois mecanismos de crescimento do botão
caudal referidos anteriormente, realizámos uma série de experiências, incluindo análises
morfométricas, análise clonal retrospectiva e monitorização em tempo real do ciclo
celular de células progenitoras residentes no botão caudal. Desta forma, no presente
estudo pretendemos analisar: (1) as dimensões (comprimento, largura e altura) e o
volume dos segmentos posteriores de embriões de peixe-zebra entre os estadios de 10
sómitos (14 hpf) e 32 sómitos (25,4 hpf), recorrendo à utilização do software Imaris; (2)
as divisões celulares que ocorrem no botão caudal através da monitorização em tempo
real do desenvolvimento da região posterior em embriões de peixe-zebra transgénicos
da linha Cecyil, que possuem uma série de marcadores do ciclo celular acoplados a
moléculas fluorescentes que permitem acompanhar a progressão do ciclo celular em
células progenitoras residentes no botão causal; (3) as características (dimensões,
frequência, identidade, distribuição e modo de crescimento) dos nichos de células
progenitoras residentes ao nível do botão caudal, a partir dos clones gerados através da
7
técnica de análise clonal retrospectiva, que se baseia na marcação aleatória e hereditária
de células individuais, permitindo a análise clonal dos seus descendentes a longo prazo
(Petit et al., 2005).
A nossa análise morfométrica permitiu-nos identificar duas fases distintas envolvidas no
processo de alongamento da região posterior do corpo no peixe-zebra. A primeira fase
(em embriões com 14 a 21 hpf, ou seja, de 14 a 24 somitos) caracteriza-se por um
aumento relativamente lento do comprimento e volume do embrião acompanhado por
uma diminuição na largura e aumento na altura, sugerindo que o crescimento
anisotrópico e apenas moderado e que a principal causa por detrás do alongamento
provem de deformações do tecido, ao passo que a segunda fase (em embriões a partir de
21 hpf) é caracterizada por um aumento rápido do comprimento e do volume
acompanhado pela estabilização da largura e altura dos segmentos, o que indica a
ocorrência de apenas pequenas alterações na forma do tecido em conjunto com um
crescimento anisotrópico acentuado. De um modo geral, estes resultados sugerem um
cenário onde diferentes processos se encontram em jogo em alturas específicas e críticas
do desenvolvimento para promoverem o alongamento do botão caudal.
Tendo em conta estes resultados, e de forma a determinar quais os segmentos
posteriores onde crescimento anisotrópico de facto ocorre, decidimos analisar variações
no volume ao longo do tempo em todos os segmentos posteriores do embrião, a partir
dos sómitos 13-14 até ao botão caudal, em embriões do estádio de 10 (14 hpf) até ao
estadio de 30 somitos (24,4 hpf). Esta análise permitiu-nos concluir que crescimento
anisotrópico mais acentuado ocorre maioritariamente nos segmentos que se encontram
mais distanciados do botão caudal e que correspondem aos sómitos que se formam em
primeiro lugar no embrião em todos os estadios de desenvolvimento. Após
monitorização cuidadosa dos embriões durante alongamento do botão caudal, dois
processos biológicos destacaram-se como bons candidatos hipotéticos para explicar esta
resposta por parte do tecido, sendo eles o processo de dilatação das células da notocorda
e a miogénese, mais especificamente o alongamento de miofibrilhas ao longo dos
sómitos. Por este motivo, decidimos determinar em cada estadio do desenvolvimento
qual o ultimo segmento posterior onde estes dois processos são observáveis, e comparar
estas observações com as variações de volume observadas anteriormente em todos os
segmentos posteriores.

8
Por fim, propusemo-nos a analisar quais os modos de crescimento (baseado em
proliferação/dispersão vs. nicho de células progenitoras estaminais) em jogo durante o
alongamento do botão caudal. Como ponto de partida, os nossos resultados utilizando a
linha Cecyil de peixe-zebra demonstraram que não existem praticamente células em
proliferação activa no botão caudal, ou seja, na fase S do ciclo celular, o que sugere que
o botão caudal não possui um nicho de células progenitoras estaminais. Estes resultados
foram ainda corroborados pela nossa análise clonal retrospectiva, uma vez que que ao
analisármos a biblioteca de clones obtida não conseguimos identificar nenhum clone
multipotente que poderia sugerir a existência de um nicho de células estaminais
residente no botão caudal.
Apesar do nosso estudo ter já providenciado pistas em relação aos mecanismos e modos
de crescimento envolvidos no processo de alongamento do botão caudal em peixe-zebra,
futuramente seria importante realizar mais estudos focados na análise dos mecanismos
celulares e moleculares responsáveis pela regulação deste processo, tais como: (1)
analisar os comportamentos celulares por detrás das alterações observadas ao nível do
tecido em relação à forma e tamanho dos segmentos; (2) investigar o papel que tanto a
dilatação das células da notocorda como o alongamento das miofibrilhas ao longo dos
sómitos desempenham durante o alongamento da região posterior do corpo de um modo
mais detalhado; (3) confirmar a importância do papel da proliferação celular durante
este processo, bem como a (não)existância de um nicho de células estaminais residentes
no botão caudal em peixe-zebra; (4) realizar estudos complementares em diferentes
organismos, incluindo amniotas e anamniotas, como por exemplo o anfioxo, de forma a
efectuar estudos comparativos com o objectivo de estudar a conservação, ou não, dos
mecanismos evolutivos por detrás do alongamento do botão caudal.
Palavras-chave: Alongamento do botão caudal em peixe-zebra | Crescimento
anisotópico | Deformação do tecido | Análise morfométrica | Análise clonal
retrospectiva
9
Table of Contents
Acknowledgements ........................................................................................................ 3
Abstract .......................................................................................................................... 4
Resumo .......................................................................................................................... 5
I. Introduction .............................................................................................................. 10
I.2. Posterior body elongation in zebrafish .................................................................. 11
I.3. Tailbud modes of growth ....................................................................................... 12
I.4. Posterior body elongation – Growth vs. tissue deformation ................................. 14
I.6. Retrospective clonal analysis (RCA) ..................................................................... 15
II. Objectives ................................................................................................................. 17
III. Materials and Methods ......................................................................................... 18
III.1. ubi:creERt2/ubi:Switch System (lines II, V and Switch) ................................ 18
III.2. 4-OHT treatment for CreERt2 induction ......................................................... 19
III.3. Analysis of the clone characteristics and confocal imaging ......................... 19
III.4. Confocal imaging of fixed embryos and morphometric analysis ................. 20
III.5. Cecyil fish ..................................................................................................... 21
III.6. Image acquisition of fixed Cecyil embryos................................................... 22
IV. Results .................................................................................................................. 23
IV.1. Tailbud elongation undergoes two distinct phases ........................................ 23
IV.2. Tailbud outgrowth relies both in tissue deformation and growth ................. 24
IV.3. Myogenesis and notochord inflation correlate with growth in early born
segments ....................................................................................................................... 26
IV.4. Lack of persistent proliferation in the zebrafish tailbud suggests the absence
of a pool of resident stem-cells .................................................................................... 28
IV.5. Our RCA preliminary results are consistent with a proliferation/dispersion -
like mode of growth ..................................................................................................... 29
V. Discussion ................................................................................................................ 33
V.1. Posterior body tissue dynamics ......................................................................... 33
V.2. The role of cell proliferation during tailbud outgrowth .................................... 35
V.3. Future Perspectives ........................................................................................... 38
References ....................................................................................................................... 39
Appendix I – Supplementary data ................................................................................... 43
10
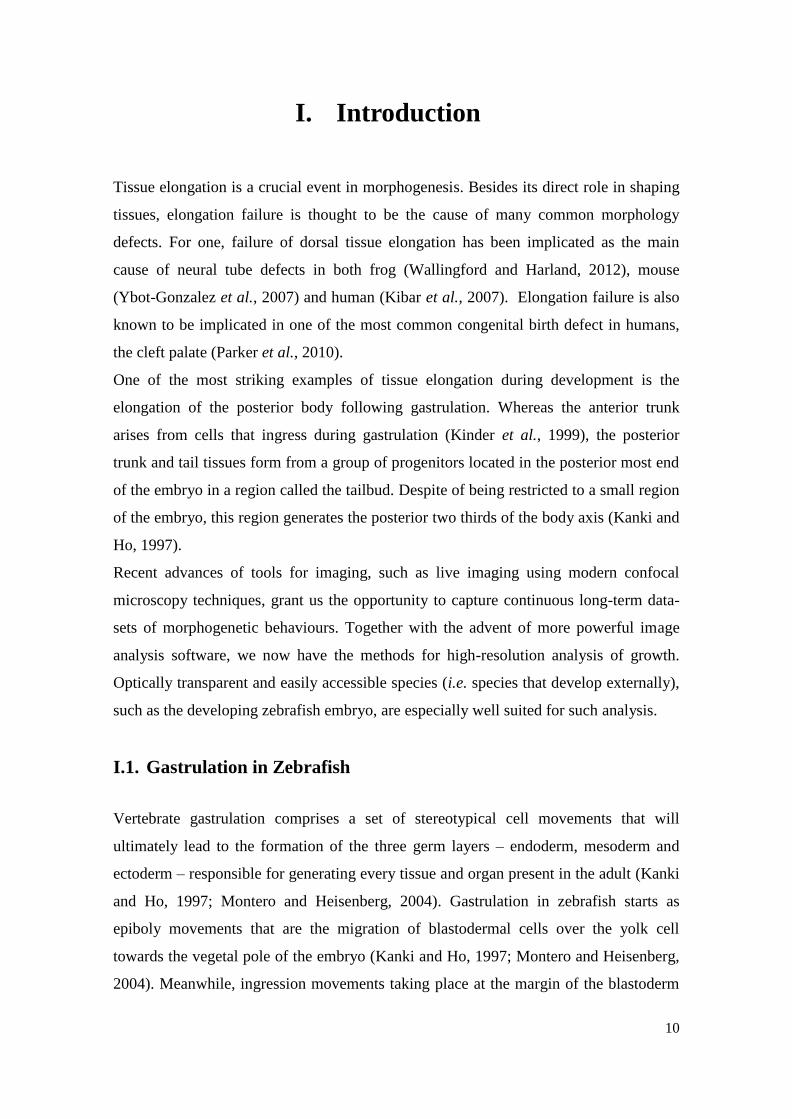
I. Introduction
Tissue elongation is a crucial event in morphogenesis. Besides its direct role in shaping
tissues, elongation failure is thought to be the cause of many common morphology
defects. For one, failure of dorsal tissue elongation has been implicated as the main
cause of neural tube defects in both frog (Wallingford and Harland, 2012), mouse
(Ybot-Gonzalez et al., 2007) and human (Kibar et al., 2007). Elongation failure is also
known to be implicated in one of the most common congenital birth defect in humans,
the cleft palate (Parker et al., 2010).
One of the most striking examples of tissue elongation during development is the
elongation of the posterior body following gastrulation. Whereas the anterior trunk
arises from cells that ingress during gastrulation (Kinder et al., 1999), the posterior
trunk and tail tissues form from a group of progenitors located in the posterior most end
of the embryo in a region called the tailbud. Despite of being restricted to a small region
of the embryo, this region generates the posterior two thirds of the body axis (Kanki and
Ho, 1997).
Recent advances of tools for imaging, such as live imaging using modern confocal
microscopy techniques, grant us the opportunity to capture continuous long-term data-
sets of morphogenetic behaviours. Together with the advent of more powerful image
analysis software, we now have the methods for high-resolution analysis of growth.
Optically transparent and easily accessible species (i.e. species that develop externally),
such as the developing zebrafish embryo, are especially well suited for such analysis.
I.1. Gastrulation in Zebrafish
Vertebrate gastrulation comprises a set of stereotypical cell movements that will
ultimately lead to the formation of the three germ layers – endoderm, mesoderm and
ectoderm – responsible for generating every tissue and organ present in the adult (Kanki
and Ho, 1997; Montero and Heisenberg, 2004). Gastrulation in zebrafish starts as
epiboly movements that are the migration of blastodermal cells over the yolk cell
towards the vegetal pole of the embryo (Kanki and Ho, 1997; Montero and Heisenberg,
2004). Meanwhile, ingression movements taking place at the margin of the blastoderm

11
Figure 1. Contribution of dorsal and
ventral blastoderm marginal cells to
the formation of the zebrafish tailbud.
The position and movement of dorsal
(blue) and ventral (red) blastoderm
marginal cells at the shield stage (left
panel), by the end of gastrulation (central
panel) and at 24 hpf (right panel).
(blue) and ventral (red) blastoderm marginal cells at the shield
stage (left panel), by the end of gastrulation (central panel) and at
24 hpf (right panel).
As seen in Agathon et al., 2003
will lead to the internalization of mesendodermal progenitor cells that will form the
hypoblast layer and will later give rise to the mesoderm and endoderm germ layers
(Kimmel et al., 1990; Montero and Heisenberg, 2004). All the ectodermal and
neuroectodermal derivatives present in the embryo will arise from the non-internalized
superficial cells remaining in the epiblast layer (Kimmel et al., 1990; Shih and Fraser,
1995). Cells of the epiblast and
hypoblast will then converge to
the future dorsal side of the
embryo and undergo
convergence extension,
ultimately resulting in the
narrowing and extension of the
embryo body along the medio-
lateral and anterior-posterior
axes, respectively (Kanki and
Ho, 1997; Montero and
Heisenberg, 2004).
I.2. Posterior body elongation in zebrafish
At the end of gastrulation, the tailbud starts to form as the cells of the blastoderm
margin come together, fusing with each other over the ventral yolk cell (Westerfield,
1993; Kimmel et al., 1995). Whereas ventral marginal cells slip over the yolk plug,
giving rise to the posterior half of the tailbud, the dorsal marginal cells migrate further,
extending towards the animal pole and originate the anterior half (Kanki and Ho, 1997;
Agathon et al., 2003) (Fig.1). According to Kanki and Ho, this constitutes the first stage
of zebrafish posterior body formation occurring between 11 and 12 hours post-
fertilization (hpf). During the second stage, the tailbud extends along the ventral side of
the yolk (between 12 up to17 hpf), stopping once it reaches the midpoint along the
ventral side. During the third stage (from 17 to 18 hpf), cells accumulate at the extremity
of the tailbud forming a larger protruding aggregate. Once the tailbud undergoes the
fourth stage of eversion and detaches itself from the yolk (from 18 hpf onward), the
extending appendage is designated as the developing tail (Fig.2).

12
Figure 2. Zebrafish posterior body formation throughout development. The four distinct
phases leading to tail formation are indicated above. The developmental stages (in somite
number and hpf) are shown below each embryo panel.
Adapted from Kanki and Ho, 1997 and Kimmel, 1995
I.3. Tailbud modes of growth
The study of vertebrate body development has generated controversy over the past
century and led to a longstanding question on whether the mechanisms underlying
anterior and posterior body formation are the same (Handrigan, 2003). Two extreme
views of posterior growth have been proposed. One view (Holmdahl, 1925) proposed
that the tailbud is a homogeneous mass of undifferentiated cells or blastema,
characterized by the combination of a high proliferation rate and the capacity to
generate all tissue types along the entire posterior axis. In addition, it is suggested that
tailbud outgrowth occurs in the absence of the cell movements typically observed during
gastrulation and takes place through secondary development, in a manner that is
comparable to limb bud development (see Model 2 in Fig.3). The other view (Pasteels,
1943) proposed the opposite notion, arguing that posterior body formation is a simple
continuation of the processes initiated during gastrulation, which includes cell relative
movements (see Model 1 in Fig.3). According to Pasteels view, the three germ layers
are established during gastrulation.
In zebrafish, time-lapse imaging (Kanki and Ho, 1997) revealed that tailbud outgrowth
involves, to some extent, the gastrulation movements responsible for head and anterior
trunk patterning, such as convergence-extension. There are in addition novel posterior-
specific cell movements, such as subduction and lateral divergence. The restricted fate
view is supported by lineage tracing experiments showing that the tailbud contains
distinct domains restricted to specific cell fates (Kanki and Ho, 1997). However, it is
important to keep in mind that possibly this fate map missed the existence of
13
multipotent precursors, owing to the small number of labelled cells. Fate map studies
are not exhaustive because only a small fraction of the cells are labelled, which does not
allow for the identification of rare events such as the existence of stem cell pools.
On the other hand, a growing body of literature support the existence of a stem cell
population resident in the vertebrate tailbud. The idea that the posterior end of the
vertebrate embryo consists of an uncommitted group of cells was recently strengthened
by two separate studies. The earliest study has shown in mouse the existence of a unique
and permanent pool of bipotential stem cells within the tailbud that can give rise to both
neural and mesodermal derivatives all along the axis using retrospective clonal analysis
(RCA) with a ubiquitous promoter (Tzouanacou et al., 2009; Nicolas et al., 1996). This
cell fate decision between the neural and the mesodermal cell lineages is continuously
made within the tailbud until the late developmental stages during tailbud outgrowth.
The second suggested the existence of a stem cell zone in zebrafish through a
combination of genetic manipulation of the Wnt signalling pathway and single cell
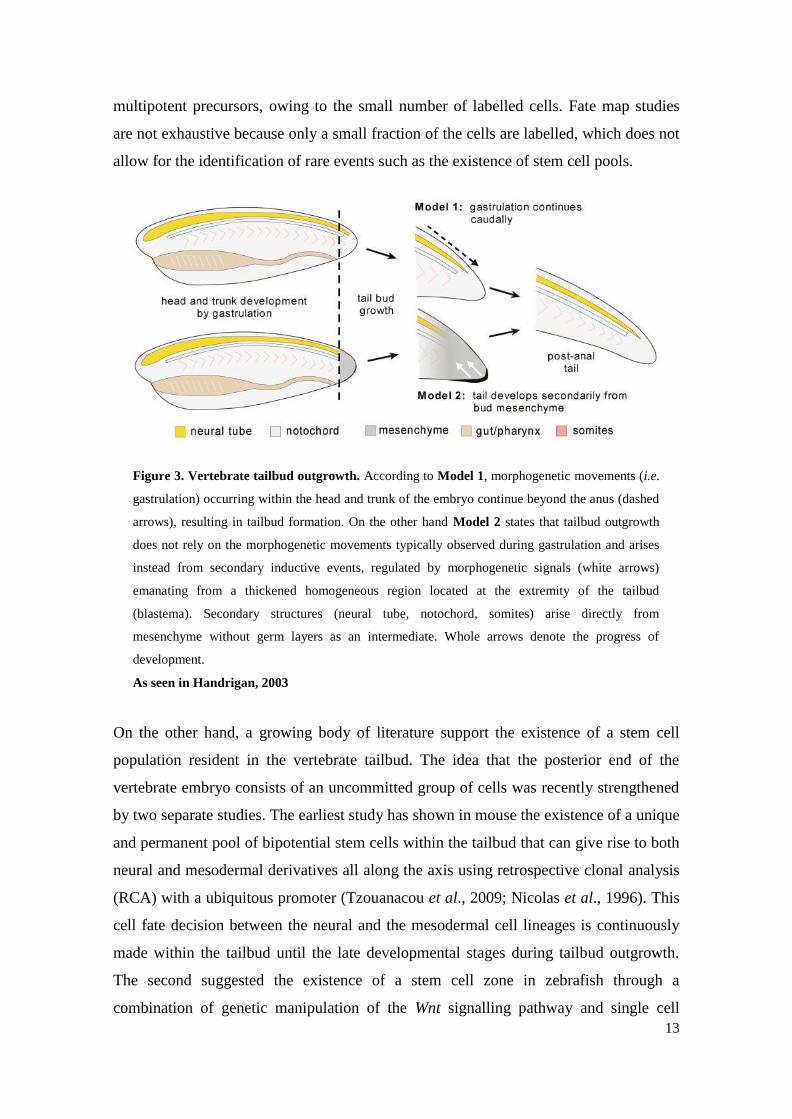
Figure 3. Vertebrate tailbud outgrowth. According to Model 1, morphogenetic movements (i.e.
gastrulation) occurring within the head and trunk of the embryo continue beyond the anus (dashed
arrows), resulting in tailbud formation. On the other hand Model 2 states that tailbud outgrowth
does not rely on the morphogenetic movements typically observed during gastrulation and arises
instead from secondary inductive events, regulated by morphogenetic signals (white arrows)
emanating from a thickened homogeneous region located at the extremity of the tailbud
(blastema). Secondary structures (neural tube, notochord, somites) arise directly from
mesenchyme without germ layers as an intermediate. Whole arrows denote the progress of
development.
As seen in Handrigan, 2003
14
transplantation techniques (Martin and Kimelman, 2012). However, it is important to
bear in mind that this study only provides indirect evidence regarding cell fate decision,
since the behaviour of the transplanted cells in a genetically-modified environment
might not accurately reflect what these cells do in their normal environment. Thus, this
longstanding controversy over the potency of tailbud cells in anamniotes remains
unanswered.
I.4. Posterior body elongation – Growth vs. tissue deformation
One can imagine that posterior body elongation can be achieved either by anisotropic
growth (proposed by Holmdahl’s blastemal model), tissue deformation (proposed by
Pasteels’ continuity of gastrulation model), or a combination of both. Tissue elongation
driven by anisotropic growth must ultimately require either an increase in number or
size of cells along the axis of growth. This can be achieved by localized proliferation,
oriented divisions or cell elongation. We can take the elongation of the vertebrate long
bones as an example of tissue elongation resulting from localized cell proliferation
(Wolpert, 2010) (Fig.4A). In an elegant study recently published, Cooper et al. (2013)
also showed that differential growth rates of the metatarsal chondrocytes (increase of up
to 40 times their original volume in the jerboa) are responsible for the differences in feet
size between the lesser Egyptian jerboa (Jaculus jaculus) and the mouse. As seen during
axis elongation in zebrafish (Gong et al., 2004) (Fig.4B), tissue elongation can also be
achieved by oriented cell divisions, with cell divisions aligned along the axis of growth.
On the other hand, tissue elongation driven by tissue deformation may be achieved
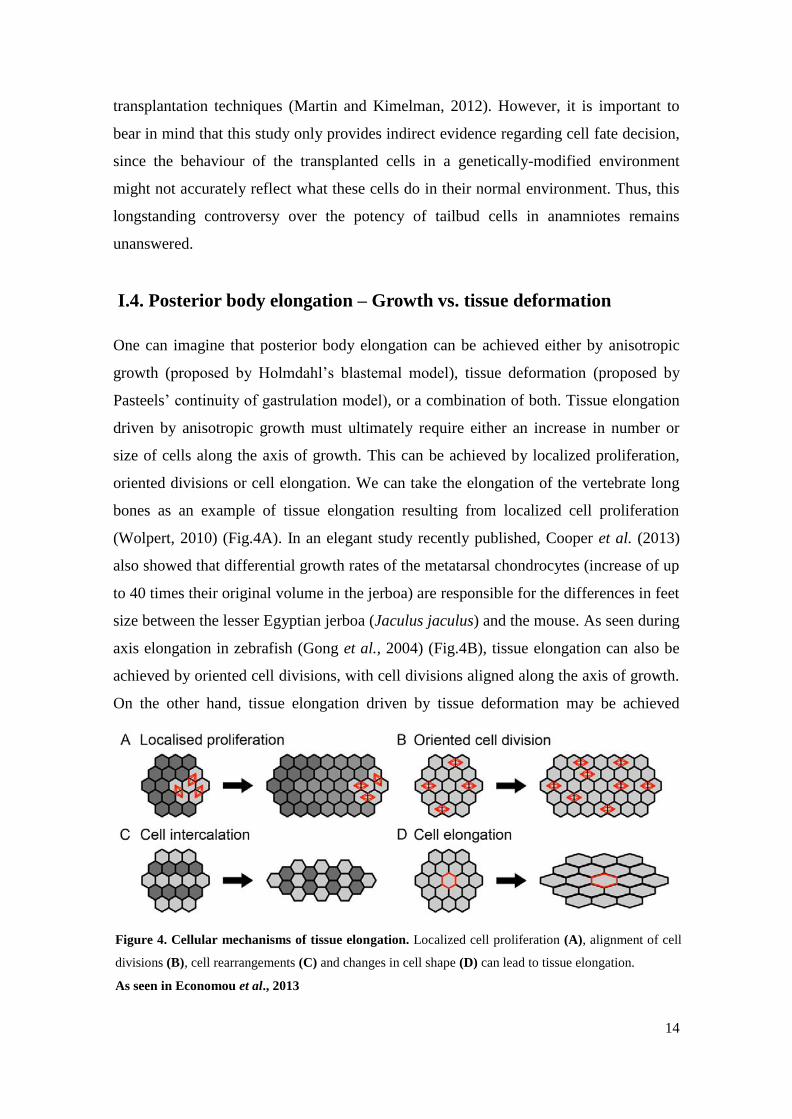
Figure 4. Cellular mechanisms of tissue elongation. Localized cell proliferation (A), alignment of cell
divisions (B), cell rearrangements (C) and changes in cell shape (D) can lead to tissue elongation.
As seen in Economou et al., 2013
15
through: (1) cell rearrangements as seen in the cell intercalation movements during
convergent extension of the vertebrate body axis (Keller, 2006) (Fig.4C); and (2) cell
shape change that is known to play a role during germ band elongation in Drosophila
for instance (Blanchard et al., 2009) (Fig.4D).
I.5. Morphometric analysis of the zebrafish tailbud
The relative contribution of anisotropic growth vs. tissue deformation to the process of
posterior body elongation is as yet unknown. With the advent of tools for imaging, such
as confocal imaging, and the gradual improvement of image analysis software, we can
now perform 3D reconstructions of a structure of interest and precisely measure the
volume and shape (length, height and width) of the given structure. This type of
approach, called a morphometric approach, facilitates the analysis of quantitative
variation, generally involves determining the volume and measuring the shape of a
tissue, and is most useful for the study of a process throughout the development of a
given structure (Roth and Mercer, 2010).
Morphometric analysis of embryonic shape and organ rudiments has already been
performed during gastrulation in live and fixed zebrafish embryos (Sepich et al., 2005).
These methods allowed not only to quantitatively assess the movements of cell
populations in vivo, but also to determine whether cell fate and/or movements are
disturbed. Although extensively used in the last years for several applications, there has
not been any study taking advantage of morphometric analysis methods to investigate
the contribution of anisotropic growth and tissue deformation to the shaping of the
zebrafish posterior body. In this context, we decided to take advantage of the Imaris
software to determine the dimensions of the posterior segments during tailbud
outgrowth in zebrafish embryos ranging from 14 up to 25,4 hpf.
I.6. Retrospective clonal analysis (RCA)
In an effort to investigate whether the progenitor pools within the zebrafish tailbud
display a proliferative/dispersal or stem cell-like mode of growth we have taken
advantage of a genetic approach to lineage analysis called retrospective clonal analysis
(RCA). RCA is based on the random and heritable labelling of single cells, allowing the
retrospective analysis of all their clonal descendants on a long-term basis (Petit et al.,

16
2005). The temporally inducible RCA method we established in zebrafish is based on
the ubi:creERt2/ubi:Switch system (Mosimann et al., 2011). This tool involves a 4-OHT
inducible, CRE-mediated heritable expression of a mCherry reporter. It is also known
that the reporter construct has an ubiquitous expression throughout zebrafish
development. The use of an inducible system allows for an estimation of the time at
which the progenitor cells were labelled. Several requirements must be met to ensure
that labelling events correspond to clones that reflect the full range of cell behaviours at
play. Firstly, the reporter must be able to be expressed in all cell types of the structure of
interest. However, only after the production of an exhaustive library of clones (with a
clone being defined as the entire progeny of a particular single cell) will we know
whether any cell can be labelled under clonal conditions. Secondly, the frequency of
labelling events must vary in response to the modulation of the parameters of the
inducing system. Thirdly, the frequency of labelling events must be able to be reduced
to a level lower than 10%, corresponding to an extremely low likelihood (less than 1%)
for the occurrence of a multiple labelling event per embryo. Fourthly, there must be
little or no activity of the reporter in the absence of induction. Most of the validation of
our temporally inducible RCA method was conducted during my M1 internship but I
continued to test different parameters during my M2 internship.
Regardless of the labeling system selected, unlike classical fate mapping, RCA is
unbiased, large-scale and exhaustive as it can label any cell. This allows for
visualization of rare events, such as stem-like behaviours as well as the precursor pool
mode of growth (proliferative/dispersal or stem-like). A self-renewal mode of growth
with stem cells located in the tailbud would be expected to produce long clones that are
anchored in the tail. Furthermore, asymmetry regarding the cell fate of the progeny
would be indicative of a stem-like mode of growth. In contrast, a proliferative/dispersal
mode of growth would generate a series of clones distributed along the axis of growth
without anchorage in the tail and with variable lengths.
Drawing from the topographical characteristics of the clones (cell number per clone,
clone antero-posterior position and extension, cell fates, frequency of each clonal
category), retrospective clonal analysis should provide insights into the growth modes,
size, number and location of the precursor pools within the tailbud.
17
II. Objectives
Although the different phases leading to zebrafish tailbud formation have been
extensively characterized, the mechanisms underlying this process continue to generate
controversy as of today. Throughout the years, two prevailing models have been
proposed to explain posterior body elongation: one defending that this process is driven
by a highly proliferative and not fate-restricted posterior growth zone and another
arguing that tissue rearrangements of fate-restricted progenitors, similar to those
observed during gastrulation, are the key factors at play. We hypothesize that rather than
being driven solely by one of these mechanisms, tailbud outgrowth results from the
combination of growth from a group of tailbud-resident cells together with dynamic cell
behaviours, such as oriented cell divisions, rearrangements and changes in cell size and
shape. Thus, in an effort to analyse these processes at the tissue level and determine the
relative contribution of these two mechanisms for zebrafish tailbud outgrowth we have
performed a series of experiments, including morphometric analysis and RCA devised
to assess:
i. Dimension (i.e. length, width, height and volume) of posterior segments
ii. Tailbud cell division patterns
iii. Clone characteristics (frequency, identity and distribution) at the tailbud level
Assessing the volume and shape of the structure over time will show the relative
contribution of growth and tissue deformation to the posterior body elongation, whereas
analysis of specific cell behaviours will tell us how growth and/or tissue deformation are
achieved.
18
III. Materials and Methods
III.1. ubi:creERt2/ubi:Switch System (lines II, V and Switch)
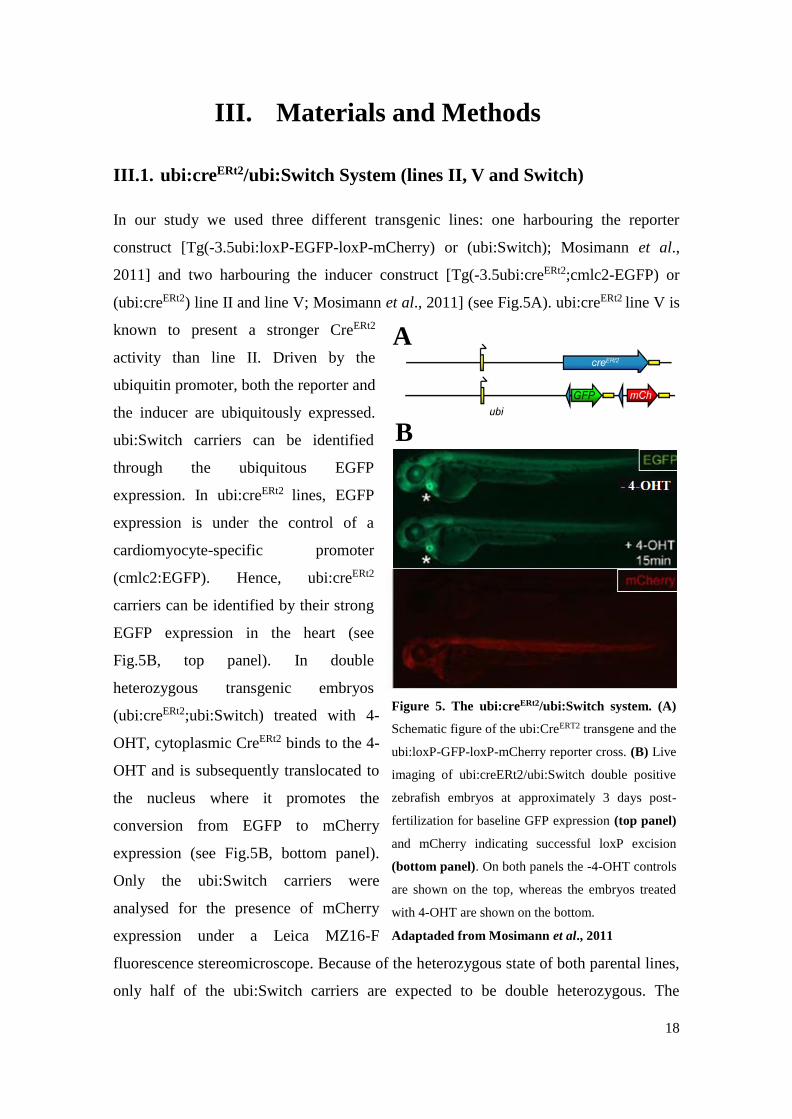
In our study we used three different transgenic lines: one harbouring the reporter
construct [Tg(-3.5ubi:loxP-EGFP-loxP-mCherry) or (ubi:Switch); Mosimann et al.,
2011] and two harbouring the inducer construct [Tg(-3.5ubi:creERt2;cmlc2-EGFP) or
(ubi:creERt2) line II and line V; Mosimann et al., 2011] (see Fig.5A). ubi:creERt2 line V is
known to present a stronger CreERt2
activity than line II. Driven by the
ubiquitin promoter, both the reporter and
the inducer are ubiquitously expressed.
ubi:Switch carriers can be identified
through the ubiquitous EGFP
expression. In ubi:creERt2 lines, EGFP
expression is under the control of a
cardiomyocyte-specific promoter
(cmlc2:EGFP). Hence, ubi:creERt2
carriers can be identified by their strong
EGFP expression in the heart (see
Fig.5B, top panel). In double
heterozygous transgenic embryos
(ubi:creERt2;ubi:Switch) treated with 4-
OHT, cytoplasmic CreERt2 binds to the 4-
OHT and is subsequently translocated to
the nucleus where it promotes the
conversion from EGFP to mCherry
expression (see Fig.5B, bottom panel).
Only the ubi:Switch carriers were
analysed for the presence of mCherry
expression under a Leica MZ16-F
fluorescence stereomicroscope. Because of the heterozygous state of both parental lines,
only half of the ubi:Switch carriers are expected to be double heterozygous. The
A
B
Figure 5. The ubi:creERt2/ubi:Switch system. (A)
Schematic figure of the ubi:CreERT2 transgene and the
ubi:loxP-GFP-loxP-mCherry reporter cross. (B) Live
imaging of ubi:creERt2/ubi:Switch double positive
zebrafish embryos at approximately 3 days post-
fertilization for baseline GFP expression (top panel)
and mCherry indicating successful loxP excision
(bottom panel). On both panels the -4-OHT controls
are shown on the top, whereas the embryos treated
with 4-OHT are shown on the bottom.
Adaptaded from Mosimann et al., 2011
19
frequency of mCherry labelled embryos was calculated by dividing the number of
labelled embryos by the expected number of double heterozygous.
III.2. 4-OHT treatment for CreERt2 induction
4-Hydroxytamoxifen or 4-OHT (SIGMA cat#H7904) is lipid-soluble and thus can
penetrate through cell membranes and the chorion. 4-OHT is light- and temperature-
sensitive. A 10 mM working stock solution in ethanol was kept in single-use aliquots at
-20 ºC in the dark. The entire clutches obtained from the crosses between one ubi:creERt2
line and the ubi:Switch line was used and split in multi-well dishes for 4-OHT induction
at different concentrations or as controls (no 4-OHT-treatment). Prior to induction, up to
50 collected embryos of the same developmental stage were kept in a single well of a
six-well plate with fresh embryo medium. Afterwards, we phenotypically characterized
each adult fish in order to use the same couples in each experiment. Also, each clutch
was analysed individually in order to track its parental origin. The prepared induction
solution was kept in the dark (covered by aluminium foil). In order to induce Cre
activity in creERt2-expressing embryos, all medium was removed and replaced with 5
mL of embryo medium freshly mixed with 4-OHT. The 4-OHT concentration used and
the induction stage vary between experimental procedures. Immediately after, the
treated embryos were placed into a 28 ºC incubator in the dark, to allow for efficient
induction. The induction solution was removed after 5 or 15 minutes, depending on the
experimental procedure, and the embryos were thoroughly rinsed once, followed by
three 5-minute washes under agitation and two more rinses, to remove all traces of 4-
OHT. The embryos were subsequently placed in a petri dish containing fresh embryo
medium and grown at 28 ºC. The next day we changed the medium for embryo medium
with 0.003% Propylthiouracil (PTU), which inhibits the formation of pigments. For the
10 μM induction experiment, we replaced the induction solution daily to maintain
CreERt2 activity.
III.3. Analysis of the clone characteristics and confocal imaging
Clone characteristics (frequency, number of cells labelled, their position along the
anterior-posterior axis and cell identity) were screened three days after performing the
4-OHT-mediated CreERt2 induction, under a Leica MZ16-F fluorescence

20
stereomicroscope. Preliminary screenings at one day post-induction (dpi) revealed a
very faint expression of mCherry, almost imperceptible. The time required for the
translocation of the cytoplasmic CreERt2 to the nucleus, recombination of the loxP sites,
mRNA transcription of the mCherry reporter and subsequent protein translation and
folding, may lead to the insufficient accumulation of mCherry after 1 day. We thus
decided to perform the screening at 3 dpi to enable mCherry sufficient accumulation
over the detection threshold.
To record the clones, embryos were imaged in a lateral view using a Leica SP-5
confocal microscope with a 10x or 40x objective. Confocal z-stacks through the entire
embryo posterior body were acquired with a 2 μm z-step. Embryos were anesthetized
with tricaine (0.16 mg/ml) and embedded in 5% methylcellulose. Since this is an
inverted microscope, the embryos were placed in a bottom glass dish. Embryos were
then fixed in PFA 4% and stored for future analysis.
III.4. Confocal imaging of fixed embryos and morphometric analysis
For our morphometric analysis we labelled the membrane and the nucleus with
fluorescent markers by co-injecting 1 nl of a mix of nuclear mCherry (0.35 µg/µl) and
membrane GFP mRNAs (0.4 µg/µl) at the one-cell stage in order to achieve ubiquitous
labelling. From the injected clutches of embryos, we collected the brightest embryos. At
the appropriate stage (from 14 up to 25,4 hpf), injected embryos were anesthetized in
embryo medium with tricaine (0.16 mg/ml), fixed in 4% PFA and embedded in 1% low-
melting-point agarose in glass bottom dishes. Embryos were oriented in a lateral
position. This is the position in which the thickness of the tissue is the lowest, allowing
better imaging. Laser scanning confocal data was acquired using a Leica SP-5 confocal
microscope. Fluorophores were excited using a 488 nm argon laser (GFP) and a 514 nm
DPSS laser (mCherry). We used a 10x objective to capture the entire posterior body
region. Confocal images were acquired as z stacks of xy images taken with a 2 μm Z-
step size. The channels were acquired simultaneously and imported into ImageJ, where
channels were split. Uniform contrast and brightness adjustments were made using
Adobe Photoshop.
Our laser scanning concofal data on fixed ubiquitously labelled samples was then
processed and surface reconstructions of all the posterior segments, pre-somitic
mesoderm (PSM) and tailbud (TB) of embryos ranging from 10 up to 32-somites (14 up
21
to 25,4 hpf) were done with the combination of the MeasurementsPro and surface
functions of the Imaris software (Bitplane AG). This was done by manually contouring
the feature of interest within the region of interest at regular z-intervals. We then
determined the dimensions (i.e. length, width, height and volume) of the entire posterior
body from the dimensions of all the resulting surface renderings (i.e. from the
dimensions of all the segments). Furthermore, both the length and volume of the entire
posterior body were calculated by summing the lengths of all the segments, whereas
both the width and height were calculated by averaging over all the segments.
In order to analyse the variation of each of these parameters throughout tailbud
elongation, we plotted the mean values obtained from several measurements at each
developmental stage against time (displayed in hpf) accompanied by the corresponding
standard deviation bars. Afterwards, we also calculated the elongation rate (ER) and fold
increase (FI) for each of these parameters during the two phases of posterior body
elongation we identified from our first observations – phase 1 (ranging from 14 hpf up
to 21 hpf) and phase 2 (from 21 hpf up to 25,4 hpf) – using the expressions:
, where x represents the mean values (n= 3 embryos) obtained at the extreme time points
of each phase for a given parameter.
III.5. Cecyil fish
In order to analyse the zebrafish tailbud mode of growth, we monitored tailbud
outgrowth in embryos belonging to a transgenic fish line called Cecyil (cell cycle
illuminated), harbouring a set of cell cycle markers coupled with different fluorescent
molecules that enable the detection of cells undergoing S/M/G2 (green) or G1 (red)
phases (Sugiyama et al., 2009). To analyse the pattern and distribution of labelled cells,
embryos were then imaged under a Leica SP-5 confocal microscope following the
parameters described below.

22
III.6. Image acquisition of fixed Cecyil embryos
Laser scanning confocal data was acquired using a Leica SP-5 confocal microscope.
Fluorophores were excited using a 488 nm argon laser (GFP) and a 561 nm DPSS laser
(DsRed). Embryos were anesthetized with tricaine (0.16 mg/ml), fixed in 4% PFA and
embedded in 1% low-melting-point agarose in glass bottom dishes. Embryos were
oriented in a lateral position. We used a 10x objective to capture the entire posterior
body region. Confocal images were acquired as z stacks of xy images taken with a 2 μm
Z-step size. These imaging parameters were selected in order to ensure the viability of
the embryo while maintaining enough image resolution for automated analysis. The
channels were acquired simultaneously and imported into ImageJ, where channels were
split. Uniform contrast and brightness adjustments were made using Adobe Photoshop.
23
IV. Results
IV.1. Tailbud elongation undergoes two distinct phases
As a starting point, we decided to investigate in more detail the mechanism(s)
responsible for posterior body elongation by monitoring zebrafish tailbud outgrowth
using large-scale 4-D morphometric analysis. We defined segments as the portion of
posterior body that corresponds to two consecutive somites: segment 13-14 is the
portion of the body at the level of somites 13 and 14; the unsegmented region and the
tailbud are each a segment. To this end, the length, width, height and volume of
posterior segments (i.e., the segments that will give rise to the posterior body, that in
zebrafish correspond to segment 13-14 up to the most caudal segment, the tailbud) of
embryos from 10 (14hpf) up to 32 somites (25,4hpf) were determined using the Imaris
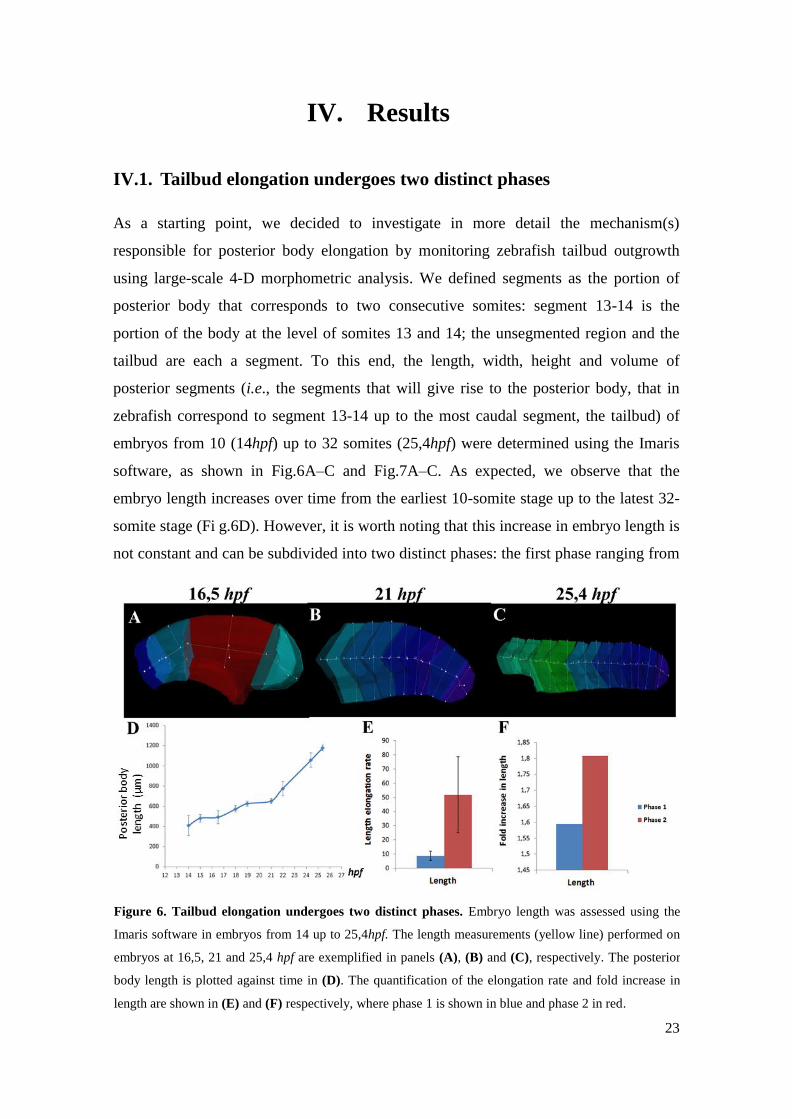
software, as shown in Fig.6A–C and Fig.7A–C. As expected, we observe that the
embryo length increases over time from the earliest 10-somite stage up to the latest 32-
somite stage (Fi g.6D). However, it is worth noting that this increase in embryo length is
not constant and can be subdivided into two distinct phases: the first phase ranging from
Figure 6. Tailbud elongation undergoes two distinct phases. Embryo length was assessed using the
Imaris software in embryos from 14 up to 25,4hpf. The length measurements (yellow line) performed on
embryos at 16,5, 21 and 25,4 hpf are exemplified in panels (A), (B) and (C), respectively. The posterior
body length is plotted against time in (D). The quantification of the elongation rate and fold increase in
length are shown in (E) and (F) respectively, where phase 1 is shown in blue and phase 2 in red.

24
14 up to 21hpf (i.e., from 10 up to 24 somites) when the embryo length increases slowly
over time and the second phase taking place from 21hpf onward, when the embryo
length increases more rapidly (Fig.6D). To describe further these two phases, we
quantified the speed and amount of length increment during phase 1 and phase 2 by
calculating the elongation rate and fold increase in elongation in both phases. Our
results clearly show that during phase 2, both the elongation rate and the fold increase
are significantly higher (Fig.6E, F) than in phase 1. The posterior body therefore
elongates more and faster during phase 2. Tailbud elongation in zebrafish clearly
undergoes two distinct phases.
IV.2. Tailbud outgrowth relies both in tissue deformation and growth
We next decided to investigate whether we could detect significant changes in tissue
shape by directly analyzing the width and height of the posterior body over time. Our
results demonstrate that during phase 1, the posterior body width tends to decrease over
time, whereas the height has a tendency to increase (Fig.7D), supporting the idea that
Figure 7. Tailbud elongation relies on alterations in posterior body shape. Posterior body width and
height were assessed using the Imaris software on embryos from 14 up to 25,4hpf. The width (red line)
and height (yellow line) measurements performed on embryos with 16,5, 21 and 25,4hpf are exemplified
in panels (A), (B) and (C), respectively. The posterior body width (red curve) and height (green curve)
are plotted against time in (D). The rate of width and height variation during the first phase (in blue) and
the second phase (in red) are shown in (E). The fold increase in width and height are shown in (F), with
phase 1 in blue and phase 2 in red.
25
significant changes in tissue shape are taking place. More precisely, the structure is
getting thinner, taller and longer. However, this scenario is completely different during
the second phase, where both width and height seem to have reached a plateau (Fig.7D),
suggesting that changes in tissue shape during this phase are much more subtle. This
difference between phase 1 and 2 is confirmed when we compare the rates and fold
increase of width and height variations. Regarding the width, both the rate and fold
increase are negative during the first phase and almost null in the second phase, which is
consistent with the decrease and subsequent stabilization observed during phase 1 and 2,
respectively (Fig.7E, F). Similarly for the height, both the rate and fold increase are
higher during phase 1, thus supporting the previous results showing an increase during
phase 1 and a stabilization in phase 2 (Fig.7E, F).
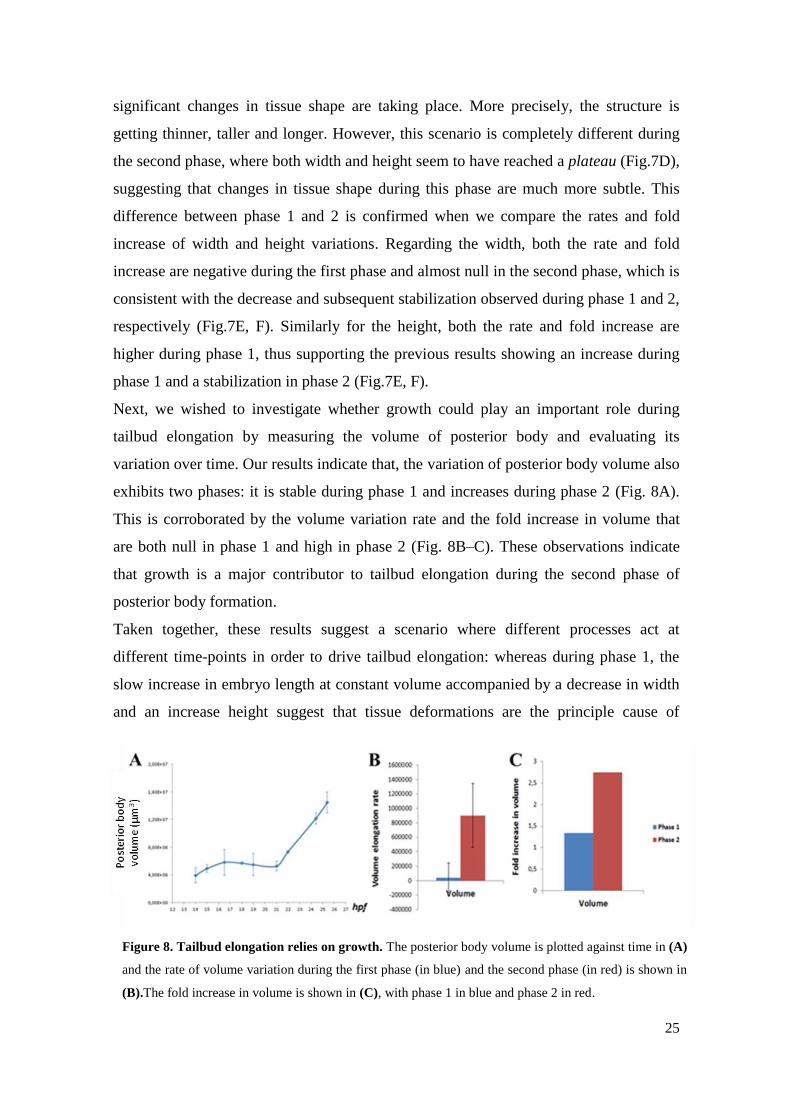
Next, we wished to investigate whether growth could play an important role during
tailbud elongation by measuring the volume of posterior body and evaluating its
variation over time. Our results indicate that, the variation of posterior body volume also
exhibits two phases: it is stable during phase 1 and increases during phase 2 (Fig. 8A).
This is corroborated by the volume variation rate and the fold increase in volume that
are both null in phase 1 and high in phase 2 (Fig. 8B–C). These observations indicate
that growth is a major contributor to tailbud elongation during the second phase of
posterior body formation.
Taken together, these results suggest a scenario where different processes act at
different time-points in order to drive tailbud elongation: whereas during phase 1, the
slow increase in embryo length at constant volume accompanied by a decrease in width
and an increase height suggest that tissue deformations are the principle cause of
Figure 8. Tailbud elongation relies on growth. The posterior body volume is plotted against time in (A)
and the rate of volume variation during the first phase (in blue) and the second phase (in red) is shown in
(B).The fold increase in volume is shown in (C), with phase 1 in blue and phase 2 in red.

26
Figure 9. Myogenesis and notochord inflation drive
zebrafish elongation. Schematic figure depicting the
zebrafish posterior segments at 18hpf. Segments are
indicated in black and their corresponding A-P position
in red (A). By 19 hpf notochord inflation becomes
apparent as cells start to slightly distantiate from each
other (B, white asterisk). Later, as cells start
undergoing cavitation, vacuoles start forming inside the
notochord (C, yellow asterisk), increasing in size until
they occupy the whole extension of the notochord (D,
red asterisk). The last somite where myofibers are
elongated laterally is indicated with a white arrow in
panels (E– G), corresponding to somite 12 (19 hpf) , 17
(21 hpf) and 26 (25,4 hpf) , respectively. Plotting the
volume of each posterior segment against its position on
the A-P axis, we observe that the increment in volume
is consistent with the onset of notochord inflation and
myofiber elongation (G).
Plotting the volume of each posterior segment against
elongation during this first phase, the rapid increase in length and volume together with
width and height stabilization indicate minor changes in tissue shape but a major role for
an accentuated growth during phase 2.
IV.3. Myogenesis and notochord inflation correlate with growth in
early born segments
Although our previous results highlight the importance of growth especially during the
second phase of tailbud elongation, the antero-posterior levels where the posterior
segments undergo these physical modifications within the 21-25,4hpf time frame remain
to be identified. Thus, we analyzed the volume variation over time displayed by each
red asterisk). The last somite where myofibers are elongated laterally is indicated with a white arrow in panels (E–
G), corresponding to somite 12 (19 hpf), 17 (21 hpf) and 26 (25,4 hpf), respectively. Panels (B-G) represent
maximum intensity projections of z-stacks acquired from PFA(4%)-fixed embryos ubiquitously labelled with
membrane-targeted GFP highlighting the cell contours using a Leica SP5 confocal microscope. The volume of each
posterior segment is plotted against its position on the A-P axis in (H).
27
posterior segment, using embryos from 10 (14hpf) up to 30 somites (24,4hpf). To be
able to register and thus compare the evolution of each posterior segment, the volume of
each segment was plotted against its position on the antero-posterior (A-P) axis, position
+1-2 corresponding to the last segment formed (Fig. 9A). For example, in a 18-somite
stage embryo, the position +1-2 corresponds to segment 17-18. By doing so, we
observed that from position +7-8 up to position 17-18 in embryos ranging from 21 up to
24,4hpf, the increase in volume becomes much more accentuated (Fig.9H), suggesting
that growth is taking place mainly in the early born segments, that include the first three
posterior segments forming in the embryo (i.e., segment 13-14, segment 15-16 and
segment 17-18).
After determining that early born segments correspond to the posterior segments
displaying major growth during posterior body elongation, we were interested in
investigating which biological processes could correlate with this tissue response. Upon
carefully monitoring these embryos throughout tailbud outgrowth, we discovered two
possible mechanisms that were good candidates to explain our previous observations.
The first is a phenomenon known as notochord inflation, a process in which notochord
cells undergo cavitation, becoming highly enlarged in volume in a rostral-to-caudal
fashion (Fig.9B–D). The second is myofiber maturation during which a subset of
muscle cells start to fuse with each other, forming long myotubes, after that another
subset of muscle cells have elongated and relocated to the somite surface (Fig.9E–G).
These behaviors result in alterations in somite shape and size. In order to investigate
whether these processes correlate with growth, we observed and annotated for each
embryo stage the segment corresponding to the posterior-most segment where
notochord inflation could be observed, as well as the posterior-most segment where
elongated myofibers were located laterally in the somites. Afterwards, we compared
these observations with the variation in volume displayed by all the posterior segments.
By doing so we were able to conclude that the increment in volume observed from
position 7-8 up to position 17-18 in embryos ranging from 21 up to 24,4 hpf is
coincident with the onset of notochord inflation and myofiber maturation in these
stages, indicating that both processes seem to be directly involved in posterior body
growth (Fig.9H). Furthermore, we also observed that in early born segments, notochord
inflation and myofiber maturation are initiated when these segments occupy a more
anterior position compared to that of late born segments. In addition, in early born

28
segments, the onset of notochord inflation and myofiber maturation occur
simultaneously while in late born segments, the onset of notochord inflation and
myofiber maturation are slightly out of phase (Fig.9H). Together, these observations
indicate that both processes of notochord inflation and myofiber maturation progress
posteriorly faster than segment formation, with notochord inflation progressing slightly
faster than myofiber maturation.
IV.4. Lack of persistent proliferation in the zebrafish tailbud suggests
the absence of a pool of resident stem-cells
In order to shed some light into the zebrafish tailbud mode of growth either
proliferative/dispersal or stem-like, we monitored tailbud outgrowth in embryos
belonging to a transgenic fish line called Cecyil, harbouring a set of cell cycle markers
coupled with different fluorescent molecules that enable the detection of cells
undergoing S/M/G2 (green) or G1 (red) phases (Sugiyama et al., 2009). Our results
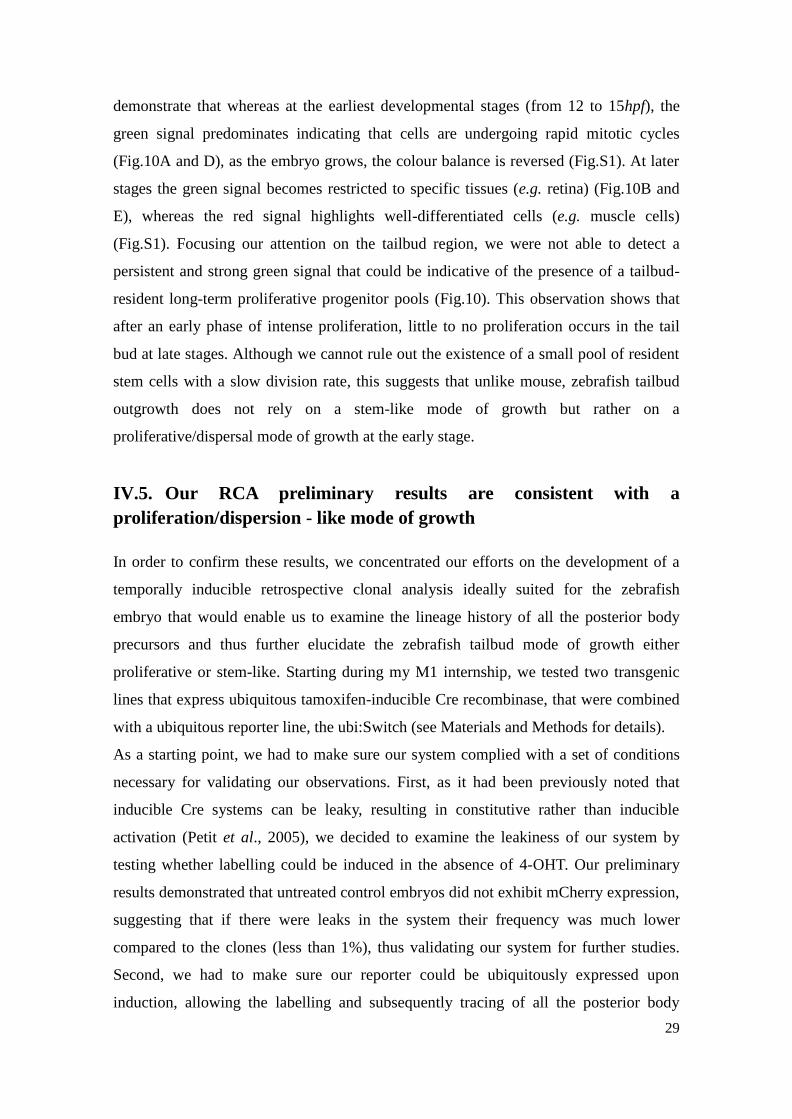
Figure 10. The zebrafish tailbud does not contain a pool of resident proliferative
progenitors. Representative maximum intensity projection of PFA-fixed Cecyil embryos
during posterior body formation, visualizing proliferating cells (green; A-C). Developmental
stages are expressed in hpf. Z-stacks were acquired from live embryos using a Leica SP5
confocal microscope equipped with an objective lens (x10 N.A. 0.3). Panels (D-F) represent
a single bright field plane merged with the green signal to better visualize the embryonic
structures. Brackets delimit the tailbud region.
29
demonstrate that whereas at the earliest developmental stages (from 12 to 15hpf), the
green signal predominates indicating that cells are undergoing rapid mitotic cycles
(Fig.10A and D), as the embryo grows, the colour balance is reversed (Fig.S1). At later
stages the green signal becomes restricted to specific tissues (e.g. retina) (Fig.10B and
E), whereas the red signal highlights well-differentiated cells (e.g. muscle cells)
(Fig.S1). Focusing our attention on the tailbud region, we were not able to detect a
persistent and strong green signal that could be indicative of the presence of a tailbud-
resident long-term proliferative progenitor pools (Fig.10). This observation shows that
after an early phase of intense proliferation, little to no proliferation occurs in the tail
bud at late stages. Although we cannot rule out the existence of a small pool of resident
stem cells with a slow division rate, this suggests that unlike mouse, zebrafish tailbud
outgrowth does not rely on a stem-like mode of growth but rather on a
proliferative/dispersal mode of growth at the early stage.
IV.5. Our RCA preliminary results are consistent with a
proliferation/dispersion - like mode of growth
In order to confirm these results, we concentrated our efforts on the development of a
temporally inducible retrospective clonal analysis ideally suited for the zebrafish
embryo that would enable us to examine the lineage history of all the posterior body
precursors and thus further elucidate the zebrafish tailbud mode of growth either
proliferative or stem-like. Starting during my M1 internship, we tested two transgenic
lines that express ubiquitous tamoxifen-inducible Cre recombinase, that were combined
with a ubiquitous reporter line, the ubi:Switch (see Materials and Methods for details).
As a starting point, we had to make sure our system complied with a set of conditions
necessary for validating our observations. First, as it had been previously noted that
inducible Cre systems can be leaky, resulting in constitutive rather than inducible
activation (Petit et al., 2005), we decided to examine the leakiness of our system by
testing whether labelling could be induced in the absence of 4-OHT. Our preliminary
results demonstrated that untreated control embryos did not exhibit mCherry expression,
suggesting that if there were leaks in the system their frequency was much lower
compared to the clones (less than 1%), thus validating our system for further studies.
Second, we had to make sure our reporter could be ubiquitously expressed upon
induction, allowing the labelling and subsequently tracing of all the posterior body

30
precursors. In order to test this, we crossed the ubi:creERt2 lines (line II or line V) with
ubi:Switch line and submitted the embryos to a continuous high concentration of 4-OHT
(10 μM; as described in Methods) to achieve high CreERt2 responses. By doing so, we
were able to detect widespread labelling, in the sense that it encompassed a large
fraction of the cells broadly scattered all along the body axis, including neural tube,
notochord, gut, surface ectoderm, fin and muscle cells. With this result we confirmed
that the reporter can be expressed in most if not all tissue types in the posterior body,
indicating that our system is suited for tailbud lineage tracing experiments.
After verifying that our system met the requirements necessary to establish a temporally
inducible retrospective clonal analysis strategy, we had to determine a set of right
parameters that would enable us to modulate induction in such a way that we would be
able to conduct our experiments under clonal conditions, i.e., when the frequency of
embryos labelled is lower that 10%. First, we had to select which embryonic stage
would be more suitable to perform the inductions. Since we wanted recombination to
happen prior to the tailbud outgrowth, which in zebrafish starts at about 10hpf, we
Figure 11. Clones obtained by temporally inducible retrospective clonal analysis. The small library
of clones is exemplified in panels (A) to (E) where we can observe labelling in surface ectoderm cells at
the level of somite 23 (A) and in muscle fibers located on somite 19, 12, 10 and 5 (B– E), respectively.
These clones were obtained from both ubi:creERt2 lines II and V, induced at 4 hpf with 15 nM of 4-OHT
for 5 min.

31
decided to perform inductions at 4hpf (sphere stage) and 8hpf (75%-epiboly). The
results obtained were similar for both stages, suggesting that the induction time point
does not significantly affect the successful recombination.
We then had to play with various parameters that might directly affect the frequency of
labelling events, such as different concentrations of 4-OHT, variations of the induction
length and different ubi:creERt2 lines, in order to reach optimal clonal conditions. After
performing several tests, we observed that whereas the first two parameters affected the
frequency of labelling events in a concentration/time-dependent manner, the latter did
not seem to have a significant effect on labelling extent nor distribution.
Clonal frequencies were reached with 15 nM of 4-OHT and also with 25 nM (Fig.11).
From these experiments conducted for a two-year period we were able to generate a
small library of 23 clones from both ubi:creERt2 lines II and V, induced at 4 or 8hpf using
15 or 25 nM 4-OHT for 5 min (Table 1). The clones altogether are located over the
entire anterior-posterior axis and correspond to a wide range of cell types: surface
ectoderm cells (Fig.11A), muscle fibers (Fig.11B–E), neurons and fin cells (Table 1).
Up to this point we only identified small clustered unipotent clones and no clones
indicative of a stem-cell like mode of growth were found. Although a bigger library of
clones has to be built in order to conclusively rule out the existence of a tailbud-resident
stem cell pool, as of today these results support the idea that tailbud outgrowth in
zebrafish relies on a proliferative rather than a stem-cell like mode of growth, which is
consistent with our previous results using the Cecyil transgenic fish line.
Table 1. Library of clones obtained by temporally inducible retrospective clonal analysis.
Number of labelled cells Cell type AP position Number of clusters
2 Muscle fiber ? 1 2 Surface ectoderm Head 1 2 Surface ectoderm Head 1 2 Muscle fiber Somite 4/13 1 or 2 4 Surface ectoderm Somite 22 1 1 Muscle fiber Somite 10 1 3 Surface ectoderm Head 1 1 Muscle fiber Somite 11 1 1 Muscle fiber Tail 1 2 + 4 Muscle fiber + Fin Tail 2 ? Neurons Somite 11 1 2 Surface ectoderm Head 1 1 Surface ectoderm Head 1

32
10 Surface ectoderm Fin (Somite 23) 1 1 Muscle fiber Somite 19 1 1 Muscle fiber Somite 12 1 1 Muscle fiber Somite 10 1 ? Neuronal cells Eye 1 ? Neuronal cells Eye 1 ? Surface ectoderm Somite 1 1 3 Muscle fiber Somite 5 1 2 Muscle fiber Somite 9 1 1 or 2 Muscle fiber Somite 4 1
33
V. Discussion
V.1. Posterior body tissue dynamics
In the present work we found evidence supporting the idea that tailbud outgrowth
undergoes two distinct phases in which the embryo posterior segments undergo a series
of shape and size modifications. In particular, we observed that whereas segment
growth, i.e. increase in volume, occurs mainly during the second phase of tailbud
elongation, the highest amount of segment shape changes, i.e. the most significant
variations in segment width and height, takes place mainly during the first phase. Taken
together our results support what other authors have previously postulated, arguing that
tailbud outgrowth relies on the combination of diverse mechanisms (Keller, 2002),
rather than on a single process. Although our study already provided precious insights
into the dynamics of tissue growth and remodeling during zebrafish posterior body
elongation, the precise events taking place at the cellular level that are the microscopic
driving forces of these tissue modifications are not yet completely understood. For
instance, considering only segment growth, one can imagine at least two distinct events
that could lead to an increase in the segment volume observed at the tissue level: one
possible explanation would be the accentuated increase in the number of cells along the
antero-posterior embryonic axis; on the other hand it could be simply due to alterations
in cell shape and size (e.g. cell elongation or cell-cell spacing modifications) that can
occur in the absence of cell proliferation. Moreover, one should also keep in mind that
the increase in the number of cells in the direction of growth rather than relying solely
on cell proliferation, can also be attained through a combination of cell movements,
rearrangements and oriented cell divisions (Economou et al., 2013). Taking into
consideration the substantial amount of studies addressing these issues during the last
years, it has been becoming clear that in the majority of cases these complex
morphogenetic events rely on an intricate combination of all these cellular processes,
rather than on one sole main mechanism. A clear example that morphogenesis often
involves the combination of different cellular processes is the vertebrate limb bud.
Evidence in the mouse limb bud has shown that proliferation cannot solely be
accountable for growth, and that both cell shape and oriented cell divisions are
important for driving elongation (Boehm et al., 2010). In this context, we believe it is
34
reasonable to assume that all these processes could be at play during zebrafish tailbud
outgrowth and ought to be properly investigated on an individual basis in order to
dissect their relative contribution. Thus, we strongly believe that in the future
experiments addressing the following points should be performed:
i. Cell behaviours (e.g. cell intercalation) should be performed in the developing
zebrafish tailbud by tracking and monitoring individual tailbud cells using 4D
live imaging;
ii. Cell shape changes should be carried out by analysing cell segmentation profiles
in mosaically labelled movies;
iii. Oriented cell divisions should also be quantified by direct annotation from the
generated movies.
For this reason, we developed long-term 4D imaging of the growing tailbud of
zebrafish, a vertebrate model ideally suited for long-term live imaging. To do so, we had
to find the right parameters to time-lapse the entire posterior body elongation, such as z-
and time-step, magnification and how to embed the embryos. By right parameters one
means those that allow us not to miss any cell division and to have enough resolution to
track cells in space and time (average time-step of 2 minutes and z-step of 2µm). We
have started addressing the aforementioned points by: (1) manually annotating all cell
divisions in the zebrafish tailbud by marking the x,y,z,t position of each hemi-nuclei
with the Imaris measurement point tool in mosaically labelled embryos (by injecting 32-
cell stage embryos with nuclear mCherry and membrane GFP mRNAs; see Fig. S2);
and (2) generating automated cell tracks of all nuclei and manually selecting the ones
originating from the tailbud.
Afterwards, we investigated the biological mechanisms that could correlate with the
physical alterations we had observed at the tissue level and we discovered two
independent processes taking place during tailbud outgrowth – notochord inflation and
myogenesis – that proved out to be excellent candidates to support our previous
observations. A recent study provided further evidence, at least for the role of
myogenesis in tissue elongation (Bouldin et al., 2014). By taking advantage of a
transgenic zebrafish line that misexpresses cdc25a, a key controller of mitotic entry, the
authors observed that cells abnormally express MyoD, a transcription factor known to
play a critical role in zebrafish muscle formation, and remain in an undifferentiated
state. As a consequence, they are not capable of contributing to the formation of
35
myofibers, and thus to contribute significantly to the lengthening of the embryo (note
that ectopic expression of Cdc25a results in the shortening of the embryos). However,
further investigation is needed in order to not only confirm the importance of these two
biological processes, but also to identify other novel mechanisms that may be actively
contributing to tailbud elongation.
Collectively, the data presented in this study points towards a scenario in which growth
from the tailbud plays little or no role during zebrafish tailbud elongation and occurs
mostly anteriorly, based on the fact that:
i. Growth only starts to increase significantly during the second phase of tailbud
outgrowth;
ii. The highest increase in volume is mainly observed in anterior segments;
iii. Cell divisions in Cecyil fish are practically inexistent in the tailbud region;
iv. Our RCA experiments do not suggest the existence of a stem cell pool resident
in the zebrafish tailbud.
V.2. The role of cell proliferation during tailbud outgrowth
Finally, combining two different experimental strategies, Cecyil fish and RCA, we tried
to investigate in more detail the zebrafish tailbud mode of growth in an effort to find an
answer to the longstanding question regarding the potency of tailbud cells that has been
generating controversy amongst the scientific community for the past years. In both
cases we found no evidence supporting the existence of a stem-cell population resident
in the zebrafish tailbud, which lead us to believe that in this vertebrate model tailbud
outgrowth relies mostly on the proliferation/dispersion of lineage-restricted progenitors.
By taking advantage of a novel zebrafish transgenic line that ubiquitously expresses a
photoconvertible protein, together with long-term imaging, Bouldin et al. 2014 were
able to label groups of posterior progenitors and reveal that they enter a prolonged
quiescent phase until they begin to differentiate as somitogenesis proceeds, further
supporting the proliferative/dispersal mode of growth in the zebrafish tailbud. This is
opposed to what has been shown in the mouse model where it was recently
demonstrated that a stem cell pool resides within the tailbud, as it is capable of
generating both cells in the neural tube and muscle (Tzouanacou et al., 2009). It also
challenges current thinking that the zebrafish tailbud, as seen in the mouse, is populated
by a bipotential cell pool (Martin and Kimelman, 2012). However, the latter study was
36
based on the combination of Wnt signalling disruption and single cell transplantation
techniques, and thus only provide information over the potency of these cells when
challenged, rather than providing an accurate representation of the endogenous cells
capabilities in the wild-type normal environment. The discrepancies over the fate
decision made within the tailbud between zebrafish and the mouse, might derive from
differences in the speed of development, one of the key differences between amniotes
and anamniotes. Zebrafish embryos need to develop very rapidly, as it needs to escape
predators and feed as soon as possible. In contrast, mouse embryonic development
occurs in utero, hence protected and can therefore be slower. In this context, one might
argue that zebrafish tailbud relies on a rapid proliferative/dispersal mode of growth, as
opposed to a slow stem cell mode of growth seen in the mouse.
Although this study already provided some clues on the mechanisms involved in
zebrafish tailbud elongation, the preliminary results obtained are not sufficient to draw a
definite conclusion and exclude stem cells as one of the key players acting to drive
tailbud outgrowth. Therefore, other complementary experiments ought to be performed
in the future to validate this hypothesis. In this context, one alternative to confirm that
the zebrafish tailbud is indeed devoid of stem cells that may play a role during posterior
body formation and relies mostly on the proliferation of lineage-restricted progenitors,
would be to perform a double immunohistochemistry on fixed embryos at different
developmental stages using antibodies against stemness (e.g. Oct4 and Sox2) and
proliferation markers (e.g. Ki67) that have been previously validated in zebrafish
(Robles et al., 2011) and check whether it would be possible to identify cells resident in
the tailbud positive for both markers. If yes, then the stem-cell like mode of growth
hypothesis could not be discarded and would have to be reconsidered, but if, on the
other hand, it was possible to identify only Ki67+ cells, then we would obtain one more
observation supporting the idea that tailbud outgrowth is mainly driven by proliferation
of unipotent precursors, which is consistent with the preliminary results present in our
study. Although the co-expression of both proliferation and stemness markers would be
a first evidence pointing towards the existence of a stem-like mode of growth, the
definitive proof could only be attained by performing lineage tracing experiments
demonstrating cell fate asymmetry and multipontency. Moreover, the relative
contribution of cell proliferation towards elongation has already been quantified in a
mutant (emi1-/- zebrafish mutant), in which the cell cycle is arrested shortly after the

37
beginning of gastrulation, resulting in a 22% reduction on axis elongation (Zhang et al.,
2008). However, an alternative approach using specific DNA replication inhibitors (e.g.
Aphidicolin and Hydroxyurea) that cause cell cycle arrest at the S phase would also be
an interesting trail to pursue since, unlike the emi1-/- zebrafish mutant, it would allow to
block cell divisions at specific time-points, and thus more precisely evaluate their
impact on posterior body formation. During these assays embryos are placed inside a
solution containing both DNA replication inhibitors while the control counterparts are
placed inside a DMSO solution and incubated until fixation. To assay for DNA
synthesis after drug incubation, BrDU can be injected into the yolk and its incorporation
by the proliferating cells can then be measured by performing immunohistochemistry on
fixed embryos at different developmental stages using an anti-BrDU antibody. By
subjecting zebrafish embryos to this treatment while quantifying BrDU incorporation by
tailbud resident cells, one can imagine at least three distinct possible outcomes:
i. Tailbud outgrowth is completely impaired in embryos treated with DNA
replication inhibitors – demonstrating that cell proliferation is essential for
tailbud outgrowth;
ii. Tailbud outgrowth still occurs in embryos treated with DNA replication
inhibitors, but the process is much slower when compared to DMSO-treated
embryos and/or the embryos display a set of posterior body abnormalities –
suggesting that cell proliferation is required, but it is not the only process
involved in tailbud outgrowth;
iii. Tailbud outgrowth in embryos treated with DNA replication inhibitors occurs
normally as in control DMSO-treated embryos – indicating that cell proliferation
is not at all required for tailbud outgrowth, a scenario that is less likely to be true
and is not consistent with our preliminary results.
Based on the library of clones so far generated by RCA and on our experiments using
the Cecyil zebrafish transgenic line, we strongly believe that cell proliferation in
lineage-restricted progenitors throughout the posterior body is one of the mechanisms
that enables posterior body elongation in zebrafish. Therefore by performing these
experiments we would expect to observe at least a partial impairment in tailbud
elongation accompanied by a slow BrDU uptake in tailbud cells.
Another important aspect that should be addressed in the future has to do with the
conservation of the evolutionary mechanisms involved in the control of vertebrate
38
posterior body formation. Although it has been previously demonstrated that in avians
(Catala et al., 1995) and Xenopus (Gont et al., 1993) the formation of the posterior body
seems to rely mainly on the same mechanisms that are responsible for regulating
morphogenesis and patterning more rostrally in the embryo, for other animal models
such as mouse and zebrafish this is not yet clear. In these models, evidence of
developmental features were found to be congruent with both Holmdahl’s and Vogt’s
ideas, leading some authors to believe that these vertebrate species have a heterogenous
tailbud (Handrigan, 2003). From an evolutionary point of view, it seems reasonable to
infer that the common ancestor of all vertebrates must have had a heterogenous tailbud,
a developmental trait that throughout evolution was maintained in some clades and at
the same time lost in other groups where the formation of the posterior body evolved in
a specialized fashion due to distinct selective pressures. This assumption got strengthen
when Schubert et al. 2001 reached a similar conclusion upon studying the expression
pattern of Wnt genes in the developing tailbud of amphioxus, which is considered to be
the closest living proxy to the common ancestor of all vertebrates. Although a
substantial amount of evidence point towards this scenario, further research addressing
these issues is needed in order to understand how these developmental mechanisms
differ between chordates vs. non-chordates and amniotes vs. anamniotes.
V.3. Future Perspectives
In the future more experiments addressing the molecular and cellular mechanisms
involved in the regulation of tailbud outgrowth ought to be performed, aiming to:
1. Analyze the cell behaviours underlying the alterations in segment shape and size
observed at the tissue level using live imaging;
2. Investigate in more detail the importance of notochord inflation and myogenesis
for posterior body elongation;
3. Confirm the importance of cell proliferation during posterior body elongation
and the (non-)existence of tailbud resident stem cells in zebrafish;
4. Perform complementary studies in other animal models, including amniotes and
other anamniotes such as amphioxus, in order to conduct a comparative study
aiming to evaluate the (non-)conservation of the evolutionary mechanisms
underlying tailbud outgrowth in vertebrates.

39
References
Agathon, A., Thisse, C. and Thisse, B. (2003). The molecular nature of the zebrafish
tail organizer. Letters to Nature 424, 448-452.
Blanchard, G. B., Kabla, A. G., Schultz, N. L., Butler, L. C., Sanson, B., Gorfinkiel,
N., Mahadevan, L. and Adams R. J. (2009). Tissue tectonics: morphogenetic strain
rates, cell shape change and intercalation. Nat. Methods 6, 458-464.
Boehm, B., Westerberg, H., Lesnicar-Pucko, G., Raja, S., Rautschka, M., Cotterell,
J., Swoger, J. and Sharpe, J. (2010).The role of spatially controlled cell proliferation
in limb bud morphogenesis. PLoS Biology 7(8): e1000420.
Bouldin, C. M., Snelson, C. D., Farr III, G. H. and Kimelman, D. (2014).Restricted
expression of cdc25a in the tailbud is essential for formation of the zebrafish posterior
body. Genes & Dev. 28, 384-395.
Catala, M., Teillet, M. A. and Le Douarin, N. M. (1995). Organization of the tailbud
analyzed with the quail-chick chimaera system. Mech. Dev. 51, 51-65.
Cooper, K. L., Oh, S., Sung, Y., Dasari, R. R., Kirschner, M. W. and Tabin, S. J.
(2013). Multiple phases of chondrocyte enlargement underlie differences in skeletal
proportions. Nature 495, 375-378.
Economou, A., Brock, L., Cobourne, M. and Green, J. (2013). Whole population cell
analysis of a landmark-rich mammalian epithelium reveals multiple elongation
mechanisms. Development 140, 4740-4750
Gong, Y., Mo, C. and Fraser, S. E. (2004). Planar cell polarity signalling controls cell
division orientation during zebrafish gastrulation. Letters to Nature 430, 689-693.

40
Gont, L. K., Steinbeisser, H., Blumberg, B. and De Robertis, E. M. (1993). Tail
formation as a continuation of gastrulation: The multiple cell populations of the
Xenopus tailbud derive from the late blastopore lip. Development 119, 991-1004.
Handrigan, G. (2003). Concordia discors: duality in the origin of the vertebrate tail. J.
Anat. 202, 255-267.
Hoffman, S., Psaltis, P., Clark, K., Spoon, D., Chue, C., Ekker, S. and Simari R.
(2014). An in vivo method to quantify lymphangiogenesis in zebrafish. Plos One 7(9):
e45240.
Holmdahl, D.E. (1925). Experimentelle untersuchungen uber die lage der grenze
primarer und sekundarer korperentwicklung beim huhn. Anat. Anz. 59, 393-396.
Kanki, J. P. and Ho, R. K. (1997). The development of the posterior body in zebrafish.
Development 124, 881–893.
Keller, R. (2002). Shaping the vertebrate body plan by polarized embryonic cell
movements. Science 298, 1950-1954.
Keller, R. (2006). Mechanisms of elongation in embryogenesis. Development 133,
2291-2302.
Kinder, S. J., Tsang, T. E., Quinlan, G. A., Hadjantonakis, A. K., Nagy, A. and
Tam P. P. (1999). The orderly allocation of mesodermal cells to the extraembryonic
structures and the anteroposterior axis during gastrulation of the mouse embryo.
Development, 126 4691–4701
Kimmel, C. B., Warga, R. M. and Schilling, T. F. (1990). Origin and organization of
the zebrafish fate map. Development 108, 581-94.
Kimmel, C. B., Ballard, W. W., Kimmel, S. R., Ullmann, B. and Schilling, T. F.
(1995). Stages of embryonic development of the zebrafish. Dev. Dyn. 203, 253-310.

41
Montero, J. A. and Heisenberg, C. P. (2004). Gastrulation dynamics: cells move into
focus. Trends in Cell Biology 14, 620-627.
Mosimann, C., Kaufman, C. K., Li, P., Pugach, E. K., Tamplin, O. J. and Zon, L. I.
(2011). Ubiquitous transgene expression and Cre-based recombination driven by the
ubiquitin promoter in zebrafish. Development 138, 169-177.
Nicolas, J.F., Mathis, L. and Bonnerot, C. (1996). Evidence in the mouse for self-
renewing stem cells in the formation of a segmented longitudinal structure, the
myotome. Development 122, 2933-2946.
Pasteels, J. (1943). Proliferations et croissance dans la gastrulation et la formation de la
queue des vertebres. Arch. Biol. 54, 1-51.
Petit, A. C., Legué, E. and Nicolas, J.F. (2005). Methods in clonal analysis and
applications. Reprod. Nutr. Dev. 45, 321–339.
Robles, V., Martí, M. and Belmonte, J. (2011). Study of pluripotency markers in
zebrafish embryos and transient embryonic stem cell cultures. Zebrafish. 8(2): 57–63.
Roth, V. L. and Mercer, J. M. (2000). Morphometrics in development and evolution.
Amer. Zool. 40(5): 801–810.
Sepich, D. S. and Solnica-Krezel L. (2005). Analysis of cell movements in zebrafish
embryos: morphometrics and measuring movement of labeled cell populations in vivo.
Methods Mol Biol. 294, 211-33
Shih, J. and Fraser, S. E. (1995). Distribution of tissue progenitors within the shield
region of the zebrafish gastrula. Development 121, 2755-2765.

42
Schubert, M., Holland, L. Z., Stokes, M. D. and Holland, N. D. (2001). Three
amphioxus Wnt genes (AmphiWnt3, AmphiWnt5, and AmphiWnt6) associated with the
tailbud: The evolution of somitogenesis in chordates. Dev. Biol. 240, 262-273.
Sugiyama, M., Sakaue-Sawano, A., Iimura, T., Fukami, K., Kitaguchi, T.,
Kawakami, K., Okamoto, H., Higashijima, S-i. and Miyawaki, A.
(2009).Illuminating cell-cycle progression in the developing zebrafish embryo. Proc.
Natl. Acad. Sci. USA 49, 20812-20817.
Tzouanacou, E., Wegener, A., Wymeersch, F. J., Wilson, V. and Nicolas, J. F.
(2009). Redefining the progression of lineage segregations during mammalian
embryogenesis by clonal analysis. Developmental Cell 17, 365–376.
Westerfield, M. (1993). The Zebrafish Book. A Guide for the Laboratory Use of
Zebrafish. Eugene, OR: Univesity of Oregon Press.
Wolpert, L. (2010). Arms and the man: the problems of symmetric growth. PLoS
Biology 8(9): e1000477.
Zhang, L., Kendrick, C., Jülich, D. and Holley, S. A. (2008). Cell cycle progression
is required for zebrafish somite morphogenesis but not segmentation clock function.
Development 135, 2065-2070.

43
Appendix I – Supplementary data
Figure S1. Post-mitotic cells progressively invade the posterior body. Representative
maximum intensity projection of PFA-fixed Cecyil embryos during posterior body formation,
visualizing post-mitotic non-proliferating cells (red; A-C). Developmental stages are expressed
in hpf. Z-stacks were acquired from live embryos using a Leica SP5 confocal microscope
equipped with an objective lens (x10 N.A. 0.3). Panels (D-F) represent a single bright field
plane merged with the green signal to better visualize the embryonic structures. Brackets
delimit the tailbud region. The presence of differentiated cells undergoing G1 is relatively low
(red; A, D). As the embryo grows, the red signal increases significantly and strongly
highlightswell-differentiated cells, such as post-mitotic muscle cells at the level of the somites
(B, C, E and F). Brackets delimit the tailbud region.
Figure S2. Schematic figure of the generation of mosaically labeled embryos injected with
membrane eGFP and nuclear mCherry mRNA’s at the 32-cell stage. The developmental stages in
hpf are indicated above.