a labour market in the great the case of denmark - cpb.nl · a flexicurity labour market in the...
TRANSCRIPT

1
A flexicurity labour market in the great recession – the case of Denmark
Preliminary and incomplete first draft
January 2011
Torben M. Andersen
School of Economics and Management Aarhus University
CEPR, CESifo and IZA
Abstract: Flexicurity labour markets are characterised by flexible hiring/firing rules, generous social safety net and active labour market policies. How can such labour markets cope with the consequences of the Great Recession? Larger labour shedding is to be expected and this strains the social safety net and increases the demands on active labour market policies. This paper takes a closer look at the labour market consequences of the crisis for Denmark. It is found that employment adjustment is not particularly large in international comparison, although it has more weight on the extensive (number of employees) than the intensive (hours) margin. The level of job creation remains high, although job creation is pro‐cyclical and job‐separation counter‐cyclical. As a consequence most unemployment spells remain short. This is critical since a persistent increase in unemployment will affect the financial balance of the model severely. Comparative evidence does not, however, indicate that flexicurity markets are more prone to persistence. Crucial for this is the design of the social safety net and in particular the active labour market policy. The larger inflow into activation, however, raises questions concerning the possibility of maintaining the efficiency of the system.
Paper prepared for CPB‐ROA conference on flexibility of the labour market, Den Haag, January 2011

2
1. Introduction Prior to the financial crisis there was much focus on the concept of flexicurity. The idea that it is possible to ensure flexibility for employers and security for employers without impairing labour market flexibility and social balances received substantial attention. The EU commission even proposed that member countries should follow the flexicurity approach, although the definition of the concept was so broad as to make the precise meaning unclear. Denmark has often been referred to as a flexicurity case due to the combination of flexible hiring and firing rules as well as a generous social safety net. An equally important element of the model is a set of active labour market policies attaching conditions to the claiming of unemployment and social benefits, and also including programmes to enhance qualification and thus job finding chances for jobless (see e.g. Andersen and Svarer (2007)). In the run up to the financial crisis unemployment was low, and the model was thus taken to be well functioning. The crisis has induced a Great Recession which also has affected Denmark severely. Output has been falling by almost 6 % from top to through (2008.3 to 2990.4) and the unemployment rate has increased by some 3‐4 percentage points. How can the flexicurity model cope with such large shocks? Since the crisis has a strong global element and affected many countries similarly at roughly the same time these developments provide an opportunity to draw some tentative lessons on the importance of labour market institutions and policies. Despite its dire consequence the financial crisis produce a semi‐controlled experiment on the implications of policies and institutions for the response of labour markets to a deep crisis. In a flexicurity labour market with flexible firing rules it is to be expected that the immediate effect on unemployment is large. Since it is easy to shed labour it is an immediate implication that the employment to output response should be larger, the more lax the firing rules, and in this way the model is vulnerable to aggregate output shocks. Figure 1: Unemployment, Denmark and OECD, 1970.1‐2010.3
Datasource: www.sourceoecd.org
0
2
4
6
8
10
12
Q1‐19
90
Q1‐19
91
Q1‐19
92
Q1‐19
93
Q1‐19
94
Q1‐19
95
Q1‐19
96
Q1‐19
97
Q1‐19
98
Q1‐19
99
Q1‐20
00
Q1‐20
01
Q1‐20
02
Q1‐20
03
Q1‐20
04
Q1‐20
05
Q1‐20
06
Q1‐20
07
Q1‐20
08
Q1‐20
09
%
Denmark
OECD
3
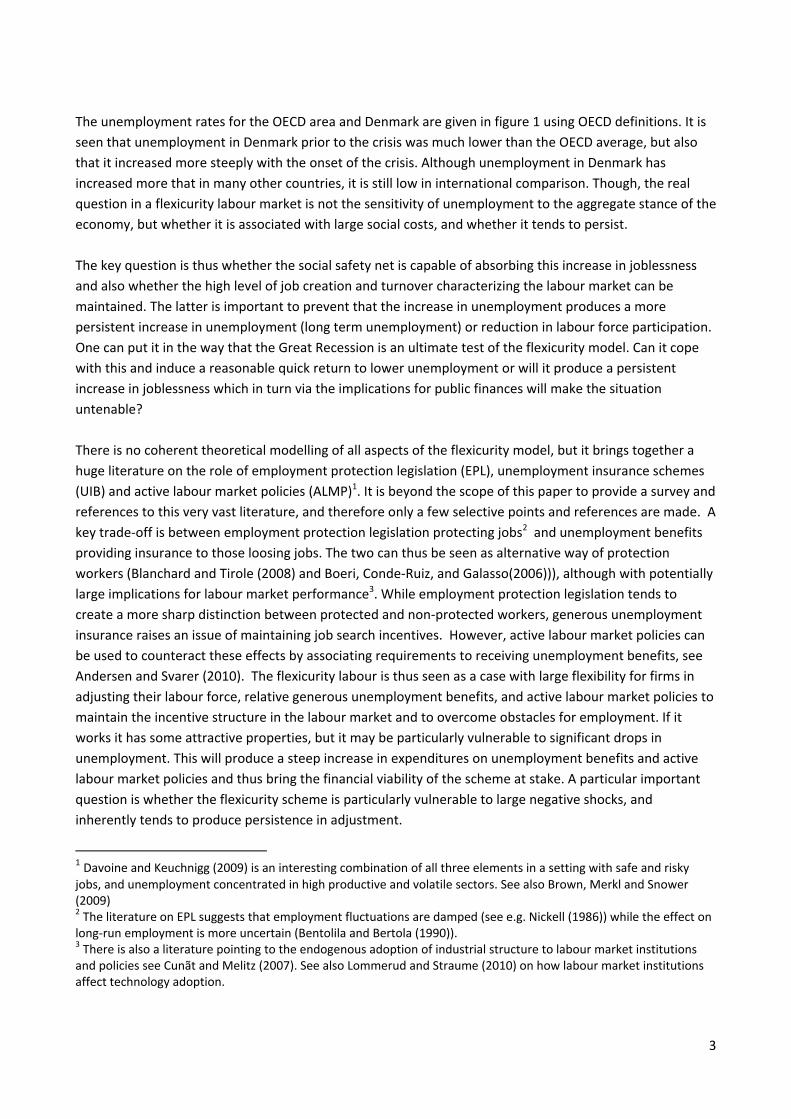
The unemployment rates for the OECD area and Denmark are given in figure 1 using OECD definitions. It is seen that unemployment in Denmark prior to the crisis was much lower than the OECD average, but also that it increased more steeply with the onset of the crisis. Although unemployment in Denmark has increased more that in many other countries, it is still low in international comparison. Though, the real question in a flexicurity labour market is not the sensitivity of unemployment to the aggregate stance of the economy, but whether it is associated with large social costs, and whether it tends to persist. The key question is thus whether the social safety net is capable of absorbing this increase in joblessness and also whether the high level of job creation and turnover characterizing the labour market can be maintained. The latter is important to prevent that the increase in unemployment produces a more persistent increase in unemployment (long term unemployment) or reduction in labour force participation. One can put it in the way that the Great Recession is an ultimate test of the flexicurity model. Can it cope with this and induce a reasonable quick return to lower unemployment or will it produce a persistent increase in joblessness which in turn via the implications for public finances will make the situation untenable? There is no coherent theoretical modelling of all aspects of the flexicurity model, but it brings together a huge literature on the role of employment protection legislation (EPL), unemployment insurance schemes (UIB) and active labour market policies (ALMP)1. It is beyond the scope of this paper to provide a survey and references to this very vast literature, and therefore only a few selective points and references are made. A key trade‐off is between employment protection legislation protecting jobs2 and unemployment benefits providing insurance to those loosing jobs. The two can thus be seen as alternative way of protection workers (Blanchard and Tirole (2008) and Boeri, Conde‐Ruiz, and Galasso(2006))), although with potentially large implications for labour market performance3. While employment protection legislation tends to create a more sharp distinction between protected and non‐protected workers, generous unemployment insurance raises an issue of maintaining job search incentives. However, active labour market policies can be used to counteract these effects by associating requirements to receiving unemployment benefits, see Andersen and Svarer (2010). The flexicurity labour is thus seen as a case with large flexibility for firms in adjusting their labour force, relative generous unemployment benefits, and active labour market policies to maintain the incentive structure in the labour market and to overcome obstacles for employment. If it works it has some attractive properties, but it may be particularly vulnerable to significant drops in unemployment. This will produce a steep increase in expenditures on unemployment benefits and active labour market policies and thus bring the financial viability of the scheme at stake. A particular important question is whether the flexicurity scheme is particularly vulnerable to large negative shocks, and inherently tends to produce persistence in adjustment.
1 Davoine and Keuchnigg (2009) is an interesting combination of all three elements in a setting with safe and risky jobs, and unemployment concentrated in high productive and volatile sectors. See also Brown, Merkl and Snower (2009) 2 The literature on EPL suggests that employment fluctuations are damped (see e.g. Nickell (1986)) while the effect on long‐run employment is more uncertain (Bentolila and Bertola (1990)). 3 There is also a literature pointing to the endogenous adoption of industrial structure to labour market institutions and policies see Cunãt and Melitz (2007). See also Lommerud and Straume (2010) on how labour market institutions affect technology adoption.

4
This paper takes a first look at these issues in the perspective of labour adjustments in response to the great recession. It is obviously too early to make a final call on these questions, but it is possible to make a mid‐term evaluation of how the Danish flexicurity model has coped with the crisis to judge whether it is on a stable or unstable track. This paper attempts to do this, and starts out in Section 2 with a brief outline of some key characteristics of the Danish flexicurity model. The labour market consequences of the crisis are laid out in Section 3, and Section 4 turns to a more detailed analysis of the implications and adjustment processes released from a comparative perspective. Section 5 offers some concluding remarks.
2. The Danish flexicurity model The main ingredients of the Danish flexicurity model are well‐known, and the following gives a brief overview relevant for the latter discussion. More detailed accounts can be found in e.g. Andersen and Svarer (2007), Jørgensen and Kongshøj (2007), and Strøby‐Jensen (2008). Table 1 summarises country indicators on employment protection (EPL), unemployment benefit generosity (UIB) and active labour market policies (ALMP). Table 1: Employment protection (EPL), unemployment benefit generosity (UIB) and active labour market policies (ALMP)
EPL UIB ALMP USA 0.2 LUX 87 DEN 4.8UK 0.7 NZL 72 FIN 3.6CAN 0.8 NET 71 BEL 3.6IRE 1.0 SPA 69 NET 3.6
AUS 1.1 DEN 68 SWE 3.5NOR 1.1 FRA 67 GER 3.1POL 1.5 SWE 66 SPA 2.7JPN 1.6 BEL 65 IRE 2.6DEN 1.8 GER 64 FRA 2.6CH 1.9 AUT 61 AUT 1.8FIN 2.1 FIN 60 NOR 1.8AUT 2.1 CAN 52 NZL 1.7NET 2.4 IRE 50 CAN 1.6
SWE 2.6 JPN 45 POL 1.4
BEL 2.6 POL 42 AUS 1.4GER 2.6 AUS 42 ITA 1.3NZL 2.7 NOR 38 UK 0.9ITA 2.8 ITA 37 LUX 0.9FRA 3.0 GRE 33 JPN 0.7SPA 3.2 CH 33 GRE 0.7
LUX 3.3 UK 28 USA 0.6
GRE 3.3 USA 28 CH 0.4Source: EPL measured by OECD epl1 index measured on scale between zero and three, UIB is the first year replacement rate, and ALMP as expenditures on active labour market policies as a share of GDP. Source: www.sourceoecd.org and OECD (2009).

5
2.1. Hiring and firing rules For hiring and firing rules the key distinction is between blue‐collar (hourly paid) or white collar (funktionærer) workers.
For blue‐collar workers dismissal rules are settled in collective agreements4. For workers with short tenure there is no dismissal period, while there may be some for workers with longer‐tenure. As an example workers in the building and construction sector have a period of notice of 3 weeks after 1 years employment, 5 weeks after 3 years employment and 7 weeks after 5 years of employment5 . For workers the notice is 1 week after one year employment, and 2 weeks after 5 years employment.
The basic rule for white‐collar workers6 is that there is one months notice for dismissals within the first 6 months of work, and this period is extended by 1 month per 3 years of employment up to a maximum of 6 months notice (after employment in 8 years and 7 months). It is possible to be hired as white collar worker on probation for a period up to 3 months in which case the dismissal notice is 14 days. (Funktionærlovens parag. 2). The employee can quit the job with one months notice.
In case of dismissal of a white‐collar worker who has been employed in the company in the last 12, 15 or 18 years, the employer should compensate the worker by 1,2 or 3 months salary, respectively. It is possible to negotiate severance payments as part of the contract.
For all lay‐offs the employer covers unemployment benefits for the first three days for all workers who within the last four weeks have been employed for at least two weeks (Godtgørelsesdagsbetalinger). These are the only formal severance payments. Note that this has been introduced to reduce the number of short term unemployment spells.
2.2. Unemployment insurance and the social safety net The unemployment insurance system in Denmark is a variant of the Gent model with UI‐funds and voluntary individual membership. Contribution rates are determined politically and are the same across all UI‐funds. The UI‐funds are subsidized by the public sector (in a countercyclical way). Accordingly, the marginal costs of increasing unemployment are fully tax financed. Membership is open to persons with relevant qualifications for the specific UI‐fund, or via regular work within its area. The unemployment benefit cannot exceed 90 % of the previous wage (calculated over the last year) or a given cap (currently about 22.300 euros annually, taxable income), and it is indexed to general wage developments7. The maximum duration of benefits is 4 years (from 2011 2 years), and the entitlement to benefits can be regained by regular work for at least 6 months within the last 36 months. Moreover, certain activation requirements are associated with claiming of benefits (see below). When UI‐benefits expire, the individual
4 In Denmark there is a tradition of having most labour market issues settled by the parties in the labour market rather than by legislation. 5 http://www.workinfo.dk/da‐DK/EMNER/ID117/ID127/ID133.aspx 6 In the case of sickness for more than 120 days within the last year there are special rules for dismissals with one months notice 7 The current indexing formula is from a law enacted in 1990 (revised 2003) according to which all transfers are indexed on the basis of the annual wage increases two years earlier. If the increase is above 2 %, a part of 0,3 % is transferred to a fund (satsreguleringspuljen) which is spent on initiatives aiming at improving the conditions for people on transfers.

6
would normally be eligible for social assistance – which is also the case for unemployed who are not members of an UI‐fund. The social assistance scheme is rather complicated since the benefit level among other things depends on age and marital status, and in addition, there are various means‐tested supplements. It is therefore difficult to generalize on the fall in transfer income upon transition from UI‐benefits to social assistance. A person receiving the maximum unemployment benefit would experience an income reduction of 20 – 40 %.
It is an implication of this scheme that the replacement rate is strongly dependent on previous income since the cap implies that the 90 % compensation only applies for low income groups. In Figure 2, the replacement rate is depicted as a function of income for DK and other selected countries. It is seen that Denmark stands out by having a high replacement rate for low income groups, but not for higher income. Hence, when the Danish UI system is characterized as very generous, it has to be made with a proviso, and the flexicurity characterization of Denmark is most fitting for low income groups.
Figure 2: Income dependent replacement rates, Selected countries
Note: Replacement rate in unemployment insurance schemes calculated on the basis of daily income, and for single persons in countries where benefits are dependent on socio‐economic variables. Daily wages are truncated at relevant minimum wage levels (for countries with no legal minimum wage the negotiated minimum wages are used).
Source: Own calculations based on European Commission, MISSOC 2006 and ILO.
2.3. Active labour market policies For persons eligible for unemployment benefits or receiving social assistance or start‐aid8 the basic rules are as follows9:
8 For the latter two groups this applies if their problem is lack of a job. 9 http://www.ams.dk/Reformer‐og‐indsatser/Indsatser/Kontakt‐og‐aktivering/Beskaeftigelsesrettet‐aktivering.aspx.
0
0,1
0,2
0,3
0,4
0,5
0,6
0,7
0,8
0,9
1
0 10 20 30 40 50 60 70 80 90 100 110 120 130 140 150 160 170 180 190 200 210 220 230
Daily wage in Euros
rate
of c
ompe
nsat
ion
DenmarkBelgiumSwedenNetherlandsFinland
Danish APW

7
Unemployed below the age of 30 have the right and duty to an activation offer no later than after 13 weeks unemployment. The activity should have an uninterrupted duration of 6 months. For persons below 25 years without a labour market relevant education (and without children) the activation requirement is an education under normal conditions (study grants). In addition the level of social assistance is reduced after 6 months unemployment to the same level as the study grant. For persons above 30 the right and duty to an activation offer is no later than after 9 months unemployment. Though, the period is only 6 months for persons with unemployment insurance and above 60 years.
After the first offer there is a right and duty to a new offer for each consecutive period of 6 months on public support, and the duration of the offer should be at least 4 weeks.
Unemployed eligible for unemployment insurance with an unemployment period of 30 months have a right and duty to an activation offer for the remaining part of the 4 year unemployment benefit period (full time activation).
The activation offer can be in one of three forms where there for all are specific rules on duration: I) counselling and –requalification. This includes short counselling and assessment programmes as well as special project and education in the ordinary educational system, II) job‐training (virksomhedspraktik), this may be in the public sector or a private company, and is used for persons where there is a need to clarify the possible job prospects, or for persons who due to lack of qualifications may have difficulties in finding a job on normal conditions, III) employment with wage subsidy, this may be with a public or private employer and is used for retraining to upgrade the qualifications (specific skills, language or social skils) of unemployed. About 2/3 of all activations offers are of type I, and the other two types constitute about 1/6 each.
The basis ingredients of the interaction between the social safety net and active labour market policies in Denmark are illustrated in figure 3 showing both the social safety net (the upper part) and the activation policies (the lower part) depending on the duration of the unemployment spell. There is thus duration dependence in both the benefit level and the activation requirements. While the duration dependence in benefits is weak (long duration of unemployment benefits), the effective profile displays more time dependent due to a stepping‐up of the activation requirement with duration of an unemployment spell10.
10 It should be noted that additional employment conditionalities have been build into the scheme. Eligibility for the full social assistance thus has conditions on past employment, as has child support.

8
Figure 3: Danish social safety net in case of unemployment
Note: Diagram applies to an individual fulfilling the requirements for unemployment benefits at the moment of becoming unemployed. Social assistance is calculated on the basis of the benefits for a single person. The activation requirements are those for those above the age of 30. APW refers to the replacement rate for an average production worker.
3. Labour market consequences of the great recession Denmark was alike most countries severely affected by the financial crisis. Prior to the crisis the economy was booming, and the unemployment rate was record low, cf. figure 1. There were clear signs of overheating, but there was political delay in accepting the need to undertake contractionary policies. The crisis implied a drastic and swift change in the situation, and hence the the Danish development in recent years has displayed a boom‐bust pattern.
The increase in employment before the financial crisis was significantly more than implied by the historical relation between output and employment, cf. figure 4. This clearly reflected a situation with shortage of labour, and firms facing recruitment problems. Although there was an increasing inflow of migrant workers, there were clear signs of excess demand. This may in part have been strengthened by firms hoarding labour
Replacement rate %
Activation requirement
M
o
n
t
6 12 18 24 30 36 42 48 54 6066 72
90
Unemployment benefits
Social assistance
Regaining eligibility for UIB: 6 months regular work within last 36 months
Full time activation
Activation offer: right and duty
AcActiveaastive job
Activation offer: right and duty
Active job
Active job
h
Low income groups
APW60
9
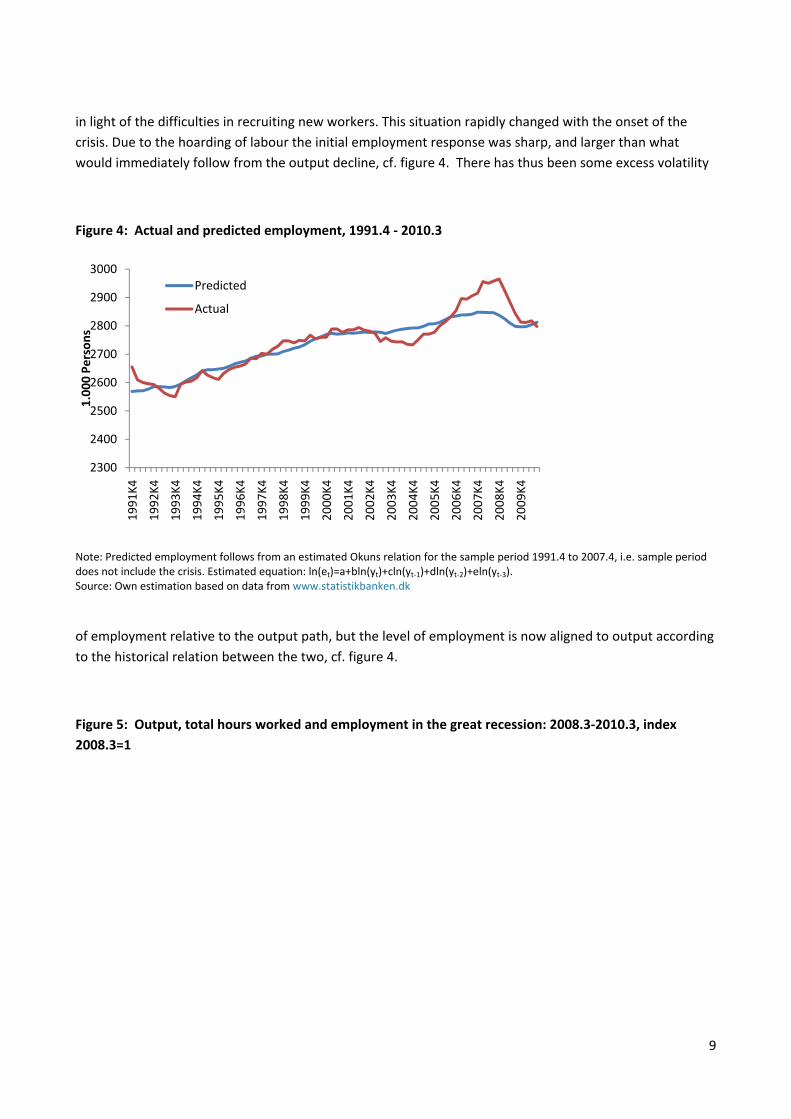
in light of the difficulties in recruiting new workers. This situation rapidly changed with the onset of the crisis. Due to the hoarding of labour the initial employment response was sharp, and larger than what would immediately follow from the output decline, cf. figure 4. There has thus been some excess volatility
Figure 4: Actual and predicted employment, 1991.4 ‐ 2010.3
Note: Predicted employment follows from an estimated Okuns relation for the sample period 1991.4 to 2007.4, i.e. sample period does not include the crisis. Estimated equation: ln(et)=a+bln(yt)+cln(yt‐1)+dln(yt‐2)+eln(yt‐3). Source: Own estimation based on data from www.statistikbanken.dk
of employment relative to the output path, but the level of employment is now aligned to output according to the historical relation between the two, cf. figure 4.
Figure 5: Output, total hours worked and employment in the great recession: 2008.3‐2010.3, index 2008.3=1
2300
2400
2500
2600
2700
2800
2900
3000
1991
K4
1992
K4
1993
K4
1994
K4
1995
K4
1996
K4
1997
K4
1998
K4
1999
K4
2000
K4
2001
K4
2002
K4
2003
K4
2004
K4
2005
K4
2006
K4
2007
K4
2008
K4
2009
K4
1.00
0 Pe
rson
s
Predicted
Actual
10
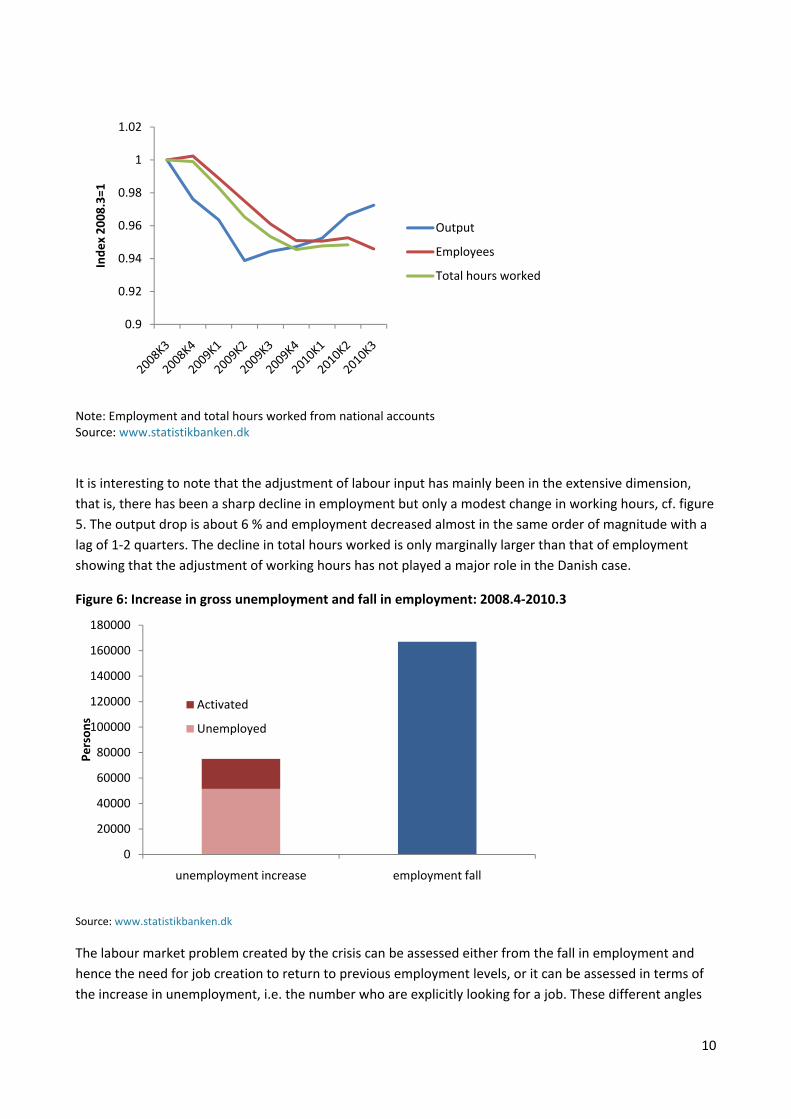
Note: Employment and total hours worked from national accounts Source: www.statistikbanken.dk
It is interesting to note that the adjustment of labour input has mainly been in the extensive dimension, that is, there has been a sharp decline in employment but only a modest change in working hours, cf. figure 5. The output drop is about 6 % and employment decreased almost in the same order of magnitude with a lag of 1‐2 quarters. The decline in total hours worked is only marginally larger than that of employment showing that the adjustment of working hours has not played a major role in the Danish case.
Figure 6: Increase in gross unemployment and fall in employment: 2008.4‐2010.3
Source: www.statistikbanken.dk
The labour market problem created by the crisis can be assessed either from the fall in employment and hence the need for job creation to return to previous employment levels, or it can be assessed in terms of the increase in unemployment, i.e. the number who are explicitly looking for a job. These different angles
0.9
0.92
0.94
0.96
0.98
1
1.02
Inde
x 20
08.3=1
Output
Employees
Total hours worked
0
20000
40000
60000
80000
100000
120000
140000
160000
180000
unemployment increase employment fall
Person
s
Activated
Unemployed

11
leave quite different messages. The increase in unemployment has been much smaller than the decline in employment, cf. figure 6. Gross unemployment includes unemployed and participants in activation receiving unemployment benefits or social assistance. Roughly the decrease in employment is double the increase in gross unemployment. The huge difference may be attributed to three factors. First, unemployment statistics may underestimate the true rate of joblessness since not all unemployed are eligible for unemployment benefits or social assistance. Prior to the crisis there was a decline in membership in unemployment insurance funds, and thus an increase in the number of non‐insured. Second, the strained labour market situation has induced increased enrolment in various forms of education. The previous pattern or fad among youth of working for some period as unskilled before commencing education has been more difficult due to the strained labour market situation. Changes in enrolment can account for about 1/3 of the difference between the fall in employment and the increase in gross unemployment. Finally, there may have been an outflow of migrant workers. The rise in unemployment has affected various groups quite differently. As for most countries the sharpest increase in unemployment is seen for males, youth and unskilled.
Figure 7: Registered, gross and AKU unemployment
Source: www.statistikbanken.dk
The difficulties in assessing the state of the labour market is also reflected in figure 7 showing three different concepts of unemployment. The first is the number of registered unemployed i.e. unemployed receiving unemployment benefits or social assistance. The gross unemployment adds the number of people in activation programmes, and as expected the difference between gross and registered unemployment has increased in response to the crisis. Finally, the AKU‐unemployment is a survey based metric of unemployment. While the latter is associated with various measurement problems the widening difference between the AKU and gross unemployment may reflect that not all jobless are eligible for unemployment benefits or social assistance.
0
50000
100000
150000
200000
250000
Person
s AKU unemployment
Gross Unemployment
Registrered Unemployment
12
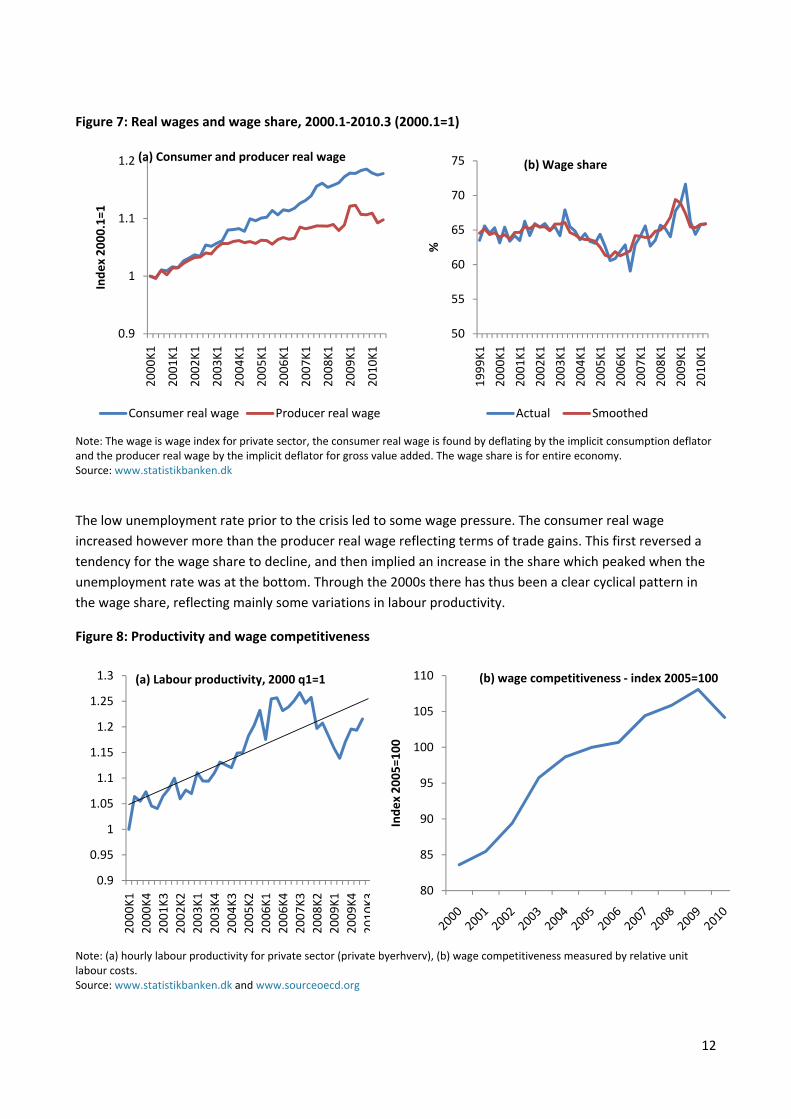
Figure 7: Real wages and wage share, 2000.1‐2010.3 (2000.1=1)
Note: The wage is wage index for private sector, the consumer real wage is found by deflating by the implicit consumption deflator and the producer real wage by the implicit deflator for gross value added. The wage share is for entire economy. Source: www.statistikbanken.dk
The low unemployment rate prior to the crisis led to some wage pressure. The consumer real wage increased however more than the producer real wage reflecting terms of trade gains. This first reversed a tendency for the wage share to decline, and then implied an increase in the share which peaked when the unemployment rate was at the bottom. Through the 2000s there has thus been a clear cyclical pattern in the wage share, reflecting mainly some variations in labour productivity.
Figure 8: Productivity and wage competitiveness
Note: (a) hourly labour productivity for private sector (private byerhverv), (b) wage competitiveness measured by relative unit labour costs. Source: www.statistikbanken.dk and www.sourceoecd.org
0.9
1
1.1
1.220
00K1
2001
K1
2002
K1
2003
K1
2004
K1
2005
K1
2006
K1
2007
K1
2008
K1
2009
K1
2010
K1
Inde
x 20
00.1=1
(a) Consumer and producer real wage
Consumer real wage Producer real wage
50
55
60
65
70
75
1999
K1
2000
K1
2001
K1
2002
K1
2003
K1
2004
K1
2005
K1
2006
K1
2007
K1
2008
K1
2009
K1
2010
K1
%
(b) Wage share
Actual Smoothed
0.9
0.95
1
1.05
1.1
1.15
1.2
1.25
1.3
2000
K120
00K4
2001
K320
02K2
2003
K120
03K4
2004
K320
05K2
2006
K120
06K4
2007
K320
08K2
2009
K120
09K4
2010
K3
(a) Labour productivity, 2000 q1=1
80
85
90
95
100
105
110
Inde
x 20
05=100
(b) wage competitiveness ‐ index 2005=100

13
In the period up to the onset of the crisis, labour productivity was falling reflecting the hoarding of labour (figure 3). The adjustment of employment has implied a readjustment of labour productivity which is now almost back to trend (figure 8). While wage increases have been relative moderate despite the low level of unemployment, it remains a fact that wage competitiveness has declined. This is to some extent to be expected due to the extraordinary low level of unemployment (figure 1) but also reflects that trend productivity has been growing more slowly in Denmark than for its competitors.
4. Adjustment and burden sharing The adjustment process in the Danish labour market is of interest in its own right, but also in a broader perspective of the lessons to be drawn on the role of flexicurity labour market institutions. The following consider these issue by addressing some key points where the Danish developments are seen in comparative perspective and related to labour market institutions and policies.
Figure 9: Adjustment of total labour input relative to output change – decomposed in hours and employment adjustment.
Note: Change measured from peak to trough during the 2008‐09 recession (quarterly data). Total change in labour input is decomposed into changes in hours per worker and number of employees. Datasource: OECD (2010).
4.1. Adjusting labour input It is to be expected that employment is more sensitive to output in a country with more lax employment protection. As already noted above the adjustment of labour input in Denmark has mainly been via the number of employees, and working hours has only be moderately changed. With lax employment protection legislation and a generous social safety net, the costs of adjusting labour along the extensive margin are smaller, while strict employment protection may make hours adjustment a cheaper mode of adjustment.
‐0.5
0
0.5
1
1.5
2
2.5
3
3.5
SVK
NZL
DNK
ITA
DEU NLD
KOR
BEL
JPN
FRA
SWE
HUN
GBR PRT
CZE
FIN
AUT
IRL
USA
CAN
ESP
NOR
%
Employment
Hours
14
The adjustment of labour input relative to the output change is in figure 9 decomposed in the change in hours and employment for OECD countries. There is quite substantial variation in the adjustment of labour input relative to the output change, but also substantial differences in the role played by hours relative to employment. Denmark does not stand out among the countries with the largest changes in labour input relative to output, and moreover the relative large burden taken by employment is seen again here.
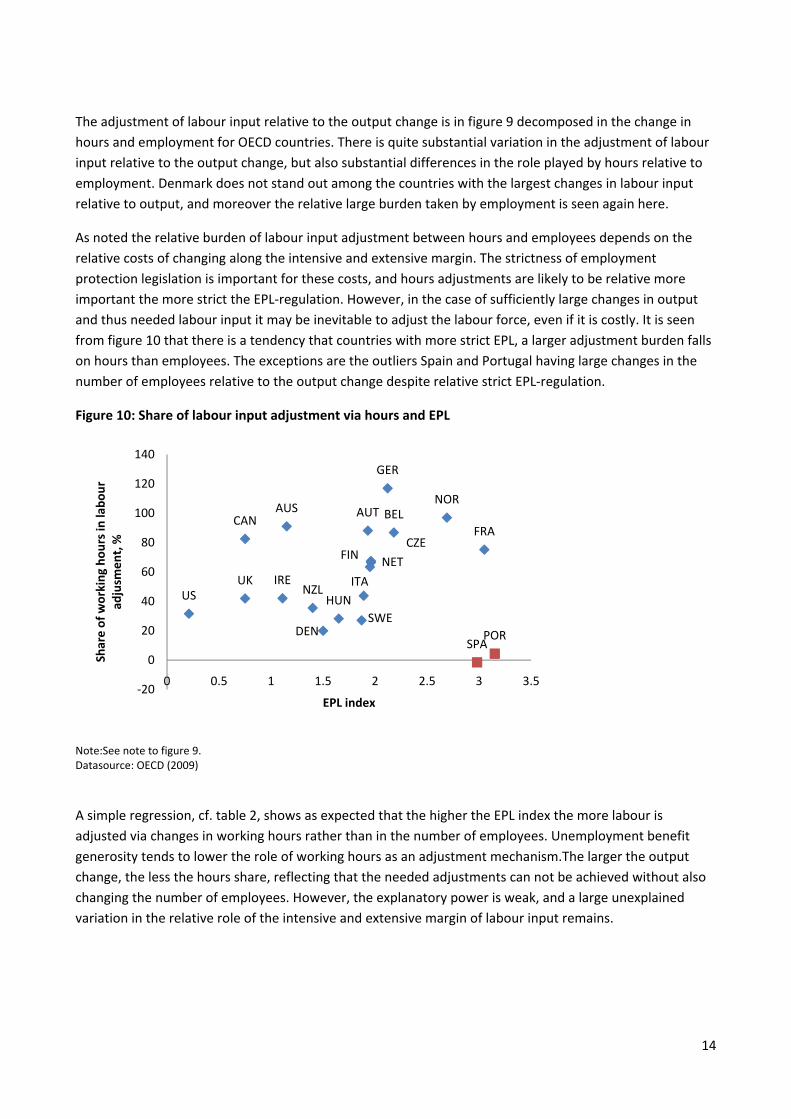
As noted the relative burden of labour input adjustment between hours and employees depends on the relative costs of changing along the intensive and extensive margin. The strictness of employment protection legislation is important for these costs, and hours adjustments are likely to be relative more important the more strict the EPL‐regulation. However, in the case of sufficiently large changes in output and thus needed labour input it may be inevitable to adjust the labour force, even if it is costly. It is seen from figure 10 that there is a tendency that countries with more strict EPL, a larger adjustment burden falls on hours than employees. The exceptions are the outliers Spain and Portugal having large changes in the number of employees relative to the output change despite relative strict EPL‐regulation.
Figure 10: Share of labour input adjustment via hours and EPL
Note:See note to figure 9. Datasource: OECD (2009)
A simple regression, cf. table 2, shows as expected that the higher the EPL index the more labour is adjusted via changes in working hours rather than in the number of employees. Unemployment benefit generosity tends to lower the role of working hours as an adjustment mechanism.The larger the output change, the less the hours share, reflecting that the needed adjustments can not be achieved without also changing the number of employees. However, the explanatory power is weak, and a large unexplained variation in the relative role of the intensive and extensive margin of labour input remains.
AUS AUT BELCAN
CZE
DEN
FIN
FRA
GER
HUN
IRE ITA
NET
NOR
NZL
SWE
UKUS
PORSPA
‐20
0
20
40
60
80
100
120
140
0 0.5 1 1.5 2 2.5 3 3.5
Share of working
hou
rs in
labo
ur
adjusm
ent, %
EPL index
15
Table 2: Share of hours in labour adjustment EPL UIB ALMP Output change Constant R2
0.20 (0.27)
‐0.02 (0.92)
‐0.11 (0.37)
NI 4.07 (3.36)
0.05
0.24 (0.26)
‐0.31 (0.91)
0.07 (0.39)
‐0.15 (0.11)
5.55 (3.41)
0.18
Note: all variables in logs NI= not included. Share of hours in labour adjustment as in figure 9, EPL as in table 1, and output change is the numerical value of the change in output. Estimation for 17 OECD countries.
The smaller the change in labour input relative to the output decline, the more labour productivity falls. This has implications for the adjustment over time. If output recovers there are idle resources making this possible up to some level without increasing labour input. If output does not recover a delayed labour input adjustment is to be expected.
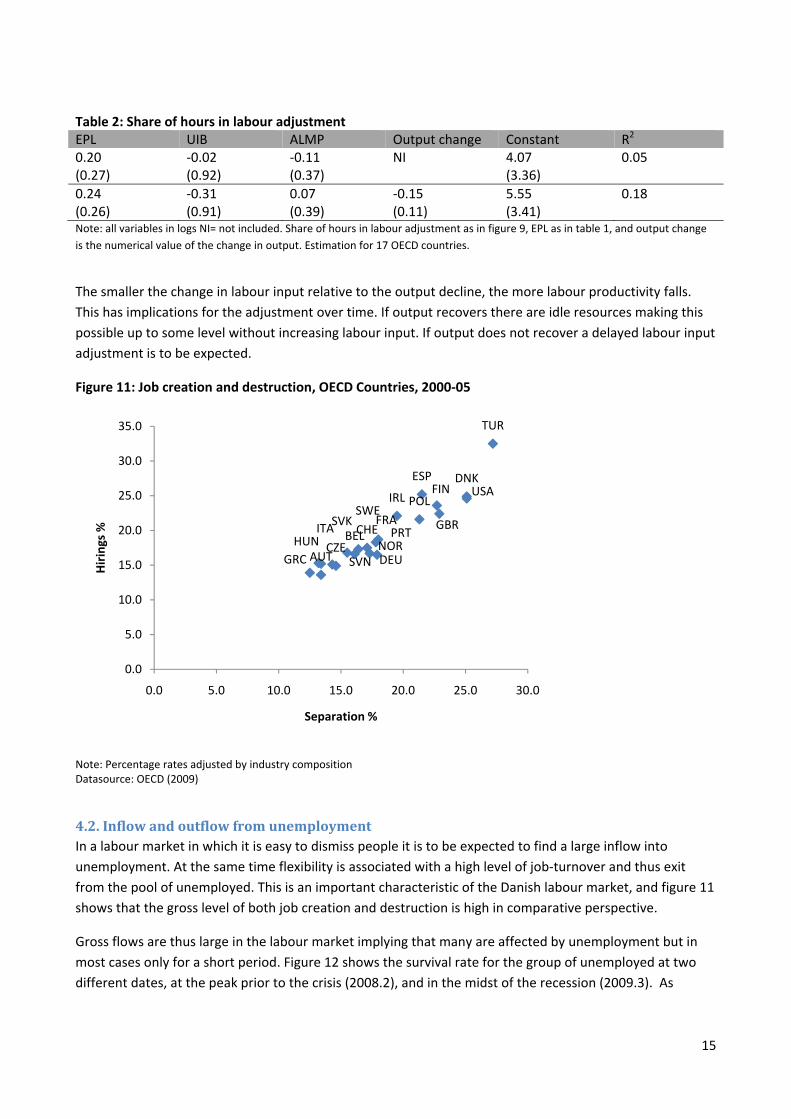
Figure 11: Job creation and destruction, OECD Countries, 2000‐05
Note: Percentage rates adjusted by industry composition Datasource: OECD (2009)
4.2. Inflow and outflow from unemployment In a labour market in which it is easy to dismiss people it is to be expected to find a large inflow into unemployment. At the same time flexibility is associated with a high level of job‐turnover and thus exit from the pool of unemployed. This is an important characteristic of the Danish labour market, and figure 11 shows that the gross level of both job creation and destruction is high in comparative perspective.
Gross flows are thus large in the labour market implying that many are affected by unemployment but in most cases only for a short period. Figure 12 shows the survival rate for the group of unemployed at two different dates, at the peak prior to the crisis (2008.2), and in the midst of the recession (2009.3). As
AUT
BELCHECZE
DEU
DNKESPFIN
FRA GBR
GRCHUN
IRL
ITANOR
POL
PRTSVK
SVN
SWE
TUR
USA
0.0
5.0
10.0
15.0
20.0
25.0
30.0
35.0
0.0 5.0 10.0 15.0 20.0 25.0 30.0
Hirings %
Separation %
16
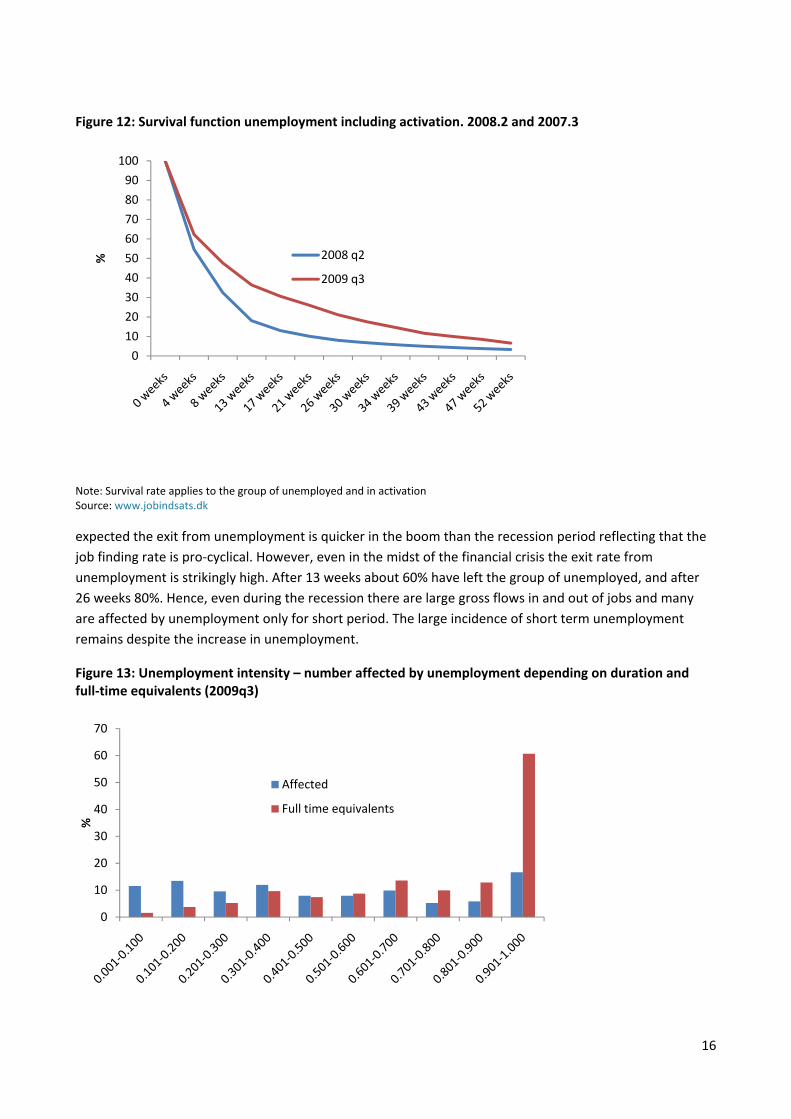
Figure 12: Survival function unemployment including activation. 2008.2 and 2007.3
Note: Survival rate applies to the group of unemployed and in activation Source: www.jobindsats.dk expected the exit from unemployment is quicker in the boom than the recession period reflecting that the job finding rate is pro‐cyclical. However, even in the midst of the financial crisis the exit rate from unemployment is strikingly high. After 13 weeks about 60% have left the group of unemployed, and after 26 weeks 80%. Hence, even during the recession there are large gross flows in and out of jobs and many are affected by unemployment only for short period. The large incidence of short term unemployment remains despite the increase in unemployment.
Figure 13: Unemployment intensity – number affected by unemployment depending on duration and full‐time equivalents (2009q3)
0
10
20
30
40
50
60
70
80
90
100
% 2008 q2
2009 q3
0
10
20
30
40
50
60
70
%
Affected
Full time equivalents
17
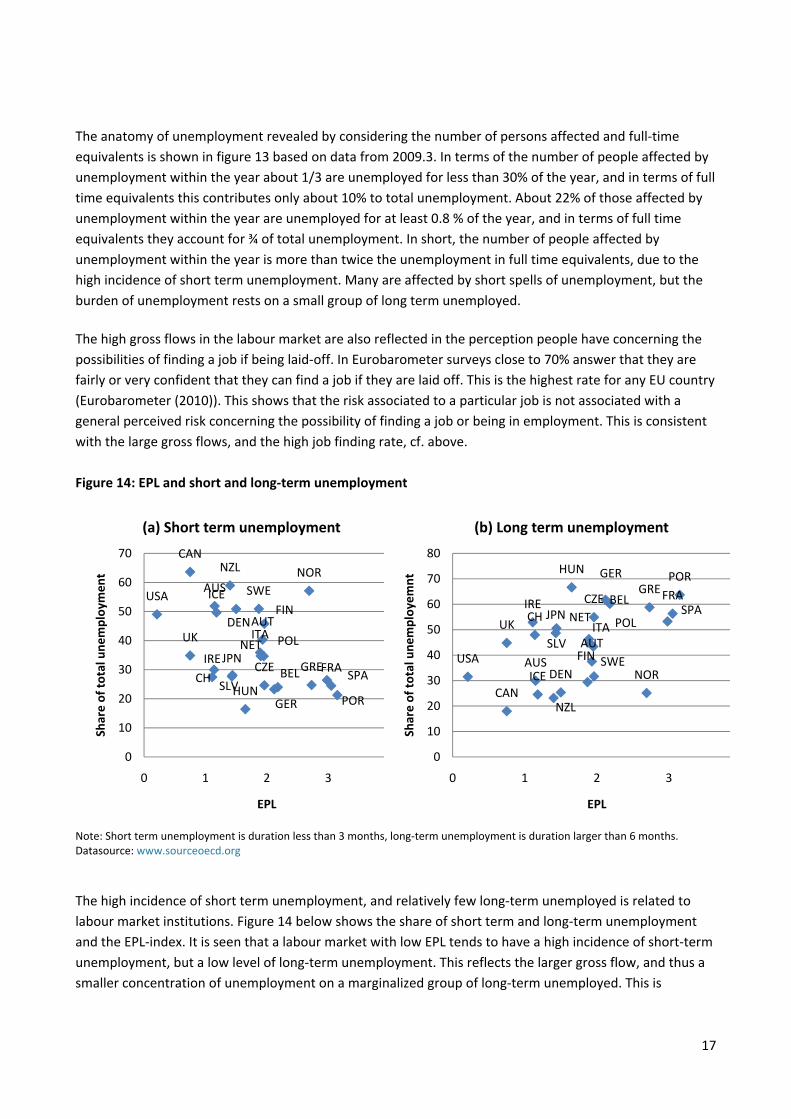
The anatomy of unemployment revealed by considering the number of persons affected and full‐time equivalents is shown in figure 13 based on data from 2009.3. In terms of the number of people affected by unemployment within the year about 1/3 are unemployed for less than 30% of the year, and in terms of full time equivalents this contributes only about 10% to total unemployment. About 22% of those affected by unemployment within the year are unemployed for at least 0.8 % of the year, and in terms of full time equivalents they account for ¾ of total unemployment. In short, the number of people affected by unemployment within the year is more than twice the unemployment in full time equivalents, due to the high incidence of short term unemployment. Many are affected by short spells of unemployment, but the burden of unemployment rests on a small group of long term unemployed. The high gross flows in the labour market are also reflected in the perception people have concerning the possibilities of finding a job if being laid‐off. In Eurobarometer surveys close to 70% answer that they are fairly or very confident that they can find a job if they are laid off. This is the highest rate for any EU country (Eurobarometer (2010)). This shows that the risk associated to a particular job is not associated with a general perceived risk concerning the possibility of finding a job or being in employment. This is consistent with the large gross flows, and the high job finding rate, cf. above. Figure 14: EPL and short and long‐term unemployment
Note: Short term unemployment is duration less than 3 months, long‐term unemployment is duration larger than 6 months. Datasource: www.sourceoecd.org
The high incidence of short term unemployment, and relatively few long‐term unemployed is related to labour market institutions. Figure 14 below shows the share of short term and long‐term unemployment and the EPL‐index. It is seen that a labour market with low EPL tends to have a high incidence of short‐term unemployment, but a low level of long‐term unemployment. This reflects the larger gross flow, and thus a smaller concentration of unemployment on a marginalized group of long‐term unemployed. This is
AUS
AUT
BEL
CAN
CZE
DEN FIN
FRA
GER
GRE
HUN
ICE
IRE
ITA
JPN NET
NZL NOR
POL
POR SLV
SPA
SWE
CH
UK
USA
0
10
20
30
40
50
60
70
0 1 2 3
Share of to
tal une
mploy
men
t
EPL
(a) Short term unemployment
AUS
AUT
BEL
CAN
CZE
DEN FIN
FRA
GER GRE
HUN
ICE
IRE
ITA JPN NET
NZL
NOR
POL
POR
SLV
SPA
SWE
CH UK
USA
0
10
20
30
40
50
60
70
80
0 1 2 3
Share of to
tal une
mploy
emnt
EPL
(b) Long term unemployment
18
consistent with the evidence reported in figure 13 that short‐term unemployment is a dominant type of unemployment in Denmark.
Table 3: Short and long term unemployment and labour market characteristics EPL UIB ALMP Constant R2
Short term unemployment
‐0.31 (0.13)
0.28 (0.47)
0.07 (0.19)
2.64 (1.72)
0.27
Long term unemployment
0.36 (0.14)
‐0.57 (0.49)
0.02 (0.20)
5.70 (1.80)
0.29
Note estimations for 21 OECD countries. Share of short and long term unemployment measured as in figure, and EPL, UIB and ALMP as in Table 1. All variables are in logs. Standard deviations in parenthesis.
Table 3 confirms that high EPL tends to imply that short term unemployment constitute a lesser share of total unemployment, while long‐term unemployment constitutes a larger share. Unemployment benefit generosity tends to have the opposite effect (though not significant). This can be interpreted as showing that temporary lay‐offs are most easy with benefit generosity, and that this dominates possible long‐term disincentive effects (see below). Active labour market policies do not influence the split of unemployment between short‐ and long‐term unemployment.
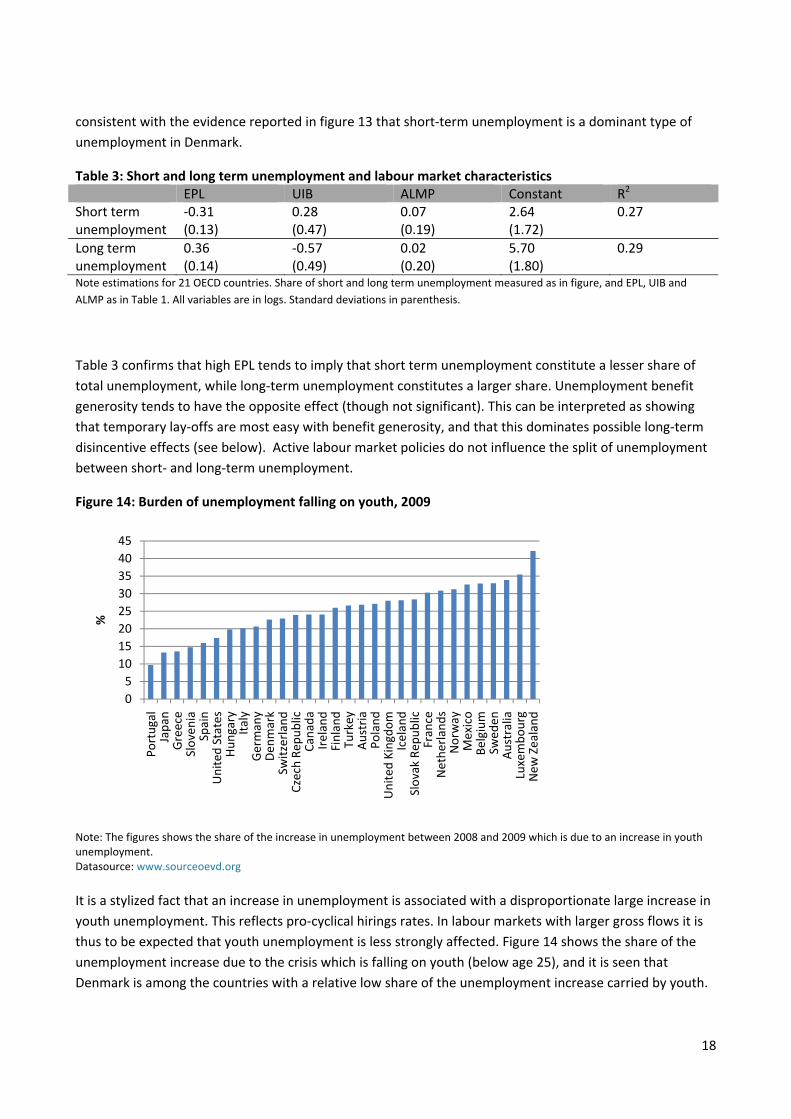
Figure 14: Burden of unemployment falling on youth, 2009
Note: The figures shows the share of the increase in unemployment between 2008 and 2009 which is due to an increase in youth unemployment. Datasource: www.sourceoevd.org It is a stylized fact that an increase in unemployment is associated with a disproportionate large increase in youth unemployment. This reflects pro‐cyclical hirings rates. In labour markets with larger gross flows it is thus to be expected that youth unemployment is less strongly affected. Figure 14 shows the share of the unemployment increase due to the crisis which is falling on youth (below age 25), and it is seen that Denmark is among the countries with a relative low share of the unemployment increase carried by youth.
05
1015202530354045
Portugal
Japan
Greece
Sloven
iaSpain
United States
Hun
gary
Italy
Germany
Den
mark
Switzerland
Czech Re
public
Canada
Ireland
Finland
Turkey
Austria
Poland
United Kingdo
mIceland
Slovak Rep
ublic
France
Nethe
rlands
Norway
Mexico
Belgium
Swed
enAustralia
Luxembo
urg
New
Zealand
%

19
This may be attributed both to the larger gross flows in the labour market and thus higher job finding rates and to the strong requirements on unemployed youth, cf section 2.
4.3. Persistence and the social safety net11 A concern in the present situation is that the increase in unemployment becomes persistent as was the case in many countries during the 1970s and 1990s. Possible causes of persistence in the labour market include depreciation of human capital increasing with the length of unemployment spells, changes in the wage setting mechanism if it primarily is affected by insiders (the employed) with little weight given to the outsiders (unemployed), or a reduction of production capacity as a response to the crisis. The key question here is whether these sources of persistence are strengthened by the social safety net. Noord et.al. (2006) find a weak positive relation between persistence measured by the half lives of output gaps and social expenditures as a share of GDP.
Ljungqvist and Sargent (1998) describe a generous welfare state as a “time bomb” in the sense that it may operate efficiently in tranquil times but be vulnerable to turbulence which easily translates into persistent unemployment12. The latter is caused by weakened job search activities and higher reservation wages due to a generous social safety net. In particular, shocks tends to depreciate skills and thus requires workers to accept a wage cut to find a new job, but unemployment benefits depending on past wages tend to create inertia in the adjustment of reservation wages. As a consequence the safety net hinders the process of restructuring the economy. It is also an implication of a generous tax financed social safety net that the level of mobility across jobs is lowered (Ljungqvist and Sargent (1995)). This may contribute to reduce frictional unemployment, but induce higher structural unemployment in a situation with turbulence.
A different explanation of persistence has been advanced by pointing to the role of norms in counteracting the incentive effects of a generous social safety net (see e.g. Lindbeck (1995) and Lindbeck et.al (2003)). A strong norm to be self supporting counters the economic incentives created by a generous scheme. Allowing for the norm to be endogenous and depending (possibly with a lag) on the number of individuals being self‐supporting implies that a generous social safety net can be maintained if the employment rate is high. However, if employment falls due to e.g. a severe business cycle downturn, norms may be eroded, and the welfare state is caught in a situation with persistent non‐employment and fiscal problems.
While there is a voluminous empirical literature addressing the role of various institutional factors including the social safety net for labour market performance (see e.g. Blanchard (2006) for a survey and discussion), there are very few studies who explicitly addresses the persistence issue. Two different conceptual issues are at stake namely on the one hand the structural unemployment rate, and on the other hand the responsiveness of the labour markets to shocks. The latter involves both the impact effect (volatility) and the adjustment process (persistence). These issues are clearly highly relevant in the current situation where there have been large decreases in employment. These changes are irreversible, but it is crucial to minimize the extent to which this translates into persistent reductions in employment. The following accordingly
11 This section builds on Andersen (2011) 12 A possibility of multiple equilibria also arises when taking into account the financing of the safety net. Similarly if incentive problems are countered by costly monitoring, the effectiveness of such monitoring is large at low levels of unemployment reinforcing this situation, and oppositely in a situation with high unemployment (Ljungqvist and Sargent (1995)).
20
takes a closer look at the empirical support for the social insurance sclerosis hypothesis, which is very important for a flexicurity labour market.
It is not straightforward how to measure persistence in the adjustment process. Ideally one would want to separate exogenous persistence (driven by persistence in shocks) from endogenous persistence (driven by adjustment mechanisms in the system). This is obviously very difficult and will invariably rely on identifying assumptions which may be open for debate. It is beyond the scope of this paper to go into details with this, and rather a more simplistic approach is pursued by presenting various metrics of persistence.
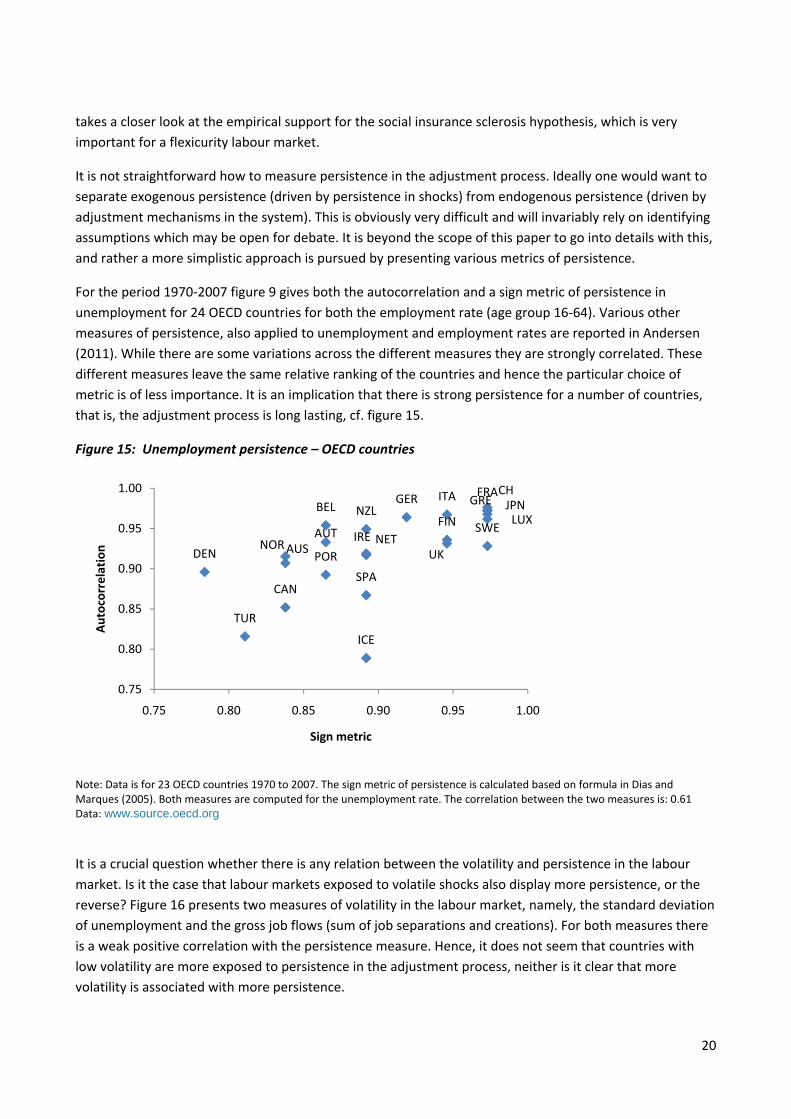
For the period 1970‐2007 figure 9 gives both the autocorrelation and a sign metric of persistence in unemployment for 24 OECD countries for both the employment rate (age group 16‐64). Various other measures of persistence, also applied to unemployment and employment rates are reported in Andersen (2011). While there are some variations across the different measures they are strongly correlated. These different measures leave the same relative ranking of the countries and hence the particular choice of metric is of less importance. It is an implication that there is strong persistence for a number of countries, that is, the adjustment process is long lasting, cf. figure 15.
Figure 15: Unemployment persistence – OECD countries
Note: Data is for 23 OECD countries 1970 to 2007. The sign metric of persistence is calculated based on formula in Dias and Marques (2005). Both measures are computed for the unemployment rate. The correlation between the two measures is: 0.61 Data: www.source.oecd.org
It is a crucial question whether there is any relation between the volatility and persistence in the labour market. Is it the case that labour markets exposed to volatile shocks also display more persistence, or the reverse? Figure 16 presents two measures of volatility in the labour market, namely, the standard deviation of unemployment and the gross job flows (sum of job separations and creations). For both measures there is a weak positive correlation with the persistence measure. Hence, it does not seem that countries with low volatility are more exposed to persistence in the adjustment process, neither is it clear that more volatility is associated with more persistence.
AUSAUT
BEL
CAN
DEN
FIN
FRAGER GRE
ICE
IRE
ITAJPNLUX
NET
NZL
NORPOR
SPA
SWE
CH
TUR
UK
0.75
0.80
0.85
0.90
0.95
1.00
0.75 0.80 0.85 0.90 0.95 1.00
Autocorrelation
Sign metric

21
Figure 16: Labour market volatility and persistence
Note: Persistence is the autocorrelation for unemployment over the period 1970‐2007. Volatility is the standard deviation of the unemployment rate over the period 1970‐2007. Gross job flows is the sum of hiring and separation rates over the period 2000‐07. Data: www.sourceoecd.org
The persistence measures reported above are open to various interpretation problems and an alternative way to approach the same problem would be to look at cases of large unemployment crises. In Andersen (2011) a large employment crises is defined as a fall of 3 percentage points or more in the employment rate within a three year period, and this leaves 18 such events among OECD countries over the period 1970‐2007. All these cases display very strong persistence in the sense that there are no cases where employment has recovered within five years and only few instances where it is the case within ten years after the onset of the crisis. There is thus evidence that deep employment crises tend to be highly persistent.
The next step is to consider whether there are any empirical regularities linking persistence to policy design and institutions in the labour market. This is a difficult endeavour since the metrics of persistence are imprecise and since it is difficult to characterise and summarize policies and institutions in a few simple measures. The following takes two different approaches to this issue both considering automatic stabilizers as a summary metric of the extent of the social safety net, and by considering various indicators related to policies and institutions.
Automatic stabilizers play an important role in the macro literature since they measure the extent to which income variations are absorbed by the public budget and in this way cushions income to shocks. The quantitative size of the automatic stabilizers reflects in a summary way the consequences of the way in which the social safety net and its financing is arranged. Hence, it can be taken as a simple summary measure of the extent of the social safety net in the wide meaning of including the state dependencies of transfer, taxes and expenditures. Figure 17 gives a cross plot of automatic stabilizers and unemployment persistence. There is no clear relation between the two. Interestingly the group of countries with the
AUSAUTBEL
CANDEN
FINFRA GERGRE
ICE
IREITA
JPN LUXNET NZL
NOR
PORSPA SWE
CH
TUR
UK
USA
0.60.650.70.750.80.850.90.95
1
0 0.2 0.4 0.6 0.8 1
Persistence
Volatility
Unemployment volatility and persistence
AUTBEL
CAN
CHE
GER
SPA
FINFRA
UK
GRC
IRL
ISL
ITA
NLD
NOR
PRT
SWE
TURUSA
0.75
0.80
0.85
0.90
0.95
1.00
0.0 20.0 40.0 60.0 80.0Pe
rsistence
Gross job flows
Unemployment persistence and gross flows
22
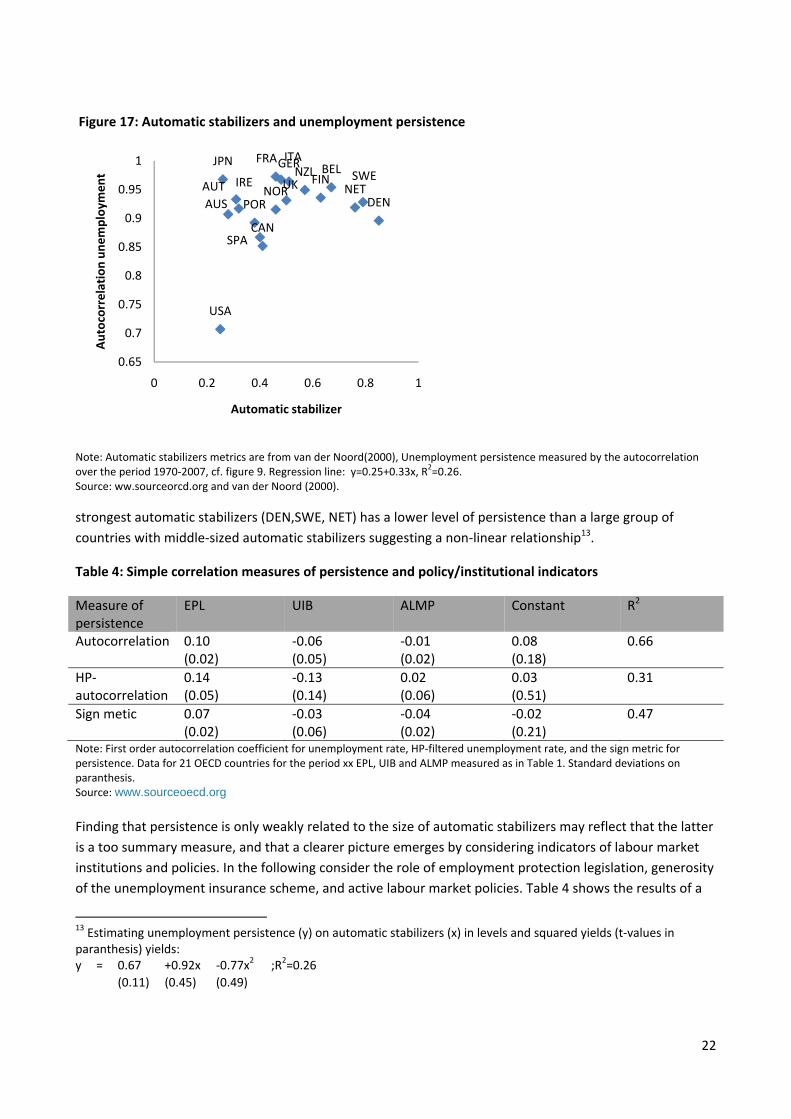
Figure 17: Automatic stabilizers and unemployment persistence
Note: Automatic stabilizers metrics are from van der Noord(2000), Unemployment persistence measured by the autocorrelation over the period 1970‐2007, cf. figure 9. Regression line: y=0.25+0.33x, R2=0.26. Source: ww.sourceorcd.org and van der Noord (2000). strongest automatic stabilizers (DEN,SWE, NET) has a lower level of persistence than a large group of countries with middle‐sized automatic stabilizers suggesting a non‐linear relationship13.
Table 4: Simple correlation measures of persistence and policy/institutional indicators
Measure of persistence
EPL UIB ALMP Constant R2
Autocorrelation 0.10 (0.02)
‐0.06 (0.05)
‐0.01 (0.02)
0.08 (0.18)
0.66
HP‐autocorrelation
0.14 (0.05)
‐0.13 (0.14)
0.02 (0.06)
0.03 (0.51)
0.31
Sign metic 0.07 (0.02)
‐0.03 (0.06)
‐0.04 (0.02)
‐0.02 (0.21)
0.47
Note: First order autocorrelation coefficient for unemployment rate, HP‐filtered unemployment rate, and the sign metric for persistence. Data for 21 OECD countries for the period xx EPL, UIB and ALMP measured as in Table 1. Standard deviations on paranthesis. Source: www.sourceoecd.org Finding that persistence is only weakly related to the size of automatic stabilizers may reflect that the latter is a too summary measure, and that a clearer picture emerges by considering indicators of labour market institutions and policies. In the following consider the role of employment protection legislation, generosity of the unemployment insurance scheme, and active labour market policies. Table 4 shows the results of a
13 Estimating unemployment persistence (y) on automatic stabilizers (x) in levels and squared yields (t‐values in paranthesis) yields: y = 0.67 +0.92x ‐0.77x2 ;R2=0.26
(0.11) (0.45) (0.49)
AUSAUT
BEL
CAN
DEN
FIN
FRAGERIRE
ITAJPN
NETNZL
NORPOR
SPA
SWEUK
USA
0.65
0.7
0.75
0.8
0.85
0.9
0.95
1
0 0.2 0.4 0.6 0.8 1
Autocorrelation
une
mploy
men
t
Automatic stabilizer
23
simple regression using different metrics of persistence in unemployment. It is seen that more strict employment protection legislation tends to produce more persistence, consistent with the finding the EPL tends to increase the share of long‐term unemployment in total unemployment, cf. table 3. The effect of UIB is somewhat surprisingly to reduce persistence (though not significant), and active labour market policies have an unclear effect.
Important for the present discussion there is no evidence supporting that countries with a more extended welfare state suffer from more persistence. Nonetheless as noted above this is not implying that persistence is unimportant for countries with extended welfare state. Quite the contrary the strong automatic budget responses imply that persistent declines in employment rates will have dramatic consequences for public finances. It is interesting to note that the countries with extended welfare state are among the countries which prior to the financial crisis did most to consolidate public finances and the undertake reforms to address fiscal sustainability problems arising from ageing14.
4.4. Challenges for ALMP Active labour market policies are extensively used and are an integral part of the Danish flexicurity model. The activation requirements serve to maintain focus on job search, strengthen job search incentives and contribute to overcome qualifications barriers for employment. The ALMP is thus important in ensuring that a steep increase in unemployment does not translate into persistent unemployment. However, ALMP is also strained when unemployment increases, there is a large inflow into programmes, and they may be less effective in a recession.
It is difficult empirically to discern the precise effect of activation policies. Most studies tend to focus on the direct effect in terms of locking‐in effect and post‐programme effects in terms of employment. While these are important elements, activation has also crucial indirect (general equilibrium) effects, see Andersen and Svarer (2010)). Activation is part of the eligibility conditions for social transfers (unemployment benefits and social assistance) and thus serves to attach stronger requirements to receiving benefits, cf. figure 3.. This may in turn both have an incentive effect lowering the reservation requirements to jobs (type of job, location, employer, wage etc). This is sometimes termed a threat or motivation effect. Related there is a screening effect since it is more difficult to claim benefits while not being interested in work or working in the black sector. Related to the above there may also be a wage effect, since activation not only has a direct effect on participants but also affects the fall back position of employed if they become unemployed. Under standard assumptions this leads to wage moderation. Hence, a proper assessment of the effects of activation is very difficult and care should be taken in making conclusions from partial analysis.
Various assessments have been made of ALMP in Denmark and the general findings are matching findings from studies for other countries, see e.g. Kluve (2006) and Card et.al. (2010). In Rosholm and Svarer (2008) it is shown that activation in general has a locking‐in effect. However, private job training and education improves qualifications, while there is no statistical significant effect from public job training and other forms of activation. This study also finds a threat/motivation effect from all forms of activation which tends to shorten the duration of unemployment spells. Overall it is assessed that activation when taking into
14 In European Commission (2009) on fiscal sustainability the Scandinavian countries are found to be among the countries with the smallest sustainability problems.

24
account the locking‐in, the qualification and the motivation effect contributes to higher job finding rates and thus lower duration of average unemployment spells.
Positive long‐run employment effects from private job‐training are also found in Jespersen et.al. (2008), while there is no such effect from public job‐training or educational activation programmes.
Danish Economic Council (2007) considers the motivation, locking‐un and qualification effect of all forms of activation. In general activation has a locking‐in effect, There is a positive employment effect due to improved qualifications from private job‐training but a negative effect from other forms of activation. In addition a positive motivation effect is found. The study is not able to find any positive effects of educational activation, not even after 5‐6 years after participation. Educational activation programmes are analysed in Christensen and Jacobsen (2009) with particular focus on the locking‐in and motivation effect. There is no short‐ or long‐run (5 years) positive employment effect from ordinary education for persons becoming unemployed in 2002. However, positive effects are found for persons who became unemployed in 1995. For both groups there are positive effects of private job training. It is also found that the effects of all forms of activation are better when unemployment is low (less locking‐in), but the direct effect of the programme is not different across business cycle situations. The program ”Early start” (Hurtig i gang) has made it possible to make an experimental design of the effects of active labour market policy. In this programme half the participants received the activation offers as prescribed by existing rules while the other received and early and more intensive intervention. The program was first made in 2005‐6 and later repeated 2008‐09 to allow for a more specific evaluation of the applied activities. The general finding is that the early intervention has contributed to enhance employment prospects, correspond to a shortening of unemployment duration spells by 3 weeks (see Graversen et.al. (2007), Rosholm (2007) and Rosholm and Svarer (2009)). Cost benefit analyses show that the increased employment can cover the costs of running the programme. It is a particular challenge to maintain effectiveness of activation policies in a period with increasing unemployment. First, the effects of activation policies may be business cycle dependent, and less effective in a downturn. Second, there is a volume increase in participants which may lead to difficulties in both meeting the timing requirements (see Section 2), and also a twist towards less effective programme activities due to shortage of relevant openings. Finally, the composition of the group of unemployed changes and targeting becomes more difficult. Among newly unemployed there is a large group which is likely quickly to find a new job, and there are others which are at risk of long‐term unemployment. A high level of activation may thus carry a high deadweight cost.
These problems are present in Denmark. There have been problems in meeting the requirements stipulated in the rules wrt the deadlines for offering of various initiatives. Moreover, the volume increase has led to incidences where the content and/or the quality of the activity have been called into question. Figure 18 shows that the number of participants in activation has tripled since 2008, and there has been some decline in the average duration of programme activities.

25
Figure 18: Activation degree and average duration
Source: www.jobindsats.dk
There are also signs that the effectiveness of activation is lower due to the present situation in the labour market. Figure 19 displays the share in employment after various horizons for participants in activation programmes. It is seen that there is a clear decline in recent quarters. This is the direct effect of lower job finding rates, and it is a concern since it increases the risk that a larger group becomes long‐term unemployed.
Figure 19: Share in employment after activation
Datasource: www.jobsindsats.dk
0
0.5
1
1.5
2
2.5
3
3.5
4
0
0.2
0.4
0.6
0.8
1
1.2
1.4
1.6
1.8
Jan‐04 Maj …
Sep‐04
Jan‐05 Maj …
Sep‐05
Jan‐06 Maj …
Sep‐06
Jan‐07 Maj …
Sep‐07
Jan‐08 Maj …
Sep‐08
Jan‐09 Maj …
Sep‐09
Jan‐10 Maj …
Sep‐10
Dureation
weeks
%
Activated in % of labour force (left scale)
Average duration (right scale)
0
10
20
30
40
50
60
1. kvt 200
42. kvt 200
43. kvt 200
44. kvt 200
41. kvt 200
52. kvt 200
53. kvt 200
54. kvt 200
51. kvt 200
62. kvt 200
63. kvt 200
64. kvt 200
61. kvt 200
72. kvt 200
73. kvt 200
74. kvt 200
71. kvt 200
82. kvt 200
83. kvt 200
84. kvt 200
81. kvt 200
92. kvt 200
9
3 months
6 months
12 months
26
Note that the challenge of maintaining extensive activation policies during a recession has two sides. One is the economic arising from first a cost increase and eventually from the problems arising if long‐term unemployment increases. The other is that the political support for active labour market policies may weaken in a period with low labour demand and examples of not well‐functioning activation programmes.
5. Concluding remarks The Danish labour market has been severely affected by the Great Recession. However, in comparative perspective the performance is still characterized by below average unemployment, large gross flows, and no stronger tendencies for unemployment to become persistent. However, open issues remains in particular concerning the effectiveness of the active labour market policies in a deep recession. Balancing the cost pressure with the volume increase and maintaining efficiency of programme activities is not an easy task in a period with a lower job finding rate. This is however crucial in preventing an increase in long‐term unemployment which both has social costs but also will affect public finances severely. It is too early to make a call on these questions.
In comparative perspective the Danish case fits into a picture where countries with strict EPL tends to carry a large burden of adjustment of labour input via working hours, rather than employment. Unemployment benefit generosity tends to imply the opposite. More EPL regulation also tends to imply that short‐term unemployment constitutes a relatively smaller share of overall unemployment than long‐term unemployment. Youth unemployment also tends to be more affected by recessions in countries with high EPL, and changes in unemployment in general tend to be more persistent. The evidence on what characterizes the success cases is less conclusive. While there is some indication that generous unemployment insurance in combination with active labour market policies makes it possible to achieve better risk sharing without impairing labour market flexibility, the evidence is much too inconclusive to make strong statements on this. To settle these issue more research is needed.
References Andersen, T. M. and M. Svarer, 2007, Flexicurity – Labour market performance in Denmark, CESifo Economic Studies.
Andersen, T.M. and M. Svarer, 2010, The role of workfare in striking a balance between incentives and insurance in the labour market, Working Paper.
Andersen, T.M., 2010, Collective risk sharing: The social safety net and employment, Working Paper
Andersen, T.M., 2011, Employment crises, Working Paper in preparation
Bentolila, S., and Bertola, G., 1990, Firing Cots and Labour demand: How bad is Eurosclerosis? Review of Economics Studies 57, 381‐402. Blanchard, O., and J. Tirole, 2008, The joint design of unemployment insurance and employment protection: A first pass, Journal of European Economic Association, 6, 45‐77. Boeri, T., Conde‐Ruiz, J.I., and V. Gallaso, 2006, The Political Economy of Flexicurity, Workings Paper 2006‐15 FEDEA.

27
Brown, A., and C. Merkl, and D. Snower, 2009, Incentives and Complementarities in Flexicurity, WP 1526 Kiel Institute for the World Economy.
Christensen, R. N., Jacobsen, R. H, (2009). Analyser af effekten af aktivering og voksen og efteruddannelse for forsikrede ledige. CEBR. Cogley, T., and J.M. Nason, 1995, Output dynamics in real‐business‐cycle models, American Economic Review, 85, 492‐511. Cunãt, A., and M. Melitz, 2007, Volatility, labour market flexibility and the pattern of comparative advantage, NBER Working Paper 13062. Davoine, T., and C. Keuschimigg, 2010, Flexicurity and Job Reallocation, Working Paper, University of St. Gallen. Dias, D., and C.R. Marques, 2005, Using Mean Reversion as a Measure of Persistence, ECB Working Paper 450. Det Økonomiske Råd, DØR (2007). Dansk økonomi, forår 2007. Duval, R., J.Elmeskov, and L. Vogel, 2006, Structural Policies and Economic Resilience to Shocks, OECD Working Paper. Elsby….
Eurobarometer, 2010, March Girouard, N., and C. André, 2005, Measuring cyclically‐adjusted budget balances for OECD countries, OECD working paper 434. Graversen B. K., Damgaard, B. og Rosendahl, A. (2007). Hurtigt i gang ‐ evaluering af et forsøg med en tidlig og intensiv beskæftigelsesindsats for forsikrede ledige. SFI rapport 07:10. IMF, 2010, World Economic Outlook
Jespersen, S., Jacob R. Munch og Skipper, L. (2008). Costs and Benefits of Danish Active Labour Market Programmes, Labour Economics 15, pp. 859‐884. Jespersen, S., Jacobsen, R. H. & Bøge, M. (2006). Evaluering af aktiveringsindsatsen for forsikrede ledige ‐ med særlig fokus på uddannelsesaktivering. CEBR. Jørgensen, H., and P. Konshøj Madsen, 2007, Flexicurity and Beyond – Finding a new agenda for the European Social Model, DJØF Publishing Copenhagen. Lindbeck, A., 1995, Hazardous Welfare State Dynamics, American Economic Review, Papers and Proceedings, May, 1995, 9‐15.

28
Lindbeck, A., and S. Nyberg and J.W. Weibull, 2003, Social Norms Welfare State Dynamics, Journal of the European Economic Association, 1, 533‐542.
Ljungqvist, L., and T.J. Sargent, 1995, The Swedish unemployment experience, European Economic Review, 39, 1043‐70. Ljungqvist, L., and T.J. Sargent, 1998, The European Unemployment Dilemma, Journal of Political Economy, 106(3), 514‐550. Lommerud, K.E., and O.R. Straume, 2010, Employment protection vs. flexicurity: On technology adoption in unionized firms, CEPR working paper 7919. Nickell, S.J., 1986, Dynamic models of labour demand, Handbook of Labour Economics, Vol 2, O. Ashenfelter and D. Layard, North‐Holland. OECD, 2009, Employment Outlook, Paris.
OECD, 2010, Employment Outlook, Paris.
OECD, 2010b, Labour markets and the crisis, OECD Economics Department Working Papers, 756, Paris Rosholm M. (2008). Experimental Evidence on the Nature of the Danish Employment Miracle. Rosholm, M. & Svarer, M. (2008). Estimating the Threat Effect of Active Labour Market Programmes, Scandinavian Journal of Economics, 110(2), 385‐401. Rosholm, M. & Svarer, M. (2009), Kvantitativ analyse af ”hurtig i gang 2”, Arbejdsmarkedsstyrelsen. Strøby‐Jensen, 2008, Employment relations in Denmark – Explaining flexicurity, Working paper, Department of Sociology, University of Copenhagen. Van der Noord, P., 2000, The size and role of automatic stabilizers in the 1990s and beyond, OECD working paper 230. Van der Noord, P., N. Girouard, and C. André, 2006, Social Safety Nets and Structural Adjustment, OECD Working Paper 517.