a kinematic analysis and design of a continuously variable
TRANSCRIPT
A Kinematic Analysis and Design of a
Continuously Variable Transmission
Christopher Ryan Willis
Thesis submitted to the faculty of Virginia Polytechnic
Institute and State University in partial fulfillment of
the requirements for the degree
Master of Science
in
Mechanical Engineering
Dr. Charles F. Reinholtz, Chair
Dr. Richard M. Goff
Dr. Mehdi Ahmadian
19 January 2006
Blacksburg, VA
Keywords: CVT, continuously variable transmission,
kinematics, design
© 2006 by Christopher Ryan Willis
Use or inclusion of any portion of this ETD in a work intended for commercial use will require
clearance by the copyright owner

Kinematic Analysis and Design of a Continuously Variable
Transmission
Christopher Ryan Willis
(Abstract)
This thesis describes a method for analyzing and designing a continuously
variable transmission (CVT). The analysis process is implemented in a software package
that can be used to tune a CVT for a given application. The analysis is accomplished
through the use of kinematic principles as well as equations developed from basic energy
balances. Although the theory developed can be applied to any CVT, this thesis focuses
on a case study using the Team Industries brand CVT applied to the Virginia Tech Mini
Baja Team. The work was motivated by the team’s need to have a reliable and
inexpensive method for CVT tuning. Previous approaches to CVT tuning were strictly
empirical and involved mechanical component replacement in a slow and expensive trial-
and-error optimization loop. The tuning software is intended to be a first step in the
process of properly tuning a CVT for a specific application and not a complete
replacement for the empirical methods employed previously.

Acknowledgments
After beginning my academic career at Virginia Tech I had no intentions of
pursuing a higher degree. When my time in Blacksburg was coming to an end I wanted
nothing other than to stay and attempt a Master’s Degree. After discussing my plans with
Dr. Reinholtz, he introduced the concept of this project to me. From careful
consideration, it was clear that the next step for me was to stay at Virginia Tech and
attempt this project. I only hope that I met all of his initial expectations for developing a
CVT tuning program. I would also like to thank him for the assistance he gave me in
completing this project. With a thesis focused around the Mini Baja project it was a
natural fit to be able to assist in the design and construction of three more vehicles as the
teams Teaching Assistant.
Also, I would like to thank Dr. Goff for taking the time to help strengthen my
leadership and communication skills. There were several occasions when his guidance
was crucial to help keep the teams focused and on track. I would also like to thank the
Baja students who allowed me to share what knowledge I have accumulated over the
years to help design a winning vehicle.
I would like to thank my family for all of their support throughout the years.
Especially to my mother for the sacrifices she has made to allow me to be here today. I
would also like to thank all of my friends here at Tech, each one of you helped to either
keep me focused or distract me, which ever was needed at that time. Finally, I would like
to thank all the people that have made the mistake of asking me about my thesis, and
were consequently subjected to listen to me try and explain how a CVT works.
iii

Contents
Abstract iii
Acknowledgements iv
Table of Contents v
List of Figures vi
List of Tables vii
List of Equations vii
Chapter 1: Motivation and Background 1
1.1 Introduction 1
1.2 Motivation 2
1.3 Background 3
1.4 Literature Review 6
Chapter 2: Development of Solution Technique 9
2.1 Energy Balances 9
2.2 Primary Pulley Tuning 16
2.3 Secondary Pulley Tuning 17
Chapter 3: Development of Tuning Software 17
Chapter 4: Case Study: Mini Baja Vehicle 19
Chapter 5: Conclusions and Recommendations 23
5.1 Conclusions 23
5.2 Recommendations 24
iv

References 26
Appendix A: Additional Figures 27
Appendix B: MATLAB code for tuning the Team Industries
continuously variable transmission. 29
v
List of Figures
Figure 1: CAD drawing and picture of the typical setup of a CVT for use in a Mini
Baja Vehicle. 4
Figure 2: Picture of Team Industries primary CVT pulley. 5
Figure 3: Section drawing of the Team Industries primary pulley. 5
Figure 4: Picture of Team Industries secondary CVT pulley. 6
Figure 5: Plots of the displacement, velocity, and acceleration curves of the sheave
movement based on the rotation of the flyweight. 12
Figure 6: Plot showing the profile of the flyweights. 14
Figure 7: Plot showing the movement of the center of gravity with respect
to the sheave movement. 15
Figure 8: Sample input from the tuning software. 18
Figure 9: Flowchart explaining software. 19
Figure 10: Torque curve for Briggs and Stratton Intek 20 engine. 20
Figure 11: Briggs and Stratton Intek 20 engine power curve. 20
Figure 12: Output from software indicating most appropriate combination. 23
Figure A-1: Sketches of different flyweight modifications. 27
Figure A-2: Section drawing showing how the primary and secondary sheave work
together. 28
Figure B-1: MATLAB code for tuning the Team Industries CVT 36
vi

List of Tables
Table 1: Results from software showing flyweight weight for each primary spring. 21
Table 2: Calculated secondary spring rates and available secondary spring rates
with appropriate color code. 22
List of Equations
Equation 1 10
Equation 2 10
Equation 3 11
Equation 4 11
Equation 5 11
Equation 6 12
Equation 7 15
Equation 8 16
Equation 9 16
Equation 10 17
vii
1
Chapter 1: Motivation and Background
1.1 Introduction
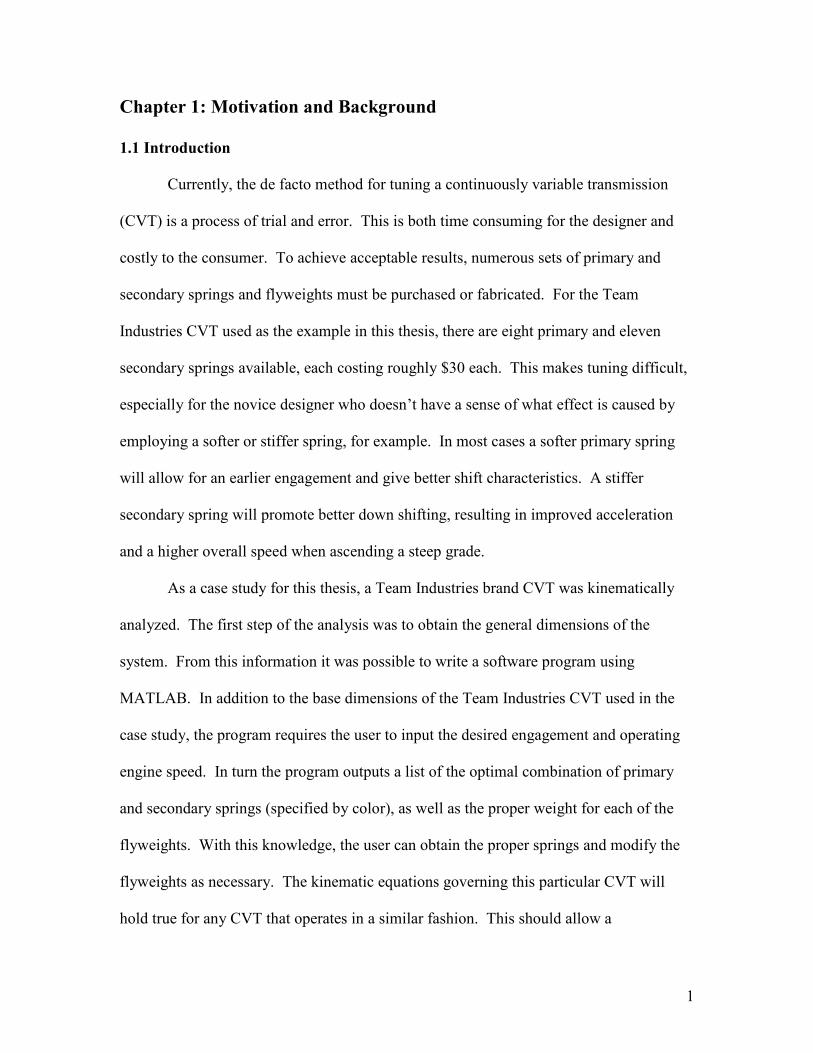
Currently, the de facto method for tuning a continuously variable transmission
(CVT) is a process of trial and error. This is both time consuming for the designer and
costly to the consumer. To achieve acceptable results, numerous sets of primary and
secondary springs and flyweights must be purchased or fabricated. For the Team
Industries CVT used as the example in this thesis, there are eight primary and eleven
secondary springs available, each costing roughly $30 each. This makes tuning difficult,
especially for the novice designer who doesn’t have a sense of what effect is caused by
employing a softer or stiffer spring, for example. In most cases a softer primary spring
will allow for an earlier engagement and give better shift characteristics. A stiffer
secondary spring will promote better down shifting, resulting in improved acceleration
and a higher overall speed when ascending a steep grade.
As a case study for this thesis, a Team Industries brand CVT was kinematically
analyzed. The first step of the analysis was to obtain the general dimensions of the
system. From this information it was possible to write a software program using
MATLAB. In addition to the base dimensions of the Team Industries CVT used in the
case study, the program requires the user to input the desired engagement and operating
engine speed. In turn the program outputs a list of the optimal combination of primary
and secondary springs (specified by color), as well as the proper weight for each of the
flyweights. With this knowledge, the user can obtain the proper springs and modify the
flyweights as necessary. The kinematic equations governing this particular CVT will
hold true for any CVT that operates in a similar fashion. This should allow a
2
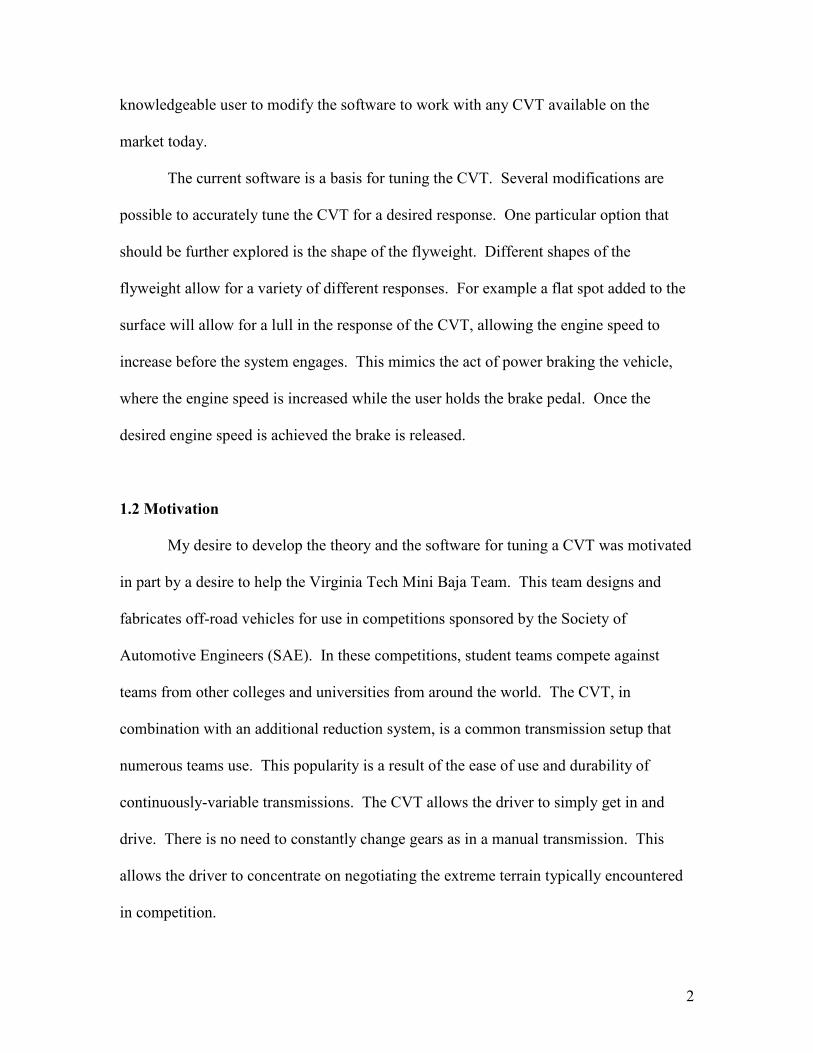
knowledgeable user to modify the software to work with any CVT available on the
market today.
The current software is a basis for tuning the CVT. Several modifications are
possible to accurately tune the CVT for a desired response. One particular option that
should be further explored is the shape of the flyweight. Different shapes of the
flyweight allow for a variety of different responses. For example a flat spot added to the
surface will allow for a lull in the response of the CVT, allowing the engine speed to
increase before the system engages. This mimics the act of power braking the vehicle,
where the engine speed is increased while the user holds the brake pedal. Once the
desired engine speed is achieved the brake is released.
1.2 Motivation
My desire to develop the theory and the software for tuning a CVT was motivated
in part by a desire to help the Virginia Tech Mini Baja Team. This team designs and
fabricates off-road vehicles for use in competitions sponsored by the Society of
Automotive Engineers (SAE). In these competitions, student teams compete against
teams from other colleges and universities from around the world. The CVT, in
combination with an additional reduction system, is a common transmission setup that
numerous teams use. This popularity is a result of the ease of use and durability of
continuously-variable transmissions. The CVT allows the driver to simply get in and
drive. There is no need to constantly change gears as in a manual transmission. This
allows the driver to concentrate on negotiating the extreme terrain typically encountered
in competition.

3
The teams are faced with numerous challenges throughout the design process that
prove to be both costly and time consuming. A method for quickly and accurately tuning
the CVT is would be of great value to the team. The software developed as part of this
research allows the team to simply enter the desired characteristics of the system and
quickly determine the proper primary and secondary spring rates and the correct weight
for the flyweights. This will allow the team to obtain the needed springs and make the
necessary modifications to the weights. Once these steps have been accomplished it is
then possible to attach the new parts to the CVT and begin vehicle testing. In Mini Baja,
testing is one of the most important steps of the design and manufacturing process. The
variety and brutality of the terrain seen by these vehicles is so extreme that extensive
testing and redesign is an important portion of the process.
1.3 Background
In the case of the Virginia Tech Mini Baja vehicle, the particular CVT used is a
rubber V-belt type. Such a CVT consists of two pulleys connected by a rubber V-belt.
The primary sheave is driven directly by the engine while the secondary sheave provides
input to a secondary reduction. This is a common arrangement in small vehicles that
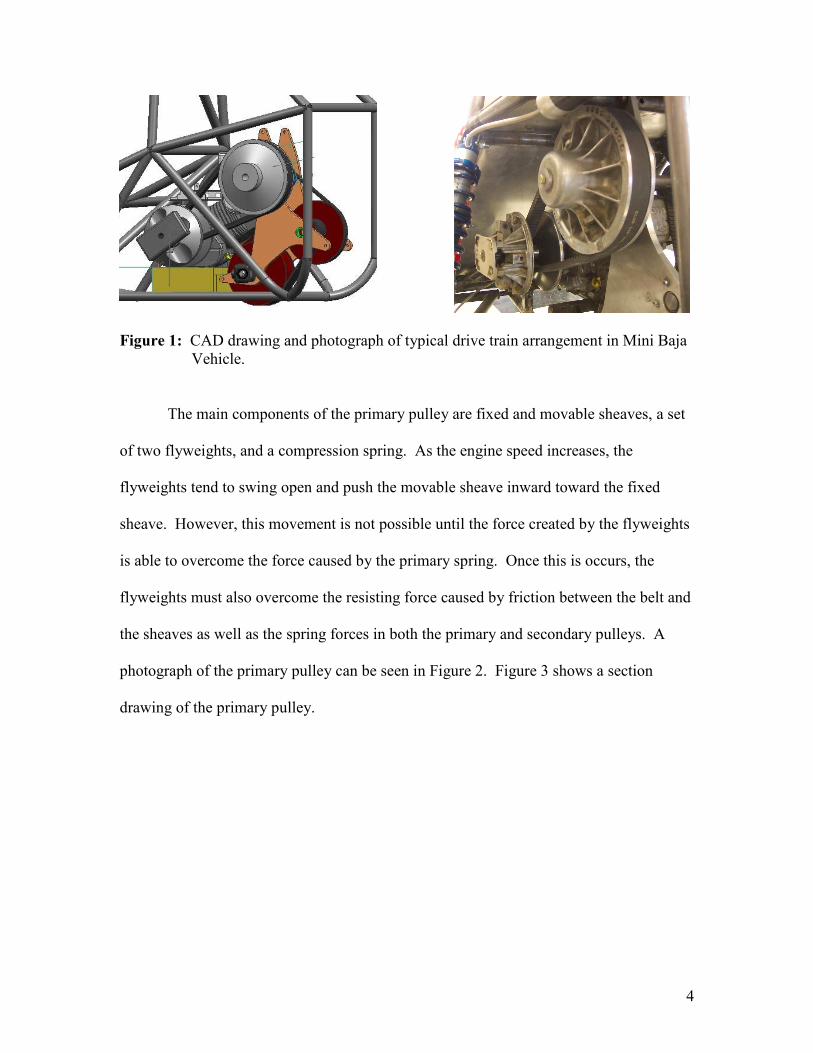
incorporate CVTs. Figure 1 shows a drawing and a photograph of this arrangement.
4
Figure 1: CAD drawing and photograph of typical drive train arrangement in Mini Baja Vehicle.
The main components of the primary pulley are fixed and movable sheaves, a set
of two flyweights, and a compression spring. As the engine speed increases, the
flyweights tend to swing open and push the movable sheave inward toward the fixed
sheave. However, this movement is not possible until the force created by the flyweights
is able to overcome the force caused by the primary spring. Once this is occurs, the
flyweights must also overcome the resisting force caused by friction between the belt and
the sheaves as well as the spring forces in both the primary and secondary pulleys. A
photograph of the primary pulley can be seen in Figure 2. Figure 3 shows a section
drawing of the primary pulley.

5
Figure 2: Photograph of Team Industries primary CVT pulley.
Figure 3: Section drawing of the Team Industries primary pulley [1].
The secondary pulley includes fixed and moveable sheaves and a spring loaded in
compression. As the primary begins to shift, its two sheaves move closer together. This,

6
in turn, narrows the width of the v-slot driving the belt to a larger diameter. The normal
force caused by the wedging of the belt between the sheaves forces the secondary sheaves
apart, which allows the belt to move to a smaller diameter on the secondary. This is the
process that shifts the system to a higher gear ratio. In an ideal case, such a combination
is capable of producing an overdrive gear a ratio of 0.75:1 in the CVT. The initial
reduction provided by the CVT is 3.5:1 A picture of the secondary pulley is included as
Figure 4.
Figure 4: Picture of Team Industries secondary CVT pulley.
1.4 Literature Review
The concept of the CVT is often referred to as the “Holy Grail” of transmissions,
since the CVT is able to provide smooth uninterrupted power without the step
discontinuities and resulting jerk of common gear-shift based standard transmissions.
The belt drive CVT used in the Virginia Tech Mini Baja vehicle is similar to the ones
7
commonly used in modern snowmobiles. CVTs have been the used in snowmobiles for
approximately fifty years [1].
Olav Aaen is widely considered to be the leading expert in the field of CVT
design and tuning. He has published nine editions of the Clutch Tuning Handbook [1],
which has been used as the basis for tuning the Virginia Tech’s Mini Baja vehicle for the
past six years. In his book, Aaen gives the background information necessary for a
casual user to tune a CVT without having detailed knowledge of the workings of the
internal mechanisms. He describes a tuning strategy that might be considered as an
educated guess and check method. In using this method to tune a CVT, the user must go
to a facility with consistent track conditions. The person tuning the CVT must physically
change out the available combinations of weights and springs to see which set produces
the best performance. After an extensive testing session, the user must decide on the best
combination that will produce the desired results. In most cases the desired result is
maximum top-end speed. In addition to describing the tuning method, in Chapters 4 and
5 Aaen also explains how the common primary and secondary pulleys work. In Chapter
7, Aaen describes the flyweight and a method for modifying them. In this section Aaen
describes the effects caused by modifying the flyweights.
As mentioned previously, the CVT is a popular transmission used in Mini Baja
competitions. Mark Allen and Robert LeMaster from the University of Tennessee at
Martin describe the design of a transmission involving a CVT and a fixed ratio gear box
in the SAE paper “A Hybrid Transmission for SAE Mini Baja Vehicles” [2]. In this
paper they discuss the design of a manual transmission to be used with a Salsbury style
CVT. This particular CVT works in the same way as the Team Industries CVT. The

8
difference is in the operation of the flyweights in the primary pulley. Allen and LeMaster
used Lagrange’s equations to determine the forces acting in the pulleys. The CVT was
analyzed as-is without considering possible modifications. The software described is
used as an estimate for the overall top speed achievable based on the gear ratio used in
the manual transmission.
Michael A. Kluger and Denis M. Long from the Southwest Research Institute
describe several transmission types and their properties in “An Overview of Current
Automatic, Manual and Continuously Variable Transmission Efficiencies and Their
Projected Future Improvements” [3]. In this Kluger and Long discuss the various types
of transmissions including: automatic, manual and continuously variable. For each type
they discuss the efficiency as well as the areas for improvement for each. They discuss
the CVT’s various advantages and disadvantages, and help to determine the overall CVT
efficiency at different operating speeds and loading conditions.
A SAE publication entitled “A Theoretical and Experimental Procedure for
Design Optimization of CVT Belts” [4] by Sergio Lolli describes a theoretical and
experimental method for designing CVT belts. In this paper Lolli develops equations that
determine the stress within the belt and provides a method for determining the tensile
forces seen within the belt. Lolli uses a method of finite element modeling to determine
stresses and uses this information to predict the lifespan of a CVT belt.
In Mechanisms and Dynamics of Machinery [5] Hamilton Mabie and Charles
Reinholtz describe general methods for designing and analyzing cam mechanisms. In a
CVT, the surface of the flyweight serves as a cam to actuate a roller attached to the
moving sheave. As the engine speed increases, the flyweight rotates out, forcing the
9
sheaves together and changing the drive ratio. The shape of the cam surface of the
flyweight must be determined to perform a complete analysis. This was done using a
dial indicator as the translating roller follower and then using the results found in Mabie
and Reinholtz to calculate the shape of the cam surface. Once this surface shape is
known, it is possible to compute the output displacement of the roller follower in the
CVT. However, this process is complicated, another acceptable method is to measure the
sheave displacement based on the rotation of the flyweight with a dial indicator. The
measured data can then be plotted with a curve fit created for the data. Once the
displacement function of the follower has been developed, a velocity plot is found by
taking the derivative of the initial curve. An acceleration curve is determined by
performing a derivative on the velocity. Using this method, it is possible to determine the
energy developed by the movement of the primary sheave.
Chapter 2: Development of Solution Technique
2.1 Energy Balances
One approach for modeling a complicated system, such as the CVT, is to perform
an energy balance. To accomplish this, expressions for the potential and kinetic energy
of each subsystem must be developed. There are four significant energy terms in the
system. These terms describe the potential energy stored in the springs, the energy lost to
friction, the kinetic energy stored due to the velocity of the sheaves, and the angular
velocity of the flyweights.
The first term considered is the potential energy stored in the compression
springs. This energy may be found using Equation 1 with the proper substitutions.

10
( ) Energy = ½ K x⋅ ⋅ ∆2
(1)
Here, K is the stiffness of the spring in lbs/in. and ∆x is the distance the spring has been
compressed. Once the primary pulley has engaged, the primary pulley sheave closes at
the same rate as the secondary sheave is opening. For the primary pulley, the ∆x value
ranges from 0 to 1.25 in. The sheave must move a distance of 0.15 in. in order for the
CVT to engage. Once this engagement occurs, the power from the engine is then
transmitted to the secondary pulley, then to the remainder of the drive train. The
secondary pulley sheave moves 0.15 inches less than the primary sheave, as indicated in
Equation 2.
∆x x= − 015. (2)
Where x is the movement of the primary sheave. To simplify the equations when the total
reaction of the system is considered, it is important to be able to relate the movement of
the secondary sheave to the primary sheave.
The work energy lost through the frictional force between the rubber v-belt and
the aluminum sheaves must be determined as well. The work is found by multiplying
the force by the distance traveled. To determine the work, the length of belt in contact
with the sheaves has to be found. Equations were found that related the amount of
sheave travel in the primary to the length of belt in contact with the sheave. Separate
equations were written for the primary and the secondary. After the contact length is
determined, it is possible to calculate the energy lost through friction. This energy is
turned into heat and can become quite noticeable during extended operation. The
equation used to determine the energy lost due to friction is given in Equation 3

11
Energy N dk= ⋅ ⋅ ⋅2 µ (3)
where N is the normal force caused by the spring, µk is the coefficient of friction between
the belt and the sheaves, and d is the radial distance the belt slides along the surface if the
sheave. In other words, d is the change in diameter of the belt location on the sheave. As
the pulleys shift the belt is forced to move up or down on the pulley, this sliding motion
is the cause of the frictional losses. For the Team Industries CVT, equation 4 is used to
calculate the belt height change on the primary sheave
d xprimary = ⋅ −2 4641 0. .24641 (4)
where x is the distance the primary sheave moves. Equation 5 is used to find the belt
height for the secondary pulley in a similar method as used for the primary
d ondarysec .= ⋅3080 -2.4641 x (5)
where x is again the distance the primary sheave moves. Writing both equations with
respect to the movement of the primary sheave simplifies the equations by removing one
of the possible variables. Equations 4 and 5 were found by determining the height of the
belt on the sheave, based on the position of the movable primary sheave. The belt height
is then treated as if it is a radius and the circumference of the half circle is calculated.
The third term in the energy equation is the kinetic energy stored in the motion of
the primary and secondary sheave. The sheave velocity can be determined by analyzing
the motion produced by the cam surface on the moving flyweight. By measuring the
linear follower displacement as a function of the rotation of the cam, a displacement plot
can be constructed. After determining a curve fit model to give an analytical
displacement function, it is possible to take derivatives to find the velocity and
acceleration with respect to rotation.

12
A plot, shown in Figure 5, created using the tuning software, shows these three
plots for the current cam profile. In this plot the blue lines represent the collected data,
where the green lines are for the curve fits.
Figure 5: Plots of the displacement, velocity, and acceleration curves of the sheave movement based on the rotation of the flyweight. After creating these plots and the corresponding models, it is possible to
determine the sheave velocity at the point where the sheave has moved enough to contact
the v-belt. At this point of contact, the system has engaged and power will begin to be
transmitted to the remainder of the drive train. The kinetic energy stored the sheave is
found from Equation 6
Energy m v= ⋅ ⋅1
2
2 (6)
13
where m is the sliding mass (sheave and flyweights), and v is the velocity of the sheave.
However, the velocity is not in the correct units. The particular velocity found is based
on cam rotation angle rather than time. To get true velocity, we must multiply the result
by dw
dt, w being the rotational engine speed.
The final type of energy developed in the system is caused by the rotation of the
flyweight. An accurate model of the cam surface had to be created to find this energy. In
addition detailed measurements were taken of the current weight to achieve this model.
Then, these measurements were put into MATLAB and a curve fit was calculated. The
ideal tool for taking these measurements would be a dial indicator with a knife-edge tip.
This would produce the exact radial location of points on the cam surface. In most
cases, including this one, this tool is not available. In this situation a dial indicator with a
ball end was used. This ball end is 1/16 in. in diameter and introduces a certain amount of
error. The radius of the ball end is the maximum error that can be introduced when
measuring this particular flyweight. If the flyweight surface curved dramatically the
error may increase. This error was found to be one half the radius of the ball end
indicator, 0.031 in. at its maximum. This error was assumed to be insignificant and was
therefore ignored in this study.
After analyzing the magnitude of the error introduced by the roller on the system,
a curve has been created and is shown in Figure 6. The blue “x” represents the center of
gravity point of the flyweight. It is possible to further improve the characteristics of the
CVT by changing the profile of the flyweights. These values can be easily changed in
the supplied software to best meet the user’s needs. For example, adding a flat spot at the
point were first contact between the flyweight and the roller occurs, will allow for a
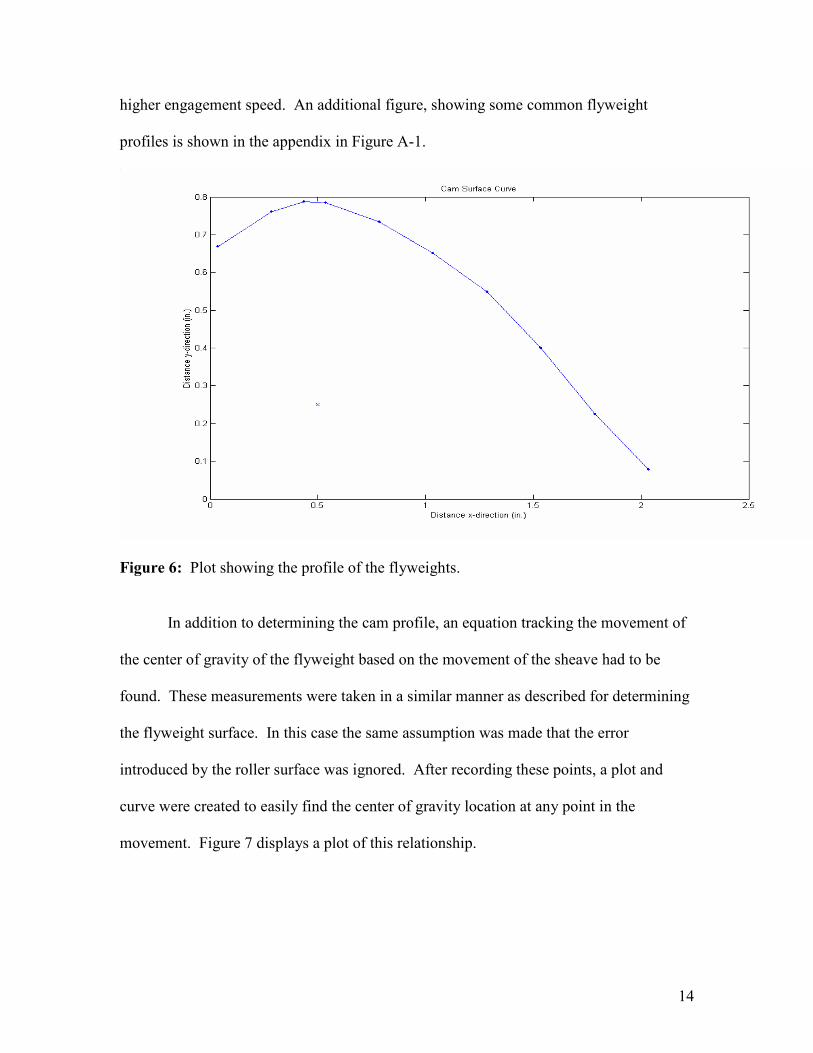
14
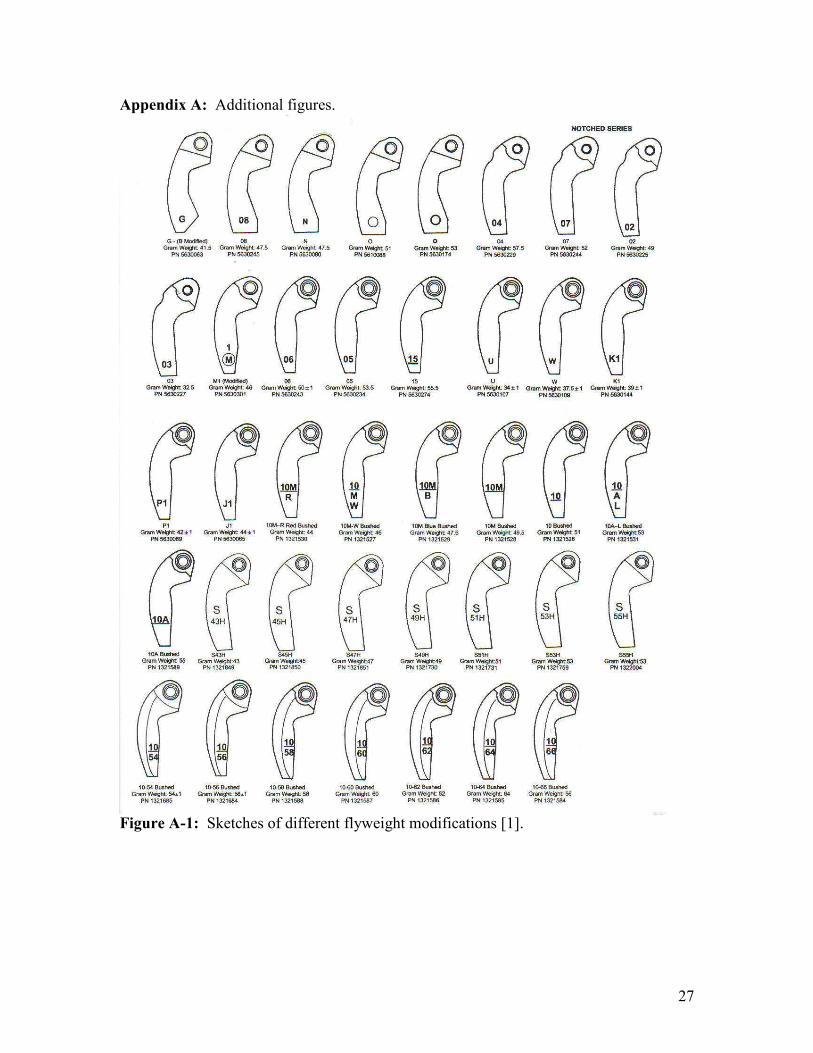
higher engagement speed. An additional figure, showing some common flyweight
profiles is shown in the appendix in Figure A-1.
Figure 6: Plot showing the profile of the flyweights.
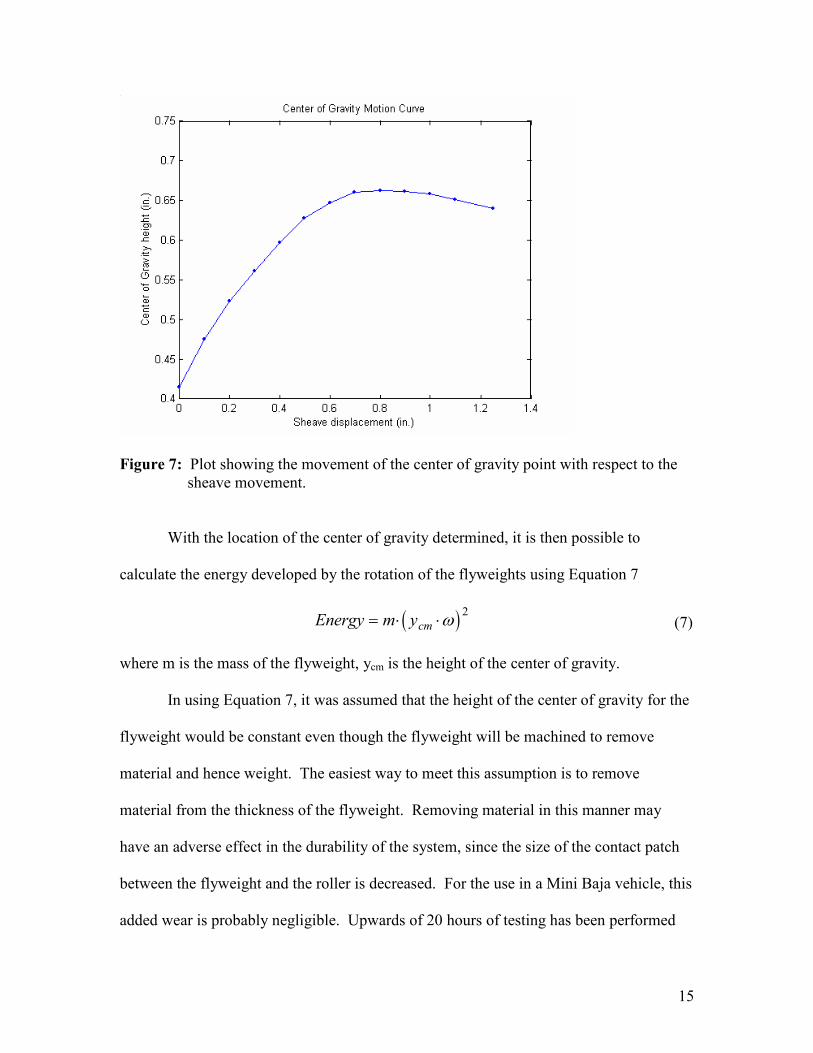
In addition to determining the cam profile, an equation tracking the movement of
the center of gravity of the flyweight based on the movement of the sheave had to be
found. These measurements were taken in a similar manner as described for determining
the flyweight surface. In this case the same assumption was made that the error
introduced by the roller surface was ignored. After recording these points, a plot and
curve were created to easily find the center of gravity location at any point in the
movement. Figure 7 displays a plot of this relationship.
15
Figure 7: Plot showing the movement of the center of gravity point with respect to the sheave movement.
With the location of the center of gravity determined, it is then possible to
calculate the energy developed by the rotation of the flyweights using Equation 7
( )Energy m ycm= ⋅ ⋅ω2
(7)
where m is the mass of the flyweight, ycm is the height of the center of gravity.
In using Equation 7, it was assumed that the height of the center of gravity for the
flyweight would be constant even though the flyweight will be machined to remove
material and hence weight. The easiest way to meet this assumption is to remove
material from the thickness of the flyweight. Removing material in this manner may
have an adverse effect in the durability of the system, since the size of the contact patch
between the flyweight and the roller is decreased. For the use in a Mini Baja vehicle, this
added wear is probably negligible. Upwards of 20 hours of testing has been performed

16
with no noticeable wear shown on the rollers. In an environment where the CVT is
running for several thousand hours, additional wear may be noted and a different method
for reducing the cam weight may need to be determined.
2.2 Primary Pulley Tuning
Using the energy equations previously found, it is possible to perform an energy
balance on the system. The sum of the energies in this equation must equal zero to allow
for conservation of energy. Equation 8 shows the energies needed
PE E KE KEspring friction sheave flyweights− + + = 0 (8)
where each term of this equation was developed above. Rearranging the equation, to
solve for the mass of the flyweights, allows the software to calculate a weight based on
each primary spring available as shown in equation 9
( )
mE PE
m v y wfw
friction spring
s cm
=−
⋅ ⋅ + ⋅12
2 2ω
(9)
in this the terms are as described above.
CVT springs are commonly referred to by their color rather than their spring rate
since several springs have the same stiffness but different free lengths, which produce
different preloads. Therefore an algorithm must be written that will output the proper
spring color needed.
The masses are then analyzed to filter out any masses that are unrealistic. These
unrealistic masses are any masses that have values that may be negative or values that
small compared to the initial flyweight of 200 grams. Masses larger than the initial must
17
also be filtered out, since it is difficult to add additional mass to the weights in an
accurate manner. One possibility for creating a heavier flyweight is to create it out of a
denser material than the one currently used.
2.3 Secondary Pulley Tuning
With the information found for the primary, it is now possible to properly tune the
secondary pulley. By combining the equations of energy a balance can be written that
describes both the primary and secondary pulleys. The general equation that describes
the energy balance is shown in Equation 10.
PE E KE KEsprings friction sheave flyweights− + + = 0 (10)
where the spring potential energy as well as the energy from friction is for both the
primary and secondary pulley. The equation is then rearranged to solve for the secondary
spring rates needed to operate at the desired engine speed based on each combination of
primary spring and flyweight weight. These secondary spring rates are then compared to
a list of the available secondary spring rates. The closest match is then found.
Chapter 3: Development of Tuning Software
A MATLAB program was created to perform the necessary calculations based on
the theory presented in the preceding sections. One goal in developing this software was
to make it easy to use. For a given CVT system with assorted combinations of weights
and springs previously entered in the program, the user simply enters the engagement and
operating speeds. Since the software is based on the theory developed herein, it is also
easy for an advanced user to adapt the software to CVTs other than the one presented.
18
Also, the user may modify the software to further tune the CVT by changing the profile
of the flyweight. The current software is intended to be used only as a starting point for
CVT tuning; the user may need to make changes to the results based on what is seen
during testing.
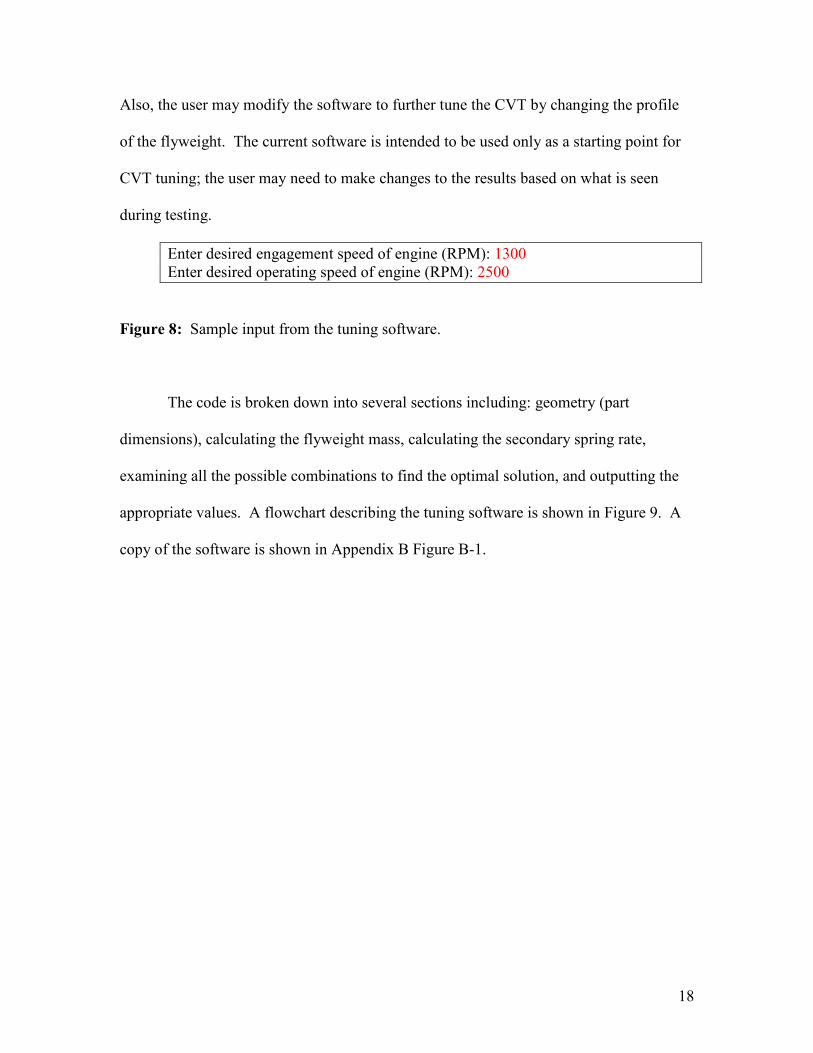
Enter desired engagement speed of engine (RPM): 1300 Enter desired operating speed of engine (RPM): 2500
Figure 8: Sample input from the tuning software.
The code is broken down into several sections including: geometry (part
dimensions), calculating the flyweight mass, calculating the secondary spring rate,
examining all the possible combinations to find the optimal solution, and outputting the
appropriate values. A flowchart describing the tuning software is shown in Figure 9. A
copy of the software is shown in Appendix B Figure B-1.
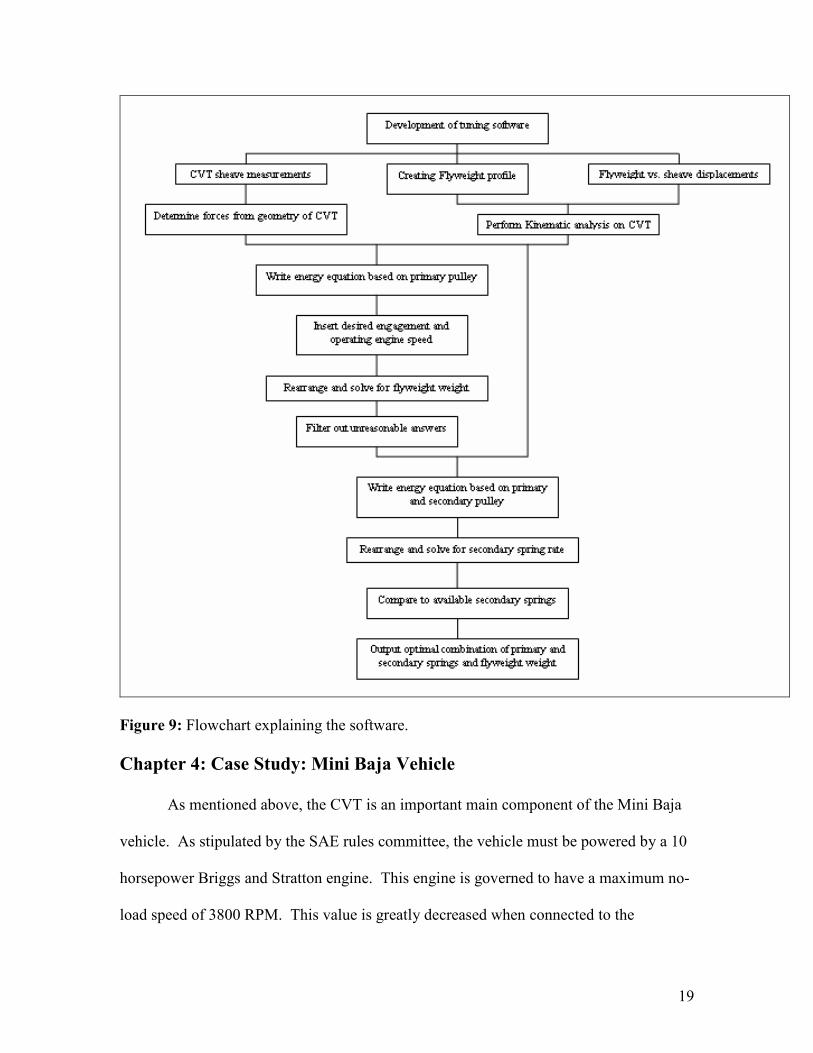
19
Figure 9: Flowchart explaining the software.
Chapter 4: Case Study: Mini Baja Vehicle
As mentioned above, the CVT is an important main component of the Mini Baja
vehicle. As stipulated by the SAE rules committee, the vehicle must be powered by a 10
horsepower Briggs and Stratton engine. This engine is governed to have a maximum no-
load speed of 3800 RPM. This value is greatly decreased when connected to the
20
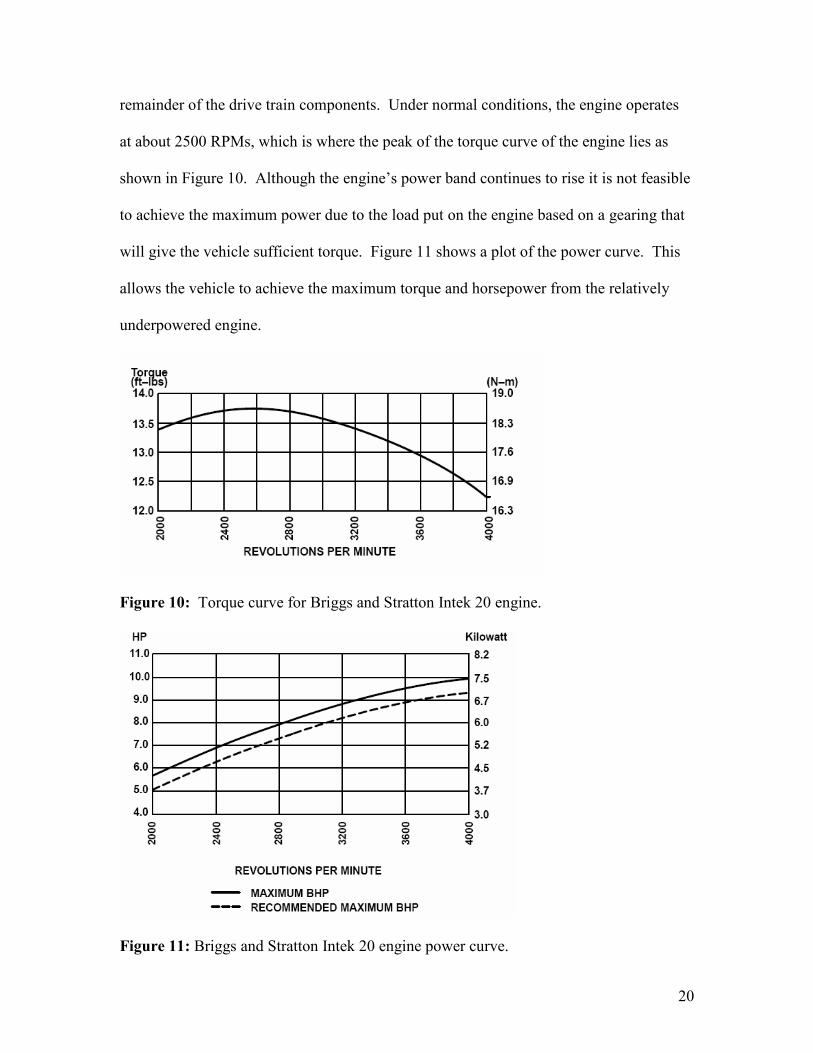
remainder of the drive train components. Under normal conditions, the engine operates
at about 2500 RPMs, which is where the peak of the torque curve of the engine lies as
shown in Figure 10. Although the engine’s power band continues to rise it is not feasible
to achieve the maximum power due to the load put on the engine based on a gearing that
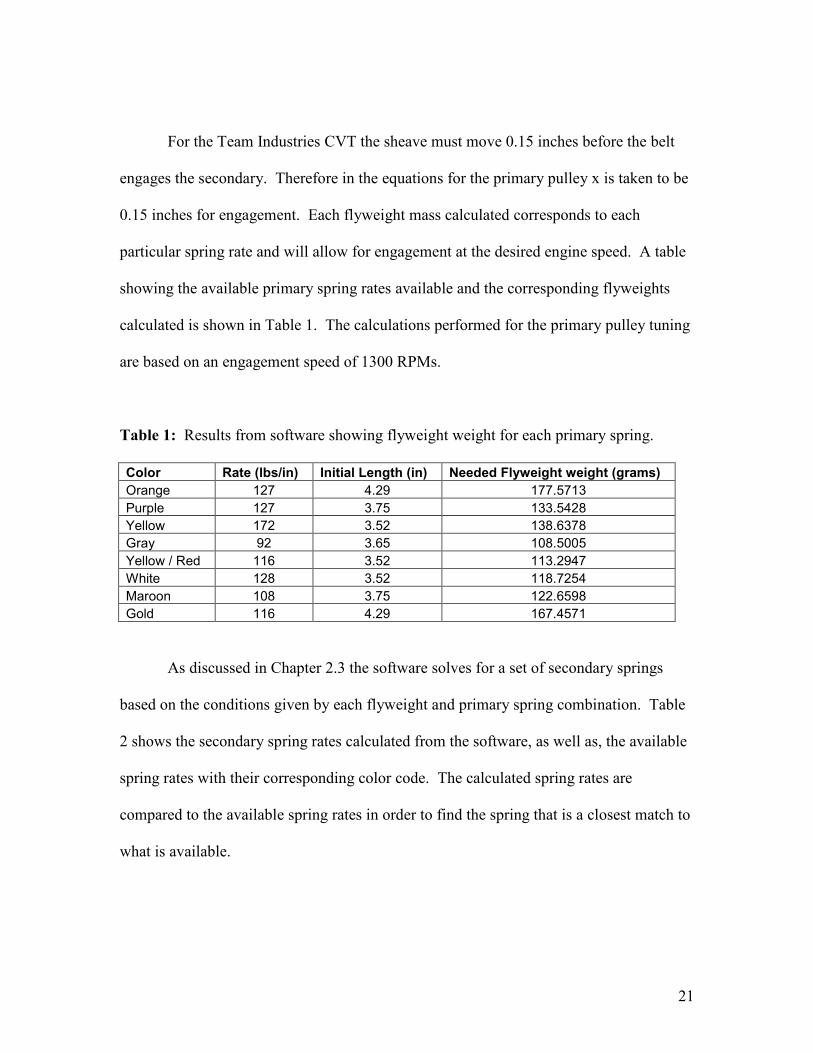
will give the vehicle sufficient torque. Figure 11 shows a plot of the power curve. This
allows the vehicle to achieve the maximum torque and horsepower from the relatively
underpowered engine.
Figure 10: Torque curve for Briggs and Stratton Intek 20 engine.
Figure 11: Briggs and Stratton Intek 20 engine power curve.
21
For the Team Industries CVT the sheave must move 0.15 inches before the belt
engages the secondary. Therefore in the equations for the primary pulley x is taken to be
0.15 inches for engagement. Each flyweight mass calculated corresponds to each
particular spring rate and will allow for engagement at the desired engine speed. A table
showing the available primary spring rates available and the corresponding flyweights
calculated is shown in Table 1. The calculations performed for the primary pulley tuning
are based on an engagement speed of 1300 RPMs.
Table 1: Results from software showing flyweight weight for each primary spring.
Color Rate (lbs/in) Initial Length (in) Needed Flyweight weight (grams)
Orange 127 4.29 177.5713
Purple 127 3.75 133.5428
Yellow 172 3.52 138.6378
Gray 92 3.65 108.5005
Yellow / Red 116 3.52 113.2947
White 128 3.52 118.7254
Maroon 108 3.75 122.6598
Gold 116 4.29 167.4571
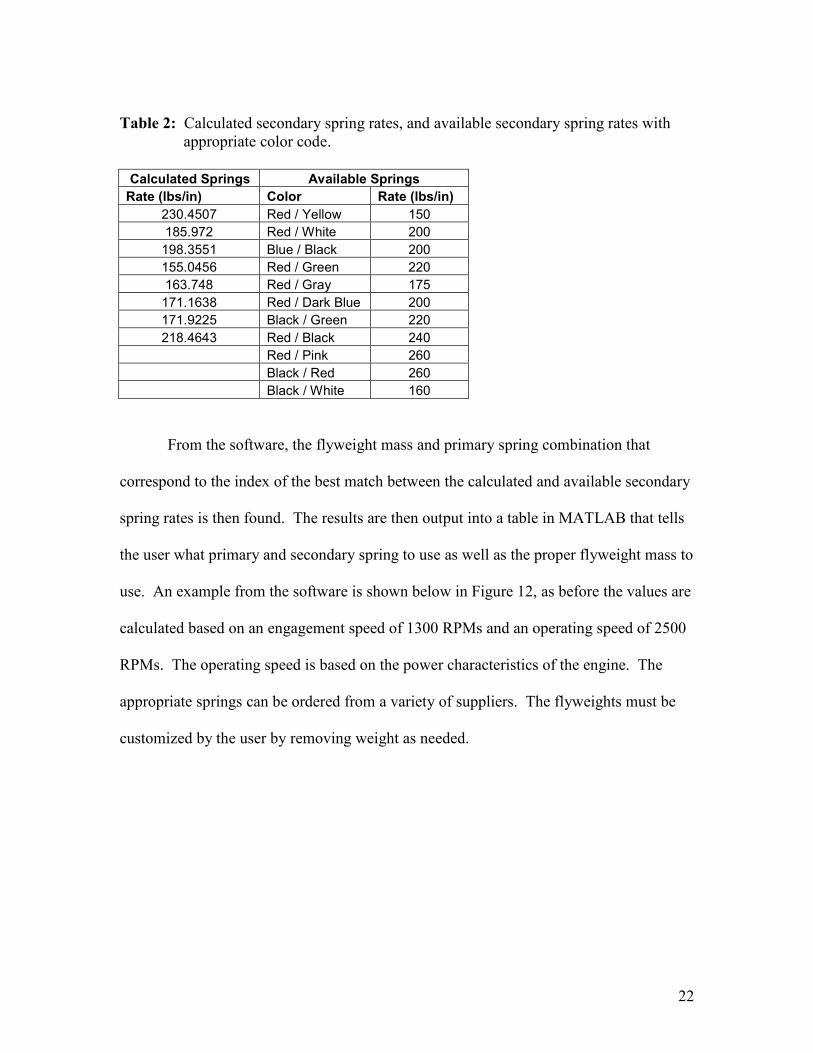
As discussed in Chapter 2.3 the software solves for a set of secondary springs
based on the conditions given by each flyweight and primary spring combination. Table
2 shows the secondary spring rates calculated from the software, as well as, the available
spring rates with their corresponding color code. The calculated spring rates are
compared to the available spring rates in order to find the spring that is a closest match to
what is available.
22
Table 2: Calculated secondary spring rates, and available secondary spring rates with appropriate color code. Calculated Springs Available Springs
Rate (lbs/in) Color Rate (lbs/in)
230.4507 Red / Yellow 150
185.972 Red / White 200
198.3551 Blue / Black 200
155.0456 Red / Green 220
163.748 Red / Gray 175
171.1638 Red / Dark Blue 200
171.9225 Black / Green 220
218.4643 Red / Black 240
Red / Pink 260
Black / Red 260
Black / White 160
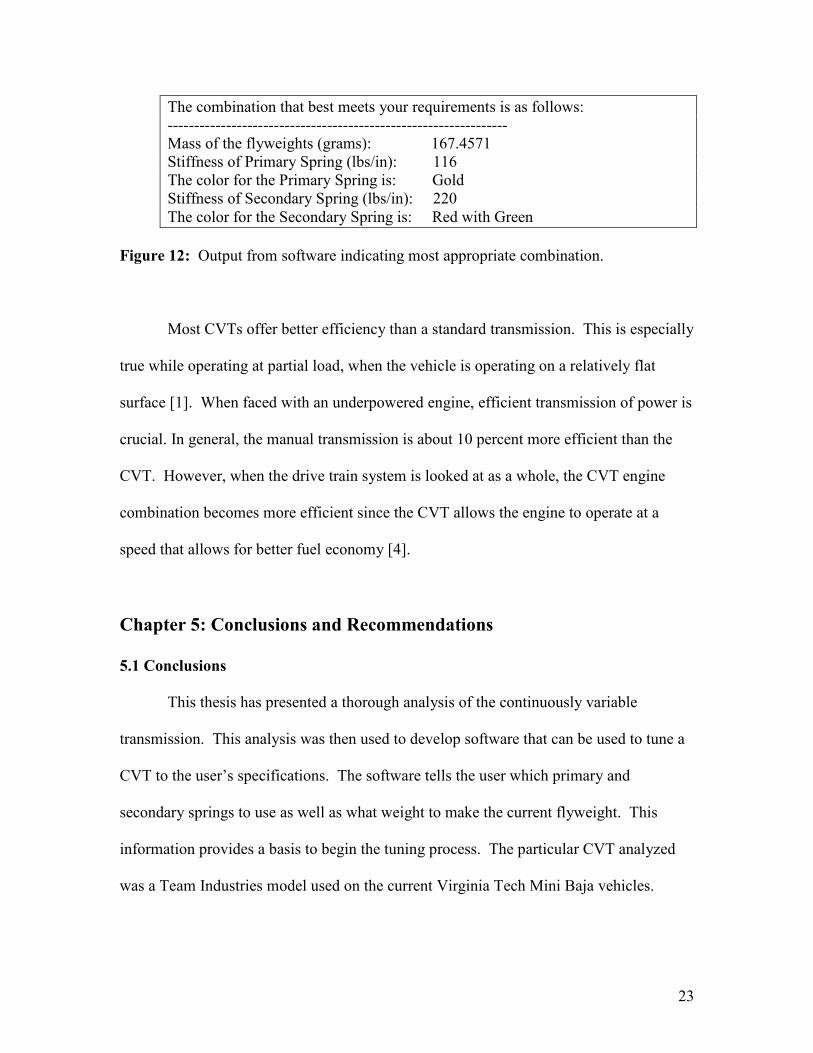
From the software, the flyweight mass and primary spring combination that
correspond to the index of the best match between the calculated and available secondary
spring rates is then found. The results are then output into a table in MATLAB that tells
the user what primary and secondary spring to use as well as the proper flyweight mass to
use. An example from the software is shown below in Figure 12, as before the values are
calculated based on an engagement speed of 1300 RPMs and an operating speed of 2500
RPMs. The operating speed is based on the power characteristics of the engine. The
appropriate springs can be ordered from a variety of suppliers. The flyweights must be
customized by the user by removing weight as needed.
23
The combination that best meets your requirements is as follows: ---------------------------------------------------------------- Mass of the flyweights (grams): 167.4571 Stiffness of Primary Spring (lbs/in): 116 The color for the Primary Spring is: Gold Stiffness of Secondary Spring (lbs/in): 220 The color for the Secondary Spring is: Red with Green
Figure 12: Output from software indicating most appropriate combination.
Most CVTs offer better efficiency than a standard transmission. This is especially
true while operating at partial load, when the vehicle is operating on a relatively flat
surface [1]. When faced with an underpowered engine, efficient transmission of power is
crucial. In general, the manual transmission is about 10 percent more efficient than the
CVT. However, when the drive train system is looked at as a whole, the CVT engine
combination becomes more efficient since the CVT allows the engine to operate at a
speed that allows for better fuel economy [4].
Chapter 5: Conclusions and Recommendations
5.1 Conclusions
This thesis has presented a thorough analysis of the continuously variable
transmission. This analysis was then used to develop software that can be used to tune a
CVT to the user’s specifications. The software tells the user which primary and
secondary springs to use as well as what weight to make the current flyweight. This
information provides a basis to begin the tuning process. The particular CVT analyzed
was a Team Industries model used on the current Virginia Tech Mini Baja vehicles.
24
The current software is a basis for tuning the CVT. Several modifications are
possible to accurately tune the CVT for a desired response. One particular option that
should be further explored is the shape of the flyweight. Different shapes of the
flyweight allow for a variety of different responses. For example a flat spot added to the
surface will allow for a lull in the response of the CVT, allowing the engine speed to
increase before the system engages. This mimics the act of power braking the vehicle,
where the engine speed is increased while the user holds the brake pedal. Once the
desired engine speed is achieved the brake is released.
5.2 Recommendations
The research contained in this thesis provides an excellent starting point for more
in-depth research into the operation of the CVT. The result from the software is intended
to assist in the process of tuning. Current processes for tuning the CVT require the user
to repeatedly change the CVT setup until a reasonable response is found, based on the
combination of springs and weights. The process for obtaining the precise balance of the
springs and flyweights can be long and tedious. By achieving a starting point about
which to center the tuning process, the designer can save time and money.
This research does not address the issue of the cam profile of the flyweights. The
shape of the flyweights is a field of study in itself. The simplest of modifications can
cause a large change in the performance of the CVT. Some research has been done in the
field of flyweight shape and the performance changes that occur. To date, this work has
only been experimental. Developing an analytical approach for changing the flyweight
shapes would be a major contribution. An extensive cam synthesis should be performed
25
to achieve the best possible shape based on the characteristics of the engine and drive
train.
Additionally modifying the software to be able to work with a variety of CVT
manufactures is needed. Allowing the user to input the characteristics and general
dimensions of their particular CVT will permit the software to be used for any CVT with
a similar configuration. With changing technology, there are constant advancements in
CVT properties including numerous improvements in the overall efficiency of the CVT
belts. The growing popularity of Mini Baja gives manufactures a low cost testing
environment for new designs; this includes designing new CVT’s that are designed to
operate at lower operating speeds. These improvements allow teams involved in the Mini
Baja competitions to continuously change manufacturers or models to find the best
possible system for them.
26
References
1. Aaen, Olav. Clutch Tuning Handbook. © Olav Aaen, December 2003
2. Allen, Mark and LeMaster, Robert. “A Hybrid Transmission for SAE Mini Baja
Vehicles”. SAE Publication 2003-32-0045
3. Lolli, Sergio. “A Theoretical and Experimental Procedure for Design
Optimization of CVT Belts”. SAE Publication 2003-01-0973
4. Kluger, Michael A. and Long, Denis M. “An Overview of Current Automatic,
Manual and Continuously Variable Transmission Efficiencies and Their Projected
Future Improvements”. SAE Publication 1999-01-1259
5. Mabie, Hamilton H. and Charles F. Reinholtz. Mechanism and Dynamics of Machinery, Fourth Edition. New York: John Wiley and Sons, 1987
27
Appendix A: Additional figures.
Figure A-1: Sketches of different flyweight modifications [1].
28
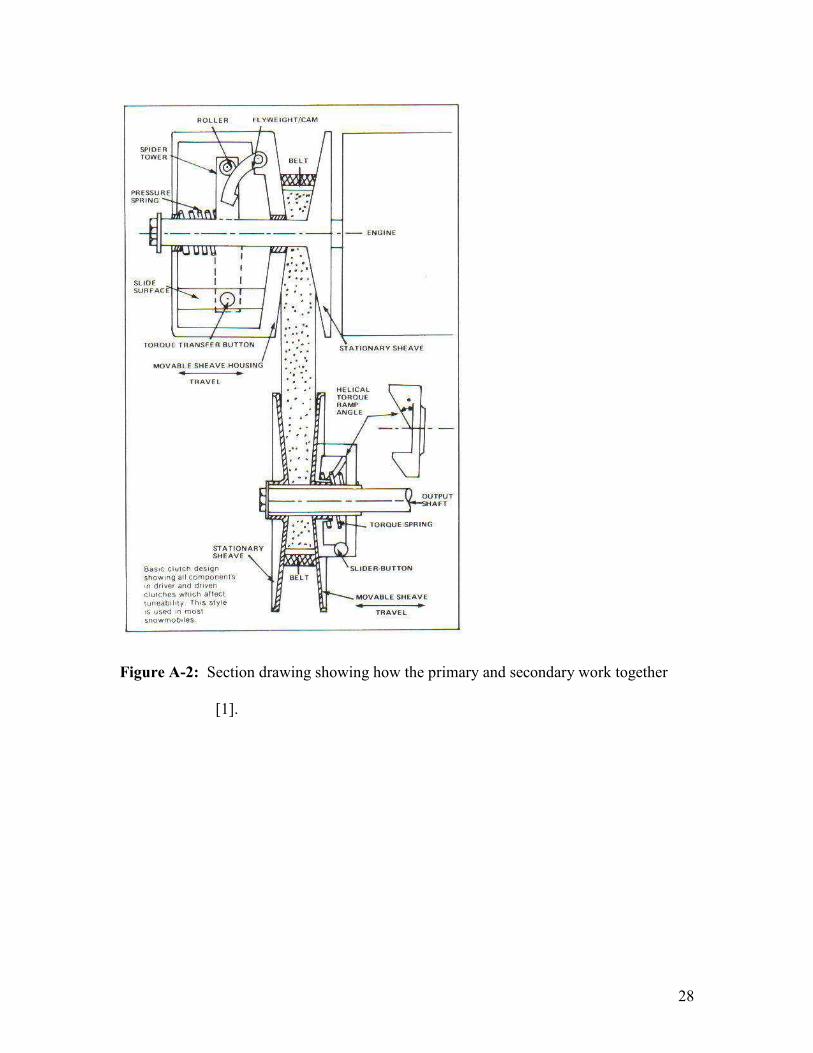
Figure A-2: Section drawing showing how the primary and secondary work together
[1].