a, jennifer h. dennisab,*, michael mazzocco c b. c
TRANSCRIPT
1
AN EVALUATION OF CONSUMER SEGMENTS FOR FARMERS’ MARKET CONSUMERS IN INDIANA AND ILLINOIS
Kendra Arringtona, Jennifer H. Dennisab,*, Michael Mazzocco
c
a. Department of Agricultural Economics, Purdue University, 659 Krannert Building, West
Lafayette, IN 47907-1145, USA, [email protected] b. Department of Horticulture & Landscape Architecture, Purdue University, 320
Horticulture Building, West Lafayette, IN 47907, USA, [email protected] c. Verdant Partners LLC, 2504 Galen Drive, Suite 103, Champaign, IL 61821-8817, USA,
[email protected] * Corresponding author. Tel.: +1-765-494-9812; fax:+1-765-494-9176
The authors would like to thank Drs. Janet Ayers and Frank Dooley for their assistance with this manuscript.
Selected Paper prepared for presentation at the 2010 WERA-72 Agribusiness Research Emphasizing Competitiveness and Profitability Meeting, Santa Clara, CA, June 13-15, 2010.
>> Copyright 2010 by {Kendra Arrington, Jennifer Dennis, and Michael Mazzocco}. All rights reserved. Readers may make verbatim copies of this document for non-commercial purposes by any means,
provided this copyright notice appears on all such copies.

2
AN EVALUATION OF CONSUMER SEGMENTS FOR FARMERS’ MARKET 1
CONSUMERS IN INDIANA AND ILLINOIS 2
In Spring 2005 and Fall 2009 consumer surveys were collected in several Metropolitan 4
cities in Indiana and Illinois to explore differences based on psychographic and behavioral 5
characteristics of farmers’ market consumers. Consumer intercept surveys were conducted in: 6
South Bend, IN; Bloomington, IN; Springfield, IL and Peoria, IL. Likert scale questions were 7
analyzed using factor and hierarchical cluster analysis to identify clusters of consumers based on 8
several farmers’ market characteristics. Survey results show that of the 164 Metropolitan 9
surveys analyzed, 85.3% of respondents were Caucasian, 71.9% were between the ages of 35 and 10
64 and 78% were female. Data analysis showed that four clusters were formed: Recreational 11
(42%), Minimalists (27%), Enthusiasts (23%) and Time-challenged (8%). Each cluster had a 12
unique set of preferences based on farmers’ market attributes ranging from overall convenience 13
of the shopping trip to the presence of nearby stores. Differences in consumer segments suggest 14
that farmers’ market managers can develop specific marketing messages toward each segment. 15
Abstract 3
16
Keywords: cluster analysis, consumers, farmers’ market, primary data, surveys 17
18

3
Executive Summary 19
A factor and hierarchical cluster analysis showed four clusters existed based on farmers’ 20
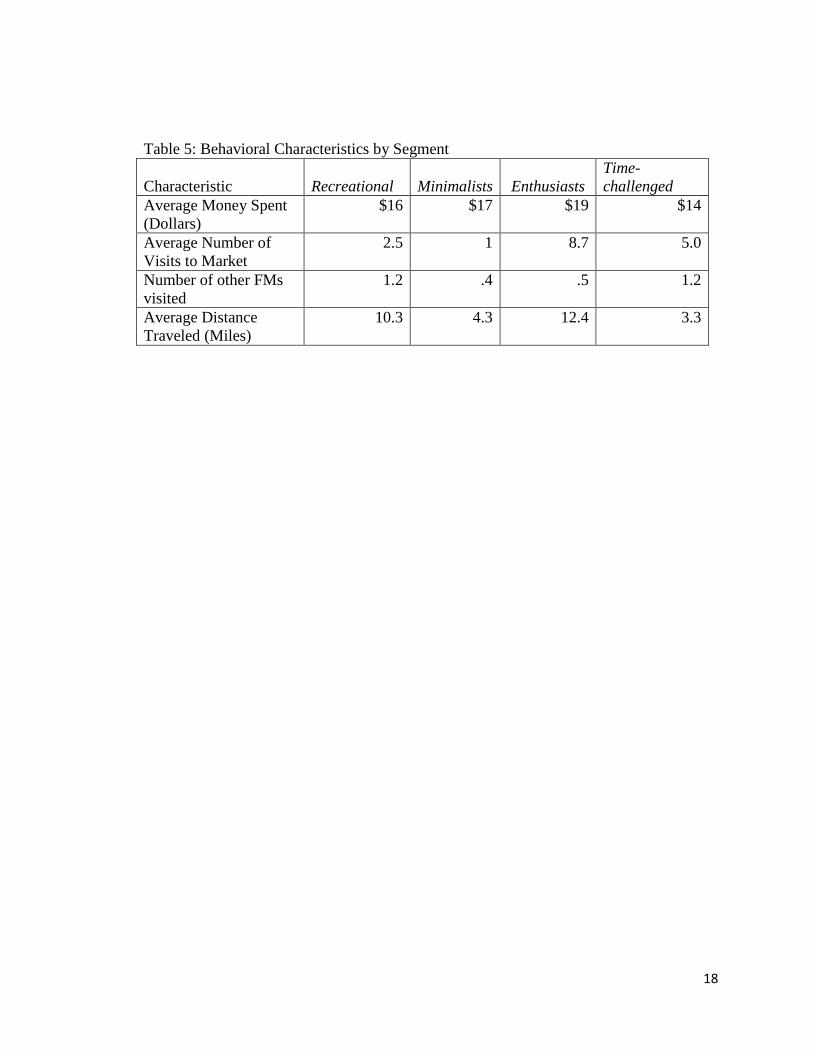
market characteristics. Recreational shoppers were the largest segment of consumers (42%) and 21
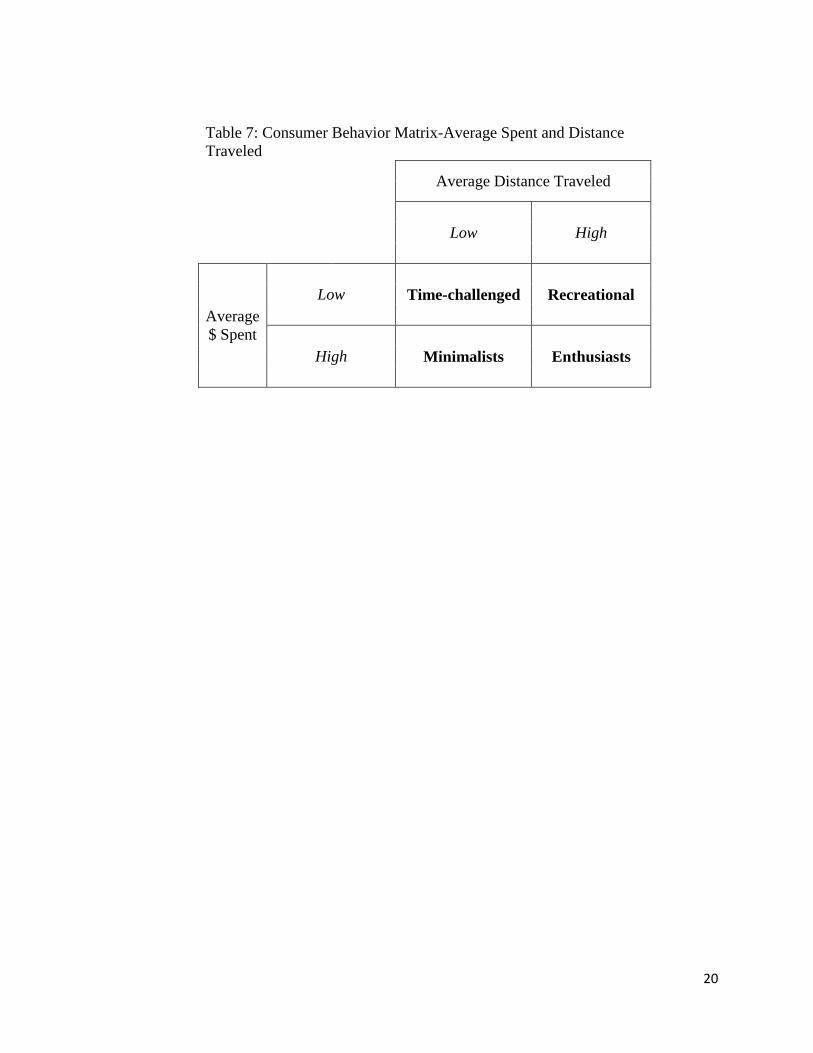
had a low average expenditure per visit, a high average distance traveled (Table 7) and a high 22
average of visits to the survey market per season showing they were likely to travel and visit 23
often but were not as likely to spend large amounts of money. Minimalists had the highest 24
percentage of primary shoppers of any other segment (81.8%). Minimalists had a high average 25
expenditure per visit, a low average distance traveled (Table 7) and a low average of visits to the 26
survey market per season. Time-challenged shoppers valued the presence of nearby stores. Time-27
challenged shoppers had a low average expenditure per visit, a low average distance traveled 28
(Table 7) and a high average of visits to the survey market per season. Enthusiasts were 29
dedicated shoppers that enjoyed all aspects of the farmers’ market shopping experience but did 30
not place much importance on variety. Enthusiasts had a high average expenditure per visit, a 31
high average distance traveled (Table 7) and a high average of visits to the survey market per 32
season. Enthusiasts spent the most ($19), traveled the farthest (12.4 miles), and visited the 33
market more than any other segment (8.7 times). 34

4
1. Introduction 35
Farmers’ markets have experienced brisk growth in recent years; however, slowly rising 36
sales question the sustainability of the industry. From 2000 to 2005, the number of famers’ 37
markets in the United States (U.S.) grew 43%. However, sales lagged, growing at 2.5% each 38
year (Ragland and Tropp, 2009). In 2005, annual sales for farmers’ markets in the United States 39
were $242,500 (Ragland and Tropp, 2009). Farmers’ markets that took the initiative to learn 40
more about customers reported higher sales than markets that did not. However, only 27.6% of 41
farmers’ market managers conducted surveys to learn the needs and preferences of their 42
consumers (Ragland and Tropp, 2009). 43
Farmers’ market managers are seeking ways to learn about their customers and how to 44
effectively promote to their target markets. Consumer segmentation is a technique commonly 45
used by traditional retail mangers to classify customers based on needs, preferences, behaviors, 46
and demographics (Reynolds et al., 2002). Consumer segmentation is vital to the farmers’ market 47
industry to take steps toward overcoming challenges, increasing profitability and sustainability. 48
Therefore, the objective of this study is to identify preference based segments in farmers’ market 49
consumers using self-reported psychographic, behavioral, and demographic characteristics of 50
Metropolitan consumers in Indiana and Illinois and to evaluate their differences. 51
Consumer Segmentation 52
Consumer segmentation is a technique used to classify consumers into groups based on 53
factors such as consumption trends, behaviors, and preferences. Consumer segmentation has 54
been used in previous research to better understand customers and to build a foundation for 55
better promotion and marketing (Elepu, 2005; Coca-Cola Retailing Research Foundation, 2004; 56
Reynolds et al., 2002). Past research has focused on consumers of retail shopping outlets such as 57
5
malls or grocery stores (Coca-Cola Retailing Research Foundation, 2004; Reynolds et al., 2002). 58
Elepu (2005), to date, is the only study to segment farmers’ market consumers. These studies are 59
examined in detail below. 60
Reynolds et al., (2002), focused on developing retail shopper types and determining the 61
difference between the attitudes and preferences of traditional versus factory outlet mall 62
shoppers. Shoppers at traditional and outlet malls participated in an intercept survey and ranked 63
market attributes such as cleanliness, number of stores and safety as “not important” (1) to 64
“extremely important” (7). From the cluster analysis, six shopper types were identified: Basic, 65
Apathetic, Destination, Enthusiasts, Serious, and Brand Seekers. All shopper type descriptions 66
were similar for traditional and factory outlet malls except for the Brand Seekers segment, which 67
did not exist for traditional mall shoppers and was exclusive to the factory outlet mall shopper 68
group. “Brand Seekers” were most concerned with brand name merchandise above all other 69
factors and enjoyed the shopping experience. 70
According to the Coca-Cola Retailing Research Council of North America (2004), 71
consumers were categorized into different segments based on their need states or purpose for 72
shopping. Shoppers were surveyed and interviewed in online panels and week-long focus groups. 73
Based on ratings from store attributes and attitudes towards grocery shopping, consumers 74
shopped for different reasons each time; therefore they were categorized based upon reasons 75
called “need states”. Need states refer to specific needs a shopper brings to a shopping trip, 76
which may strongly influence their purchasing decisions and can change from one occasion to 77
the next. The nine segments of consumers in this study were: Care For Family, Smart Budget 78
Shopping, Discovery, Efficient Stock-Up, Specific Item, Bargain-Hunting Among Stores, 79
Reluctance, Small Basket Grab and Go and Immediate Consumption (Coca-Cola Retailing 80
6
Research Council, 2004). This study helped retailers, specifically the Coca-Cola Company, make 81
a beneficial connection with consumers. 82
Elepu (2005) used the two previous studies (Reynolds et al., 2002 and The Coca Cola 83
Research Foundation, 2004) to examine whether differences existed in urban farmers’ market 84
consumers. An intercept survey was conducted at six urban and suburban farmers’ markets in 85
Illinois. Five segments existed including: Basic, Serious, Enthusiast, Recreational and Low-86
involved. Overall, consumers were Caucasian, female, between the ages of 35 and 44, primary 87
shoppers of food, college graduates, working professionals, with an annual income of $100,000 88
or greater, living in two person households (Elepu, 2005).Based on these studies, hypothesis one 89
was formed. 90
H1: Preference based segments exist for farmers’ market consumers in Metropolitan areas 91
in Indiana and Illinois. 92
2. Methodology 93
In the spring 2005 and fall 2009, consumer intercept surveys were conducted at Illinois and 94
Indiana farmers’ markets, respectively, to evaluate consumer preferences for farmers’ market 95
attributes. Data were collected using a written survey administered face-to-face to farmers’ 96
market consumers. Indiana farmers’ markets were selected from the Indiana AgroTourism 97
Directory published by the Indiana State Department of Agriculture. Illinois markets were 98
selected to include a stratified sample of urban and suburban markets from the USDA National 99
Directory of Farmers’ Markets. Using census data on population categories, markets categorized 100
as Metropolitan cities (cities with 50,000 residents or more) were selected (OMB, 2008). Using a 101
random number generator, Indiana markets were selected using the same selection method as 102
Elepu (2005). The cities surveyed in Indiana were South Bend and Bloomington. The cities 103

7
surveyed in Illinois were Springfield, and Peoria. Farmers’ market managers were contacted to 104
obtain permission to conduct intercept surveys taking place at their market. Upon approval from 105
each market, dates were scheduled and surveys were collected. Surveys were completed on a 106
voluntary, anonymous basis by consumers present at each market. 107
The survey focused on demographics, importance of market attributes and behavioral trends 108
at the market. In total, 165 of the 196 Metropolitan surveys were usable. One hundred and five 109
surveys were collected in Indiana, 78 of which were fully completed by respondents and used in 110
this study. One hundred and forty-eight metropolitan surveys were collected in Illinois, 87 of 111
which were fully completed and used in this study. 112
The first section of the survey, questions one through eleven, asked respondents about their 113
motivations for shopping, consumption trends, frequency of visits to the market, market location, 114
frequency of visits to other markets and attitudes towards farmers’ markets. Section two, 115
questions twelve through fourteen, focused on consumer’s attitudes toward farmers’ markets and 116
farmers’ market attributes. Question twelve was a seven-point Likert scale that asked 117
respondents to indicate the level of importance they attached to the 23 market attributes listed, 118
where one meant “not at all important” and seven meant “very important” (Figure 1.1). Section 119
three, questions fifteen through twenty-two, asked for demographic information such as gender, 120
age, number of individuals living in the household, zip code, primary shopper status, education 121
level, ethnicity, and income level. Demographic characteristics were categorized as: age, gender, 122
education, ethnicity, household size, primary shopper, and income. 123
A multi-step cluster analysis was used to segment consumers. Multi-step cluster analysis has 124
been used in previous consumer segmentation studies (Elepu, 2005; Reynolds et al., 2002; Bloch 125
et al., 1994; and Darden and Ashton, 1974). Multi-step cluster analysis uses factor analysis, 126

8
Ward’s clustering method and K-means clustering. A factor analysis was conducted in SPSS 127
(The Statistical Package for Social Scientists) for data reduction of the Likert scale variables 128
(Table 1) (SPPS 17.0, 2010). Component factors were then used to form consumer segments 129
with Ward’s hierarchical clustering method. Cluster centers were identified by performing the k-130
means analysis method (Table 2). An Analysis of Variance (ANOVA) test was used along with 131
k-means analysis to identify statistical significance of component factors. Factor analysis was 132
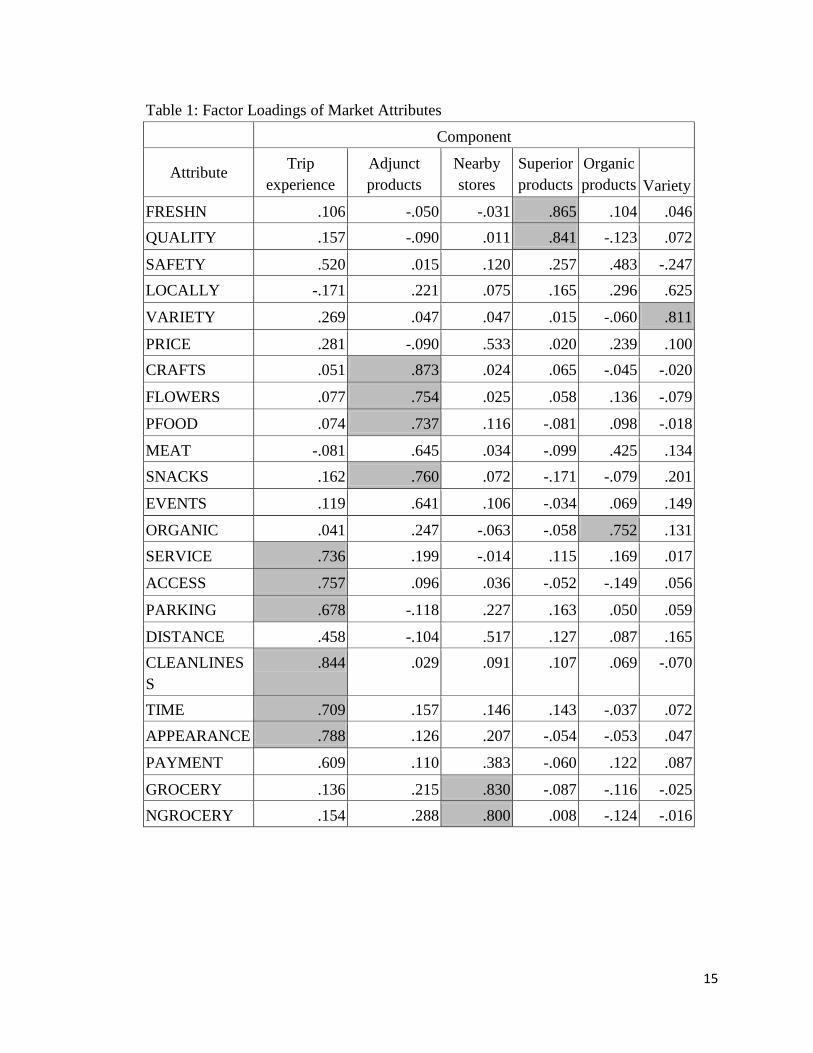
used to reduce the number of market attributes into component factors. There were 23 market 133
attributes used in the survey. The component factors identified accounted for 64.2% of the 134
variance. Six component factors were named: trip experience, adjunct products, nearby stores, 135
superior produce, organic produce and variety (Table 1). These factors were then used to identify 136
consumer segments. 137
Consumer Segmentation 138
The Ward’s cluster method, a hierarchical clustering technique, was used to identify outliers 139
to establish the number of clusters. One outlier was identified and eliminated leaving 164 140
observations to be further analyzed. Output from the hierarchical cluster analysis gave the option 141
of three, four or five clusters. The four cluster option was distinct and the dendogram showed 142
four clusters as the optimal solution (data not shown). To determine the number of the clusters, 143
points where the distance agglomeration coefficients changed drastically were also identified. In 144
this case, the increase was at observation 160 which was subtracted from the number of 145
observations (164) for a total of four clusters. The initial conclusion of four distinct clusters was 146
further validated by examining the dendogram and using the agglomeration coefficients 147
technique. 148
The initial cluster seeds derived from the Ward’s method were used in the k-means method 149

9
to obtain final clusters of consumers. Clusters were named based on their preferences for 150
component factors (Table 2) and were given the following names: Recreational Shoppers, 151
Minimalists, Time-challenged Shoppers, and Enthusiasts. ANOVA results indicated that each 152
component factor was statistically significant (Table 3). 153
3. Results 154
Overall Demographics of Sample 155
The highest percentage of respondents were Caucasian (85.3%), female (78%), between the 156
ages of 55 and 64 (27%), primary shoppers of food (73%), in a two-person household (44%), 157
with a post graduate degree (36.2%), and annual income between $50,000 and $74,999 (29.6%), 158
(Table 4). These findings were consistent with previous literature that found farmers’ market 159
consumers were typically Caucasian, female, middle aged, middle class, primary shoppers, with 160
some form of college degree (Kezis et al., 1998; Govindasamy et al., 1996; Govindasamy et al., 161
1998; Otto and Varner 2005; Onianwa, Mojica and Wheelock, 2006; Rainey and Vetter, 2009; 162
Zepeda and Li, 2006; Bond, Thilmany and Bond, 2009). Thus data are presumed to be 163
representative of farmers’ market consumers. 164
Recreational Shoppers were the largest consumer segment, accounting for 42% of the total 165
sample. This segment traveled an average of 10 miles to the market, visited the market an 166
average of 2.5 times during the season, visited other markets an average one time per season and 167
spent an average of $16 per trip (Table 5). Demographically, the highest percentage of 168
Recreational Shoppers were (75.4%), mostly between the ages of 45-54 (29.4%), Caucasian 169
(85.3%), primary shoppers of food (72.1%) of a two person household (42.6%) with annual 170
income of $50,000 to $74,999 (32.3%) (Table 6). This segment also had the highest percentage 171
of respondents that identified themselves as “post-graduates” at 42.6 % (Table 6). Recreational 172

10
Shoppers placed value on nearby stores, superior products, organic products and variety based on 173
positive standardized factor scores (Table 2). Recreational Shoppers were most likely attending 174
the market to enjoy the atmosphere and browsing, but were not interested in any extra amenities 175
the market had to offer. 176
Minimalists were the second largest segment group, consisting of 27% of the total sample. 177
On average, Minimalists shoppers traveled approximately four miles to the market, visited the 178
market one time during the season and spent $17 per trip (Table 5). Demographically, 179
Minimalists were female (86.4%), mostly between the ages of 45-64 (27.3%), post graduates 180
(36.4%), living in a two person household (47.7%), with an annual income between $20,000 and 181
$49,000 (34.3%) (Table 6). These shoppers placed value on trip experience and superior 182
products based on positive standardized factor scores (Table 2). 183
Enthusiasts accounted for 23% of the total sample. Enthusiasts were predominately 184
Caucasian, (80.6%), female (77.8%), primary shoppers of food (69.4%), mostly between the 185
ages of 55 and 64 (50%), living in a two-person household (42.9%), with an annual income 186
between $50,000 and $74,999 (29.4%), and had completed “some college” (41.7%) (Table 6). 187
Enthusiasts had a preference for trip experience, adjunct products, nearby stores, superior 188
products, and organic products based on positive standardized factors (Table 2). Enthusiasts 189
were generally very dedicated and loyal to the market and loved every aspect of shopping. 190
Enthusiasts traveled an average of 12 miles to the market, visited the market an average of nine 191
times per season and spent an average of $19 per trip (Table 5). 192
Time-challenged Shoppers accounted for 8% of the total sample, ranking fourth in size of the 193
consumer segments. This segment reported traveling an average of three miles to the market, 194
visiting five times during the season, visiting other markets once per season and spending $14 195
11
per trip (Table 5). Time-challenged Shoppers were mostly female (53.8%), between the ages of 196
25-34 and 45-54 (23.1 %) respectively, college graduates (46.2%), Caucasian (84.6%), living in 197
a household with one to three individuals (69.3%), primary shoppers (53.8%), with an annual 198
income between $75,000 and $99,000 (38.5%) (Table 6). Nearby stores was the only component 199
factor that was of importance to these shoppers based on positive standardized factor scores 200
(Table 2). The presence of nearby stores was important because Time-challenged Shoppers most 201
likely planned to visit a grocery or other retail outlet in conjunction with their farmers’ market 202
trip. These shoppers are most likely to only buy a few items from the farmers’ market and then 203
complete the remainder of their shopping at other stores. 204
A chi-square test was run to determine statistical significance in behavioral characteristics 205
amongst clusters. Consumer segments were significantly different in average amount spent per 206
visits, frequency of visits to the survey market per season, frequency of visits to other markets 207
per season, and distance traveled to the market per trip (Table 8). Therefore, hypothesis one is 208
supported. 209
4. Summary, Conclusion, and Implications 210
This study showed differences existed in preferences for farmers’ market consumers in 211
Metropolitan areas in Indiana and Illinois. Four preference based segments for Metropolitan 212
farmers’ market consumers in Indiana and Illinois were identified and further distinguished by 213
behavioral and demographic characteristics. 214
There are differences in preferences, behavioral characteristics and demographics among 215
segments. Farmers’ market consumers shop based on preferences for market attributes. Thus, it 216
is beneficial for market managers to take these factors into consideration when evaluating their 217
target market. This information can be used to the benefit of farmers’ markets across the U.S. as 218

12
it provides a basis for the development of promotional and marketing techniques. For instance, 219
since nearby stores was an important factor for three of the four segments (Enthusiasts, 220
Recreational, and Time-challenged) a new market manager may find it beneficial to consider 221
proximity of the market to nearby stores when planning to start a market. An existing market 222
manager may try to develop promotional strategies to attract consumers that visit the least, in this 223
case Minimalists. 224
13
Bloch, P. H., Ridgway, N. M., & Dawson, S. A. (1994). The shopping mall as consumer 226 habitat. Journal of Retailing, 70, 23–23. 227
Literature Cited 225
Bond, J. K., Thilmany, D., & Bond, C. (2009). What Influences Consumer Choice of Fresh 228 Produce Purchase Location? Journal of Agricultural and Applied Economics, 41(01). 229
Coca-Cola Retailing Research Council. (2004) “The World According to Shoppers: 230 Different Days, Different Needs.” Study Conducted by TNS NFO, 41 Pp 231
Darden, W. R., & Ashton, D. (1974). Psychographic profiles of patronage preference 232 groups. Journal of Retailing, 50(4), 99–112. 233
Elepu, G. (2005). Urban and suburban farmers markets in Illinois: a comparative analysis of 234 consumer segmentation using demographics, preferences and behaviors. PhD Thesis, 235 University of Illinois at Urbana Champaign, Urbana. 236
Govindasamy, R., & Nayga Jr, R. M. (1996). Characteristics of farmer-to-consumer direct 237 market customers: an overview. Journal of Extension, 34(4). 238
Govindasamy, R., Zurbriggen, M., Italia, J., Adelaya, A., Nitzsche, P., & VanVranken, R. 239 (1998). Farmers Markets: Consumer Trends, Preferences and Characteristics, New 240 Jersey Agricultural Experiment Station. 241
Kezis, A., Gwebu, T., Peavey, S., & Cheng, H. T. (1998). A study of consumers at a small 242 farmers' market in Maine: results from a 1995 survey. Journal of Food Distribution 243 Research, 29, 91–99. 244
Oberholtzer, L., & Grow, S. (2003). Producer-Only Farmers’ Markets in the Mid-Atlantic 245 Region. Arlington va: Henry A. Wallace Center for Agricultural and Environmental 246 Policy at Winrock International. 247
OMB. (2008, November 20). Update of statistical area definitions and guidance on their uses. 248 Retrieved from http://www.whitehouse.gov/omb/bulletins/fy2007/b0701.pdf 249
250
Onianwa, O., Mojica, M., & Wheelock, G. (2006). Consumer Characteristics and Views 251 Regarding Farmers Markets: An Examination of On-Site Survey Data of Alabama 252 Consumers. Journal of Food Distribution Research, 37(1), 119. 253
Otto, D., & Varner, T. (2005). Consumers, Vendors, and the Economic Importance of Iowa 254 Farmers’ Markets: An Economic Impact Survey Analysis. Iowa State University, 255 Leopold Center for Sustainable Agriculture. March. 256
14
Ragland , E, & Tropp, D. (2009, May). Usda national farmers' market manager survey. 257 Retrieved from 258 http://www.ams.usda.gov/AMSv1.0/getfile?dDocName=STELPRDC5077203 259
Rainey, R, & Vetter, A. (2009). Understanding direct markets: characteristics of the farmers’ 260 market consumer. Retrieved from 261 http://www.uark.edu/afma/Meetings/2009%20AFMA%20Survey%20Handout.pd f 262
Reynolds, K. E., Ganesh, J., & Luckett, M. (2002). Traditional malls vs. factory outlets: 263 comparing shopper typologies and implications for retail strategy. Journal of Business 264 Research, 55(9), 687–696. 265
SPSS for Windows, Release 17.0. 2010. Chicago: SPSS, Inc. 266
Zepeda, L., & Li, J. (2006). Who Buys Local Food? Journal of Food Distribution 267 Research, 37(3), 1. 268
269
15
Table 1: Factor Loadings of Market Attributes Component
Attribute Trip experience
Adjunct products
Nearby stores
Superior products
Organic products Variety
FRESHN .106 -.050 -.031 .865 .104 .046 QUALITY .157 -.090 .011 .841 -.123 .072
SAFETY .520 .015 .120 .257 .483 -.247 LOCALLY -.171 .221 .075 .165 .296 .625
VARIETY .269 .047 .047 .015 -.060 .811
PRICE .281 -.090 .533 .020 .239 .100 CRAFTS .051 .873 .024 .065 -.045 -.020
FLOWERS .077 .754 .025 .058 .136 -.079
PFOOD .074 .737 .116 -.081 .098 -.018
MEAT -.081 .645 .034 -.099 .425 .134 SNACKS .162 .760 .072 -.171 -.079 .201
EVENTS .119 .641 .106 -.034 .069 .149
ORGANIC .041 .247 -.063 -.058 .752 .131 SERVICE .736 .199 -.014 .115 .169 .017
ACCESS .757 .096 .036 -.052 -.149 .056
PARKING .678 -.118 .227 .163 .050 .059
DISTANCE .458 -.104 .517 .127 .087 .165 CLEANLINESS
.844 .029 .091 .107 .069 -.070
TIME .709 .157 .146 .143 -.037 .072 APPEARANCE .788 .126 .207 -.054 -.053 .047
PAYMENT .609 .110 .383 -.060 .122 .087
GROCERY .136 .215 .830 -.087 -.116 -.025 NGROCERY .154 .288 .800 .008 -.124 -.016

16
Table 2: Final Cluster Centers Based on Standardized Factor Scores
Recreational Minimalists Enthusiasts Time-challenged
Trip Experience -.28628 .39514 .23248 -.49749
Adjunct Products -.35555 -.57278 1.39178 -.24252
Nearby Stores .07500 -.34285 .18895 .21004
Superior Products .14091 .29147 .22346 -2.38762
Organic .46565 -.80579 .12754 -.11700
Variety .53875 -.40109 -.31881 -.57008
Total 69 44 38 13
Table 3: ANOVA of Component Factors Cluster Error
F Sig. Component Mean
Square df Mean
Square df Trip Experience 5.932 3 .908 160 6.537 .000 Adjunct Products 32.510 3 .409 160 79.450 .000
Nearby Stores 2.497 3 .972 160 2.569 .056
Superior Produce 27.038 3 .512 160 52.832 .000 Organic Products 14.776 3 .742 160 19.921 .000
Variety 11.731 3 .799 160 14.686 .000

17
Table 4: Metropolitan Consumer Demographic Characteristics Characteristic Percentage Gender Male 22.0% Female 78.0% Age Under 25 6.5% 25-34 8.6% 35-44 20.5% 45-54 24.4% 55-64 27.0% 65 and over 13.0% Education Some high school 1.1% High school graduate 8.1% Some college 25.4% College graduate 29.2% Post-graduate 36.2% Ethnicity Black 7.7% Caucasian 85.3% Asian 2.2% Hispanic 1.1% Native Hawaiian Pacific
Islander 1.6% American Indian 0.5% Other 1.6% Household 1 19.6% 2 44.0% 3 14.1% 4 14.7% 5 4.9% 6 2.7% Primary Shopper Yes 73.0% No 27.0% Income Less than $20,000 14.2%
$20,000-49,000 25.4% $50,000-74,999 29.6% $75,000-99,999 16.0% $100,000 and over 14.8%
18
Table 5: Behavioral Characteristics by Segment
Characteristic Recreational Minimalists Enthusiasts Time-challenged
Average Money Spent (Dollars)
$16 $17 $19 $14
Average Number of Visits to Market
2.5 1 8.7 5.0
Number of other FMs visited
1.2 .4 .5 1.2
Average Distance Traveled (Miles)
10.3 4.3 12.4 3.3
19
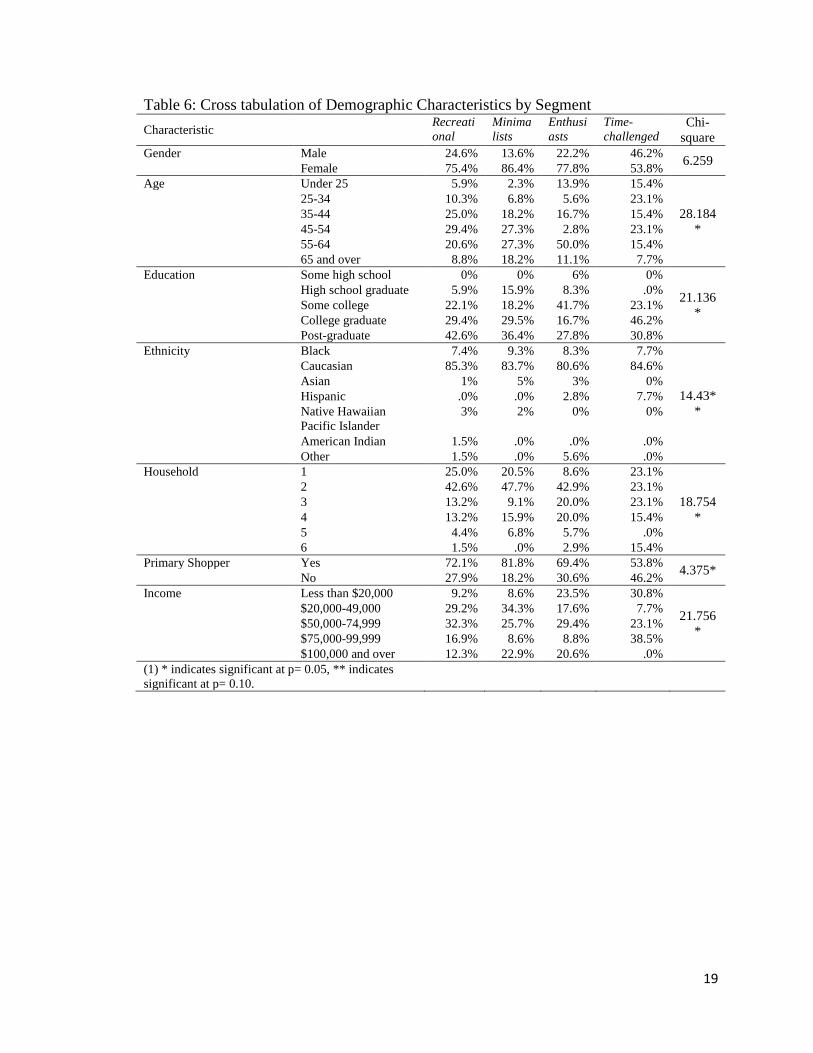
Table 6: Cross tabulation of Demographic Characteristics by Segment Characteristic Recreati
onal Minimalists
Enthusiasts
Time-challenged
Chi-square
Gender Male 24.6% 13.6% 22.2% 46.2% 6.259 Female 75.4% 86.4% 77.8% 53.8% Age Under 25 5.9% 2.3% 13.9% 15.4%
28.184*
25-34 10.3% 6.8% 5.6% 23.1% 35-44 25.0% 18.2% 16.7% 15.4% 45-54 29.4% 27.3% 2.8% 23.1% 55-64 20.6% 27.3% 50.0% 15.4% 65 and over 8.8% 18.2% 11.1% 7.7% Education Some high school 0% 0% 6% 0%
21.136*
High school graduate 5.9% 15.9% 8.3% .0% Some college 22.1% 18.2% 41.7% 23.1% College graduate 29.4% 29.5% 16.7% 46.2% Post-graduate 42.6% 36.4% 27.8% 30.8% Ethnicity Black 7.4% 9.3% 8.3% 7.7%
14.43**
Caucasian 85.3% 83.7% 80.6% 84.6% Asian 1% 5% 3% 0% Hispanic .0% .0% 2.8% 7.7% Native Hawaiian
Pacific Islander 3% 2% 0% 0%
American Indian 1.5% .0% .0% .0% Other 1.5% .0% 5.6% .0% Household 1 25.0% 20.5% 8.6% 23.1%
18.754*
2 42.6% 47.7% 42.9% 23.1% 3 13.2% 9.1% 20.0% 23.1% 4 13.2% 15.9% 20.0% 15.4% 5 4.4% 6.8% 5.7% .0% 6 1.5% .0% 2.9% 15.4% Primary Shopper Yes 72.1% 81.8% 69.4% 53.8% 4.375* No 27.9% 18.2% 30.6% 46.2% Income Less than $20,000 9.2% 8.6% 23.5% 30.8%
21.756*
$20,000-49,000 29.2% 34.3% 17.6% 7.7% $50,000-74,999 32.3% 25.7% 29.4% 23.1% $75,000-99,999 16.9% 8.6% 8.8% 38.5%
$100,000 and over 12.3% 22.9% 20.6% .0% (1) * indicates significant at p= 0.05, ** indicates significant at p= 0.10.
20
Table 7: Consumer Behavior Matrix-Average Spent and Distance Traveled
Average Distance Traveled
Low High
Average $ Spent
Low Time-challenged Recreational
High Minimalists Enthusiasts

Table 8: Cross tabulation of Behavioral Characteristics by Segment Characteristic Recreational Minimalists Enthusiasts Time-challenged Chi-square Frequency of Visits to Survey Market 0-10 94.10% 97.70% 80.00% 92.30%
62.27** 11-20 2.90% 2.30% 5.70% 0.00% >20 2.90% 0.00% 14.30% 7.70% Frequency of Visits to Other Markets 0 33.30% 59.10% 52.80% 46.20%
39.85* 1 63.80% 38.60% 41.70% 30.80%
2 0.00% 2.30% 5.60% 7.70%
>3 2.90% 0.00% 0.00% 15.40% Average Money Spent per Visit $0-10 43.50% 41.90% 28.90% 53.80%
83.00** $11-20 37.70% 34.90% 42.10% 38.50% $21-40 17.40% 20.90% 23.70% 0.00% $>40 1.40% 2.30% 5.30% 7.70% Average Distance Traveled per Visit 0-10 76.80% 93.00% 75.70% 92.30%
108.12** 11-20 17.40% 7.00% 16.20% 7.70% >20 5.80% 0.00% 8.10% 0.00% (1) * indicates significant at p=0.01, ** indicates significant at p=0.10

22
Figure 1.1: Likert Scale Question from Survey
Please indicate the level of importance you attach to each of the following market attributes when deciding to come to shop at this farmers’ market. Please rate each item on a scale of 1 to 7(1 = not at all important and 7 = extremely important). Please attach a rating of 1-7 to each item depending on its level of importance to you.
Freshness
Loud Music
Quality
Food safety
Presence of locally grown produce
Product variety
Price of products
Customer service
Accessibility of market
Availability of parking space
Distance to market
Non-local products
Cleanliness of market
Hours of operation of market
Presence of crafts
Presence of flowers/shrubs/herbs
Presence of meat and poultry
Presence of processed food products (i.e., cheese, jellies, jam, etc.)
Presence of food for on-site consumption
Social events/entertainment
Presence of organic produce
Physical appearance of market
Method of payment at market
Presence of nearby grocery stores
Presence of nearby non-grocery stores
Other (please specify) ________________