a java framework for data sonification and 3d … · a java framework for data sonification and 3d...
TRANSCRIPT

A JAVA FRAMEWORK FOR DATA SONIFICATION AND 3D GRAPHICRENDERING
Domenico VicinanzaUniversity of Salerno - Musica inaudita
Department of Mathematics and Computer [email protected]
ABSTRACT
Data audification is the representation of data by meansof sound signals (waveforms or melodies typically). Al-though most data analysis techniques are exclusively vi-sual in nature, data presentation and exploration systemscould benefit greatly from the addition of sonification ca-pabilities. In addition to that, sonic representations areparticularly useful when dealing with complex, high-di-mensional data, or in data monitoring or analysis taskswhere the main goal is the recognition of patterns and re-current structures.
The main goal of this paper is to briefly present the au-dification process as a mapping between a discrete data setand a discrete set of notes (we shall deal with MIDI repre-sentation), and look at a couple of different examples fromtwo well distinguished fields, geophysics and linguistics(seismograms sonificaton and text sonification). Finallythe paper will present another example of the mappingbetween data sets and other information, namely a 3Dgraphic image generation (rendered with POVRay) drivenby the ASCII text.
1. ABOUT DATA AUDIFICATION
Data audification is the representation of data by soundsignals; it can be considered as the acoustic counterpartof data graphic visualization, a mathematical mapping ofinformation from data sets to sounds. In the past twentyyears the word audification has acquired a new meaningin the world of computer music, computer science, andauditory display application development.
Data audification is currently used in several fields, fordifferent purposes: science and engineering, education andtraining, in most of the cases to provide a quick and effec-tive data analysis and interpretation tool [3]. Althoughmost data analysis techniques are exclusively visual in na-ture (i.e. are based on the possibility of looking at graphi-cal representations), data presentation and exploration sys-tems could benefit greatly from the addition of sonifica-tion capabilities. In addition to that, sonic representationsare particularly useful when dealing with complex, high-dimensional data, or in data monitoring tasks where it ispractically impossible to use the visual inspection. Moreinteresting and intriguing aspects of data sonification con-
cern the possibility of describing patterns or trends, throughsound, which were hardly perceivable otherwise.
Moreover in many cases human ears are used to dis-cover slight changes in acoustic patterns. One example isthe medicine who routinely applies acoustic data analy-sis when uses the stethoscope to listen to breath noise andheart tones. Audification may give information about theinner structure of the represented data using the power ofan abstract description. Any kind of regularity in the orig-inal data set will be reflected to the aural signal generatedby the audification algorithm.
One of the most important challenges is finding theproper balance between the amount of information thatcan be converted into an audio signal and the effective ca-pability of that sound to communicate meaningful infor-mation to a listener.
2. MIDI ”MELODISATION” OF A DISCRETEDATA SET
The melodisation of a data set, i.e. the creation of a melodystarting from a list of data is an interesting way to convertinto aural signals, almost any kind of information. For thesake of simplicity we can imagine a set ofm elements (alist or a discrete set of values) to be sonified. The sonifi-cation will provide a melody, a list of notes chosen amonga set ofn notes, to be drawn onto a pentagram. Withoutloose of generality, we can consider a standard, numerical,coding convention for the (well tempered) notes to be rep-resented. In particular we shall refer to the MIDI1 code,according to which the central ”C” note corresponds to theinteger 60, ”C#” is 61, ”D” is 62, and so on (any semitoneshift will add or subtract one from that previous value).The lowest acceptable MIDI value is 0 and the higher is127, so there are 128 possible notes to represent our data.
From a mathematical point of view the MIDI melodis-ation (the set of possibile notes is 128, son = 128) couldbe considered as a map between two discrete set,
Zm → Z128
1 The original Musical Instrument Digital Interface (MIDI) specifi-cation defined a physical connector and message format for connectingdevices and controlling them in ”real time”. A few years later StandardMIDI Files were developed as a storage format so performance informa-tion could be recalled at a later date.
which have to preserve the structural properties of the orig-inal data (such as the invariance with respect to a certainsymmetry group, as it will be shawn in the next sections).
Compared to other sonifications methods, the MIDIsonification has the great advantage to code informationinto one of the most widely used musical format. Almostall the applications for music analysis/sequencing are ableto operate and play MIDI files in extremely customiz-able manners. Moreover many programming languages,as Java for example, have the possibility to load and usespecial libraries to efficiently manage them (see for exam-ple jMusic2 [4]).
Finally several tools have been developed to analyzeand process MIDI files, to discover self-similarities, repe-tition of microstructures, statistical diagrams (one for all,the well known ”MIDI toolbox” written by Petri Toivi-ainen [6]).
3. MIDI SONIFICATION OF MT. ETNAVOLCANO SEISMOGRAMS
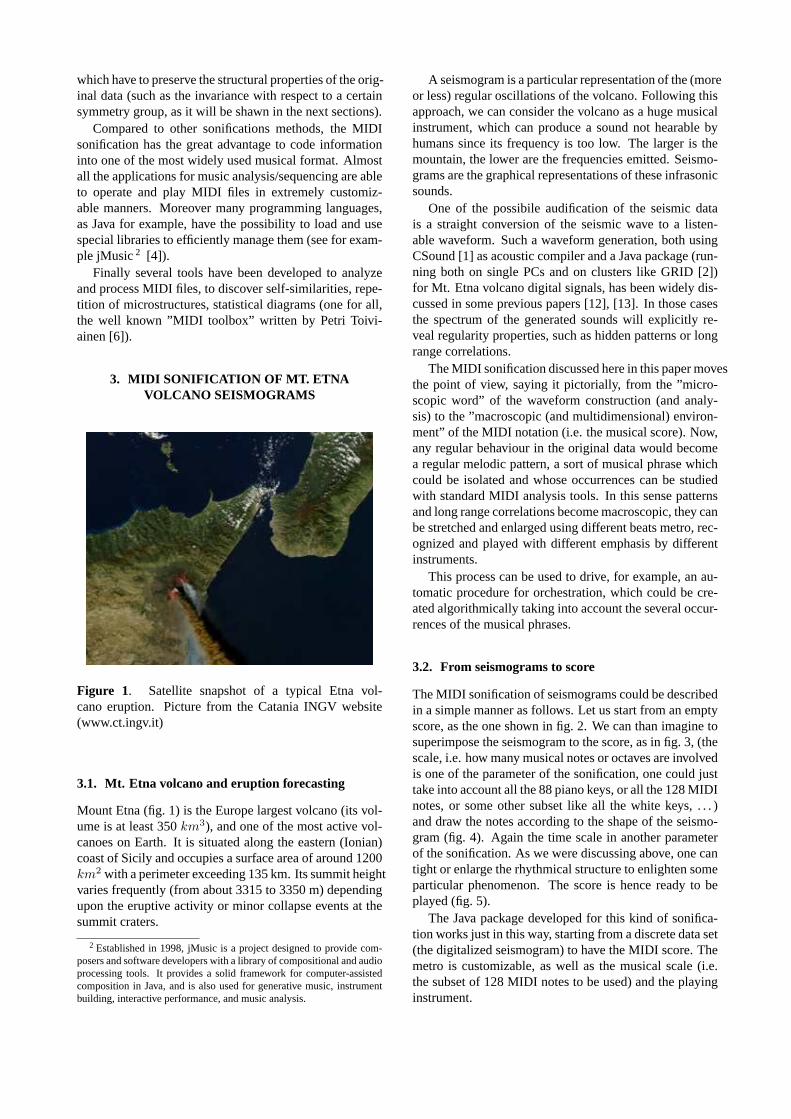
Figure 1. Satellite snapshot of a typical Etna vol-cano eruption. Picture from the Catania INGV website(www.ct.ingv.it)
3.1. Mt. Etna volcano and eruption forecasting
Mount Etna (fig. 1) is the Europe largest volcano (its vol-ume is at least 350km3), and one of the most active vol-canoes on Earth. It is situated along the eastern (Ionian)coast of Sicily and occupies a surface area of around 1200km2 with a perimeter exceeding 135 km. Its summit heightvaries frequently (from about 3315 to 3350 m) dependingupon the eruptive activity or minor collapse events at thesummit craters.
2 Established in 1998, jMusic is a project designed to provide com-posers and software developers with a library of compositional and audioprocessing tools. It provides a solid framework for computer-assistedcomposition in Java, and is also used for generative music, instrumentbuilding, interactive performance, and music analysis.
A seismogram is a particular representation of the (moreor less) regular oscillations of the volcano. Following thisapproach, we can consider the volcano as a huge musicalinstrument, which can produce a sound not hearable byhumans since its frequency is too low. The larger is themountain, the lower are the frequencies emitted. Seismo-grams are the graphical representations of these infrasonicsounds.
One of the possibile audification of the seismic datais a straight conversion of the seismic wave to a listen-able waveform. Such a waveform generation, both usingCSound [1] as acoustic compiler and a Java package (run-ning both on single PCs and on clusters like GRID [2])for Mt. Etna volcano digital signals, has been widely dis-cussed in some previous papers [12], [13]. In those casesthe spectrum of the generated sounds will explicitly re-veal regularity properties, such as hidden patterns or longrange correlations.
The MIDI sonification discussed here in this paper movesthe point of view, saying it pictorially, from the ”micro-scopic word” of the waveform construction (and analy-sis) to the ”macroscopic (and multidimensional) environ-ment” of the MIDI notation (i.e. the musical score). Now,any regular behaviour in the original data would becomea regular melodic pattern, a sort of musical phrase whichcould be isolated and whose occurrences can be studiedwith standard MIDI analysis tools. In this sense patternsand long range correlations become macroscopic, they canbe stretched and enlarged using different beats metro, rec-ognized and played with different emphasis by differentinstruments.
This process can be used to drive, for example, an au-tomatic procedure for orchestration, which could be cre-ated algorithmically taking into account the several occur-rences of the musical phrases.
3.2. From seismograms to score
The MIDI sonification of seismograms could be describedin a simple manner as follows. Let us start from an emptyscore, as the one shown in fig. 2. We can than imagine tosuperimpose the seismogram to the score, as in fig. 3, (thescale, i.e. how many musical notes or octaves are involvedis one of the parameter of the sonification, one could justtake into account all the 88 piano keys, or all the 128 MIDInotes, or some other subset like all the white keys, . . . )and draw the notes according to the shape of the seismo-gram (fig. 4). Again the time scale in another parameterof the sonification. As we were discussing above, one cantight or enlarge the rhythmical structure to enlighten someparticular phenomenon. The score is hence ready to beplayed (fig. 5).
The Java package developed for this kind of sonifica-tion works just in this way, starting from a discrete data set(the digitalized seismogram) to have the MIDI score. Themetro is customizable, as well as the musical scale (i.e.the subset of 128 MIDI notes to be used) and the playinginstrument.

Figure 2. From volcano seismograms to score: we startfrom an empty score
Figure 3. From volcano seismograms to score: we super-impose the seismogram
Figure 4. From volcano seismograms to score: we putnotes according to the shape of the seismogram
Figure 5. From volcano seismograms to score: finally weget the melody
Following this procedure, we shall get a melody whoseprofile follows perfectly the shape and the behaviour ofthe seismograms, reproducing the oscillation amplitudevariations and giving a quick and effective insight to theiroverall structural properties.
Some examples of this sonification can be listened fromthe Mt. Etna volcano sonification web site,http://grid.ct.infn.it/etnasound , where itis also possible to download the PDF scores of such soni-fications.
4. ANOTHER EXAMPLE: TEXT SONIFICATION
We have already observed that any kind of regularity ofthe original data set will be conveyed to the aural sig-nal generated by the audification algorithm. Let us studya particular case of audification, where this ”informationtransfer” is particularly easy to observe: the text messagessonification.
During the first decades of the XI Century, Guido Mo-naco, also known as Guido d’Arezzo (990-1050 ca), aBenedictine Monk who invented the system of staff-notationstill in use, proposed (and used in several musical pieces) amethod to associate a note on the pentagram to each vowelof text to sing. The duration of the notes was dependingupon the number of consonants between each vowel. Thefollowing figure represents an excerpt of a manuscript (itis the ending part of a Gloria) in which the words ”saecu-lorum Amen” have been sonified according to this algo-rithm (”ae” has been sonified as ”e”). The algorithm wasnot strict, in the sense that there was a certain degree offreedom in the choice of notes (according to the compos-ing rules of that age).
In the text sonification, the most natural choice is maybethe following one: ”the same set of characters will returnexactly the same musical phrase” (i.e. the same sequenceof notes), so that one might easily (acoustically) recog-nize words which start with the same root, or end with thesame letters, as rhymes, for examples. In some sense onecan listen to the metric, using melodies.
Figure 6. Manuscript of the final section of ”Gloria Patri”by Guido d’Arezzo. ”Euouae” indicates the vowels of thesyllables of ”saeculorum Amen”[10].
There are many audification possibilities, thanks to dif-ferent possible algorithms to associate notes to the mes-sages, keeping valid the covariance principle. One of thefirst we have implemented is a sort of Java version ofthe original Guido’s method. We proposed other possi-ble sonification algorithms: standard dodecaphonic (chro-matic), whole tone (Debussy style), pentatonic, major di-
atonic, blue scale, plus some other ancient scales (Greekmodes).
In the chromatic mode, the pitch will be chosen ac-cording to the position of the sonified letter (namely itsASCII code) into the English alphabet, so a ”B” will bea semitone higher with respect to a ”A”, a ”D” a thirdminor higher, and so on. The algorithm is case sensi-tive, so that a ”B” will be lower than a ”b”. In addi-tion to that, the duration of the consonants the one of a1/16 note in the MIDI file, while the duration of vowelsis a 1/8 note. Examples can be listened to the websitewww.musicainaudita.it .
In particular they have been developed two differentversion of the program, a first one is able to run offline,taking a text file as input, tested on single computer andlarge clusters (a working demo on clusters is availablewithin the GRID [2] tutor website3 at the URLhttps://grid-tutor.ct.infn.it ). A second im-plementation is an applet (simplified and didactical) di-rectly playable on the web at the URLwww.musicainaudita.it/sonification , whereit has been setup a two voices canon generator (the secondvoice starts exactly one measure after the first one) usingthe ancient Greek scales as pitch sets.
Figure 7. The output of the applet version of the text soni-fication program
4.1. An example: SATOR AREPO TENET OPERAROTAS. Covariance of the MIDI audification undertransformations
Let us consider another example, to make some considera-tion about the sonification process. The sentence ”SATORAREPO TENET OPERA ROTAS” (sometimes called the”sator square” or ”Templar sqare”) is a Latin palindrome(the most ancient have been found in the Pompeii archaeo-logical site, but many of the same palindromes have beendiscovered in several other places), the words of which,when written in a square, may be read top-to-bottom, bottom-to-top, left-to-right, and right-to-left, returning the sameresult. A representation could be given as follows:
3 GRID is the Europen project for the distributed computation
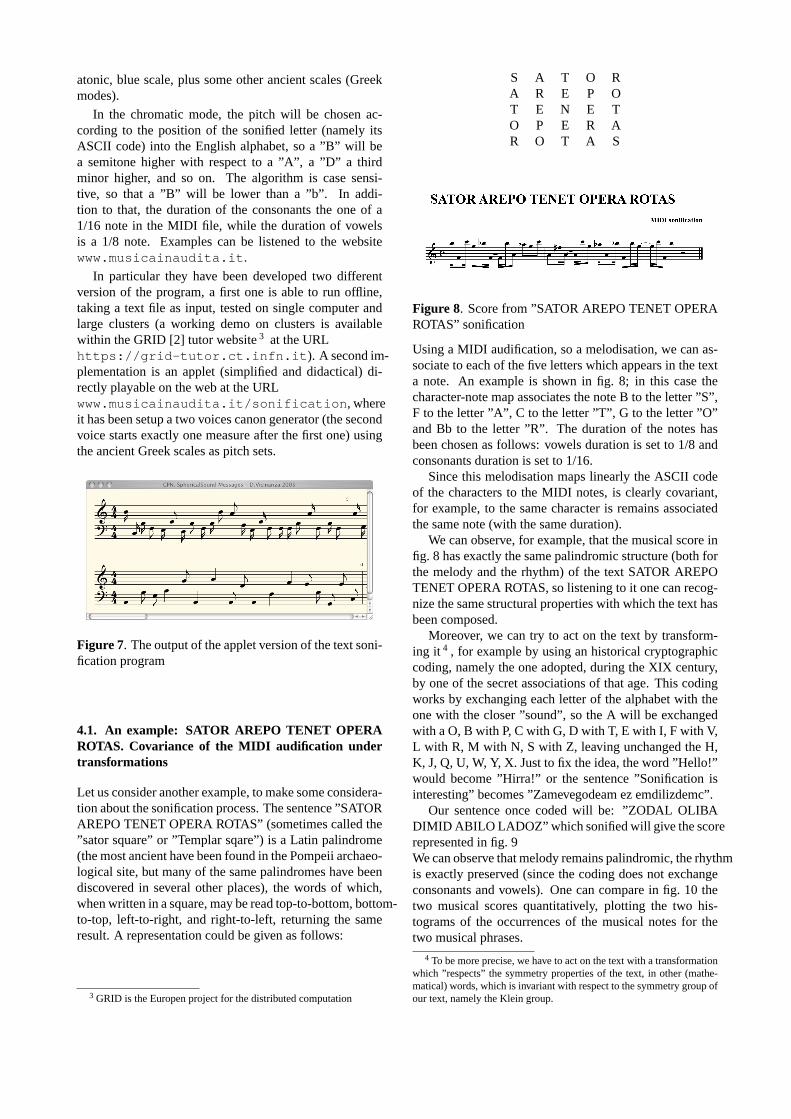
S A T O RA R E P OT E N E TO P E R AR O T A S
Figure 8. Score from ”SATOR AREPO TENET OPERAROTAS” sonification
Using a MIDI audification, so a melodisation, we can as-sociate to each of the five letters which appears in the texta note. An example is shown in fig. 8; in this case thecharacter-note map associates the note B to the letter ”S”,F to the letter ”A”, C to the letter ”T”, G to the letter ”O”and Bb to the letter ”R”. The duration of the notes hasbeen chosen as follows: vowels duration is set to 1/8 andconsonants duration is set to 1/16.
Since this melodisation maps linearly the ASCII codeof the characters to the MIDI notes, is clearly covariant,for example, to the same character is remains associatedthe same note (with the same duration).
We can observe, for example, that the musical score infig. 8 has exactly the same palindromic structure (both forthe melody and the rhythm) of the text SATOR AREPOTENET OPERA ROTAS, so listening to it one can recog-nize the same structural properties with which the text hasbeen composed.
Moreover, we can try to act on the text by transform-ing it 4 , for example by using an historical cryptographiccoding, namely the one adopted, during the XIX century,by one of the secret associations of that age. This codingworks by exchanging each letter of the alphabet with theone with the closer ”sound”, so the A will be exchangedwith a O, B with P, C with G, D with T, E with I, F with V,L with R, M with N, S with Z, leaving unchanged the H,K, J, Q, U, W, Y, X. Just to fix the idea, the word ”Hello!”would become ”Hirra!” or the sentence ”Sonification isinteresting” becomes ”Zamevegodeam ez emdilizdemc”.
Our sentence once coded will be: ”ZODAL OLIBADIMID ABILO LADOZ” which sonified will give the scorerepresented in fig. 9We can observe that melody remains palindromic, the rhythmis exactly preserved (since the coding does not exchangeconsonants and vowels). One can compare in fig. 10 thetwo musical scores quantitatively, plotting the two his-tograms of the occurrences of the musical notes for thetwo musical phrases.
4 To be more precise, we have to act on the text with a transformationwhich ”respects” the symmetry properties of the text, in other (mathe-matical) words, which is invariant with respect to the symmetry group ofour text, namely the Klein group.

Figure 9. Score from ”ZODAL OLIBA DIMID ABILOLADOZ” sonification
Figure 10. Histograms of the MIDI notes occurrences forthe two sonifications
Finally, fig. 11, gives another sonification example, show-ing the melodisation of several anagrams of the word ”aster”.It is interesting to observe the particular structure which isassumed by the score.
Figure 11. Another example: score from ”aster” ana-grams sonification
5. 3D IMAGE RENDERING AS DATAREPRESENTATION
In the previous sections we have discussed the MIDI soni-fication of a certain given data set. Generally speaking,as it has been observed before, a sonification procedure isa map between two discrete sets of values. Going ahead,we con consider another example of mapping, this timeaddressed to graphical images.
5.1. 3D rendering using POVRay: a first example
The Persistence of Vision Raytracer (POVRay[11]) is ahigh-quality, totally free tool for creating three-dimensionalgraphics. It is available in official versions for Windows,Mac OS/Mac OS X and i86 Linux. The source code is
available for those wanting to do their own ports. Therendering engine is controlled by a sort of special pro-gramming language with primitives which define the el-ementary objects, such as spheres, lines, planes, regularshapes, . . .
Here follows an example, about how to get a simplesphere on a reflecting background.
union{sphere{z * 9-1,2}plane{y,-3}finish{reflection{,1}}
}background{1+z/9}
This code has been rendered in fig. 12. The first line de-clares that the object which are going to be defined will bejoined together. The second and the third ones declare asphere in the second line (radius=2) and then an horizontalplane. The finish command, set the surfaces behaviour asreflecting/metallic. Finally the last line defines a gradientbackground to complete the scene.
Figure 12. A POVRay example, a sphere ren-dering (from the POVRay shortest code contest:http://astronomy.swin.edu.au/ pbourke/raytracing/scc3/)
5.2. 3D graphical rendering and data representationof three characters
The Java package developed for this purpose, takes as in-put a text file and returns as output a 3D source file to berendered with the ray-tracing program POVRay (also inthis case a full working demo running on the PC cluster ofthe European project for distributed computation, GRID,is available at the URL:https://grid-tutor.ct.infn.it ). Again, to eachcharacter of the message will be associated a graphicalobject, a sphere in this case. Spheres position, texture,index of reflection, surface properties and degree of trans-parency will be determined as a function of the position ofthe letter into the alphabet. An example is shown in fig. 13where three characters have been rendered using the Javapackage and POVRay.

Figure 13. 3D representation of three charachters. Thex, y, z position, the radius of each sphere, as well as itssurface properties (reflection index, refraction index, dif-fusion coefficient) have been calculated according to theposition of the letters within the English alphabet
#include "colors.inc"... settings, background, camera
sphere {<8,33,18>,5.935057pigment {colour
red 0.65882355green 0.65882355blue 0.65882355filter 0.0
}finish {
reflection {0.0}ior 0.0phong 0.0
}}
sphere {<-16,13,-23>,2.2259622pigment {Yellow filter 0.0}
finish {reflection {1.0}ior 0.0phong 1.0
}}
sphere {<31,-10,-5>,7.56183pigment {Yellow filter 0.0}
finish {reflection {0.0}ior 0.0phong 0.0
}}
...
Four rendering sets of parameters have been chosen toprovide four different representations (14 - 17): two ofthem with glassy spheres onto a sea-and-sky landscape,one with a low-key background and distorted objects, a
least one with distorted glassy spheres on a water back-ground. In the POVRay code shown above, it is easy torecognize the declaration of three spheres, generated ac-cording to the three mapped characters of the example.Each sphere command will draw a sphere on the screenonce the POVRay source file is compiled. The first al-gorithm will put the graphical objects on an algorithmi-cally generated sky and sea background, without any pro-cessing, while the other rendering algorithms will apply a(wavy) distorsion to the final picture. The POVRay spherecommand allows to operate on the following parameters:x,y,z coordinates of the center, radius, color (RGB code),coefficient of reflection, index of refraction (ior in the pro-gram), phong (size of the reflection spot on the sphere sur-face), texture.
6. CONCLUSIONS
Two data sonification and a 3D rendering Java packageshave been presented. All the packages are able to run of-fline taking as input a data file or a text file both on singlePCs and on clusters (see the next section for more detailedinstructions).
The sonification applications are also able to run inter-actively, embedded into website as applet (seehttp://www.musicainaudita.it/sonification to have an example).
7. ACKNOWLEDGMENTS
The author is particularly grateful to Emidio Giorgio andGiuseppe La Rocca from INFN Catania for their preciouscontribution to set up the GRID interactive version of theMIDI sonification (of both text messages and seismogramsdata) and 3D rendering. The online version of those soft-ware is available at the URL:https://grid-tutor.ct.infn.it . To run oneof the jobs, click on left menu on the link ”VO Services”,then after the login procedure (the user has just to click onthe login button in the page which will appear), it will beshown a menu on the left side where it appears the link”Sonification”.
This web interface allows any user to connect and runsonification and 3D representation directly on the GRID,the European largest distributed cluster for massive com-putation in a transparent and simple way.
8. REFERENCES
[1] CSound acoustic compiler,http://www.csounds.com
[2] Foster, I. and Kesselman, C. (2001),TheAnatomy of the GRID, Int. J. SupercomputerApplications, 15(3)
[3] Lane, D.M. (1999-2002),Development ofsonification design theorgy: Metaphors, map-

Figure 14. 3D rendering (of the POVRay source file) ofthe message: SphericalSound Message Sentences sonifi-cations and 3D rendering (first algorithm).
Figure 15. 3D rendering (of the POVRay source file) ofthe message: SphericalSound Message Sentences sonifi-cations and 3D rendering (second algorithm).
Figure 16. 3D rendering (of the POVRay source file) ofthe message: SphericalSound Message Sentences sonifi-cations and 3D rendering (third algorithm).
Figure 17. 3D rendering (of the POVRay source file) ofthe message: SphericalSound Message Sentences sonifi-cations and 3D rendering (fourth algorithm).
Figure 18. Another example of 3D rendering (of thePOVRay source file) using the first algorithm, the sourcewas a T.S. Elliot poetry.

pings, holistic sound design, and data-specificsonification, National Science Foundation
[4] jMusic (Java API for MIDI notation) website:http://jmusic.ci.qut.edu.au/
[5] The INFN GRID project, and the EuropeanDATAGRID project: http://www.infn.it/grid,http://www.datagrid.org
[6] http://www.jyu.fi/musica/miditoolbox/
[7] The GRID INFN Laboratory for Dissemina-tion Activities (GILDA): https://gilda.ct.infn.it
[8] Malinowski, Audification/Sonification,http://www.musanim.com/mam/samindex.html
[9] Tripp, A.C, Geological Sonification: Us-ing Auditory Signals to Represent Geologi-cal Data, proc. of the AAPG annual meeting2003.
[10] Gregorian Chant notationhttp://interletras.com/canticum/
[11] Persistence of Vision RayTracer (POVRay),http://www.povray.org
[12] Vicinanza, D. (2004),First results about soundsynthesis and sonification within GRID, inproc. of the UCM 2004 International Confer-ence, Caserta, Italy, 2004
[13] Vicinanza, D., ”Making music with GRID -Sonification of ETNA Volcano Seismograms”,poster presented at the ”50 years of CERN”celebrations, Geneva, Switzerland, October16, 2004