a histidine ph sensor regulates activation of the ras...
TRANSCRIPT
*For correspondence:
[email protected] (JK);
[email protected] (JPR)
†These authors contributed
equally to this work
Present address: ‡Carmot
Therapeutics, San Francisco,
United States
Competing interest: See
page 22
Funding: See page 21
Received: 25 May 2017
Accepted: 05 September 2017
Published: 27 September 2017
Reviewing editor: Volker
Dotsch, J.W. Goethe-University,
Germany
Copyright Vercoulen et al. This
article is distributed under the
terms of the Creative Commons
Attribution License, which
permits unrestricted use and
redistribution provided that the
original author and source are
credited.
A Histidine pH sensor regulates activationof the Ras-specific guanine nucleotideexchange factor RasGRP1Yvonne Vercoulen1,2†, Yasushi Kondo3,4†, Jeffrey S Iwig3,4†‡, Axel B Janssen1,Katharine A White5, Mojtaba Amini2, Diane L Barber5, John Kuriyan3,4,6,7,8*,Jeroen P Roose1*
1Department of Anatomy, University of California, San Francisco, San Francisco,United States; 2Molecular Cancer Research, Center for Molecular Medicine, UMCUtrecht, Utrecht University, Utrecht, Netherlands; 3Department of Molecular andCell Biology and Chemistry, University of California, Berkeley, United States;4California Institute for Quantitative Biosciences, University of California, Berkeley,United States; 5Department of Cell and Tissue Biology, University of California, SanFrancisco, San Francisco, United States; 6Howard Hughes Medical Institute,University of California, Berkeley, United States; 7Department of Chemistry,University of California, Berkeley, United States; 8Divisions of Molecular Biophysicsand Integrated Bioimaging, Lawrence Berkeley National Laboratory, Berkeley,United States
Abstract RasGRPs are guanine nucleotide exchange factors that are specific for Ras or Rap, and
are important regulators of cellular signaling. Aberrant expression or mutation of RasGRPs results
in disease. An analysis of RasGRP1 SNP variants led to the conclusion that the charge of His 212 in
RasGRP1 alters signaling activity and plasma membrane recruitment, indicating that His 212 is a pH
sensor that alters the balance between the inactive and active forms of RasGRP1. To understand
the structural basis for this effect we compared the structure of autoinhibited RasGRP1,
determined previously, to those of active RasGRP4:H-Ras and RasGRP2:Rap1b complexes. The
transition from the autoinhibited to the active form of RasGRP1 involves the rearrangement of an
inter-domain linker that displaces inhibitory inter-domain interactions. His 212 is located at the
fulcrum of these conformational changes, and structural features in its vicinity are consistent with
its function as a pH-dependent switch.
DOI: https://doi.org/10.7554/eLife.29002.001
IntroductionThe Ras family of small G-proteins, including Ras and Rap, are molecular switches that transmit sig-
nals when bound to GTP (Rojas et al., 2012). Ras-family members are activated by specific guanine-
nucleotide exchange factors (that we term GEFs for simplicity here), such as Son of Sevenless, that
activates Ras (Boriack-Sjodin et al., 1998), and Epac1 and Epac2, that activate Rap
(Rehmann et al., 2006). GEFs activate Ras-family members by triggering the release of GDP and its
replacement by GTP (Wittinghofer and Vetter, 2011). These GEFs, of which there are several dis-
tinct families in humans, activate Ras-family members in response to a variety of signals, and thereby
initiate downstream kinase signaling cascades (Bos et al., 2007; Cherfils and Zeghouf, 2013). One
family of these GEFs is comprised of the Ras guanine-nucleotide releasing proteins (RasGRPs) that
can activate Ras or Rap, of which there are four in humans. RasGRP1 is most extensively studied in T
Vercoulen et al. eLife 2017;6:e29002. DOI: https://doi.org/10.7554/eLife.29002 1 of 26
RESEARCH ARTICLE

lymphocytes (Dower et al., 2000; Priatel et al., 2002; Roose et al., 2005; Daley et al., 2013),
RasGRP2 in neutrophils and platelets (Lozano et al., 2016; Stone, 2011), RasGRP3 in B lymphocytes
(Teixeira et al., 2003), and RasGRP4 in mast cells (Yang et al., 2003). However, RasGRPs can be
found in other cell types as well, including epithelial lineages (Depeille et al., 2015). T cell receptor
(TCR) or B cell receptor (BCR) stimulation leads to an increase of diacylglycerol at the membrane,
protein kinase C (PKC) activation, and increases in intracellular calcium levels (Myers and Roose,
2016). RasGRP1 is recruited to the plasma membrane, where it binds diacylglycerol to enable inter-
action with Ras. Upon receptor stimulation, RasGRP1 is phosphorylated by PKC (Zheng et al., 2005;
Roose et al., 2007), which enhances RasGRP1’s GEF activity through unknown mechanisms.
RasGRP1 contains a calcium-binding EF hand domain and calcium binding to RasGRP1 induces allo-
steric changes that release autoinhibition (Iwig et al., 2013).
Dysregulated RasGRPs can cause aberrant signaling and result in disease. Alterations in RasGRP1
expression contribute to diseases such as skin carcinoma (Diez et al., 2009; Luke et al., 2007), colo-
rectal cancer (Depeille et al., 2015), and leukemia (Ksionda et al., 2016; Hartzell et al., 2013). Ele-
vated RasGRP3 expression has been reported in breast cancer (Nagy et al., 2014), prostate cancer
(Yang et al., 2010), lymphoma (Teixeira et al., 2003), cutaneous melanoma (Yang et al., 2011), and
uveal melanoma (Chen et al., 2017). A polymorphism (Arg 519 Gly) in Rasgrp1 in mice results in T
cell abnormalities and autoimmunity (Daley et al., 2013). Furthermore, several genetics studies have
linked single nucleotide polymorphisms (SNPs) in RasGRP1 to human autoimmune disease
(Plagnol et al., 2011; Qu et al., 2009), and low RasGRP1 levels have been detected in T lympho-
cytes from patients with Systemic Lupus Erythematosus (SLE) (Yasuda et al., 2007), and rheumatoid
arthritis (RA) (Golinski et al., 2015). Complete RasGRP1 deficiency in a patient leads to a novel pri-
mary immunodeficiency, with impaired activation and proliferation of the patient’s T- and B- cells
and defective killing by cytotoxic T cells and NK cells (Roose, 2016; Salzer et al., 2016). Rasgrp2
deficiency in mice results in excessive bleeding, caused by defective platelets aggregation and
degranulation (Crittenden et al., 2004). Moreover, polymorphisms in RasGRP2, either converting
eLife digest Complex chain reactions between many kinds of molecules regulate every process
in the body. For example, the signaling molecule Ras helps the cell to grow and divide. However,
abnormally high levels of Ras signals can cause cancer.
Ras is activated by proteins called exchange factors. One of the families of Ras exchange factors
– RasGRP – plays important roles in immune and bleeding disorders, and certain cancers. In 2013,
researchers studied the structure of one of these exchange factors, called RasGRP1, while it was
inactivated. Inactive RasGRP proteins have a ‘closed’ structure, which must ‘open up’ when they are
activated.
Vercoulen, Kondo, Iwig et al. – who include several of the researchers involved in the 2013 study
– have now investigated the regulation of various RasGRP family members. The protein structures of
the active forms of two family members were determined and compared with the structure of
inactive RasGRP1. In parallel, Vercoulen et al. analyzed how genetic mutations that alter some of the
amino acids that make up RasGRP1 affect Ras signaling in cells. This revealed that a particular amino
acid, histidine 212, plays a key role in activating RasGRP1.
Histidines can be in a positively charged or neutral form depending on other surrounding amino
acids and on the acidity of the cell’s interior. The interiors of cells that receive an external signal
often decrease in acidity, and cancer cells tend to have less acidic interiors than normal cells.
Vercoulen et al. reveal that a change in the charge on histidine 212 from positive to neutral opens
up the RasGRP1 protein. Histidine 212 therefore acts as an acidity sensor that activates RasGRP1
when the inside of the cell becomes less acidic as external signals are received.
Since RasGRP proteins play important roles in many diseases, understanding how cell acidity
regulates RasGRPs has wide medical relevance. In the future, the protein structures of the RasGRP
family members and the method developed in this study could be used to explore how they
contribute to disease.
DOI: https://doi.org/10.7554/eLife.29002.002
Vercoulen et al. eLife 2017;6:e29002. DOI: https://doi.org/10.7554/eLife.29002 2 of 26
Research article Biochemistry Biophysics and Structural Biology
Arg 113 into a stop codon, or missense mutations (Gly 248 Trp or Ser 381 Phe), cause a platelet dis-
order in patients (Lozano et al., 2016;Canault et al., 2014).
The N-terminal portion of the RasGRPs contains the catalytic module that is common to other
GEFs that operate on Ras-family members (Figure 1A). This module consists of a Ras-exchanger
motif (REM) domain followed by a Cdc25 domain (Boguski and McCormick, 1993;Fam et al.,
1997). As first revealed by structural analysis of the Ras-specific GEF Son-of-Sevenless (SOS), the
Cdc25 domain interacts with Ras and is responsible for nucleotide release, and the REM domain pro-
vides structural support for the Cdc25 domain (Boriack-Sjodin et al., 1998). The remaining portion
of the RasGRP proteins consists of a Ca2+-binding EF domain and a C1 domain that binds diacylgly-
cerol for membrane localization (Beaulieu et al., 2007; Ebinu et al., 1998; Zahedi et al., 2011).
RasGRP1 has a C-terminal coiled-coil domain that is missing in the other family members. The com-
mon set of domains in RasGRP-1, -2, -3, and -4 show a high degree of sequence conservation
(Ksionda et al., 2013).
A nearly complete understanding of the regulation of SOS has been provided through structural
and functional studies (reviewed in Jun et al., 2013); The exchange-factor activity of the catalytic
module of SOS is inhibited by the action of the N- and C-terminal segments (Sondermann et al.,
2004), and the activation of SOS requires allosteric feedback from Ras.GTP binding to a site that is
distal to the catalytic site where nucleotide is exchanged (Roose et al., 2007; Margarit et al., 2003;
Boykevisch et al., 2006). Once activated, SOS requires multiple plasma membrane-anchoring mech-
anisms to signal efficiently to Ras (Findlay et al., 2013; Christensen et al., 2016), and SOS signaling
is terminated in part via endocytosis (Christensen et al., 2016). The regulation of the Rap-specific
GEF Epac2 is also well understood (Rehmann et al., 2006; Rehmann et al., 2008).
Much less is known about the regulation and activation of any of the four RasGRP proteins. We
had previously analyzed the structural basis for the autoinhibition of RasGRP1, which is very different
from that of SOS (Figure 1B). In SOS, the active site is open in the autoinhibited form, and inactiva-
tion appears principally to be the result of the blockage of allosteric Ras binding. Allosteric Ras bind-
ing causes a conformational change at the active site in SOS. In contrast, in RasGRP1, the active site
is blocked by the linker connecting the Cdc25 domain to the EF domain (the Cdc25-EF linker)
(Iwig et al., 2013). In addition, we proposed that dimerization of RasGRP1 through the C-terminal
coiled-coil domain results in blockage of the membrane-interacting surface of the C1 domain. In the
structure of autoinhibited RasGRP1, the EF and C1 domains are docked on the base of the Cdc25
domain, and this interaction steers the Cdc25-EF linker through the Ras-binding site of the Cdc25
domain (Iwig et al., 2013). Calcium binding to the EF-hand of RasGRP1 promotes a conformational
change that is likely to result in displacement of the Cdc25-EF linker from the catalytic site
(Iwig et al., 2013). Thus, the EF domain plays both autoinhibitory and activating roles in regulating
RasGRP1, and a point mutation in the EF domain leads to an autoimmune phenotype in mice
(Daley et al., 2013). Sequence comparisons suggest that this autoinhibitory mechanism is conserved
in the three other RasGRP proteins.
By scanning and testing human single nucleotide variants (SNVs) from genome databases, we
uncovered that a conserved histidine residue in the Cdc25 domain of RasGRP1 (His 212) is critical for
autoinhibition. We show that the activity of RasGRP1 is sensitive to cellular pH, and that His 212 is
critical for this pH sensitivity. Stimulation of lymphocytes results in an increase in intracellular pH
(pHi) (Cheung et al., 1988; Fischer et al., 1988;Mills et al., 1985), which can lead to deprotonation
and conversion of histidine residues from positively charged to neutral (Schonichen et al., 2013).
We find that increasing pHi synergizes with receptor stimulation to activate the cellular RasGRP1-
Ras-ERK pathway. Conversely, replacing His 212 by a positively charged lysine residue (H212K) pre-
vents the recruitment of RasGRP1 to the membrane, presumably by stabilizing the autoinhibited
form.
In order to understand the role of His 212 in regulation of RasGRP1 we sought to compare the
structure of autoinhibited RasGRP1, determined previously (Iwig et al., 2013), to that of the active
form in complex with Ras. We have been unable to crystallize a RasGRP1:Ras complex. Instead, we
determined the structures of the catalytic modules of two other members of the family, RasGRP4
and RasGRP2, bound to nucleotide-free HRas and Rap1B, respectively. These structures reveal a key
role for the REM-Cdc25 linker in determining the switch from the autoinhibited to the active states.
The structure of this linker is fully resolved in the RasGRP2:Rap1B complex, and the linker conforma-
tion is incompatible with the inhibitory docking of the EF domain on the Cdc25 domain. The
Vercoulen et al. eLife 2017;6:e29002. DOI: https://doi.org/10.7554/eLife.29002 3 of 26
Research article Biochemistry Biophysics and Structural Biology

A
REM Cdc25 EF C1 CC
Thr184 Arg519
RasGRP1 domains
Arg271
B
C
EFCdc25 C1 CC
H16R
S22A
P34L
T45N
F47S
R48Q
V51M
G59E
D63E
C80Y
V96A
K116N
A144T
.T149I
V157L
L164I
H165Y
C166Y
Q173E
A176V/T
R177H
R195Q
L204V
H212Y
L215Y
S220L
F221C
S225L
F226L
L233F
R246Q
R265L
R271Q
Q289H
S314L/P
H315R
E319K
G325S
R342Q
D349N
K351R
S365L
Y366C
N388H
H389R
A400V
V471I
D485N
D487V
I498T
A524D
P541L
N543D
N557D
G564E
R571L
R594Q
L623F
P626T/R
H641Y
R648Q
S657P
S661A/Y
S663P
G682S
P689L
Y704H
S708R
S712A
R720I
R741H
Q753E
L779I
Q780H
D
RasGRP1-EGFP expression
unTFX low med high
P-E
RK
/ P
-S6
102100 103 104 105
10
210
010
310
410
5
Antibody detection
P-ERK/ P-S6
TFX cells
Analyze expression
(FACS)
RasGRP1-EGFP E
F
rati
o m
ed
ian
P-E
RK
/
med
ian
P-E
RK
un
TF
X P-ERK
rati
o m
ed
ian
P-S
6/
med
ian
P-S
6 u
nT
FX
P-S6
0
0.5
1.0
1.5
2.0
2.5
0
5
10
15
20
25
WT
His
212Tyr
Arg
271G
lu
Ser2
20L
eu
Ph
e221C
ys
Ser2
25L
eu
Ph
e226L
eu
WT
His
212Tyr
Arg
271G
lu
Ser2
20L
eu
Ph
e221C
ys
Ser2
25L
eu
Ph
e226L
eu
REMm
ed
ian
P-E
RK
/ P
-S6
co
rrect
for
WT
un
TF
X
RasGRP1-EGFP level
unTFX low medium high
DT40 P-ERK and P-S6
0
5
10
15
20 P-S6
P-ERK
cdc25-EF
linker
cdc25REM
C1
EF
cc
Inactive
RasGRP1 dimer
unTFX low med high
102100 103 104 105
10
21
00
10
31
04
10
5
RasGRP1-EGFP ‘low’
Figure 1. Altered basal RasGRP1 signaling by a human His 212 Tyr SNV. (A) The REM, Cdc25, EF hands, C1 and coiled-coil are known protein domains
of RasGRP1. Indicated are residues in different domains that have been shown to impact RasGRP1 activity (Thr 184, Arg 271, Arg 519). (B) Schematic of
an autoinhibited RasGRP1 homodimer. (C) Alignment of SNVs (missense variants) are in the coding regions of RasGRP1 collected from online
repositories dbSNP, COSMIC, NCBI in 2012 and 2014. (D) Assay to determine RasGRP1 activity in cells. RasGRP1�/�RasGRP3�/� DT40 cells are
Figure 1 continued on next page
Vercoulen et al. eLife 2017;6:e29002. DOI: https://doi.org/10.7554/eLife.29002 4 of 26
Research article Biochemistry Biophysics and Structural Biology
sequence of the REM-Cdc25 linker is conserved between RasGRP1 and RasGRP2, and we infer that
the activation of the RasGRP1 involves correlated movements in the REM-Cdc25 linker and the
Cdc25-EF linker. The structures show that the location of His 212 is such that the charge on this resi-
due could alter the balance between the active and inactive states of RasGRP1.
Results and discussion
Human missense variants of RasGRP1Single nucleotide variants that cause amino acid substitutions (missense variants; SNVs) are frequent
and generate human genetic variation: most people inherit ~12,000 missense gene variants
(Abecasis et al., 2010). We identified all SNVs reported for RasGRP1 in publicly available databases,
and took a shotgun approach to test a panel of these SNVs for their ability to alter RasGRP1 regula-
tion (Figure 1C).
We have not been able to express full length RasGRP1 and study the autoinhibitory mechanisms
in cell-free assays (Iwig et al., 2013). Therefore, to assess the potential signaling impact of these
SNVs, we used RasGRP1�/�RasGRP3�/� DT40 cells (a chicken B cell line) genetically deleted for
RasGRP1 and RasGRP3 and reconstituted these cells via transfection with wildtype EGFP-RasGRP1
(WT) or a catalytically inactive RasGRP1 (Arg271Glu) as before (Iwig et al., 2013), or with a panel of
RasGRP1 SNVs (indicated in bold and blue in Figure 1C). This assay allows for activity assessment of
RasGRP1-ERK signaling (Iwig et al., 2013), but also of RasGRP1-mTORC1-p70S6 kinase signaling
resulting in phosphorylation of ribosomal protein S6 (P-S6). Precisely how RasGRP1 signals to the S6
pathway is still unresolved and is not the focus of this study here, but the Arg 519 Gly mutation in
Rasgrp1Anaef mice results in higher basal S6 signaling, T cell abnormalities, and autoimmunity
(Daley et al., 2013). To assess the basal activity of RasGRP1 and its SNVs, we used quantitative flow
cytometric analysis of phosphorylated ERK (P-ERK) and phosphorylated ribosomal protein S6 (P-S6)
levels as a function of the expression level of RasGRP1-EGFP (Figure 1D). Our quantitative flow
cytometric analyses revealed that RasGRP1 signals strongly to P-S6 in the basal state; basal signals
from RasGRP1 to ERK do occur, but are more modest (Figure 1E).
Most SNVs were neutral, with signaling features either similar to WT RasGRP1 or with lower activ-
ity. There are numerous possible reasons for SNVs signaling at lower strength, including reduction in
protein stability (data not shown). However, the His 212 Tyr SNV signaled more strongly to ERK than
WT, indicating altered regulation of RasGRP1. More detailed analysis of the cellular biochemical
traits of the SNVs in the His 212 region demonstrated that His 212 Tyr, but not Ser 220 Leu, Phe 221
Cys, and Phe 226 Leu, resulted in increased basal signals to P-ERK and P-S6 in unstimulated cells as
compared to WT RasGRP1 (Figure 1F).
His 212 controls basal RasGRP1 signalsHis 212 in RasGRP1 is conserved among all vertebrate RasGRPs, and is present in most RasGRP pro-
teins from lower organisms (Figure 2A). This residue is located in the first helix of the Cdc25 domain,
and is far from the Ras-binding site. We assessed the activity of RasGRP1 bearing mutations at posi-
tion 212 in transfected cells. Analysis of the human SNV variant His 212 Tyr and His 212 Ala, both
alterations to neutral residues, showed increased basal signals to P-ERK in RasGRP1�/�RasGRP3�/�
DT40 cells (Figure 2B, Figure 2—figure supplement 1A) as well as in JPRM441 (Figure 2C, Fig-
ure 2—figure supplement 1B), a RasGRP1-deficient Jurkat T cell leukemia line that we previously
exploited to asses RasGRP1 function (Roose et al., 2005; Iwig et al., 2013). Similarly, the His 212
Tyr and His 212 Ala variants of RasGRP1 signaled stronger to P-S6 in the DT40 cell system
Figure 1 continued
transfected with EGFP-RasGRP1 wildtype or mutant plasmid. Intracellular phosphorylated-ERK (P-ERK) and phosphorylated ribosomal protein S6 (P–S6)
are detected by flow cytometry that allows for analysis of cells expressing different levels of RasGRP1-EGFP. (E) Analysis of basal S6- and ERK-
phosphorylation as a function of RasGRP1 expression levels (N = 7, unTFX = untransfected). (F) Effect of SNVs on basal S6- and ERK- phosphorylation.
Graphs display RasGRP1-EGFP low expressing cells (N = 2). (E,F) Y-axes show the average ratios of median fluorescent phospho-protein signals/median
fluorescent phospho-protein signals from untransfected cells (baseline). Shown are means ±SD.
DOI: https://doi.org/10.7554/eLife.29002.003
Vercoulen et al. eLife 2017;6:e29002. DOI: https://doi.org/10.7554/eLife.29002 5 of 26
Research article Biochemistry Biophysics and Structural Biology

A
His212 H.sapiens RasGRP1 EPEELSEHLTYLEFKSFRRISFSDYQNYL H.sapiens RasGRP2 EPMELAEHLTYLEYRSFCKILFQDYHSFV H.sapiens RasGRP3 EPIELAEHLTFLEHKSFRRISFTDYQSYV H.sapiens RasGRP4 ETGELAQHLTYLEFRSFQAITPQDLRSYV H.sapiens RasGRP1 EPEELSEHLTYLEFKSFRRISFSDYQNYL M.musculus RasGRP1 HLTYLEFKSFRRISFSDYQNYL G.gallus RasGRP1 HLTYLEFKSFRRISFSDYQSYI X.leavis RasGRP1 EPQELAEHLTYLEFKAFRRISFSDYQNYI D.rerio HLSYLEFKNFCNVSFLDYRSYV A.carolinensis HLTFLEHKSFRRISFTDYQSYV C.elegans SPSDISTSLSHIDYRVLSRISITELKQYV L.Loa TPEEIAVSLSHIDYKALFKIPISELKQYC
EPIELAEEPDEMAE
EPEELSDEPEELSE
C
EDT40 P-ERK
JPRM441 P-ERK
rati
o m
ed
ian
P-E
RK
/
me
dia
n P
-ER
K u
nT
FX
rati
o m
ed
ian
P-E
RK
/
me
dia
n P
-ER
K u
nT
FX
rati
o m
ed
ian
P-E
RK
/
me
dia
n P
-ER
K u
nT
FX
rati
o m
ed
ian
P-S
6/
me
dia
n P
-S6
un
TF
X
rati
o m
ed
ian
P-E
RK
/
me
dia
n P
-ER
K u
nT
FX
RasGRP1-EGFP level
unTFX low medium high
RasGRP1-EGFP level
unTFX low medium high
RasGRP1-EGFP level
unTFX low medium high
RasGRP1-EGFP level
unTFX low medium high
RasGRP1-EGFP level
unTFX low medium high
B
WT
His212Arg
His212Lys
WTHis212Tyr
His212Ala
0
10
20
25
15
5
0
10
20
25
15
5
****
WT
His212Arg
His212Lys
WT
His212Arg
His212Lys
WTHis212Tyr
His212Ala
0
10
30
20
40
0
1
2
3
0
*4
5
1
2
3
4
5
JPRM441 P-ERK
DT40 P-ERKD
DT40 P-S6
rati
o m
ed
ian
P-S
6/
me
dia
n P
-S6
un
TF
X
DT40 P-S6
RasGRP1-EGFP level
unTFX low medium high
WTHis212Tyr
His212Ala
0
10
30
20
40
*
***
F G
Figure 2. A neutral charge on Histidine 212 in RasGRP1 enhanced basal activity. (A) Alignment of RasGRP isoforms and RasGRP1 sequences in
different species to determine conserved residues. His 212 conservation is indicated by grey color. (B–G) Low RasGRP1-expressing Jurkat cells
(JPRM441), or RasGRP1�/�RasGRP3�/� DT40 cells were transfected with wildtype- or variants of EGFP-RasGRP1. (B–D) His 212 was mutated into
neutrally charged residues (His 212 Ala, His 212 Tyr), or (E–G) into positively charged residues (His 212 Arg, His 212 Lys). RasGRP1 signaling was
determined by levels of phosphorylated ERK (P-ERK) and S6 (P–S6). Shown are average median levels of P-ERK and P-S6, corrected for untransfected
cells for each experiment, to prevent experimental fluctuation in fluorescent signal. (Figure 2B and E: WT N = 8, His 212 Tyr N = 8, His 212 Ala N = 6,
His 212 Arg N = 3, His 212 Lys N = 3, Figure 2C and F: WT N = 10, His 212 Tyr N = 7, His 212 Ala N = 7, Figure 2D and G: WT, His 212 Arg, His 212
Lys, all N = 6). Kruskal-wallis test was used, with post-test Dunn’s multiple comparisons, comparing each mutant to WT (*p<0.05), **p<0.01,
***p<0.001).
DOI: https://doi.org/10.7554/eLife.29002.004
The following figure supplement is available for figure 2:
Figure 2 continued on next page
Vercoulen et al. eLife 2017;6:e29002. DOI: https://doi.org/10.7554/eLife.29002 6 of 26
Research article Biochemistry Biophysics and Structural Biology

(Figure 2D, Figure 2—figure supplement 1C); PTEN- and SHIP1-deficiency in Jurkat results in
hyperactive PI3kinase signals (Abraham and Weiss, 2004), making analysis of PI3K-dependent sig-
nals, such as those to S6, difficult in Jurkat. Thus, the His 212 Tyr and His 212 Ala variants are less
autoinhibited. Mutation of His 212 to positively charged residues, i.e. His 212 Arg and His 212 Lys,
maintained autoinhibition of RasGRP1 activity in unstimulated cells with a similar efficiency as WT
RasGRP1 (Figures 2E,F and G, Figure 2—figure supplement 1D,E and F). Note that our analysis of
the effects of these, and other, mutations in RasGRP1 is necessarily restricted to cell-based assays.
As shown previously, the RasGRP1 construct used here is released from autoinhibition when studied
in vitro, in solution (Iwig et al., 2013). The inability of in vitro measurements to capture details of
the regulatory mechanism may reflect the role of dimerization in maintaining autoinhibition – the
construct used in these studies lacks the C-terminal dimerization domain, and we have not yet suc-
ceeded in expressing and purifying full-length RasGRP1.
The charge of His 212 impacts activation of RasGRP1The same transfection phospho-flow strategy also allows for evaluation of RasGRP1 function follow-
ing B cell receptor (BCR) stimulation, by analyzing kinase pathway signals in cells that express low
levels of RasGRP1-EGFP, which we gate on. Upon BCR stimulation with M4 antibody, we typically
observe induced levels of P-ERK and P-S6 that are 7–9 fold and 2–3 fold over baseline, respectively
(Figure 3A). Note that induction of ERK phosphorylation is more robust than S6 phosphorylation
upon BCR stimulation. Thus, S6 phosphorylation appears to be a more robust event in the basal
state (Figure 1) and ERK phosphorylation is a more robustly triggered kinase pathway in stimulated
cells. To understand the role of His 212 in the activation of RasGRP1, we used our transfection phos-
pho-flow platform and BCR stimulation.
Changing His 212 to neutral residues, as in the human SNV His 212 Tyr or the designed His 212
Ala variant, resulted in increased levels of BCR-induced phosphorylation of ERK and S6 (Figure 3B
and C). Conversely, altering His 212 to positively charged residues, either His 212 Arg or His 212
Lys, impaired the BCR-induced ERK and S6 responses (Figure 3D and E). The transfection platform
with EGFP-tagged RasGRP1 also allowed us to investigate the recruitment of RasGRP1 to the
plasma membrane (Bivona et al., 2003; Daley et al., 2013). Wildtype and His 212 Tyr versions of
RasGRP1-EGFP revealed very similar efficiency of plasma membrane recruitment upon BCR-stimula-
tion (Figure 3F and G, and Figure 3—figure supplement 1). Most striking was the complete lack of
RasGRP1 plasma membrane recruitment for the positively charged mutant His 212 Lys (Figure 3G
and Figure 3—figure supplement 1). This is remarkable because BCR-stimulation generates a
robust intracellular calcium flux and increased levels of DAG (Myers and Roose, 2016), which
recruits RasGRP1 to the membrane and activates it. Thus, the His 212 Lys mutation blocks the
responsiveness of RasGRP1 to these calcium and DAG cues. Together, these data suggest that the
positive charge of His 212 contributes to RasGRP1 autoinhibition in the basal state (Figure 2), and
that a neutral residue at position 212 is essential to allow for RasGRP1 plasma membrane recruit-
ment and signal output to the ERK and S6 pathways (Figure 3).
His 212 functions as a pH sensor that modulates RasGRP1 activityGiven that increases in intracellular pH can result in deprotonation of histidines (Schonichen et al.,
2013) (Figure 4A), we next explored whether RasGRP1 is regulated by intracellular pH through His
212. Cells in an activated state often display increases in intracellular pH (pHi); For example, the pHi
is elevated in tumor cells, which promotes tumor survival and progression (Webb et al., 2011;
Grillo-Hill et al., 2015). Stimulation of DT40 cells by PMA (a diacylglycerol analogue) and ionomycin
(calcium ionophore), mimicking lymphocyte receptor signaling events that connect to RasGRP1,
resulted in a consistent increase of the intracellular pH (Figure 4B).
Intracellular pH can be experimentally changed by regulating the activity of plasma membrane
H+ and HCO3� ion transporters. Additionally, treating cells with low concentrations (10–20 mM) of
Figure 2 continued
Figure supplement 1. Analyses of RasGRP1 level-dependent effects on ERK- and S6-kinase pathway activation.
DOI: https://doi.org/10.7554/eLife.29002.005
Vercoulen et al. eLife 2017;6:e29002. DOI: https://doi.org/10.7554/eLife.29002 7 of 26
Research article Biochemistry Biophysics and Structural Biology

FWT no stim WT + BCR
His212Tyr no stim His212Tyr + BCR
His212Lys no stim His212Lys + BCR
G
B P-ERK
me
dia
n P
-ER
K
co
rre
ct
for
WT
me
dia
n P
-ER
K
co
rre
ct
for
WT
me
dia
n P
-S6
co
rre
ct
for
WT
me
dia
n P
-S6
co
rre
ct
for
WT
p=0.22p=0.04
p=0.0002p=0.05
p=0.01p=0.002
p=0.006
p<0.0001
0.5
1.0
1.5
0
0
1
2
3
4
0.5
1.0
1.5
0
0
1
2
3
4
P-S6C
D E
RasGRP1-EGFP
WT no stim WT + BCR
RasGRP1-EGFP
WT
His
21
2A
rg
H2
1is
2L
ys
WT
His
21
2Ty
r
His
21
2A
la
WT
His
21
2Ty
r
His
21
2A
la
WT
His
21
2A
rg
H2
1is
2L
ys
plasma membranecytoplasm
A
RasGRP1-EGFP expression level
unTFX low high
P-E
RK
/ P
-S6
102100 103 104 105
102
100
103
104
105
P-ERK P-S6
unstimulated
5 min stimulated
P-ERK P-S6
gate on
low
Figure 3. A constitutive positive charge on His 212 in RasGRP1 reduces kinase signaling and prevents RasGRP1 plasma membrane recruitment. (A)
Assay to determine RasGRP1 activity in receptor stimulated cells using RasGRP1-/-RasGRP3-/- DT40 cells, BCR stimulation, and gating on low levels of
transfected RasGRP1-EGFP. (B–E) Effects of H212 mutations on RasGRP1 activity were tested upon B cell receptor (BCR) stimulation. Shown are average
median levels of P-ERK and P-S6 in EGFP-low expressing cells, corrected for wildtype stimulated cells. WT was set on 1.0. Kruskal-wallis test (Figure 3C
Figure 3 continued on next page
Vercoulen et al. eLife 2017;6:e29002. DOI: https://doi.org/10.7554/eLife.29002 8 of 26
Research article Biochemistry Biophysics and Structural Biology
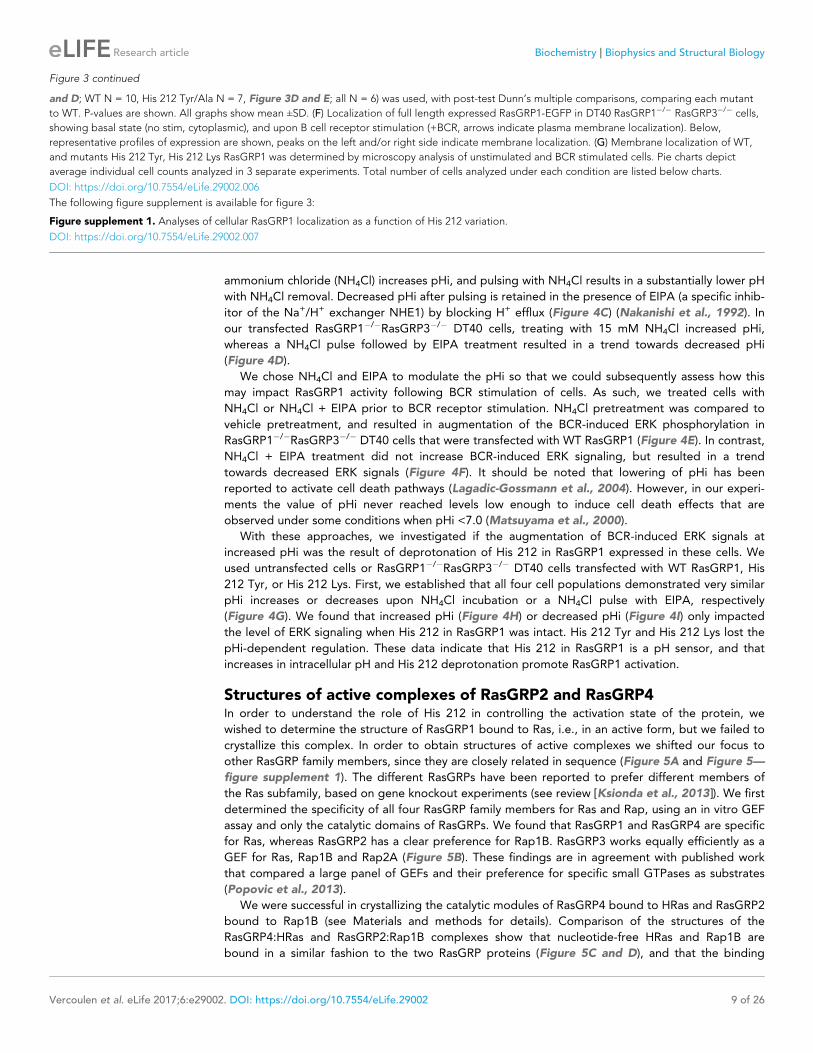
ammonium chloride (NH4Cl) increases pHi, and pulsing with NH4Cl results in a substantially lower pH
with NH4Cl removal. Decreased pHi after pulsing is retained in the presence of EIPA (a specific inhib-
itor of the Na+/H+ exchanger NHE1) by blocking H+ efflux (Figure 4C) (Nakanishi et al., 1992). In
our transfected RasGRP1�/�RasGRP3�/� DT40 cells, treating with 15 mM NH4Cl increased pHi,
whereas a NH4Cl pulse followed by EIPA treatment resulted in a trend towards decreased pHi
(Figure 4D).
We chose NH4Cl and EIPA to modulate the pHi so that we could subsequently assess how this
may impact RasGRP1 activity following BCR stimulation of cells. As such, we treated cells with
NH4Cl or NH4Cl + EIPA prior to BCR receptor stimulation. NH4Cl pretreatment was compared to
vehicle pretreatment, and resulted in augmentation of the BCR-induced ERK phosphorylation in
RasGRP1�/�RasGRP3�/� DT40 cells that were transfected with WT RasGRP1 (Figure 4E). In contrast,
NH4Cl + EIPA treatment did not increase BCR-induced ERK signaling, but resulted in a trend
towards decreased ERK signals (Figure 4F). It should be noted that lowering of pHi has been
reported to activate cell death pathways (Lagadic-Gossmann et al., 2004). However, in our experi-
ments the value of pHi never reached levels low enough to induce cell death effects that are
observed under some conditions when pHi <7.0 (Matsuyama et al., 2000).
With these approaches, we investigated if the augmentation of BCR-induced ERK signals at
increased pHi was the result of deprotonation of His 212 in RasGRP1 expressed in these cells. We
used untransfected cells or RasGRP1�/�RasGRP3�/� DT40 cells transfected with WT RasGRP1, His
212 Tyr, or His 212 Lys. First, we established that all four cell populations demonstrated very similar
pHi increases or decreases upon NH4Cl incubation or a NH4Cl pulse with EIPA, respectively
(Figure 4G). We found that increased pHi (Figure 4H) or decreased pHi (Figure 4I) only impacted
the level of ERK signaling when His 212 in RasGRP1 was intact. His 212 Tyr and His 212 Lys lost the
pHi-dependent regulation. These data indicate that His 212 in RasGRP1 is a pH sensor, and that
increases in intracellular pH and His 212 deprotonation promote RasGRP1 activation.
Structures of active complexes of RasGRP2 and RasGRP4In order to understand the role of His 212 in controlling the activation state of the protein, we
wished to determine the structure of RasGRP1 bound to Ras, i.e., in an active form, but we failed to
crystallize this complex. In order to obtain structures of active complexes we shifted our focus to
other RasGRP family members, since they are closely related in sequence (Figure 5A and Figure 5—
figure supplement 1). The different RasGRPs have been reported to prefer different members of
the Ras subfamily, based on gene knockout experiments (see review [Ksionda et al., 2013]). We first
determined the specificity of all four RasGRP family members for Ras and Rap, using an in vitro GEF
assay and only the catalytic domains of RasGRPs. We found that RasGRP1 and RasGRP4 are specific
for Ras, whereas RasGRP2 has a clear preference for Rap1B. RasGRP3 works equally efficiently as a
GEF for Ras, Rap1B and Rap2A (Figure 5B). These findings are in agreement with published work
that compared a large panel of GEFs and their preference for specific small GTPases as substrates
(Popovic et al., 2013).
We were successful in crystallizing the catalytic modules of RasGRP4 bound to HRas and RasGRP2
bound to Rap1B (see Materials and methods for details). Comparison of the structures of the
RasGRP4:HRas and RasGRP2:Rap1B complexes show that nucleotide-free HRas and Rap1B are
bound in a similar fashion to the two RasGRP proteins (Figure 5C and D), and that the binding
Figure 3 continued
and D; WT N = 10, His 212 Tyr/Ala N = 7, Figure 3D and E; all N = 6) was used, with post-test Dunn’s multiple comparisons, comparing each mutant
to WT. P-values are shown. All graphs show mean ±SD. (F) Localization of full length expressed RasGRP1-EGFP in DT40 RasGRP1�/� RasGRP3�/� cells,
showing basal state (no stim, cytoplasmic), and upon B cell receptor stimulation (+BCR, arrows indicate plasma membrane localization). Below,
representative profiles of expression are shown, peaks on the left and/or right side indicate membrane localization. (G) Membrane localization of WT,
and mutants His 212 Tyr, His 212 Lys RasGRP1 was determined by microscopy analysis of unstimulated and BCR stimulated cells. Pie charts depict
average individual cell counts analyzed in 3 separate experiments. Total number of cells analyzed under each condition are listed below charts.
DOI: https://doi.org/10.7554/eLife.29002.006
The following figure supplement is available for figure 3:
Figure supplement 1. Analyses of cellular RasGRP1 localization as a function of His 212 variation.
DOI: https://doi.org/10.7554/eLife.29002.007
Vercoulen et al. eLife 2017;6:e29002. DOI: https://doi.org/10.7554/eLife.29002 9 of 26
Research article Biochemistry Biophysics and Structural Biology

H
neutral His
(+) His
NH4Cl
NH4Cl+EIPA pHi
pHi
me
dia
n P
-ER
K
co
rre
ct
for
WT
+B
CR
DT40+RasGRP1 WT DT40+RasGRP1 WT
G
NH4Cl
pHi
neutral His
NH4Cl+EIPA
pHi
(+) His
BCR NH4Cl+BCR BCR NH
4Cl+EIPA+BCR
C
control EIPAcontrol NH4Cl
pH
i
pH
i
E
D
controlNH
4Cl
NH4Cl+EIPA
8.0
7.8
7.6
7.4
7.2
pH
i
p=0.03
p=0.1
p=0.02p=0.13
p=0.08 * *
BCR
NH4Cl+EIPA+BCR3
2
1
0
BCR
NH4Cl+BCR
0
WT
His
21
2Ty
r
H2
1is
2L
ys
0
0.5
0
8.0
7.8
7.6
7.4
7.2
8.0
7.8
7.6
7.4
7.2
**
1.0
1.5
2.0
0.5
1.0
1.5
2.0
3
2
1
me
dia
n P
-ER
K
co
rre
ct
for
WT
+B
CR
m
ed
ian
P-E
RK
co
rre
ct
for
WT
+B
CR
me
dia
n P
-ER
K
co
rre
ct
for
WT
+B
CR
I
WT
His
21
2Ty
r
H2
1is
2L
ys
+W
T
+H
is2
12
Ty
r
+H
21
is2
Ly
s
un
TF
X
F
A B
p=0.01
control PMA+iono
pH
i
8.0
7.8
7.6
7.4
7.2
Figure 4. His 212 in RasGRP1 is a pH sensor. (A) Intracellular pH (pHi) influences the charge of histidines (His). Low pHi shifts equilibrium towards
protonated histidine (His+), while in high pHi conditions equilibrium shifts towards deprotonated histidine (His neutral). (B) Intracellular pH (pHi) was
measured upon PMA +ionomycin stimulation in DT40 cells. Shown are means ±SD (N = 3). Paired T-test was performed, p-value is shown. (C) NH4Cl
(NH4Cl) increases pHi, resulting in a neutral Histidine, while NH4Cl loading and washing, followed by EIPA (NH4Cl + EIPA) decreases pHi leading to a
protonated Histidine. H212Y mimics neutrally charged histidine, and H212K mimics protonated histidine. (D) DT40 RasGRP1�/�RasGRP3�/� cells
Figure 4 continued on next page
Vercoulen et al. eLife 2017;6:e29002. DOI: https://doi.org/10.7554/eLife.29002 10 of 26
Research article Biochemistry Biophysics and Structural Biology
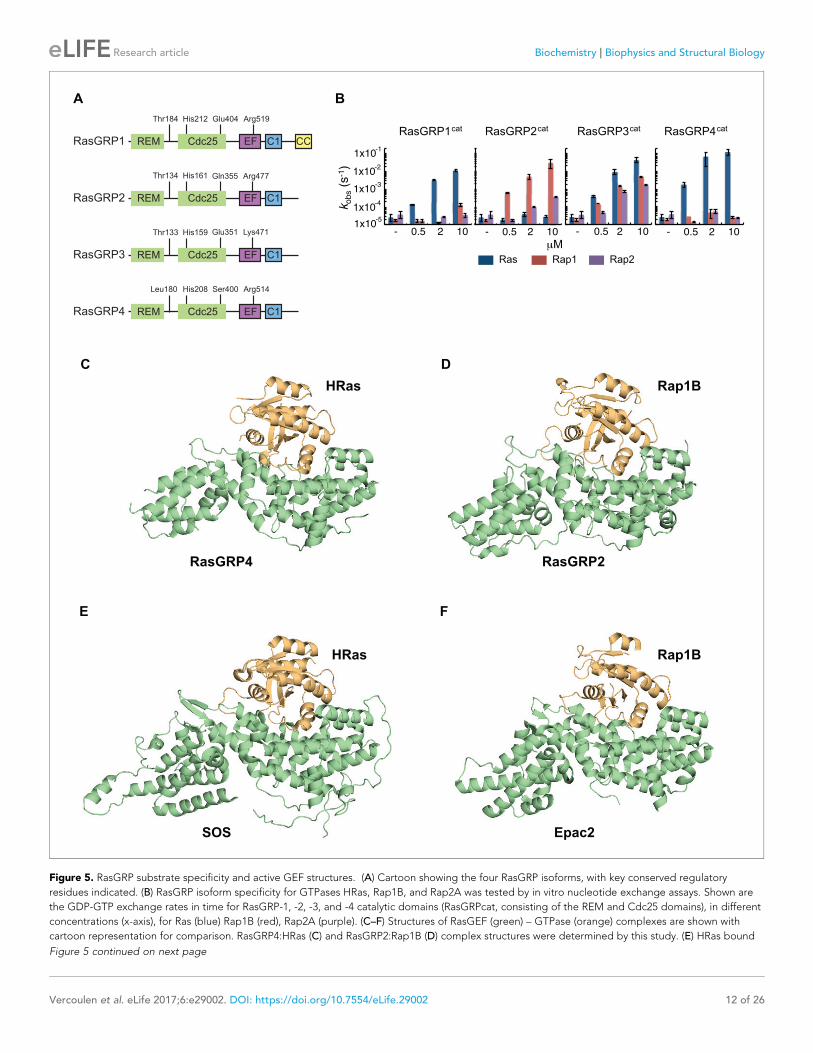
mode is similar to that seen in SOS:HRas (Boriack-Sjodin et al., 1998) and Epac2:Rap1B
(Rehmann et al., 2008) complexes (Figure 5E and F).
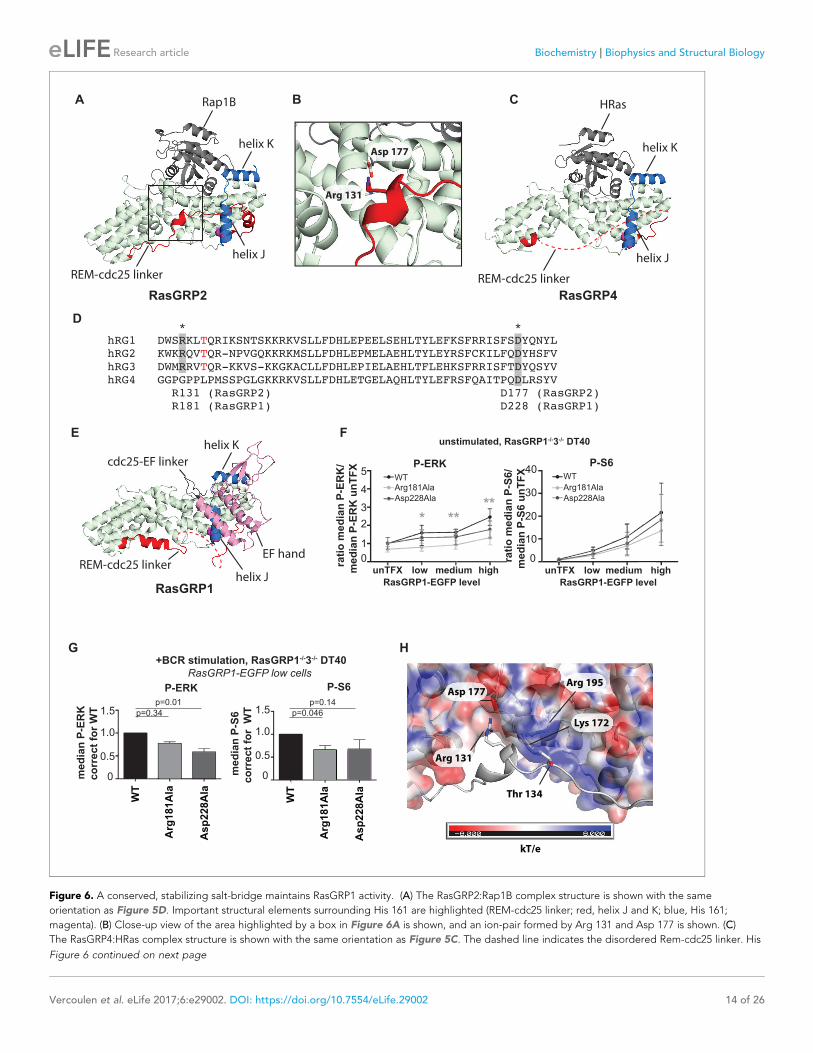
A role for the REM-cdc25 linker in stabilizing the active conformation ofRasGRPsAn intriguing aspect of the RasGRP2:Rap1B structure is that the linker connecting the REM domain
to the Cdc25 domain (REM-Cdc25 linker) is ordered in its entirety (Figure 6A and B). By contrast,
this linker is disordered in the RasGRP4 structure (Figure 6C). The sequence of the linker is con-
served between RasGRP1 and RasGRP2, but is drastically different in RasGRP4 (Figure 6D). The
structure of the linker as visualized in the RasGRP2 structure is of potential functional importance,
because it is inconsistent with adoption of the autoinhibited structure of RasGRP1 that we have
defined earlier (Iwig et al., 2013) (compare Figure 6A and B with Figure 6E).
In the structure of autoinhibited RasGRP1, the EF domain is docked on top of helix J of the
Cdc25 domain (Figure 6E; the helices are labeled as defined for the Cdc25 domain of SOS [Boriack-
Sjodin et al., 1998]). The docking of the EF domain maintains RasGRP1 in an inactive state in two
ways. First, the Cdc25-EF linker physically blocks the active site. Second, in the autoinhibited dimer,
interactions between the EF domain of one RasGRP1 molecule and the C1 domain of the other
block the membrane-interacting face of the C1 domain (see Figure 1B and [Iwig et al., 2013]). In
the structure of RasGRP2:Rap1B, the REM-Cdc25 linker runs along the surface of helix J, and wraps
around it by forming an a helix (Figure 6A).
The high sequence conservation of the REM-Cdc25 linker between RasGRP1 and RasGRP2 sug-
gests that the linker might adopt the same conformation in the active states of both molecules. Sup-
port for this idea is provided by experiments in which we disrupted ion-pairing hydrogen bonds
formed between Arg 131 in the REM-Cdc25 linker and Asp 177 in helix B of the Cdc25 domain, in
the RasGRP2:Rap1B structure (Figure 6B). We used our cellular assay to test whether mutation of
the corresponding residues in RasGRP1, Arg181 and Asp228, has any effect on GEF activity. Upon
mutation of the ion-pairing residues, only Arg 181 mutation to alanine (Arg 181 Ala) resulted in
somewhat lower levels of basal RasGRP1 signals to P-ERK (Figure 6F). These mutations did not sig-
nificantly impact the RasGRP1-p70S6 kinase pathway (Figure 6F), possibly because RasGRP1 signals
to S6 are relatively active in the basal state (Figure 1E). Both mutants (Arg 181 Ala and Asp 228 Ala)
revealed decreased induction of both P-ERK and P-S6 under BCR stimulatory conditions, in compari-
son to levels induced by wild type RasGRP1 (Figure 6G). Taken together, our results indicate that
formation of the ion pair between Arg 181 and Asp 228 is necessary for robust activation of
RasGRP1.
Another observation that points to the relevance of this linker conformation is that PMA- or anti-
gen receptor-induced phosphorylation of RasGRP1 at Thr 184 in the REM-Cdc25 linker, or RasGRP3
at the corresponding residue (Thr 133), is correlated with increased RasGRP activity. Mutation of
these threonine residues to alanine results in reduced, but not eliminated, RasGEF activity
(Aiba et al., 2004), whereas introduction of a negative charge to mimic a phosphorylated threonine
results in higher activity (Roose et al., 2005). The corresponding residue in RasGRP2 is Thr 134
(Figure 6D) and is phosphorylated in lymphocytes analyzed by total phospho-proteomics (Dr.
Doreen Cantrell, set of 11 phospho-peptides from RasGRP2, personal communication). The
Figure 4 continued
transfected with wildtype (WT) RasGRP1-EGFP were treated with NH4Cl (N = 4) or with NH4Cl + EIPA (N = 3). pHi was determined in triplicates of
controls and treated cells. Individual experiments are shown. Paired T-test was performed. (E, F) NH4Cl, NH4Cl + EIPA, and control treatment was
followed by B cell receptor (BCR) stimulation. Shown are average median levels ± SD of P-ERK in EGFP-low expressing cells, corrected for wildtype BCR
stimulated cells. WT was set on 1.0. (BCR, NH4Cl: N = 7, NH4ClL + EIPA: N = 4). Wilcoxon test was performed. (G) pHi was determined in untransfected
and cells transfected with WT or mutant RasGRP1-EGFP. Shown are means ±SD (N = 3). Kruskal-Wallis tests were performed with post-test Dunn’s
multiple comparisons between control, NH4Cl and NH4Cl + EIPA for each unTFX, or transfected RasGRP1 WT or mutant. P-values are depicted for
p<0.2. All other P-values showed no significance and are not indicated. (H, I) RasGRP1-EGFP His 212 variant and WT transfected cells were treated with
control, NH4Cl, followed by B cell receptor (BCR) stimulation. Shown are average median levels of P-ERK in EGFP-low expressing cells, corrected for
wildtype BCR stimulated cells. WT +BCR was set on 1.0. Shown are means ±SD (BCR, NH4Cl: N = 7, NH4CL + EIPA: N = 4). Wilcoxon test was
performed to test differences.
DOI: https://doi.org/10.7554/eLife.29002.008
Vercoulen et al. eLife 2017;6:e29002. DOI: https://doi.org/10.7554/eLife.29002 11 of 26
Research article Biochemistry Biophysics and Structural Biology
REM Cdc25 EF C1 CC
Thr184 His212 Glu404
RasGRP1
REM Cdc25 EF C1
His208
RasGRP4
REM Cdc25 EF C1
Thr133 His159
RasGRP3
REM Cdc25 EF C1
Thr134 His161
RasGRP2
A
RasGRP1cat RasGRP2cat RasGRP3cat
Ras Rap1 Rap2
1x10⁻⁴
1x10⁻³
1x10⁻²
1x10⁻¹
ko
bs (
s-1
)
1x10⁻⁵
- 500 nm 2 M 10 M - 500 nm 2 M 10 M - 500 nm 2 M 10 M - 500 nm 2 M 10 M
RasGRP4cat
!"!!!#$
!"!!#$
!"!#$
!"#$
!"!!!#$
!"!!#$
!"!#$
!"!!!#$
!"!!#$
!"!#$
!"#$
RasGRP1cat RasGRP2cat RasGRP3cat
Ras Rap1 Rap2
!"!!!!#$
!"!!!#$
!"!!#$
!"!#$
1x10⁻⁴
1x10⁻³
1x10⁻²
1x10⁻¹
ko
bs (
s-1
)
1x10⁻⁵
- 0.5 2 10
M- 0.5 2 10 - 0.5 2 10 - 0.5 2 10
RasGRP4cat
B
Arg519
Gln355 Arg477
Glu351 Lys471
Ser400 Arg514Leu180
C D
E F
RasGRP4 RasGRP2
SOS Epac2
HRas
HRas
Rap1B
Rap1B
Figure 5. RasGRP substrate specificity and active GEF structures. (A) Cartoon showing the four RasGRP isoforms, with key conserved regulatory
residues indicated. (B) RasGRP isoform specificity for GTPases HRas, Rap1B, and Rap2A was tested by in vitro nucleotide exchange assays. Shown are
the GDP-GTP exchange rates in time for RasGRP-1, -2, -3, and -4 catalytic domains (RasGRPcat, consisting of the REM and Cdc25 domains), in different
concentrations (x-axis), for Ras (blue) Rap1B (red), Rap2A (purple). (C–F) Structures of RasGEF (green) – GTPase (orange) complexes are shown with
cartoon representation for comparison. RasGRP4:HRas (C) and RasGRP2:Rap1B (D) complex structures were determined by this study. (E) HRas bound
Figure 5 continued on next page
Vercoulen et al. eLife 2017;6:e29002. DOI: https://doi.org/10.7554/eLife.29002 12 of 26
Research article Biochemistry Biophysics and Structural Biology

positioning of the REM-Cdc25 linker in the RasGRP2:Rap1B complexes places the side chain of Thr
134 close to the side chains of the positively charged Lys 172 and Arg 195 in the Cdc25 domain,
which provides a possible explanation for the activating effect of phosphorylation of the threonine
residue, which adds a negative charge (Figure 6H).
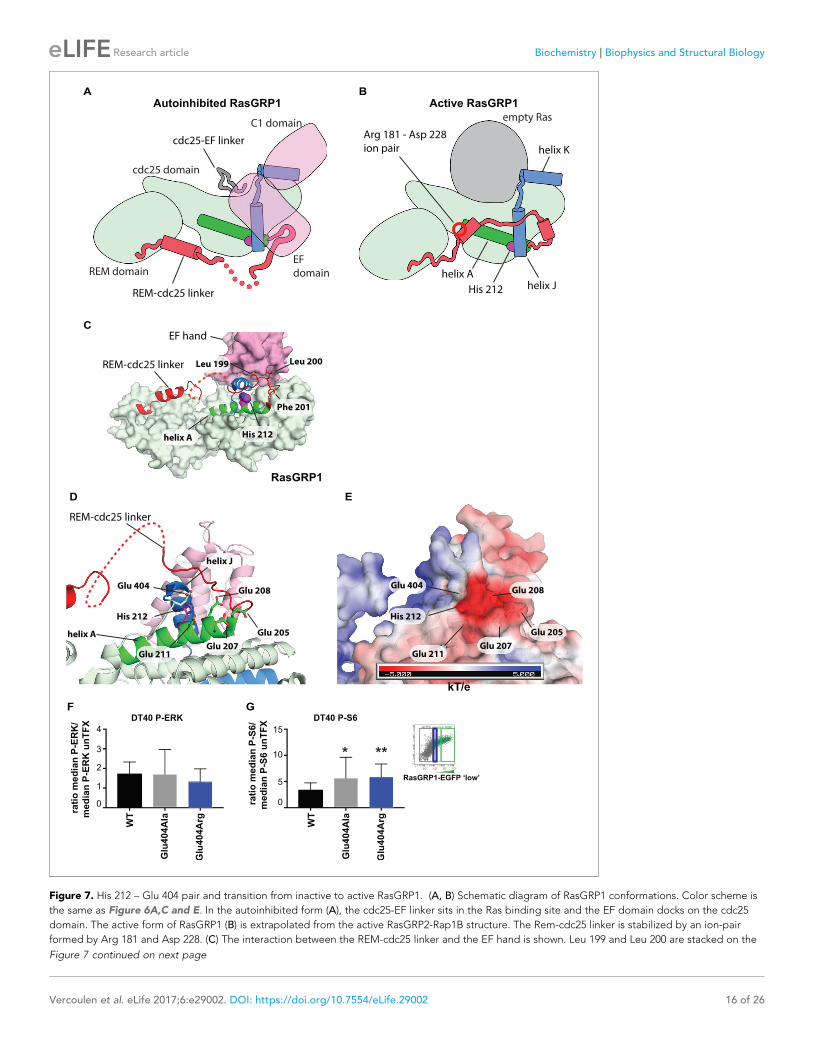
The location and environment of His 212 is consistent with a role as pHsensorThe cellular signaling results with variants of His 212, including the human SNV His 212 Tyr, and the
findings that His 212 is a pH sensor, prompted us to investigate how His 212 may impact the transi-
tion between the autoinhibited and active states of RasGRP1. Schematic diagrams for these two
states are shown in Figure 7A and B, which indicate the position of His 212 with respect to the
structural elements that rearrange in the transition. His 212 is located within helix A of the Cdc25
domain, at the interface between helices A and J. Helix J is connected to helix K, which forms part
of the Ras binding site. In the autoinhibited conformation of RasGRP1, Helix J is part of the platform
on which the EF domain is docked (Figure 7C). Thus, the location of His 212 is consistent with a role
for this residue in the transition between the active and inactive states of RasGRP1. In addition, the
structure suggests that the charge on the histidine residue will be important.
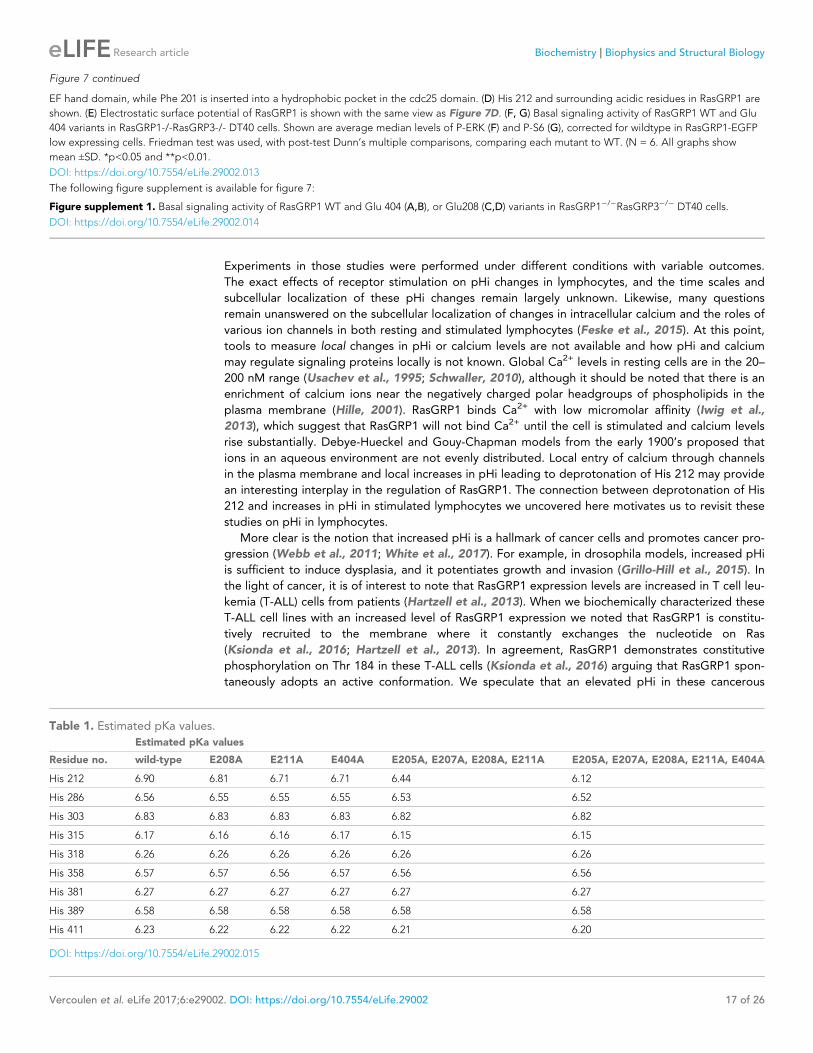
An unusual aspect of this histidine is that there are five negatively charged residues in its vicinity
(Figure 7D). Four of these are provided by helix A (Glu 205, Glu 207, Glu 208 and Glu 211) and the
fifth one (Glu 404) is provided by the loop leading into helix J, which packs against helix A
(Figure 7E). We estimated the pKa values of the histidine sidechains in RasGRP1, using continuum
electrostatics as implemented in a web-based server for the program DELPHI (Sharp and Honig,
1990; Wang et al., 2016). Using the crystal structure of the cdc25 domain of RasGRP1 (Iwig et al.,
2013), the pKa value of His 212 is calculated to be 6.90, that is, increased by almost 1 pH unit above
the pKa value of an isolated histidine (6.0). His 212 has the highest calculated pKa value among the
nine histidines in the cdc25, indicating that it is primed to convert from positive to neutral when the
intracellular pH increases beyond a neutral value (Table 1). The calculated pKa value of this residue
is reduced significantly when one or more of the four glutamate sidechains located nearby, in helix
A, are substituted by alanine.
We observed a similar cluster of glutamate residues surrounding a His pH sensor in the focal
adhesion-associated protein talin, and computational pKa prediction suggested that these gluta-
mate residues have increased pKa values (Srivastava et al., 2008). In both RasGRP1 and talin the
glutamate network could be part of the pH sensor with histidine. Supporting this idea, experimental
work has shown that histidines with coordinating glutamate residues have increased pKa values
when determined experimentally by NMR (Tishmack et al., 1997; Hiebler et al., 2017; Baran et al.,
2008). As noted earlier, mutation of His 212 to non-titratable residues abrogates pH sensitive activa-
tion, which is also consistent with a role for this residue in pH sensing.
We propose that the configuration of residues seen in the autoinhibited RasGRP1 structure is sta-
ble when His 212 is protonated, because the concentration of negative charge in this region would
favor a positively charged histidine. Neutralization of the histidine may favor disruption of the clus-
tering of negative charge, most likely by movement of Glu 404, in the loop leading into helix J (the
other four acidic residues are on the same helix as His 212, and are less likely to move away). In the
active structure, the loop bearing Glu 404 packs against the REM-Cdc25 linker (Figure 7). In the
autoinhibited RasGRP1 structure, the REM-Cdc25 linker positions two hydrophobic sidechains (Leu
Figure 5 continued
to the catalytic site of SOS and SOScat domain of the SOScat:HRas complex is extracted from PDB ID:1NVV (Margarit et al., 2003). (F) The structures
of REM-cdc25 domain of Epac2 and Rap1B in Epac2:Rap1B complex are extracted from PDB ID:3CF6 (Rehmann et al., 2008).
DOI: https://doi.org/10.7554/eLife.29002.009
The following source data and figure supplement are available for figure 5:
Source data 1. Crystallographic table (RasGRP).
DOI: https://doi.org/10.7554/eLife.29002.011
Figure supplement 1. Sequence comparison of RasGRP homologs.
DOI: https://doi.org/10.7554/eLife.29002.010
Vercoulen et al. eLife 2017;6:e29002. DOI: https://doi.org/10.7554/eLife.29002 13 of 26
Research article Biochemistry Biophysics and Structural Biology
F
p=0.01
WT
Arg181Ala
Asp228Ala
unstimulated, RasGRP1-/-3-/- DT40
rati
o m
ed
ian
P-E
RK
/
med
ian
P-E
RK
un
TF
X
unTFX low medium high
RasGRP1-EGFP level
P-ERK
0
1
2
3
4
5
rati
o m
ed
ian
P-S
6/
med
ian
P-S
6 u
nT
FX
unTFX low medium high
RasGRP1-EGFP level
P-S6
0
10
20
30
WT
Arg181Ala
Asp228Ala
40
0
0.5
1.0
1.5p=0.34
p=0.14
p=0.046
P-ERK P-S6
* ****
0
0.5
1.0
1.5
med
ian
P-E
RK
co
rrect
for
WT
med
ian
P-S
6
co
rrect
for
WT
G+BCR stimulation, RasGRP1-/-3-/- DT40
RasGRP1-EGFP low cells
D
H
* * hRG1 DWSRKLTQRIKSNTSKKRKVSLLFDHLEPEELSEHLTYLEFKSFRRISFSDYQNYL hRG2 KWKRQVTQR-NPVGQKKRKMSLLFDHLEPMELAEHLTYLEYRSFCKILFQDYHSFV hRG3 DWMRRVTQR-KKVS-KKGKACLLFDHLEPIELAEHLTFLEHKSFRRISFTDYQSYV hRG4 GGPGPPLPMSSPGLGKKRKVSLLFDHLETGELAQHLTYLEFRSFQAITPQDLRSYV R131 (RasGRP2) D177 (RasGRP2) R181 (RasGRP1) D228 (RasGRP1)
WT
Arg
181A
la
Asp
228A
la
WT
Arg
181A
la
Asp
228A
la
E
A B C
RasGRP2 RasGRP4
REM-cdc25 linker
helix K
Rap1B
helix J
Arg 131
Asp 177
HRas
E
RasGRP1
EF hand
cdc25-EF linker
helix K
helix J
REM-cdc25 linker
REM-cdc25 linker
helix K
helix J
Asp 177Arg 195
Thr 134
Arg 131
Lys 172
kT/e
Figure 6. A conserved, stabilizing salt-bridge maintains RasGRP1 activity. (A) The RasGRP2:Rap1B complex structure is shown with the same
orientation as Figure 5D. Important structural elements surrounding His 161 are highlighted (REM-cdc25 linker; red, helix J and K; blue, His 161;
magenta). (B) Close-up view of the area highlighted by a box in Figure 6A is shown, and an ion-pair formed by Arg 131 and Asp 177 is shown. (C)
The RasGRP4:HRas complex structure is shown with the same orientation as Figure 5C. The dashed line indicates the disordered Rem-cdc25 linker. His
Figure 6 continued on next page
Vercoulen et al. eLife 2017;6:e29002. DOI: https://doi.org/10.7554/eLife.29002 14 of 26
Research article Biochemistry Biophysics and Structural Biology

199 and Leu 200) against the hydrophobic interface formed between helix J and the EF domain
(Figure 7C). Release of the leucine residues, due to destabilization of the conformation of the REM-
Cdc25 linker, would weaken the interface with the EF domain and help initiate a transition towards
the active conformation. Consistent with this idea, we found that mutation of Glu 404 resulted in
altered RasGRP1 activity, while mutation of Glu 208, located within helix A, had no effect. Replace-
ment of Glu 404 by either alanine or arginine both resulted in increased signals to S6 but not to the
less basally active RasGRP1-ERK pathway (Figure 7F and G, and Figure 7—figure supplement 1).
Concluding remarksIn unstimulated cells, RasGRP1 is in an inactive conformation, in which the Cdc25-EF linker prevents
Ras binding to the active site (Iwig et al., 2013). In dimeric and autoinhibited RasGRP1, the EF
domains from each molecule in a RasGRP1 dimer block the DAG-binding sites on the C1 domains of
the dimer partner (Figure 8). Lymphocyte receptor stimulation results in increased pHi, increased
DAG levels, and increased intracelluar calcium levels, and we propose that these three signals coor-
dinately induce a conformational change in RasGRP1. The structure of the RasGRP2:Rap1B complex
that we have now determined establishes an important role for the REM-Cdc25 linker in the transi-
tion to the active state. A prominent feature in the active RasGRP2 structure is the formation of an
ion-pair between Arg 131, in the REM-Cdc25 linker and Asp 177 in the Cdc25 domain (Arg 181 and
Asp 228 in RasGRP1). This salt bridge and the position of the REM-Cdc25 linker reinforces the active
conformation of RasGRP and is incompatible with the autoinhibited conformation (Figure 7).
The sequence of the REM-Cdc25 linker is conserved between RasGRP1, RasGRP2 and RasGRP3
(Figure 6D). This suggests that these proteins share a common regulatory mechanism. For RasGRP1,
this mechanism provides the first plausible structural explanation for how phosphorylation of Thr 184
in RasGRP1 (Zheng et al., 2005; Roose et al., 2007) results in a stable active conformation (Fig-
ure 8). The sequence of the REM-Cdc25 linker is divergent in RasGRP4, however, and the sequence
of the EF domain indicates that RasGRP4 is unlikely to be regulated by calcium (Iwig et al., 2013;
Reuther et al., 2002). Thus it appears that the regulation of RasGRP4 is likely to be different from
that of the other three members of the family.
Our analysis of SNPs in the RasGRP proteins led to the finding that His 212 in RasGRP1 functions
as a pH sensor. Receptor signaling-induced increases in pHi is expected to convert His 212 to the
deprotonated and neutral form, which destabilizes the autoinhibited conformation and potentiates
the activation of RasGRP1 by calcium flux and DAG formation at the membrane (Figure 8). His 212
is predicted to have an increased pKa value, which is likely influenced by the adjacent cluster of glu-
tamate residues. Supporting this idea, experimental work has shown that histidines with coordinat-
ing glutamate residues have upshifted pKa values when determined experimentally by NMR
(Tishmack et al., 1997; Hiebler et al., 2017; Baran et al., 2008). At this point we cannot formally
rule out the possibility that other histidines in RasGRP1 also function as pH sensors. However, the
fact that mutation of His 212 to non-titratable residues abrogates pH sensitive activation, strongly
suggests that His 212 is essential for the pH-sensitive function of RasGRP.
Most studies describing pHi changes upon receptor stimulation in lymphocytes have been pub-
lished roughly 30 years ago (Cheung et al., 1988; Fischer et al., 1988;Mills et al., 1985).
Figure 6 continued
208 and other structural elements are highlighted as Figure 6A. (D) Alignment of RasGRP isoforms, highlighting RasGRP2’s Arg 131 and Asp 177 in
grey as conserved residues corresponding to Arg 181 and Asp 228 in RasGRP1. The RasGRP1 phosphorylation site Thr 184 is in red. (E) The RasGRP1
structure (PDB ID: 4L9M [Iwig et al., 2013];) is shown with the same orientation as Figure 6A. and Figure 6C. The structural elements are colored as
Figure 6A and C with additional elements (cdc25-EF linker; gray, EF hand and C1 domains; pink). (F) DT40 RasGRP1�/�RasGRP3�/� cells were
transfected with RasGRP1-EGFP WT or variants Arg 181 Ala, Asp 228 Ala. The basal signaling activity of RasGRP1 WT and variants was determined.
Shown are average median basal levels of P-ERK and P-S6, corrected for untransfected cells. Kruskal-wallis test was used, with post-test Dunn’s multiple
comparisons, comparing each mutant to WT. All graphs show mean ±SD (N = 5). *p<0.05, **p<0.01. (G) Cells were unstimulated, or stimulated for 5
min with anti-B cell receptor antibody (clone M4). Only RasGRP1-EGFP low expressing cells were analyzed. Shown are average median levels of P-ERK
and P-S6 in EGFP-low expressing cells, corrected for wildtype (WT). WT is set on 1.0. Kruskal-Wallis test was used with post-test Dunn’s multiple
comparisons, comparing each variant to WT. All graphs show mean ±SD (N = 3), P-values are shown. (H) Electrostatic surface potential of RasGRP2
except the REM-Cdc25 linker, calculated by APBS (Baker et al., 2001), is shown. The REM-Cdc25 linker is shown with cartoon model.
DOI: https://doi.org/10.7554/eLife.29002.012
Vercoulen et al. eLife 2017;6:e29002. DOI: https://doi.org/10.7554/eLife.29002 15 of 26
Research article Biochemistry Biophysics and Structural Biology
cdc25 domain
C1 domain
EF
domainREM domain
REM-cdc25 linker
cdc25-EF linkerhelix K
helix J
Arg 181 - Asp 228
ion pair
helix A
empty Ras
His 212
Leu 199 Leu 200
Phe 201
His 212helix A
REM-cdc25 linker
EF hand
Glu 208
Glu 205
Glu 207Glu 211
Glu 404
REM-cdc25 linker
His 212
helix A
helix J
His 212
Glu 208
Glu 205
Glu 207Glu 211
Glu 404
Figure 7. His 212 – Glu 404 pair and transition from inactive to active RasGRP1. (A, B) Schematic diagram of RasGRP1 conformations. Color scheme is
the same as Figure 6A,C and E. In the autoinhibited form (A), the cdc25-EF linker sits in the Ras binding site and the EF domain docks on the cdc25
domain. The active form of RasGRP1 (B) is extrapolated from the active RasGRP2-Rap1B structure. The Rem-cdc25 linker is stabilized by an ion-pair
formed by Arg 181 and Asp 228. (C) The interaction between the REM-cdc25 linker and the EF hand is shown. Leu 199 and Leu 200 are stacked on the
Figure 7 continued on next page
Vercoulen et al. eLife 2017;6:e29002. DOI: https://doi.org/10.7554/eLife.29002 16 of 26
Research article Biochemistry Biophysics and Structural Biology
Experiments in those studies were performed under different conditions with variable outcomes.
The exact effects of receptor stimulation on pHi changes in lymphocytes, and the time scales and
subcellular localization of these pHi changes remain largely unknown. Likewise, many questions
remain unanswered on the subcellular localization of changes in intracellular calcium and the roles of
various ion channels in both resting and stimulated lymphocytes (Feske et al., 2015). At this point,
tools to measure local changes in pHi or calcium levels are not available and how pHi and calcium
may regulate signaling proteins locally is not known. Global Ca2+ levels in resting cells are in the 20–
200 nM range (Usachev et al., 1995; Schwaller, 2010), although it should be noted that there is an
enrichment of calcium ions near the negatively charged polar headgroups of phospholipids in the
plasma membrane (Hille, 2001). RasGRP1 binds Ca2+ with low micromolar affinity (Iwig et al.,
2013), which suggest that RasGRP1 will not bind Ca2+ until the cell is stimulated and calcium levels
rise substantially. Debye-Hueckel and Gouy-Chapman models from the early 1900’s proposed that
ions in an aqueous environment are not evenly distributed. Local entry of calcium through channels
in the plasma membrane and local increases in pHi leading to deprotonation of His 212 may provide
an interesting interplay in the regulation of RasGRP1. The connection between deprotonation of His
212 and increases in pHi in stimulated lymphocytes we uncovered here motivates us to revisit these
studies on pHi in lymphocytes.
More clear is the notion that increased pHi is a hallmark of cancer cells and promotes cancer pro-
gression (Webb et al., 2011; White et al., 2017). For example, in drosophila models, increased pHi
is sufficient to induce dysplasia, and it potentiates growth and invasion (Grillo-Hill et al., 2015). In
the light of cancer, it is of interest to note that RasGRP1 expression levels are increased in T cell leu-
kemia (T-ALL) cells from patients (Hartzell et al., 2013). When we biochemically characterized these
T-ALL cell lines with an increased level of RasGRP1 expression we noted that RasGRP1 is constitu-
tively recruited to the membrane where it constantly exchanges the nucleotide on Ras
(Ksionda et al., 2016; Hartzell et al., 2013). In agreement, RasGRP1 demonstrates constitutive
phosphorylation on Thr 184 in these T-ALL cells (Ksionda et al., 2016) arguing that RasGRP1 spon-
taneously adopts an active conformation. We speculate that an elevated pHi in these cancerous
Figure 7 continued
EF hand domain, while Phe 201 is inserted into a hydrophobic pocket in the cdc25 domain. (D) His 212 and surrounding acidic residues in RasGRP1 are
shown. (E) Electrostatic surface potential of RasGRP1 is shown with the same view as Figure 7D. (F, G) Basal signaling activity of RasGRP1 WT and Glu
404 variants in RasGRP1-/-RasGRP3-/- DT40 cells. Shown are average median levels of P-ERK (F) and P-S6 (G), corrected for wildtype in RasGRP1-EGFP
low expressing cells. Friedman test was used, with post-test Dunn’s multiple comparisons, comparing each mutant to WT. (N = 6. All graphs show
mean ±SD. *p<0.05 and **p<0.01.
DOI: https://doi.org/10.7554/eLife.29002.013
The following figure supplement is available for figure 7:
Figure supplement 1. Basal signaling activity of RasGRP1 WT and Glu 404 (A,B), or Glu208 (C,D) variants in RasGRP1�/�RasGRP3�/� DT40 cells.
DOI: https://doi.org/10.7554/eLife.29002.014
Table 1. Estimated pKa values.
Estimated pKa values
Residue no. wild-type E208A E211A E404A E205A, E207A, E208A, E211A E205A, E207A, E208A, E211A, E404A
His 212 6.90 6.81 6.71 6.71 6.44 6.12
His 286 6.56 6.55 6.55 6.55 6.53 6.52
His 303 6.83 6.83 6.83 6.83 6.82 6.82
His 315 6.17 6.16 6.16 6.17 6.15 6.15
His 318 6.26 6.26 6.26 6.26 6.26 6.26
His 358 6.57 6.57 6.56 6.57 6.56 6.56
His 381 6.27 6.27 6.27 6.27 6.27 6.27
His 389 6.58 6.58 6.58 6.58 6.58 6.58
His 411 6.23 6.22 6.22 6.22 6.21 6.20
DOI: https://doi.org/10.7554/eLife.29002.015
Vercoulen et al. eLife 2017;6:e29002. DOI: https://doi.org/10.7554/eLife.29002 17 of 26
Research article Biochemistry Biophysics and Structural Biology

T-ALL cells facilitates opening up of the overexpressed RasGRP1 leading to the constitutively high
level exchange activity that we observed (Ksionda et al., 2016; Hartzell et al., 2013).
Materials and methods
Cell linesJurkat and low level RasGRP1 expressing JPRM441 cells were previously characterized (Roose et al.,
2005) and described (Roose et al., 2007). RasGRP1�/�RasGRP3�/� DT40 cells were described in
(Roose et al., 2007).
Medium and buffersJurkat and JPRM441 were cultured in RPMI1640 (Hyclone), containing 10% Fetal calf serum (FCS),
1% glutamine, 10 mM Hepes, penicillin and streptomycin. DT40 culture medium contained addi-
tional 1% chicken serum. After electroporation, cells were recovered in culture medium without peni-
cillin and streptomycin. Starvation of cells was performed in culture medium containing low FCS
(0.2%) for 3 hr, or in plain RPMI1640 for 30 mins. FACS buffer consisted of Phosphate buffered salt
(PBS) with 2 mM EDTA, 2% FCS, and 0.1% NaN3.
R181
O
O
N
N
N
R181
D228
DAG
lymphocyte receptor
Signal
Diacylglycerol (DAG)
Cytoplasmic calcium (Ca2+)
Active, Ras bound
RasGRP1 dimer
cdc25-EF
linker
REM-cdc25
linker (dyslocated)
Ras
cdc25REM
C1
EF
cc
H212
Ca2+O
O
N
N
N
D228
Inactive conformation
lymphocyte receptor
antigen/stimulus
Initiation of conformational change Stable active conformation
pHi
Deprotonation His212
H212+ H212+REM
-cdc25
linker
RasO
ON
N
N
R181D228
cdc25
-EF linker
RasH212
Ca2+
Ras
H212
H+
T184 P-T184P
Phosphorylation (P) T184
REM-cdc25 linker moves to active conformation
Formation stabilizing saltbridge linker & cdc25
Inactive
RasGRP1 dimer
Figure 8. Model of RasGRP1 regulation. (Left) In resting cells, RasGRP1’s basal activity is autoinhibited through a dimer; the Cdc25-EF linker (red)
blocks the Ras binding site, and the EF hands (purple) prevent C1 domains (cyan) from binding diacylglycerol (DAG), and thus block membrane
recruitment. (Middle) Upon receptor stimulation, DAG- and intracellular calcium- levels are induced and the intracellular pH (pHi) increases, which we
propose leads to deprotonation of His 212, calcium binding to the EF-hand, and initiation of a conformational change that allows for binding to DAG at
the membrane. (Right) Formation of a stable, active RasGRP1 conformation. Phosphorylation of Thr 184 promotes the proximity of the REM-Cdc25
linker (black) with the positively charged patch in the Cdc25 domain of RasGRP1. At the same time, a salt-bridge is formed between Asp 228 and R181
to stabilize the active conformation.
DOI: https://doi.org/10.7554/eLife.29002.016
Vercoulen et al. eLife 2017;6:e29002. DOI: https://doi.org/10.7554/eLife.29002 18 of 26
Research article Biochemistry Biophysics and Structural Biology

Transfection of cells with RasGRP1-EGFP plasmidsRasGRP1�/�RasGRP3�/� DT40 cells, or low level RasGRP1 expressing JPRM441 cells (Roose et al.,
2005) were transfected by electroporation with DNA plasmids encoding EGFPN1-RasGRP1 wildtype
or mutant (20 � 106 cells with 20 microgram DNA)(Biorad Genepulser Xcel). Then cells were rested,
stimulated and used for flow cytometry, microscopy, and pHi modulation as described below.
Flow cytometry assaysThe protocol was slightly modified from an earlier published version (Iwig et al., 2013). DT40 cells,
or JPRM441 cells (Roose et al., 2005) were transfected as described above, and recovered in cul-
ture medium without antibiotics for 3–4 hr. Cells were washed, resuspended in plain RPMI, seeded
0.4 � 106 per well in a 96 well round bottom plate, and starved in an incubator for 30 min. DT40
cells were stimulated with anti-IgM (clone M4), cross-linking the B cell receptor, or with vector
(RPMI), and JPRM441 cells were treated with RPMI1640 only for 5 min. Cells were fixated in pre-
warmed fixations buffer (BD, Cytofix, BD biosciences, San Jose, CA), or in 4% paraformaldehyde in
Phosphate buffered saline (PBS), for 15 min at 21˚C, washed in FACSbuffer, and permeabilized in
either 0.5% Phosflow buffer IV (BD biosciences) for 15 min at 21˚C, or MetOH for 30 min on ice. Bar-
coding protocols were modified from described methods (Krutzik et al., 2011). Pacific Blue and
Alexa Fluor 750 carboxilic acid succinimidyl-esters (Life Technologies, Grand Island, NY) were added
in the methanol or the phosflow buffer IV in titrated serial dilutions, and incubated for 30 min on ice
(Methanol), or for 15 min at 21˚C (phosflow buffer IV). Cells were washed thoroughly in FACS buffer,
and barcoded cells were pooled and incubated for 30 min with antibodies towards P-ERK, P-S6, and
for JPRM441 cells we used cleaved caspase or cleaved PARP to exclude (pre-) apoptotic cells from
analysis. Cells were washed and analyzed using the LSR II flow cytometer, or LSR Fortessa (BD Bio-
sciences, San Jose, CA, USA). Data were analyzed using Cytobank (Cytobank Inc, Mountain View,
CA, USA). In some of the pHi modulation experiments cells were measured without barcoding.
Antibodies for flow cytometryAnti-phosphorylated-S6 -PE (clone D57.2.2E, #5316 s, diluted 1:200), anti-phosphorylated ERK-
AF647 (clone 137F5, #5376, diluted 1:50), cleaved caspase 3- pacific blue (clone D3E9, #8788,
diluted 1:200), or anti-phosphorylated ERK (clone 197G2, #4377 s, diluted 1:50) all from Cell Signal-
ing Technologies, Beverly, MA, USA). Unconjugated P-ERK was followed by AffiniPure F(ab’)2 frag-
ment Donkey-anti-Rabbit IgG, conjugated to APC (#711-136-152, diluted 1:50) or PE (#711-116-152,
diluted 1:50, Jackson ImmunoResearch, West Grove, PA, USA), or cleaved PARP-AF647 (clone F21-
852, #558710, diluted 1:100, BD Biosciences, San Jose, CA, USA)
Microscopy assaysRasGRP1-RasGRP3 deficient DT40 cells were transfected by electroporation with DNA plasmids
encoding EGFPN1-RasGRP1. Cells were cultured for 4 hr, and starved for 30 min in RPMI. Cells were
stimulated by anti-IgM (M4), cross-linking the B cell receptor, 20 ng/ml PMA, or with vehicle (RPMI)
for 2 min. Cells were fixated in 4% paraformaldehyde in PBS, for 15 min, at 21˚C, and washed. Cells
were FACS sorted (MoFlo XDP, Beckman Coulter,CA, USA) for RasGRP1-EGFP low or high expres-
sion onto poly-L Lysine coated microscopy slides. For each sample 30–50 RasGRP1-EGFP-low cells
were captured on a Zeiss confocal microscope, and scored blindly by 2 independent researchers for
localization of RasGRP1 (cytoplasmic, or membrane. Cells with partial or full membrane localization
(showing a clear line of increased GFP signal at the edge) were counted as ’membrane localization’.
Whilst cells only without clear increased membrane fluorescent signal were counted as ’cytoplasma
localization’. Profiles were made with Fiji (ImageJ) software.
pHi modulation and receptor stimulation in cellsCells were transfected as described above, recovered for 2 hr in culture medium containing 10%
FCS without antibiotics, and then transferred to starvation medium containing 0.2% FCS for 3 hr
prior to assay. Cells were then were treated with 15 mM ammonium chloride (NH4Cl) in RPMI for 10
min to increase pHi, or pulsed with 15 mM NH4Cl for 15 min, spun down to remove NH4Cl, and
resuspended in RPMI with 10 mM EIPA (5’-(N-ethyl-N-isopropyl)amiloride, a selective inhibitor of
Na+/H+ exchanger NHE1 activity, Enzo Life Science) for 5 min to decrease pHi (Choi et al., 2013).
Vercoulen et al. eLife 2017;6:e29002. DOI: https://doi.org/10.7554/eLife.29002 19 of 26
Research article Biochemistry Biophysics and Structural Biology
Next, stimulation with anti-B cell receptor antibody M4 (1:1000) or 20 ng/ml diacylglycerol analogue
PMA (phorbol 12-myristate 13-acetate) was performed in presence of NH4Cl, EIPA, or RPMI (con-
trol), and after 5 minutes cells were fixated in 4% PFA (paraformaldehyde) in PBS (phosphate buff-
ered salt).
pHi measurements0.5 � 106 cells per well were plated on a 24 well dishes coated with poly-L Lysine, and induced to
be quiescent by maintaining for 3 hr in RPMI with 0.2% FCS. Intracellular pH (pHi) was determined
as previously described (Choi et al., 2013) in a bicarbonate buffer (25 mM HCO3�, 115 mM NaCl, 5
mM KCl, 10 mM glucose, 1 mM KPO4, 1 mM MgSO4, and 2 mM CaCl2, pH 7.4) by using cells loaded
with 1 mM 20,70-bis-(2-carboxyethyl)�5-(and-6)-carboxyfluorescein (BCECF; Invitrogen). To determine
steady-state pHi, fluorescence of BCECF at Ex490/Em530 and Ex440/Em530 was acquired every 15
s for 5 min using a plate reader (SpectraMax M5; Molecular Dynamics) and the fluorescence ratios
were converted to pHi by calibrating the fluorescence in each well with 10 mM nigericin in 105 mM
KCl.
In vitro nucleotide exchange assayIn vitro nucleotide exchange rates for RasGRP1-4 proteins (RasGRP1cat, RasGRP2cat, RasGRP3, and
RasGRP4cat) and small GTPases (HRas, Rap1B, and Rap2A) were measured and analyzed as
described previously (Iwig et al., 2013), except that the final GTPase concentration was 1 mM
instead of 500 nM.
Protein expression and purificationRasGRP2cat (residues 1-394), RasGRP2cat (1-425), and RasGRP4cat (46-460) expression vectors
were constructed by inserting the genes into 2CT-10 plasmid (attaches an N-terminal hexa-histidine
tag followed by MBP and TEV protease cleavage site), a gift from Scott Gradia (Addgene plasmid #
55209). RasGRP3cat (1-418) was cloned into pSMT3 vector. Rap1B (1-167), Rap1B (1-175), and
Rap2A (1-167) was cloned into pProEX HTb vector (Invitrogen). All proteins correspond to human
genes.
Non-labeled RasGRPcat domains were expressed in T7 Xpress cells (NEB) in Terrific Broth media.
RasGRP2cat labeled with selenomethionine (SeMet) (residues 1–394) was expressed in BL21(DE3)
cells in M9 minimal media with 50 mg/ml of each amino acid except methionine, 5 mg/ml methionine
and 50 mg/ml SeMet.
For RasGRPcat domains, the cells were grown at 37˚C with 100 mg/ml ampicillin, and induced
with 0.25 mM IPTG at 15˚C for 14–18 hr. The cells were suspended in the Ni-A buffer (25 mM Tris
pH8.0 500 mM NaCl, 10% Glycerol, 20 mM imidazole, and 5 mM b-mercaptoethanol) supplemented
with 200 mM AEBSF, 5 mM leupeptin and 500 mM benzamidine, and lysed by a cell disrupter. The
cell lysate was cleared by ultracentrifugation with 142,032 x g for 1 hr and applied to HisTrap column
(GE Healthcare). The protein was eluted by Ni-A buffer supplemented with 500 mM imidazole. The
MBP tag was cleaved off by addition of TEV protease while dialyzing against the buffer (25 mM Tris
pH8.0, 100 mM NaCl, 10% glycerol, 1 mM TCEP). The protein was run through HisTrap column and
the flowthrough was collected. The protein was concentrated using Amicon Ultra ultrafiltration unit
(EMD Millipore) and run on an S-75 size-exclusion column equilibrated with SEC buffer (25 mM Tris
pH 8.0, 100 mM NaCl, 10% glycerol, 1 mM TCEP). The protein was concentrated and stored at
�80˚C after flash-freezing using liquid nitrogen.
HRas (residues 1–166), Rap1B (1-167), Rap1B (1-175), and Rap2A (1-167) were expressed and
purified as described previously for HRas (Iwig et al., 2013).
Crystallization and structure determinationThe RasGRP2:Rap1B complex and the RasGRP4:HRas complex were formed by mixing the proteins
at 1:2 ratio of the GEF and either Rap1B or HRas. After addition of alkaline phosphatase (SIGMA,
P0114), the sample was incubated at 4˚C overnight. The complexes were purified by gel filtration
(Superdex 75 column) in SEC buffer.
Crystals of SeMet-labeled RasGRP2cat bound to Rap1B were obtained by sitting-drop vapor dif-
fusion (500 mL reservoir volume) by mixing 2 mL of protein (30 mg/mL) with 2 mL of the reservoir
Vercoulen et al. eLife 2017;6:e29002. DOI: https://doi.org/10.7554/eLife.29002 20 of 26
Research article Biochemistry Biophysics and Structural Biology

solution containing 17% PEG3350 and 10 mM sodium citrate (pH 5.6) at 20˚C. The crystals were
streak-seeded from another crystallization drop using a cat whisker 3 min after mixing the drops.
Crystals were harvested for data collection after one month, cryoprotected by incubating them in
mother liquor supplemented with 10% xylitol, and flash-frozen in liquid nitrogen. Most of the crystals
grown in this condition were in space group P21221, and exhibited anisotropic diffraction, but the
best data were obtained from one crystal with space group I212121. All X-ray diffraction data were
collected at Advanced Light Source beamlines 8.3.1 and 8.3.2. The data were integrated and scaled
using XDS (Kabsch, 2010) and Aimless (Evans, 2006).
Crystals of the RasGRP4cat:HRas complex were obtained by hanging-drop vapor diffusion (500
mL reservoir volume) by mixing 1 mL of protein (10 mg/mL) with 1 mL of the reservoir solution contain-
ing 20% PEG3350 and 300 mM sodium thiocyanate at 20˚C. The crystals were cryoprotected by the
reservoir solution supplemented with 20% glycerol before flash-frozen in liquid nitrogen. The space
group of the RasGRP4cat:HRas crystals was initially assigned as P6322, and molecular replacement
using Phaser (McCoy et al., 2007) with the RasGRP1 Cdc25 domain (PDB ID: 4L9M) as a search
model placed three copies of RasGRP4cat in the asymmetric unit. We were able to place HRas
bound to RasGRP4cat as observed in the SOS-HRas complex (Boriack-Sjodin et al., 1998), but we
could not model the REM domain due to weak electron density. We then processed the data in a
lower-symmetry space group (P3212), The final model contains six copies of the RasGRP4cat:HRas
complex. The model was rebuilt using Coot (Emsley et al., 2010) and the structure was refined by
Refmac (Murshudov et al., 2011) and Phenix (Adams et al., 2010) in an iterative manner (Figure 5—
source data 1). The application of a twinning operator (h, k, l fi k, h, -l) gave better electron density
for the REM domain.
Anomalous diffraction data for crystals of SeMet-labeled RasGRP2cat bound to Rap1B were inte-
grated and scaled as for the RasGRP4cat-HRas data. Phase were determined by molecular replace-
ment using Phaser with RasGRP4cat-HRas as a search model, and refinement was performed with
Refmac and Phenix using anomalous data to reduce the model bias with rebuilding the model using
Coot (Figure 5—source data 1).
AcknowledgementsThe authors thank Marsilius Mues and Andre Limnander for assistance with mutagenesis, Jesse E Jun
for advice on DT40 cell assays, Frank L Bos for technical assistance with confocal microscopy, Tiago
Barros and Christine Gee for technical assistance with crystallography, and members of the Roose,
Kuriyan and Arthur Weiss labs for helpful discussions. The Rap1 and Rap2 plasmids were gifts from
Dr. Xuewu Zhang at UT Southwestern.
This research was supported by a P01 Program grant from NIH-NIAID (AI091580 – to JK and
JPR). Further support came from a Marie Curie International Outgoing Fellowship # PIOF-GA-2012–
328666 (to YV) and R01-AI104789 (to JPR), NIH grant 5F32GM095149-03 (JSI), NIH grants R01-
CA197855 (DLB) and F32-CA177085 (KAW) and the Dutch Arthritis Foundation, the Foundation for
Scientific Research in Internal Medicine (SWOIG) Nijmegen, the KWF (Dutch Cancer Society), the Nij-
bakker-Morra Foundation, and the Nora Baart Foundation (all to ABJ).
Additional information
Competing interests
John Kuriyan: Senior editor, eLife. The other authors declare that no competing interests exist.
Funding
Funder Author
National Institute of Allergyand Infectious Diseases
John KuriyanJeroen P Roose
National Cancer Institute Katharine A WhiteDiane L Barber
Vercoulen et al. eLife 2017;6:e29002. DOI: https://doi.org/10.7554/eLife.29002 21 of 26
Research article Biochemistry Biophysics and Structural Biology

Marie Curie International Out-going Fellowship
Yvonne Vercoulen
The funders had no role in study design, data collection and
interpretation, or the decision to submit the work for publication.
Author contributions
Yvonne Vercoulen, Conceptualization, Data curation, Formal analysis, Funding acquisition, Investiga-
tion, Methodology, Writing—original draft; Yasushi Kondo, Jeffrey S Iwig, Conceptualization, Data
curation, Formal analysis, Investigation, Methodology, Writing—review and editing; Axel B Janssen,
Formal analysis, Investigation; Katharine A White, Diane L Barber, Formal analysis, Investigation,
Writing—review and editing; Mojtaba Amini, Investigation; John Kuriyan, Jeroen P Roose, Concep-
tualization, Supervision, Funding acquisition, Writing—original draft, Writing—review and editing
Author ORCIDs
Yvonne Vercoulen http://orcid.org/0000-0002-5060-2603
Yasushi Kondo http://orcid.org/0000-0003-2131-575X
Axel B Janssen http://orcid.org/0000-0002-9865-447X
Diane L Barber http://orcid.org/0000-0001-7185-9435
John Kuriyan https://orcid.org/0000-0002-4414-5477
Jeroen P Roose https://orcid.org/0000-0003-4746-2811
Decision letter and Author response
Decision letter https://doi.org/10.7554/eLife.29002.021
Author response https://doi.org/10.7554/eLife.29002.022
Additional files
Major datasets
The following datasets were generated:
Author(s) Year Dataset title Dataset URL
Database, license,and accessibilityinformation
Yasushi Kondo, Jef-frey S Iwig, JohnKuriyan
2017 Structure of RasGRP2 in complexwith Rap1B
http://www.pdb.org/pdb/search/structid-Search.do?structureId=6AXF
Publicly available atPDB (accession no:6AXF)
Yasushi Kondo, Jef-frey S Iwig, JohnKuriyan
2017 Structure of RasGRP4 in complexwith HRas
http://www.pdb.org/pdb/search/structid-Search.do?structureId=6AXG
Publicly available atPDB (accession no:6AXG)
ReferencesAbecasis GR, Altshuler D, Auton A, Brooks LD, Durbin RM, Gibbs RA, Hurles ME, McVean GA, Genomes ProjectC, 1000 Genomes Project Consortium. 2010. A map of human genome variation from population-scalesequencing. Nature 467:1061–1073. DOI: https://doi.org/10.1038/nature09534, PMID: 20981092
Abraham RT, Weiss A. 2004. Jurkat T cells and development of the T-cell receptor signalling paradigm. NatureReviews Immunology 4:301–308. DOI: https://doi.org/10.1038/nri1330, PMID: 15057788
Adams PD, Afonine PV, Bunkoczi G, Chen VB, Davis IW, Echols N, Headd JJ, Hung LW, Kapral GJ, Grosse-Kunstleve RW, McCoy AJ, Moriarty NW, Oeffner R, Read RJ, Richardson DC, Richardson JS, Terwilliger TC,Zwart PH. 2010. PHENIX: a comprehensive Python-based system for macromolecular structure solution. ActaCrystallographica Section D Biological Crystallography 66:213–221. DOI: https://doi.org/10.1107/S0907444909052925, PMID: 20124702
Aiba Y, Oh-hora M, Kiyonaka S, Kimura Y, Hijikata A, Mori Y, Kurosaki T. 2004. Activation of RasGRP3 byphosphorylation of Thr-133 is required for B cell receptor-mediated Ras activation. PNAS 101:16612–16617.DOI: https://doi.org/10.1073/pnas.0407468101, PMID: 15545601
Vercoulen et al. eLife 2017;6:e29002. DOI: https://doi.org/10.7554/eLife.29002 22 of 26
Research article Biochemistry Biophysics and Structural Biology

Baker NA, Sept D, Joseph S, Holst MJ, McCammon JA. 2001. Electrostatics of nanosystems: application tomicrotubules and the ribosome. PNAS 98:10037–10041. DOI: https://doi.org/10.1073/pnas.181342398,PMID: 11517324
Baran KL, Chimenti MS, Schlessman JL, Fitch CA, Herbst KJ, Garcia-Moreno BE. 2008. Electrostatic effects in anetwork of polar and ionizable groups in staphylococcal nuclease. Journal of Molecular Biology 379:1045–1062. DOI: https://doi.org/10.1016/j.jmb.2008.04.021, PMID: 18499123
Beaulieu N, Zahedi B, Goulding RE, Tazmini G, Anthony KV, Omeis SL, de Jong DR, Kay RJ. 2007. Regulation ofRasGRP1 by B cell antigen receptor requires cooperativity between three domains controlling translocation tothe plasma membrane. Molecular Biology of the Cell 18:3156–3168. DOI: https://doi.org/10.1091/mbc.E06-10-0932, PMID: 17567957
Bivona TG, Perez De Castro I, Ahearn IM, Grana TM, Chiu VK, Lockyer PJ, Cullen PJ, Pellicer A, Cox AD, PhilipsMR. 2003. Phospholipase Cgamma activates Ras on the Golgi apparatus by means of RasGRP1. Nature 424:694–698. DOI: https://doi.org/10.1038/nature01806, PMID: 12845332
Boguski MS, McCormick F. 1993. Proteins regulating Ras and its relatives. Nature 366:643–654. DOI: https://doi.org/10.1038/366643a0, PMID: 8259209
Boriack-Sjodin PA, Margarit SM, Bar-Sagi D, Kuriyan J. 1998. The structural basis of the activation of Ras by Sos.Nature 394:337–343. DOI: https://doi.org/10.1038/28548, PMID: 9690470
Bos JL, Rehmann H, Wittinghofer A. 2007. GEFs and GAPs: critical elements in the control of small G proteins.Cell 129:865–877. DOI: https://doi.org/10.1016/j.cell.2007.05.018, PMID: 17540168
Boykevisch S, Zhao C, Sondermann H, Philippidou P, Halegoua S, Kuriyan J, Bar-Sagi D. 2006. Regulation of rassignaling dynamics by Sos-mediated positive feedback. Current Biology 16:2173–2179. DOI: https://doi.org/10.1016/j.cub.2006.09.033, PMID: 17084704
Canault M, Ghalloussi D, Grosdidier C, Guinier M, Perret C, Chelghoum N, Germain M, Raslova H, Peiretti F,Morange PE, Saut N, Pillois X, Nurden AT, Cambien F, Pierres A, van den Berg TK, Kuijpers TW, Alessi MC,Tregouet DA. 2014. Human CalDAG-GEFI gene (RASGRP2) mutation affects platelet function and causessevere bleeding. The Journal of Experimental Medicine 211:1349–1362. DOI: https://doi.org/10.1084/jem.20130477, PMID: 24958846
Chen X, Wu Q, Depeille P, Chen P, Thornton S, Kalirai H, Coupland SE, Roose JP, Bastian BC. 2017. RasGRP3mediates MAPK pathway activation in GNAQ mutant uveal melanoma. Cancer Cell 31:685–696. DOI: https://doi.org/10.1016/j.ccell.2017.04.002, PMID: 28486107
Cherfils J, Zeghouf M. 2013. Regulation of small GTPases by GEFs, GAPs, and GDIs. Physiological Reviews 93:269–309. DOI: https://doi.org/10.1152/physrev.00003.2012, PMID: 23303910
Cheung RK, Grinstein S, Gelfand EW. 1988. Mitogenic and non-mitogenic ligands trigger a calcium-dependentcytosolic acidification in human T lymphocytes. Journal of immunology 141:1648–1651. PMID: 3261756
Choi CH, Webb BA, Chimenti MS, Jacobson MP, Barber DL. 2013. pH sensing by FAK-His58 regulates focaladhesion remodeling. The Journal of Cell Biology 202:849–859. DOI: https://doi.org/10.1083/jcb.201302131,PMID: 24043700
Christensen SM, Tu HL, Jun JE, Alvarez S, Triplet MG, Iwig JS, Yadav KK, Bar-Sagi D, Roose JP, Groves JT. 2016.One-way membrane trafficking of SOS in receptor-triggered Ras activation. Nature Structural & MolecularBiology 23:838–846. DOI: https://doi.org/10.1038/nsmb.3275, PMID: 27501536
Crittenden JR, Bergmeier W, Zhang Y, Piffath CL, Liang Y, Wagner DD, Housman DE, Graybiel AM. 2004.CalDAG-GEFI integrates signaling for platelet aggregation and thrombus formation. Nature Medicine 10:982–986. DOI: https://doi.org/10.1038/nm1098, PMID: 15334074
Daley SR, Coakley KM, Hu DY, Randall KL, Jenne CN, Limnander A, Myers DR, Polakos NK, Enders A, Roots C,Balakishnan B, Miosge LA, Sjollema G, Bertram EM, Field MA, Shao Y, Andrews TD, Whittle B, Barnes SW,Walker JR, et al. 2013. Rasgrp1 mutation increases naive T-cell CD44 expression and drives mTOR-dependentaccumulation of Helios+ T cells and autoantibodies. eLife 2:e01020. DOI: https://doi.org/10.7554/eLife.01020,PMID: 24336796
Depeille P, Henricks LM, van de Ven RA, Lemmens E, Wang CY, Matli M, Werb Z, Haigis KM, Donner D, WarrenR, Roose JP. 2015. RasGRP1 opposes proliferative EGFR-SOS1-Ras signals and restricts intestinal epithelial cellgrowth. Nature Cell Biology 17:804–815. DOI: https://doi.org/10.1038/ncb3175, PMID: 26005835
Diez FR, Garrido AA, Sharma A, Luke CT, Stone JC, Dower NA, Cline JM, Lorenzo PS. 2009. RasGRP1 transgenicmice develop cutaneous squamous cell carcinomas in response to skin wounding: potential role of granulocytecolony-stimulating factor. The American Journal of Pathology 175:392–399. DOI: https://doi.org/10.2353/ajpath.2009.090036, PMID: 19497993
Dower NA, Stang SL, Bottorff DA, Ebinu JO, Dickie P, Ostergaard HL, Stone JC. 2000. RasGRP is essential formouse thymocyte differentiation and TCR signaling. Nature Immunology 1:367–368. DOI: https://doi.org/10.1038/80799, PMID: 11017103
Ebinu JO, Bottorff DA, Chan EY, Stang SL, Dunn RJ, Stone JC. 1998. RasGRP, a Ras guanyl nucleotide- releasingprotein with calcium- and diacylglycerol-binding motifs. Science 280:1082–1086. DOI: https://doi.org/10.1126/science.280.5366.1082, PMID: 9582122
Emsley P, Lohkamp B, Scott WG, Cowtan K. 2010. Features and development of Coot. Acta CrystallographicaSection D Biological Crystallography 66:486–501. DOI: https://doi.org/10.1107/S0907444910007493,PMID: 20383002
Evans P. 2006. Scaling and assessment of data quality. Acta Crystallographica Section D BiologicalCrystallography 62:72–82. DOI: https://doi.org/10.1107/S0907444905036693, PMID: 16369096
Vercoulen et al. eLife 2017;6:e29002. DOI: https://doi.org/10.7554/eLife.29002 23 of 26
Research article Biochemistry Biophysics and Structural Biology
Fam NP, Fan WT, Wang Z, Zhang LJ, Chen H, Moran MF. 1997. Cloning and characterization of Ras-GRF2, anovel guanine nucleotide exchange factor for Ras. Molecular and Cellular Biology 17:1396–1406. DOI: https://doi.org/10.1128/MCB.17.3.1396, PMID: 9032266
Feske S, Wulff H, Skolnik EY. 2015. Ion channels in innate and adaptive immunity. Annual Review of Immunology33:291–353. DOI: https://doi.org/10.1146/annurev-immunol-032414-112212, PMID: 25861976
Findlay GM, Smith MJ, Lanner F, Hsiung MS, Gish GD, Petsalaki E, Cockburn K, Kaneko T, Huang H, BagshawRD, Ketela T, Tucholska M, Taylor L, Bowtell DD, Moffat J, Ikura M, Li SS, Sidhu SS, Rossant J, Pawson T. 2013.Interaction domains of Sos1/Grb2 are finely tuned for cooperative control of embryonic stem cell fate. Cell152:1008–1020. DOI: https://doi.org/10.1016/j.cell.2013.01.056, PMID: 23452850
Fischer GF, Holter W, Majdic O, Cragoe EJ, Knapp W. 1988. T cell stimulation via CD2 molecules is regularlyaccompanied by an increase in cytoplasmic pH. Different effects of lectins and CD3 antibodies. Journal ofImmunology 141:404–409.
Golinski ML, Vandhuick T, Derambure C, Freret M, Lecuyer M, Guillou C, Hiron M, Boyer O, Le Loet X, VittecoqO, Lequerre T. 2015. Dysregulation of RasGRP1 in rheumatoid arthritis and modulation of RasGRP3 as abiomarker of TNFa inhibitors. Arthritis Research & Therapy 17:382. DOI: https://doi.org/10.1186/s13075-015-0894-9, PMID: 26714738
Grillo-Hill BK, Choi C, Jimenez-Vidal M, Barber DL. 2015. Increased H+ efflux is sufficient to induce dysplasiaand necessary for viability with oncogene expression. eLife 4:e03270. DOI: https://doi.org/10.7554/eLife.03270,PMID: 25793441
Hartzell C, Ksionda O, Lemmens E, Coakley K, Yang M, Dail M, Harvey RC, Govern C, Bakker J, Lenstra TL,Ammon K, Boeter A, Winter SS, Loh M, Shannon K, Chakraborty AK, Wabl M, Roose JP. 2013. DysregulatedRasGRP1 responds to cytokine receptor input in T cell leukemogenesis. Science Signaling 6:ra21. DOI: https://doi.org/10.1126/scisignal.2003848, PMID: 23532335
Hiebler K, Lengyel Z, Castaneda CA, Makhlynets OV. 2017. Functional tuning of the catalytic residue pKa in a denovo designed esterase. Proteins 85:1656–1665. DOI: https://doi.org/10.1002/prot.25321, PMID: 28544090
Hille B. 2001. Ion Channels of Excitable Membranes. 3rd edn.Iwig JS, Vercoulen Y, Das R, Barros T, Limnander A, Che Y, Pelton JG, Wemmer DE, Roose JP, Kuriyan J. 2013.Structural analysis of autoinhibition in the Ras-specific exchange factor RasGRP1. eLife 2:e00813. DOI: https://doi.org/10.7554/eLife.00813, PMID: 23908768
Jun JE, Rubio I, Roose JP. 2013. Regulation of ras exchange factors and cellular localization of ras activation bylipid messengers in T cells. Frontiers in Immunology 4:239. DOI: https://doi.org/10.3389/fimmu.2013.00239,PMID: 24027568
Kabsch W. 2010. XDS. Acta Crystallographica. Section D, Biological Crystallography 66:125–132. DOI: https://doi.org/10.1107/S0907444909047337, PMID: 20124692
Krutzik PO, Clutter MR, Trejo A, Nolan GP. 2011. Fluorescent cell barcoding for multiplex flow cytometry.Current Protocols in Cytometry Chapter 6:31. DOI: https://doi.org/10.1002/0471142956.cy0631s55,PMID: 21207359
Ksionda O, Limnander A, Roose JP. 2013. RasGRP Ras guanine nucleotide exchange factors in cancer. Frontiersin Biology 8:508–532. DOI: https://doi.org/10.1007/s11515-013-1276-9, PMID: 24744772
Ksionda O, Melton AA, Bache J, Tenhagen M, Bakker J, Harvey R, Winter SS, Rubio I, Roose JP. 2016. RasGRP1overexpression in T-ALL increases basal nucleotide exchange on Ras rendering the Ras/PI3K/Akt pathwayresponsive to protumorigenic cytokines. Oncogene 35:3658–3668. DOI: https://doi.org/10.1038/onc.2015.431,PMID: 26549032
Lagadic-Gossmann D, Huc L, Lecureur V. 2004. Alterations of intracellular pH homeostasis in apoptosis: originsand roles. Cell Death and Differentiation 11:953–961. DOI: https://doi.org/10.1038/sj.cdd.4401466, PMID: 15195071
Lozano ML, Cook A, Bastida JM, Paul DS, Iruin G, Cid AR, Adan-Pedroso R, Ramon Gonzalez-Porras J,Hernandez-Rivas JM, Fletcher SJ, Johnson B, Morgan N, Ferrer-Marin F, Vicente V, Sondek J, Watson SP,Bergmeier W, Rivera J. 2016. Novel mutations in RASGRP2, which encodes CalDAG-GEFI, abrogate Rap1activation, causing platelet dysfunction. Blood 128:1282–1289. DOI: https://doi.org/10.1182/blood-2015-11-683102, PMID: 27235135
Luke CT, Oki-Idouchi CE, Cline JM, Lorenzo PS. 2007. RasGRP1 overexpression in the epidermis of transgenicmice contributes to tumor progression during multistage skin carcinogenesis. Cancer Research 67:10190–10197. DOI: https://doi.org/10.1158/0008-5472.CAN-07-2375, PMID: 17974959
Margarit SM, Sondermann H, Hall BE, Nagar B, Hoelz A, Pirruccello M, Bar-Sagi D, Kuriyan J. 2003. Structuralevidence for feedback activation by Ras.GTP of the Ras-specific nucleotide exchange factor SOS. Cell 112:685–695. DOI: https://doi.org/10.1016/S0092-8674(03)00149-1, PMID: 12628188
Matsuyama S, Llopis J, Deveraux QL, Tsien RY, Reed JC. 2000. Changes in intramitochondrial and cytosolic pH:early events that modulate caspase activation during apoptosis. Nature cell biology 2:318–325. DOI: https://doi.org/10.1038/35014006, PMID: 10854321
McCoy AJ, Grosse-Kunstleve RW, Adams PD, Winn MD, Storoni LC, Read RJ. 2007. Phaser crystallographicsoftware. Journal of Applied Crystallography 40:658–674. DOI: https://doi.org/10.1107/S0021889807021206,PMID: 19461840
Mills GB, Cragoe EJ, Gelfand EW, Grinstein S. 1985. Interleukin 2 induces a rapid increase in intracellular pHthrough activation of a Na+/H+ antiport. Cytoplasmic alkalinization is not required for lymphocyte proliferation.The Journal of Biological Chemistry 260:12500–12507. PMID: 2995378
Vercoulen et al. eLife 2017;6:e29002. DOI: https://doi.org/10.7554/eLife.29002 24 of 26
Research article Biochemistry Biophysics and Structural Biology
Murshudov GN, Skubak P, Lebedev AA, Pannu NS, Steiner RA, Nicholls RA, Winn MD, Long F, Vagin AA. 2011.REFMAC5 for the refinement of macromolecular crystal structures. Acta Crystallographica Section D BiologicalCrystallography 67:355–367. DOI: https://doi.org/10.1107/S0907444911001314, PMID: 21460454
Myers DR, Roose JP. 2016. Kinase and phosphatase effector pathways in T cells. Encyclopedia ofImmunobiology 11006.
Nagy Z, Kovacs I, Torok M, Toth D, Vereb G, Buzas K, Juhasz I, Blumberg PM, Bıro T, Czifra G. 2014. Function ofRasGRP3 in the formation and progression of human breast cancer. Molecular Cancer 13:96. DOI: https://doi.org/10.1186/1476-4598-13-96, PMID: 24779681
Nakanishi T, Gu H, Seguchi M, Cragoe EJ, Momma K. 1992. HCO3(-)-dependent intracellular pH regulation inthe premature myocardium. Circulation Research 71:1314–1323. DOI: https://doi.org/10.1161/01.RES.71.6.1314, PMID: 1423929
Plagnol V, Howson JM, Smyth DJ, Walker N, Hafler JP, Wallace C, Stevens H, Jackson L, Simmonds MJ, BingleyPJ, Gough SC, Todd JA, Type 1 Diabetes Genetics Consortium. 2011. Genome-wide association analysis ofautoantibody positivity in type 1 diabetes cases. PLoS Genetics 7:e1002216. DOI: https://doi.org/10.1371/journal.pgen.1002216, PMID: 21829393
Popovic M, Rensen-de Leeuw M, Rehmann H. 2013. Selectivity of CDC25 homology domain-containing guaninenucleotide exchange factors. Journal of Molecular Biology 425:2782–2794. DOI: https://doi.org/10.1016/j.jmb.2013.04.031, PMID: 23659792
Priatel JJ, Teh SJ, Dower NA, Stone JC, Teh HS. 2002. RasGRP1 transduces low-grade TCR signals which arecritical for T cell development, homeostasis, and differentiation. Immunity 17:617–627. DOI: https://doi.org/10.1016/S1074-7613(02)00451-X, PMID: 12433368
Qu HQ, Grant SF, Bradfield JP, Kim C, Frackelton E, Hakonarson H, Polychronakos C. 2009. Association ofRASGRP1 with type 1 diabetes is revealed by combined follow-up of two genome-wide studies. Journal ofMedical Genetics 46:553–554. DOI: https://doi.org/10.1136/jmg.2009.067140, PMID: 19465406
Rehmann H, Das J, Knipscheer P, Wittinghofer A, Bos JL. 2006. Structure of the cyclic-AMP-responsive exchangefactor Epac2 in its auto-inhibited state. Nature 439:625–628. DOI: https://doi.org/10.1038/nature04468,PMID: 16452984
Rehmann H, Arias-Palomo E, Hadders MA, Schwede F, Llorca O, Bos JL. 2008. Structure of Epac2 in complexwith a cyclic AMP analogue and RAP1B. Nature 455:124–127. DOI: https://doi.org/10.1038/nature07187,PMID: 18660803
Reuther GW, Lambert QT, Rebhun JF, Caligiuri MA, Quilliam LA, Der CJ. 2002. RasGRP4 is a novel Ras activatorisolated from acute myeloid leukemia. Journal of Biological Chemistry 277:30508–30514. DOI: https://doi.org/10.1074/jbc.M111330200, PMID: 11880369
Rojas AM, Fuentes G, Rausell A, Valencia A. 2012. The Ras protein superfamily: evolutionary tree and role ofconserved amino acids. The Journal of Cell Biology 196:189–201. DOI: https://doi.org/10.1083/jcb.201103008,PMID: 22270915
Roose JP, Mollenauer M, Gupta VA, Stone J, Weiss A. 2005. A diacylglycerol-protein kinase C-RasGRP1 pathwaydirects Ras activation upon antigen receptor stimulation of T cells. Molecular and Cellular Biology 25:4426–4441. DOI: https://doi.org/10.1128/MCB.25.11.4426-4441.2005, PMID: 15899849
Roose JP, Mollenauer M, Ho M, Kurosaki T, Weiss A. 2007. Unusual interplay of two types of Ras activators,RasGRP and SOS, establishes sensitive and robust Ras activation in lymphocytes. Molecular and CellularBiology 27:2732–2745. DOI: https://doi.org/10.1128/MCB.01882-06, PMID: 17283063
Roose JP. 2016. Lost GRP on cytotoxicity? Nature Immunology 17:1339–1340. DOI: https://doi.org/10.1038/ni.3620, PMID: 27849207
Salzer E, Cagdas D, Hons M, Mace EM, Garncarz W, Petronczki OY, Platzer R, Pfajfer L, Bilic I, Ban SA, WillmannKL, Mukherjee M, Supper V, Hsu HT, Banerjee PP, Sinha P, McClanahan F, Zlabinger GJ, Pickl WF, Gribben JG,et al. 2016. RASGRP1 deficiency causes immunodeficiency with impaired cytoskeletal dynamics. NatureImmunology 17:1352–1360. DOI: https://doi.org/10.1038/ni.3575, PMID: 27776107
Schwaller B. 2010. Cytosolic Ca2+ buffers. Cold Spring Harbor Perspectives in Biology 2:a004051. DOI: https://doi.org/10.1101/cshperspect.a004051, PMID: 20943758
Schonichen A, Webb BA, Jacobson MP, Barber DL. 2013. Considering protonation as a posttranslationalmodification regulating protein structure and function. Annual Review of Biophysics 42:289–314. DOI: https://doi.org/10.1146/annurev-biophys-050511-102349, PMID: 23451893
Sharp KA, Honig B. 1990. Electrostatic interactions in macromolecules: theory and applications. Annual Reviewof Biophysics and Biophysical Chemistry 19:301–332. DOI: https://doi.org/10.1146/annurev.bb.19.060190.001505, PMID: 2194479
Sondermann H, Soisson SM, Boykevisch S, Yang SS, Bar-Sagi D, Kuriyan J. 2004. Structural analysis ofautoinhibition in the Ras activator Son of sevenless. Cell 119:393–405. DOI: https://doi.org/10.1016/j.cell.2004.10.005, PMID: 15507210
Srivastava J, Barreiro G, Groscurth S, Gingras AR, Goult BT, Critchley DR, Kelly MJ, Jacobson MP, Barber DL.2008. Structural model and functional significance of pH-dependent talin-actin binding for focal adhesionremodeling. PNAS 105:14436–14441. DOI: https://doi.org/10.1073/pnas.0805163105, PMID: 18780792
Stone JC. 2011. Regulation and function of the RasGRP family of Ras activators in blood cells. Genes & Cancer 2:320–334. DOI: https://doi.org/10.1177/1947601911408082, PMID: 21779502
Teixeira C, Stang SL, Zheng Y, Beswick NS, Stone JC. 2003. Integration of DAG signaling systems mediated byPKC-dependent phosphorylation of RasGRP3. Blood 102:1414–1420. DOI: https://doi.org/10.1182/blood-2002-11-3621, PMID: 12730099
Vercoulen et al. eLife 2017;6:e29002. DOI: https://doi.org/10.7554/eLife.29002 25 of 26
Research article Biochemistry Biophysics and Structural Biology
Tishmack PA, Bashford D, Harms E, Van Etten RL. 1997. Use of 1H NMR spectroscopy and computer simulationsTo analyze histidine pKa changes in a protein tyrosine phosphatase: experimental and theoreticaldetermination of electrostatic properties in a small protein. Biochemistry 36:11984–11994. DOI: https://doi.org/10.1021/bi9712448, PMID: 9305993
Usachev YM, Marchenko SM, Sage SO. 1995. Cytosolic calcium concentration in resting and stimulatedendothelium of excised intact rat aorta. The Journal of Physiology 489 (Pt 2):309–317. DOI: https://doi.org/10.1113/jphysiol.1995.sp021052, PMID: 8847627
Wang L, Zhang M, Alexov E. 2016. DelPhiPKa web server: predicting pKa of proteins, RNAs and DNAs.Bioinformatics 32:614–615. DOI: https://doi.org/10.1093/bioinformatics/btv607, PMID: 26515825
Webb BA, Chimenti M, Jacobson MP, Barber DL. 2011. Dysregulated pH: a perfect storm for cancerprogression. Nature Reviews Cancer 11:671–677. DOI: https://doi.org/10.1038/nrc3110, PMID: 21833026
White KA, Grillo-Hill BK, Barber DL. 2017. Cancer cell behaviors mediated by dysregulated pH dynamics at aglance. Journal of Cell Science 130:663–669. DOI: https://doi.org/10.1242/jcs.195297, PMID: 28202602
Wittinghofer A, Vetter IR. 2011. Structure-function relationships of the G domain, a canonical switch motif.Annual Review of Biochemistry 80:943–971. DOI: https://doi.org/10.1146/annurev-biochem-062708-134043,PMID: 21675921
Yang Y, Wang X, Dong T, Kim E, Lin WJ, Chang C. 2003. Identification of a novel testicular orphan receptor-4(TR4)-associated protein as repressor for the selective suppression of TR4-mediated transactivation. Journal ofBiological Chemistry 278:7709–7717. DOI: https://doi.org/10.1074/jbc.M207116200, PMID: 12486131
Yang D, Kedei N, Li L, Tao J, Velasquez JF, Michalowski AM, Toth BI, Marincsak R, Varga A, Bıro T, Yuspa SH,Blumberg PM. 2010. RasGRP3 contributes to formation and maintenance of the prostate cancer phenotype.Cancer Research 70:7905–7917. DOI: https://doi.org/10.1158/0008-5472.CAN-09-4729, PMID: 20876802
Yang D, Tao J, Li L, Kedei N, Toth ZE, Czap A, Velasquez JF, Mihova D, Michalowski AM, Yuspa SH, BlumbergPM. 2011. RasGRP3, a Ras activator, contributes to signaling and the tumorigenic phenotype in humanmelanoma. Oncogene 30:4590–4600. DOI: https://doi.org/10.1038/onc.2011.166, PMID: 21602881
Yasuda S, Stevens RL, Terada T, Takeda M, Hashimoto T, Fukae J, Horita T, Kataoka H, Atsumi T, Koike T. 2007.Defective expression of Ras guanyl nucleotide-releasing protein 1 in a subset of patients with systemic lupuserythematosus. The Journal of Immunology 179:4890–4900. DOI: https://doi.org/10.4049/jimmunol.179.7.4890, PMID: 17878389
Zahedi B, Goo HJ, Beaulieu N, Tazmini G, Kay RJ, Cornell RB. 2011. Phosphoinositide 3-kinase regulates plasmamembrane targeting of the Ras-specific exchange factor RasGRP1. Journal of Biological Chemistry 286:12712–12723. DOI: https://doi.org/10.1074/jbc.M110.189605, PMID: 21285350
Zheng Y, Liu H, Coughlin J, Zheng J, Li L, Stone JC. 2005. Phosphorylation of RasGRP3 on threonine 133provides a mechanistic link between PKC and Ras signaling systems in B cells. Blood 105:3648–3654.DOI: https://doi.org/10.1182/blood-2004-10-3916, PMID: 15657177
Vercoulen et al. eLife 2017;6:e29002. DOI: https://doi.org/10.7554/eLife.29002 26 of 26
Research article Biochemistry Biophysics and Structural Biology