a guide to calculating and interpreting the kidney … · a guide to calculating and interpreting...
TRANSCRIPT
02/28/2012 Page 1 of 12
A Guide to Calculating and Interpreting the Kidney Donor Profile Index (KDPI) NOTE: KDPI is not currently used for kidney allocation. It is only displayed in DonorNet® to assist OPOs and transplant centers in evaluating the quality of deceased-donor kidneys. Including the KDPI in a new kidney allocation system is being considered for a policy proposal by the OPTN Kidney Transplantation Committee. What is the KDPI? The Kidney Donor Profile Index (KDPI) is a numerical measure that combines ten dimensions of information about a donor, including clinical parameters and demographics, to express the quality of the donor kidneys relative to other donors. The KDPI is derived by first calculating the Kidney Donor Risk Index (KDRI) for a deceased donor. A donor with a KDPI of 90%, for example, has a KDRI greater than 90% of donors in the chosen reference population. In this way, the KDPI is simply a mapping of the KDRI from a relative risk scale a cumulative percentage scale. The reference population of donors is all donors in the U.S. from whom a kidney was recovered during the prior calendar year. Lower KDPI values are associated with increased donor quality; higher KDPI values are associated with lower donor quality. What is the KDRI? The Kidney Donor Risk Index (KDRI) is an estimate of the relative risk of post-transplant kidney graft failure (in an average, adult recipient) from a particular deceased donor compared to the median (50th percentile) donor. A donor with a KDRI of 1.28, for example, confers an estimated risk of kidney graft failure that is 1.28 times that of an “average” donor. Lower KDRI values are associated with increased donor quality; higher KDRI values are associated with lower donor quality. What are the benefits of the KDPI? KDPI is an improvement over the Expanded Criteria Donor (ECD)/Standard Criteria Donor (SCD) dichotomy, in several ways: • KDPI explicitly incorporates 10 donor factors (instead of 4 in the ECD definition) and is a more
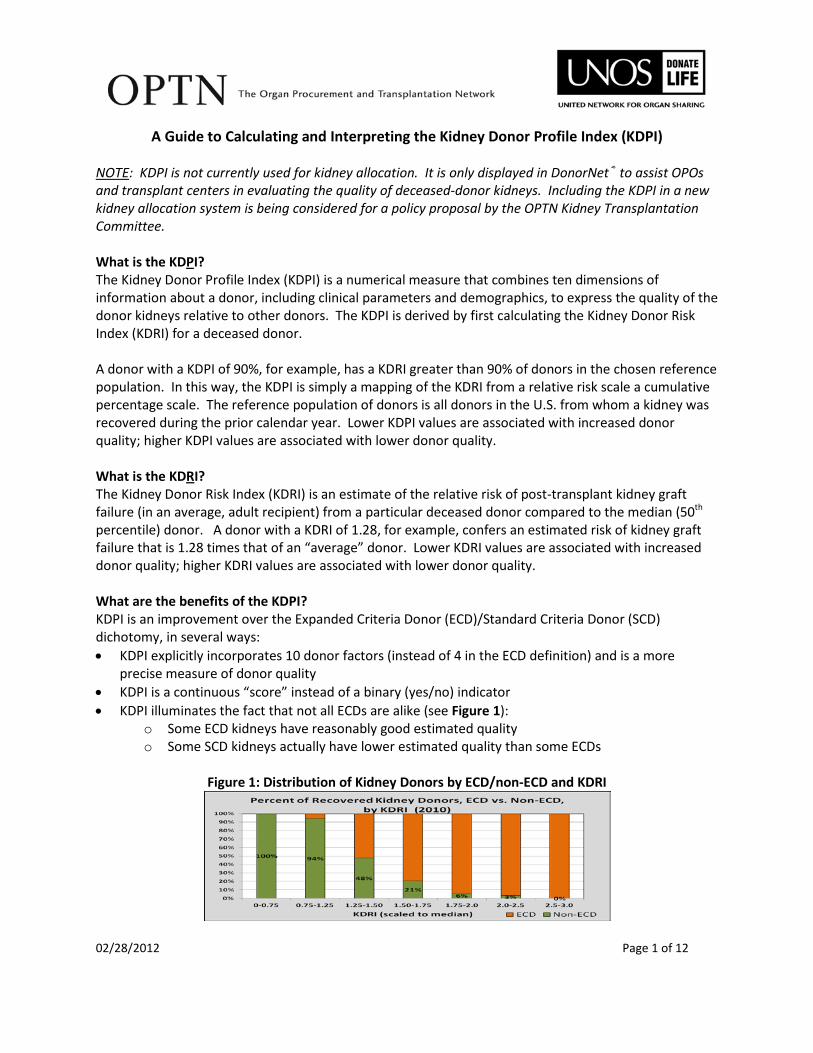
precise measure of donor quality • KDPI is a continuous “score” instead of a binary (yes/no) indicator • KDPI illuminates the fact that not all ECDs are alike (see Figure 1):
o Some ECD kidneys have reasonably good estimated quality o Some SCD kidneys actually have lower estimated quality than some ECDs
Figure 1: Distribution of Kidney Donors by ECD/non-ECD and KDRI

02/28/2012 Page 2 of 12
What are some intended uses of the KDPI? The primary purpose of adding KDPI to DonorNet® is to provide a new measure of donor quality for assisting transplant professionals in evaluating the suitability of deceased donor kidney offers for each of their candidates receiving an offer. Just as some candidates are more likely to benefit from an ECD kidney than others,1 transplant programs may choose to accept kidneys of different quality, depending on the medical circumstances of each particular candidate, by establishing candidate-specific KDPI acceptability thresholds. The KDPI may eventually replace the ECD/SCD dichotomy. In the meantime, while both KDPI and ECD are displayed in DonorNet®, the KDPI can help transplant programs distinguish between lower versus higher quality ECD kidneys. In order to possibly benefit from a higher quality ECD kidney, though, suitable candidates must first be listed as willing to consider accepting an ECD kidney so that they will show up on match runs for these kidneys. KDPI may also be useful in determining whether to accept an offer of both kidneys from a particular donor or to decline if only a single kidney is available. For example, a program may be willing to consider accepting kidneys from a donor with an elevated KDPI, but only if both kidneys are available (per OPTN Policy 3.5) and would together provide sufficient renal mass for an anticipated successful outcome. Additional analytical tools are being developed to provide guidance to transplant programs and patients for determining which types of donors – in terms of KDPI – to accept, based on expected graft/patient survival and waiting time considerations. The KDPI is not currently available in WaitlistSM as a donor acceptance criterion, so it cannot be used to screen donors off of the match. However, adding KDPI as a new screening element is anticipated to be included in the policy proposal for a revised kidney allocation system. This policy proposal may also suggest incorporating the KDPI into the allocation algorithm itself to determine, along with waiting time and other factors, priority for waitlisted candidates. OPOs may be interested in the KDPI to help predict which donors/organs may be more or less difficult to place. Can the KDPI be calculated for living donors? No. The KDPI only applies to deceased donors. Calculating and Interpreting the Kidney Donor Risk Index (KDRI) The KDPI is derived from the Kidney Donor Risk Index (KDRI).2 Consequently, to determine a donor’s KDPI, the first step is to calculate the KDRI.

02/28/2012 Page 3 of 12
The following donor characteristics are used to calculate the KDRI:
Age Height Weight Ethnicity History of Hypertension History of Diabetes Cause of Death Serum Creatinine Hepatitis C Virus (HCV) Status Donation after Circulatory Death (DCD) Status
The association between these donor factors and graft survival was determined by estimating a multivariable Cox proportional hazards regression model using graft outcomes from nearly 70,000 adult, solitary, first-time deceased donor kidney recipients in the U.S. from 1995-2005.2 The estimated coefficients derived from this model are shown in Table 1.
Table 1: KDRI Donor Factors and Model Coefficients
Donor Characteristic Applies to: KDRI Coefficient
(“Beta”) KDRI “XBeta” Component
Age (integer years) All donors 0.0128 0.0128*(age-40)
Donors with age < 18 -0.0194 -0.0194*(age-18) Donors with age > 50 0.0107 0.0107*(age-50)
Height (cm) All donors -0.0464 -0.0464*(hgt-170)/10 Weight (kg) All donors w/ weight < 80kg -0.0199 -0.0199*(wgt-80)/5
Ethnicity African American donors 0.1790 0.1790 History of Hypertension Hypertensive donors 0.1260 0.1260
History of Diabetes Diabetic donors 0.1300 0.1300 Cause of Death Donors w/ COD=CVA 0.0881 0.0881
Serum Creatinine All donors 0.2200 0.2200*(creat-1)
Donors with creat > 1.5 mg/dL -0.2090 -0.2090*(creat-1.5) HCV status HCV positive donors 0.2400 0.2400 DCD Status DCD donors 0.1330 0.1330
The KDRI is calculated for a particular donor by summing the XBETA components for all applicable donor characteristics, then applying the antilog function (base e) to this sum, as follows: • XBETA = sum(KDRI score components) • KDRI_RAO = exp(XBETA) “KDRI_RAO” is interpreted as the relative risk of post-transplant graft failure for this donor compared to a reference donor (age=40 years, non-African American, etc.) as defined in Rao, et al.2 This particular reference donor is neither an “ideal” donor nor an “average” donor, but somewhere in between.

02/28/2012 Page 4 of 12
Consequently, to aid its interpretation, the version of the KDRI displayed in DonorNet® is scaled such that a value of 1.0 corresponds to the “median” donor, as follows: • KDRI_MEDIAN = KDRI_RAO / (scaling factor) The “scaling factor” is the median KDRI_RAO value among all kidney donors recovered during the previous calendar year. This value was 1.24 in 2010. The use of this scaling factor does not affect the KDPI nor the donor’s rank-ordering relative to other donors. The KDRI_MEDIAN is interpreted as the relative risk of post-transplant graft failure (in an average, adult recipient) for this donor compared to the median kidney donor recovered last year. In the descriptive text in DonorNet® explaining the KDPI, for example, “The estimated risk of kidney graft failure from this donor is higher than 74% of all kidney donors recovered in 2010 and 1.28 times that of the median donor from 2010,” the value 1.28 is the “scaled to the median” KDRI. The KDRI displayed in DonorNet® and referenced in this document is the donor-only version of the KDRI. As explained in Rao, et al, several factors pertaining to the recipient and/or transplant procedure (cold ischemic time, degree of HLA mismatching, single vs. double vs. en-bloc kidneys) can also be used to calculate a “full” KDRI. Since these factors are generally not known at the time offers are made, or are candidate-specific, the donor-only KDRI is the version that was implemented. As shown in Figure 2, KDRI generally ranges from about 0.50 to 3.5. Higher values of KDRI are associated with lower expected graft survival, and vice versa.
Figure 2: Distribution of Kidney Donors Recovered in 2010, by KDRI
KDRI Scaled Relative to the Median Donor Recovered in 2010
Based on OPTN data as of January 20, 2012
02/28/2012 Page 5 of 12
Calculating and Interpreting the Kidney Donor Profile Index (KDPI) The KDPI is simply a mapping of the KDRI, a measure of relative risk, to the cumulative percentage scale. A donor with a KDRI greater than 90% of donors in the chosen reference population has a KDPI of 90%. The reference population of donors is all donors in the U.S. from whom a kidney was recovered during the prior calendar year. The same reference population of donors is used both to generate the “scaled to the median” version of KDRI, as described above, and to convert KDRI to KDPI. The KDPI is calculated to the nearest integer percentage value and ranges from 0% to 100%. A donor with KDPI of 0% has a KDRI less than all donors in the reference population. In general, a donor with a KDPI of X% implies that the donor’s KDRI exceeds more than (X-1)% but not more than X% of all donors in the reference population. For example: • A donor with a KDPI of 20% has a KDRI exceeding at least 19% and at most 20% of all donors in the
reference population. • A donor with a KDPI of 99% has a KDRI exceeding at least 98% and at most 99% of all donors in the
reference population. • A donor with a KDPI of 100% has a KDRI exceeding more than 99% of all donors in the reference
population. The KDRI->KDPI Mapping Table shows the KDPI associated with every possible KDRI value. Example Calculation: KDRI and KDPI To calculate the KDRI and KDPI for a donor with the following characteristics: Age: 52 years Height: 5’11” (183 cm) Weight: 177 lb (81 kg) Ethnicity: Hispanic/Latino History of Hypertension: Yes, donor has history of hypertension Diabetes Status: No, donor has no history of diabetes Cause of Death: Cerebrovascular accident (CVA) Serum Creatinine: 1.7 mg/dL HCV Status: Negative DCD Status: Yes, donor was recovered as a DCD First, calculate and take the sum of each KDRI XBETA component, and then exponentiate, as follows: • XBETA = [0.0128*(52-40) + 0.0107*(52-50)] + -0.0464*(183-170)/10 + 0 + 0 + 0.1260 + 0
+ 0.0881 + 0.2200*(1.7-1) + -0.2090*(1.7-1.5) + 0 + 0.1330 = 0.57398 • KDRI_RAO = exp(0.57398) = 1.7753187792565 Next, divide this donor’s KDRI_RAO by the median KDRI_RAO in 2010 (or most recent cohort): • KDRI_MEDIAN = 1.7753187792565 / 1.24234410213776 = 1.42900728942229

02/28/2012 Page 6 of 12
Next, find the KDPI corresponding to a KDRI_MEDIAN of 1.42900728942229 on the KDRI-to-KDPI Mapping Table from 2010 (or most recent cohort): • KDPI = 82% Interpretation: The estimated risk of kidney graft failure from this donor is higher than 82% of kidney donors recovered in 2010 and 1.43 times that of the median donor recovered in 2010. Frequenty Asked Questions (FAQ) about KDPI How strong is the association between KDRI/KDPI and graft survival? Figure 3 and Table 2 show that as KDRI increases, the expected graft survival decreases substantially, on average, across the population of adult, primary, kidney-alone recipients from 2000-2007. Though the analysis used for Figure 3 and Table 2 did not account for differences in recipient characteristics, the strength of the association between KDRI and graft survival changes very little when adjusting for recipient factors in a multivariable model.
Figure 3: Kaplan-Meier Survival Curves by KDRI

02/28/2012 Page 7 of 12
The predictive power of the KDRI can be summarized into a single number, the c-statistic, which is approximately 0.60. The c-statistic ranges from 0.5 to 1.0, with higher values indicating greater discriminatory power (the ability to separate more successful from less unsuccessful graft outcomes along the KDRI scale). A c-statistic of 0.60 is considered to be only moderately predictive, whereas values near 0.70 or 0.80+ are more desirable and indicative of models with high discriminatory power. Graft outcome is affected not only by donor characteristics, but also by recipient variables, factors related to the transplant procedure, as well as by the transplant program itself. KDRI is designed only to capture the donor factors that are predictive of graft outcome. Thus, some amount of residual variability in outcomes, due to differences in candidate ages, comorbidities, etc., and variability among transplant programs, is expected. A model that accounts for these additional sources of variation would result in a higher c-statistic, but the goal of the KDRI is strictly to summarize graft failure risk from a donor. The KDPI has effectively the same predictive power as the KDRI, with only a trivial difference induced by the use of the discrete (one percentage point intervals) mapping table.
Table 2: Estimated Kidney Graft Survival Rates, by Donor KDRI
KDPI KDRI
Estimated Kidney Graft Survival Rates by KDRI
1 Year 3 Years 5 Years 8 Years 1% 0.55 94.0% 87.8% 80.5% 68.7% 5% 0.61 93.5% 86.7% 78.8% 66.2%
10% 0.65 93.1% 85.9% 77.6% 64.4% 20% 0.73 92.3% 84.4% 75.3% 61.1% 30% 0.81 91.5% 82.9% 73.0% 57.9% 40% 0.90 90.5% 81.1% 70.4% 54.4% 50% 1.00 89.5% 79.2% 67.6% 50.8% 60% 1.10 88.6% 77.4% 65.2% 47.6% 70% 1.23 87.3% 75.1% 61.9% 43.6% 80% 1.39 85.8% 72.4% 58.3% 39.2% 90% 1.62 83.7% 68.7% 53.3% 33.6% 95% 1.85 81.6% 65.2% 48.9% 28.9% 99% 2.30 77.7% 58.8% 41.1% 21.4%
Survival rate estimates in Table 2 are based on a Cox regression model with log(KDRI) as the sole independent variable, which allowed estimation of survival at desired values of KDPI. As in Figure 3, data included primary, solitary, adult kidney transplants from 2000-2007. The KDRI was scaled to the median donor in 2009 in both of these analyses. How much predictive power is lost when using the donor-only version of the KDRI compared to the “full” KDRI that contains recipient-donor matching and transplant factors?

02/28/2012 Page 8 of 12
Virtually no predictive ability is lost by using a donor-only version of the KDRI (c=0.596) compared to a full version of the KDRI (c=0.601) that includes the degree of HLA matching, cold ischemic time, and transplant procedure type (single vs. double vs. en-bloc).3 What other donor factors were considered for possible inclusion in the KDRI/KDPI? Donor factors evaluated but not explicitly included in the KDRI formula included gender and cigarette use. Since these two characteristics were included in the multivariable modeling process but, given the other factors in the model, were not statistically significant, donor gender and cigarette use can be thought of as being implicitly included in the KDRI with a model coefficient of zero. Is it okay to use the KDRI/KDPI as a measure of donor quality for non-renal organs? The KDRI and KDPI were developed strictly in the context of predicting kidney graft survival. A Liver Donor Risk Index (LDRI)4 has been developed to summarize the quality of liver donors; similarly, a Pancreas Donor Risk Index (PDRI)5 exists for pancreas donors. Ideally, these organ-specific metrics should be used for organ-specific decision-making. However, it has been shown that the KDRI is highly correlated with both the LDRI and PDRI, and provides nearly identical discriminatory power (as measured by the c-statistic) as those organ-specific models. The KDRI was also shown to have very modest discriminatory power (c=0.54) for heart transplant outcomes and very little association with lung transplant outcomes (c=0.52).6 Though ideally the organ-specific indices should be used, it is not unreasonable to use the KDPI as an approximate measure of donor quality for livers and pancreata, and possibly even hearts. How should KDPI not be used? The KDPI should not be turned into a dichotomous indicator such that all kidneys with a KDPI≤X% are considered equally “good” and those with KDPI>X% are equally “bad.” Doing so would negate one of the advantages this continuous-scale metric has over the current ECD indicator. Also, factors already included in the KDPI formula, for example history of hypertension, should generally not be used to differentiate the quality (in terms of expected graft survival) of kidney donors with the same KDPI. For example, if two donors have a KDPI of 40%, but one has a History of Hypertension and the other does not, the donor with the history of hypertension should not be considered to have a significantly lower expected graft survival, since the multivariable KDRI model has already taken hypertension into account. Other clinical reasons may make a hypertensive (or diabetic, DCD, etc.) donor less preferable compared to a non-hypertensive donor, however. Finally, though a transplant program may choose to “rule out” all kidneys with KDPI exceeding a certain threshold (either for all of their candidates or by using candidate-specific thresholds), the KDPI should never be used in isolation to “rule-in” a kidney for transplantation. The KDPI may be clinically useful but has limitations, as described below in “What are the limitations of the KDPI?” What are the limitations of the KDPI? As previously mentioned, the predictive power of the KDPI is only moderate (c=0.60). It is not a precise enough tool to differentiate with high confidence the quality of kidney donors with only slight

02/28/2012 Page 9 of 12
differences in KDPI. Donors on opposite ends of the KDPI spectrum can be differentiated in terms of expected graft outcomes with greater confidence. In addition, the KDPI does not include all donor factors potentially associated with kidney graft outcomes. For example, biopsy results are not included in the KDPI, in large part because many deceased donor kidneys are not biopsied. Since the KDPI is a donor-level measure, not specific to either kidney, it also does not contain any information about damage, trauma, or abnormalities that may be associated with one of a donor’s kidneys. Further, the KDPI provides no assessment of the likelihood of disease or malignancy transmission from a deceased donor. Even though the formula includes HCV as a factor, its inclusion was strictly due to the association of HCV positivity with (lower) graft survival. Other serological (or molecular/DNA) test results are also not incorporated into the KDPI. Also not included is whether the donor meets U.S. Public Health Service guidelines for being considered at an increased risk of disease transmission. The donor’s social history, which may reflect a higher risk of disease transmission, is also absent from the KDPI. Finally, the KDPI was developed using graft outcomes from strictly adult transplant recipients; pediatric recipients were not included in the modeling process. Consequently, KDPI should be used with caution when assessing donor quality from the perspective of a pediatric candidate. The KDPI should be used in conjunction with these additional sources of information to make fully informed decisions about the suitability of a kidney for a particular transplant candidate. Does the KDRI quantify the risk of kidney graft failure for a particular time window (e.g., first 6 months after transplant)? No. The KDRI is a relative risk measure indicating an upward or downward shift in the instantaneous risk of graft failure over time (the hazard function), for this donor relative to the reference donor. Thus, the KDRI does not have an interpretation tied to any particular outcome window, such as graft survival within 3 months, 6 months, 1 year, etc. Can the KDPI be calculated for very young pediatric donors? Yes. As shown in Figure 4, very young and/or small donors, whose kidneys are generally smaller and have less renal mass, can have high KDPI values.
Figure 4: Relationship between Donor Age and KDPI

02/28/2012 Page 10 of 12
Has the KDRI distribution changed over time? Yes, but not dramatically. From 2000 to 2010, the median and mean KDRI increased 7% (0.94 to 1.00) and 6% (1.03 to 1.08), respectively, as shown in Table 3. Much of this increase occurred from 2000 to 2005; between 2006 and 2010, no clear trend is evident.
Table 3: KDRI Distribution from 2000 – 2011
Year
N (Kidney Donors)
KDRI Statistics
% Missing P10 Median Mean P90 2000 5374 2.1% 0.63 0.94 1.03 1.56 2001 5453 1.4% 0.64 0.93 1.02 1.54 2002 5523 2.1% 0.63 0.93 1.02 1.55 2003 5651 1.8% 0.64 0.95 1.04 1.57 2004 6263 1.0% 0.64 0.96 1.05 1.60 2005 6632 1.0% 0.65 0.96 1.07 1.66 2006 7096 1.2% 0.65 1.00 1.09 1.67 2007 7180 0.8% 0.65 0.99 1.09 1.67 2008 7130 0.8% 0.66 1.00 1.10 1.67 2009 7171 1.1% 0.66 1.02 1.10 1.65 2010 7182 0.8% 0.66 1.00 1.08 1.64
KDRI scaled relative to the median kidney donor in 2010 Missing means the KDRI could not be calculated due to missing or unknown fields.
Based on OPTN data as of January 12, 2012. When performing long-term trend analyses with KDRI, it is important that the scaling factor remain constant, i.e., the scaling is not performed separately by year, which would artificially remove any trends. The results shown in Table 3 were derived by scaling each donor’s KDRI by the median KDRI_RAO value (1.24234410213776) from 2010. How different are the sub-populations of donors recovered among the 58 OPOs, in terms of KDRI/KDPI? In 2010, the median KDRI of recovered kidney donors varied from about 0.90 to 1.16 across the 58 OPOs. The mean KDRI varied from about 0.80 to 1.25. While most OPOs had about 20% of their recovered donors in the “national top 20%” (KDPI≤20%) in 2010, some OPOs had only about 10-12% of donors with KDPI≤20%, and other OPOs had upwards of 35% with KDPI≤20%. How are missing, unknown, and other “ambiguous” values handled in the KDPI calculation? If any of the 10 fields used for calculating KDRI are missing, the KDRI and KDPI are not computed. However, several fields can be “non-missing” but still be ambiguous:
• History of hypertension: unknown • History of diabetes: unknown • HCV status (“Anti-HCV”): unknown, not done, indeterminate, or pending

02/28/2012 Page 11 of 12
All 10 fields used for calculating KDRI are required to run a kidney match. To ensure that when matches are run every donor has a non-missing KDPI value, ambiguous values are handled as follows: If history of hypertension = unknown was selected, the KDRI calculation in DonorNet® assumes that the donor has a probability of having been hypertensive equal to the proportion of donors in the reference population having a history of hypertension. In 2010, this proportion was 32.35%. In such cases, the XBETA component associated with a history of hypertension is the weighted average of 0 and 0.1260, or 0*(1-0.3235) + 0.1260*(0.3235) = 0.040761. If history of diabetes = unknown was selected, the KDRI calculation in DonorNet® assumes that the donor has a probability of having been diabetic equal to the proportion of donors in the reference population having a history of diabetes. In 2010, this proportion was 10.30%. In such cases, the XBETA component associated with a history of diabetes is the weighted average of 0 and 0.1300, or 0*(1-0.1030) + 0.1300*(0.1030) = 0.01339. Since the likelihood that a particular donor has a history of hypertension or diabetes varies substantially depending on the donor’s age and other factors, a more sophisticated, model-based approach for estimating the probability a donor was hypertensive or diabetic is being considered for future implementation. If HCV status is unknown, not done, indeterminate, or pending, the KDRI calculation assumes that HCV status is negative. In such cases, the XBETA component associated with HCV status is zero. DonorNet® will display a warning message indicating that the donor’s HCV status is not known but was assumed to be negative for calculating KDRI and KDPI. When calculating these metrics on historical data (e.g., donor fields on the Deceased Donor Registration form) for analysis purposes, as opposed to in DonorNet® for organ placement, KDRI and KDPI are generally not calculated (i.e., they are left missing) for donors with any missing and/or ambiguous data elements among the 10 fields used in these calculations. How are extreme values of creatinine, age, height, and weight handled in the KDPI calculation? With the implementation of KDPI into DonorNet®, the system no longer allows creatinine values to be entered that are outside of the range 0.01 to 40. Values that are between 10 and 40 will prompt the user to double check the value to make sure it is correct before proceeding. Values greater than 8 are capped at 8 for calculating KDRI; in other words, creatinine values of 8, 9, 15, and 25 would all result in the same KDRI/KDPI, all else being equal. A note will appear under the KDPI calculation indicating the creatinine was capped at 8 for KDRI/KDPI calculations. Donor age is restricted to be between 0 and 99 in DonorNet®. Height is limited to a maximum of 7’ 11”, and the weight must be between 1lb (0.454kg) and 441lb (200kg). Does the duration for which a donor had hypertension or diabetes affect the KDPI calculation? No. The KDPI is only affected by the presence or absence of hypertension or diabetes in the donor.

02/28/2012 Page 12 of 12
References 1. Merion RM, Ashby VB, Wolfe RA, et al. Deceased-donor characteristics and the survival benefit of
kidney transplantation. JAMA 2005;294:2726-33. 2. Rao PS, Schaubel DE, Guidinger MK, et al. A comprehensive risk quantification score for deceased
donor kidneys: the kidney donor risk index. Transplantation 2009;88:231-6. 3. Massie AB, Montgomery RA, Segev DL. Does the Kidney Donor Index Need Non-Donor Factors?
American Transplant Congress Abstracts 2011:Abstract #32. 4. Feng S, Goodrich NP, Bragg-Gresham JL, et al. Characteristics associated with liver graft failure: the
concept of a donor risk index. Am J Transplant 2006;6:783-90. 5. Axelrod DA, Sung RS, Meyer KH, Wolfe RA, Kaufman DB. Systematic evaluation of pancreas allograft
quality, outcomes and geographic variation in utilization. Am J Transplant 2010;10:837-45. 6. Stewart DE, Edwards, LB, Metzger, RA. Is the Kidney Donor Risk Index (KDRI) a Useful Predictor of
Graft Survival for Non-Renal Organs? American Transplant Congress Abstracts 2011:Abstract #464.