a global station coordinate solution based upon · pdf filea global station coordinate...
TRANSCRIPT

X-592-73-171
A GLOBAL STATION COORDINATESOLUTION BASED UPON CAMERA
AND LASER DATA - GSFC 1973
N73-28130(NASA-TM-X- 7 J4 2 2 ) -A GLOBAL STATIO1
'COORDINATE SOLUTION BASED UPON CAMERA ANL
LASER DATA - GSFC 1973 (NASA) 71 p HC$575 CSCL 14B Unclas
.$5.75 G3/11 11 7 4
J. G. MARSHB.C. DOUGLASS. M. KLOSKO
C
MAY 1973
GODDARD SPACE FLIGHT CENTERGREENBELT, MARYLAND
https://ntrs.nasa.gov/search.jsp?R=19730019398 2018-05-08T13:03:12+00:00Z

A GLOBAL STATION COORDINATE
SOLUTION BASED UPON CAMERA
AND LASER DATA - GSFC 1973
J.G. Marsh
Geodynamics Program DivisionGoddard Space Flight CenterGreenbelt, Maryland, U.S.A.
B.C. Douglas
S.M. Klosko
Wolf Research and Development CorporationRiverdale, Maryland, U.S.A.
Presented at the
First International SymposiumThe Use of Artificial Satellites for Geodesy and Geodynamics
Athens, GreeceMay 14-21, 1973
/

PRECEDING PAGE BLANK NOT FILMED
ABSTRACT
This paper presents new results obtained at GSFC for
the geocentric coordinates of 72 globally distributed satellite
tracking stations consisting of 58 cameras and 14 lasers. The
observational data for this solution consists of over 65,000
optical observations and more than 350 laser passes recorded
during the National Geodetic Satellite Program (NGSP), the
1968 Centre National d'Etudes Spatiales (CNES)/Smithsonian
Astrophysical Observatory (SAO) Observing Program, and
International Satellite Geodesy Experiment Program (ISAGEX).
Dynamical methods were used. The data were analyzed with the
GSFC GEM and SAO 1969 Standard Earth Gravity Models. The
recent value of GM = 3.986008 x 10⁵ km3/sec 2 derived at the
Jet Propulsion Laboratory (JPL) gave the best results for this
combination laser/optical solution. Comparisons of this new
solution are made with the deep space solution of JPL
(LS-25 solution), results of analysis of lunar laser data
recorded at McDonald Observatory, results obtained at GSFC
from Mariner-9 Unified S-Band tracking, and interferometric
analysis of Apollo Lunar Module tracking data. Comparisons
with other near-earth satellite derived solutions are also
made. Datum transformation parameters relating the North
American, European, South American, Australian and other
datums to this reference system are given, enabling the
positions of some 200 other tracking stations to be placed
in the geocentric system. An uncertainty of the new solution
of 5m (la) in each coordinate is suggested by the comparisons
and an analysis of the error sources.
iii

PRECEDING PAGE BLANK NOT FILMED
CONTENTS
Page
ABSTRACT . .* **. .... ...... ........... iii
1.0 INTRODUC TION ................... . . .... 1
2.0 DESCRIPTION OF SOLUTIONS . . . . . . . . . . . . . . . . . . 4
3.0 RESULTS . .. . . . . . ... . . . . .. ... . . .. .. 18
3.1 GSFC '73 COMPARISON WITH GEODETIC PARAMETERS RECOVEREDAT JPL FOR THE DEEP SPACE NETWORK AND THE MCDONALDOBSERVATORY LUNAR LASER EXPERIMENT . . . . . . . . . . . 20
3.2 COMPARISONS WITH USB GEODETIC STATION LOCATIONSDETERMINED FROM LEM LUNAR SURFACE DATA ANDMARINER 9 *.*....... ................ . 26
3.3 EVALUATION OF RADIAL POSITIONS . . . . . . . . . . . . . . . 34
3.4 INTERCOMPARISON OF CHORD DISTANCES ON THE NORTHAMERICAN AND EUROPEAN DATUMS ...... ......... 39
3.5 COMPARISONS WITH THE GLOBAL STATION SOLUTIONS OFSAO 1973 AND GEM 4 . . . . . . . . . . . . . . . . . . . . . 45
4.0 THE RELATION OF MAJOR GEODETIC DATUMS TO AGEOCENTRIC REFERENCE SYSTEM .............. 51
4.1 THE NORTH AMERICAN DATUM-1927 ........ . . . . 51
4.2 THE EUROPEAN DATUM-1950 . . . . . . . . . . . . . .. . 53
4.3 THE PROVISIONAL SOUTH AMERICAN DATUM-1969 . . . . .. . . 53
4.4 AUSTRALIAN GEODETIC DATUM AND THE ARC DATUM . . . . . . 56
4.5 DATUM TRANSLATION VALUES FOR OTHER AREAS OFTHE WORLD ...... ..... .............. o.oo oo oo 58
REFERENCES . . . . . . . . . . . . . . . . . . . . . . . . 62
V

ILLUSTRATIONS
Figure Page
1 Geographic Location of Tracking Stations for theGSFC '73 Solution .......... . . . ....... ... 5
2 GEOID Height Comparison Between GSFC '73 and theGEM4 Satellite GEOID .................. . 37
3 GEOID Height Comparison for GSFC '73 and theGravimetric GEOID ................... ... 38
4 Histogram of North American Chord Agreement Betweenthe Reece Geometric and GSFC '73 Dynamic Solutions . . . ... 40
5 The Translation Parameters for the X CoordinatesBetween GSFC '73 and the Local Surveys(Satellite-Survey) in Meters . . . . . . . . . . . . ... . . . . 59
6 The Translation Parameters for the Y CoordinatesBetween GSFC '73 and the Local Surveys(Satellite-Survey) in Meters . . . . . . . . . . . . . . . . 60
7 The Translation Parameters for the Z CoordinatesBetween GSFC '73 and the Local Surveys(Satellite-Survey) in Meters . .......... . . . ...... 61
TABLES
Table Page
1 GSFC '73 Adjusted Station Coordinates . ............ 6
2 Stations Constrained to Adjust in Parallel . . . ......... 13
3 RMS of Fit to the Data for Station Solution . . . . . . . . . . .. 14
4 Number of Observations by Station Selected for theGSFC '73 Solution ................... .... 16
5 Comparison of Distances from the Earth's Spin Axisfor Sites Inferred from JPL DSN Solution and GSFC'73 Independent Solutions . . . .. ... . .. ......... . . . 22
6 Spin Axis Distance for the McDonald Observatory . ....... 23
vi

TABLES (Continued)
Table Page
7 Longitude Differences for Sites Inferred from JPLDSN Solution and GSFC '73 Independent Solutions . . . . . . . . . 25
8 Comparison of Distances from the Earth's Spin Axisfor Sites Inferred from Narrow Band VLBI Trackingof the Lunar Excusion Module and GSFC '73Independent Solutions ................... .. 27
9 Longitude Differences for Sites Inferred from NarrowBand VLBI Tracking of the Lunar Excusion Module andGSFC '73 Independent Solutions . . . . . . . . . . . . . . . . . 29
10 Comparisons of Distances from the Earth's Spin Axis forSites Inferred from the Dynamical S-Band Solution usingData from Mariner 9 and the GSFC '73 IndependentSolutions . . . . . . . . . . . . . . . . . . . . . . . . . .. 30
11 Longitude Difference for Sites Inferred from the DynamicalS-Band Solution using Data from Mariner 9 and the GSFC'73 Independent Solutions ................... 31
12 Comparison of Distances from the Earth's Spin Axisfor Florida and Hawaii ................... . 33
13 Residuals by Station in Meters Between the GeometricalSolution of Reece andGSFC' 73 ................. 41
14 Agreement with Survey for the Chord from Rosman, N.C.and Goldstone, California (Satellite-Survey) . . . . . .... . 43
15 Comparison of Chord Distances from Station 9004 (SanFernando, Spain) and the European Datum of 1950 . . . . . . . . . 44
16 Orientation Solution Between the Global GeocentricSolutions of GEM4 and GSFC '73 for 34 CommonStations . . . .. . . . . . . . . . . . . . . . . . . . . .. 46
17 An Orientation Solution Between GSFC '73 Solutionsusing Different Gravity Models . . . . . . . . . . . . . . . . . 48
18 Estimated Uncertainty in the GSFC '73 Station Solution . . . ... 49
19 The Orientation and Chord Length Agreement for theNorth American 1927 Datum with GSFC '73 .......... 52
vii

TABLES (Continued)
Table Page
20 The Orientation and Chord Length Agreement for theEuropean 1950 Datum with GSFC '73 . . . . . . . . . . . . . . . 54
21 The Orientation and Chord Length Agreement for theProvisional South American 1969 Datum withGSFC '73 . . . . . . . . . . . . . . . . . . . . . . . . . . . 55
22 The Orientation and Chord Length Agreement for theAustralian Geodetic Datum with GSFC '73 . . . . . . . . . . . . . 57
viii

1.0 INTRODUCTION
With the advent of artificial satellites, the science
of geodesy was provided with a valuable new means of direct
earth measurement on a global scale. Some 15 years have
passed and in this time, newer instrumentation, computers
and techniques have yielded work of high geodetic value.
Both operational and purely scientific demands have pro-
duced and required information on the size and shape of the
Earth and the geopotential. Many experiments using widely
varying techniques have derived information on the relative
positions of earth based observers, and their locations with
respect to the center of mass. The present level of accuracy
on a global basis is well below ten meters. This paper
presents the results of a global solution for the coordinates
of about 70 tracking stations derived with dynamical techniques
from precision reduced optical and laser observations of
geodetic satellites.
Three recent geodetic satellite observing campaigns
have provided a large amount of laser and precision optical
tracking data. These were the National Geodetic Satellite
Program (NGSP), the 1968 Centre National d'Etudes Spatiales
(CNES) - Smithsonian Astrophysical Observatory (SAO) Observing
Campaign, and the International Satellite Geodesy Experiment
(ISAGEX). Observations recorded during these programs have
been used in combination to compute a new global solution for
the coordinates of the tracking stations.
Results of dynamic adjustment of station coordinates
have been previously reported by the authors (Marsh, Douglas,
Klosko, 1971, 1972). These were based primarily upon pre-
cision reduced camera observations of the GEOS-I and II
flashing lamps. Since the last results were derived, large
amounts of additional NGSP optical data and laser data from the
1

ISAGEX have become available. Also major computer programimprovements have been implemented. The new software pro-vided the opportunity to combine laser and optical datawith all stations adjusted simultaneously without constraints,rather than in groups as before. Furthermore, our preliminaryerror analysis indicated that a large simultaneous solutionas performed required no initial constraints relating thestations to the geocenter. To assure this independence fromother solutions, the a priori variances of all station co-ordinates were taken to be 100,000 m2. The a posteriori variancesfrom the least-squares adjustement were generally 3m3 or less.
The amount of new data is substantial. In addition tothe laser data, the new solution contains approximately 5000additional GEOS-I and II camera observations recorded by NGSPEuropean Observatories. This data set consists of observationsmade available to us by the Malvern, Uzhgorod, Delft andHelsinki Observatories. The laser data contributed additionalprecise scale information to the optical solution, and alsoprovided recovery for two new areas of the world, Guam Islandand Dakar, Senegal.
The NONAME Orbit and Geodetic Parameters Estimation(Martin, C.F. and O'Neill, 1968) System used previously re-stricted the maximum number of stations which could be ad-justed simultaneously to twenty. In order to overcome thislimitation, previous results were derived in a step-wisefashion. The GEODYN Computer Program System (Martin, T.V.,1972) used in the present analyses did not contain thislimitation and permitted the simultaneous adjustment of allstations.
As before, we evaluate our results by making compari-sons wherever possible with independent results obtained byother experimenters. A more comprehensive evaluation of resultsis now possible through the independent geodetic values derived
2

from; Mariner-9 Unified S-Band tracking data, lunar laser
data recorded at McDonald Observatory, Apollo Lunar Module
tracking data and detailed gravimetric geoid heights based
upon a combination of satellite and surface gravity data
and others. These comparisons are of great significance
because some of the independent solutions for station co-
ordinates are independent of the geopotential.
3

2.0 DESCRIPTION OF SOLUTIONS
Figure 1 shows the geographic locations of the optical
and laser sites which contributed observations for thissolution. Data from BE-C, GEOS-I, GEOS-II, Dl-C and Dl-Dwere used in this work. Table 1 presents the values for ourrecovered stations referred to elsewhere in this text asGSFC '73.
The solutions were derived through the use of theGEODYN program on the GSFC IBM 360/95 computer. GEODYN isa multiple arc, multiple satellite orbit and geodetic parame-ter estimation system based upon Cowell type numericalintegration techniques. Model parameters included luni-solar gravitational perturbations, solar radiation pressure,BIH polar motion and UTI data, and several different setsof geopotential coefficients. While the effects of solidEarth tides are modeled by the program, they were not con-sidered in this analysis since the potential model solutionsdid not account for them.
A total of 150 two-day arcs were used in the finalsimultaneous solution. Experience with the GEOS flash ob-servations and laser data has indicated that two-day arcs areshort enough to accommodate model errors yet long enough toprovide adequate dynamical strength. The dominant errorsource for this work was uncertainty in the values of the12th and 13th order resonant coefficients of the gravitationalmodel. Resonance produces an orbital perturbation of about600 meters, primarily along track, on the GEOS satelliteswith a period of about six days. Resonance errors on theorder of a few tens of meters were for the most part absorbedin the two day orbital elements. To further reduce unmodeledorbital error, passes were selected to be in all directionson all sides of the stations which lead to favorable cancel-lation of errors.
4

FIGURE 1. GEOGRAPHIC LOCATION OF TRACKING STATIONS
FOR THE GSFC'73 SOLUTION
1800 2100 2400 2700 3000 3300 0o 300 600 90o
1200 1500 1800
180o
210°
2400 2700 300°
330 00 30 600 90O
1200 1500
* NASA camera
SSAO camerao International camera
SNASA laser* SAO laser
0 GRGS (French) laser

Table 1
GSFC '73 Adjusted Station Coordinates
StandardEarth Fixed Rectangular Coordinates
DeviationStation
Name Number X
(M) (M) (M) (M) (M) (M)
1BPOIN 1021 1118044.28 -4876311.20 3942969.13 1.58 1.66 2.13
1FTMYR 1022 807878.54 -5651976.34 2833509.48 0.98 0.74 1.47
1OOMER 1024 -3977283.19 3725645.25 -3302982.36 0.99 0.96 1.39
1SATAG 1028 1769720.15 -5044611.18 -3468254.13 1.24 1.29 1.65
1MOJAV 1030 -2357233.29 -4646330.63 3668317.01 0.90 0.76 1.40
1JOBUR 1031 5084792.27 2670410.49 -2768141.79 0.97 1.14 1.46
1NEWFL 1032 2602772.46 -3419140.86 4697664.13 2.54 4.10 3.31
1COLEG 1033 -2299250.39 -1445693.00 5751809.47 3.56 5.96 4.32
1GFORK 1034 - 521691.57 -4242046.85 4718728.68 0.98 0.84 1.38
1WNKFL 1035 3983118.58 - 48493.59 4964720.04 1.39 1.25 1.73
1ULASK 1036 -2282349.12 -1452644.04 5756898.95 2.55 2.39 3.10
1ROSMN 1037 647538.79 -5177924.35 3656711.95 0.97 0.77 1.44
1ORORL 1038 -4447490.66 2677168.66 -3695059.08 1.35 1.46 1.60
1ROSMA 1042 647531.24 -5177925.13 3656712.41 0.97 0.77 1.44
1TANAN 1043 4091870.67 4434292.77 -2064723.14 1.65 1.58 1.93
1UNDAK 7034 - 521691.57 -4242046.85 4718728.68 0.98 0.84 1.38
1EDINB 7036 - 828475.36 -5657454.18 2816822.13 1.07 0.86 1.57
1COLBA 7037 - 191271.65 -4967275.43 3983264.16 0.95 0.74 1.40
1BERMD 7039 2308235.18 -4873589.40 3394578.32 1.09 1.04 1.62
1PURIO 7040 2465075.10 -5534913.57 1985524.52 1.11 0.99 1.68
1DENVR 7045 -1240461.34 -4760228.83 4048990.72 0.97 0.84 1.44
GODLAS 7050 1130687.92 -4831357.28 3994109.28 1.21 0.83 1.34
WALLAS 7052 1261564.16 -4881571.83 3893172.13 1.36 1.32 1.47
6

Table 1 (Continued)-
StandardEarth Fixed Rectangular Coordinates Deviation
DeviationStation
Name Number X
(M) (M) (M) (M) (M) (M)
CRMLAS 7054 -2328182.35 5299650.40 -2669473.46 1.77 1.14 1.88
GMILAS 7060 -5068969.11 3584090.31 1458761.92 1.47 1.95 1.72
1JUM24 7071 976287.90 -5601398.33 2880235.06 1.51 1.45 1.99
1JUM40 7072 976291.83 -5601391.98 2880246.34 1.51 1.45 1.99
1SUDBR 7075 692631.93 -4347062.15 4600486.87 1.19 1.11 1.56
1JAMAC 7076 1384177.17 -6905663.00 1966543.85 1.22 1.08 1.75
1CARVN 7079 -2328597.68 5299360.83 -2669665.62 1.77 1.14 1.88
DAKLAS 7820 5886270.08 -1845641.58 1615263.13 2.56 3.74 3.21
DELFTH 8009 3923403.21 299905.17 5002984.93 1.72 1.44 1.88
ZIMWLD 8010 4331308.98 567539.81 4633129.26 1.23 1.31 1.84
MALVRN 8011 3920166.80 - 134710.63 5012735.01 2.34 1.74 2.25
HAUTEP 8015 4578327.29 457994.69 4403201.69 0.74 1.01 1.26
HAULAS 7809 4578347.92 457985.79 4403179.81 0.74 1.01 1.26
HAUTLS 89 4578370.29 457978.93 4403157.43 0.74 1.01 1.26
NICEFR 8019 4579478.08 586629.42 4386427.12 1.40 1.37 1.78
MUDONI 8030 4205641.08 163743.17 4776557.11 2.11 1.76 2.39
10ORGAN 9001 -1535737.62 -5167004.17 3401046.39 1.21 1.12 1.72
10LFAN 9002 5056128.71 2716523.00 -2775768.38 0.83 1.07 1.38
OLILAS 7902 5056126.96 2716522.07 -2775767.42 0.83 1.07 1.38
1SPAIN 9004 5105593.50 - 555216.21 3769676.43 0.70 0.94 1.27
SAFLAS 7804 5105613.60 - 555238.49 3769645.13 0.70 0.94 1.27
SAFLAS 80 5105613.60 -555238.49 3769645.13 0.70 0.94 1.27
1TOKYO, 9005 -3946711.01 3366270.13 3698831.44 2.70 4.27 3.05
1NATOL 9006 1018186.61 5471109.36 3109620.35 2.20 1.96 2.58
7

Table 1 (Continued)
StandardEarth Fixed Rectangular Coordinates
Station _Deviation
Name NumberX Y Z X Y Z(M) (M) (M) (M) (M) (M)
1QUIPA 9007 1942789.38 -5804078.88 -1796924.28 1.18 0.81 1.54
ARELAS 7907 1942789.54 -5804079.35 -1796924.43 1.18 0.81 1.54
1SHRAZ 9008 3376865.40 4404000.16 3136262.06 3.68 4.04 4.06
1CURAC 9009 2251853.44 -5816914.68 1327172.04 2.76 3.26 3.46
1VILDO 9011 2280592.01 -4914577.49 -3355407.84 1.36 1.21 1.67
1MAUIO 9012 -5466048.05 -2404310.04 2242187.75 1.23 1.27 1.70
HOPKIN 9021 -1936767.24 -5077711.90 3331918.44 1.33 1.05 1.66
HOPLAS 7921 -1936766.10 -5077708.34 3331923.32 1.33 1.05 1.66
AUSBAK 9023 -3977785.39 3725102.02 -3303006.37 0.99 0.96 1.39
DODAIR 9025 -3910455.14 3376332.59 3729216.75 2.70 4.27 3.05
DEZEIT 9028 4903748.22 3965226.77 963868.91 1.83 1.99 2.09
NATALB 9029 5186473.14 -3653859.90 - 654326.87 1.45 1.70 2.03
NATLAS 7929 5186473.65 -3653860.26 - 654326.93 1.45 1.70 2.03
COMRIV 9031 1693806.56 -4112337.96 -4556644.76 1.69 1.91 2.00
AGASSI 9050 1489751.00 -4467467.86 4287310.20 4.15 4.13 4.30
GREECE 9091 4595161.99 2039475.58 3912666.88 1.04 1.17 1.55
GRELAS 7930 4595219.45 2039457.97 3912620.41 1.04 1.17 1.55
COLDLK 9424 -1264826.52 -3466881.64 5185469.29 4.27 5.03 5.32
EDWAFB 9425 -2449996.16 -4624428.96 3635038.09 1.55 1.53 2.15
OSLONR 9426 3121260.13 592666.09 5512723.84 8.23 5.60 7.79
JOHNST 9427 -6007395.09 -1111889.86 1825744.67 2.88 3.40 3.50
RIGALA 9431 3183880.77 1421486.63 5322812.71 1.92 1.41 1.73
UZHGOR 9432 3907413.47 1602446.82 4763922.11 1.45 1.45 1.88
HELSIK 9435 2884532.38 1342146.05 5509530.97 2.92 2.13 2.38
8

Table 1 (Continued)
Geodetic Coordinates* Standard Deviation
Station EastName Number Latitude (Deg, Longitude Height Lat Lon Ht
Min, See) (Deg, Min, (Meters) (Sec) (Sec) (M)Min, Sec) Sec)
Sec)
1BPOIN 1021 38 25 49.826 282 54 49.027 - 50.26 0.061 0.066 1.93
1FTMYR 1022 26 32 53.336 278 8 4.582 - 36.87 0.046 0.036 0.81
1OOMER 1024 -31 23 25.041 136 52 15.828 123.10 0.044 0.041 0.89
1SATAG 1028 -33 8 58.452 289 19 53.702 705.21 0.052 0.049 1.33
1MOJAV 1030 35 19 47.914 243 5 59.462 886.09 0.043 0.037 0.85
1JOBUR 1031 -25 53 0.900 27 42 26.547 1534.93 0.047 0.041 1.01
1NEWFL 1032 47 44 29.639 307 16 46. 883 67.64 0.088 0.153 4.08
1COLEG 1033 64 52 18.268 212 937.190 156.20 0..121 0.363 5.46
1GFORK 1034 48 1 21.332 262 59 20.064 213.47 0.038 0.047 1.10
1WNKFL 1035 51 26 45.970 359 18 8.895 100.80 0.044 0.065 1.76
1ULASK 1036 64 58 36.948 212 28 31.733 287.51 0.078 0.197 3.05
1ROSMN 1037 35 12 7.330 277 741.756 861.79 0.044 0.039 0.90
1ORORL 1038 -35 37 32.012 148 57 14.927 941.43 0.052 0.054 1.45
1ROSMA 1042 35 12 7.345 277 741.456 861.92 0.044 0.039 0.90
1TANAN 1043 -19 0 31.858 47 17 59.420 1356.32 0.061 0.056 1.64
1UNDAK 7034 48 1 21.332 262 59 20.064 213.47 0.038 0.047 1.10
1EDINB 7036 26 22 46.733 261 40 7.840 20.35 0.049 0.039 0.95
1COLBA 7037 38 53 36.179 267 47 41.417 225.04 0.042 0.039 0.91
1BERMD 7039 32 21 49.787 295 20 35. 615 - 16.84 0.050 0.043 1.12
1PURIO 7040 18 15 28.771 294 0 24.034 - 9.46 0.053 0.039 1.03
1DENVR 7045 39 38 48.065 255 23 39. 119 1759.45 0.042 0.041 1.01
GODLAS 7050 39 1 14.268 283 10 18. 955 2.46 0.044 0.051 0.74
WALLAS 7052 37 51 36.191 284 29 24.506 - 49.68 0.056 0.055 1.00
CRMLAS 7054 -24 54 15.609 113 42 58.681 - 1.46 0.063 0.065 0.92
*ae = 6378155.m, 1/f= 298.255
9

Table 1 (Continued)
Geodetic Coordinates* Standard Deviation
Station EastGeodetic
Name Number Latitude (Deg, Longitude Height Lat Lon Htmin, Seg) (Deg, Min, (Meters) (Sec) (Sec) (M)Min, Sec) Sec)
Sec)
GMILAS 7060 13 18 33.581 144 44 13.951 126.82 0.055 0.077 0.80
1JUM24 7071 27 1 13.868 279 53 13.092 - 31.04 0.061 0.055 1.60
1JUM40 7072 27 1 14.277 279 53 13.272 - 30.89 0.061 0.055 1.60
1SUDBR 7075 46 27 21.352 279 3 10,907 230.50 0.044 0.056 1.33
1JAMAC 7076 18 4 34.515 283 11 27.437 415.28 0.056 0.042 1.12
1CARVN 7079 -24 54 22.615 113 43 16.381 - 9.46 0.063 0.065 0.92
DAKLAS 7820 14 46 3.458 342 35 28.210 28.69 0.115 0.123 2.21
DELFTH 8009 52 0 6.468 4 22 16.292 56.54 0.053 0.076 1.95
ZIMWLD 8010 46 52 37.225 7 27 54.171 941.68 0.048 0.063 1.63
MALVRN 8011 52 8 36.002 358 1 54.808 145.02 0.058 0.092 2.69
HAUTEP 8015 43 55 57.739 5 42 45.360 691.16 0.040 0.046 0.77
HAULAS 7809 43 55 56.787 5 42 44.871 690.13 0.040 0.046 0.77
HAUTLS 89 43 55 55.780 5 42 44.465 690.14 0.040 0.046 0.77
NICEFR 8019 43 43 32.980 7 17 59.324 415.51 0.052 0.062 1.59
MUDONI 8030 48 48 22.175 2 13 46.696 '205.89 0.059 0.087 2.60
1ORGAN 9001 32 25 24.805 253 26 49.169 1615.84 0.052 0.047 1.24
1OLFAN 9002 -25 57 36.013 28 14 52.626 1558.13 0.045 0.040 0.78
OLILAS 7902 -25 57 36.013 28 14 52.626 1555.92 0.045 0.040 0.78
1SPAIN 9004 36 27 46.764 353 47 37.190 56.48 0.041 0.038 0.71
SAFLAS 7804 36 27 45.516 353 47 36.388 55.88 0.041 0.038 0.71
SAFLAS 80 36 27 45.516 353 47 36.388 55.88 0.041 0.038 0.71
1TOKYO 9005 35 40 22.708 139 32 17.258 78.41 0.112 0.131 3.46
INATOL 9006 29 21 34.473 792727.796 1863.09 0.077 0.081 2.21
1QUIPA 9007 -16 27 56.834 288 30 24.664 2476.01 0.049 0.040 0.83
*ae = 63 78155.m, 1/f = 298.255
10

Table 1 (Continued)
Geodetic Coordinates* Standard Deviation
Station EastName Number Geodetic Longitude Height Lat Lon Ht
Latitude (Deg, (Deg, Min, (Meters) (Sec) (Sec) (M)Min, Sec) Sec)
ARELAS 7907 -16 27 56.834 288 30 24.664 2476.53 0.049 0.040 0.83
1SHRAZ 9008 29 38 13.786 52 31 12.030 1566.93 0.116 0.139 4.39
1CURAC 9009 12 5 25.109 291 944.992 - 20.72 0.105 0.098 3.28
1VILDO 9011 -31 56 34.777 294 53 36.556 622.71 0.052 0.052 1.28
IMAUIQ 9012 20 42 26.097 203 44 34.433 3040.82 0.054 0.045 1.22
HOPKIN 9021 31 41 2.993 249 7 18.799 2338.61 0.054 0.052 0.98
HOPLAS 7921 31 41 3.191 249 7 18.792 2338.00 0.054 0.052 0.98
AUSBAK 9023 -31 23 25.788 136 52 43.828 131.50 0.044 0.041 0.89
DODAIR 9025 36 0 20.012 139 11 32.248 877.29 0.112 0.132 3.46
DEZEIT 9028 8 44 51.256 38 57 33.837 1897.72 0.068 0.066 1.79
NATALB 9029 - 5 55 40.252 324 50 7.373 28.52 0.066 0.061 1.20
NATLAS 7929 - 5 55 40.252 324 50 7.373 29.14 0.066 0.061 1.20
COMRIV 9031 -45 53 12.463 292 23 9.539 186.85 0.062 0.079 1.98
AGASSI 9050 42 30 21.759 288 26 30.541 131.07 0.126 0.183 4.50
GREECE 9091 38 4 44.567 23 55 59.285 489.38 0.047 0.050 1.10
GRELAS 7930 38 4 42.473 23 55 57.668 496.42 0.047 0.050 1.10
COLDLK 9424 54 44 34.260 249 57 23.234 665.23 0.133 0.234 6.11
EDWAFB 9425 34 57 50.648 242 5 8.202 745.29 0.063 0.062 1.75
OSLONR 9426 60 12 39.545 10 45 4.869 593.98 0.187 0.360 9.74
JOHNST 9427 16 44 38.967 19029 9.707 3.33 0.105 0.108 3.36
RIGALA 9431 56 56 55.437 24 3 32.470 11.11 0.050 0.094 1.92
UZHGOR 9432 48 38 1.831 22 17 55.471 216.12 0.050 0.071 1.79
HELSIK 9435 60 9 43.199 24 57 7.633 41.59 0.080 0.153 2.66
*ae = 6378155. m, 1/f = 298.255
11

In order to utilize accurate survey ties between ad-
jacent stations, the coordinates of certain stations were
constrained to adjust in parallel. A list of the constrained
stations is presented in Table 2. It is noted that no other
constraints were employed in the solution since it was felt
that the laser data could be used to reveal systematic dif-
ferences due to the incompatibility of computation parameters
such as scale which might otherwise be obscured. Also, the
optical data provide a direct and absolute measure of latitude
and longitude with proper modeling of UT1 and polar motion.
The goal of the authors was to produce a global solu-tion with an accuracy of 5 meters in each coordinate. Ourprevious work employed the SAO 1969 Standard Earth Gravity Modelwhich was found to be the best available at that time. Recently,Lerch, et al. at GSFC (1972) have produced a series of gravitymodels (GEM). Our global solution was computed using the GEM1gravity model modified with the SAO 1969 resonant coefficients andrepeated using the full SAO 1969 model. Generally, the resultsusing GEM1 gave a more consistent set of recovered stations, asmaller RMS of fit to the-data and the best overall results. Itis the station solution with GEM1 and the SAO 12th, 13th and 14th
order terms (resonant coefficients) which we have adopted forthe GSFC '73 solution. In Section 3.5 a comparison of theresults obtained with these two gravity models is presented.
A total of 65,000 optical observations and some 350passes of laser data were used in our final simultaneousrecovery. The NASA and CNES laser data were sampled leavingfrom 10 to 20 points per pass where possible. For those systemswith slower data rates, all data available were used. The formalRMS of fit for this data set after station adjustment is pre-sented in Table 3.
12

TABLE 2
STATIONS CONSTRAINED TO ADJUST IN PARALLEL
Mt. Hopkin, Arizona 7921-9021
Woomera, Australia 1024-9023
Carnarvon, Australia 7054-7079
Natal, Brazil 7929-9029
Jupiter, Florida 7071-7072
Haute Provence, France 89-7809-8015
Dionysis, Greece 7930-9091
Tokyo, Japan 9005-9025
Rosman, North Carolina 1037-1042
Olifantsfontein, Republic ofSouth Africa 7902-9002
Arequipa, Peru 7907-9007
San Fernando, Spain 80-7804-9004
13

TABLE 3
RMS OF FIT TO THE DATA FOR STATION SOLUTION
Number ofObservations RMS of Fit
Right Ascension 32122 1.62 seconds of arc
Declination 32301 1.54 seconds of arc
Laser Ranges 7043 4.6 meters
14

The number of observations for each station used in
the solution is presented in Table 4. This fit to the
data demonstrates that the optical data has a noise level
well below 2 seconds of arc.
15

TABLE 4
NUMBER OF OBSERVATIONS BY STATION SELECTEDFOR THE GSFC '73 SOLUTION
STATION STATIONCODE NAME NUMBER NO. OF OBS. CODE NAME NUMBER NO. OF OBS.
1BPOIN 1021 918 GODLAS 7050 1812
1FTMYR 1022 3969 WALLAS 7052 178
[100MER 1024 6241 CRMLAS 7054 214AUSBAK 9023 2938 1CARVN 7079 194
1SATAG 1028 1234 GMILAS 7060 1078
1MOJAV 1030 4266 1JUM24 7071 202
1JOBUR 1031 2236 1JUM40 7072 976
1NEWFL 1032 148 1SUDBR 7075 1350
1COLEG 1033 230 1JAMAC 7076 1412
1GFORK 1034 2194 DAKLAS 7820 326
1UNDAK 7034 8931 DELFTH 8009 472
1WNKFL 1035 632 ZIMWLD 8010 1290
1ULASK 1036 558 MALVRN 8011 458
1ROSMN 1037 1832 [HAUTEP 8015 80211ROSMA 1042 1436 HAUTLS 89 50310RROL 1038 1186 LHAULAS 7809 1233J1T.NAN 1043 504 NICEPR 8019 516
1EDINB 7036 2364 MUDONI 8030 236
1COLBA 7037 4168 1ORGAN 9001 1844
1BERMD 7039 1568 [OLFAN 9002 27701PURIO 7040 1868 GILLAS 7902 3461DENVR 7045 3078 1SPAIN 9004 319311CURAC 9009 310 LSAFLAS 80;7804 9391VILDO 9011 1318 1TOKYO 9005 58IMAUIO 9012 1296 [DODAIR 9025 841HOPKIN 9021 854 1NATOL 9006 366[HOPLAS 7921 197] 1QUIPA 9007 1506DEZEIT 9028 398 [ARELAS 7907 300][NATALB 9029 386 1SHRAZ 9008 174INATLAS 7929 135 COMRIV 9031 508
16

TABLE 4 (Cont.)
STATION STATIONCODE NAME NUMBER NO. OF OBS. CODE NAME NUMBER NO. OF OBS.
AGASS1 9050 156 OSLONR 9426 28 *
GREECE 9091 1322 JOHNST 9427 166
GRELAS 7930 60 RIGALA 9431 660
COLDLK 9424 78 UZHGOR 9432 522
EDWAFB 9425 1026 HELSIK 9435 250
[ - Constrained Stations
* Only 1 pair of observations for each pass was precision reduced.
17

3.0 RESULTS
The final coordinate values are presented in Table 1.
The formal error statistics for a solution of this nature
based upon an analysis of the residuals are usually overly
optimistic due to the fact that they do not consider the presence
of unmodeled error sources. These formal statistics (table 1),
however, do show a recovery to the 1 meter level in most cases.
The goal of this section is to establish a reasonable accuracy
estimate (ascribable to unmodeled error in our solution)
through comparison with other independent solutions.
A brief description of the independent solutions used
as a source of comparison for this paper is presented below:
* Solutions independent of the Earth's gravity
field have been obtained by Mottinger (1969) of
JPL (Deep Space Stations) and by Ryan (1972) of GSFC
(Unified S-Band Stations) for precise distances
from the Earth's spin axis and relative long-
itudes.
* Lunar laser data recorded at McDonald Observatory
was analyzed by Williams, et al (1973) for the recovery
of the distance from the Earth's spin axis.
* Narrow band VLBI techniques have been employed
by Walls and Martin (1972) at GSFC to recover relative
longitudes and spin axis distances for the S-Band
tracking of the Lunar Excursion Module (LEM).
Vincent and Marsh (1973) have produced gravimetric
geoids encompassing most of the northern hemi-
sphere and Australia providing a very accurate
check on station heights.
18

* Geometric solutions based upon a combination
of optical and laser data have been computed
for Europe (Cazenave et al, 1971) and for
North America (Reece et al, 1973). While the
data sets for these solutions are subsets of
our own, geometric procedures are not
influenced by errors in satellite dynamics.
* VLBI techniques by Ramasastry et al (1973) at
GSFC have yielded precise baselines across the
United States.
* Ground based measurements such as surveys are
used to establish a ground truth and an assess-
ment of both systematic scale and local noise
type errors.
* For dynamical satellite geodesy, the recently
published solutions 1973 SAO Standard Earth
by Gaposchkin at SAO (1973) and GSFC GEM4
(Lerch et al, 1972) provide intercomparisons for
solutions using primarily optical and laser
tracking.
The above list is not meant to be all inclusive but
contains solutions which could be readily compared with our
own. A wide variety of experimental techniques and instru-
mentation is sampled for these comparisons.
19
3.1 GSFC '73 COMPARISON WITH GEODETIC PARAMETERS RECOVEREDAT JPL FOR THE DEEP SPACE NETWORK AND THE MCDONALDOBSERVATORY LUNAR LASER EXPERIMENT
In any data analysis effort, evaluation of the results
is one of the most difficult and important tasks. In satellite
geodesy, it is useful to compare the results of several inves-
tigators but in many cases the solutions are not truly inde-
pendent. Fortunately the results of JPL for spin-axis distance
and longitude differences are both highly accurate and are
obtained independently of near Earth satellites.
As noted by Mottinger (1969), DSS data from interplanetary
spacecraft do not yield a complete station position. The well-determined parameters are the distance of a station from the
Earth's spin axis and the relative longitudes of the stations.
The Earth-fixed Z component of the station position is poorly
determined. Thus complete DSS positions rely on independent
determinations.
In no case is an optical or laser station precisely
contiguous with a DSS site. But in all cases except in Spainthe stations are very close, so close that significant surveyerror can generally be regarded as unlikely.
The procedure used to infer optical coordinates from theDSN solutions follows. The local-to-center of mass shift forthe DSN radar was calculated and then applied to the localcoordinates of the nearby optical sites. In cases where twocameras are nearby and independently determined, both arepresented. The resulting derived camera coordinates were thenused to calculate spin-axis distances and longitude differences.A comparison of the spin-axis distances is given in Table 5for the GSFC '73 and JPL LS25 solutions.
20

In previous optical solutions which used the SAO S.E.
1969 gravity model, we found little systematic difference in
the recovered spin-axis distances for the cameras and nearby
JPL radars CMarsh, Douglas, Klosko, 1971). This was probably
due to two factors. First, the SAO station solution of 1969
contained some constraints from the JPL results and we held
SAO information fixed initially in our previous work. Second,
the semi-major axes of the orbital arcs were able to accommodate
an error in GM.
In our recent work we included scale providing laser
data. Also, no a priori station constraints were employed.
These solutions produced spin axis distances which were
systematically larger than those of JPL when using a value
of GM = 3.986013 x 10⁵ km3/sec 2 . However, when GM was
changed to the more recent value of 3.986008 x 10⁵ km3/sec 2
Esposito and Wong, 1972) this disagreement was reduced.
The spin axis results obtained when using the value
of GM = 3.986008 x 10⁵ km3/sec 2 indicated a scale difference-6 h ipi b
of +0.8 x 10⁻⁶ for spin axis distances. The GM implied by
this scale difference would be about 3.986000 x 10⁵ km3/sec 2
Allowing for this scale, the rms difference between JPL and
GSFC '73 is 2.6 meters.
Analysis of laser range measurements to the lunar retro-
reflectors recorded at McDonald Observatory, Ft. Davis, Texas
by the lunar laser group (Williams, et.al., 1972) has yielded
the distance of the observing site from the spin axis of the
Earth with an accuracy of +3 meters. Table 6 presents a
comparison of the lunar laser results and those obtained from
recent optical/laser solutions including GSFC '73. When
the .8 ppm scale factor as determined from the JPL comparison
is subtracted from the GSFC '73 recovery, the agreement with
the lunar laser is 30 cm.
21

TABLE 5
COMPARISON OF DISTANCESFROM THE EARTH'S SPIN AXIS
FOR SITES INFERRED FROMJPL DSN SOLUTION AND GSFC '73
INDEPENDENT SOLUTIONS
OPTICAL LOCATION OPTICAL CODE JPL STATION SPIN AXIS DISTANCENUMBER AX,AY* USED (GSFC '73)-IJPL(LS25)]
FOR INFERRED Meters ppm Ar-(Ar x r)SOLUTION ppm
GOLDSTONE, CALIFORNIA 1030 DSN12 3.2m .61 -1.0m
EDWARDS AFB, CALIFORNIA 9425 DSN12 6.3m 1.20 2.1m
WOOMERA, AUSTRALIA 9023 DSN41 8.1m 1.49 3.7m
JOHANNESBURG, REP.OF S.AFRICA 1031 DSN51 2.6m .45 -2.0m
OLIFANTSFONTEIN,REP.OF S.AFRICA 9002 DSN51 1.3m .23 -3.3m
ORRORAL, AUSTRALIA 1038 DSN4Z 7.0m 1.35 2.8m
SAN FERNANDO, SPAIN 9004 DSN61 1.6m .31 -2.5m
ar = 0.8, ippmAX,AY is difference in surveyed X,Y and JPL recovered X,Y.

TABLE 6
SPIN AXIS DISTANCE FOR THE MCDONALD OBSERVATORY
GSFC '73 5492420.7m
GSFC '73* 5492416.3m
LUNAR LASER 5492416.0m
GSFC GEM4 5492418.3m
SAO '69 5492417.0m
SAO '73 5492413.4m
Modified to account for scale difference of 0.8 ppm as determined fromcomparison of GSFC '73 and JPL.

Table 7 presents the longitude differences between JPLand GSFC '73 after removal of a longitude rotation of 0'27(z 8 meters at the equator). It is noted that both theSAO 1969 and an earlier GSFC 1971 solution were rotated inlongitude by about 0?75 with respect to JPL. In our present
solutions using the SAO 1969 Standard Earth Gravity Modelwith no a priori information being supplied by SAO stationrecoveries, our results rotated into agreement with
JPL longitude. With use of the GEM1 model, a rotation of0O'27 in longitude again appeared. When this 0'27 rotationis removed, the rms agreement in longitude is 2.6 meters.This rotation may be related to least squares accommodationof tesseral harmonic coefficient error.
24

TABLE 7
LONGITUDE DIFFERENCESFOR SITES INFERRED FROM JPL DSN
SOLUTION AND GSFC '73INDEPENDENT SOLUTIONS
OPTICAL LOCATION OPTICAL CODE JPL STATION LONGITUDE DIFFERENCENUMBER AX* USED FOR (GSFC '73) - IJPL{LS25)]
INFERRED SECONDS OFSOLUTION ARC METERS
GOLDSTONE, CALIFORNIA 1030 DSN12 0.00 0.0
EDWARDS AFB, CALIFORNIA 9425 DSN12 0711 -2.7
WOOMERA, AUSTRALIA 9023 DSN41 07'.18 4.8
JOHANNESBURG, REP.OF S.AFRICA 1031 DSN51 0.'02 0.6
OLIFANTSFONTEIN, REP.OF S.AFRICA 9002 DSN51 -0'.'03 -0.8
ORRORAL, AUSTRALIA 1038 DSN42 -0.13 -3.3
SAN FERNANDO, SPAIN 9004 DSN61 0.'03 0.75
AX is difference in surveyed longitude and JPL recovered longitude.
A mean longitude rotation of 0'27 has been applied to the GSFC values.

3.2 COMPARISONS WITH USB GEODETIC STATION LOCATIONSDETERMINED FROM LEM LUNAR SURFACE DATA AND MARINER 9
Martin and Walls with GSFC(Martin & Walls, 1972) have
determined station positions for the Unified S-Band sites of
the Spaceflight Tracking and Data Network (STDN) using metric
data from the Lunar Excursion Module (LEM) while on the moon's
surface. A set of positions were estimated in a combination
solution reducing data from Apollo 14, 15 and 16. The JPL DSN
stations were held fixed in this work and an analysis of the
effects of all significant error sources indicated an accuracy
of 10m for most stations for longitude and spin axis parameters.
Frequency biases were the dominant errors except for those
stations with hydrogen maser data - Bermuda, Merritt Island
and Hawaii - for which residual refraction effects were the
dominant errors. Narrow band VLBI was used for their recovery
making the results virtually independent of the Earth's GM and
errors in the lunar ephemeris.
Table 8 presents a comparison of the spin axis distances
for the LEM solution and GSFC '73. The AX, AY and AX parameters
from the LEM recovered S-Band sites and the S-Band local surveys
were used to derive nearby optical coordinates. Independent
optical sites, in the case of Maryland - three such independent
sites, are each transformed using the S-Band results. These
inferred values are then compared with GSFC '73. Martin and
Walls indicated in their published parameter uncertainties that
their poorest determinations were at Guam and Carnarvon. The
larger differences noted at Guam and Carnarvon are therefore
not surprising. Merritt Island and Hawaii, which were indicated
t~ have good recoveries, show differences with GSFC '73 which
are unexpectedly large. As will be shown later, possible errors
exist in the survey ties between the S-Band radar and camera
sites.
26

TABLE 8
COMPARISON OF DISTANCESFROM THE EARTH'S SPIN AXIS
FOR SITES INFERRED FROM NARROW BAND
VLBI TRACKING OF THE LUNAR
EXCURSION MODULE AND GSFC '73INDEPENDENT SOLUTIONS
OPTICAL/LASER LOCATION OPTICAL/LASER S-BAND RADAR ASPIN AXIS DISTANCE
CODE NUMBER AX,AY* USED (GSFC '73) - (LEM)FOR INFERRED METERS
SOLUTION Ar Ar-(Ar xr)
FORT MYERS, FLORIDA 1022 USB1 (MERRITT ISL.) 11.7m 7.1m
JUPITER, FLORIDA 7072 USB1 (MERRITT ISL.) 16.1m 11.6m
BLOSSOM POINT, MARYLAND 1021 USB16 (GSFC) - 0.7m - 4.7m
GSFC, MARYLAND 7050** USBl6 (GSFC) - 6.3m -10.3m
WALLOPS ISLAND, VIRGINIA 7052** USB16 (GSFC) -11.5m -15.5m
BERMUDA 7039 USB3 (BERMUDA) 1.lm - 3.2m
CARNARVON, AUSTRALIA 7054** USB8 (CARNARVON) 12.1m 7.Sm
GUAM 7060** USB9 (GUAM) 10.9m 5.9m
MAUI, HAWAII 9012 USB11 (KAUAI, HAWAII) -13.5m -18.3m
EDINBURG, TEXAS 7036 USB14 (CORPUS CHRISTI) - 4.5m 9.1m
*AX,AY is difference in survey X,Y and recovered S-Band X,Y.
**NASA lasers
&A is the scale of .8 ppm determined from GSFC/JPL comparisons.

Table 9 presents a comparison of the longitudes derived
from the LEM solutions with those of GSFC '73. Again, Hawaii
shows a large disagreement. The agreement elsewhere is .very
good with an RMS of 5.0 meters.
Ryan at GSFC (Ryan, 1972) used data recorded during
Mariner-Mars 1971 Unified S-Band Tracking and Calibration
Experiment by the S-Band sites of the STDN to recover spin-
axis distances and relative longitudes. The Deep Space
Network supported this experiment. The DSN locations were
held unadjusted in Ryan's work at the LS-25 values. Using
3-way USB doppler data with corresponding 2-way DSN doppler
data, Ryan recovered values using least squares regression
analysis. Ryan places 15m as an upper bound for error in
his work.
Table 10presents a comparison of spin axis distances
for Ryan and GSFC '73. Contrary to Martin and Walls, Ryan
indicates that he had good spin-axis recoveries at Guam and
Carnarvon. Here we find good agreement with GSFC '73.
Elsewhere the agreement with Ryan is only slightly different
than that of the LEM solution with Merritt Island and Hawaii
continuing to show large differences.
Table 11 presents a comparison with the Mariner 9
solution for longitude. While Hawaii and Merritt Island
show large disagreement, the Mariner 9 solution for ETC
(GSFC) also seems to be inconsistent with both the LEM and
the GSFC '73 recovery. Ryan indicated that ETC was a known
poor determination.
28

TABLE 9
LONGITUDE DIFFERENCESFOR SITES INFERRED FROM NARROW BAND
VLBI TRACKING OF THE LUNAREXCURSION MODULE AND GSFC '73
INDEPENDENT SOLUTIONS
OPTICAL/LASER LOCATIONS OPTICAL/LASER S-BAND RADAR LONGITUDE DIFFERENCECODE NUMBER AX* USED FOR (GSFC '73)*- (LEM)
INFERRED SECONDS OFSOLUTION ARC METERS
FORT MYERS, FLORIDA 1022 USB1 (MERRITT ISL.) 0'00 0.Om
JUPITER, FLORIDA 7072 USB1 (MERRITT ISL.) 0.'13 3.6m
BLOSSOM POINT, MARYLAND 1021 USBl6 (GSFC) -0.'32 -7.7m
GSFC, MARYLAND 7050** USB16 (GSFC) -0.22 -5.7m
WALLOPS ISLAND, VIRGINIA 7052** USBl6 (GSFC) 0.04 1.0m
BERMUDA 7039 USB3 (BERMUDA) 0.02 0.5m
CARNARVON, AUSTRALIA 7054** USB8 (CARNARVON) 0.'13 3.7m
GUAM 7060** USB9 (GUAM) 0733 9.9m
MAUI, HAWAII 9012 USB11 (KAUAI, HAWAII) 0751 14,7m
EDINBURG, TEXAS 7036 USBl4 (CORPUS CHRISTI07.'12 -3.3m-
AX is difference in surveyed longitude and LEM recovered longitude
**NASA laser
*The S-Band solution is consistent with JPL. The GSFC '73/JPL rotationof 0.27 was therefore applied in this comparison.

TABLE 10
COMPARISONS OF DISTANCESFROM THE EARTH'S SPIN AXIS FOR
SITES INFERRED FROM THE DYNAMICAL S-BANDSOLUTION USING DATA FROM MARINER 9
AND THE GSFC '73 INDEPENDENT SOLUTIONSSPIN AXIS DISTANCE(GSFC '73) - (RYAN)
OPTICAL/LASER LOCATION OPTICAL/LASER S-BAND RADAR AX,AY* METERS ,CODE NUMBER USED FOR INFERRED Ar Ar-(Ar X r)
SOLUTION ppm
FORT MYERS, FLORIDA 1022 USB1 (MERRITT ISL.) 11.3 6.7m
JUPITER, FLORIDA 7072 USB1 (MERRITT ISL.) 15.9 11.4m
BLOSSOM POINT, MARYLAND 1021 USB16 (GSFC) 9.4 5.4m
GSFC, MARYLAND 7050** USB16 (GSFC) 3.8 - 0.2m
WALLOPS ISLAND, VIRGINIA 7052** USBl6 (GSFC) -1.0 - 5.0m
BERMUDA 7039 USB3 (BERMUDA) 1.9 - 2.4m
CARNARVON, AUSTRALIA 7054** USB8 (CARNARVON) 3.8 - 0.8m
GUAM 7060** USB9 (GUAM) 6.5 1.5m
MAUI, HAWAII 9012 USB11 (KAUAI, HAWAII) -16.3 -21.0m
EDINBURG, TEXAS 7036 USB14 (CORPUS CHRISTI) 8.9 4.3i
AX,AY is difference in survey X,Y and Mariner 9 recovered S-Band X,Y.
NASA lasers

TABLE 11
LONGITUDE DIFFERENCEFOR SITES INFERRED FROM THE DYNAMICAL
S-BAND SOLUTION USING DATA FROM MARINER 9AND THE GSFC '73 INDEPENDENT SOLUTIONS
OPTICAL/LASER LOCATION OPTICAL/LASER S-BAND RADAR LONGITUDE DIFFERENCE
CODE NUMBER AA* USED FOR (GSFC '73)*- (RYAN)INFERRED SECONDS OFSOLUTION ARC METERS
FORT MYERS, FLORIDA 1022 USBi (MERRITT ISL.) 0.34 9.5
JUPITER, FLORIDA 7072 USBi (MERRITT ISL.) 0.47 13.0
BLOSSOM POINT, MARYLAND 1021 USB16 (GSFC) 0.'41 10.0
GSFC, MARYLAND 7050** USB16 (GSFC) 0751 12.3
WALLOPS ISLAND, VIRGINIA 7052** USB16 (GSFC) 0.'77 18.8
BERMUDA 7039 USB3 (BERMUDA) 0.'02 0.5
CARNARVON, AUSTRALIA 7054** USB8 (CARNARVON) 0'17 4.8
GUAM 7060** USB9 (GUAM) 0.'21 6.3
MAUI, HAWAII 9012 USB11 (KAUAI, HAWAII) 0757 16.4
EDINBURG, TEXAS 7036 USB14 (CORPUS CHRISTI) 0.05 1.4
AX is difference in surveyed longitude and Mariner 9 recovered longitude.
NASA laser
*The S-Band solution is consistent with JPL. The GSFC '73/JPL rotation
of 0'27 was therefore applied in this comparison.
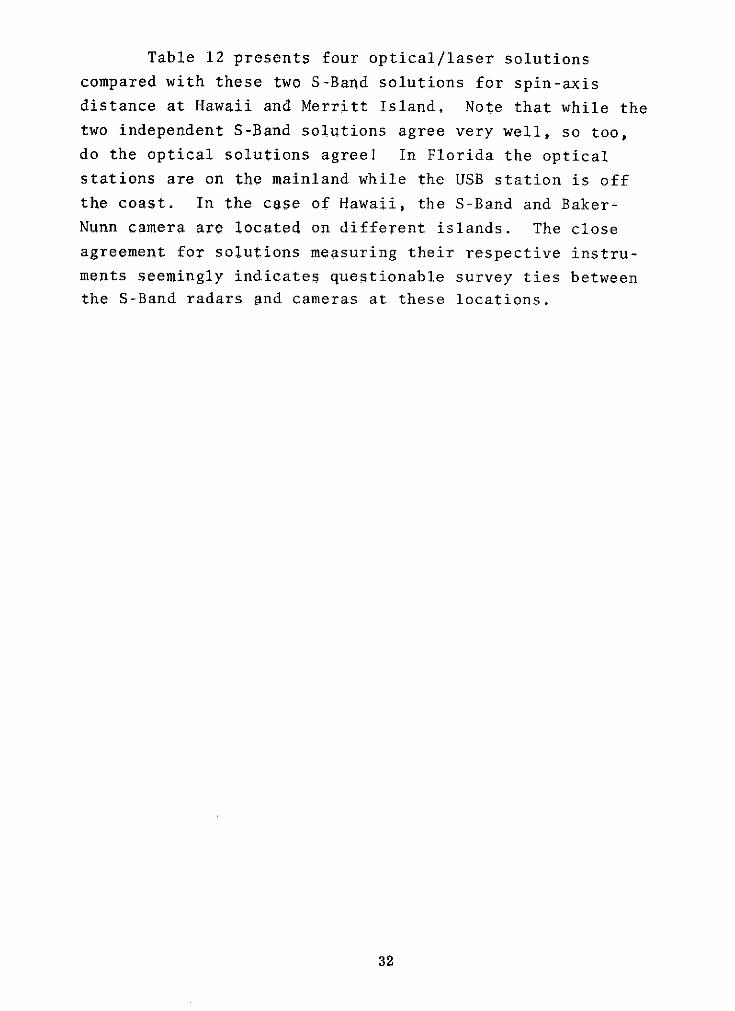
Table 12 presents four optical/laser solutions
compared with these two S-Band solutions for spin-axis
distance at Hawaii and Merritt Island, Note that while the
two independent S-Band solutions agree very well, so too,do the optical solutions agree! In Florida the optical
stations are on the mainland while the USB station is off
the coast. In the case of Hawaii, the S-Band and Baker-
Nunn camera are located on different islands. The close
agreement for solutions measuring their respective instru-
ments seemingly indicates questionable survey ties between
the S-Band radars and cameras at these locations.
32

TABLE 12
COMPARISON OF DISTANCESFROM THE EARTH'S SPIN AXIS
FOR FLORIDA AND HAWAII
INFERRED SPIN AXIS DISTANCE* RECOVERED SPIN AXIS DISTANCE*UNIFIED S-BAND SOLUTIONS OPTICAL/LASER SOLUTION
LOCATION CODE MARTIN RYAN GSFC GEM4 SAO SAONUMBER (LEM) (MARINER 9) '73 '72 '69 '73
FLORIDA 7072 820.5 820.7 836.6 832.4
1022 410.7 411.1 422.4 425.5
9010 826.0 826.2 845.6 842.4 833.2
HAWAII 9012 478.0 480.8 464.5 464.6 457.7 470.1
Last three digits of values .in meters.

3.3 EVALUATION OF RADIAL POSITIONS
The relative longitude and spin axis distance compari-
sons presented in the preceding section provide an excellent
means of assessing the precision of the geocentric X and Y
coordinate values of the solution. This precision has been
shown to be a very few meters. These comparisons are in-
sensitive to the Z values however. Systematic errors as
large as five meters can occur in Z due to errors in zonal
harmonics (Anderle 1973). Other errors are also present,
primarily due to uncertainties in modeling tesseral and
sectorial harmonics. Errors in Z will be propagated into
errors in the heights above the reference ellipsoid for
stations not on the equator.
Gravimetric geoids have been used to evaluate the
radial coordinates of our solution. On a global basis we
have used the geoid corresponding to the GSFC GEM-4 gravity
field (Marsh et al, 1973). Comparisons of this global
geoid with detailed gravimetric geoids indicated that the
accuracy is generally on ~he order of five to ten meters.
In the areas of North America, Europe and Australia,
the detailed gravimetric geoid (Vincent and Marsh, 1973)
based upon a combination of surface gravity data and satellite
data has been used. The accuracy of the detailed geoid has
been assessed as about 2 meters.
34

Figure 2 presents a plot of Ah where
Ah = (hel - hmsl) - N
versus station latitude where:
hel is the height of the station above the
reference ellipsoid
hms1 is the height of the station above mean
sea level obtained from survey data
and
N represents the GEM-4 global geoid heights.
Thus the differences presented in the Figure 2 represent the
sum of errors in the dynamically determined height, the survey
height above mean sea level and the satellite geoid height.
The RMS difference for this comparison is 5.6 meters, after
removal of a systematic difference. This systematic differ-
ence is due to the difference in semi-major axes used for
the geoid heights (6378142m) and the reference figure for
the recovered station coordinates (6378155m). This result
agrees well with Mueller (1973) and Lerch (1972) who both
indicated that a reference ellipsoid of 6378155m is too
large by at least 10m. This plot indicates no significant
slope in the residuals as a function of latitude which means
that displacement of the origin of the coordinate system
along the Z axis must be less than a few meters.
35
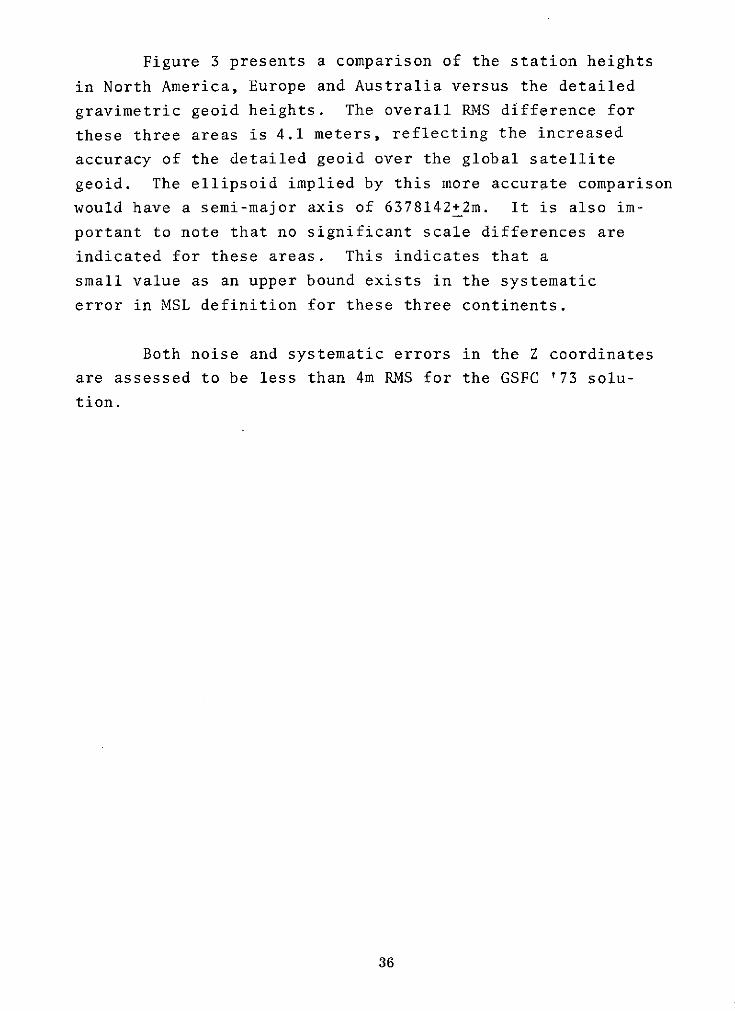
Figure 3 presents a comparison of the station heights
in North America, Europe and Australia versus the detailed
gravimetric geoid heights. The overall RMS difference for
these three areas is 4.1 meters, reflecting the increased
accuracy of the detailed geoid over the global satellite
geoid. The ellipsoid implied by this more accurate comparison
would have a semi-major axis of 6378142+2m. It is also im-
portant to note that no significant scale differences are
indicated for these areas. This indicates that a
small value as an upper bound exists in the systematic
error in MSL definition for these three continents.
Both noise and systematic errors in the Z coordinates
are assessed to be less than 4m RMS for the GSFC '73 solu-
tion.
36

FIGURE 2. GEOID HEIGHT COMPARISON BETWEEN GSFC'73 AND THE GEM4 SATELLITE GEOID
0 I0
0 50 40 30 20 10 -10
LATITUDE OF STATION (DEGREES)
N = Geoid height -GEM-4 Global Geoid.
60 50 40 30 20 10 0 -10 -20 -30 40
N = Geoid height - GEM4 Global Geoid.

FIGURE 3. GEOID HEIGHT COMPARISON FOR GSFC '73 AND THE GRAVIMETRIC GEOID
NORTH AMERICAN DATUM-1927 EUROPEAN DATUM-1950 AUSTRALIANNATIONALDATUM
I I
o I-a III-
-10 • I I *
w - - - - -- --- -- 0--------- 1-------------- I-- - --- ------ -
r - C0C4 .. =U -e a I
-20 * II •I
I II I
STATION NUMBER
hel = Dynamically determined height of station above ellipsoid (ae = 6378155m, 1/f = 298.255)
hms1 = Survey height of station above mean sea level.
N = Detailed gravimetric geoid height (Vincent and Marsh, 1973)

3.4 INTERCOMPARISON OF CHORD DISTANCES ON THE NORTHAMERICAN AND EUROPEAN DATUMS
This section presents a chord distance comparison of
the GSFC '73 solution with; the geometric satellite solutions
of Reece et al, 1973 for North America, Cazenave et al, 1972,
for Europe and the VLBI solution of Ramasastry et al, 1973.
Simultaneous observations of the GEOS-1 and II flashing
lamps taken by the NASA MOTS and SPEOPT cameras were used
by Reece et al to recover relative coordinates of thirteen
sites on the North American Datum. Scale for this solution
was provided by processing laser data from Greenbelt and
Wallops Island simultaneously with the optical data. The
GSFC '73 solution also provided coordinates for these stations.
Figure 4 presents a histogram of the chord distance agreement
between the geometric and dynamic solutions. Of the 77 common
chords, 63 agree to 5 meters or better.
A seven parameter transformation (3-translation,
3-orientation, 1-scale) was performed to relate the respec-
tive GSFC '73 and Reece station sets to a common coordinate
system. The overall scale difference recovered was -0.17
ppm. This agreement is very good considering the different
techniques employed. Table 13 presents the residuals in X,Y,Z
by station between the geometric and dynamic solutions from
this orientation solution.
39

FIGURE 4.HISTOGRAM OF NORTH AMERICAN CHORD AGREEMENT BETWEEN
THE REECE GEOMETRIC AND GSFC'73 DYNAMIC SOLUTIONS
70 -
60 -
50
, 40 -
U-0S30 -
20 -
10 -
0 5 10 15 20 25 30
METERS OF AGREEMENT
40
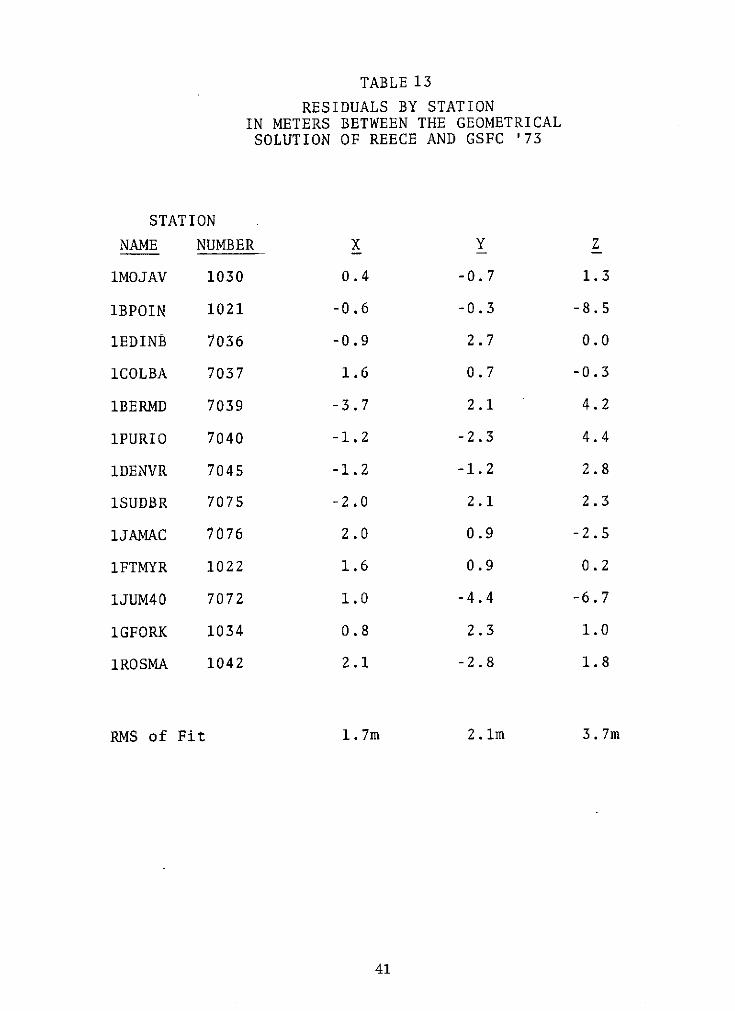
TABLE 13
RESIDUALS BY STATIONIN METERS BETWEEN THE GEOMETRICALSOLUTION OF REECE AND GSFC '73
STATION
NAME NUMBER X Y Z
1MOJAV 1030 0.4 -0.7 1.3
1BPOIN 1021 -0.6 -0.3 -8.5
1EDINB 7036 -0.9 2.7 0.0
1COLBA 7037 1.6 0.7 -0.3
1BERMD 7039 -3.7 2.1 4.2
1PURIO 7040 -1.2 -2.3 4.4
1DENVR 7045 -1.2 -1.2 2.8
1SUDBR 7075 -2.0 2.1 2.3
1JAMAC 7076 2.0 0.9 -2.5
1FTMYR 1022 1.6 0.9 0.2
1JUM40 7072 1.0 -4.4 -6.7
1GFORK 1034 0.8 2.3 1.0
1ROSMA 1042 2.1 -2.8 1.8
RMS of Fit 1.7m 2.1m 3.7m
41

Wideband noise signals from quasars have been analyzed
by Ramasastry et. al. (1973) using Very Long Baseline Inter-
ferometric (VLBI) techniques to provide a baseline from the
Rosman, North Carolina 85 foot antenna to the Goldstone,
California 40 foot antenna with a standard deviation of
14 cm. Local survey ties between the cameras and radar
antennas at the respective stations have been used to infer
a baseline from the GSFC '73 dynamical solution. The
difference between the VLBI and dynamically derived baseline
as shown in Table 14 is 70cm.
At Centre National d'Etudes Spatiales (CNES) in France
Cazenave and her associates (1971) used purely geometric
techniques with optical and laser data to recover the chord
distances between San Fernando, Spain and eight other sites
in Europe.
Table 15 compares the chord lengths obtained from
GSFC '73 with the geometric solution of CNES. The agreement
between GSFC and CNES is good, 6 of the 8 chords agreeing to
4.5 meters. The disagreement of the chord to Greece may be due
to the fact that this station is on the periphery of the geo-
metric net and therefore is constrained in only limited direc-
tions in the CNES solution. However, the mean difference
between the CNES and GSFC '73 results, including Greece, is
still only a few meters. When Greece is eliminated the mean
scale difference between GSFC '73 and CNES is 0.3 ppm.
The GSFC '73 dynamical solution when compared with
these independent geometrical solutions of Reece and
Cazenave and the VLBI solution of Ramasastry indicates
agreement to better than 5 meters in almost all cases.
This is consistent with our error analysis which indicated
that the recovered coordinates for GSFC '73 on North America
and Europe are accurate to 3m (la) in each coordinate.
42

TABLE 14
Agreement With Survey for the Chotd fromRosman, N.C. and Goldstone, California
Satellite-Survey
VLBI (Ramasastry) = 7.4m
GSFC 1973 = 8.1m
GSFC 1973 - VLBI = 0.7m

TABLE 15
COMPARISON OF CHORD DISTANCES FROMSTATION 9004 (SAN FERNANDO, SPAIN)AND THE EUROPEAN DATUM OF 1950*
STATION NUMBER SURVEY- SURVEY GSFC - CNESSAT (m) SAT (ppm) (m) (ppm)
CNES GSFC '73 CNES GSFC '73
UZHGOR 9432 -20.5 -22.5 -7.7 -8.5 -2.0 -0.8
RIGALA 9431 -21.5 -14.9 -6.8 -4.7 6.6 2.1
GREECE 9091 -26.1 -12.6 -9.8 -4.7 13.3 5.1
NICEFR 8019 -14.7 -12.7 -10.5 -9.1 2.0 1.4
HAUTEP 8015 -16.8 -17.9 -12.9 -13.7 -1.'1 -0.8
MALVRN 8011 -12.2 - 8.3 -6.9 - 4.7 3.9 2.2
ZIMWLD 8010 -17.6 -19.8 -10.8 -12.2 -2.3 -1.4
1DELFT 8009 -6.5 -10.8 -3.3 - 5.6 -4.3 -2.3
*The local survey values are based upon the 1971 Bomford geoid.

3.5 COMPARISONS WITH THE GLOBAL STATION SOLUTIONS OF SAO
1973 AND GEM 4
In the last year, two major solutions for global laser
and camera coordinates have been published. Lerch et al (1972)
at GSFC published a set of station coordinates simultaneously
recovered with the GEM 4 gravity model. Gaposchkin at SAO
(Gaposchki4 1973) solved for a global set of station coordinates
in an iterative process along with the recent SAO Standard
Earth III gravity model. This section will assess the level
of agreement between our GSFC '73 determination and these
values.
The accuracy of global station coordinate values de-
rived using dynamical techniques varies.In a least squares deter-
mination of orbital position larger errors normally occur
over areas with limited or no tracking for near earth satel-
lites. Therefore, the isolated stations with limited data sets
result in the poorest determinations. In order to more realistical-
ly assess the difference between the GSFC '73 solution and the
GEM 4 and SAO '73 values, seven stations with known larger
position uncertainties were omitted from the analysis.
The GEM-4 solution used the value of GM = 3.986013 X
105 km3/sec2 . In order to compare these values with our own,
an orientation solution of seven parameters was computed for
34 independent common stations. Table 16 presents the results
from this solution. The scale difference of .46 ppm is very
close to the expected value since the GSFC '73 solution used
a value of GM = 3.986008 X 10⁵ km3/sec 2 . The translation para-
meters, AX, AY, and AZ, are 50 cm of less in each case. A
rotation of about 0.3 arc seconds in longitude is noted. The
RMS of fit for the 34 stations as shown in Table 16 indicates
agreement to better than 5 meters between GSFC '73 and GEM 4.
This agreement is especially significant in that GEM 4 used
a different technique than GSFC '73 by solving for a gravity
45

TABLE 16
ORIENTATION SOLUTIONBETWEEN THE GLOBAL GEOCENTRICSOLUTIONS OF GEM4 AND GSFC'73
FOR 34 COMMON STATIONS
AX AY AZ Ak omega psi epsilonmeters meters meters ppm arc sec arc sec arc sec
-0.5+0.2 -0.1+0.2 0.5+0.2 0.45 0.26 0'11 0101+.03 +.01 +.01 +.01
CORRELATION COEFFICIENTS
AXAY .12 AYAZ -.019 ,757 AZAP -.140 .415 -T742 AYomega .426 .194 .073 .467210-1 6 omegapsi .236 -.079 -.259 -.186X10 -1 8 -. 21 siepsilon .015 -.303 -.495 -.124X10 -1 5 -.067 i
RMS of Fit X Y Z3.8 meters 4.3 meters 3.6 mjters
46

model complete with zonals simultaneously with the station
coordinates and a different gravity model was employed (GEM 1
vs. GEM 4).
A similiar analysis was performed using 24 common
stations of GSFC '73 and SAO '73. Here the differences were
larger. The RMS of fit for the 24 stations was 8.9, 10.5,
and 13.4 meters in X, Y, and Z respectively. A comparison
of the SAO '73 solution with respect to geoid height, indicated
a 25 meter discrepancy between the recovered heights in Europe
and those of North America and Australia. This discrepancy
largely accounts for the larger differences between GSFC '73
and SAO '73.
A comparison using this method was also performed to
assess the effect of gravity model error on our solution. A
seven parameter orientation solution was performed for 50 in-
dependent stations determined using the GEM 1 and Standard
Earth 1969 Gravity Model. Table 17 presents the parameter
values derived for this orientation solution. This comparison
indicates a longitude rotation of 0.35 arc seconds as was
discussed in Section 3.1. This method also would reveal other
systematic discrepancies between the different gravity model
solutions. The scale recovered in this transformation solution
was a very small -.06 ppm. Except for the rotation in longi-
tude (omega), systematic difference between the solutions were
less than 3 meters. The RMS of fit between these two sets of
50 stations was 3.8, 2.8, and 3.4 meters in X, Y, and Z re-
spectively.
Table 18 presents final uncertainty estimates for our
GSFC '73 recovered stations based upon error analyses and
comparisons performed in this section. For most sites, an
accuracy of 5m (la) in each coordinate is quoted.
47

TABLE 17
AN ORIENTATIONSOLUTION BETWEENGSFC'73 SOLUTIONS
USING DIFFERENT GRAVITYMODELS*
AX AY AZ Ak omega psi epsilonPpm
3.0+..2 -1.8+.2 1.36+.2 -.06+ -0'.'35+ 0'.'07+ 0'.'09+.02 .01 .01 .07
*the gravity models used were the S.E 1969 and GEM1 models.
48

TABLE 18
ESTIMATED UNCERTAINTYIN THE GSFC '73 STATION
SOLUTION
STATIONS NUMBER UNCERTAINTY IN METERSIN EACH COORDINATE
1021 1BPOIN 51022 1FTMYR 31028 1SATAG 51030 1MOJAV 31031 1JOBUR 31032 1NEWFL 71033 1COLEG 101034 1GFORK 31035 1WNKFL 31036 1ULASK 51038 1ORROL 51042 1ROSMA 31043 1TANAN 57036 1EDINB 37037 1COLBA 37039 1BERMD 37040 1PURIO 37045 1DENVR 37050 GODLAS 37052 WALLAS 77054 CRMLAS 57060 GMILAS 77072 1JUM40 37075 1SUDBR 37076 1JAMAC 37820 DAKLAS 108009 DELFTH 38010 ZIMWLD 38011 MALVRN 58015 HAUTEP 38019 NICEFR 38030 MUDONI 59001 1ORGAN 39002 1OLFAN 39004 1SPAIN 39005 1TOKYO 79006 1NATOL 79007 1QUIPA 39008 1SHRAZ 109009 ICURAC 79011 1VILDO 39012 1MAUIO 3
49

TABLE 18 (CONT.)
STATIONS NUMBER UNCERTAINTY IN METERSIN EACH COORDINATE
9021 HOPKIN 39023 AUSBAK 39028 DEZEIT 59029 NATALB 59031 COMRIV 59050 AGASSI 79091 GREECE 39424 COLDLK 109425 EDWAFB 39426 OSLONR 109427 JOHNST 109431 RIGALA 39432 UZHGOR 39435 HELSIK 5
50

4.0 THE RELATION OF MAJOR GEODETIC DATUMS TO A GEOCENTRICREFERENCE SYSTEM
The relation of the North American Datum 1927, the
European Datum-1950, the Provisional South American Datum-
1969, and the Australian Geodetic Datum to the geocentric
reference system of the GSFC '73 solution has been estab-
lished through the derivation of values for seven trans-
formation parameters (three translation, three rotation
and scale) for each datum. For the Arc Datum, the two
available stations have been used to derive the translation
of the datum.
Survey coordinates were obtained primarily from
the "NASA Directory of Observation Station Locations" (1971).
The survey coordinates for the optical and laser stations
located at Haute Provence, France, were obtained in a
private communication with Brachet, 1973, of CNES.
4.1 THE NORTH AMERICAN DATUM-1927
A total of 14 stations, 12 continental and the island
stations of Jamacia and Puerto Rico have been used to es-
tablish the orientation of the North American Datum 1927
(NAD) to a geocentric reference system established by our
GSFC '73 dynamical solution. Table 19 presents values
for the seven orientation parameters, their correlation
coefficients, associative residuals in X,Y and Z, and
chord length differences. The scale difference indicates
that the North American Datum is smaller than the geocen-
tric solution by 0.9 + 0.2 ppm. This value is in good
agreement with the 0.8 ppm derived from the GSFC '73 JPL
spin axis distance comparison. The residuals in X,Y, and
Z have RMS values of 3.4, 2.6 and 3.8 meters respectively.
51

TABLE 19
THE ORIENTATION AND CHORD LENGTH AGREEMENT FOR THENORTH AMERICAN 1927 DATUM WITH GSFC '73
TRANSFORMATION PARAMETERS FOR THE NORTH AMERICAN1927 DATUM AND THE GEOCENTRIC REFERENCE SYSTEM
9021 7.4 8 CHORD LENGTH AGREEMENT BETWEEN THE NORTHX AY Z t OMEGA PSI EPSILON 9001 27 4.3 AMERICAN 1927 DATUM AND GSFC'73 (SATELLITE-
ZOM PSi7 EPSILO.5 1.8 SURVEY) IN METERS-42.7 + 1 161.6 + 1 179.0 + 2 .9 ppm - -'2 -'05 7076 0.5 1.8 -2.7
+.2 + .04 + .04 + .07 7075 7.4 8.9 8.9 10.8
7072 -3.6 9.1 4.9 -5.6 16.1
7050 5.6 0.8 0.7 5.3 -2.4 15.2 -
7045 4.3 8.2 10.0 2.3 0.9 8.6 -5.0 '
7040 -7.5 -1.6 -5.4 -2.6 5.2 -10.1 7.6 -2.6
7037 -0.9 4.7 2.6 -1.1 7.5 5.7 -3.8 0.7 -5.3
7036 6.8 1.3 -5.0 1.7 9.1 6.1 4.5 3.6 -2.1 -0.5
7034 0.9 7.0 8.0 1.5 -3.1 8.0 -9.3 -1.1 -3.3 2.9 2.6
1042 -4.0 6.6 3.5 -1.5 11.2 4.5 3.6 3.3 -6.9 1.8 2.8 3.1 -
CORRELATION COEFFICIENTS 1030 8.7 2.0 7.7 4.0 7.9 11.3 2.0 7.4 0.6 6.2 3.3 7.7 8.1 2AX 1021 -7.8 -1.2 -3.6 -1.2 9.2 1.8 13.0 -5.2 -3.5 -5.2 -4.1 -3.2 -6.2 0.4
A Y .209 AYAZ .248 .453 A Z
60 -BA .007 .579 -. 337 At RESIDUALS BY STATION FOR NORTH AMERICAN
1927 DATUM ORIENTATION SOLUTION 55 -OMEGA .849 .184 .224 -. 37x10 - 15 OMEGA STATION RESIDUALS IN METERS
PSI .624 .131 .160 -.24x10- 15 .170 PSI NAME NUMBER X Y Z 50 -
14 HOPKIN 9021 1.4 -2.2 3.0 45EPSILON -. 266 -. 795 -. 929 .17x10
- 4 -. 241 -. 166 H1PKIN 9021 1.4 -2.2 3.01ORGAN 9001 -1.3 4.2 3.7 401SUBBR 7075 -0.6 -4.2 -6.11JUM40 7072 -3.6 3.9 5.1 35-
GODLAS 7050 4.2 -4.7 -7.1 301DENVR 7045 -3.0 -1.6 -3.6IPURIO 7040 6.8 0.5 -0.6 25 -
1COLBA 7037 -1.6 1.9 2.0 O1EDINB 7036 1.1 1.2 -1.5 201UNDAK/1GFORK 7034 -3.9 1.7 -1.6 15IROSMA 1042 -2.6 1.0 2.71MOJAV 1030 2.2 -1.6 0.7 1018POIN 1021 5.0 1.0 5.31FTMYR 1022 -4.2 -1.0 -2.1 5
RMS OF FIT 3.4m 2.6 m 3.8m 00 5 10 15 20 25 30
METERS OFAGREEMENTHISTOGRAM OF CHORD AGREEMENTBETWEEN NORTH AMERICAN 1927 DATUMAND GSFC 73

4.2 THE EUROPEAN DATUM-1950
Nine stations have been used in relating the European
Datum to this global reference system. Table 20 presents
information similar to that presented in Table 19 for the
North American Datum. The comparison of our solution with
that of CNES indicated a mean scale difference of 0.3 ppm
for chords to San Fernando, Spain. The overall scale dif-
ference derived in the seven parameter solution was 5.0 +
0.4 ppm. This large scale difference is primarily attributed
to the fact that the European Datum contains a systematic
scale error due to the unavailability of the geoid heights
throughout this system at the time of its reduction in
1950 (Bomford, 1971). The values used for the surveyed
chords in the chord length comparison and histogram in
Table 20 have been modified to account for this error.
After correction, 23 out of a total of 36 chords show
differences of 5 meters or less.
The residuals in X,Y,Z have RMS values of 3.0, 3.6
and 4.3 meters, respectively.
4.3 THE PROVISIONAL SOUTH AMERICAN DATUM-1969
Five stations tied to the Provisional South American
Datum were used in the study of this datum. A scale dif-
ference of -1.8 + 0.2 ppm was derived for this datum.
Curacao was omitted from the analysis since chords from
this station to Natal, Brazil and Arequipa, Peru were
different from survey values by -16.1 meters and 21.7
meters, respectively. However, the differences between
our values and those of GEM-4 and SAO '69 were on the order
of a few meters. The residuals in X,Y,Z for this datum
53

TABLE 20
THE ORIENTATION AND CHORD LENGTH AGREEMENT FOR THE EUROPEAN 1950DATUM WITH GSFC '73
TRANSFORMATION PARAMETERS FOR THE EUROPEAN1950 DATUM AND THE GEOCENTRIC REFERENCE SYSTEM
AX AY Z OMEGA PS EPSILON CHORD LENGTH AGREEMENT BETWEEN THEX Y Z MEGA PSI EPSILON CORRECTED EUROPEAN 1950 DATUM AND
n GSFC '73 (SATELLITE-SURVEY) IN METERS
-149.0 + 3 -103.0 + 3 -92.5 + 3 5.0 ppm 0:' 60- -1:'9 0:' 65 9432 13.3 m+.4 +.08 + .12 + .08
9091 1.7 1.1 "
9004 2.6 17.2 3.9 =
CORRELATION COEFFICIENTS 8030 -1.8 12.2 3.1 8.9AX 8019 -1.5 10.9 2.4 7.9 0.7 E
8015 -4.2 4.8 -2.1 13.5 -1.5 -3.7 a;AY .023 AYAy .023 AY 8010 -0.1 5.8 0.8 15.5 2.1 5.5 1.0AZ -.481 -0.60 AZ
8009 -0.8 15.2 6.7 5.6 -1.1 2.8 -2.5 0.1A2. --.488 -. 073 -. 512 A,
OMEGA -. 111 .758 .024 -. 60x10 - 16 OMEGA
PSI .863 .049 -. 849 -. 13x10 - 14 -. 045 PSI
EPSILON -. 089 -. 769 .173 .60x10 - 1 5 -. 190 -. 120
25 -RESIDUALS BY STATION FOR EUROPEAN 1950DATUM ORIENTATION SOLUTION 20 -
STATION RESIDUALS IN METERSNAME NUMBER X Y Z 15 -
UZHGOR 9432 0.8 -5.1 1.3 O 10 -
GREECE 9091 1.2 5.5 0.3 5 -
1SPAIN 9004 -0.0 4.2 4.3
MUDONI 8030 -5.5 -1.6 -5.5 0 10 15 20 25 30
NICEFR 8019 -3.3 0.5 -4.3 METERS OF AGREEMENT
ZIMWLD 8010 1.8 -4.0 -5.1HISTOGRAM OF CHORD LENGTH AGREEMENT
DELFTH 8009 0.8 3.6 3.8 BETWEEN THE CORRECTED EUROPEAN 1950DATUM AND GSFC'73
1WNKFL 1035 -1.2 10.4 7.4
HAUTEP 8015 5.5 -3.5 -2.1
RMS OF FIT 3.0 m 3.6 m 4.3 m

TABLE 21
THE ORIENTATION AND CHORD LENGTH AGREEMENT FOR THEPROVISIONAL SOUTH AMERICAN 1969 DATUMWITH GSFC 73
RESIDUALS BY STATION FOR PROVISIONALTRANSFORMATION PARAMETERS FOR THE PROVISIONAL SOUTH AMERICAN DATUM ORIENTATION SOLUTIONSOUTH AMERICAN DATUM AND THE GSFC '73 GEOCENTRICREFERENCE SYSTEM STATION RESIDUALS IN METERS CHORD LENGTH AGREEMENT BETWEEN THE
NAME NUMBER X Y Z PROVISIONAL SOUTH AMERICAN DATUM ANDAX AY AZ Ak OMEGA PSI EPSILON COMRIV 9031 -4.4 1.3 3.0 GSFC 73 (SATELLITE-SURVEY) IN METERS
-44.1 + 2 8.0 + 2 -46.4 + 2 -1.8 ppm 0:' 74 -0:'25 0:28NATALB 9029 -1.8 -2.7 -1.5
+ .2 + .08 + .05 + .08 o
1VILDO 9011 -1.6 5.9 3.2 29031 5.5 '
1QUIPA 9007 -0.8 1.3 9.9 9029 -9.7 -7.6 -
1SATAG 1028 8.6 -5.7 -14.7 9011 2.1 -1.7 -1.8
CORRELATION COEFFICIENTS RMS OF FIT 4.6 m 4.0 m 8.2 m 9009 -2.9 9.8 -16.1 9.0 59007 -21.8 -12.1 -1.2 -11.2 21.7
c AX
AY .484 A Y
A Z -. 424 -. 564 AZ
6A -. 295 .481 .276 6 30 -
OMEGA .858 .762 -. 571 .97x10- 15 OMEGA 25 -
PSI -. 150 .241 -. 532 .24x10- 15 .211 PSI 20 -
EPSILON .481 .774 -. 897 .93x10 - 1 5 .629 .298 15
u. 10 -
u 5 -
00 5 10 15 20 25 30
METERS OF AGREEMENT
HISTOGRAM OF CHORD LENGTH AGREEMENTBETWEEN PROVISIONAL SOUTH AMERICANDATUM AND GSFC'73

are somewhat larger than those for the two previously con-
sidered datums with RMS values of 4.6, 4.0 and 8.2 meters,
respectively. Table 21 presents these results.
4.4 AUSTRALIAN GEODETIC DATUM AND THE ARC DATUM
Only three separate locations were available for
comparison in Australia. Table 22 presents the results
for the AGD. The translation and orientation parameter
values showed high correlations as might be expected due
to the small number of stations. The correlation co-
efficients for scale were in general less than 0.3,
therefore it is concluded that the scale difference of
1.9 + 0.4 ppm is a well determined value.
Translation parameters are presented below for the
two stations on the Arc Datum which were independently
adjusted in our solution.
AX AY AZ
Johannesburg, Rep. of S.Africa -124.2 m. -108.8 -296.2
Olifantsfontein, Rep.of S.Africa -125.2 -107.8 -300.8
Comparison of the satellite derived chord connecting
these two stations with the surveyed value indicated a dif-ference of 1.9 meters.
56

TABLE 22
THE ORIENTATION AND CHORD LENGTH AGREEMENT FORTHE AUSTRALIAN GEODETIC DATUM WITH GSFC '73
CHORD LENGTH AGREEMENT BETWEEN THEAUSTRALIAN GEODETIC DATUM AND GSFC'73
TRANSFORMATION PARAMETERS FOR THE (SATELLITE-SURVEY) IN METERSAUSTRALIAN GEODETIC DATUM AND THEGSFC'73 GEOCENTRIC REFERENCE SYSTEM
Ax AY AZ At OMEGA PSI EPSILON 7054 5.2 1
-137.2 + 15 -49.5 + 5 155.0 + 21 1.9 ppm 0:'34 0:'18 0:'38 9023 -3.5 .7+.4 + .26 + .64 +.54
CORRELATION COEFFICIENTS
AX
AY -. 833 AY RESIDUALS BY STATION FOR AUSTRALIANGEODETIC DATUM ORIENTATION SOLUTION
AZ -. 979 .840 AZ
At. .095 -. 326 .060 At.STATION RESIDUALS IN METERS
OMEGA -. 969 .711 .944 .117x10 - 13 OMEGA NAME NUMBER X Y Z
PSI -. 988 .839 .993 .118x10 - 13 .943 PSI CRMLAS 7054 -1.3 -0.4 -0.2
EPSILON -. 974 .877 .992 .120x10- 13 .939 .980 O1RROL 1038 -2.0 -1.7 -0.7
AUSBAK 9023 3.3 2.1 0.9
RMS OF FIT 2.4 m 1.6 m 0.7 m

4.5 DATUM TRANSLATION VALUES FOR OTHER AREAS OF THE WORLD
Figures 5, 6, and 7 present rectangular co-
ordinate differences (satellite-survey) for the stations
considered in the GSFC '73 solution. These tables provide
the capability for other investigators to quickly place
instrument locations for which local surveys are available
into our geocentric reference system for 10 independent
geodetic datums. In this way, geocentric positions of
better than 10m accuracy can be readily obtained for over
200 additional tracking stations throughout the world.
58

FIGURE 5. THE TRANSLATION PARAMETERS FOR THE X COORDINATES
BETWEEN GSFC73 AND THE LOCAL SURVEYS
________________ ______ iATFI I ITF-911IRVFVI IN MPTFR9
9 2 00 20 :0 300 3yCO a30, C0 20o a
IV EUROPEAN
IA1950 DATUM
k~ 1 t13 o av
,/ ARC~CA
DATUM AM__D DTM12
I IATUM
KY~' KK,HAWAIIA)
DATUM
DDATUM
CAR
SOUTH AMERICAN0 DAT0M
I00 DATUM0
re30 9 93 500B90 * ! 50*

FIGURE 6. THE TRANSLATION PARAMETERS FOR THE Y COORDINATES
BETWEEN GSFC 73 AND THE LOCAL SURVEYS
(SATELLITE--SURVEY) IN METERS
240'0 3207 3000 0 9,,
I rB~m -7
134
m :)A 1 0XVEI:01 W
-~167 ATUF-
F- _ _ -112/ CSU I
7 IS LAND
-295 9 -P,_ T U M
iSLAt'VD I I ln44
jo77
8-~I /i (1 OACUR
Iu~i ----. _.
Boo ,00 Go io0
;

FIGURE 7. THE TRANSLATION PARAMETERS FOR THE Z COORDINATES
BETWEEN GSFC 73 AND THE LOCAL SURVEYS
(SATELLITE-SURVEY) IN METERS
S202n 3C' 330' - 1C' C' CC' _______
S182 ffI
-, C .I,.I
"c-l 3 EUROPEAN H1,31290 AU
J T 403 - l2ioso TON rU" i1 184I 2 1-107 I1
186 A i88 l)-
' ' °8 °.- ' ,' t'':': : ' :: - V" " <" ,
'7 118 183 8 NORTH IU i 13ERICAN179 TOKYO 'i~n-t-
18f19Is~ i , DATUM" 1927 i~7 ~ov\i i 1; 1 D M 1 1 DATUM
I i/ ac
1 7 -- 7--13~ 7 18133 '7~~TW.1 j'
.18 S L ADOLD D-, <ATUM
JOHNSTON IISLAND DATUM I- I
DAATU ...TUM
v 7. -___1 _ 21 v~ 137
RA40 IPROVISIONAL A. U SU~ GOTAI A11-
SOUTH AMERICA-0 , DATUMDATUM
__ _ _ 24 _ _ __ .00 _00 jiC i 240' 270' 3C0 :330 3'O 60" SC 30Zr"o

REFERENCES
Anderle, R.G., "Geodetic Positions Based Upon Doppler Satellite
Observations," Paper Presented at the 54th Annual Meeting of
the American Geophysical Union, Washington, D.C., April 1973.
Bomford, Brigadier G., Private Communication, 1971.
Brachet, G., Private Communication, 1973.
Cazenave, A., D'Argnies, O., Balmino, G., Lefebvre, M., "Geomet-
rical Adjustment with Simultaneous Laser and Photographic
Observations on the European Datum," American Geophysical
Union Monograph 15, 1972.
Esposito, P.B., Wong, S.K., "Geocentric Gravitational Constant
Determined from Mariner 9 Radio Tracking Data," Presented at
International Symposium on Earth Gravity Models and Related
Problems, St. Louis, Mo., August, 1972.
Gaposchkin, E.M., Lambeck, K., "1969 Smithsonian Standard Earth II,"
SAO Special Report No. 315, Smithsonian Astrophysical Observatory,Cambridge, Mass., May, 1970.
Gaposchkin, E.M., "Smithsonian Institution Standard Earth III,"
Presented at the American Geophysical Union Meeting, April, 1973.
Lerch, F.J., Wagner, C.A., Putney, B.H., Sandson, M.L., Brown, J.E.,Richardson, J.A., Taylor, W.A., "Gravitational Field Models GEM 3
and 4," GSFC Document X-592-72-476, November, 1972.
Marsh, J.G., Douglas, B.C., Klosko, S.M., "A Unified Set of Track-
ing Station Coordinates Derived from Geodetic Satellite Track-
ing Data", GSFC Document X-553-71-370, July, 1971.
Marsh, J.G., Douglas, B.C., Klosko, S.M., "The Relation of theEuropean Datum to a Geocentric Reference System," Bulletin
Geodesique 106, December, 1972.
62

Marsh, J.G., Lerch, F.J., Vincent, S.F., "The Geoid and Free Air
Gravity Anomalies Corresponding to the GEM-4 Earth Gravitational
Model," GSFC Document X-592-73-58, February 1973.
Martin, C.F., O'Neill, B., "The Geostar Plan for Geodetic Para-
meter Estimation," Report on Contract NAS-5-9756-132, NASA,
Washington, D.C., November 1968.
Martin, C.F., Walls, D.M., "USB Geodetic Station Locations
Determined from LM Lunar Surface Data" Paper Presented at the
First International Symposium on The Use of Artifical Satellites
for Geodesy and Geodynamics, Athens, Greece, May 1973.
Martin, T.V., "GEODYN Systems Operation Description," Wolf Research
and Development Corporation Final Report on Contract NAS-5-
11736-129, February 1972.
Mottinger, N.A., "Status of DSS Location Solutions for Deep Space
Probe Missions: Third Generation Orbit Determination Program
Solutions for Mariner Mars 1969 Mission," JPL Space Program.
Mueller, I.I., "Present Status of Global Geometric Satellite
Triangulation and Trilateration," Paper Presented at the 54th
Annual AGU Meeting, Washington, D.C., April 1973.
"NASA Directory of Observation Station Locations," Prepared by
Computer Sciences Corporation for the Data Evaluation Branch,
Manned Flight Planning and Analysis Division, Goddard Space
Flight Center, 2nd Edition, November 1971.
63

Ramasastry, J., Rosenbaum, B., Michelini, R.D., Frost, D.,
Criswell, S., Ross, S., Boornazian, A., Shaw, J., Richard, J.P.,
Ma, C., Davis, P.C., "GSFC/SAO VLBI Experiments for Geo-
dynamic Applications," GSFC Document X-592-73-104, April 1973.
Reece, J.S., Marsh, J.G., "Simultaneous Observation Solutions for
NASA-MOTS and SPEOPTS Station Positions on the'North American
Datum," Paper Presented at the 54th Annual American Geophysical
Union Meeting, Washington, D.C., April 1973, also GSFC Document
X-592-73-170, June 1973.
Ryan, J., "Mariner-Mars-1971 Tracking and Calibration Experiment
Interim Report," GSFC Document X-832-72-182, September, 1972.
Vincent, S.F., Marsh, J.G., "A Global Detailed Gravimetric Geoid,"
Contribution to the National Geodetic Satellite Program Final
Report, April 1973.
Williams, J.G., Mulholland, J.D., Bender, P.L., "Spin Axis Distance
of the McDonald Observatory," Paper Presented at the December
1972 Meeting of the American Geophysical Union.
US. GOVERNMENT PRINTING OFFICE: 1973-734-722139
64