a global demand analysis of vegetable oils for food and ... for industrial use, the focus of this...
TRANSCRIPT

0
A Global Demand Analysis of Vegetable Oils for Food and Industrial Use:
A Cross-Country Panel Data Analysis with Spatial Econometrics
Yasutomo Kojima
Charles H. Dyson School of Applied Economics and Management
Cornell University
Ithaca, NY 14853-7801
[Corresponding Author]
Joe Parcell
Department of Agricultural and Applied Economics
143A Mumford Hall
University of Missouri-Columbia
Columbia, MO 65211
Jewelwayne Cain
Department of Economics
The University of Tampa
Tampa, FL 33606
Conference paper
Selected Paper prepared for presentation at the 2016
Agricultural & Applied Economics Association
Annual Meeting, Boston, Massachusetts, July 31-August 2
Copyright 2016 by Yasutomo Kojima, Joe Parcell and Jewelwayne Cain. All rights reserved. Readers may make verbatim copies of this document for non-commercial purposes by any means, provided that this copyright notice appears on all such copies.
1
A Global Demand Analysis of Vegetable Oils for Food and Industrial Use:
A Cross-Country Panel Data Analysis with Spatial Econometrics
This article analyzes global demand for major edible and non-edible vegetable oils using cross-
country panel data from 1991 to 2011. A fixed effects model, accounting for spatial dependence
of the residuals, is specified. Compared to food use, income elasticities are significantly higher for
industrial use, suggesting that demand for non-edible vegetable oils is expected to increase with
the rise of global wealth in the future. Income elasticities will be useful for simulation research of
estimating how much agricultural land needs to be developed in the future in order to meet an
expected increase in demand for biofuel feedstocks.
Key words: vegetable oil, demand analysis, cross-country panel data, fixed effects model, spatial
dependence, soybean oil, rapeseed oil, palm oil, sunflower oil
JEL codes: Q11, Q41, C21, C23

1
A Global Demand Analysis of Vegetable Oils for Food and Industrial Use:
A Cross-Country Panel Data Analysis with Spatial Econometrics
Vegetable oils have become one of the global topics of interest due to several factors: (i) rising
global demand for vegetable oils due to increased global wealth; (ii) rising awareness of health
problems related to trans fatty acids, or TFA (U.S. FDA 2003, 2013); (iii) increasing use of
vegetable oils for biofuel feedstock supply as a substitute for fossil fuels and (iv) mounting
international concerns over the environmental impacts of deforestation through palm logging and
conversion of rainforest to cropland for soybean production (Morton et al. 2006). Given these
circumstances, analyzing food and industrial demand for vegetable oils from a global perspective
is important to clarify the demand characteristics of vegetable oils.
The objective of the current research is to investigate global demand characteristics of
major vegetable oils for future research and policy analysis by using a cross-country panel data of
165 countries from 1991 to 2011 in estimating demand functions for vegetable oils for food use
and for industrial use. For food use, the focus of this research is on the global markets of four
vegetable oils: soybean oil, rape and mustard oil (including canola oil), palm oil, and sunflower
oil.1 These four vegetable oils dominate more than 70% of global vegetable oils consumption for
food use during the 2000’s (table 1). For each of these vegetable oils, global own-price and cross-
price elasticities as well as income elasticities were estimated using cross-country panel data from
FAOSTAT. Differences in own-price elasticities and income elasticities by GDP category (four
groups ranging from lower-income to higher-income country) are identified and analyzed.
1 Mustard oil is grouped with rapeseed oil in FAOSTAT (Food and Agriculture Organization
Corporate Statistical Database), but world production of mustard seed takes up only about 1% of
world production during the period analyzed in this article. Therefore, rape and mustard oil is
hereafter referred to as rapeseed oil.

2
For industrial use, the focus of this research is on the global markets of three vegetable oils:
soybean oil, rapeseed oil and palm oil. These three vegetable oils dominate more than 70% of
global vegetable oils consumption for industrial use during the 2000’s.
[Insert table 1 here]
There have been growing numbers of papers which conduct theoretical and/or empirical
analysis on markets of food, biofuel and energy policy. The primary aim of this article is to
contribute to those authors conducting policy research by providing global demand elasticity
estimates of several major vegetable oils.
Global Consumption Trends
FAOSTAT has data on each country’ commodity balances in food balance data category. They are
classified into six category elements: feed, seed, waste, processing, food and other uses. For edible
vegetable oils, data on food category was used, while for non-edible oils such as those used for
industrial use, data on the “other uses” category was used. Data on feed/seed/waste/processing was
not used in this analysis. The quantities of food available for human consumption relate to the
quantities of food reaching the consumer. For all of the four major vegetable oils, food use
accounted for about 51% among the above categories, 48 % for other uses and 1% for
feed/seed/waste/processing in 2011. For example, the processing ratio was only 0.3% in 2011. The
data of processing category does not have enough information for many countries between 1991
and 2011. Other uses include quantities put into the manufacture of non-food uses, such as biofuel,
heating oil and oleochemicals. Oleochemical applications are diverse: plastics, metal soaps,
washing and cleaning agents, soaps, cosmetics, alkyd resins, dyestuffs, textile, leather and paper,

3
rubber, lubricants (Appalasami 1990). Other uses may include some used for food manufacturing,
but not captured in the food use category.
Per capita edible oil consumption of the four major vegetable oils has increased from 6.8kg
to 7.8kg between the period 1991-2000 and 2001-2011, increasing in their total share from 72%
to 73% (table 1). The consumption share of soybean oil and palm oil has increased from 30% to
31% and from 14% to 17%, respectively. The consumption shares of rapeseed oil and sunflower
oil have slightly declined. Due to increasing global demand for vegetable oils for industrial use,
consumption per capita of three major vegetable oils (palm oil, soybean oil and rapeseed oil) has
increased from 2.3kg to 5.8kg between the two periods, increasing their total shares from 62% to
74% (table 1).
The consumption ratio of soybean, palm, rapeseed and sunflower oil between food and
other uses was 75:25 in 1995 and by 2010 the ratio was about 50:50. China, Brazil, United States,
India, and Argentina are the top five countries for non-edible soybean oil. China, Germany, France,
United States and Mexico are the top five consumers for non-edible rapeseed oil, while Indonesia,
China, India, Germany, United Kingdom are the top five consumers for non-edible palm oil.2
Demand for edible vegetable oils has increased in the Americas, Asia & Oceania and
Europe regions. Demand for soybean oil has increased mainly in the Americas region, palm oil in
the Asia & Oceania region, and sunflower oil in the Europe region. By GDP category, per capita
consumption for soybean oil has increased in high and middle-high income countries (Group 1:
real GDP per capita of 15,000 or more US$ and Group 2: 4,000-14,999 US$), while per capita
consumption for palm oil increased in low-income countries (Group 4: 0-999 US$). Per capita
2 Russia, China, Turkey, Netherlands, Spain are the top five countries for non-edible sunflower
oil consumption.

4
consumption of rapeseed oil and sunflower oil has decreased in Africa and in Africa and Americas,
respectively. World consumption per capita of rapeseed oil and sunflower oil remained similar
over time.
Demand for major non-edible vegetable oils has increased in all of the regions. Demand
for soybean oil has mainly increased in the Americas and Asia & Oceania regions, while there is
an increase in demand for rapeseed oil in the Europe region and for palm oil in the Africa, Asia &
Oceania and Europe regions. Per capita consumption of non-edible soybean oil has increased in
middle income countries (Group 2 and Group 3: 1,000-3,999 US$), while that of non-edible
rapeseed oil has increased in high income countries (Group 1). Per capita consumption of non-
edible palm oil has increased in both low and high income countries (Group 1 and 4). For the total
of non-edible vegetable oils, the increase in consumption per capita is greater for higher-income
countries than for lower-income countries.
Literature Review
In recent years there have been growing numbers of papers which conduct theoretical and/or
empirical analysis of food, biofuel and energy markets. There are mainly three types of approaches,
(1) theoretical models; (2) cointegration analyses; and, (3) partial and general equilibrium (CGE)
models. Theoretical models study the channels of adjustment among markets of agriculture,
bioenergy and energy (Gardner 2007; de Gorter and Just 2008, 2009). Cointegration analysis
estimates the long-term relationship between the fuel (energy such as crude oil) and agricultural
commodity prices (Yu, Bessler and Fuller 2006; Hameed and Arshad 2008; Peri and Baldi 2010).
CGE model simulates the interdependence among markets of agriculture, bioenergy and energy
(Arnt et al. 2008; Kancs and Wohlgemuth 2008). The drawback of CGE models, on the other hand,

5
is that their results heavily depend on price transmission elasticities which are just arbitrarily
assumed.
Goddard and Glance (1989) analyzed demand relationships among twelve fats and oils in
United States, Canada and Japan using data from 1962 to 1986. Based on a translog indirect utility
function, they estimated the translog demand system and derived uncompensated price elasticities.
For the United States, they obtained uncompensated price elasticities for 10 fats and oils: butter,
lard, edible tallow, coconut oils, corn oil, cottonseed oil, soybean oil, palm oil, palm kernel oil and
peanut oil. They did not include rapeseed and sunflower oils in their model. In recent years,
rapeseed oil and sunflower oil have become one of the major vegetable oils in the global market.
One novelty in this article is that these oils are included in the analysis.
Demand analysis has not been conducted on major vegetable oils for food and industrial
use from a global perspective. Demand elasticity estimates, such as own-price, cross-price and
income elasticity, will be useful for future research and policy analysis related to the area of
agriculture, food and bioenergy. Elasticity estimates are important for use in simulation,
forecasting, and equilibrium displacement studies. For policy analysis in agriculture, food and
bioenergy, major determinants of global demand for each major vegetable oil need to be examined
and demand elasticity estimates need to be identified for food and industrial use, respectively.
Data
Vegetable oils’ consumption and price data for 165 countries from 1991 to 2011 were obtained
from FAOSTAT, while data on real GDP per capita (in 2005 US$) was obtained from USDA ERS
International Macroeconomic Data Set. In order to eliminate data for very small countries as well
as outliers, countries with population of less than 100,000 were removed from the analysis. For

6
food and industrial use, some observations were eliminated as outliers if the real price of vegetable
oil is extremely low or extremely high (e.g., lower than about 0.3 US dollar/kg and higher than
about 10 US dollar/kg). The real prices are roughly 1.0 US dollar/kg on average between 1991 and
2011. The nominal prices were deflated using Consumer Price Index (World Bank, World
Development Indicators, 2005 =100). In addition, when estimating demand function for food and
industrial use, only countries that have more than 10 tons of annual consumption of vegetable oil
are included.
Table 2 shows summary statistics for average annual consumption per capita for the 1991-
2000 and the 2001-2011 periods by food and industrial use based on cross-country panel data used
in the demand analysis of this article. It should be noted that table 2 is different from table 1. Table
2 shows average annual consumption per capita calculated using final panel data used in the
analysis while average annual consumption per capita in table 1 were calculated through averaging
each year’s consumption per capita obtained by dividing an aggregated world consumption by
world population in each year.
[Insert table 2 here]
Table 3 shows summary statistics for real average price (base year = 2005) based on cross-
country panel data with the same conditions as described for table 2. Consumer prices of vegetable
oils were not available for many countries. Therefore, using import price and export price, the
volume weighted average import and export prices of each vegetable oil for each country were
calculated, such as in Schroeder, Barkley, and Schroeder (1995). Trade data (value and quantity
of import and export) of FAOSTAT from 1991 to 2011 was used. This weighted average price
were deflated by the consumer price index (CPI) of each country, downloaded from World
Development Indicators Database of the World Bank (base year = 2005). This weighted average

7
price was used as a proxy for price in each country. For these reasons, it should be noted that table
3 does not necessarily reflect average prices in international major markets of each vegetable oil.
The bottom of table 3 shows the rate of change in real price. The numbers suggest that average
real prices of vegetable oils decreased from the 1991-2000 period to the 2001-2011 period for food
and for industrial use. Real average price of crude oil has, however, increased between these two
periods due to crude oil price surge during the 2000’s.
[Insert table 3 here]
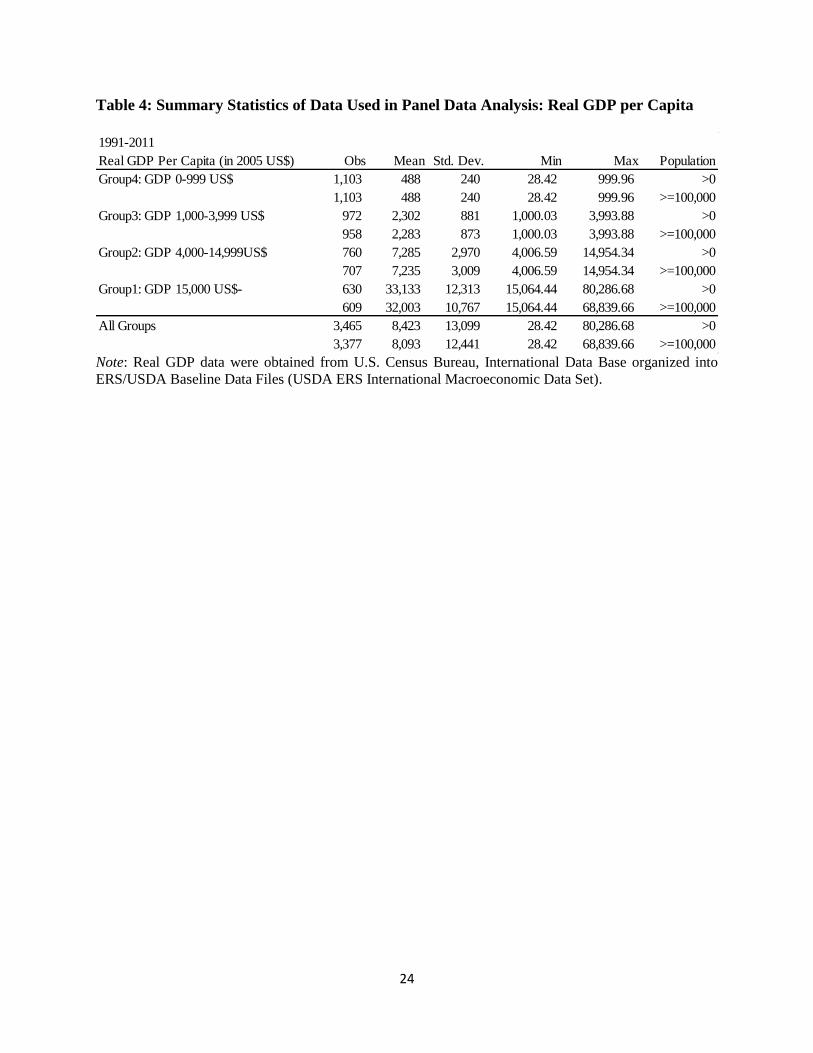
Table 4 shows summary statistics for GDP by four GDP categories over 21 years (Group
4: 0-999 US$, Group 3: 1,000-3,999 US$, Group 2: 4,000-14,999 US$, and Group 1:
>=15,000US$). As a result of data elimination for very small countries3, the cross-country panel
data consists of at most 161 countries over 21 years from 1991 to 2011. Because of missing data
in some years for some countries, panel data in the analysis is unbalanced.
[Insert table 4 here]
Model Specification
Because each country is expected to have unobservable time-invariant preference to a certain type
of vegetable oil to some extent, a fixed-effects model (Wooldridge 2002) is used. These country-
specific preferences to a particular type of edible and non-edible vegetable oil can vary from
country to country due to historical factors such as food culture, eating habits, religious reason in
each country and also due to infrastructural, technological, industrial factors for biodiesel, oil
heating, oleochemical applications. Prevailing transportation means, heating facilities (furnaces,
3 Data on four countries, such as Antigua and Barbuda, Bermuda, Dominica, and Saint Kitts and
Nevis, were dropped from the sample due to small populations of less than 100,000.

8
boilers) in buildings, and oleochemical industry development are different from country to country
as well. Such preferences account for individual heterogeneity, which can be country-specific.
These preferences can potentially change for over a century; over the course of decades, however,
it can be assumed to be time-invariant and forms one of the strong determinants for vegetable oil
demand even during a severe recession. The extent of those preferences can be approximated from
past consumption levels to some extent; however, those preferences cannot be measured in an
exact manner because the consumption levels were affected by other factors, such as own price,
substitutes price, income level and others at the same time. These unobserved factors representing
preferences that affect vegetable oils demand in a certain year will also affect the demand in the
next year. Therefore, the observations for vegetable oil consumption are not independently
distributed across time. While a fixed-effects model does not identify the effects of variables such
as unobserved preferences that are constant over time or across countries, it is well-suited to the
estimation objective of this article in isolating the effect of own price, y, and real income per capita
on demand for vegetable oils from the individual-level effect (unobserved preferences) in each
country.
A fixed effects demand model (equation 1) was estimated for major edible vegetable oil j
(j = 1…4: soybean oil, rapeseed oil, palm oil, and sunflower oil) with consumption per capita, Cji,t
as the dependent variables for country i in year t. A double-log demand model for food use is
specified as follows:
(1) 𝑙𝑛 𝐶𝑗,𝑖𝑡 = 𝑎𝑗 + ∑ 𝛾𝑗𝑘4𝑘=1 𝑙𝑛𝑝𝑘,𝑖𝑡 + 𝛽𝑗𝑙𝑛𝐺𝐷𝑃𝑗,𝑖𝑡 + 𝐹𝐸𝑗,𝑖 + 𝜀𝑗,𝑖𝑡 (j = 1…4)
(i = country, t = time 1991…2011, j = edible vegetable oils 1…4)
where FEj,i captures time-invariant preference to edible vegetable oil j for country i. aj is a constant
term of vegetable oil j’s global demand function. pk,it is the real price of vegetable oil k (k = 1…4)

9
for country i in year t, GDPit is real GDP per capita for country i in year t. For edible oil use, real
prices of four major edible vegetable oils were used. Both price and GDP are deflated by each
years’ CPI in each country as a type of homogeneity restriction. γjk and βj are parameters to be
estimated. γjk is the elasticity of demand (own-price elasticities or cross-price elasticities) with
respect to the kth price (k = 1…4), and βj is the income elasticity of demand.
Three separate fixed effects demand models were estimated representing the three major
non-edible vegetable oil j (j = 1…3: soybean oil, rapeseed oil and palm oil and). For industrial oil
use, real prices of three major non-edible oils were used and real crude oil price was included to
account for the substitution effect between vegetable oils and crude oil. The average price of crude
oil (World Bank Commodity Price Data: Brent, Dubai and WTI) was computed and the price series
were deflated by each year’s CPI for each country. The deflated crude oil price in the previous
marketing year (during October-September) was used as an explanatory variable for a dependent
variable in the present year in order to analyze demand response to change in crude oil price in the
past, as follows:
(2) 𝑙𝑛 𝐶𝑗,𝑖𝑡 = 𝑎𝑗 + ∑ 𝛾𝑗𝑘4𝑘=1 𝑙𝑛𝑝𝑘,𝑖𝑡 + 𝛽𝑗𝑙𝑛𝑥𝐺𝐷𝑃𝑗,𝑖𝑡 + 𝐹𝐸𝑗,𝑖 + 𝜀𝑗,𝑖𝑡 (j = 1…3)
(i = country, t = time 1991…2011, j = non-edible vegetable oils 1…3) ,
Incomplete models of constant elasticity demands with double-log form for major
vegetable oils were estimated. Because of the lack of accurate data for expenditure share of
vegetable oils in each country over two decades, complete system of demand equations such as
AIDS model (Deaton and Muellbauer 1980) and Rotterdam demand system (Theil 1965; Johnson,
Hassan, and Green 1980) were computational inefficient. Similarly, a compensated double-log
demand model (Alston, Chalfant, and Piggott 2002; Kastens and Brester 1996) was not specified.

10
The estimation results of the double-log model, without restriction, used here should be viewed as
an approximation.
Statistical Consideration and Estimation Results
When demand functions were estimated for vegetable oils for food and industrial use, a
robust Hausman test was implemented for each vegetable oil to decide fixed or random effects.
The preferred model was the fixed effects model for each function. To test for unit roots, a Fisher-
type test with Phillips-Perron test option was used to test the null hypothesis that all the panels
contain a unit root. One lag was chosen to remove higher-order autoregressive components of the
series. To mitigate the effects of cross-sectional dependence, the cross-sectional averages were
also subtracted from the series. Results show that the null hypothesis was rejected for all of
variables in the panel datasets. To test multicollinearity of predict variables, the variance inflation
factor (VIF) was computed. No multicollinearity among the variables in each fixed effects model
was detected.
Heteroskedasticity tests were conducted using a modified Wald test for group-wise
heteroskedasticity and confirmed the presence of heteroskedasticity of the residuals in each model.
Serial correlation was tested for using a Lagrange-Multiplier test and confirmed the first-order
autocorrelation of the residuals in each model. Tests for cross-sectional dependence
(contemporaneous correlation, spatial dependence) of the residuals across entities were conducted
using Moran’s I test for each vegetable oil for each year (Moran 1950).4 Although the spatial
4 Because the time dimension of the panel is smaller than the cross-sectional dimension, Pasaran
CD (Cross-sectional dependence) test was used (Pasaran 2004), but the results were not obtained
in each model due to missing data in different countries at different years.

11
dependence is not present each year, the data confirms weak spatial dependence of the residuals
for both food and industrial use.
The Driscoll and Kraay (DK) standard error estimator was used to arrive at robust standard
errors in the estimations of each fixed effects model with lag-1 autocorrelation of the residuals.
DK standard errors estimates are robust to disturbances being heteroskedastic, autocorrelated with
MA(1), and cross-sectionally dependent (Hoeche 2007). For comparison purpose, clustered
standard errors estimates were obtained (Rogers 1993), which is heteroskedasticity and
autocorrelation consistent.
Table 5 shows estimation results of demand function of edible and non-edible oils. Own-
price, cross-price and income elasticities are presented at global level. Weak spatial dependence
of the residuals was already observed in both food and industrial use in some years. The DK
approach provided for more significant predictors than Roger approach (table 5). In the presence
of spatial dependence of the residuals across entities, the analysis confirms that robust standard
errors estimates are appropriate.
[Insert table 5 here]
In the following section, the estimation results resulting from the DK estimator are
explained. For food use, own-price elasticities are -0.42 for soybean oil, -0.68 for rapeseed oil, -
0.46 for palm oil, and -0.54 for sunflower oil. For industrial use, own-price elasticities are -0.49
for soybean oil, -0.94 for rapeseed oil, and -0.29 for palm oil. All cross-price elasticities, which
are statistically significant at least at the 10 % level, indicate (gross) substitution effect on demand
for each vegetable oil. Results suggest that edible rapeseed oil and sunflower oil, whose
consumption per capita remained constant over time, tend to have sensitive demand to a change in
own price and substitute price. Edible soybean oil and palm oil are less sensitive to a change in

12
own price and substitute price than edible rapeseed oil and sunflower oil. As for industrial use,
demand for rapeseed oil is more sensitive to change in own price, to soybean oil price, and to crude
oil price compared to the other vegetable oils (table 5).
Income elasticities are statistically significant for all of vegetable oils except rapeseed oil
for food use (table 5). Income elasticities of rapeseed oil and palm oil for industrial use are larger
compared to those for food use. As for industrial use, income changes have a stronger effect on
demand than crude oil price changes.
Demand separation
In order to identify difference in own-price elasticities by GDP category, interaction terms
between own price and dummy variables (GDP category) were added (table 6). As for soybean oil
and palm oil for food use, no significant differences are found for own-price elasticities by GDP
category. Rapeseed oil and sunflower oil for food use indicate a significant difference in own-price
elasticities by GDP category. For edible rapeseed oil and sunflower oil, as GDP decreases, own-
price elasticities become more negative. This result suggests that demand for edible rapeseed oil
and sunflower oil is more sensitive to own price change in lower-income countries than in higher-
income countries.
[Insert table 6 here]
To conserve space, results for industrial oil use is not reported in table format. As for
soybean oil for industrial use, own-price elasticities are more negative in lower income countries
of Group 2 and Group 4 than reference category country (Group 1). Especially, Group 2 (mid-high
income country group) has significantly increased non-edible soybean oil consumption from
1990’s to 2000’s and has become the largest consuming group in 2000’s. In particular, the

13
Americas and Asia & Oceania are the major consumption regions of non-edible soybean oil.
Demand for non-edible soybean oil are sensitive to own-price change in mid-high income
countries in these regions.
In addition, in order to identify difference in income elasticities by GDP category,
interaction terms between income and dummy variables (GDP category) were also added.
Estimation results with this interaction terms for food use are shown in table 7. No significant
differences in income elasticities by GDP category are found for either food use or industrial use.
Income elasticity for edible rapeseed oil is not statistically significant in all of four GDP categories
and income elasticity for edible sunflower oil is small compared to edible lower value vegetable
oils such as soybean oil and palm oil. Income elasticity of edible palm oil is relatively high in all
of four GDP categories compared to the other edible vegetable oils, indicating that the income
effect on the demand for edible palm oil is worldwide and comparatively strong.
[Insert table 7 here]
To conserve space, results for industrial oil use is not reported in table format, but a
summary of the findings are as follows. Income elasticity for non-edible rapeseed oil is
significantly high. Income elasticity for non-edible palm oil is higher than that of non-edible
rapeseed oil. For rapeseed oil and palm oil for industrial use, the income elasticities are remarkably
higher than crude oil price elasticity of demand for each vegetable oil. Income changes play the
most important role in the determination of demand for vegetable oils for industrial use.
Concluding Remarks
In this article, demand characteristics of major vegetable oils for food use and industrial use were
identified by estimating a fixed effects model using cross-country panel data of 161 countries.
14
Empirical results yield global estimates of own-price, cross-price and income elasticities of each
of the major vegetable oils.
From the first round of estimations, heteroskedasticity, first-order autocorrelation, (weak)
spatial dependence of the residuals were found in the estimated demand models for each vegetable
oil. Therefore, using Driscoll and Kraay (DK) approach, standard errors estimates that are robust
to disturbances being heteroskedastic, autocorrelated with MA(1), and cross-sectionally dependent
were obtained. A comparison was conducted between the DK standard errors estimates with
Roger’s standard errors estimates, which is heteroskedasticity and autocorrelation consistent. The
DK approach indicates more significant predictors than with Roger’s estimation approach. In the
presence of spatial dependence of the residuals across entities, standard errors estimates that are
robust to disturbances being cross-sectionally dependent were confirmed to lead to more efficient
standard error estimates.
Concerning food use, the current research finds that per capita consumption of higher value
edible vegetable oils, such as rapeseed oil and sunflower oil, is susceptible to a change in own
prices and substitute prices compared to lower value edible vegetable oils, such as soybean oil and
palm oil. For higher value edible vegetable oils, own-price elasticities become more negative as
GDP per capita declines, suggesting that demand for those higher value edible vegetable oils is
more sensitive to own price change in lower-income countries than in higher-income countries.
Income elasticities are higher for lower value edible vegetable oils relative to for higher value
edible vegetable oils.
Lower value edible vegetable oils are more price competitive than higher value edible
vegetable oils. Income elasticity of edible palm oil is relatively high in all of four GDP categories
compared to the other edible vegetable oils. The result for a relatively higher income elasticity for

15
edible palm oil indicates that as GDP per capita increases demand for edible palm oil is expected
to increase in developing countries. Thus, countries such as Indonesia and Malaysia may continue
to be sought to supply the growing global demand for palm oil as consumer prosperity grows in
developing countries. If countries like Indonesia and Malaysia face supply restrictions in the future
the demand structure for vegetable oils will have to adjust.
Concerning policy and regulation, for example, the World Health Organization / Food and
Agriculture Organization (WHO/FAO 2003) recommended in 2003 that human diets should
provide a very low intake of trans fats (trans fatty acids: TFA)5. The WHO/FAO pointed out that
“intake of saturated fatty acids is directly related to cardiovascular risk (WHO/FAO 2003, p.88).”
As a result, an increasing number of developed countries have sought regulations imposing
labeling rules for food containing TFA for these exact health concerns6. And, by 2015 the U.S.
Food and Drug Administration announced the phase-out of “generally recognized as safe”
5 “The high degree of unsaturation of soybean oil, and particularly the significant level of linolenic
acid, limits its food application because of its low oxidative stability. Partial hydrogenation is used
to increase the melting temperature and, at the same time, to improve the oxidative stability of
soybean oil.” (Wang 2011). During the production of margarine, spreads, and shortenings via
catalytic hydrogenation when hydrogen atoms are added to liquid oils to produce more solid fats
than oils, the process catalyzes the production of some TFA (Enig et al. 1983). Through
hydrogenation, oil becomes a semi-solid fat with elevated melting point, and partially
hydrogenated oils (PHOs) are useful in certain food applications in keeping food shelf-stable and
preserving flavor. However, concerns about possible associations between TFA and certain type
of cancer (Ip 1997) have motivated some groups to seek reduction in the levels of TFA or
elimination of TFA in foods (Moreau 2002). 6 In March 2003, Denmark became the first country to introduce laws strictly regulating the sale
of many foods containing TFA. In the United States, the U.S. Food and Drug Administration
(FDA) amended its regulations on nutrition labeling in July 2003 (effective in January 2006) to
require that TFA be declared in the nutrition label of conventional foods and dietary supplements
(U.S. FDA 2003). The FDA announced the preliminary determination that partially hydrogenated
oils (PHOs), the primary dietary source of artificial trans-fat in processed foods, are not “generally
recognized as safe (GRAS)” (U.S. FDA 2013). The FDA finalized its determination that PHOs are
not GRAS for use in human food, and set a three-year time limit for removal of the GRAS
recognition from all processed foods (U.S. FDA 2015).

16
assumption for partially hydrogenated vegetable oils. Those regulatory factors will more likely
change demand structure for vegetable oils. In particular, canola oil (rapeseed oil) has been mainly
consumed in higher-income countries as a heart-healthy oil because canola oil is the lowest in
saturated fat among commodity vegetable oils and has the best fatty acid composition among all
commodity oils for health (Przybylski 2011). Rapeseed oil demand is, however, vulnerable to
change in own price and substitute prices from a global perspective as seen in the analysis of this
article. The TFA issue will also favor palm oil consumption because it can be used without full or
partial hydrogenation. Although the disadvantage of palm oil is a high content of saturated fats
(49.3%; the USDA National Nutrient Database), palm oil is naturally semi-solid in nature and
there is little necessity for solidification through hydrogenation which leads to the undesirable
presence of TFA in the frying oil. The advantages of using palm oil products include cheap raw
material, good availability and low cost of processing, since hydrogenation is not necessary (Siew
2011). It is vital to keep track of information on developments of policy and regulation concerning
health issue in each country.
Concerning industrial use, demand for rapeseed oil is sensitive to changes in own price, in
soybean oil price, and in crude oil price compared to the other vegetable oils. In particular, own-
price elasticity of non-edible rapeseed oil is relatively high compared to the other lower value
vegetable oils. Therefore, unless rapeseed oil becomes more cost competitive, it is difficult to
expect demand to grow in the Africa, Asia & Oceania, and Americas where soybean oil and/or
palm oil are mainly used for industrial use. By contrast, income elasticity of non-edible palm oil
is positive and considerably high in all GDP categories. This suggests that strong demand growth
of non-edible palm oil can be expected in a region that will experiences GDP growth in the future.

17
Deforestation through palm logging and forest conversion for soybean production are
mounting international concerns over their environmental impacts. Income elasticities will be
useful in simulating total future demand for vegetable oils with population data, and in estimating
how much agricultural land needs to be developed in the future in order to meet an expected
increase in demand for biofuel feedstocks with the rise of global wealth.
References
Alston, J.M., J.A. Chalfant, and N.E. Piggott. 2002. Estimating and testing the compensated
double-log demand model. Applied Economic 34: 1177-186.
Appalasami, S and R. J. de Vries. 1990. The Future of Palm Oil in Oleochemicals. Palm Oil
Developments 14 (3): 18-29.
Arndt, C., R. Benfica, N. Maximiano, A.M.D. Nucifora, and J.T. Thurlow. 2008. Higher fuel and
food prices: impacts and responses for Mozambique. Agricultural Economics 39 (1): 497–511.
Deaton, A., and J. Muellbauer. 1980. An Almost Ideal Demand System. American Economics
Review 70: 312-26.
de Gorter, H., and D.R. Just. 2008. ‘Water’ in the U.S. ethanol tax credit and mandate: implications
for rectangular deadweight costs and the corn-oil price relationship. Review of Agricultural
Economics 30 (3): 397–410.
de Gorter, H., and D.R. Just. 2009. The welfare economics of a biofuel tax credit and the interaction
effects with price contingent farm subsidies. American Journal of Agricultural Economics 91
(2): 477–88.

18
Enig, M.G., L.A. Pallansch, J. Sampugna, and M. Keeney. 1983. Fatty acid composition of the fat
in selected food items with emphasis on trans components.” Journal of the American Oil
Chemists' Society 60: 1788-795.
Gardner, B. 2007. Fuel ethanol subsidies and farm price support. Journal of Agricultural & Food
Industrial Organization 5 (2) (Article 4).
Goddard, E.W., and S. Glance. 1989. Demand for Fats and Oils in Canada, United States and
Japan. Canadian Journal of Agricultural Economics 37: 421-43.
Hameed, A.A.A., and F.A. Arshad. 2008. The impact of the petroleum prices on vegetable oil
prices: evidence from cointegration test. In Proceedings of the 3rd International Borneo
Business Conference (IBBC): 504–14.
Hoeche, D. 2007. Robust Standard Errors for Panel Regressions with Cross-sectional Dependence.
The Stata Journal 7 (3): 281-312.
Ip, C. 1997. Review of the effects of trans fatty acids, oleic acid, n-3 polyunsaturated fatty acids,
and conjugated linoleic acid on mammary carcinogenesis in animals. The American Journal of
Clinical Nutrition 66: 1523S-529S.
Johnson, S.R., Z. Hassan, and R. Green. 1984. Demand Systems Estimation: Methods and
Applications. Ames IA: Iowa State University Press.
Kancs, d., and N. Wohlgemuth. 2008. Evaluation of renewable energy policies in an integrated
economic-energy-environment model. Forest Policy and Economics 10 (3): 128–39.
Kastens, T.L., and G.W. Brester. 1996. Model Selection and Forecasting Ability of Theory-
Constrained Food Demand Systems. American Journal of Agricultural Economics 78: 301-12.
LaFrance, J.T. 1986. The Structure of Constant Elasticity Demand Models. American Journal of
Agricultural Economics 68: 543-52.

19
Moran, P. A. P. 1950. Notes on Continuous Stochastic Phenomena. Biometrika 37 (1): 17-23.
Moreau, R.A. 2002. Corn oil. In Vegetable oils in food technology: composition, properties, and
uses. ed. F.D. Gunstone, 278-96. Oxford, UK: Blackwell Publishing.
Morton, D.C., R.S. DeFries, Y.E. Shimabukuro, L.O. Anderson, E. Arai, F. del .B. Espirito-Santo,
R. Freitas, and J. Morisette. 2006. Cropland Expansion Changes Deforestation Dynamics in
the Southern Brazilian Amazon. In Proceedings of the National Academy of Sciences 103,
14637–4641.
Pasaran, M. 2004. General Diagnostic Tests for Cross Section Dependence in Panels. Cambridge
Working Papers in Economics No. 0435 Faculty of Economics, University of Cambridge.
Peri, M. and L. Baldi. 2010. Vegetable oil market and biofuel policy: An asymmetric cointegration
approach. Energy Economics 32: 687–93.
Przybylski, R. 2011. Canola/Rapeseed Oil. In Vegetable oils in food technology: composition,
properties, and uses, 2nd ed. F.D. Gunstone, 107-36. Oxford, UK: Wiley-Blackwell.
Rogers, W. H. 1993. sg17: Regression standard errors in clustered samples. Stata Technical
Bulletin 13: 19-23. In Stata Technical Bulletin Reprints, 3: 88–94. College Station, TX: Stata
Press.
Schroeder, T.C, A.P. Barkley, and K.C. Schroeder, 1995. Income Growth and International Meat
Consumption. Journal of International Food & Agribusiness Marketing 7 (3): 15-30.
Siew, W.L. 2011. Palm Oil. In Vegetable oils in food technology: composition, properties, and
uses, 2nd ed. F.D. Gunstone, 25-58. Oxford, UK: Wiley-Blackwell.
Theil, H. 1965. The Information Approach to Demand Analysis. Econometrica 33 (1): 67-87.

20
U.S. Food and Drug Administration. 2003. Food Labeling: Trans Fatty Acids in Nutrition
Labeling, Nutrient Content Claims, and Health Claims. Federal Register 68 (133): 41433-
1506.
U.S. Food and Drug Administration. 2013. Tentative Determination Regarding Partially
Hydrogenated Oils; Request for Comments and for Scientific Data and Information. Federal
Register 78 (217): 67169-7175.
U.S. Food and Drug Administration. 2015. The FDA takes step to remove artificial trans fats in
processed foods. FDA News Release. June.
Yu, T.H., D.A. Bessler, and S. Fuller. 2006. Conintegration and causality analysis of world
vegetable oil and crude oil prices. In Proceedings of the AAEA Annual meeting.
Wang, T. 2011. Soybean Oil. In Vegetable oils in food technology: composition, properties, and
uses, 2nd ed. F.D. Gunstone, 59-105. Oxford, UK: Wiley-Blackwell.
Wooldridge, J. M. 2002. Econometric Analysis of Cross Section and Panel Data. Cambridge, MA:
The MIT Press.
World Health Organization / Food and Agriculture Organization. 2003. Diet, Nutrition and the
Prevention of Chronic Diseases. Report of a Joint WHO/FAO Expert Consultation (Geneva,
28 January - 1 February 2002). WHO Technical Report Series, 916.

21
Table 1: Average Consumption Per Capita in the World: Food and Other Uses from 1991-2000 to 2001-2011
Note: Averages in 1991-2000 and in 2001-2011 were calculated by averaging each year’s data on average consumption per capita.
Source: Authors’ calculations based on FAOSTAT
1991-2000 2001-2011
Rate of
Change 1991-2000 2001-2011 1991-2000 2001-2011
Rate of
Change 1991-2000 2001-2011
Soybean Oil 2.85 3.37 19% 30% 31% Palm Oil 1.28 3.09 142% 35% 39%
Palm Oil 1.29 1.84 42% 14% 17% Soybean Oil 0.58 1.57 171% 16% 20%
Rape and Mustard Oil 1.39 1.37 -1% 15% 13% Rape and Mustard Oil 0.43 1.15 167% 12% 15%
Sunflowerseed Oil 1.27 1.25 -2% 13% 12% Oilcrops Oil, Other 0.50 0.59 19% 13% 8%
Groundnut Oil 0.72 0.66 -9% 8% 6% Palmkernel Oil 0.20 0.46 129% 5% 6%
Cottonseed Oil 0.54 0.52 -2% 6% 5% Sunflowerseed Oil 0.16 0.33 106% 4% 4%
Olive Oil 0.34 0.40 16% 4% 4% Coconut Oil 0.23 0.20 -11% 6% 3%
Coconut Oil 0.30 0.31 4% 3% 3% Cottonseed Oil 0.11 0.17 51% 3% 2%
Maize Germ Oil 0.24 0.29 21% 3% 3% Groundnut Oil 0.07 0.16 133% 2% 2%
Oilcrops Oil, Other 0.22 0.25 13% 2% 2% Olive Oil 0.05 0.06 14% 1% 1%
Palmkernel Oil 0.12 0.24 101% 1% 2% Sesameseed Oil 0.01 0.04 257% 0% 0%
Ricebran Oil 0.10 0.11 20% 1% 1% Ricebran Oil 0.03 0.04 10% 1% 0%
Sesameseed Oil 0.10 0.11 3% 1% 1% Maize Germ Oil 0.04 0.02 -62% 1% 0%
All Vegetable Oils 9.47 10.71 13% 100% 100% All Vegetable Oils 3.70 7.88 113% 100% 100%
Four Major Oils 6.79 7.83 15% 72% 73% Three Major Oils 2.29 5.81 154% 62% 74%
Average (Kg/Capita) Share
Food Use Other Uses (Industrial Use)
Average (Kg/Capita) Share

22
Table 2: Summary Statistics of Data Used in Panel Data Analysis: Consumption Per Capita
Note: Data were obtained from FAOSTAT. Cross-country panel data was used for the analysis in this article
if a country has a population of 100,000 or more. In addition, for both food use and industrial use, some
observations were eliminated as outliers if the real price is less than about 0.3 US dollar/kg or more than
about 10 US dollar/kg. The data were used if a country has more than 10 tons of annual consumption. The
prices are deflated by Consumer Price Index (World Bank, World Development Indicators, 2005 =100).
Food Use
Obs Mean Std. Dev. Min Max
1991-2000 Soybean Oil 829 2.9 3.6 0.00121 23.0
Rapeseed Oil 585 2.2 3.2 0.00037 18.2
Palm Oil 599 2.2 2.4 0.00070 11.1
Sunflower Oil 817 2.1 2.8 0.00041 12.7
2001-2011 Soybean Oil 1,239 3.3 3.5 0.00195 23.2
Rapeseed Oil 801 2.0 3.2 0.00020 17.5
Palm Oil 868 2.8 2.5 0.00037 11.1
Sunflower Oil 1,202 2.5 3.4 0.00013 15.9
1991-2011 Soybean Oil 2,068 3.1 3.5 0.00121 23.2
Rapeseed Oil 1,386 2.1 3.2 0.00020 18.2
Palm Oil 1,467 2.6 2.4 0.00037 11.1
Sunflower Oil 2,019 2.3 3.2 0.00013 15.9
Soybean Oil 12.2%
Rapeseed Oil -9.6%
Palm Oil 30.9%
Sunflower Oil 19.0%
Rate of Change
from 1991-2000
to 2001-2011
Consumption Per Capita (kg/per year/per capita)
Industrial Use
Obs Mean Std. Dev. Min Max
1991-2000 Soybean Oil 348 1.8 2.2 0.00051 12.4
Rapeseed Oil 513 1.4 2.3 0.00023 16.2
Palm Oil 800 2.4 4.0 0.00035 33.5
2001-2011 Soybean Oil 584 2.7 4.1 0.00134 56.5
Rapeseed Oil 632 3.7 6.5 0.01014 52.0
Palm Oil 1,226 4.3 7.6 0.00068 120.9
1991-2011 Soybean Oil 932 2.4 3.5 0.00051 56.5
Rapeseed Oil 1,210 2.5 5.1 0.00023 52.0
Palm Oil 2,026 3.5 6.5 0.00035 120.9
Soybean Oil 48.2%
Rapeseed Oil 176.6%
Palm Oil 82.7%
Consumption Per Capita (kg/per year/per capita)
Rate of Change
from 1991-2000
to 2001-2011

23
Table 3: Summary Statistics of Data Used in Panel Data Analysis: Real Average Price
Note: Data were obtained from FAOSTAT. Cross-country panel data was used for the analysis in this article
if a country has a population of 100,000 or more. In addition, for both food use and industrial use, some
observations were eliminated as outliers if the real price is less than about 0.3 US dollar/kg or more than
about 10 US dollar/kg. The data were used if a country has more than 10 tons of annual consumption. The
prices are deflated by Consumer Price Index (World Bank, World Development Indicators, 2005 =100).
Food
Obs Mean Std. Dev. Min Max
1991-2000 Soybean Oil 829 1.21 0.89 0.30 6.39
Rapeseed Oil 585 1.30 1.05 0.31 8.75
Palm Oil 599 1.07 0.79 0.34 7.04
Sunflower Oil 817 1.43 1.17 0.36 9.39
2001-2011 Soybean Oil 1,239 0.80 0.34 0.31 6.80
Rapeseed Oil 801 0.97 0.45 0.31 4.97
Palm Oil 868 0.70 0.29 0.31 3.80
Sunflower Oil 1,202 0.98 0.41 0.32 6.83
1991-2011 Soybean Oil 2,068 0.97 0.65 0.30 6.80
Rapeseed Oil 1,386 1.11 0.78 0.31 8.75
Palm Oil 1,467 0.85 0.58 0.31 7.04
Sunflower Oil 2,019 1.17 0.84 0.32 9.39
Soybean Oil -33.8%
Rapeseed Oil -25.2%
Palm Oil -34.3%
Sunflower Oil -31.5%
Rate of Change
from 1991-2000
to 2001-2011
Real Price (US$/Kg: Base year = 2005)
Industrial Use
Obs Mean Std. Dev. Min Max
1991-2000 Soybean Oil 348 1.01 0.75 0.40 5.73
Rapeseed Oil 513 1.32 1.10 0.30 9.83
Palm Oil 800 1.16 1.03 0.34 8.95
Crude Oil (Per Litre) 909 0.22 0.17 0.08 1.65
2001-2011 Soybean Oil 584 0.80 0.40 0.35 6.80
Rapeseed Oil 697 1.02 0.45 0.35 4.00
Palm Oil 1,226 0.73 0.30 0.30 3.80
Crude Oil (Per Litre) 1,289 0.33 0.12 0.14 1.12
1991-2011 Soybean Oil 932 0.88 0.57 0.35 6.80
Rapeseed Oil 1,210 1.14 0.81 0.30 9.83
Palm Oil 2,026 0.90 0.72 0.30 8.95
Crude Oil (Per Litre) 2,198 0.29 0.15 0.08 1.65
Soybean Oil -21.1%
Rapeseed Oil -22.6%
Palm Oil -37.7%
Crude Oil (Per Litre) 49.9%
Real Price (US$/Kg: Base year = 2005)
Rate of Change
from 1991-2000
to 2001-2011
24
Table 4: Summary Statistics of Data Used in Panel Data Analysis: Real GDP per Capita
Note: Real GDP data were obtained from U.S. Census Bureau, International Data Base organized into
ERS/USDA Baseline Data Files (USDA ERS International Macroeconomic Data Set).
1991-2011
Real GDP Per Capita (in 2005 US$) Obs Mean Std. Dev. Min Max Population
1,103 488 240 28.42 999.96 >0
1,103 488 240 28.42 999.96 >=100,000
972 2,302 881 1,000.03 3,993.88 >0
958 2,283 873 1,000.03 3,993.88 >=100,000
760 7,285 2,970 4,006.59 14,954.34 >0
707 7,235 3,009 4,006.59 14,954.34 >=100,000
630 33,133 12,313 15,064.44 80,286.68 >0
609 32,003 10,767 15,064.44 68,839.66 >=100,000
All Groups 3,465 8,423 13,099 28.42 80,286.68 >0
3,377 8,093 12,441 28.42 68,839.66 >=100,000
Group1: GDP 15,000 US$-
Group4: GDP 0-999 US$
Group3: GDP 1,000-3,999 US$
Group2: GDP 4,000-14,999US$

25
Table 5: Model Estimates by Fixed Model with Robust Standard Errors (Driscoll and Krray Standard Errors vs Rogers Standard Errors)
Note: The robust t-statistics are reported in parentheses. Asterisks denote statistical significance at the *10%, **5%, and ***1% levels.
Driscoll and Kraay standard errors estimates are robust to disturbances being heteroskedastic, autocorrelated with MA(1), and cross-sectionally dependent.
Rogers (Clustered) standard errors are heteroskedasticity and autocorrelation consistent.
FOOD USE
Explanatory Variable Driscoll-Kraay Rogers (Clustered) Driscoll-Kraay Rogers (Clustered) Driscoll-Kraay Rogers (Clustered) Driscoll-Kraay Rogers (Clustered)
Ln Soya Oil Deflated Price -0.42 *** -0.42 *** 0.00 0.00 0.11 ** 0.11 -0.10 -0.10
(-7.61) (-3.23) (0.00) (0.00) (2.26) (1.02) (-1.24) (-0.85)
Ln Rape Oil Deflated Price 0.11 * 0.11 -0.68 *** -0.68 *** 0.09 *** 0.09 0.03 0.03
(1.89) (1.55) (-5.19) (-3.27) (2.75) (1.28) (0.43) (0.38)
Ln Palm Oil Deflated Price -0.06 -0.06 0.37 ** 0.37 * -0.46 *** -0.46 *** 0.41 *** 0.41 ***
(-1.17) (-0.58) (2.25) (1.77) (-6.53) (-3.25) (4.29) (4.34)
Ln Sunf Oil Deflated Price 0.11 ** 0.11 0.58 *** 0.58 *** 0.09 0.09 -0.54 *** -0.54 ***
(2.12) (1.28) (3.29) (3.47) (1.22) (0.95) (-7.21) (-3.77)
Ln Per Capita Real GDP 0.73 *** 0.73 *** 0.20 0.20 1.07 *** 1.07 *** 0.47 *** 0.47 *
(4.91) (3.09) (1.11) (0.68) (6.27) (4.30) (6.24) (1.94)
Average value of the fixed effects 6.76 *** 6.76 *** 7.53 *** 7.53 *** 3.78 ** 3.78 * 7.99 *** 7.99 ***
(5.20) (3.35) (4.35) (2.94) (2.45) (1.84) (10.55) (3.74)
Observations 2068 2068 1386 1386 1467 1467 2019 2019
Groups 143 143 107 107 105 105 141 141
F 28.7 5.4 6.4 5.0 22.24 5.50 44.14 6.85
within R-squared 0.09 0.09 0.06 0.06 0.11 0.11 0.06 0.06
R-squared 0.84 0.84 0.86 0.86 0.82 0.82 0.92 0.92
Adj R-squared 0.83 0.83 0.85 0.85 0.80 0.80 0.91 0.91
Dependent Variable: Per Capita Consumption
Ln Soybean Oil Ln Rapeseed Oil Ln Palm Oil Ln Sunflower Oil
INDUSTRIAL USE
Explanatory Variable
Ln Soya Oil Deflated Price -0.49 *** -0.49 ** 0.45 ** 0.45 * -0.09 -0.09
(-3.14) (-2.09) (2.18) (1.96) (-1.12) (-0.70)
Ln Rape Oil Deflated Price 0.11 0.11 -0.94 *** -0.94 *** 0.10 0.10
(0.85) (0.56) (-8.35) (-3.20) (1.27) (1.02)
Ln Palm Oil Deflated Price 0.28 *** 0.28 0.24 0.24 -0.29 ** -0.29 **
(2.72) (1.48) (1.20) (1.09) (-2.56) (-2.29)
Ln Crude Oil Deflated Price 0.00 0.00 0.62 *** 0.62 *** 0.22 *** 0.22
(0.03) (0.02) (4.39) (3.32) (2.76) (1.64)
Ln Per Capita Real GDP 0.84 *** 0.84 1.97 *** 1.97 *** 2.79 *** 2.79 ***
(4.37) (1.64) (7.44) (4.70) (11.74) (6.52)
Average value of the fixed effects -0.52 -0.52 -9.59 *** -9.59 ** -14.53 *** -14.53 ***
(-0.26) (-0.10) (-3.72) (-2.24) (-6.19) (-3.62)
Observations 932 932 1210 1210 2026 2026
Groups 68 68 82 82 144 144
F 5.6 2.1 24.6 15.2 212.0 30.0
within R-squared 0.04 0.04 0.20 0.20 0.29 0.29
R-squared 0.78 0.78 0.80 0.80 0.75 0.75
Adj R-squared 0.76 0.76 0.78 0.78 0.73 0.73
Dependent Variable: Per Capita Consumption
Ln Soybean Oil Ln Rapeseed Oil Ln Palm Oil
Rogers (Clustered)Driscoll-Kraay Rogers (Clustered) Driscoll-Kraay Rogers (Clustered) Driscoll-Kraay

26
Table 6: Model Estimates with Interaction Terms between Own Price and GDP Category
Dummy Variables
Note: The robust t-statistics are reported in parentheses. Asterisks denote statistical significance at the
*10%, **5%, and ***1% levels.
Group 1: Countries with Annual Real GDP per Capita>=15,000US$
Group 2: Countries with Annual Real GDP per Capita>=4,000US$, <15,000US$
Group 3: Countries with Annual Real GDP per Capita>=1,000US$, <4,000US$
Group 4: Countries with Annual Real GDP per Capita>=0US$, <1,000US$
(D): Dummy variable
FOOD USE
Explanatory Variable
Ln Deflated Own Price -0.41 *** -0.51 *** -0.47 *** -0.40 ***
(-7.21) (-4.11) (-4.31) (-5.42)
Ln Deflated Own Price * Group 1 (D) Omitted Omitted Omitted Omitted
Ln Deflated Own Price * Group 2 (D) 0.02 -0.06 ** -0.04 -0.10 ***
(1.07) (-2.18) (-1.04) (-4.12)
Ln Deflated Own Price * Group 3 (D) -0.03 -0.17 * 0.02 -0.16 ***
(-0.77) (-1.97) (0.25) (-4.09)
Ln Deflated Own Price * Group 4 (D) -0.03 -0.20 * 0.04 -0.19 ***
(-0.70) (-1.93) (0.43) (-3.62)
Ln Soya Oil Deflated Price -0.02 0.12 ** -0.11
(-0.10) (2.32) (-1.34)
Ln Rape Oil Deflated Price 0.12 ** 0.07 ** 0.04
(1.98) (2.07) (0.56)
Ln Palm Oil Deflated Price -0.06 0.37 ** 0.41 ***
(-1.29) (2.18) (4.08)
Ln Sunf Oil Deflated Price 0.12 ** 0.58 *** 0.09
(2.19) (3.34) (1.18)
Ln Per Capita Real GDP 0.68 *** -0.01 1.13 *** 0.27 **
(4.72) (-0.07) (5.34) (2.51)
Average value of the fixed effects 7.11 *** 9.19 *** 3.31 * 9.51 ***
(5.47) (4.56) (1.86) (10.49)
Observations 2068 1386 1467 2019
Groups 143 107 105 141
F 33.0 5.8 26.3 37.5
within-R-squared 0.09 0.06 0.11 0.07
R-squared 0.84 0.86 0.82 0.92
Adj R-squared 0.83 0.85 0.80 0.91
Ln Sunflower Oil
Dependent Variable: Per Capita Consumption
Driscoll and Kraay standard errors estimates
Ln Soybean Oil Ln Rapeseed Oil Ln Palm Oil

27
Table 7: Model Estimates with Interaction Terms between Income and GDP Category
Dummy Variables
Note: The robust t-statistics are reported in parentheses. Asterisks denote statistical significance at the
*10%, **5%, and ***1% levels.
Group 1: Countries with Annual Real GDP per Capita>=15,000US$
Group 2: Countries with Annual Real GDP per Capita>=4,000US$, <15,000US$
Group 3: Countries with Annual Real GDP per Capita>=1,000US$, <4,000US$
Group 4: Countries with Annual Real GDP per Capita>=0US$, <1,000US$
(D): Dummy variable
FOOD USE
Explanatory Variable Ln Soybean Oil Ln Rapeseed Oil Ln Palm Oil Ln Sunflower Oil
Ln Soya Oil Deflated Price -0.42 *** -0.02 0.11 ** -0.11
(-7.53) (-0.16) (2.24) (-1.24)
Ln Rape Oil Deflated Price 0.12 ** -0.64 *** 0.08 ** 0.04
(1.99) (-5.32) (2.37) (0.55)
Ln Palm Oil Deflated Price -0.07 0.37 ** -0.46 *** 0.42 ***
(-1.32) (2.16) (-6.59) (4.18)
Ln Sunf Oil Deflated Price 0.12 ** 0.57 *** 0.09 -0.55 ***
(2.23) (3.33) (1.21) (-7.56)
Ln Per Capita Real GDP * Group 1 (D) 0.68 *** -0.08 1.09 *** 0.38 ***
(5.21) (-0.43) (5.82) (3.69)
Ln Per Capita Real GDP * Group 2 (D) 0.71 *** -0.13 1.09 *** 0.33 ***
(5.12) (-0.68) (5.64) (3.22)
Ln Per Capita Real GDP * Group 3 (D) 0.68 *** -0.22 1.10 *** 0.31 ***
(5.07) (-1.04) (5.49) (2.71)
Ln Per Capita Real GDP * Group 4 (D) 0.66 *** -0.31 1.11 *** 0.29 **
(5.14) (-1.36) (5.29) (2.28)
Average value of the fixed effects 7.14 *** 10.61 *** 3.58 ** 9.14 ***
(5.97) (5.38) (2.09) (9.60)
Observations 2068 1386 1467 2019
Groups 143 107 105 141
F 35.4 8.6 20.8 33.5
within R-squared 0.09 0.07 0.11 0.07
R-squared 0.85 0.86 0.82 0.92
Adj R-squared 0.83 0.85 0.80 0.91
Dependent Variable: Per Capita Consumption
Driscoll and Kraay standard errors estimates