a general framework for critical infrastructure ... general framework for critical infrastructure...
TRANSCRIPT
A general framework for critical infrastructure interdependencies modeling using economic
input-output model and network analysis
Jiwei LIN
Institute of Catastrophe Risk Management, Interdisciplinary
Graduate School, NTU
Kang TAI School of Mechanical and Aerospace Engineering, NTU Robert Lee Kong TIONG School of Civil and Environmental Engineering, NTU Mong Soon SIM Information Division, DSO National Laboratories, Singapore
1

Critical infrastructure interdependency
What is Critical infrastructure?
Infrastructure (industries) that provides a continuous flow of goods and services
essential for the functioning of a society and economy (Clinton 1996)
What is infrastructure interdependency?
A bidirectional relationship between two infrastructures in which the state of
each infrastructure influences or is correlated to the state of the other
infrastructure. (Rinaldi et al. 2001)
2
Clinton, W.J. (1996) “Executive order 13010 - Critical infrastructure protection”, Federal Register, Vol.61, No.138,
pp.37347-37350
Rinaldi, S.M.; Peerenboom, J.P.; Kelly, T.K.,2001) "Identifying, understanding, and analyzing critical infrastructure
interdependencies," in Control Systems, IEEE , vol.21, no.6, pp.11-25

Critical infrastructure analysed in this study
3
Banking and
Finance
Communication
and Information
Technology
Drinking Water
and Treatment
Plants
Energy
Land
Transportation
Health Care
and Civil
Defence
Agriculture
and Food
Aviation
Maritime
1. Cf. National Security Coordination Centre.(2004) “The Fight Against Terror – Singapore’s National Security Strategy”
2. Speech by Senior Minister Of State For Law and Home Affairs Ho Peng Kee at the Monoc Seminar, 22 March 2002.
4
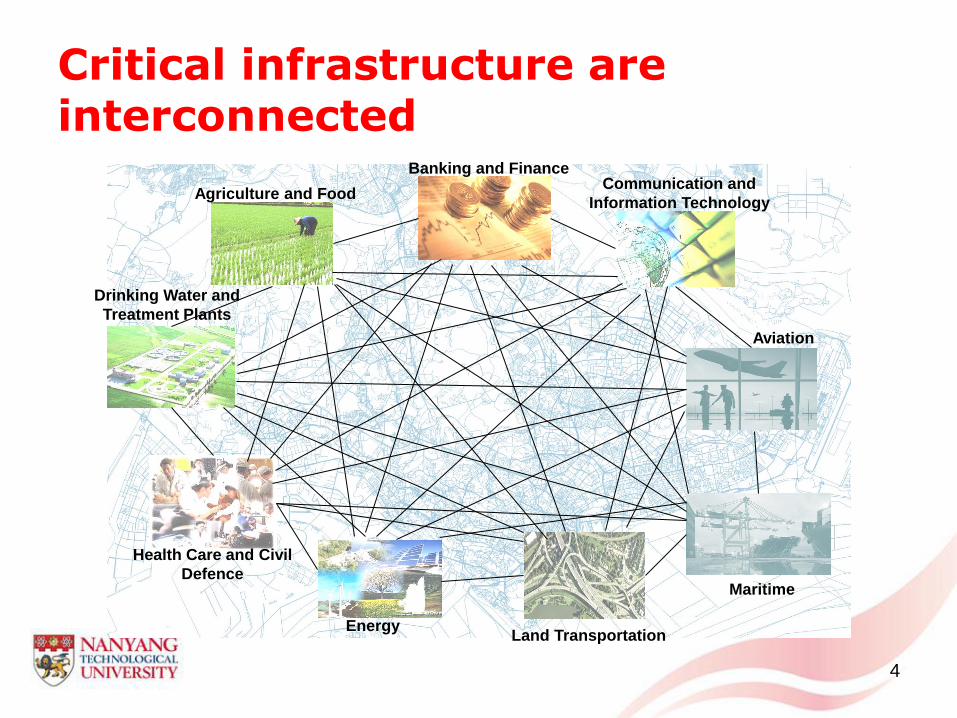
Agriculture and Food
Banking and Finance
Communication and
Information Technology
Drinking Water and
Treatment Plants
Health Care and Civil
Defence
Land Transportation
Energy
Maritime
Aviation
Critical infrastructure are interconnected
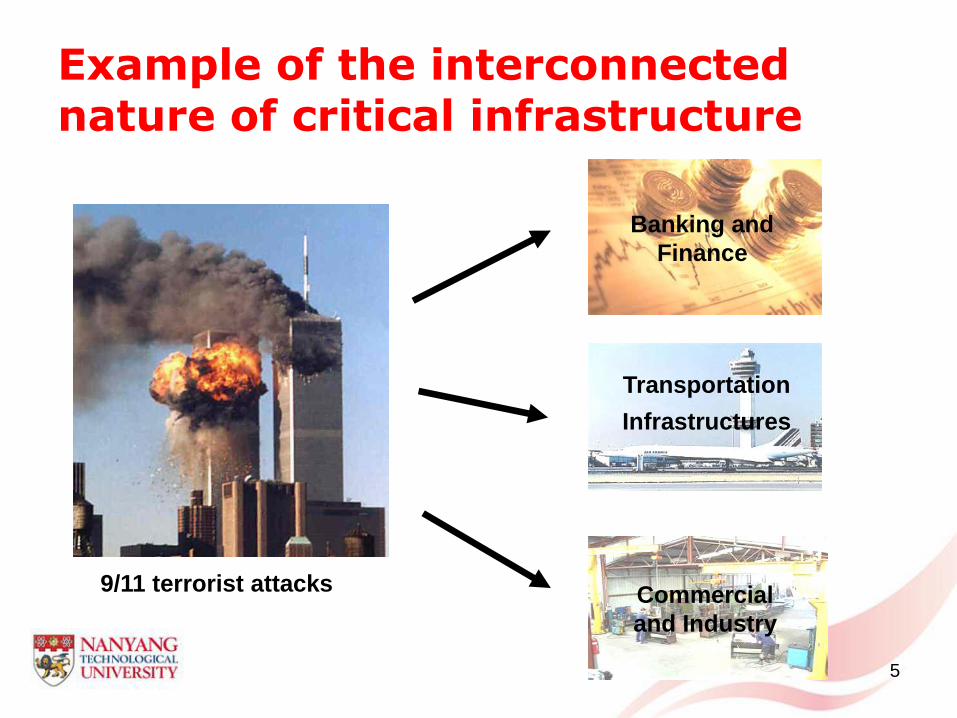
Example of the interconnected nature of critical infrastructure
5
9/11 terrorist attacks
Banking and
Finance
Transportation
Infrastructures
Commercial
and Industry

Observation from the example
• Disturbances (or hazards) can affect two or more
infrastructures
• They are the consequences of the interaction
between different infrastructures, due to their
interconnected nature
• These interactions reflect the interdependencies.
6

Issues in establishing network relationship (interdependence)
• Difficulty in accessing the data
– Modeling requires relevant data such as the interdependencies
between multiple CI sectors
– Even if there is expert knowledge
• There may still be some unforeseen interdependencies
between the CI sectors
• No standardized way of data collection
– Different methodologies have different definitions on critical
infrastructure and their interdependencies
• In order to link all critical infrastructure together, a common metric or
denomination may be required
– In our case, using monetary value
7

Key Research Issues in critical infrastructure interdependency analysis • What is the network relationship (interdependence) between critical
infrastructures?
• To improve the understanding of any impact that propagates within
a critical infrastructure network system
• To analyse and simulate the worst case scenario
8
9
I/O interdependency network model
sales by industry \
sales by
commodity
Banking
and
Finance
Inform
ation-
and
Teleco
mmuni
cations
Electric
ity Water
Transp
ortatio
n Health
Food
supply
Aviatio
n
Securit
y
Maritim
e
Securit
y
Others Total
final
output
TOTAL
OUTPUT
Banking and
Finance 11,695.3 141.6 130.4 29.7 164.8 152.0 176.6 106.8 370.7 12,683.
4 29,552.
9 55,204.7
Information- and
Telecommunicatio
ns 2,427.3 2,237.
0 38.8 4.5 121.7 273.1 144.2 349.5 229.5 8,463.8 10,317.
7 24,607.4
Electricity 104.8 90.1 1,611.2 58.6 50.9 114.7 251.3 88.5 11.0 4,618.0 1,446.3 8,445.5
Water 12.6 44.2 34.2 0.6 3.4 9.0 53.9 13.1 7.0 536.3 333.1 1,048.1
Transportation 111.2 37.7 3.9 0.6 959.0 12.8 45.0 31.7 48.7 1,094.5 3,839.2 6,184.5
Health 55.3 20.7 19.2 0.7 12.7 980.3 61.8 19.7 13.6 3,578.2 4,706.9 9,468.7
Food supply 195.6 74.0 2.8 0.9 8.4 32.4 926.1 250.0 103.9 1,423.0 10,665.
0 13,690.9
Aviation Security 110.2 43.7 1.3 1.6 6.0 23.3 60.3 2,647.
7 15.4 1,300.2 15,107.
8 19,317.3
Maritime Security 87.1 65.9 0.4 0.2 125.7 11.9 31.1 32.8 2,910.
8 8,267.8 26,625.
8 38,159.4
Others 3,458.1 2,909.
4 802.0 175.2 1,358.
5 1,604.
1 3,755.
8 3,575.
8 2,869.
2 126,52
2.0 371,39
8.4 518,465.
9
VALUE ADDED
AT BASIC
VALUES 28,913.2 8,016.
9 2,314.8 540.7 3,129.
6 5,029.
1 4,237.
6 6,160.
5 9,874.
4 183,85
7.5 0.0 252,074.
2
TOTAL INPUT 55,204.7 24,607
.4 8,445.5 1,048.
1 6,184.
5 9,468.
7 13,690
.9 19,317
.3 38,159
.4 518,46
5.9 534,70
0.5 1,229,29
2.8
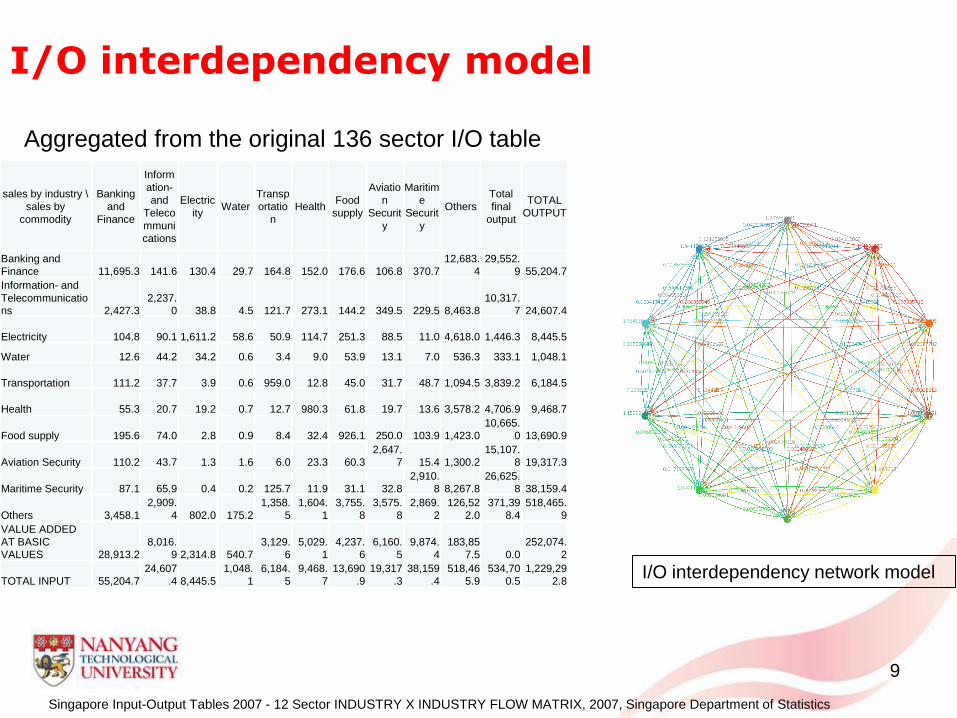
I/O interdependency model
Aggregated from the original 136 sector I/O table
Singapore Input-Output Tables 2007 - 12 Sector INDUSTRY X INDUSTRY FLOW MATRIX, 2007, Singapore Department of Statistics
10
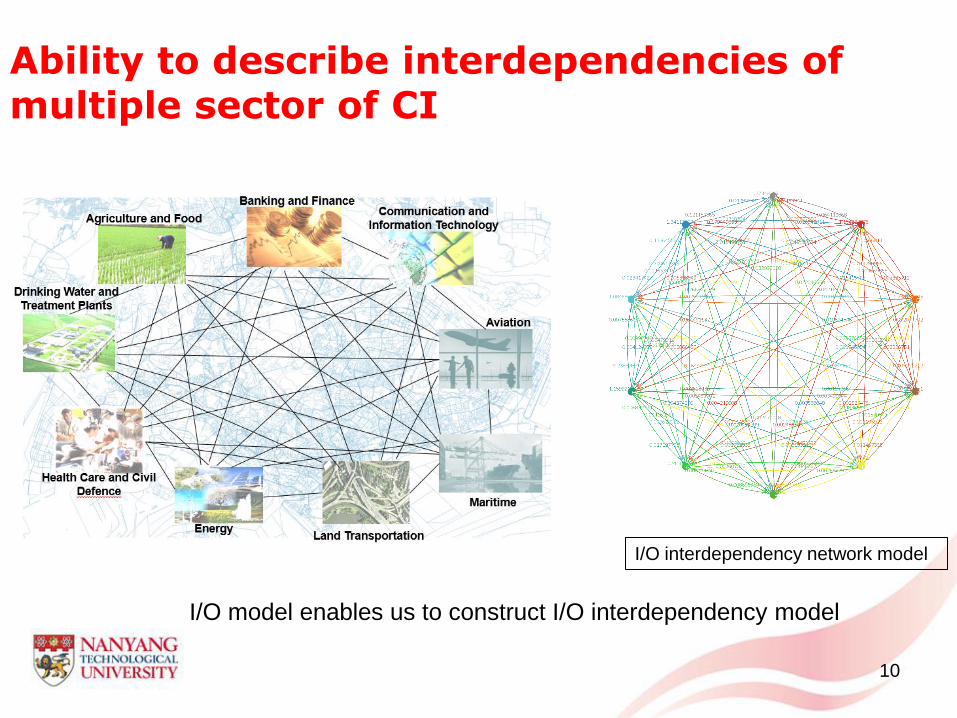
I/O interdependency network model
I/O model enables us to construct I/O interdependency model
Ability to describe interdependencies of multiple sector of CI
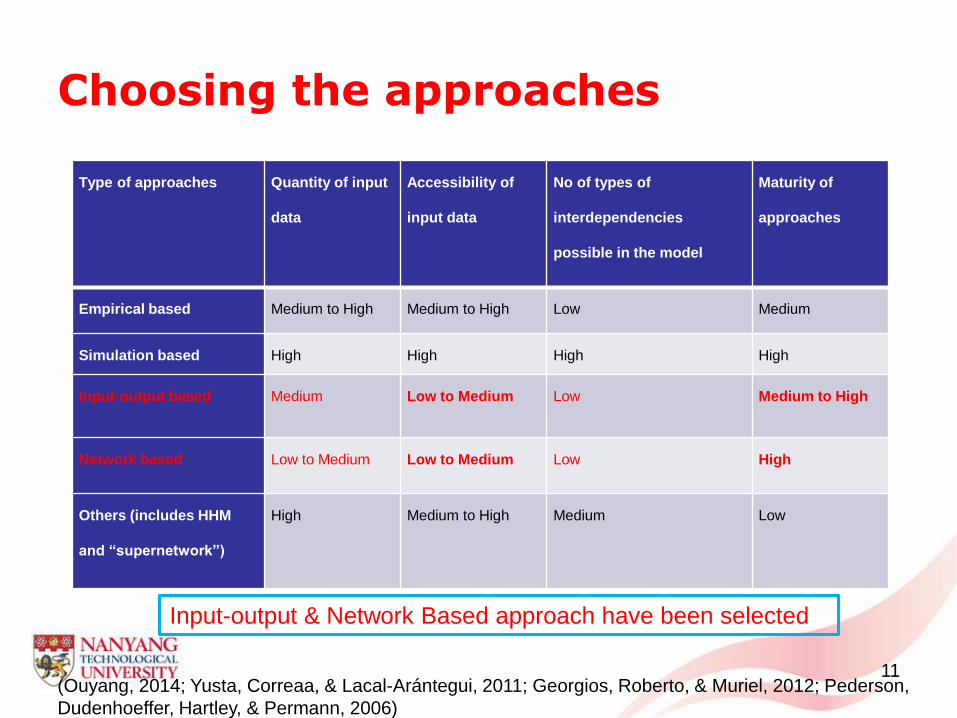
Choosing the approaches
Type of approaches Quantity of input
data
Accessibility of
input data
No of types of
interdependencies
possible in the model
Maturity of
approaches
Empirical based Medium to High Medium to High Low Medium
Simulation based High High High High
Input-output based Medium Low to Medium Low Medium to High
Network based Low to Medium Low to Medium Low High
Others (includes HHM
and “supernetwork”)
High Medium to High Medium Low
11
Input-output & Network Based approach have been selected
(Ouyang, 2014; Yusta, Correaa, & Lacal-Arántegui, 2011; Georgios, Roberto, & Muriel, 2012; Pederson,
Dudenhoeffer, Hartley, & Permann, 2006)
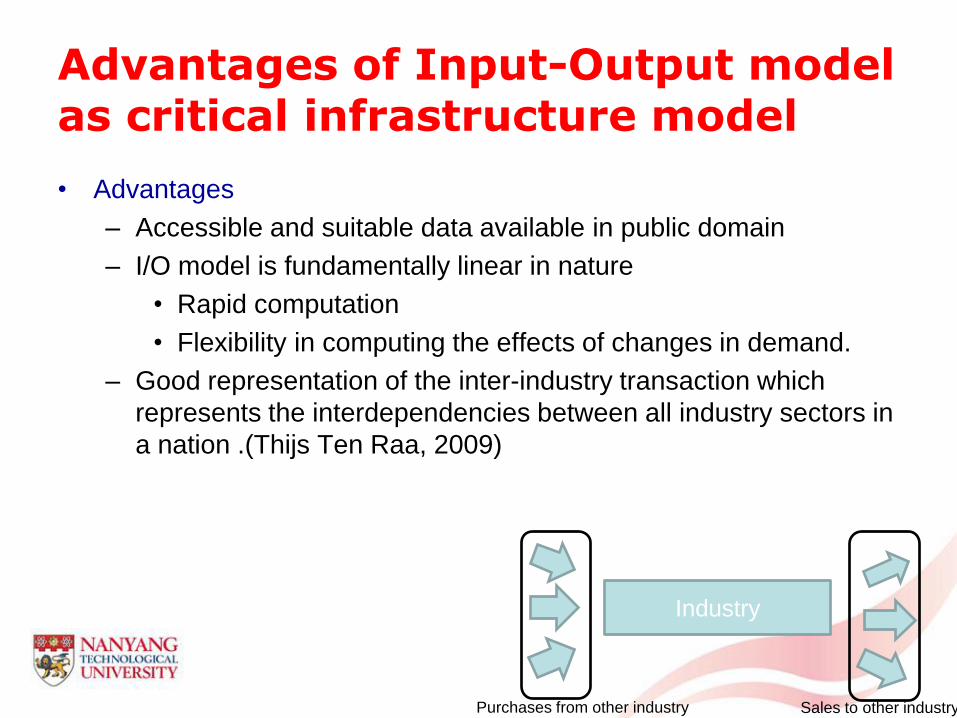
Advantages of Input-Output model as critical infrastructure model
• Advantages
– Accessible and suitable data available in public domain
– I/O model is fundamentally linear in nature
• Rapid computation
• Flexibility in computing the effects of changes in demand.
– Good representation of the inter-industry transaction which
represents the interdependencies between all industry sectors in
a nation .(Thijs Ten Raa, 2009)
Industry
Purchases from other industry Sales to other industry

I/O model as critical infrastructure model
• Depicts inter-industry relationships within an economy, showing how output from one
industrial sector may become an input to another industrial sector.
– Enables a way to analyze the economy as an interconnected system of industries
– Enables estimation of economic impacts of any change to economy based on inter-
industry transaction
• Demand-pull input-output quantity model (Miller & Blair, 2009)
• Xi= Total output of goods and service produced by sector i
• Zij= Inter-industry transactions
• fi =Final demand
13
i ij iX = Z +f
(Okuyama, 2009; Rose & Guha, 2004; Santos & Haimes 2004)
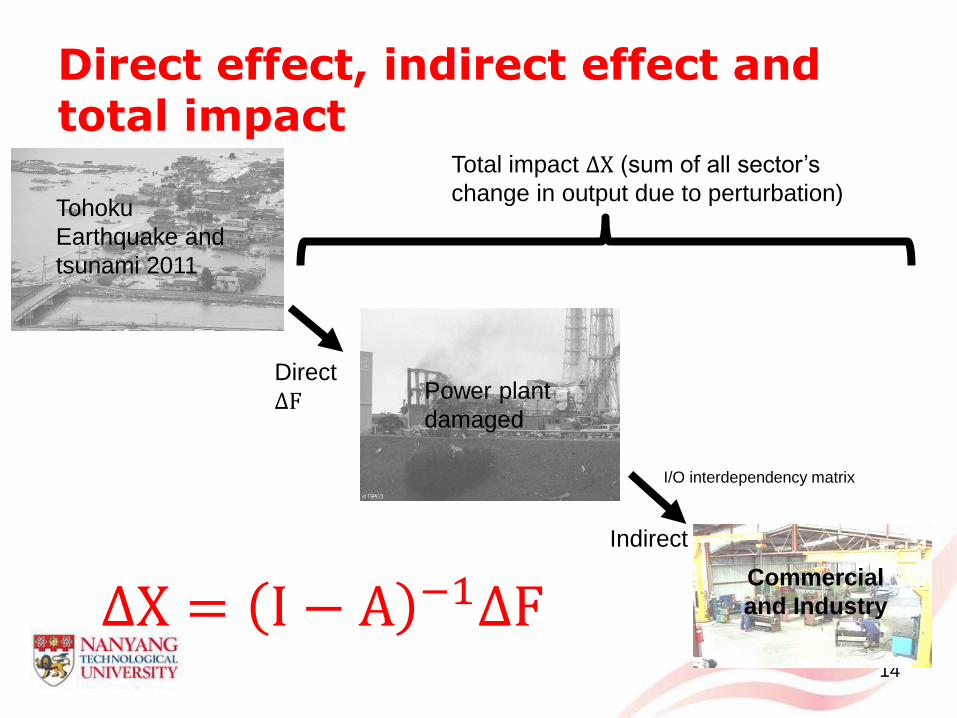
Direct effect, indirect effect and total impact
14
Commercial
and Industry
Tohoku
Earthquake and
tsunami 2011
Power plant
damaged
Direct
∆F
Indirect
Total impact ∆X (sum of all sector’s
change in output due to perturbation)
∆X = I − A −1∆F
I/O interdependency matrix
Disadvantage of I/O model for critical infrastructure modeling
• Disadvantage
– Insufficient as I/O model is unable to describe real physical
infrastructure network
15
To link actual physical infrastructure network with I/O
model
16
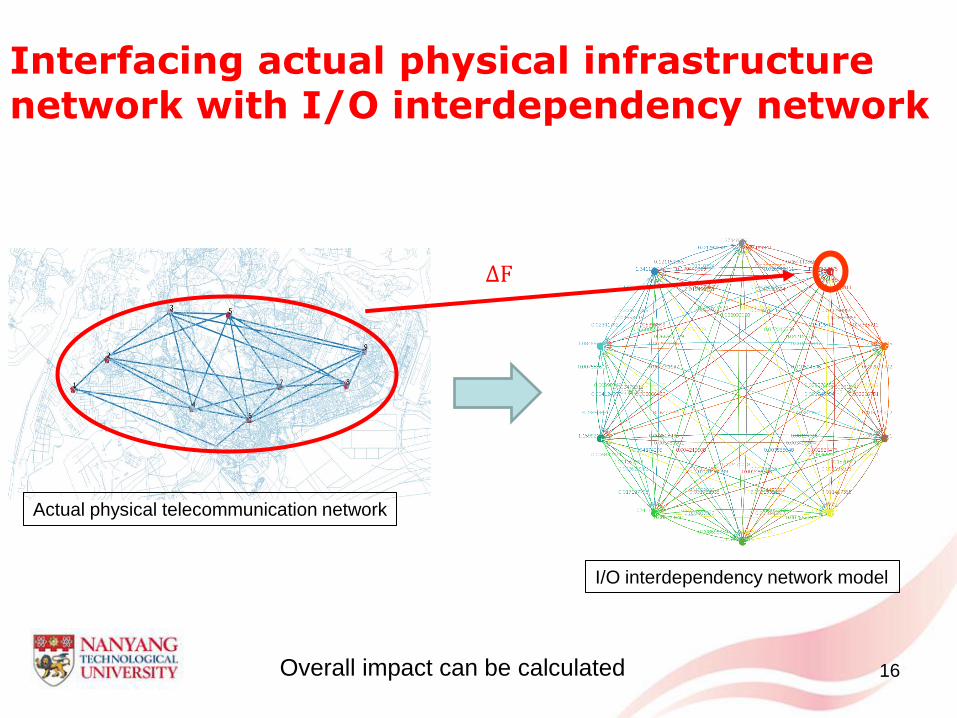
Interfacing actual physical infrastructure network with I/O interdependency network
Actual physical telecommunication network
I/O interdependency network model
∆F
Overall impact can be calculated
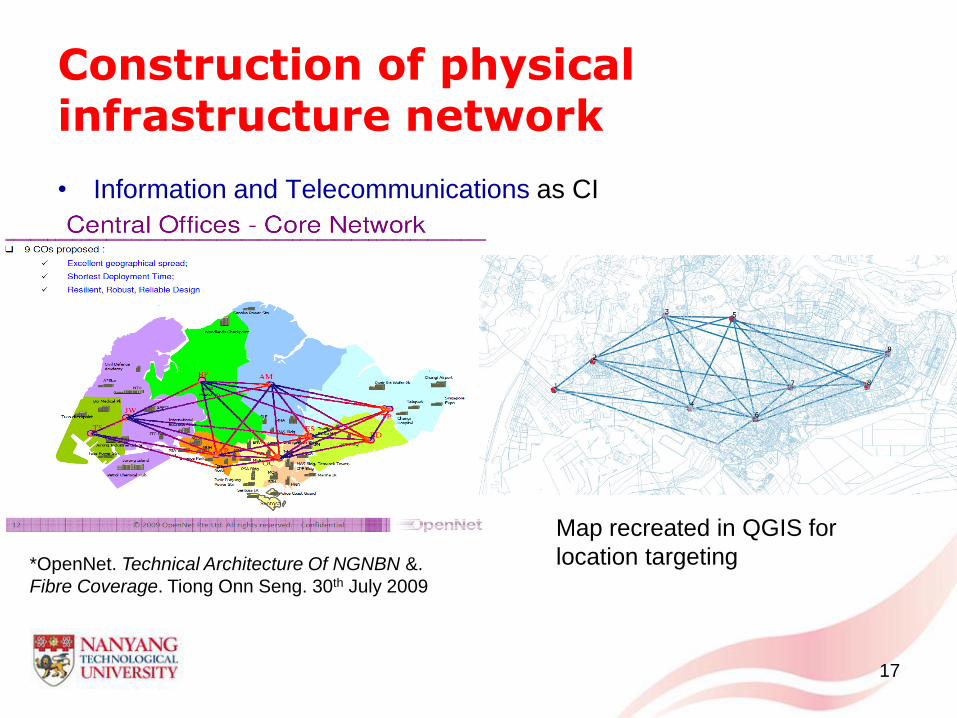
Construction of physical infrastructure network
• Information and Telecommunications as CI
17
*OpenNet. Technical Architecture Of NGNBN &.
Fibre Coverage. Tiong Onn Seng. 30th July 2009
Map recreated in QGIS for
location targeting

Simulation process
• The hazard is represented by failure of nodes
in physical infrastructure network
– Terrorist attack (Targeted node)
– Disaster (Area damage)
• A complete search of the worst case scenario
of 1,2,3 node failure for physical infrastructure
is being setup
• Program used:
– QGIS
• For GIS location of physical infrastructure
– Matlab
• As main computation engine
– Excel
• For data management
– Netlogo
• For simulation of physical infrastructure
failure
18

Initial network performance
• Initial network performance is calculated for the given physical
infrastructure network
19
Telecommunication network in Singapore
• Network performance can be
measured by:
1. Efficiency of network • n denotes the total number of nodes and
𝑑 𝑖, 𝑗 denote the shortest path between a
node i and a neighboring node j.
2. Network average clustering
coefficient • The average of the local clustering coefficients
of all the vertices n.
,
2 1( )
( 1) ( , )
n
i j G
E Gn n d i j
1
1 n
i
i
C Cn
Efficiency of network:
P. Crucitti, V. Latora, and M. Marchiori, "Model for cascading failures in complex networks," Physical Review E, vol. 69, p. 045104, 2004.
Network average clustering coefficient:
Z Mao, L Hong, Q Fei, M OuYang - Advances in Neural Networks–ISNN 2009, 2009

Final network performance
20
Two nodes removed
Calculate new network performance of the new network structure based
on the 2 network performance measures
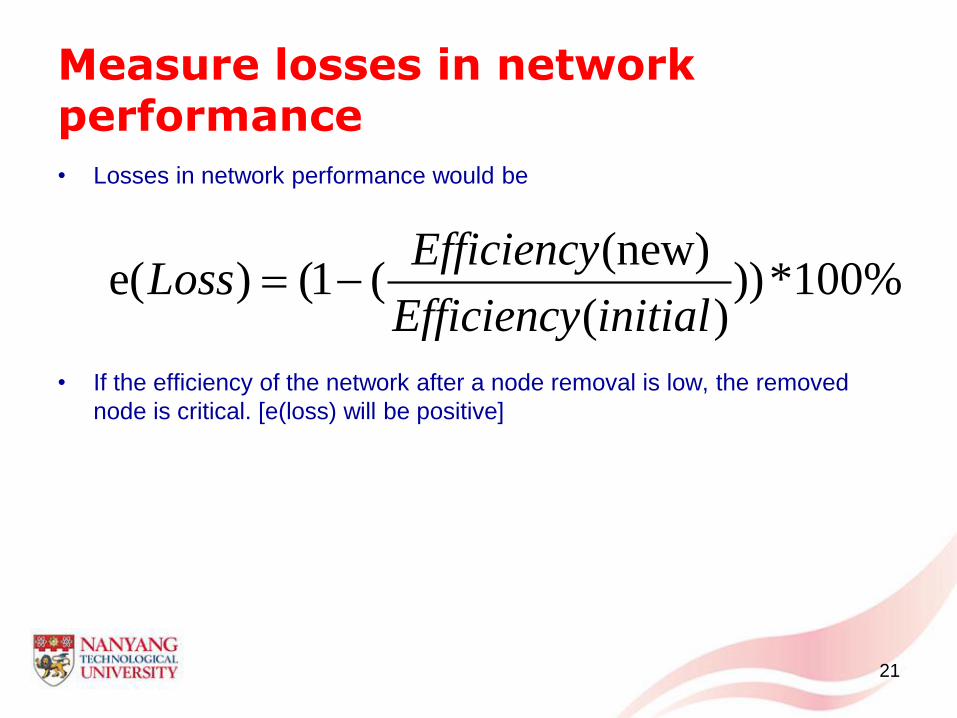
Measure losses in network performance
• Losses in network performance would be
• If the efficiency of the network after a node removal is low, the removed
node is critical. [e(loss) will be positive]
21
(new)e( ) (1 ( ))*100%
( )
EfficiencyLoss
Efficiency initial
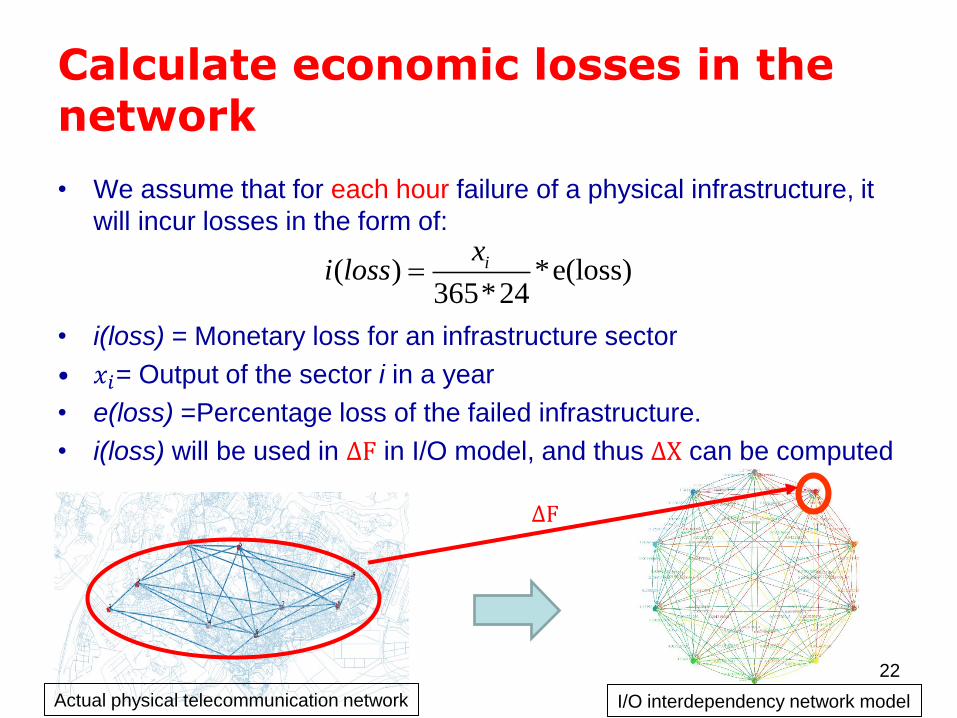
Calculate economic losses in the network
• We assume that for each hour failure of a physical infrastructure, it
will incur losses in the form of:
• i(loss) = Monetary loss for an infrastructure sector
• 𝑥𝑖= Output of the sector i in a year
• e(loss) =Percentage loss of the failed infrastructure.
• i(loss) will be used in ∆F in I/O model, and thus ∆X can be computed
22
( ) *e(loss)365*24
ixi loss
Actual physical telecommunication network I/O interdependency network model
∆F

23
Results
The worst case scenario that causes
largest impact is found Lin, J , Tai, K., Tiong, R.L.K. and Sim, M.S. (2016). A general framework for critical infrastructure interdependencies modeling using economic input-output model and network
analysis. Proceeding of the 2nd Asia-Pacific Conference on Complex Systems Design & Management, 24-26 February 2016, Singapore. (In print)
4.9%
1.4%
1.4%
6.1%
5.1%
-0.2%
6.7%
6.7%
6.7%
17.8%
17.4%
17.4%
10.5%
10.5%
8.9%
36.9%
36.9%
28.0%
% impact to
singapore hourly

24
Concluding remarks
• This framework provides a quick method to model and
analyse critical infrastructure interdependencies
• In situation where expert data is unavailable, this
approach can still be used
• Interfacing physical infrastructure and I/O interdependency
model facilitates modeling of various scenarios in the
physical world
• Simulation shows its capability of finding worst case scenario
to aid decision-making for stakeholders and security service
provider to protect the infrastructures accordingly
• With limited resources, need to prioritise which
infrastructure assets to receive more protection
• Future work will be on a case study to validate this model

25
Thank you for attending this presentation!
Comments/Suggestions are appreciated.