a framework for the study of carrier strategies in an auction …web.cecs.pdx.edu/~maf/journals/a...
TRANSCRIPT

A Framework for the study of Carrier Strategies in an Auction Based Transportation Marketplace
Miguel Andres Figliozzi University of Maryland, College Park
Department of Civil & Environmental Engineering Martin Hall, College Park, MD 20742
Hani S. Mahmassani University of Maryland, College Park
Department of Civil & Environmental Engineering Martin Hall, College Park, MD 20742
and
Patrick Jaillet Massachusetts Institute of Technology
Department of Civil & Environmental Engineering Cambridge, MA 02139-4307
August 1, 2002 Revised, January 2003
Presented at the 82nd Annual Meeting of the Transportation Research Board, and
submitted for publication in Transportation Research Record

A Framework for the study of Carrier Strategies in an Auction Based Transportation Marketplace
Miguel A. Figliozzi, Hani S. Mahmassani and Patrick Jaillet
Abstract Online markets for transportation services, in the form of Internet sites that dynamically
match shipments (shippers’ demand) and transportation capacity (carriers’ offer) through
auction mechanisms are changing the traditional structure of transportation markets. A
general framework for the study of carriers’ strategies in a transportation auction
marketplace is provided. The unique characteristics of these marketplaces and the sources
of difficulty in analyzing the performance of these marketplaces under different carrier
bidding strategies are discussed. A simulation framework is used to explore the complex
engineering and economic processes and issues that arise in a transportation marketplace,
which are difficult to explore using standard analytical or statistical tools. Some results
and the overall simulation framework are also discussed.
KEYWORDS: Freight Transportation, Shipper and Carrrier Behavior, Game Theory,
Dynamic Games, Carrier Management Strategies, Carrier Profitability, Information
Technology, Electronic Commerce, Auctions

Figliozzi, Mahmassani and Jaillet 1
INTRODUCTION
It is well recognized that information and communication technologies (ICT) are
changing many aspects of the way business is conducted (1). The implications for
transportation and logistics systems structure and operations are continuing to unfold,
sometimes in unpredictable ways. Discussion of these phenomena has been mostly
limited to generalities and speculation, with few attempts to provide formal models or
numerical results.
The changes that ICT could bring to companies’ strategies and market structures
have been examined from a broad perspective. As early as 1987, Malone et al. (2)
predicted that reducing coordination costs (while holding other factors constant) should
increase the proportion of economic activity coordinated by the markets. Factors that
favor market or auction systems are the simplicity of the product description, the
adoption of common standards, and access to multiple potential suppliers in the
marketplace.
Other authors suggest the opposite, namely that widespread availability of ICT
will reduce the number of suppliers and foster long-term cooperative partnerships (3).
These two opposing views respectively lead to the market model or to the emergence of
hierarchies. Intermediate views have also been suggested (4), whereby organizations gain
the benefit of a controlled and known hierarchy while retaining an element of market
competition. Beyond changes in market structure, the Internet and especially auctions
have emerged as an effective catalyst to sell/buy through electronic marketplaces.
Transaction time, cost and effort could be dramatically reduced, creating new markets
and connecting buyers and sellers in ways that were not previously possible.
DEFINITION OF AUCTION MARKETPLACES
Many Internet-based sites have emerged to serve the transportation industry,
offering a wide variety of services. These services range from load posting boards, cargo
matching, and auctions to the procurement of transportation equipment, parts and systems
for logistics and supply chain management (5). The focus of this paper is on the study of
transportation marketplaces that enable the sale of cargo capacity based mainly on price,

Figliozzi, Mahmassani and Jaillet 2
yet still satisfy customer level of service demands. The specific focus of the study is the
reverse auction format, where shippers post loads and carriers compete over them
(bidding).
McAffee and McMillan (6) define auctions as market institutions with an explicit
set of rules determining resource allocation and prices on the basis of bids from the
market participants. Auctions have been widely studied by economists, leading to recent
advances in the theoretical understanding of different auction types and designs (7).
Auctions as a device to match supply and demand provide a powerful mechanism to
allocate resources, especially when the latter have uncertain or non-standard value.
Transportation auctions are a relatively recent phenomenon, characterized by
rapid change and fast development. This type of market has not yet reach maturity as
indicated by the significant number of start-ups, mergers, consolidations, and liquidations
that took place in the past couple of years. The interested reader may find a list of
transportation marketplaces in the Journal of Commerce (Review and Outlook
Millennium Edition, January 18th, 2000) and check how many are still operating. Hence,
this paper does not focus on describing a particular existing marketplace, but rather builds
a general framework for the study of auction marketplaces. The auctions operate in real
time, providing transparency in a many-to-many market. Transaction volumes and prices
are barometers of the market and their variation should reflect the status of demand and
supply, for a given level of service in its multiple dimensions: reliability, visibility of the
product, speed, etc. Even if auctions are not the most utilized procurement tool for
transportation services, they provide a useful and appropriate framework to:
� Gain insight into drivers of price in a dynamic real time market
� Study and develop real time yield management strategies
� Examine the implications of market conditions and carrier strategies on shippers’
level of service
� Monitor system evolution and describe market conditions using price and other
performance parameters as system indicators.
However, as detailed below, transportation marketplaces possess certain
characteristics that preclude direct transferability of conclusions and applicability of

Figliozzi, Mahmassani and Jaillet 3
models developed for other types of goods and services. This unique set of characteristics
gives rise to challenging problem classes that must be formulated and solved in order to
study the performance and properties of transportation marketplaces, along with their
implications for shippers and carriers.
CHARACTERISTICS OF TRANSPORTATION AUCTIONS
Two types of assets could be traded in transportation marketplaces: (a) loads, or
demands of shippers, being "sold" to the lowest bidder-- this would be the case of extra
supply looking for scarce demands; and (b) capacity, i.e. the capacity to move goods, that
have certain requirements, by a given mode from location A to location B, being sold to
the highest bidder. The buyer of such capacity could be a shipper wishing to move a load,
a carrier needing the extra capacity to move contracted loads, or a third party hoping to
make a profit by reselling this capacity.
Auctions are typically used where products have no standard value (8), as
opposed to situations where a fixed price can be posted for the products. In the case of
transportation services, the price can be reasonably bounded by:
� What the shipper could pay in the regular market in an established relationship
with a carrier minus the cost or fees of the auction (upper bound)
� What the carrier must pay for rerouting the vehicle, loading time, unloading time,
driver extra compensation (lower bound)
However, these bounds can be greatly affected by the following unique
characteristics of transportation auctions:
� The traded entity is a service
� Transportation services are perishable, non-storable commodities
� Penalties/costs associated with late deliveries or no delivery might be several
times higher than the cost of transportation per se
� Demand and supply are geographically dispersed
� Uncertain demand/supply over time and space
� Present and future fleet utilization level

Figliozzi, Mahmassani and Jaillet 4
� Group Effect: value of traded item (shipment) may be strongly dependent upon
the acquisition of other items (e.g. nearby shipments)
� Network Effect: value of a shipment is related to the current spatial and temporal
deployment of the fleet
� There might be strong substitution/complementarity effects depending on the
shipment attributes and the fleet status
Multiple Disciplinary Perspectives on Transportation Auction Marketplaces
By connecting shippers and carriers nationwide in real time, and increasing the
size and scope of the market, transportation marketplaces move us closer to ideal perfect
markets. At the same time, increased collaboration among shippers or carriers might be
possible by allowing demand bundling or extended service offers and cost savings.
Audience size and scope advantages give Internet auctions a major role in the emerging
global economy (9, 10). However, the same enabling technologies may also facilitate
anticompetitive behaviors. One danger of standard auctions is the possibility that
buyers/sellers who repeatedly participate in the same types of auctions could engage in
collusive behavior. This topic has been extensively study in the Economics literature,
specifically in the field of Industrial Organization through game theoretical models of
oligopoly and collusion. General references include the work of Tirole (11) and Martin
(12).
A market environment that has few suppliers and many buyers is called an
oligopoly. In such an environment, each buyer takes market conditions as given, but each
seller is aware that his actions have significant impact upon his rival’s payoffs, and vice-
versa. Compared to a competitive firm or an uncontested monopoly, the typical
oligopolist faces a considerable complicated decision problem, which stems mainly from
the strategic interdependency among competitors (12). This interdependency lends itself
to be modeled using game theory. Game theoretic models of oligopoly tend to be marked
by precise treatments of the sequence of moves and specifications of the information that
oligopolists are assumed to have at different times. The distinctive emphasis of these
models is on the kinds of equilibria that could reasonably be expected to persist, and on
beliefs needed to support such equilibria.

Figliozzi, Mahmassani and Jaillet 5
In an auction, profits are highly dependent on the quality of the bidding strategy.
Game theoretical models of bidding provide important insights, mainly focused
on symmetric risk-neutral agents bidding competitively for a unit of an item in a one shot
(one period) auction. In a transportation auction marketplace, however, most auctions
will involve oligopolistic sellers (a few carriers) with different fleet sizes, fleet
assignment strategies, and fleet statuses (asymmetries), who meet repeatedly and
determine their bid strategically in an effort to exploit market power opportunities.
The repeated interaction among oligopolistic carriers allows the possibility of
learning about strategies, the environment, and competitors. This realistic assumption
implies that carriers can analyze with different degrees of sophistication the history of
play and estimate the possible future consequences of current actions. Therefore, carriers
and shippers must be modeled as entities or intelligent agents that determine their
interaction with other agents and with their environment on the basis of history
(experience), learning, expectations about future consequences of current actions, and
evolving strategies. A good introduction to the subject of learning in games is provided
by Fudenberg and Levine (13).
The learning and repetition establishes an expected connection to a relatively new
branch of Economics, Agent based Computational Economics (ACE) (14), which studies
the economics of self-organization and evolution using the following:
1. Heterogeneous agents that interact among each other and with the environment on
the basis of their behavior and experience
2. Agents co-evolve and continually adapt their behavior in response to agent-agent
and agent-environment interactions
3. Agents engage in continual open-ended experimentation with new rules of
behavior. That is, agents in the economic world co-evolve
4. Once initial conditions are set, all subsequent events can be initiated and driven
by agent-agent and agent-environment interactions without further outside intervention
Previous work in ACE closely relates to this topic and covers auctions in the
electric power marketplace (15). However, there appears to be no published work of a
fundamental, scholarly or methodological nature specifically dealing with the unique

Figliozzi, Mahmassani and Jaillet 6
characteristics of the interaction among shippers and carriers and the performance of
transportation marketplaces.
Clearly, the market setting will establish the rules of the game determining an
individual player’s optimal decision strategy. In the transportation context, this includes
not only the player’s bidding process decisions, but also the associated vehicle fleet and
load assignment decisions. A carrier’s bidding decisions must be directly linked to the
actual operational plan under which service will be provided. From a carrier standpoint,
deciding whether to bid, assigning a given truck to a load, or buying capacity on a
competitor’s fleet at a given price must be integrated in a real-time decision framework
for fleet operations.
Advances in ICT have also affected the way transportation fleets are operated and
managed. More quality information about the current and future status of the fleet and
demand can highly improve the efficiency of fleet operations (16). In a dynamic bidding
environment the quality and accuracy of costing services is a key input to ensure the
profitability of carrier operations and can provide a significant competitive edge. The
revenue realized for each loaded movement is highly dependent on the availability and
proximity of vehicles and drives to the load at the time it has to be moved or serviced.
Different approaches to solve the dynamic vehicle routing problem include stochastic
programming (17 and 18) variations of the probabilistic traveling salesman problem (19),
and heuristics for real time applications (20).
As seen above, the study of auction marketplaces cuts across a wide range of
disciplines including Industrial Organization, Game Theory, Learning and Cognitive
Science, Experimental Economics, Agent Based Computational Economics, and Fleet
Management. The encompassing scope of the mentioned fields indicates the nature of the
complexity of the study of transportation marketplaces, which is the topic of the next
section.
COMPLEXITY OF TRANSPORTATION AUCTIONS
Transportation auctions present opportunities to improve the efficiency of the
overall transportation system, but they also introduce a considerable challenge to the
participants (shippers and carriers). More information and data are available for decision-

Figliozzi, Mahmassani and Jaillet 7
making, but the complexity of the problem increases substantially. Shippers and carriers
have to keep in mind the marginal cost and desired profit from a particular transaction. In
real time situations this is often difficult. Furthermore, this is an increasingly difficult
when optimal decision-making entails the solution of NP hard problems (problems where
computational time to reach an optimal solution grow exponentially as problem size
increases linearly). The sources of complexity include:
1. Multiple interacting agents with multiple conflicting objectives.
2. Uncertainties about a shipment’s value, the shipper’s reservation price and cost of
serving the shipment for the carrier. This is particularly difficult for carriers if they want
to incorporate the effect of accepting this shipment on the cost of serving future
shipments.
3. Fleet management complexities (vehicle routing problem, with time windows,
penalties, etc). This is a NP hard kind of problem. For real world fleet sizes these
problems cannot be solved optimally.
4. Fast responses are needed. Information is received and updated in real time.
Responses to requests and changes in initial conditions have to be dealt with before the
arrival of new requests or changes in the initial conditions take place.
5. Demand: spatial and temporal stochasticity preclude the use of naïve or
unsophisticated bidding and fleet management techniques.
6. The problem becomes even more complicated if combinatorial bidding (bidding
on bundles) is allowed
Online transportation marketplace characteristics deeply challenge “traditional”
models of equilibrium, decision-making, and analysis. As mentioned earlier, a new cross-
disciplinary approach is required to model and study the problems that the online
business environment poses to shippers, carriers, policy makers, and researchers.
SIMULATION MOTIVATION AND DESIGN
Given that closed analytical solutions for these complex dynamic systems would
require many simplifications that could compromise the validity of the results,
computational experiments and simulation can enhance and extend the theoretical

Figliozzi, Mahmassani and Jaillet 8
investigation of these dynamic games. Furthermore, simulation enables the computational
study of interactions among market agents by means of controlled and replicable
experiments. It is also possible to explore and systematically test changes in key market
parameter values, e.g., number of carriers, arrival rates, auction types, etc. in a wide
spectrum of scenarios allowed by the many potential market settings. Table 1 provides a
categorized list of parameters that are possible to study in the context of an auction
marketplace.
A market simulation framework was therefore developed to start gaining insight
into the overall market behavior, its efficiency and resulting shipper service levels under
different market settings and when carriers follow different individual strategies in a non-
cooperative decision environment with varying degrees of information sharing and
market settings. An object-oriented discrete-event simulation code was written to test
carrier strategies and study overall market behavior and performance. The simulation
program provides a framework to study important questions and a test bed for defining
and investigating bidding and operational strategies for fleet management.
Marketplace Agents
Our framework accommodates three basic and distinct types of agents: the
marketplace, carriers, and shippers. The marketplace creates an environment with well-
defined rules and settings that allow the exchange of information and completion of
transactions between carriers and shippers. Carriers are the sellers of transportation
services. Carriers’ behavior is given by their internal state, strategy, endowment, and
external stimulus (demand stream). Carriers adapt their behaviors in response to
interactions with other carriers and their environment in an attempt to maximize profits or
gain market power. Besides, they act according to the physical feasibility constraints
given by their assignment strategies and pool of awarded shipments. Past decisions are
binding and limit the future actions of carriers, therefore behavioral rules are state-
conditioned and the carriers co-adapt their behavior as the marketplace evolves over time.
The number of carriers is an important parameter. In an oligopolistic market (relatively
few carriers) a present carrier’s action may influence competitors’ future behavior and
significantly affect its own future profit. On the other hand, with a relatively high number

Figliozzi, Mahmassani and Jaillet 9
of carriers, individual carrier actions would not significantly alter its future rewards by
modifying other players’ behavior.
Each carrier is modeled as an autonomous agent with internalized social norms
(market settings or protocol), internally stored bid outcomes data, stored state
information, and internal behavioral rules. Although each carrier has the same internal
structure, trader types can differ from each other in terms of their specific fleet
management techniques, beliefs about the shippers or other carriers, and original
endowments (fleet size or initial fleet status). Each carrier acquires different state
information and evolves different behavioral rules over time on the basis of its own
unique past experiences.
Shippers are buyers of transportation services. Shippers are developed as agents
that generate a stream of shipments and their corresponding attributes according to
predetermined probability distributions. They are rational agents because they know the
exact value of the reservation price of their shipments as a function of its attributes
(origin-destination, commodity type, stock out costs, time window, etc.). Furthermore,
shippers maximize profits by setting the right reservation price; the highest price a
shipper is willing to pay a carrier for servicing a given shipment. The shipper achieves a
profit (saving) when paying less than the reservation price. A rational shipper rejects
transportation services exceeding the reservation price (the shipper does not incur loss).
Table 2 summarizes the functions performed by each agent type in our simulation
framework.
In this framework, carriers’ beliefs and experiences evolve jointly over time, and
their strategies at a given moment are contingent on interactions that have occurred in a
path-dependent time line. Similarly, the shippers’ behavior can be affected by the
evolution of the system. However, if a large population of shippers (much larger than the
number of carriers) is considered, the individual effect of a shipper in the system’s
outcome is negligible. The reservation prices are derived mostly from individual shipper
characteristics rather than from strategic or learning considerations.
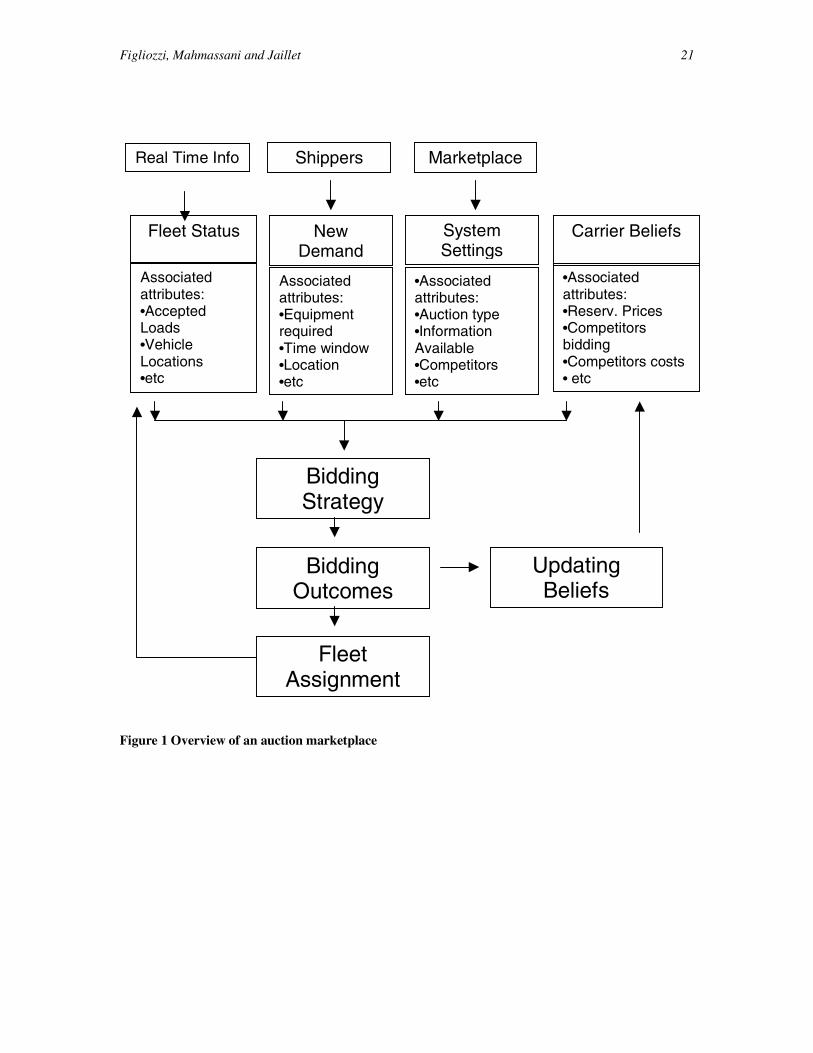
Figure 1 presents a schematic overview of how a transportation marketplace
works. A shipper’s decision to post a shipment in the auction market initiates an auction.
Events in the market are the arrival of shipments, the subsequent bidding process, and bid

Figliozzi, Mahmassani and Jaillet 10
resolutions. Carriers’ internal events are the assignment, pickup, and delivery of loads.
Carriers repeatedly engage in bidding interactions modeled as noncooperative games,
fleet assignment decisions, and update of its own beliefs to take into account bidding
outcomes and service costs.
A common characteristic among agents is that they are all capable of collecting
and processing the performance measures necessary to evaluate a given marketplace
setting. A sample of performance measures by agent type follows:
a) Marketplace level: total system welfare, number of inefficient outcomes
(shipment reservation price is higher than the cost of serving a shipment, but bids are
over the reservation price and, consequently, the shipment is not served), lost welfare
(lost wealth originated by inefficient outcomes)
b) Shipper: consumer surplus, service time, percentage of served loads.
c) Carrier: profit, fleet utilization, ratio loaded/empty distance, empty distance,
loaded distance, number of shipments in the carriers system, and market share.
EXPERIMENTAL DESIGN AND RESULTS
The experimental design considered is intended to provide a starting point for
examining marketplaces. It includes strategic interaction among carries, uncertainties
over time, space, and prices, yet keeps the complexity of carriers’ behaviors at a low
level.
A Vickrey or second price auction is used. This is a one shot (or period) auction
where each carrier submits a single sealed bid and the shipment is awarded to the carrier
with the lowest bid, but the winning bidder gets paid the second-lowest bid and the other
bidders do not get or pay anything (21). A Vickrey auction guarantees that the shipment
will always be awarded to the carrier with the lowest service cost for that shipment
(assuming rational carriers that are profit maximizers at each bid instance, with no look
ahead, i.e. ignoring the future) regardless of the beliefs of the participants about the
shippers or about other carriers. This is a consequence of a simple and remarkable result:
the optimal strategy in a Vickrey auction is for each carrier to bid his or her true cost

Figliozzi, Mahmassani and Jaillet 11
value for the shipment. The intuition and proof behind this result are detailed by Varian
(22) and Vickrey (21).
These characteristics of the Vickrey auction allow for a simple and elegant
treatment of carrier strategies since they render the tracking or updating of carrier beliefs
about the shippers or competitors essentially irrelevant. It allows all this in a simple one-
shot sealed bid auction avoiding bid iteration over time. When using a Vickrey auction it
is possible to concentrate on the effect that arrival rate and numbers of competing carriers
have on market performance without having to estimate the impact of carrier beliefs or
the search for optimal bidding strategies. This is what makes a Vickrey auction a good
starting point in the study of transportation marketplaces. The focus is on “transportation”
variables rather than on learning or rationality levels of the agents.
For added simplicity in the current implementation, it is assumed that all carriers
are identically implemented (in the simulation). Furthermore, it is assumed that carriers’
fleet assignment strategy is a simple heuristic that estimates the cost of serving a
shipment with the smallest cost of appending it to the shipment queue of each carrier’s
truck (but checking for feasibility, service must take place during the shipment time
window).
Other market setting characteristics include:
• Geographic Area : 1 by 1 unit square area
• Shipments Origin and Destination ≈ Uniformly distributed
• Shipment Type: Truckload movements only
• Shipments Reservation Price ≈ Uniformly distributed (0.5, 1.0)
• Shipment Time Window Length: 4 units of time + uniform (0.0, 4.0)
• Earliest Delivery Time = arrival time
• Latest Delivery Time = arrival time + Time window length
• Truck Speed : 1 (unit of distance/unit of time)
• Fleet size: 10 vehicles (constant) serving the market
As stated earlier, these are simple and stylized market settings and yet provide the
necessary features that capture the most important stochastic elements of the problem:

Figliozzi, Mahmassani and Jaillet 12
stochasticity of reservation prices, origin and destinations, time windows, and
competitors’ bids and costs.
The parameters to be varied include:
• Number of Carriers: 1, 2, 5, or 10 with fleet sizes of 10, 5, 2, and 1, respectively
• Poisson Arrival Rate: from 8 to 20 shipments per unit of time (very uncongested
to extremely congested conditions)
Results and Insights
Though these numerical results depend on the experimental design parameters
considered, they also provide initial insight into the performance of these kinds of
marketplaces. The results were obtained from 30 simulations including 10,000 shipments
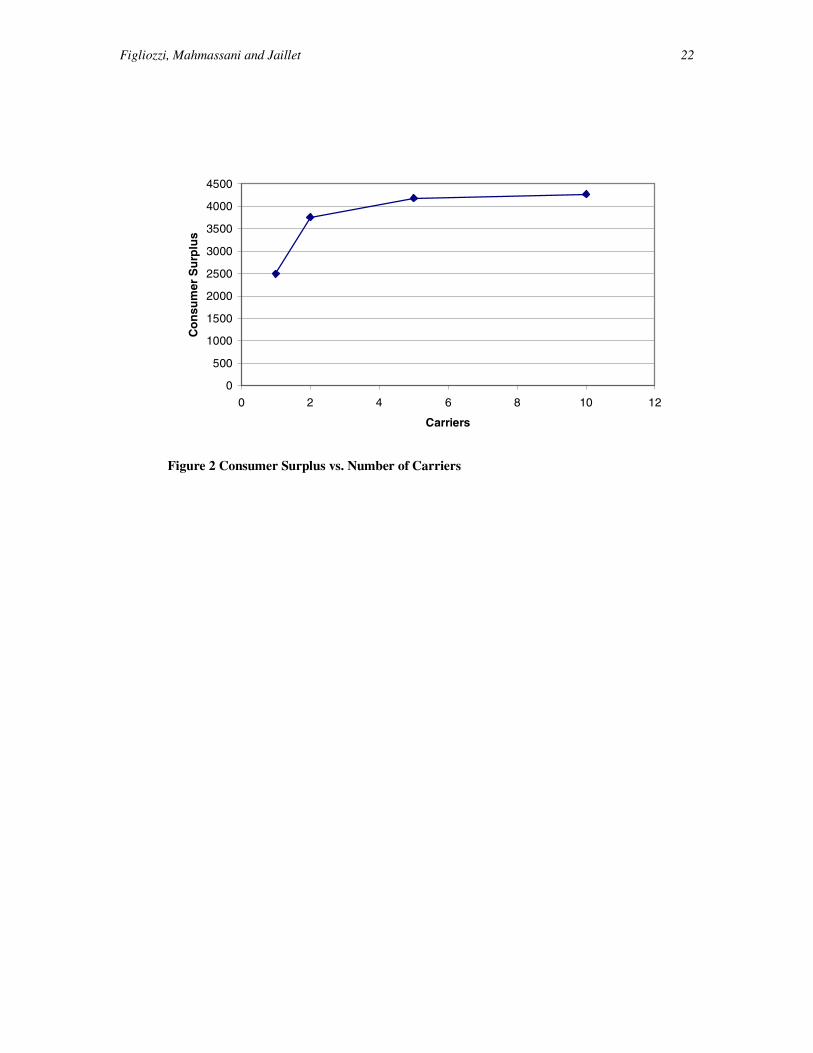
each. As expected, the number of carriers has an important effect on the consumer
surplus of shippers (Figure 2). Clearly, competition affects consumer surplus at a
decreasing rate. Keeping a constant total fleet size of 10 vehicles, the consumer surplus
(calculated as the accumulated reservation price minus the price paid to the winning
carrier) begins to taper between 2-4 carriers. Carrier profit decreases as the number of
carriers increases, and similarly to consumer surplus, it also tapers out. Consumer surplus
and carrier profit will even out at around the same point, 2-4 carriers, because with a
Vickrey auction carrier profits and consumer surplus are complementary; in other words,
holding all parameters constant but varying the number of carriers, the sum of carriers’
profits and consumer surplus is a constant. The consumer surplus for the case of one
carrier corresponds to the case when shippers can set a ceiling to the amount to be paid to
the carrier. Obviously there is a degeneracy problem since there is no second bid (to
determine what the winner gets paid). The sum of the consumer surplus and carrier
profits must add up to a known number, but each value cannot be determined without
further assumptions.
The price of bids won remains consistent regardless of the number of carriers
(Figure 3). However, there is a variation in the price of bids lost. When more carriers
enter the system, it is on average for the second lowest cost carrier more costly to pick up
an additional shipment since the fleets are smaller and hence the price higher.

Figliozzi, Mahmassani and Jaillet 13
Carrier profit will reach a peak near full fleet utilization. This occurs at an arrival
rate near 15 for the system being examined (Figure 4). The number of won bids for the
carries evens out and the number of infeasible shipments increases exponentially for
arrival rates higher than 15 (Figure 5).
Figure 6 shows how consumer surplus and total welfare also tapers as the system
approaches capacity. The slight increase in total welfare is due to an increase in carrier
profits; as the arrival rate increases, it is easier to find feasible shipments that can be
added to the end of the existing queues of shipments for each truck (Figure 7). Most of
the surplus goes to the carrier, given that the second price will be very high or non-
existing. This results from the infeasibility of the competitors when the market is under
high arrival rates.
Higher insertion costs also explain why empty distance and the price of the
winning bid increase with the arrival rate (Figures 8 and 9). However the average loaded
distance decreases because there is a higher probability of appending shorter shipments at
the end of the trucks’ shipment queues (while maintaining feasibility).
CONCLUSIONS
The complex interaction of shippers and carriers through auction marketplaces
(virtual hubs) may alter logistic networks in the medium term, and the way infrastructure
and equipment are used and operated in the long term. A simulation framework was used
to explore the complex engineering and economic processes that arise in a transportation
marketplace, which are difficult to explore using standard analytical or statistical tools.
Four different levels of analysis were explored: interaction patterns, interaction
behaviors, welfare outcomes, and service levels. This framework blends concepts and
tools from fleet management, evolutionary economics, game theory, and learning and
cognitive science, in a manner that enables:
(a) Development of a test bed for the testing, refinement, and extension of dynamic
pricing, bidding, and fleet assignment strategies;
(b) Study of the performance and evolution of different market settings; and

Figliozzi, Mahmassani and Jaillet 14
(c) Understanding of the connections relating structure, behavior, and
welfare outcomes in markets comprised of boundedly-rational agents who
learn imperfectly from the past

Figliozzi, Mahmassani and Jaillet 15
ACKNOWLEDGMENTS
This study was supported by a grant from the National Science Foundation, Program:
NSF 00-42, Award Number: CMS-0085691. The authors would like to acknowledge
the contribution of Jessica Wang in conducting the simulations and preparing the
graphical output. The content of the paper remains solely the responsibility of the
authors.
REFERENCES
1. Regan, A.C., H.S. Mahmassani and P. Jaillet (1995). Improving efficiency of commercial vehicle operations using real-time information: potential uses and assignment strategies. Transportation Research Record, 1493: 188-198. 2. Malone, T., Yates, J., and Benjamin, R.., Electronic markets and electronic hierarchies: effects of information technology on market structure and corporate strategies. Communications of the ACM, Vol. 30, No 6, pp 484-97, 1987. 3. Clemmons, E. K., and Reddi, S. P., Some propositions regarding the role of information technology in the organization of economic activity, Proceedings 26th HICSS, Vol IV: Collaboration Technology and Organizational Systems and Technology, IEEE Computer Society Press, Los Alamitos, CA, pp 809-818, 1993 4. Holland, C. P. and Lockett, G., Strategic choice and interorganizational information systems, Proceedings 27th HICSS, Vol IV: Collaboration Technology and Organizational Systems and Technology, IEEE Computer Society Press, Los Alamitos, CA, pp 809-818, 1994 5. Wolfe E. M., Wadewitz T. R., Combe C. G., e-gistics: How e-Commerce and the Supply Chain Click, June 2000, http://wpinter2.bearstearns.com/egistics/ , Accessed Oct. 10, 2000. 6. McAfee, R. Preston, and John McMillan , Auctions and Biddings, Journal of Economic Literature, Vol 25, pp 699-738, June 1987 7. Krishna, V, Auction Theory, Academic Press, 2002. 8. Cassady, Ralph, 1967, Auctions and auctioneering. Berkeley: University of California Press, 1967

Figliozzi, Mahmassani and Jaillet 16
9. Sashi, C.M., O’Leary B., The Role of Internet Auctions in the Expansion of B2B Markets, Industrial Marketing Management, Vol. 31, pp 103-110, 2002 10. Lucking-Reiley, D. and Spulber, D., Business-to-Business Electronic Commerce Journal of Economic Perspectives, vol. 15, no. 1, pp. 55-68, 2001 11. J. Tirole, The Theory of Industrial Organization, Cambridge: MIT Press, 1988 12. Martin, S., Advanced Industrial Economics, Blackwell Publishers, Cambridge, 1993. 13. Fudenberg, D. and Levine, D, The Theory of Learning in Games, MIT Press, 1998 14. Tesfatsion, L. Agent-Based Modeling of Evolutionary Economic Systems, 437-441, IEEE Transactions on Evolutionary Computation, Vol 5, N5, 2001 15. John Bower and Derek Bunn, Experimental analysis of the efficiency of uniform-price versus discriminatory auctions in the England and Wales electricity market, Pages 561-592, Journal of Economic Dynamics and Control, Vol. 25, 2001 16. Regan, A.C., H.S. Mahmassani and P. Jaillet, Dynamic decision making for commercial fleet operations using real-time information, Transportation Research Record, 1537, pp. 91-97, 1996 17. Powell, W. B., A Stochastic Formulation of the Dynamic Vehicle Allocation Problem, Transportation Science, Vol 20, pp 117-129, 1986 18. Bertsimas, D.J., Jaillet, P., and Odoni, A.R., A priori optimization, Operations Research, Vol. 36, No. 6, pp. 1019-1033, 1990 19. Jaillet, P., Priori solution of a traveling salesman problem in which a random subset of the customers are visited, Operations Research, Vol 36, No 6, pp. 929-936, 1988. 20. Mahmassani, HS; Kim, Y; Jaillet, P, Local Optimization Approaches To Solve Dynamic Commercial Fleet Management Problems, Transportation Research Record1733, pp 71-79, August 2000 21. Vickrey, W., Counterspeculation, auctions and competitive sealed tenders. Journal of Finance, Vol. 16, pp 8-37, 1961 22. Varian, H., Economic Mechanism Design for Computerized Agents, in Usenix Workshop on Electronic Commerce, New York, 1995.

Figliozzi, Mahmassani and Jaillet 17
Figliozzi, Mahmassani and Jaillet 18
List of Tables
Table 1 Market Settings ................................................................................................................................19 Table 2 Overview of Agents Functions.........................................................................................................20 List of Figures Figure 1 Overview of Carrier Operations in an auction marketplace............................................................21 Figure 2 Consumer Surplus vs. Number of Carriers .....................................................................................22 Figure 3 Average Prices of Bids (per carrier) vs. No. of Carrier ..................................................................23 Figure 4 Average Fleet Utilization vs. Arrival Rate .....................................................................................24 Figure 5 Shipments Served vs. Arrival Rate .................................................................................................25 Figure 6 Consumer Surplus and General Welfare vs. Arrival Rate ..............................................................26 Figure 7 Carrier Profit vs. Arrival Rate.........................................................................................................27 Figure 8 Empty and Loaded Distance vs. Arrival Rate.................................................................................28 Figure 9 Average Price Bids Won vs. Arrival Rate ......................................................................................29

Figliozzi, Mahmassani and Jaillet 19
1. Commodities Traded
• Shipments • Cargo capacity • Spot / Long term market • Swapping / reselling / speculation
2. Decision Making Process / Bidding Resolution • Centralized • Decentralized • Hybrid
3. Information Sharing Policies • About competitors’ past bids • About competitors’ fleet status • About fulfilled shipments or bids processes (resolute shipments) • Number of competitors watching or bidding • About shipments reservation price. • About carriers endowments: fleet and crew size • Ex-ante vs. ex-post availability of information • Perfect Public Information • About competitors’ fleet management and bidding strategies • About competitors’ beliefs
4. Auction Design • First Price Sealed Bid Auction • Second Price Sealed Bid Auction • English Auction • Dutch Auction • Double Auctions • Combinatorial Auctions
5. Commitment of players • Firm commitment at all times for any submitted bid • Bidding with given commitment duration • Bidding is allowed (Not allowed) while the results of previous bids are still unknown • Flexible commitment (shippers-carriers) • Bid firm for a small time window Conditional bidding (Shipment bundling or combinatorial auctions)
6. Modal / Geographic Setting • TL, LTL Services • Ocean, Rail, Air Services • Intermodal • Urban, Intercity, International Freight • Geographic Shape, origin-destination areas • Arrival rates
Table 1 Market Settings and Dimensions

Figliozzi, Mahmassani and Jaillet 20
Agent Function
Market Agent
1. Linkage and communication between carriers and shippers
2. Bidding processing 3. Bid Awarding 4. Track statistics of performance data
Carrier
1. Gathering, storing and processing information 2. Updating beliefs
a. about shippers b. about carriers c. about my service costs and fleet management
3. Estimating expected utilities 4. Bidding submission 5. Fleet management 6. Track statistics of performance data
Shipper 1. Generate stream of arrivals and shipment attributes 2. Track statistics of performance data
Table 2 Overview of Agents Functions
Figliozzi, Mahmassani and Jaillet 21
Figure 1 Overview of an auction marketplace
Bidding Strategy
Bidding Outcomes
Fleet Assignment
Updating Beliefs
New Demand
Associated attributes: •Equipment required •Time window •Location •etc
•Associated attributes: •Auction type •Information Available •Competitors •etc
System Settings
•Associated attributes: •Reserv. Prices •Competitors bidding •Competitors costs • etc
Carrier Beliefs
Fleet Status
Associated attributes: •Accepted Loads •Vehicle Locations •etc
Shippers Marketplace Real Time Info
Figliozzi, Mahmassani and Jaillet 22
0
500
1000
1500
2000
2500
3000
3500
4000
4500
0 2 4 6 8 10 12
Carriers
Co
nsu
mer
Su
rplu
s
Figure 2 Consumer Surplus vs. Number of Carriers

Figliozzi, Mahmassani and Jaillet 23
.
0
0.1
0.2
0.3
0.4
0.5
0.6
0.7
0 2 4 6 8 10 12
No. of Carriers
Pri
ce
Price Won Bids
Price Lost Bids
Figure 3 Average Prices of Bids (per carrier) vs. No. of Carrier

Figliozzi, Mahmassani and Jaillet 24
0
0.2
0.4
0.6
0.8
1
1.2
5 7 9 11 13 15 17 19 21 23
Arrival Rate
Fle
et U
tiliz
atio
n
Figure 4 Average Fleet Utilization vs. Arrival Rate

Figliozzi, Mahmassani and Jaillet 25
0
1000
2000
3000
4000
5000
6000
0 5 10 15 20 25
Arrival Rate
Sh
ipm
ents
Served Shipments
Expensive Shipments
Infeasible Shipments
Figure 5 Shipments Served vs. Arrival Rate

Figliozzi, Mahmassani and Jaillet 26
0
500
1000
1500
2000
2500
3000
3500
0 5 10 15 20 25
Arrival Rate
Co
nsu
mer
Su
rplu
s
2 Carrier System
5 Carrier System
10 Carrier System
General Welfare
Figure 6 Consumer Surplus and General Welfare vs. Arrival Rate

Figliozzi, Mahmassani and Jaillet 27
0
200
400
600
800
1000
1200
1400
0 5 10 15 20 25
Arrival Rate
Car
rier
Pro
fit
2 Carrier System
5 Carrier System
10 Carrier System
Figure 7 Carrier Profit vs. Arrival Rate

Figliozzi, Mahmassani and Jaillet 28
0
0.1
0.2
0.3
0.4
0.5
0.6
5 10 15 20 25
Arrival Rate
Ave
rag
e D
ista
nce
per
Sh
ipm
ent
Ser
ved
Empty Distance
Loaded Distance
Figure 8 Empty and Loaded Distance vs. Arrival Rate

Figliozzi, Mahmassani and Jaillet 29
Figure 9 Average Price Bids Won vs. Arrival Rate
0.2
0.21
0.22
0.23
0 5 10 15 20 25
Arrival Rate
Pri
ce