a framework for pro- environmental … · initial scoping through to more detailed consumer...
TRANSCRIPT
A FRAMEWORK FOR PRO-ENVIRONMENTAL BEHAVIOURS
REPORT
January 2008
www.defra.gov.uk

Department for Environment, Food and Rural Affairs Nobel House 17 Smith Square London SW1P 3JR Tel: 020 7238 6000 Website: www.defra.gov.uk © Crown copyright 2007 Copyright in the typographical arrangement and design rests with the Crown. This document/publication is value added. If you wish to re-use, please apply for a Click-Use Licence for value added material at: http://www.opsi.gov.uk/click-use/value-added-licence-information/index.htm Alternatively applications can be sent to: Office of Public Sector Information Information Policy Team St Clements House 2-16 Colegate Norwich NR3 1BQ Fax: 01603 723000 Email: [email protected] Information about this publication and copies are available from: Behaviours Unit Business Resource Efficiency and Consumers Division Defra Ergon House 5th Floor C/o Nobel House 17 Smith Square London, SW1P 3JR Email: [email protected] This report has been prepared by a new environmental behaviours unit established in Defra. The roles of the unit are to assemble, analyse and translate evidence related to pro-environmental behaviours and to work within Defra and with external stakeholders to improve the design and implementation of policy interventions aimed at helping individuals and communities live more environmentally sustainable lifestyles. This document is available on the Defra website. Published by the Department for Environment, Food and Rural Affairs
CONTENTS PAGE EXECUTIVE SUMMARY 3
CHAPTERS
1. AIMS AND OBJECTIVES 13
2. PRINCIPLES AND APPROACHES 18
3. BEHAVIOUR GOALS 24
4. RESEARCH EVIDENCE BASE 28
5. SEGMENTATION 41
6. IMPLICATIONS FOR POLICY 47
7. DELIVERY 65
8. EXTENDING THE EVIDENCE BASE 70
9. CONCLUSIONS 74
10. SUPPLEMENT: SEGMENT PROFILES (i)
ANNEXES [separate documents]
A. Long list of behaviours B. Trend indicators C. Calculation of household impacts, current uptake, willingness D. Maps of current policy E. Best practice principles F. Segmentation methodology G. Headline results from 2007 survey of public attitudes and
behaviours H. Executive summary from synthesis of qualitative research I. Stakeholder input (April stakeholder forum) J. Participants at April forum K. Bibliography
1

2

EXECUTIVE SUMMARY
This report sets out a framework for Defra’s work on pro-environmental behaviour. It pulls together evidence on public understanding, attitudes and behaviours; identifies behaviour goals; and draws conclusions on the potential for change across a range of behaviour groups. It is designed to support policy development and implementation in Defra, in other Government Departments and externally. The ultimate aim is to protect and improve the environment by increasing the contribution from individual and community action. This will come in particular from moving towards more sustainable patterns of consumption, covering the purchase, use and disposal of goods and services. The scope of this report therefore includes:
• the main consumption clusters of food and drink, personal travel, homes and household products, and travel tourism;
• environmental behaviours across all the environmental sectors, including climate change, air quality, water quality, waste, biodiversity and protection of natural resources, taking account of our global footprint;
• consideration of a wide range of possible interventions. The report concentrates primarily on behaviours which will have an impact on carbon savings and therefore link to climate change mitigation. The report recognises that there may also be other environmental behaviours we wish to promote where carbon savings are not the primary or secondary purpose (i.e. behaviours that enhance biodiversity). Further work is required on identifying and prioritising such behaviours which will have a positive impact on the natural environment.
3

We have broadly followed a social marketing methodology, moving from the initial scoping through to more detailed consumer insight, segmentation and strategy. The evidence base includes an extensive programme of research commissioned by Defra (listed in box 1 of the report) as well as other external material (referenced in annex K). Overview of behaviours framework
Principles/approaches
BehavioursEvidence Segmentation
Translation (of research), insight, analysis, option development
Sectoral policies, e.g. energy eff, food, waste
Cross-cutting actions, e.g. Act on CO2, capacity building
Partnerships (public, private, 3rd sectors)
Refine aims and objectives, creative development, testing
Monitoring and evaluation, further research, piloting
Implementation
4

Our principal focus has been on a set of 12 headline behaviour goals, selected after a process of stakeholder engagement, to identify a range of low/high impact and easy/hard behaviours some of which could potentially engage large numbers of people and others which would be more appropriate for targeting particular population groups. The headline goals have been drawn from a longer list of 30 goals spanning most areas of environmental policy. They will be reviewed again at the end of 2008. The headline behaviour goals1
- Install insulation - Better energy management
- Install microgeneration
- Increase recycling - Waste less (food)
- More responsible water usage
- Use more efficient vehicles - Use car less for short trips
- Avoid unnecessary flights (short haul)
- Buy energy efficient products- Eat more food that is
locally in season - Adopt lower impact diet
Personal Transport Homes: waste
Homes: energy
Homes water
Eco-products
Research commissioned by Defra has enabled us to update and improve our understanding of the current baseline – showing how many people consider they are already acting on these behaviours. We can compare this take-up against the relative impact of the behaviours (expressed in kgs of CO2; the calculation of impact at a typical household level requires several assumptions – which are explained in the report – but they help to give a relative guide).
1 Given the very modest impact of the local/seasonal food goal, we will explore whether it would be better to replace this with another goal from the long list
5
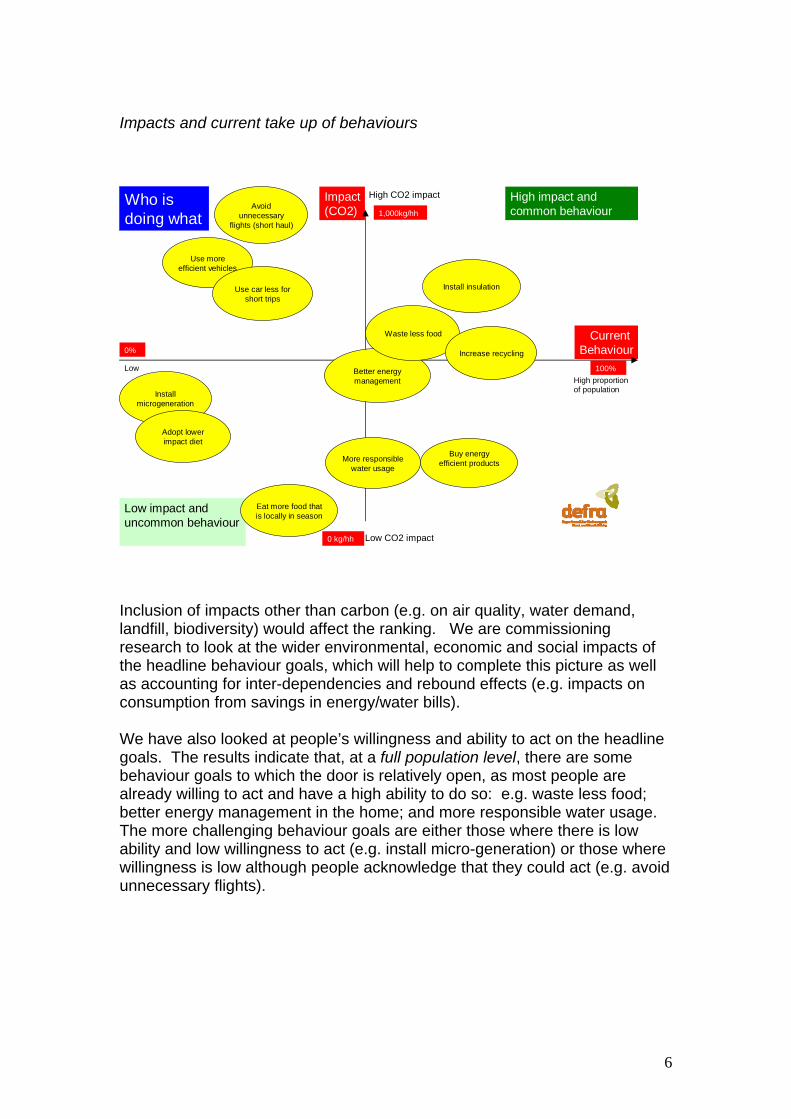
Impacts and current take up of behaviours
Current Behaviour
Impact(CO2)
High impact and common behaviour
Low impact and uncommon behaviour
Who is doing what
Use more efficient vehicles
Better energy management
Install insulation
Waste less food
Increase recycling
Use car less for short trips
Install microgeneration
Adopt lower impact diet
Eat more food that is locally in season
High CO2 impact
Low CO2 impact
High proportionof population
Low
Avoid unnecessary
flights (short haul)
Buy energy efficient productsMore responsible
water usage
0%
100%
0 kg/hh
1,000kg/hh
Inclusion of impacts other than carbon (e.g. on air quality, water demand, landfill, biodiversity) would affect the ranking. We are commissioning research to look at the wider environmental, economic and social impacts of the headline behaviour goals, which will help to complete this picture as well as accounting for inter-dependencies and rebound effects (e.g. impacts on consumption from savings in energy/water bills). We have also looked at people’s willingness and ability to act on the headline goals. The results indicate that, at a full population level, there are some behaviour goals to which the door is relatively open, as most people are already willing to act and have a high ability to do so: e.g. waste less food; better energy management in the home; and more responsible water usage. The more challenging behaviour goals are either those where there is low ability and low willingness to act (e.g. install micro-generation) or those where willingness is low although people acknowledge that they could act (e.g. avoid unnecessary flights).
6

People’s willingness and ability to act
Willing to Act
Ability to Act
High ability and willing
Low ability and unwilling
Who is willing to do what
Avoid unnecessary flights (short
haul)
Buy energy efficient products
Install insulation
Increase recycling
Use car less for short trips
Install microgeneration
Adopt lower impact diet
Eat more food that is locally in season
High
Low
Low
Waste less food
Use more efficient vehicles
More responsible water usage
Better energy management
100%
0%
High proportion of population
We have looked further into the motivators and barriers related to these goals. Whilst motivators and barriers vary across population groups and may change over time according to life stage and other individual circumstances, it is nonetheless possible to identify a number that are relatively common across the public. Common motivators include: ‘feel good factor’; social norm; individual benefits (e.g. health, financial outlay); ease; being part of something. Common barriers include: external constraints (infrastructure, cost, working patterns, demands on time); habit; scepticism; disempowerment. Lifestyle fit and self identity can be a potential motivator or barrier, depending on where people are starting from. Whilst the above describes our understanding at the broad population level, a segmented approach would make it easier for government to tailor its approach for specific groups. We can identify the issues and opportunities, based on our understanding of each segment’s attitudes, barriers, motivations and current behaviours. It means, for example, we understand which groups are most sceptical about their behaviour contributing to climate change or where most people are already actively seeking to influence their friends and family to be more environmentally friendly.
7

Defra’s environmental segmentation model divides the public into seven clusters each sharing a distinct set of attitudes and beliefs towards the environment, environmental issues and behaviours. The model is the outcome of an extensive three stage research process (desk research; qualitative research; and quantitative research) alongside wider engagement activities. It is based on people’s responses to a broad range of attitudinal questions as part of the 2007 Defra attitudes and behaviours survey. The model includes detailed profiles of each segment covering, for example ecological worldview, sociogeodemographics, lifestyle, attitudes towards behaviours and current behaviours, motivations and barriers, and knowledge and engagement. The seven population segments
Willing to Act
Ability to act High potential and willing
Low potential and unwilling
Segment willingness and ability
1: Positive greensI think it’s important that I do as much as I can to limit my impact
on the environment.18%
High
Low
HighLow
7: Honestly disengaged
Maybe there’ll be an environmental disaster, maybe not. Makes no difference to me, I’m just living life the way I want
to.18%
6: Stalled startersI don’t know much about
climate change. I can’t afford a car so I use public
transport.. I’d like a car though.
10%
5: Cautious participantsI do a couple of things to help the environment. I’d really like to do more, well as long as I
saw others were.14%
2: Waste watchers‘Waste not, want not’ that’s
important, you should live life thinking about what you are
doing and using.12%
3: Concerned consumers
I think I do more than a lot of people. Still, going away is
important, I’d find that hard to give up..well I wouldn’t, so carbon off-
setting would make me feel better.14%
4: Sideline supportersI think climate change is a big problem for us. I know I don’t
think much about how much water or electricity I use, and I forget to turn things off..I’d like to do a bit
more.14%
The above graph plots each segment against their relative willingness and ability to act. In addition we can provide an indication of the relative acceptability of each of the headline behaviours by segment (below). It is apparent that segments 1, 2 and 3 offer the most potential in terms of their ability to act, though there are very different motivations and barriers, particularly for segment 2 who is less willing to act to be more environmentally friendly at least. Segment 4 is more willing to act though currently relative beginners in terms of their behaviours. Segment 5’s willingness to act is informed by their concerns about others’ actions. Segment 6 and 7 are least willing to act.
8
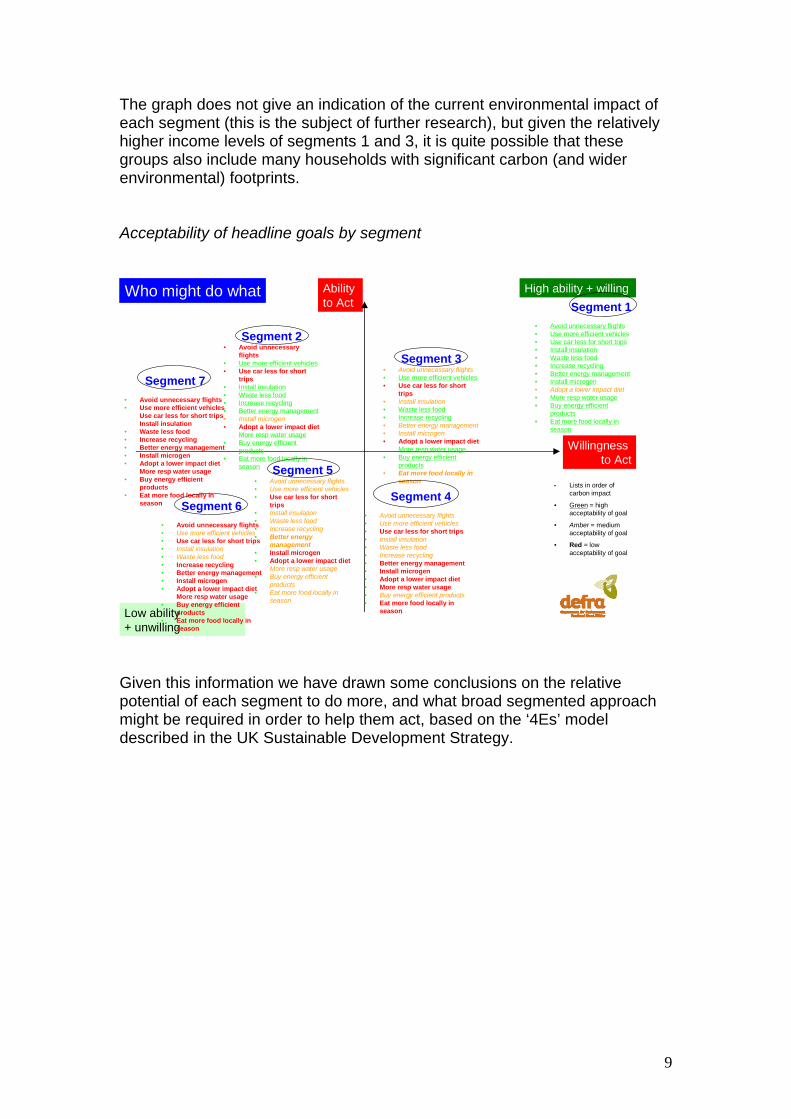
The graph does not give an indication of the current environmental impact of each segment (this is the subject of further research), but given the relatively higher income levels of segments 1 and 3, it is quite possible that these groups also include many households with significant carbon (and wider environmental) footprints. Acceptability of headline goals by segment
Willingness to Act
Ability to Act
High ability + willing
Low ability
Who might do whatSegment 1
• Avoid unnecessary flights
Segment 2
• Use more efficient vehicles
g+ unwillin
• Use more efficient vehicles• Use car less for short trips
• Avoid unnecessary flights
• Use car less for short trips
• Install insulation• Waste less food• Increase recycling• Better energy management• Install microgen• Adopt a lower impact diet• More resp water usage• Buy energy efficient
products• Eat more food locally in
season
• Install insulation• Waste less food• Increase recycling• Better energy management•• Adopt a lower impact diet
Install microgen
More resp water usage• Buy energy efficient
products• Eat more food locally in
season
Segment 3• Use more efficient vehicles • Avoid unnecessary flights
• Use car less for short trips
• Install insulation• Waste less food• Increase recycling• Better energy management• Install microgen• Adopt a lower impact diet
More resp water usage • Buy energy efficient
products• Eat more food locally in
season
Segment 4••••••••••••
Segment 5•••
•
••
Segment 7••
•••••
•
•
Segment 6•••••••••
•
•
Avoid unnecessary flights Use more efficient vehicles
Install insulationWaste less foodIncrease recycling
Buy energy efficient products
Avoid unnecessary flights Use more efficient vehicles
Install insulationWaste less food
• Increase recyclingBetter energy management
More resp water usage Buy energy efficient productsEat more food locally in season
Use more efficient vehicles
Install insulationWaste less food
Use car less for short trips
Better energy managementInstall microgenAdopt a lower impact dietMore resp water usage
Eat more food locally in season
Use car less for short trips
•
•
Install microgenAdopt a lower impact diet
•
•
Avoid unnecessary flights Use more efficient vehicles Use car less for short trips Install insulationWaste less food Increase recycling Better energy managementInstall microgenAdopt a lower impact diet More resp water usage Buy energy efficient productsEat more food locally in season
Avoid unnecessary flights
Use car less for short trips
Increase recycling Better energy managementInstall microgenAdopt a lower impact diet More resp water usage Buy energy efficient products Eat more food locally in season
• Lists in order of carbon impact
• Green = high acceptability of goal
• Amber = medium acceptability of goal
• Red = low acceptability of goal
Given this information we have drawn some conclusions on the relative potential of each segment to do more, and what broad segmented approach might be required in order to help them act, based on the ‘4Es’ model described in the UK Sustainable Development Strategy.
9

Segmented strategy
Willing to Act
Potential to do more
High potential and willing
Low potential and unwilling
Potential to do more, and how
1:Positive greens
High
Low
HighLow
7: Honestly disengaged
6: Stalled starters
5: Cautious participants
4: Sideline supporters
Encourage
Exemplify
Encourage Engage
Enable
Enable
Enable
2: Waste watchers
3: Concerned consumers
At this strategic level the segments fall into three broad types:
• Segments 1, 3 and 4 are relatively willing to act and have relatively high potential to do more. Segment 1 are already active, but, because of their commitment and strong pro-environmental beliefs, are prepared to do more; segment 3 have less conviction in their environmental views and are less active than segment 1, though being environmentally friendly fits with their self-identity and they are willing to do more; segment 4 have similar pro-environmental beliefs to segment 1, though they are relative beginners with environmental behaviours and very willing to do more, in at least some areas of their lives. The emphasis here should be on interventions that enable and engage, for example enabling by tackling external barriers (such as information, facilities and infrastructure – applies to all segments) and engaging through communications, community action, targeting individual opinion leaders.
• Segments 2 and 5 need different approaches to encourage them to be more environmentally friendly. Segment 2 are already active, though driven by a motivation to avoid waste, high concerns about changes to the UK countryside and have concerns about other countries not acting. Others acting (individuals, countries and government) is more critical for segment 5. Whilst they are more dependent on behaviours becoming the norm before they will act and more embarrassed to be green, segment 5 are willing to do more. The emphasis here should be
10

on interventions that enable, encourage and, in particular, exemplify, for example providing fiscal incentives or businesses and government leading by example.
• Segments 6 and 7 are generally less willing to act and are less likely to be open to voluntary engagement or exemplification by others; the emphasis here is likely to have to be on interventions that enable and encourage, for example choice editing in product availability or, where necessary, regulation.
Success in encouraging segment 1 to do more may also help encourage 3 and 4, given the higher numbers in group 1 seeking to influence others and that this is a broader group than ‘deep greens’. It is likely that motivating segments 1, 3 and 4 to adopt more environmentally friendly behaviours will help interventions to encourage segment 5. Apart from considering the implications of the behaviours framework for each segment, we have also considered policy implications by behaviour goal, based on the consumer research, and a number of cross cutting themes (derived from the Sustainable Consumption Roundtable’s ‘I will if you will’ report). Some important themes include: Use the mandate for action: in terms of public understanding and attitudes, there is a mandate for government to take action – not to force radical changes in people’s current lifestyles so much as to help “green” those lifestyles and reduce their overall negative impacts, for example in terms of investment in the provision of more sustainable energy and transport services or in the “choice editing” of products. Focus on behaviour: whilst radical lifestyle changes are unlikely, there is nonetheless scope to make significant progress against most of the headline behaviour goals. The research again confirms the influence of personal recommendations and face to face contact in encouraging the adoption of new behaviours such as better energy management or take up of more sustainable products. Put products at the centre: notwithstanding issues about cost, the demand for and availability of high quality greener products is key and some themes emerge for interventions in this area. Whilst it is recognised that information is inadequate on its own, it clearly has an important role as part of a package of supporting measures, for example not only helping consumers but also procurers to make more sustainable choices. Collective action: there is a need for more visibility to be given to the actions which government and business are already taking. Consistency of high-level messages (and campaign brands) should help – for example through more coalitions with and between mass membership organisations, widespread adoption of the “Act on CO2” brand, and concentration on just a couple of issues/behaviours at any one time.
11

Widen the mandate: there is a role for government - or advisory bodies such as the Sustainable Development Commission - to play in continuing to explore the boundaries of the current mandate, for example stimulating policy debate on well-being, travel, consumerism, trade-offs between energy policy options and lifestyles, or personal carbon trading. As might have been expected there is no one silver bullet but a multiplicity of actions needed to support greener lifestyles, confirming the need for packages of mutually supporting measures. In most cases we are quite likely to require combinations of top down mass engagement, some targeting of key segments (or groups within those segments), partnering with other public, private or 3rd sector bodies, or community-based action. This framework can help with the design of all of these possible interventions, better and more co-ordinated implementation and the evaluation of effectiveness. It is intended not only to support Defra’s work on environmental behaviours, but to provide an open and shared resource for all interested stakeholders. Next steps will be to:
• Disseminate the environmental behaviours framework across Defra and delivery partners at national, regional and local scales;
• Work with key partners to identify new opportunities for partnership working, for example embedding the framework within Defra’s 3rd sector strategy;
• Provide advice and support to a range of priority projects where there is a strong consumer dimension, including the Act on CO2 campaign, energy and water efficiency, the food chain programme, personal carbon trading, incentives for waste minimisation and recycling, product road maps, sustainable tourism;
• Continue to strengthen the evidence base, including the 07/08 programme of research, development of a proposal for a Research Centre on sustainable behaviours, piloting new approaches and evaluating community level interventions, strengthening the natural environment content;
• Review progress, including the selection of headline goals, by end 2008.
12

CHAPTER 1: AIMS AND OBJECTIVES Purpose of report This report sets out a framework for Defra’s work on pro-environmental behaviour. It pulls together evidence on public understanding, attitudes and behaviours, identifies behaviour goals, and draws conclusions on the potential for change across a range of behaviour groups. The report is designed to support policy development and implementation in Defra, in other Government Departments and externally. The focus is therefore on capturing the big picture – setting the broad social marketing framework – rather than working up the detail of any one programme or project. But by doing this we aim to help identify priorities, establish common principles and approaches and identify opportunities for specific, cross-cutting or systems based solutions, all based on a much stronger evidence base of behaviour research and consumer insight. The ultimate aim is to protect and improve the environment by increasing the contribution from individual and community action. This will come in particular from moving towards more sustainable patterns of consumption, covering the purchase, use and disposal of goods and services. The framework will contribute to the achievement of Defra’s two new Public Service Agreements, on securing a healthy natural environment for today and the future and leading the global effort to avoid dangerous climate change.2 This report builds on an initial scoping report (“An environmental behaviours strategy for Defra”, December 2006) which reviewed the scale of the challenge, current practice and understanding; explored a possible conceptual framework for a more structured approach; identified a long list of environmental behaviours and possible set of headline behaviours; initiated work on segmentation and considered a range of policy actions. We have updated and refined the initial scoping work by commissioning a programme of qualitative and quantitative research the results of which are presented here (and in the annexes and supporting documents) and through a process of stakeholder consultation and deliberation. An overview of the methodology is provided in figure 1 – the focus of this report therefore being on the second phase of our work running from January to September 2007. Whilst this report presents a framework based on our best understanding at this moment, it is important to stress that we are describing a complex and dynamic process which will require continuous learning and adaptation over the longer term rather than setting a fixed or inflexible strategy. A challenge
2 Progress against these agreements is measured through a set of indicators, including UK greenhouse gas emissions, air quality, biodiversity and the marine environment
13

for Defra – and for its delivery partners – will be in creating the right conditions (people, skills, tools) to respond to this evolving picture. Scope The scope of this report includes:
• the main consumption clusters of food and drink, personal travel, homes and household products, and travel tourism;
• environmental behaviours across all the environmental sectors, including climate change, air quality, water quality, waste, biodiversity and protection of natural resources, taking account of our global footprint;
• consideration of a wide range of possible interventions.
The report concentrates primarily on behaviours which will have an impact on carbon savings and therefore link to climate change mitigation. There may also be other environmental behaviours we wish to promote where carbon savings are not the primary or secondary purpose (eg such as behaviours that enhance biodiversity). Further work is required on identifying and prioritising such behaviours which will have a positive impact on the natural environment. We have broadly followed a social marketing methodology, moving from the initial scoping through to more detailed consumer insight, segmentation and strategy. This approach has been broadly welcomed by stakeholders, recognising the value of the open evidence base as a shared resource. Chapter 2 offers an updated set of principles and approaches drawing on the available evidence; chapter 3 describes the long list of behaviour goals and set of headline goals; chapter 4 summarises our understanding of consumer attitudes and behaviour; chapter 5 describes the environmental segmentation model and the linkage between population segments and potential behaviours, barriers and motivators; chapter 6 sets out implications for policy organised by cross-cutting theme, population segments and headline behaviour goal; chapter 7 sets out how this framework will be implemented, in particular working across government and with stakeholders; chapter 8 outlines next steps in strengthening the evidence base; chapter 9 draws some headline conclusions. Given the magnitude of the subject matter, this report provides only a relatively brief summary of the behaviour change evidence base and framework. Further supporting material is contained in the set of annexes, the Defra commissioned research reports (box 1) and other relevant material, referenced in the bibliography (annex K). Apart from Defra itself, this report is also aimed at policy makers and marketing advisers in government, other public sector, and stakeholders in the private and third sectors who are interested in supporting greener lifestyles. Its conclusions and recommendations – and more particularly the under-
14
pinning research – should be of interest to the wider research community in the UK and to some extent beyond. The report draws heavily on a wide range of evidence and expert advice. In particular we would like to acknowledge the input of the Sustainable Consumption Roundtable, Green Alliance (who organised stakeholder workshops on behaviour goals and interventions), and the many organisations represented at the scoping workshops (listed in annex A to scoping report) and at the stakeholder forum in April 07 (annexes I and J).
15

Box 1: Defra Research Base3
Research commissioned to directly contribute to this work includes:
1. Defra Survey of Public Attitudes and Behaviours Toward the Environment, 2007 (BMRB)
2. Public Understanding of Sustainable Finance and Investment, 2007 (Ipsos-Mori) 3. Public Understanding of Sustainable Consumption of Food, 2007 (Opinion Leader
Research) 4. Public Understanding of Sustainable Energy Consumption in the Home, 2007 (Brook
Lyndhurst) 5. Public Understanding of Sustainable Leisure and Tourism, 2007 (University of Surrey) 6. Public Understanding of Sustainable Transport, 2007 (Scott Wilson) 7. Synthesis Review of Public Understanding Reports, 2007 (Policy Studies Institute) 8. Defra Segmentation Report Qualitative Research, 2006 (Define Research) 9. Innovative Approaches to Sustainable Consumption and Production, 2007 (Social
Marketing Practice) 10. Environmental Action Fund (EAF): A Review of Sustainable Consumption and
Production Projects. Interim Report, 2007 (Brook Lyndhurst) Wider Defra commissioned research and consultation which has informed this report includes: Behaviour Change: A series of practical guides for policy makers and practitioners, 2006 Climate Change Citizens' Summit, 2007 (Opinion Leader Research)
16
3 Defra published reports are available through the Defra Website at http://www.defra.gov.uk/corporate/publications/default.htm Wider research informs research evidence base. This is detailed further in the Bibliography at Annex L.
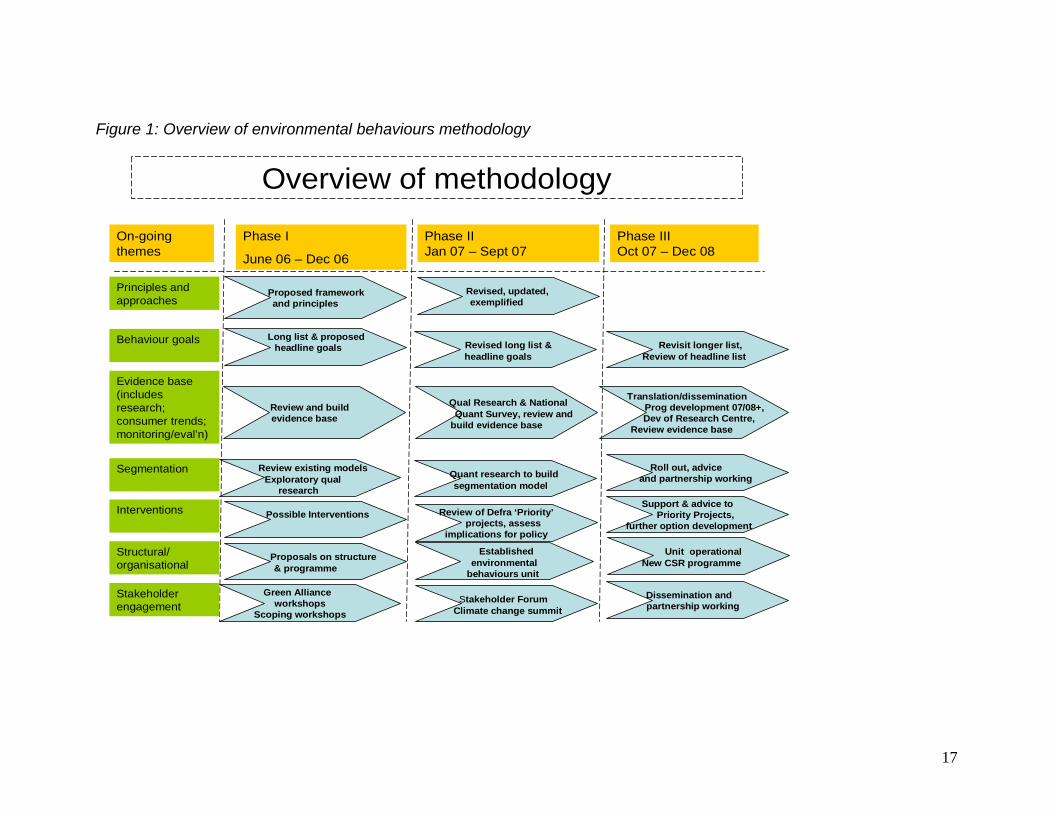
Figure 1: Overview of environmental behaviours methodology
Overview of methodology
Proposed frameworkand principles
Phase I
June 06 – Dec 06
Principles and approaches
Behaviour goals
Evidence base(includes research; consumer trends; monitoring/eval’n)
Segmentation
Interventions
Structural/ organisational
Stakeholder engagement
Revised, updated, exemplified
Phase IIJan 07 – Sept 07
Phase IIIOct 07 – Dec 08
Dissemination and partnership working
Review existing modelsExploratory qual
research
Possible Interventions
Proposals on structure& programme
Green Alliance workshops
Scoping workshops
Long list & proposedheadline goals Revised long list &
headline goals
Unit operationalNew CSR programme
Quant research to build segmentation model
Review of Defra ‘Priority’projects, assess
implications for policy
Established environmental
behaviours unit
Stakeholder Forum Climate change summit
Translation/disseminationProg development 07/08+, Dev of Research Centre,
Review evidence base
Revisit longer list,Review of headline list
Roll out, advice and partnership working
Support & advice to Priority Projects,
further option development
Review and build evidence base
Qual Research & National Quant Survey, review and
build evidence base
On-going themes
17

CHAPTER 2: PRINCIPLES AND APPROACHES The challenge As consumers – of food and drink, personal travel, home and household products and travel tourism – we are accountable for a large proportion of the UK’s environmental pressures, including pressures arising outside the UK. For example, households account for 42% of carbon emissions from energy use (including private car use) 50% of public water supply and 15% of controlled waste. In addition indirect emissions and other environmental effects (such as on wildlife and the wider health of ecosystems, e.g. timber, fish stocks) occur during the production of other goods and services that we consume, whether they are produced in the UK or in other countries. The sum of our individual behaviours can also often have less obvious or expected environmental impacts. For example, the paving over gardens across England has led to the decrease of an important habitat for urban biodiversity (e.g. in London alone, an area of gardens the size of Hyde Park has been lost in this way). Whilst there are some encouraging signs of changes towards more sustainable consumption patterns, for example reflected in increased “ethical” spend, the overall picture is of pressures increasing, due principally to rising incomes and smaller households. These are off-set only in part by improvements in product quality and efficiency (figure 2, and annex B for other relevant trend data). There is widespread consensus that government, business and individuals need to act together to tackle climate change and the depletion of natural resources – expressed by the Sustainable Consumption Roundtable as “I will if you will”. There is perhaps less consensus over the extent to which this can be done within the context of people’s current lifestyles (for example designing out inefficient products) or whether more fundamental lifestyle changes are required. Unsurprisingly, however, most of our consumer research points to the need for pro-environmental behaviours to fit within people’s current lifestyle, even if one might aim for more fundamental shifts over the longer term. It also emphasises the need to develop interventions with an understanding of current lifestyles (and life-stages) for different population groups.
18

Figure 2: some trends in household energy use and transport4
Domestic CO2 emissions, energy consumption and consumption expenditure, 1990 to 2005
Domestic CO2
emissions*
Household final consumption expenditure
Domestic energy
consumption
1990 Baseline
80
90
100
110
120
130
140
150
160
1990
1991
1992
1993
1994
1995
1996
1997
1998
1999
2000
2001
2002
2003
2004
2005
Inde
x
(199
0 =
100)
Car and taxi km, GB: 1990 - 2005
9095
100105110115120
1990
1991
1992
1993
3
1994
1995
1996
1997
1998
1999
2000
2001
2002
2003
2004
2005
inde
x 19
90=1
00
Source: Department forTransport
km
Passengers uplifted by UK airlines from UK airports: 1995 - 2005
020
4060
80100
120
1995 1996 1997 1998 1999 2000 2001 2002 2003 2004 2005
mill
ions
International: Domestic:
4 Air passenger data from Dft; energy data from AEA Energy and Environment, BERR, ONS
19

The approach As in the initial scoping report, our strategy needs to be about more than behaviour “change”. In practice we need to have a broad approach that includes the ways in which positive behaviours are adopted in the first place as well as how they can be maintained and reinforced over time. We should view behaviour formation and behaviour change as dynamic processes that evolve over time rather than being simple on-off switches. Based on the social marketing theory, our strategy therefore needs to address:
• Behaviour formation and establishment; • Behaviour maintenance and reinforcement; • Behaviour change; • Behaviour controls.
A five point summary of recommended approaches for Defra is given in box 2. This builds on the framework proposed by the Sustainable Consumption Roundtable as well as input from stakeholders on the kind of role they would like to see Defra play. Figure 3 shows how packages of various interventions might work together as a behavioural “roadmap”. Figure 3: a roadmap for environmental behaviours
USE THE MANDATE WIDEN THE MANDATE
INFORMATION/EDUCATION/TOOLS
MINIMUM STANDARDS
TAX PENALTIESGRANTS
CHOICE EDITING
INFRASTRUCTURE
FISCAL INCENTIVES/REWARD
LABELLING
LEADING BY EXAMPLE
DISCOURAGE THE BAD
ENCOURAGE THE BEST
SUSTAINABILITY
TAKE UP
INNOVATION
DEBATE
SUPPORT THE BETTER
20
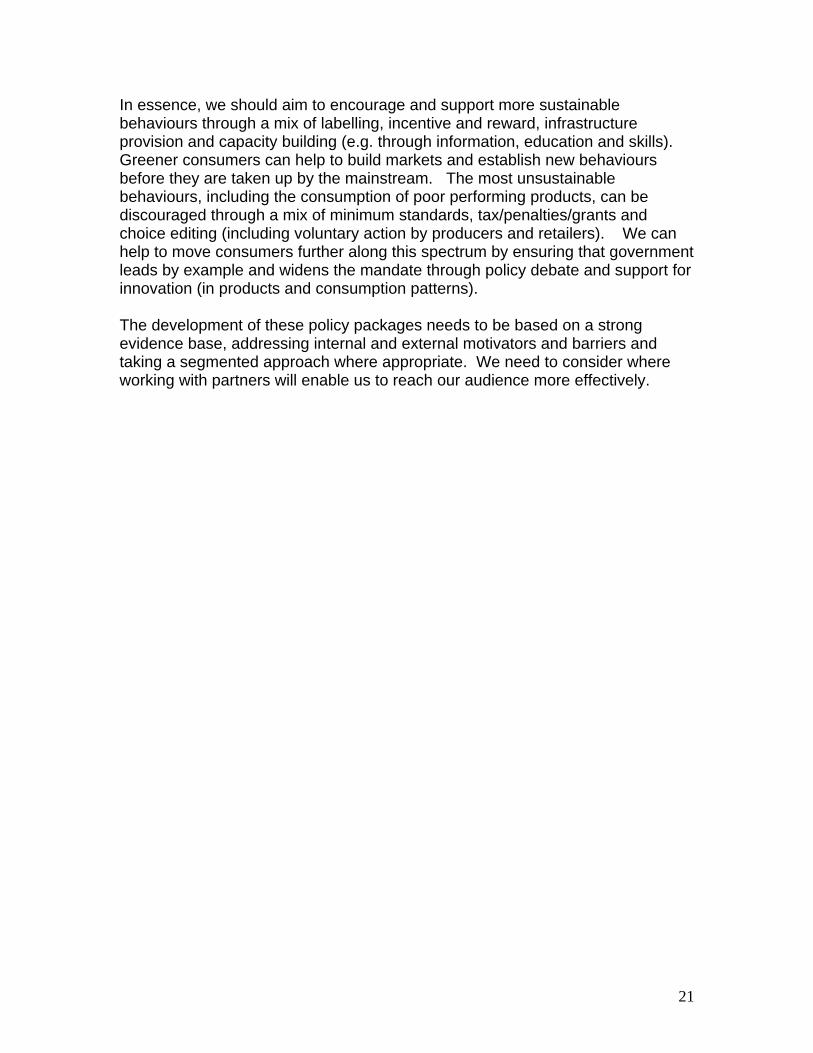
In essence, we should aim to encourage and support more sustainable behaviours through a mix of labelling, incentive and reward, infrastructure provision and capacity building (e.g. through information, education and skills). Greener consumers can help to build markets and establish new behaviours before they are taken up by the mainstream. The most unsustainable behaviours, including the consumption of poor performing products, can be discouraged through a mix of minimum standards, tax/penalties/grants and choice editing (including voluntary action by producers and retailers). We can help to move consumers further along this spectrum by ensuring that government leads by example and widens the mandate through policy debate and support for innovation (in products and consumption patterns). The development of these policy packages needs to be based on a strong evidence base, addressing internal and external motivators and barriers and taking a segmented approach where appropriate. We need to consider where working with partners will enable us to reach our audience more effectively.
21

Box 2 : Recommended approaches (for Defra) to encourage pro-environmental behaviours
(1) use the mandate for action
• We need to demonstrate urgency and magnitude, responding to expectations of commensurate action by Government and business.
• Government needs to lead by example, and to be more visible. • An environmental behaviours strategy needs to be seen as a long term commitment, e.g. 10-20 years, but
with some short term deliverables.
• There isn’t a one size fits all single solution: we need to allow for a mix of top down and bottom up approaches, using packages of measures and taking a systems approach.
(2) focus on behaviour
• Policy action needs to be rooted in an understanding and awareness of consumer behaviour. A set of best practice principles is set out in box 3 and in more detail at annex E.
• We need to establish a strong evidence base. • We need to target people in lifestyle settings and stages. • We need to promote a range of behaviours as entry points in helping different groups to make their lifestyles
more sustainable – including catalytic (or “wedge”) behaviours if identified through research. (3) put products and services at the centre
• Government and business should be more prepared to intervene up-stream and “choice edit” in order to remove the most unsustainable products and services from the market place.
• By using life-cycle analysis, product roadmaps will help clarify understanding of where intervention is best
applied, including stimulating the demand side. We need to ensure a strong link between the consumption and production sides of our work so that they are truly complementary.
(4) build collective action
• We need to show people they are part of something bigger and part of a collective movement, spanning the public sector, business and the third sector and establishing new social norms.
• Defra can provide an aligning hub and supportive framework for collective progress – providing coherence
through the evidence base; clarity on behaviour goals and targeting; and clear and consistent high level messaging, but not micro-managing or stifling innovation.
(5) widen the mandate
• We need to treat sustainable consumption and environmental behaviours as a spectrum along which we can move towards more sustainable patterns of living.
• We need to be prepared to engage people and businesses openly on the more difficult issues and to create
pathways towards big potential solutions, involving policy think tanks, institutes, opinion leaders etc .
22

Box 3: Checklist of best practice principles for a pro- environmental behaviours framework
The big picture 1. There is no single solution that will motivate a mainstream audience to live a greener life. It requires multiple, integrated interventions. 2. Draw on all the interventions available to you. Develop an intervention mix combining tools from across the policy and communications spectrum. 3. Build an understanding of the public and societal trends. Consider public attitudes, beliefs, motivations, barriers, and current and desired behaviours. Review your options for interventions against these insights. Use key insights and segmentation models to develop targeted approaches. 4. Understand the behaviours you are asking people to adapt or adopt. Tackling habits, lifestyle choices or purchasing behaviours may need different tactics. 5. Be clear what your organisation/programme can do as well as what others are doing. Consider the role of government, business and the public. 6. Work across sectors in designing and implementing programmes - evidence shows this makes interventions more successful. 7. Accept that outcomes of behaviour change interventions are difficult to predict; we need to take risks and pilot activity. 8. Recognise securing behaviour change is a long term process not a single event. 9. Demonstrate consistency. The specifics 10. Address both internal and external motivations and barriers. 11. Optimise common motivations and barriers. Use non-environmental motivations. 12. Recognise the role of social norms, identity, and status for moving towards greater adoption of pro-environmental behaviours 13. Use ‘opinion leaders’ and trusted intermediaries to reach your audience. 14. Recognise the value in joining up environmental issues for people, as well as joining up organisations’ work and messages. 15. Give feedback on progress made. Consider when we can ask people or organisations to make commitments to being more pro-environmental.
23

CHAPTER 3: BEHAVIOUR GOALS The number of specific actions people can undertake to help the environment and “green” their lifestyles can easily run to several hundred, as witnessed by the growing number of “how to save the planet” books. However, there is general agreement between government and its stakeholders (and supported by the recommendations of the Sustainable Consumption Roundtable) that we collectively need to focus on a more limited set of behaviour goals for the purposes of public policy and marketing and communications. A clearer focus would help to reduce some of the current confusion over conflicting and competing messages about what people can or should do as well as establishing a baseline against which progress could be assessed. To do all this, we first carried out an exercise within Defra to map the main pro-environmental behaviour goals sought through public policy and make an initial assessment of their impact against feasibility. The latest version of the long list is contained in annex A. The goals have been organised into five behaviour groups5, which in turn can be mapped on to the main consumption clusters identified by the Sustainable Consumption Roundtable of food and drink, personal travel, homes and household products, and travel tourism. Most goals have carbon savings as either a primary or secondary purpose, but there are also other goals focused in particular on protection of natural resources and biodiversity where there is no clear carbon saving. All remain important, and some goals on the long list may additionally have greater traction with some population groups than those appearing on the headline list. They may therefore have their place in more targeted interventions. Further work is needed in identifying and prioritising these other behaviours. The next step was to work with Green Alliance to review the long list and refine it down to a shorter set of “headline” goals6. This was managed through a series of stakeholder workshops (principally made up of civil society organisations and Defra delivery bodies and including Defra staff) conducted in autumn 2006. Attendees discussed and agreed a set of criteria for prioritising the goals:
• Specificity; • Environmental benefit; • Measurability; • Consideration for public acceptability; • Timescale;
5 Energy efficiency/usage in the home; waste and recycling; water efficiency/usage in the home; personal transport; purchase of eco-friendly products 6 Green Alliance, 2006. Achieving a step-change in environmental behaviours. Report to Defra
24

• Catalysing effect. This meant that the recommendations intentionally covered a spectrum of behaviour types (e.g. habitual lifestyle and occasional purchase), low-high impact and low-high feasibility/acceptability, with in effect some goals being relatively accessible to the majority of the population and others of more interest to committed groups. The resulting set were felt to be the best match of impact and feasibility – for example some relatively lower impact behaviours were included as they were seen to have wider potential uptake and could be a means of engaging new groups. With those behaviours that were perceived to be more ‘difficult’ the focus was on where we could start and how we could develop a progressive path towards the goal (for example, it was envisaged that the primary focus of activity to encourage people to eat a lower impact diet would be working with the Department of Health and the Food Standards Agency). It was recognised that this was a field where public opinion and perceptions were changing and this was an opportunity – as the Sustainable Consumption Roundtable proposed – both to use the current mandate for action and to help widen it over the longer term. The results of the assessment are described in figure 4 below, showing how the recommendations relate to the Defra long list (see also annex A). Figure 4 : Long list of behaviours, showing Green Alliance recommended headline behaviours [* shows final headline goals ]
Tackle Energy Efficiency In the
Home
Tackle Water Efficiency In the
Home
Seek Alternative
Transport for Short Trips
<3miles
Avoid Short-haul domestic and intra-EU
flights
Use Low Carbon Vehicles
Buy Local & Seasonal Food (certified) where
possible
Rely less on animal
protein
Waste Less Food
Have a household env audit
Personal Transport: Travel more responsibly,
cut reliance on car
In the Home: Energy Efficiency/Energy
Usage
In the Home (& Garden): Water Efficiency
Buy more Eco-friendly Products
In the Home (& Garden): Waste: Reduce, Re-use, Recycle and Compost
Avoid unnecessary flights*
Use car less-short trips*
Travel less/share
Drive more economically
Buy energy efficient
products*
Install insulation*
Switch heating system
Micro-gen*
Energy efficient homes (new)
Green tariff
Better energy management in
home*
Install water efficient products
Better water management
*
Eat more food locally in
season etc.*
Use food labelling
Lower impact diet*
High impact commodities (domestic)
Household products
Sustainable timber
Plant for wildlife
Buy durable products
Less packaging
Re-use / repair
Waste less (food)*
Home compost
Increase Recycling:
segregation*
InsulateInstall micro generation
Green Alliance’s 9 Headline Behaviours
Defra’s 5 Priority Behaviour Groups (with goals)
Buy energy efficient
appliances
Install a smart energy
meter
Install a water meter
Buy more energy efficient
vehicles*
Certified fish
Energy efficient homes (old)
High impact commodities
(int’l)
25

The Green Alliance recommendations were adopted as our proposed headline goals in the initial scoping report, with several modifications. The goal of “less animal protein” was expanded to “adopt a lower impact diet”; an additional goal on recycling was added; and goals on using smart metering and audits were omitted (on the basis that they are interventions designed to achieve the outcome of better energy/water management, rather than behavioural goals in themselves; but this is not to ignore their obvious importance in supporting greener behaviours). With one possible exception, we recommend maintaining the current set of headline goals (table 1) at least for the next 12 months. Our recent research – which has focused mainly on the headline set – has confirmed the spectrum of ease/difficulty whilst lending more precision to the understanding of impact over public willingness and ability to act, with some clear distinctions between population segments. This means that the goals can work both for mass engagement activities as well as more targeted interventions towards particular groups. For example, the goal relating to microgeneration is unlikely to be applicable for many households other than higher income early adopters (or possibly tenants in public or housing association property). Whilst the marginal abatement cost is substantially higher than for the other goals, it may nonetheless be seen by some consumers as enhancing property value and providing a highly visible expression of their environmental concerns or act as a valuable community scale measure. The exception is whether the goal on local/seasonal food should be retained as a headliner, given its modest CO2 and biodiversity impacts compared with all the other headline goals. One possibility, which could be taken up with the original Green Alliance stakeholder grouping, would be to exchange it with one of the goals from the long list. We propose to re-visit the long list and selection/definition of headline behaviours by the end of 2008 in order to check their continued validity and whether any priorities need to be adjusted7. It should also be pointed out that in order to be made more operational these headline goals will need to say more about target group(s) and the degree of take-up which is considered feasible over and above the current baseline. Nor are they consumer-facing messages in themselves, since they are focused on describing a behavioural outcome rather than appropriate and engaging language.
7 It should be noted for example that the stakeholder forum organised by Defra in April 2007 expressed concerns about new car purchases and the marketability of lower impact diets as an environmental goal.
26

Table 1: Headline behaviour goals CONS. CLUSTER
BEHAVIOUR GROUP
BEHAVIOUR BEHAVIOUR TYPE
Homes Energy efficiency/usage in the home
Install insulation products One-off purchasing decision
Homes Energy efficiency/usage in the home
Better energy management and usage8
Habitual everyday lifestyle
Homes Energy efficiency/usage in the home
Install domestic micro-generation through renewables
One-off purchasing decision
Homes Waste and recycling
Increase recycling and segregation
Regular everyday lifestyle
Food Waste and recycling
Waste less (food) Habitual everyday lifestyle
Homes Water efficiency/usage in the home
More responsible water usage9
Habitual everyday lifestyle
Transport Personal transport Buy/use more energy efficient (low carbon) vehicles
Occasional purchasing decision; Habitual everyday lifestyle
Transport Personal transport Use car less – seek alternatives for short trips (<3 miles)
Habitual everyday lifestyle
Tourism Personal transport Reduce non-essential flying (short haul)
Occasional lifestyle decision
Homes Purchase of eco-friendly products
Buy energy efficient products Occasional purchasing decisions
Food Purchase of eco-friendly products
Eat food locally in season10 Habitual purchasing
decisions
Food Purchase of eco-friendly products
Adopt diet with lower GHG/env impacts
Habitual everyday lifestyle
8 Would include metering and audit 9 Would include metering 10 This goal may be substituted by one of the goals from the long list in annex A
27

CHAPTER 4: RESEARCH EVIDENCE BASE What behavioural models tell us People’s reasons for doing what they do are multiple and complex; behavioural models11 map these elements, showing the interactive nature of the many foundations and causes of observable behaviour. Models also help us to understand where there is scope to influence people towards more pro-environmental behaviour: which causes of behaviour are fundamental to a person’s life and will require deep and repeated interventions to change (e.g. habits, social identity, values); which rely on a swing in social behaviour (social norms); and which are locked-in behaviours through the built world, financial constraints or day to day lifestyles which will, for example, require a re-think of working patterns, building design or community. It is clear from such evidence that any approach to influence behaviour must incorporate multiple, interactive interventions, focusing both on the internal and external causes of behaviour. What research says about people and their environmental attitudes It is well reported that for many people there is a gap between their high level of concern about the environment and their actions – the value action gap. Research findings also show that there is widespread awareness of environmental problems and that the majority of people recognise that their everyday behaviours contribute to these. Many people are willing to do a bit more to limit their environmental impact, yet people have a much lower level of understanding about what they can do and what will make a difference. For example:
• 93% of people say they know something about climate change, and nearly half say they know something about carbon footprints12;
• 73% claim that they are aware of environmental problems but not solutions and, beyond using less, people do not know what actions they can take to help13;
• 63% agree that if things continue on their current course we will soon experience a major environmental disaster.Two thirds think humans will find ways of overcoming the environmental problems, one in five think it
11 See for example, Jackson, T. 2005. Motivating Sustainable Consumption, Report to SDRN . 12 Defra attitudes and behaviours survey, 2007 (BMRB) 13 Climate Group, 2006
28

will be scientists that find solutions without people making big changes to their lifestyle and a similar number think it is too late to do anything about climate change; 14
• Just 11% of UK consumers think that there is too much concern with the environment. 62% of UK adults agree that they have become more environmentally aware over the last 12 months; 15
• While nearly a quarter do not think their behaviour contributes to climate change, about 60% of people think they are doing quite a few things, or more, to be environmentally friendly. More than half said they would like to do a bit more to help the environment. 16
Box 4: The Defra 2007 Survey of Public Attitudes and Behaviours Toward the Environment
The Defra Survey of Public Attitudes and Behaviours Toward the Environment was conducted with approximately 3,600 individuals in England during spring 2007. The survey covered attitudes and knowledge in relation to the environment; transport; energy and water efficiency; recycling; and purchasing. The data were collected on behalf of Defra by the British Market Research Bureau (BMRB) through face-to-face interviews lasting on average 51 minutes. Additional research on biodiversity, animal welfare, and wellbeing was carried out through an omnibus survey of approximately 1,700 individuals. This survey follows on from previous environmental surveys run by Defra and its predecessors in 1986, 1989, 1993, 1996-7 and 2001. A short summary of headline findings is at Annex G. Full results can be found at: http://www.defra.gov.uk/environment/statistics/pubatt/index.htm
Current behaviours and scope for change Defra’s attitudes and behaviours survey 2007 (see also box 4) provides new evidence on people’s current behaviour and the scope for change according to how willing and able individual households are to act on the various behaviour goals (discussed in Chapter 3). These data inform the baseline of how many
14 Defra attitudes and behaviours survey, 2007 (BMRB) 15 Henley Centre Headlight Vision, 2006. Trends data. 16 Defra attitudes and behaviours survey, 2007 (BMRB)
29

people are currently acting on each of the headline behaviours so that changes can be tracked over time. It is reported across environmental and non-environmental behaviours research that some people’s responses are affected by their sense of what is socially acceptable, such as what they think they should do or most people do, leading for example to over-claiming or agreement with a number of statements which can be contradictory. Whilst we cannot rule this effect out, we have sought to minimise the possibility of this through questionnaire development and we think it is unlikely to impact on the relative positioning of uptake of specific behaviours.17 High impact behaviours The graph at figure 5 shows that some high impact behaviour goals (walk or cycle for journeys <3miles; avoid unnecessary flights) are currently claimed by only about one third of the population. The most common, high impact behaviour goal is installing insulation where more than two-thirds of those with cavity walls say that they have some cavity wall insulation. There is further take up of other types of insulation with 9 in 10 households saying they have at least one of double or secondary glazing, loft insulation, hot water tank insulation or cavity wall insulation (where they have cavity walls)18. In addition to this evidence, installing (or improving) insulation in the home was found the most accessible behaviour goal19, partly because it is a common and therefore normative behaviour and also because it is known to reduce energy bills. Yet alongside this we know that there are deep barriers relating to time and hassle, as well as initial costs, that hinder levels of uptake of insulation products. Behaviours in the home and habitual behaviours With smaller, habitual energy and water management behaviours, nearly two thirds of respondents say they never leave the TV on standby overnight and their mobile phone chargers plugged in, with about half saying they never leave lights on in rooms when they are not in them. However about one fifth say they always leave the TV on standby overnight and a similar proportion that they always leave the tap running when brushing their teeth and take a bath rather than a shower. The lowest levels say they never throw away food (15%). Comparison with the 2001 Defra survey showed that the proportion of people saying that they recycle paper, glass and plastic has doubled in the last 6 years.
17 This includes using multi-directional attitude statements, asking respondents what they think other people do, and assessing some behavioural levels using more than one method. We believe that over-claiming is unlikely to impact on the ordering of uptake for particular behaviours or those behaviours to which different groups are more open. We also compare findings with the same and related questions asked in different surveys and different years to compare directional trends and relative positioning. 18 Defra attitudes and behaviours survey, 2007 (BMRB). 19 Brook Lyndhurst. 2007. Public Understanding of Sustainable Energy Use in the Home. Report to Defra
30

eight in ten now feel people have a ‘duty’ to recycle (which is a gradual increase year on year from 200320) and nearly two thirds feel that ‘waste not, want not’ sums up their general approach to life. About half would favour a system that rewarded them if they recycled everything they could and penalised those who did not, with about a quarter opposing it. It was not necessarily the heavier recyclers who supported such a measure, as some people seemed generally opposed to top-down government-led interventions that ‘forced’ people to be more environmentally friendly. The three top reasons given for not recycling more were the same as those given in 2001 (already recycle all I can; no doorstep collection; and nowhere to store the material). However, the proportion of people citing lack of access to facilities had reduced from nearly one quarter in 2001 to just 8% in 2007. Purchasing behaviours Research shows there is potential for increasing environmentally friendly purchasing and particularly purchases of energy efficient products21. Nearly half say they would be prepared to pay more for environmentally friendly products (a year on year increase from 200322), with nearly one third disagreeing. Two thirds say they would only buy appliances with high energy efficiency ratings even if it cost more23. When asked why they did not buy more environmentally friendly products, nearly half cited high costs, with about one in ten saying they were not available or that there was not enough labelling. Interestingly, it seemed it was those groups that were already buying more environmentally friendly and certified/assured products that wanted more labelling. Research also indicated a concern surrounding the performance of environmentally friendly products based on a remembered experience before such products were substantially improved in more recent times24. Individuals were asked if they had heard of a number of certified and/or assurance schemes for different products and whether they made an effort to buy them. Eight in ten had heard of Fair Trade and about half of these said they made an effort to buy them. Over one third of people had heard of timber certified by the Forest Stewardship Council or other timber from sustainable sources, though only a quarter of those said they made an effort to buy them. Over one third (38%) agreed that they made a point of checking where fruit and vegetables were grown before buying them and about half said they made an effort to buy things from local producers. 20 HCHLV and BMRB survey trend data, 2003-2006 21 Opinion Leader Research. 2007. Public Understanding of Sustainable Consumption of Food. Report to Defra Brook Lyndhurst. 2007. Public Understanding of Sustainable Energy Use in the Home. Report to Defra 22 HCHLV and BMRB, 2003-2006 23 Defra attitudes and behaviours survey, 2007 (BMRB) 24 Brook Lyndhurst. 2007. Public Understanding of Sustainable Energy Use in the Home. Report to Defra
31

Current behaviour The graph at figure 5 represents the proportions of people already saying they are acting on the set of behaviour goals, the baseline, 25 in comparison with the behaviour’s impact. For example, it can be seen that a relatively high proportion of people (more than two thirds) say they are already recycling and segregating and have cavity wall insulation installed (out of those homes with cavity walls), whilst at the other end of the spectrum less than 1% currently have microgeneration. Around half the population say they are taking action to manage their energy and water use more responsibly. The impact of each goal has been calculated for a typical, but not average, household. This estimates the potential saving from a switch between a relatively high impact behaviour and a lower impact behaviour. For example, at the higher end, savings of around 700-1,000kg of CO2 could be achieved for households using the car less for short journeys, using more energy efficient vehicles, installing insulation or not taking one return flight to Spain. At the lower end eating more food that is locally in season could save around 10kg of CO2 assuming a 10% reduction in tonnes of food transported by air. It is important to note that the precise numbers depend heavily on the assumptions which must necessarily be made. However, the main purpose here is to look at relative rather than absolute impacts. Details of the calculations and assumptions (on impact, current uptake, willingness and ability) are presented in Annex C.
25 Based on Defra attitudes and behaviour survey, 2007 (BMRB)
32

Figure 5: Impacts and current take up of behaviours26
Current Behaviour
Impact(CO2)
High impact and common behaviour
Low impact and uncommon behaviour
Who is doing what
Use more efficient vehicles
Better energy management
Install Insulation
Waste less food
Increase recycling
Use car less for short trips
Install microgeneration
Adopt lower impact diet
Eat more food that is locally in season
High CO2 impact
Low CO2 impact
High proportionof population
Low
Avoid unnecessary
flights (short haul)
Buy Energy Efficient ProductsMore responsible
water usage
0%
100%
0 kg/hh
1,000kg/hh
Whilst figure 5 above represents the picture of how people say they are acting at the moment, of critical interest is how to develop a picture that maps the potential for change on to the headline behaviours. Behaviour goals were discussed in qualitative research commissioned by Defra across five key behavioural areas (food, energy, transport, leisure and tourism, and finance) in order to understand the acceptability of the various goals and how feasible people believed them to be27. Figure 6 below presents the behaviour goals but in this case it distinguishes between people’s ability and willingness to act and therefore provides an indication of the scope for change. People’s ability to act depends on mainly
26 We have presented information about the different population segments and headline behaviours in a graphical form throughout this report, in order to help illustrate current evidence, understanding and thinking. These are not precise numerical graphs, and illustrate relative positioning only. These graphical illustrations draw on data available to calculate approximate CO2 savings for different behaviour goals; self-reported attitudes and behaviours; and in depth focus group results.
27 Opinion Leader Research. 2007. Public Understanding of Sustainable Consumption of Food. Report to Defra Brook Lyndhurst. 2007. Public Understanding of Sustainable Energy Use in the Home. Report to Defra Ipsos-Mori. 2007. Public Understanding of Sustainable Finance and Investment. Report to Defra University of Surrey. 2007. Public Understanding of Sustainable Leisure and Tourism. Report to Defra Scott Wilson. 2007. Public Understanding of Sustainable Transport. Report to Defra Policy Studies Institute. 2007. A Synthesis Review of the Public Understanding Research Projects. Report to Defra
33

external constraints which enable or limit their actions: for example, living in a rural area with limited public transport service limits people’s ability to reduce car dependency; the upfront cost of installing insulation limits action of those on lower incomes. Goals which are positioned as very high ability are those where there are almost no barriers and therefore everyone should in theory be able to act: they are not dependant on access to services external to the home and have no negative cost implications (they are usually likely to save the household money). People’s willingness to act is more complex as it takes into account their internal response to the behaviour and their likely reaction to elements such as societal pressures (norms) surrounding a behaviour. The proportions estimated to be “willing” include respondents who have not thought about the behaviour but are at any rate not opposed – so to a large extent this represents a best case scenario. Figure 6: People’s willingness to act, against ability
Willing to Act
Ability to Act
High ability and willing
Low ability and unwilling
Who is willing to do what
Avoid unnecessary flights (short
haul)
Buy energy efficient products
Install Insulation
Increase recycling
Use car less for short trips
Install microgeneration
Adopt lower impact diet
Eat more food that is locally in season
High
Low
Low
Waste less food
Use more efficient vehicles
More responsible water usage
Better energy management
100%
0%
High proportion of population
This indicates that, at a full population level, there are some behaviour goals to which the door is relatively open, as most people are already willing to act and have a high ability to do so: e.g. waste less food; better energy management in the home; and more responsible water usage. The more challenging behaviour goals are either those where there is low ability and low willingness to act (e.g. install micro-generation) or those where willingness is low although people acknowledge that they could act (e.g. avoid unnecessary flights).
34

Motivators for and Barriers to Behaviour Goals Understanding people’s reasons for action or inaction requires a deep understanding of motivators and barriers related to the behaviour goals. Motivators and barriers vary across population groups (discussed further in chapter 5) and may change over time according to life stage and other individual circumstances. It is also the case that motivators for some people are the barriers that prevent action by others. Box 5: Commons motivators and barriers
Common motivators - A behaviour results in the ‘feel good factor’ or provides a sense of altruism and some social
currency o Over half of people said it was worth acting even if others do not – they are acting
as they think it is the right thing to do - and nearly half disagreed that the environment was a low priority in their life.
- New behaviours fit within current lifestyle and/ or are expected by society o Nearly half of people cited the need for any changes people made to fit with their
current lifestyle. - Individual benefits accrue from taking up the behaviour (e.g. improved health, lower
financial outlay, alleviates guilt) o More than half said they sometimes felt guilty about harming the environment.
- Behaviours are easy to do (perhaps facilitated through local authority schemes or grant funding)
- People understand why they are being asked to act and what difference their actions will make; people want to be ‘part’ of something
o About half said so many people are acting nowadays, it’s worth being environmentally friendly as it can make a difference.
Common barriers
- External, practical limits to choosing a certain behaviour (e.g. infrastructure limitations, financial constraints, working patterns, demands on time)
o 1 in 3 felt time was a barrier. 1 in 5 said it was only worth doing environmentally friendly things if it saved you money though about half said they’d be prepared to pay more for environmentally friendly products.
- Belief that taking on new behaviours will have a negative impact on current lifestyle (particularly time) and restrict current freedoms (particularly convenience).
- Habitual behaviour, apathy towards change and effort needed o 1 in 3 felt the difficulty of changing habits was a barrier and about 1 in 5 agreed
that effort was a barrier to doing more environmentally friendly things - Maintaining one’s self-identity and negative perceptions of ‘green’ lifestyles and products
o About one-third felt being green is an alternative lifestyle not for the majority - Scepticism around the climate change debate and distrust of both government and industry
o For example, about a quarter don’t believe their behaviour contributes to climate change.
- Disempowerment, as there is a disconnect between the size of the problem (Global Climate Change) and the individual’s contribution (e.g. turning off lights) and a sense that individuals cannot make a difference.
o About one third said it was not worth Britain acting, as other countries would cancel its actions out. More than half claimed if government did more, they would too.
35

Previously reported research28 relating to the motivations and barriers to action is extended with further evidence taken from Defra’s public understanding research series and survey on attitudes and behaviours. Box 5 above describes motivators and barriers that are found to be most common across the public and may therefore be suitable for use in policy or communications interventions to encourage pro-environmental behaviours. What research says about consumer expectations of government and business People have expectations of government and business action to tackle environmental issues. Findings from recent research point towards a number of areas where there is opportunity for progress29. There is an expectation that government should do more to tackle climate change, though levels of support vary for different types of intervention and there is little understanding of how much government is currently doing. People also assume that government and business ‘edit out’ certain consumer choices and indeed expect this to be happening. It is recognised that this is not about removing choice, rather enabling more pro-environmental choice so that the worst offending products for the environment are taken out of the market. Currently, people find it difficult to know which products are better for the environment and want government and business to make it easier to buy low impact products (about three-quarters say this according to recent Ipsos MORI research)30. People also note that some products (particularly food) are already ‘over-labelled’ and additional information presented in this way will not help their decision making31; conversely they stress the need for guidance and provision of information, particularly around major purchases such as electronic goods. There is an associated expectation that government will be regulating industry (manufactures, producers or retailers) to ensure all take their responsibility32. There is less overt support for legislation such as environmental taxes, whether through opposition to government-led top-down initiatives or suspicion of how the money will be used33, although some car users and flyers recognise they should bear the costs for the environmental damage their activity causes34. As the Sustainable Consumption Roundtable report highlighted35, such interventions need to be fair and have a similar impact on people regardless of income or
28 Environmental Behaviours Strategy for Defra, December 2006. 29 Policy Studies Institute. 2007. A Synthesis Review of the Public Understanding Research Projects. Report to Defra 30 Ipsos MORI, 2007. Tipping Point or Turning Point. 31 Opinion Leader Research. 2007. Public Understanding of Sustainable Consumption of Food. Report to Defra 32 Policy Studies Institute. 2007. A Synthesis Review of the Public Understanding Research Projects. Report to Defra 33 Policy Studies Institute. 2007. A Synthesis Review of the Public Understanding Research Projects. Report to Defra 34 Defra attitudes and behaviours survey, 2007 (BMRB) 35 Sustainable Consumption Roundtable. 2006. ‘I Will if You Will’. Report to Defra and Dti
36

geography. The way such policies are implemented can lead to big changes in public opinion, for example there was increased support for the London Congestion Charge post-implementation. The way government or business engages with people can also have an impact. Defra’s deliberative event on climate change included regional events, trialling environmental behaviours, information packs covering case studies, fact sheets, an overview of government activity, and a national event with the Secretary of State present (see box 6). There were positive changes in people’s attitudes towards climate change. Box 6: The Citizens’ Summit on Climate Change36
In May 2007 Defra hosted a citizens’ summit on climate change in order to explore the impacts of a deliberative engagement process on public attitudes and behaviour towards the environment in the context of the consultation process for the draft Climate Change Bill. Around 150 citizens (selected to be demographically representative of their region) were taken through a process of regional workshops; provision of information packs and a request for them to try out a range of pro-environmental behaviours; and the summit itself. The process demonstrated the impact of a combination of factual and emotive materials as well as people’s general desire to see Government taking a lead and ensuring greater consistency of action across the economy and internationally. Final polling at the close of the day again reinforced how the process had engaged and informed on the topic of climate change. Agreement with the phrase ‘I am well informed about climate change’ more than doubled, with two in three participants claiming to be well informed by the end. In addition, four out of five participants agreed that action needed to be taken urgently (82% compared with only 65% prior to the regional workshops) and those claiming to be personally making a lot of effort doubled from 31% before to 62% afterwards.
Most encouragingly however, was the change in attitudes over responsibility for tackling climate change. Prior to the regional workshops, just over half (56%) felt that the responsibility belonged to ‘all of us’. As the event closed, this figure had risen to 83%, an indication that the summit had been an effective tool in engaging and informing citizens of the need to make an urgent and collaborative effort to tackle climate change.
36 Opinion Leader Research. 2007. Defra – Citizens’ Summit on Climate Change. Report to Defra
37

Trust – in science, motives and being able to make a difference Trust, or rather mistrust, is a critical issue which is potentially a major barrier to people becoming more pro-environmental. It manifests in a number of ways but mainly as scepticism, cynicism, mistrust, confusion or disbelief. Disbelief around the science of climate change is one important element. The ongoing scientific debate is sometimes misunderstood by the public, or misrepresented in the media (a recent example being a documentary on Channel 4 – the Great Global Warming Swindle37). Recent Ipsos MORI research found that over half of respondents believed many leading experts still question if human activity is contributing to climate change38. However, a review of scientific publications found that of 928 papers, all authors agree that climate change is at least partially anthropogenic.39 The recent Defra survey found about one quarter did not think their behaviour contributed to climate change.Others think the effects of climate change are too far into the future to worry them(about one in five)
sts o
iduals.
40. Where there is no concrete agreement amongst scientiand other leading experts, people default to either ‘do nothing’ (i.e. no change tcurrent lifestyle) or to behaviours which suit them best as indiv Evidence suggests that there is a lack of trust in government, local authorities and industry relating to pro-environmental behaviour41. People are sceptical about the motives of each player, particularly where money is involved – e.g. government is suspected of ‘using’ the environment to increase general tax revenue; industry are perceived as having no reason to act unless environmental issues help them raise profits; local authorities are seen to be asking people to do more themselves while not reflecting this in lower council taxes. People believe that if the crisis were so serious then addressing climate change would be the subject of major government spending and profile and that government would be more pro-active in making businesses do more. Only about a quarter think the government is doing a lot to tackle climate change42. Of the issues that people thought government should be dealing with, environment was the fourth most commonly mentioned in 2007 (unchanged from 2001), behind crime, health and education43. There is also some disbelief about the scale of the actions people are being asked to undertake in relation to the magnitude of ‘global climate change’. People do not believe these small actions will have a significant effect on tackling climate change: this may be because of the small scale of the activity, or suspicion of what happens down the line (e.g. recycling, with the mistrust partly fuelled by some media stories of recycling going to landfill).
37 for ensuing debate see: http://www.channel4.com/science/microsites/G/great_global_warming_swindle/index.html 38 Ipsos MORI, 2007 Tipping Point or Turning Point, 39 Oreskes, N. 2004. Beyond the ivory tower: The scientific consensus on climate change. Science (3). 40 Defra attitudes and behaviours survey, 2007 (BMRB) 41 Policy Studies Institute. 2007. A Synthesis Review of the Public Understanding Research Projects. Report to Defra. 42 Defra Attitudes and Behaviours Survey 2007 (BMRB) 43 Defra Attitudes and Behaviours Survey 2007 (BMRB)
38

Consistency, leading by example and activities of others An additional challenge for government is in successfully demonstrating and explaining policy consistency across different government departments so as to avoid the risk of creating confusion and cynicism for some groups. For example, the Government’s support for targeted airport expansion has been perceived by some people to contradict with evidence on the climate change impacts of increased flying44. There is a similar challenge for celebrities, politicians and other experts, whom some perceive to be ‘jumping on the green bandwagon’45. This is partly due to the carbon impacts of these people’s lifestyles often being so much higher than average (e.g. frequent-flyers such as film and other celebrities supporting ‘Global Cool’46). People expect that when such groups ask others to make compromises in their life to reduce their impact on the environment, they should themselves be exemplifying pro-environmental behaviours across the board. Yet the recent focus has been to encourage consumers to start from where they can in their current lifestyle and build on this. In fact this can be assisted by spokespeople being honest about what they are doing and what they have changed, as well as what they are finding difficult. This has implications for the positioning of such groups and, indeed, wider pro-environmental consumer messaging from organisations. One of the key demotivators people articulate is that ‘others should act first’, with these others being any of individuals, government, business or countries; 60% of people said they would do more if government did too47. Whilst this may be little more than an excuse for some people, it is a commonly cited barrier, so should be considered and addressed. Whilst about half of people think that so many are environmentally friendly nowadays it can make a difference, about one third think it’s not worth acting if others don’t and similar levels think it’s not worth Britain acting if other countries don’t as they will cancel out what we do. Whilst any of these may be little more than an excuse for some people, for others it seems to be a genuine issue that needs to be addressed.
44 The Government's policy on sustainable aviation, set out in Future of Air Transport White Paper (2003) and subsequently reaffirmed, sets out a comprehensive strategy that balances the growing aspirations we have to travel and the need to protect the environment. The Government is committed to ensuring that aviation reflects the full costs of its climate change emissions and continues its strong support of international emissions trading as the most effective way of tackling the climate change impacts of aviation." 45 Policy Studies Institute. 2007. A Synthesis Review of the Public Understanding Research Projects. Report to Defra. 46 http://www.globalcool.org/ 47 Defra Attitudes and Behaviours Survey, 2007 (BMRB)
39

Societal trends As outlined in the scoping report, there are a number of wider trends that will inform strategy development and implementation. There are trends that provide a context for what we do, such as increases in single person households or levels of political engagement. Others impact negatively on the environment, such as consumers flying more and the disposable culture. There are also positive trends that we can work with, for example:
• more businesses are announcing environmental commitments, whether seeking to ‘green’ their business or address specific areas, such as provision of reusable bags or selling more energy efficient lightbulbs.48
• growth in ethical consumerism (including organic food, energy efficient electrical appliances and eco-travel) exceeded the sales of over-the-counter beer and cigarettes for the first time (£29.3 billion in 2005) 49
We need to understand the drivers and limits for these trends to help us assess their impact on encouraging more widespread pro-environmental behaviour. Different people, different interventions The evidence presented in this chapter paints a broad picture of current public behaviour, why people do what they do, what might persuade them to change and what they say stops them from changing. The Defra scoping report set out the early development of a segmentation model, which is a critical tool in the framework for influencing behaviour. As has already been intimated, different people act (or not) for different reasons; a motivation for one may well be a barrier for another. Segmenting the Defra audience (i.e. the whole English population) allows us to communicate and interact with people in the most effective way to support more sustainable lifestyles. The next chapter gives detail of this segmentation.
48 The Climate Group is also working with a number of businesses that have made specific environmental commitments. www.theclimategroup.org 49 The Cooperative Bank, 2006. Ethical Consumerism Report
40
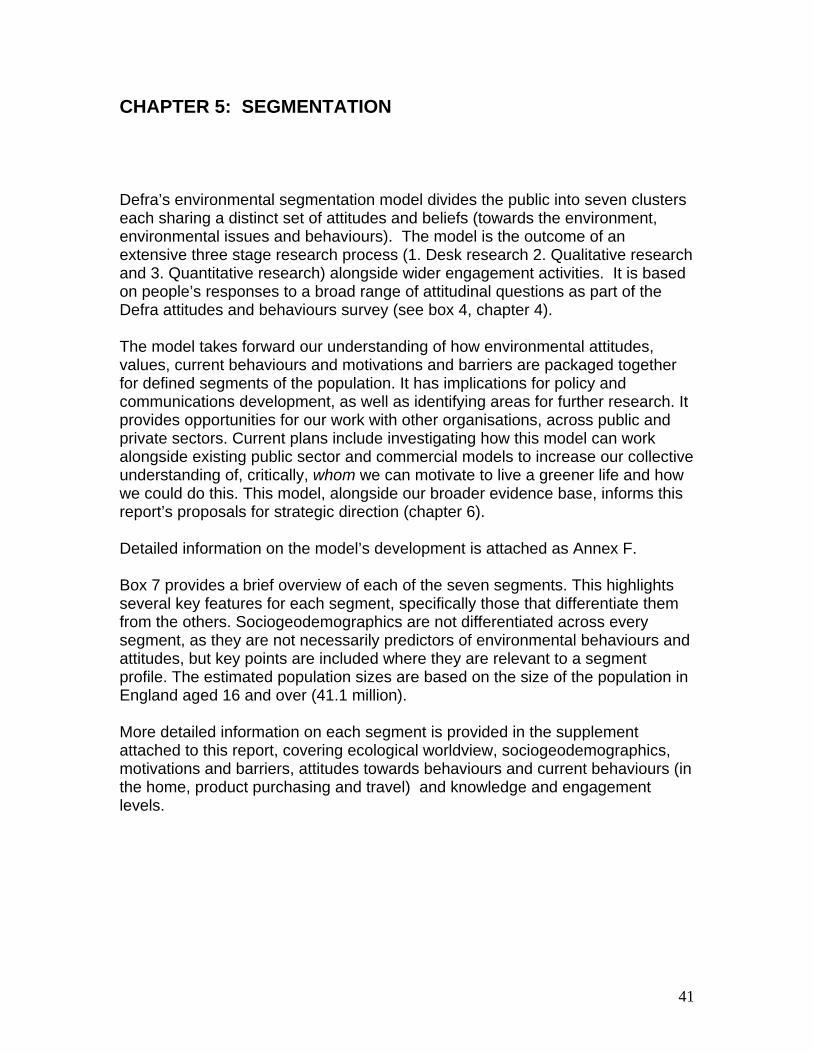
CHAPTER 5: SEGMENTATION Defra’s environmental segmentation model divides the public into seven clusters each sharing a distinct set of attitudes and beliefs (towards the environment, environmental issues and behaviours). The model is the outcome of an extensive three stage research process (1. Desk research 2. Qualitative research and 3. Quantitative research) alongside wider engagement activities. It is based on people’s responses to a broad range of attitudinal questions as part of the Defra attitudes and behaviours survey (see box 4, chapter 4). The model takes forward our understanding of how environmental attitudes, values, current behaviours and motivations and barriers are packaged together for defined segments of the population. It has implications for policy and communications development, as well as identifying areas for further research. It provides opportunities for our work with other organisations, across public and private sectors. Current plans include investigating how this model can work alongside existing public sector and commercial models to increase our collective understanding of, critically, whom we can motivate to live a greener life and how we could do this. This model, alongside our broader evidence base, informs this report’s proposals for strategic direction (chapter 6). Detailed information on the model’s development is attached as Annex F. Box 7 provides a brief overview of each of the seven segments. This highlights several key features for each segment, specifically those that differentiate them from the others. Sociogeodemographics are not differentiated across every segment, as they are not necessarily predictors of environmental behaviours and attitudes, but key points are included where they are relevant to a segment profile. The estimated population sizes are based on the size of the population in England aged 16 and over (41.1 million). More detailed information on each segment is provided in the supplement attached to this report, covering ecological worldview, sociogeodemographics, motivations and barriers, attitudes towards behaviours and current behaviours (in the home, product purchasing and travel) and knowledge and engagement levels.
41

Box 7: The seven population segments
Segment 1: ‘Positive greens’ 18% of the population (7.6 million) “I think we need to do some things differently to tackle climate change. I do what I can and I feel bad about the rest” • This group assess themselves as acting in more environmentally friendly ways than any other segment does.
Additionally, they are the most likely group to want to live a more environmentally friendly life than they currently do. • Members of this group consistently hold the most positive pro-environmental attitudes and beliefs; they believe that
we are reaching the planet’s natural limits, and that the ecological crisis is pressing. They believe that humans are largely responsible for the environmental damage and it is up to individuals to adapt their behaviour to address this.
• While they are likely to be doing most to reduce their impact on the environment, there is scope for them to do more, particularly with their travel behaviours. They are most likely to have undertaken behaviours in the home including saving energy and water, and they are the heaviest recyclers. They are also most likely to buy ethical and local products including local food and fair trade. They have pro-environmental attitudes to travel yet, for example, their dependency on cars is only just below average.
• They are the least motivated by saving money (and by far the most willing to pay more for environmentally friendly products), keen to avoid waste, and the most likely to feel guilty about harming the environment.
• They are the least likely to cite generic barriers to being more environmentally friendly (whether effort, the difficulty of changing habits or the level of others’ action).
• They have the highest levels of self-reported knowledge about environmental terms, although still around a half know little or nothing about carbon footprints and offsetting. They are also most likely to want more information on what they can do.
• They are most likely to seek to influence friends, family and the workplace to be more environmentally friendly. They are most likely to be involved in environmental and community organisations, although still at low levels (eg. fewer than one in ten are members of Greenpeace or Friends of the Earth).
• They are the most likely by far to be in AB socioeconomic groups (SEGs) and have the highest levels with household incomes of £40k and over per annum. They are the most likely to have a degree, and to read The Guardian, Independent or Times. Their profile is biased towards middle age (41-64), and owner-occupancy.
Segment 2: ‘Waste watchers’ 12% of the population (5.1 million) “’Waste not, want not’ that’s important, you should live life thinking about what you’re doing and using” • This group is doing more than any other (except group 1) to help the environment. However this behaviour is driven
by an urge to avoid waste rather than seeking to reduce their environmental impact. • Members of this group are as likely as group 1 to rate their behaviour as environmentally friendly. Nearly three
quarters are content with what they are currently doing to help the environment - whereas three quarters of group 1 would like to do more.
• Their ecological worldview tends to be slightly more pro-environmental than the average, but they are also more likely than average to be sceptical about the scale and urgency of environmental problems.
• They are very concerned about changes to the UK countryside and loss of biodiversity (second only to group 1). • They say that the environment is a high priority for them, yet they are the second least likely group (after group 7) to
feel guilty about their environmental impacts and they do not share group 1’s pro-environmental attitudes to travel. • Their current behaviours focus on those in the home (including saving energy and water), using a more fuel efficient
car and purchasing ethical and local/national products. They are very committed recyclers, indeed they are most likely to volunteer that they cannot recycle any more as they already recycle as much as they can.
• There is a middle age and older age bias. One third are aged 65 and over (nearly twice as likely as average), while less than a quarter are 40 and under (half as likely as average). One third are retired, and many are on low incomes (two fifths on £20k per annum or less). Over half own their homes outright and they are the most likely to read the Daily Mail or Telegraph.
42

Segment 3: ‘Concerned consumers’ 14% of the population (5.7 million) “I think I do more than a lot of people. Still, going away is important, I’d find that hard to give up..well I wouldn’t, so carbon offsetting would make me feel better” • This group hold broadly pro-environmental beliefs, although with less conviction than groups 1 and 2. Members of
this group are particularly sympathetic to the concept of ‘climate change’, acknowledging their personal impact and seeing taking action as important. Conversely, they show the strongest rejection of any group of the idea that we are reaching our limits to growth and they also doubt that an ecological crisis is imminent.
• They rate themselves as environmentally friendly in their behaviours and two thirds of the group claim they would like to do more.
• Their current behaviours focus on environmental behaviours in the home including saving energy and water (these behaviours are similar to group 5), and some purchasing behaviours; both of which they undertake at above average levels. In terms of travel, this group have greener attitudes to travel than most. However, their levels of dependence on the car remain average, while they take the most flights per year of any segment.
• There is little stopping them being more environmentally friendly, as they are less likely than average to cite general barriers to pro-environmental behaviour, such as money-saving, inconvenience, and others not taking action. There is also some guilt about harming the environment and pro-environmental behaviours seem to fit with their self-identity. They may like to think that they are doing more than they are.
• One third are aged 30-40, and there are the lowest levels aged 65 and over. There is a slight bias towards ABC1 SEG. One third have household incomes of £40k and above per annum and, notably, this includes the highest level of all groups with household incomes of £60k and above (nearly one fifth of the group). They are the most likely to be owner-occupiers with a mortgage, and the most likely to have dependent children (along with group 5). They are the second most likely to have a degree.
Segment 4: ‘Sideline supporters’ 14% of the population (5.6 million) “I think climate change is a big problem for us. I suppose I don’t think much about how much water or electricity I use, and I forget to turn things off..I’d like to do a bit more”
• This group has a generally pro-environmental worldview, although these beliefs are held relatively weakly across the board. Members of this group are second only to group 1 in anticipating an imminent crisis; however they are more likely to think that humans (possibly other people) will find the solution.
• Their green beliefs have not translated to their behaviours – this is the group where the attitude action gap is most evident. They are much more likely than the first three groups to say they have not thought about doing particular behaviours. However, low knowledge is also a barrier (for example, roughly two thirds say they know nothing about carbon footprints or offsetting).
• Their current behaviours are less ‘green’ than all except groups 6 and 7 on a range of pro-environmental behaviours including habitual behaviours in the home, though there are lower levels saying that they ‘don’t want to do’ specific behaviours than groups 6 and 7. They have the second highest level of car ownership and at the same time, they show the strongest dislike of any group for getting on the bus.
• Most say they are doing one or two things to help the environment and would like to do more. • They acknowledge a range of barriers more readily than group 3, such as the need to fit with their current
lifestyle and the difficulty in changing habits; they are more likely to feel guilty about harming the environment (with group 5).
• They recognise the environmental issues, are willing to learn and do more – they appear receptive though are unlikely to be proactive in acquiring information or adapting their behaviours.
• Members of this group span all ages, although under 30s are over-represented. They have average levels of household income, but with a bias towards C2DE SEGs. They are more likely than average to read the Daily Mail or the Sun, and fewer than average are educated to degree level.
43

Segment 5: ‘Cautious participants’ 14% of the population (5.6 million) “I do a couple of things to help the environment. I’d really like to do more..well as long as I saw others were”
• This group’s environmental worldview is close to the average for the population: members of this group tend to agree there is a pressing crisis, and that there are limits to growth. They are pessimistic about our ability to tackle climate change, but recognise their impacts.
• Their current behaviours focus on those in the home, including habitual behaviours saving energy and water. • This group are quicker to say that our efforts can be negated by other individuals and countries (than groups 1, 3
and 4); others’ levels of action are key to this group’s potential to act and so a sense of popular momentum may be required.
• They report more barriers to pro-environmental behaviour than groups 1 and 3, including the need to fit with current lifestyle and difficulty in changing their habits and they are more likely to feel guilty about harming the environment (with group 4).
• They tend to have green travel attitudes, and are particularly keen on travellers paying for the environmental damage they cause (second to group 1 in this area).
• Environmentally friendly behaviours are not a natural fit with their self-identity – with levels feeling they would be embarrassed to be green higher than groups 1-4. Half this group report doing only a few things or nothing pro-environmental, but three quarters say they would like to do more – the second highest proportion after group 1.
• This group has a younger than average age profile, with one quarter 30 and under, and nearly as few aged 65 and over as group 3. Equal with group 3, members of this group are the most likely to have dependent children, however they are slightly more likely to be renting than group 3. They are the third most likely to have a degree, after groups 1 and 3.
Segment 6: ‘Stalled starters’ 10% of the population (4.1 million) “I don’t know much about climate change. I can’t afford a car so I use public transport..I’d like a car though”
• This group present somewhat confused environmental views. Mostly the views are strongly negative: members of this group have the highest level saying climate change is too far in the future to worry about and, with group 7, the highest levels believing that the environmental crisis has been exaggerated (about half). However they are also the most likely (with group 1) to agree that there are limits to growth and that humans are damaging nature; if the group genuinely holds these views, they appear not to want to act on them.
• They have the lowest levels of knowledge about environmental terms: only just over a third know more than a little about climate change, and nearly three quarters know nothing about carbon footprints.
• They are most likely to say that their behaviour does not contribute to climate change, and that the environment is a low priority for them personally.
• Their life may have a relatively low impact on the environment for other reasons, such as financial constraints; though they are less likely to focus on thinking about the levels of energy and water they use in the home or generally undertake the smaller positive habitual behaviours. They currently choose not to do many pro-environmental behaviours beyond recycling (and have the lowest levels doing this with group 7). In keeping with their likely low impacts, they are the least frequent flying of all groups, and the least likely to own a car. Nonetheless in both cases a higher proportion of this group does not want to reduce their use of cars and planes than the proportion that has already done so.
• They have a lot of serious life priorities to address before they consider the environment. They mention lots of barriers – they are the most likely to cite convenience, difficulty, cost issues, others’ level of action, and the need for behaviours to fit with their lifestyle. They are the most likely to see being green as embarrassing, while the majority of the group see being ‘green’ as an alternative lifestyle.
• One sixth of this group (the highest of any) say they are doing nothing to help the environment; yet despite their low levels of pro-environmental behaviour, two thirds say they are happy with what they are doing and they do not want to do more.
• They have the lowest social profile of any group (nearly half are DE SEGs), and the lowest levels of income (nearly half are on less than £20k). They tend to be younger or older, with middle aged people under-represented, and the group includes more BMEs than average. They have the lowest levels of qualifications of any group (half have none), and are the most likely not to be working. They are the most likely group to read the Sun, Mirror and News of the World.
44
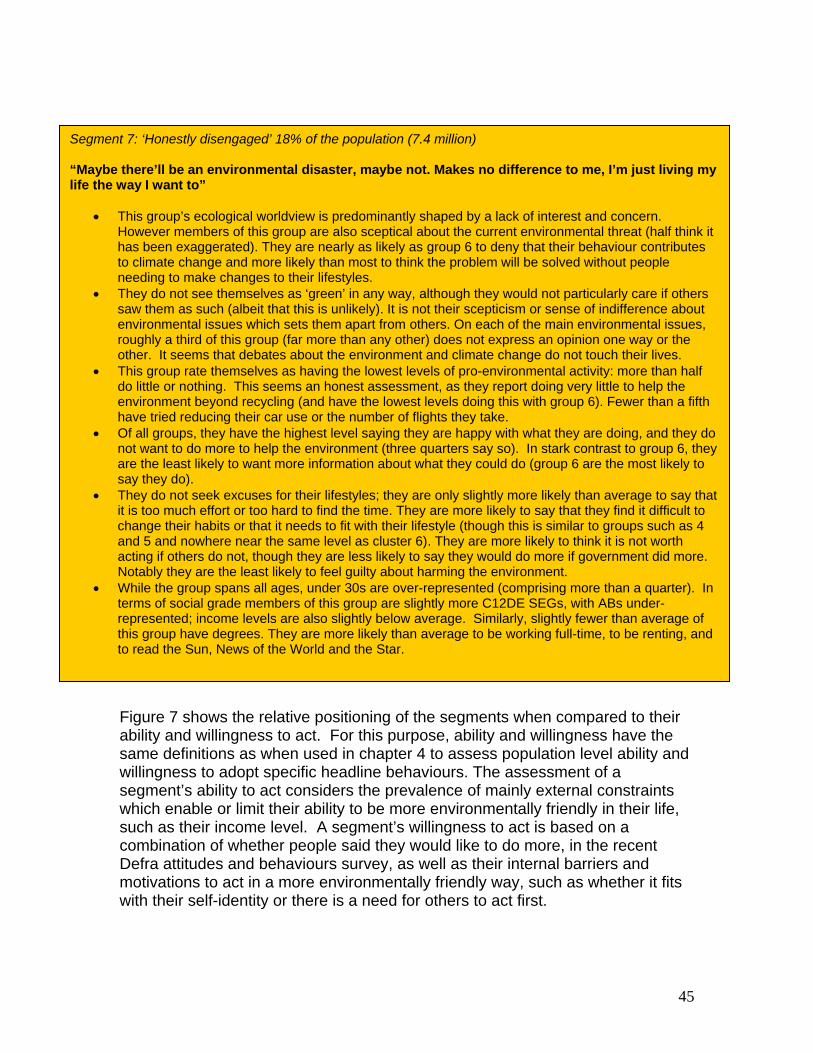
Segment 7: ‘Honestly disengaged’ 18% of the population (7.4 million) “Maybe there’ll be an environmental disaster, maybe not. Makes no difference to me, I’m just living my life the way I want to”
• This group’s ecological worldview is predominantly shaped by a lack of interest and concern. However members of this group are also sceptical about the current environmental threat (half think it has been exaggerated). They are nearly as likely as group 6 to deny that their behaviour contributes to climate change and more likely than most to think the problem will be solved without people needing to make changes to their lifestyles.
• They do not see themselves as ‘green’ in any way, although they would not particularly care if others saw them as such (albeit that this is unlikely). It is not their scepticism or sense of indifference about environmental issues which sets them apart from others. On each of the main environmental issues, roughly a third of this group (far more than any other) does not express an opinion one way or the other. It seems that debates about the environment and climate change do not touch their lives.
• This group rate themselves as having the lowest levels of pro-environmental activity: more than half do little or nothing. This seems an honest assessment, as they report doing very little to help the environment beyond recycling (and have the lowest levels doing this with group 6). Fewer than a fifth have tried reducing their car use or the number of flights they take.
• Of all groups, they have the highest level saying they are happy with what they are doing, and they do not want to do more to help the environment (three quarters say so). In stark contrast to group 6, they are the least likely to want more information about what they could do (group 6 are the most likely to say they do).
• They do not seek excuses for their lifestyles; they are only slightly more likely than average to say that it is too much effort or too hard to find the time. They are more likely to say that they find it difficult to change their habits or that it needs to fit with their lifestyle (though this is similar to groups such as 4 and 5 and nowhere near the same level as cluster 6). They are more likely to think it is not worth acting if others do not, though they are less likely to say they would do more if government did more. Notably they are the least likely to feel guilty about harming the environment.
• While the group spans all ages, under 30s are over-represented (comprising more than a quarter). In terms of social grade members of this group are slightly more C12DE SEGs, with ABs under-represented; income levels are also slightly below average. Similarly, slightly fewer than average of this group have degrees. They are more likely than average to be working full-time, to be renting, and to read the Sun, News of the World and the Star.
Figure 7 shows the relative positioning of the segments when compared to their ability and willingness to act. For this purpose, ability and willingness have the same definitions as when used in chapter 4 to assess population level ability and willingness to adopt specific headline behaviours. The assessment of a segment’s ability to act considers the prevalence of mainly external constraints which enable or limit their ability to be more environmentally friendly in their life, such as their income level. A segment’s willingness to act is based on a combination of whether people said they would like to do more, in the recent Defra attitudes and behaviours survey, as well as their internal barriers and motivations to act in a more environmentally friendly way, such as whether it fits with their self-identity or there is a need for others to act first.
45

Figure 7: Position of segments against ability/willingness
Willingness to Act
Ability to Act
High ability + willing
Low abilit
Who might do whatSegment 1
• Avoid unnecessary flights
Segment 2
• Use more efficient vehicles
y g+ unwillin
• Use more efficient vehicles• Use car less for short trips
• Avoid unnecessary flights
• Use car less for short trips
• Install insulation• Waste less food• Increase recycling• Better energy management• Install microgen• Adopt a lower impact diet• More resp water usage• Buy energy efficient
products• Eat more food locally in
season
• Install insulation• Waste less food• Increase recycling• Better energy management•• Adopt a lower impact diet
Install microgen
More resp water usage• Buy energy efficient
products• Eat more food locally in
season
Segment 3• Use more efficient vehicles • Avoid unnecessary flights
• Use car less for short trips
• Install insulation• Waste less food• Increase recycling• Better energy management• Install microgen• Adopt a lower impact diet
More resp water usage • Buy energy efficient
products• Eat more food locally in
season
Segment 4••••••••••••
Segment 5•••
•
••
Segment 7••
•••••
•
•
Segment 6•••••••••
•
•
Avoid unnecessary flights Use more efficient vehicles
Install insulationWaste less foodIncrease recycling
Buy energy efficient products
Avoid unnecessary flights Use more efficient vehicles
Install insulationWaste less food
• Increase recyclingBetter energy management
More resp water usage Buy energy efficient productsEat more food locally in season
Use more efficient vehicles
Install insulationWaste less food
Use car less for short trips
Better energy managementInstall microgenAdopt a lower impact dietMore resp water usage
Eat more food locally in season
Use car less for short trips
•
•
Install microgenAdopt a lower impact diet
•
•
Avoid unnecessary flights Use more efficient vehicles Use car less for short trips Install insulationWaste less food Increase recycling Better energy managementInstall microgenAdopt a lower impact diet More resp water usage Buy energy efficient productsEat more food locally in season
Avoid unnecessary flights
Use car less for short trips
Increase recycling Better energy managementInstall microgenAdopt a lower impact diet More resp water usage Buy energy efficient products Eat more food locally in season
• Lists in order of carbon impact
• Green = high acceptability of goal
• Amber = medium acceptability of goal
• Red = low acceptability of goal
This graph also provides an indication of the relative acceptability of each of the headline behaviours by segment, including where people are already acting. It is apparent that segments 1, 2 and 3 have relatively high ability to act, though there are very different motivations and barriers particularly for segment 2 and this group are less willing to act to be more environmentally friendly at least. Segment 4 are more willing to act though currently relative beginners in terms of their behaviours. Segment 5’s willingness to act is informed by their concerns about others’ actions. Segment 6 and 7 are least willing to act. It is evident that each segment’s willingness and ability to act, assessments of their potential to act and their beliefs, barriers and motivations have implications for the nature of the interventions that are likely to be most effective in encouraging higher levels of pro-environmental behaviour. This is covered in chapter 6.
46

CHAPTER 6: IMPLICATIONS FOR POLICY This chapter considers the implications of the available evidence on consumer understanding and behaviour for the development and implementation of policy, marketing and communications. These are organised by cross-cutting theme (see also box 2, chapter 2); by population segment; and by headline behaviour goal. The result is not intended to be a complete or prescriptive action plan. Rather, it is designed to identify potential areas of opportunity which policy managers, stakeholders and others will wish to consider. It has been informed by workshops with internal and external experts and an extensive set of policy recommendations on interventions submitted by Green Alliance.50 Clearly the wider legislative and spending context has a bearing on the kinds of opportunities which can realistically be identified. For present purposes we have worked on the assumption that Defra’s overall spend will remain roughly constant. It is important also to be aware of the extent of existing policies and programmes impacting on consumers – the principal ones are listed in annex D. A range of new policies are continually under development, a number of which will be given priority attention in the work programme of Defra’s environmental behaviours unit. This is complex and congested territory. Input from this behaviours framework will need to be factored into the respective sectoral and cross-cutting programmes and will depend to some extent on their own timetables. These implementation issues are considered further in chapter 7. A. Implications – by cross-cutting theme Use the mandate for action In terms of public understanding and attitudes, there is a mandate for government to take action – not to force radical changes in people’s current lifestyles so much as to help “green” those lifestyles, for example in terms of investment in the provision of more sustainable energy and transport services or in the “choice editing” of products.
50 See annex H of Scoping Paper
47

The most fundamental issue is the rate at which the economy as a whole is willing and able to invest in more resource efficient and low carbon products and services. There is an expectation amongst consumers that government and business should take responsibility for helping people to close the gap between their values/concerns and their ability to act, for example by addressing price differentials or raising the quality of the sustainable alternative. Focus on behaviour Whilst radical lifestyle changes are unlikely, there is nonetheless scope to make significant progress against most of the headline behaviour goals. The research again confirms the influence of personal recommendations and face to face contact in encouraging the adoption of new behaviours such as better energy management or take up of more sustainable products51. Our strategy should target both membership based organisations and community groups and influencing individuals (currently understood to be at higher levels in segment 1), enabling them to myth-bust and act as champions for certain key behaviours. This might include, for example, perceptions about product performance (e.g. of energy efficient light bulbs), the adequacy of insulation, or alternatives for car use for shorter journeys. We should look to challenge the perception held by many that recycling can count as “doing my bit” as well as encouraging people to see links between environmental behaviours and to other non-environmental benefits (financial outlay, health, quality, status, enjoyment etc). The Defra-commissioned research into Innovative Approaches to Sustainable Consumption and Production offers various examples of social marketing and viral marketing techniques that would be worth considering in this context. These should include identifying more opportunities to target our “influencers” in lifestyle settings linked to the behaviour goals. In focusing on behaviour, proposals for a household environmental audit and/or the intervention mix developed to support the uptake of visual display units have a role. Just as influencing social networks is critical for some groups, personal contact has a vital role for others in educating and encouraging more sustainable behaviours. A plan to develop existing energy audits to cover key behaviours in other areas (such as water usage, safe disposal and some purchasing tips based on labelling) would be helpful in extending behaviours and joining up environmental issues.
51 Brook Lyndhurst. 2007. Public understanding of sustainable energy, Report to Defra
48

Put products at the centre Notwithstanding issues about cost, the demand for and availability of high quality greener products is key and some themes emerge for interventions in this area. Our priorities should be to:
• Work with retailers, manufacturers and service providers to identify the major life cycle impacts for products, identify standards for improvement; and drive action to deliver those, including choice editing by business;
• Consider how existing approaches to improve products – e.g. the Directive on Ecodesign of Energy Using Products (EUP); producer responsibility – might be strengthened and extended (e.g. applying an EUP type approach to water using products);
• Promote supporting actions to ensure that consumers are provided with timely, reliable information on product impacts, e.g. through improved environmental labelling;
• Work with trade associations to help builders, plumbers, electricians etc advise their clients on insulation, energy and water efficient products;
• Support third party activity in benchmarking product and retailer performance (and optimise the work of the Market Transformation Programme and Defra’s Products and Materials Unit);
• Increase producer responsibility for packaging;
Whilst the provision of information is recognised to be inadequate on its own, it clearly has an important role as part of a package of supporting measures, for example not only helping consumers but also procurers to make more sustainable choices. Collective action There is a need for more visibility to be given to the actions which government and business are already taking. Notwithstanding the “we’re in this together” types of slogan, we remain some way from a sense of collective national action that might engage those segments who are more driven by social norms. Consistency of messages (and campaign brands) should help – for example through more coalitions with and between mass membership organisations, widespread adoption of the “Act on CO2” brand, and concentration on just a couple of issues/behaviours at any one time.
49

It will also be important to continue to use communication channels, and extend the range, that integrate ‘green’ messages into people’s lives, rather than focusing on niche ‘green’ supplements that can support some groups’ perceptions of environmentally friendly behaviours as a minority activity. Defra, OGDs and delivery partners need to ensure that they share a clear understanding and coherent “story” on key points which could otherwise undermine engagement and trust, e.g. airport provision/flying, local seasonal food/fair trade and development, relative impacts of different individual actions. Box 8: The Act on CO2 campaign
The Act on CO2 brand and marketing campaign has been developed to unify fragmented Government communications to the public and respond to the need for clarity and direction from Government. A key objective of the campaign is to address the perceived leadership gap and the research finding that "if the Government did more to tackle climate change, I would do too". Research confirms that some people not only want advertising and information from Government on this but they also want a real sense of urgency and immediacy in Government communications on climate change. The recent Defra "Footprint" TV campaign started in July/August 2007: • It stimulated a 50% increase in awareness of carbon footprint (from 54% to 82%) • 50% of viewers who saw the ads said that "they either had or planned to take action
as result of the campaign" • The comparatively low level (25%) of people believing that "the Government is doing
everything it can to help individuals to tackle climate change" increased by almost a third to 32%.
Widen the mandate There is a role for government - or advisory bodies such as the Sustainable Development Commission and National Consumer Council - to play in continuing to explore the boundaries of the current mandate, for example stimulating policy debate on well-being, travel, consumerism, trade-offs between energy policy options and lifestyles, or personal carbon trading. Members of the public could be brought into this process through the use of appropriately designed deliberative fora. But we need to be aware of the potential backlash, at least in the short term, against further direct interventions in people’s lifestyles, particularly where they appear to involve added cost/inconvenience but little realistic opportunity to adopt more sustainable behaviours.
50

B. Implications by segment The benefit of using a segmentation model is that it assists tailored approaches for specific groups. We can identify the issues and opportunities, based on our understanding of each segment’s attitudes, barriers, motivations and current behaviours. It means, for example, we understand which groups are most sceptical about their behaviour contributing to climate change or where most people are already actively seeking to influence their friends and family to be more environmentally friendly. Table 2 outlines some initial thoughts on the opportunities and issues for each segment and the implications of this for the way we develop interventions and the way we engage with different groups. These will be developed over time for those specific segments and priority projects that are chosen for targeting. Even at this early stage, we can see that there are implications that are common to a number of groups, who in other ways are very different. Figure 8 gives an overview of what a high-level segmented approach might look like. This compares the willingness to act of each segment with our assessment of the potential to make further progress through the application of this framework. We can then draw some conclusions about where particular emphasis might need to be placed in the design of interventions, taking the “4 Es” behaviour change model52 definitions of enabling, engaging, encouraging and exemplifying (figure 9). 52 Securing the Future, UK Sustainable Development Strategy 2005;
51

Figure 8: Segmented strategy, showing potential by segment and main emphasis for interventions
Willing to Act
Potential to do more
High potential and willing
Low potential and unwilling
Potential to do more, and how
1:Positive greens
High
Low
HighLow
7: Honestly disengaged
6: Stalled starters
5: Cautious participants
4: Sideline supporters
Encourage
Exemplify
Encourage Engage
Enable
Enable
Enable
2: Waste watchers
3: Concerned consumers
At this strategic level the segments fall into three broad types:
• Segments 1, 3 and 4 are relatively willing to act and have relatively high potential to do more. Segment 1 are already active, but, because of their commitment and strong pro-environmental beliefs, are prepared to do more; segment 3 have less conviction in their environmental views and are less active than segment 1, though being environmentally friendly fits with their self-identity and they are willing to do more; segment 4 have similar pro-environmental beliefs to segment 1, though they are relative beginners with environmental behaviours and very willing to do more, in at least some areas of their lives. The emphasis here should be on interventions that enable and engage, for example enabling by tackling external barriers (such as information, facilities and infrastructure – applies to all segments) and engaging through communications, community action, targeting individual opinion leaders.
• Segments 2 and 5 need different approaches to encourage them to be more environmentally friendly. Segment 2 are already active, though driven by a motivation to avoid waste, high concerns about changes to the UK countryside and have concerns about other countries not acting. Others acting (individuals, countries and government) is more critical for
52
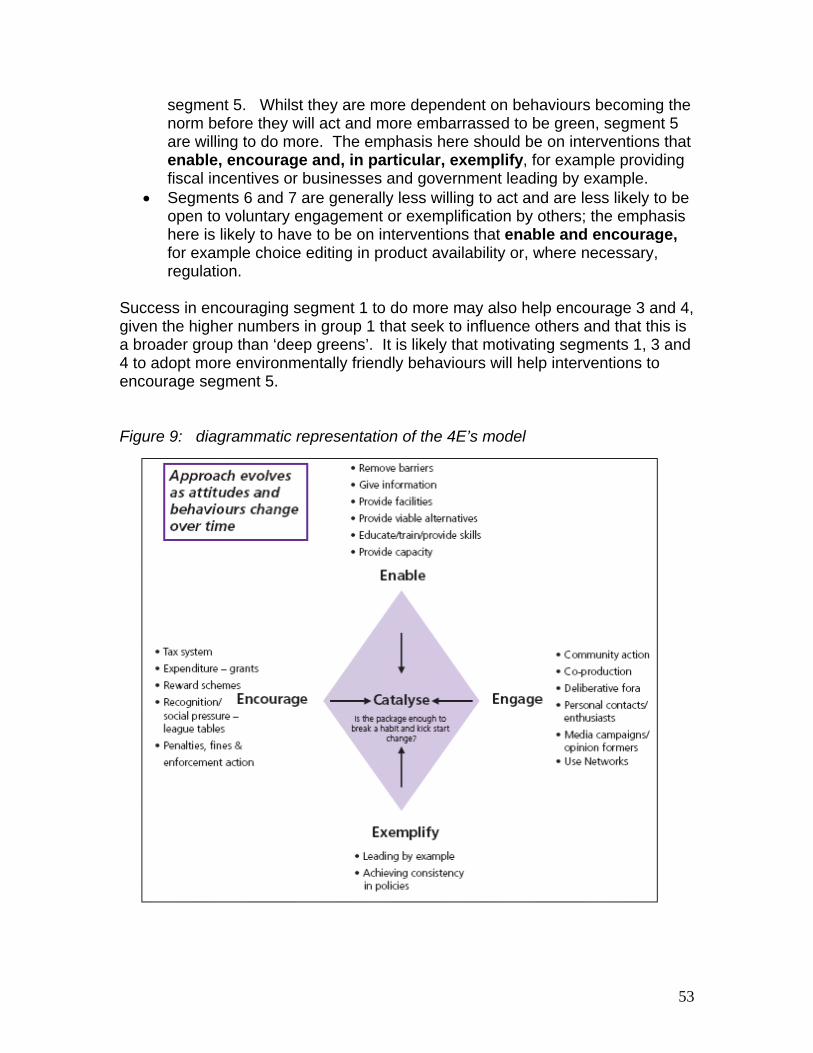
segment 5. Whilst they are more dependent on behaviours becoming the norm before they will act and more embarrassed to be green, segment 5 are willing to do more. The emphasis here should be on interventions that enable, encourage and, in particular, exemplify, for example providing fiscal incentives or businesses and government leading by example.
• Segments 6 and 7 are generally less willing to act and are less likely to be open to voluntary engagement or exemplification by others; the emphasis here is likely to have to be on interventions that enable and encourage, for example choice editing in product availability or, where necessary, regulation.
Success in encouraging segment 1 to do more may also help encourage 3 and 4, given the higher numbers in group 1 that seek to influence others and that this is a broader group than ‘deep greens’. It is likely that motivating segments 1, 3 and 4 to adopt more environmentally friendly behaviours will help interventions to encourage segment 5. Figure 9: diagrammatic representation of the 4E’s model
53

There are also implications in terms of which segments we might choose to engage with first when developing interventions. For example, some in segment 1 may be most likely to want to contribute to appraisal of different interventions, prior to development, and provide valuable input. Others (such as segments 2 and 3) who are less supportive of government-led top-down measures that ‘force’ people to change their behaviour may value communication, engagement activity etc relating to the behaviour(s) prior to any such interventions. Common motivations as well as each segment’s key motivations have implications for policy development as well as communications development. It is helpful to recognise where non-environmental motivations (segments 2, 6 and 7) and environmental concern (segments 1, 3 and 4) have a role, as well as where others acting are key (e.g. segment 5, and other countries’ actions for segment 2). It is clear each segment’s attitudes and beliefs will influence the type of messages that will be most likely to be successful in engaging them. There are also implications for the communication channels we would use. There will be more detailed information on this later this year, after workshops using the results of the fusion of the segmentation database with the TGI (Target Group Index) database managed by British Market Research Bureau, which is a continuous survey measuring product usership, media exposure and attitudes and behaviours. For example, determining where there are differences across segments in their attitudes and usage of media will be valuable in informing media planning for the Act on CO2 campaign. Critically the segmentation model will help campaign development through building an understanding of the way current behaviours, environmental attitudes, motivations and barriers are packaged together for targeted segments. It will also increase understanding of the characteristics of those groups that do not believe their behaviour contributes to climate change. Engagement with trusted intermediaries has a role with most groups, including 6, in engaging and influencing them (through information provision or implementation). For example, non-environmental organisations such as supermarkets and sports and arts organisations can help ‘mainstream’ environmental behaviours for segment 5 and engage segments 3 and 4; community and local groups have a role in integrating environmental behaviours for some such as segment 2; membership organisations can help reach segment 1; landlords and housing associations can ‘adapt’ the behaviours of some such as segment 6; and trade associations can influence people across all segments at point of purchase. Another way of using the segmentation model is to overlay assessments of where key life-stages cut across segments. This is partly because research findings indicate that people are generally more open to change at these points (moving home, having a baby etc) and also as this approach may have
54

55
applicability for some interventions. For example, retirement is a key life-stage for segment 2, middle age with older children is more applicable for segments 1 and 2 whereas segments 4, 5, 6 and 7 all include a younger group where some may be buying, or renting, their first home and others may be having a baby (with segments 3 and 5 most likely to have dependent children). For each life-stage, it is then important to assess whether there are approaches that can work across segments, or identify where a tailored approach will be most beneficial. C. Implications by headline behaviour Finally, table 3 proposes some possible opportunities and risks for making progress in relation to each of the headline behaviour goals. It also distinguishes between the population segments in terms of their relative openness to each behaviour and identifies some of the key actors. The final column gives an approximate rating of the potential to make progress against the behaviour goal in terms of impact against engagement levels.

Table 2. Implications for policy by segment % OF
POPULATION OPPORTUNITIES/ ISSUES IMPLICATIONS
Segment 1: Positive greens HIGH POTENTIAL (high willingness and high ability to act)
18% - Segment 1 has a high willingness to do more, the most positive attitudes and highest levels of knowledge. Members of this group have the potential to influence other groups by being seen to act (while committed greens are within this group, it is a much broader group). - They are the most likely to be actively engaged with environmental issues, whether as members or volunteers, and also more likely to volunteer their time to non-environmental groups, such as schools and local community groups. - They are most likely to say they try to persuade friends and family to be more environmentally friendly and to have suggested environmentally friendly improvements at the workplace - Members of this group are more likely to be early adopters for environmental behaviours and purchases. - They are the least likely to say that others acting would impact on what they do. - There is plenty of scope for them to do more, notably on use of renewables and green tariffs. Despite positive attitudes, the group remains attached to car use, flying, and to supermarkets. - They are by far the most willing to spend more
- Enable this group to act as opinion leaders and influencers and ensure they have the information and tools they need to do this. Target the less activist majority of this group (the activists will progress themselves) - It is less likely that this group will respond to current mainstream communication campaigns led by government (e.g. given their current knowledge and perceptions of the level of government activity). It is more likely that we will be able to build their knowledge in specific areas through working with trusted intermediaries. For example, there is potential to build on current positive activities with membership organisations such as the National Trust and WI. Also to support this group as they take their environmental knowledge into other areas of their life, whether to non-environmental neighbourhood groups and/or schools to investigate how they can become more sustainable. - There is also potential for this group to be influenced trade association members (such as plumbers and kitchen fitters) as sources of knowledge about environmentally friendly products. (Indeed this has relevance for all groups) - Potential to pilot and trial new initiatives with members of this group. For example, it is this group that is most likely to value, and trial, extensions of product labelling focused on environmental impact. - They may also want to input to debate to ‘widen the mandate’ beyond recycling (might appeal to group 3 too). - Opportunities to encourage members to help grow markets for greener products.
56

% OF POPULATION
OPPORTUNITIES/ ISSUES IMPLICATIONS
money on environmentally friendly products. - They are the most likely to think government is not doing a lot to tackle climate change. - They support those that cause the environmental damage paying for it (for example, car users paying for the damage driving causes and that money being used to address environmental issues)
- Demonstrate the positive impacts of their behaviours, and the extent of the government’s commitment
Segment 2: Waste watchers MEDIUM POTENTIAL (Medium willingness and high ability)
12%
- This segment is strongly focused on avoiding waste, across a wide range of areas and to recycling. - The local and national environment is more motivating than the global environment. - High levels of knowledge (2nd to segment 1), though they are less likely to seek to persuade others to be environmentally friendly (though about 1 in 3 of segments 2, 3, 4 and 5 still claim they do this). - This group is content with what they are doing to help the environment. - They are less likely to support government led top-down measures that are seen to ‘force’ people to change their behaviours. - The level of activity by other individuals and by government is not a barrier, though there is more concern about other countries’ activity. - The relationship between key demographics (such as age and geography), attitudes to car travel and
- They are unlikely to respond positively to climate change communications. Use non-environmental motivations. Focus on building on the ‘waste not, want not’ ethos and extending this to other issues, rather than trying to convince this group of environmental issues. - Target with behaviours that relate to their concern about the UK countryside, such as plant for wildlife, water management in the garden. - Recognise that while this group is less likely to want to do more, they are doing more than most already. - It may be possible to use an approach that encourages them to share their ‘waste not, want not’ approach with others, and to adapt other behaviours that fit with this approach. - Engage with this group prior to implementing top-down measures - Include snapshots on other countries’ activities to mitigate climate change in directgov and PR activity as part of broader initiatives tackling myths and concerns. - Prominence of car purchase information focused on efficiency before environmental benefit will help this group
57

% OF POPULATION
OPPORTUNITIES/ ISSUES IMPLICATIONS
flying, and their car dependency and usage is key. Changing their travel behaviours will be hard, as they will resist persuasion or compulsion. There is a resistance to driving or flying less, yet good potential for using more fuel-efficient cars.
(e.g. DfT car efficiency ratings).
Segment 3: Concerned consumers HIGH POTENTIAL (High willingness and high ability
14% - This segment’s environmental concern focuses on climate change. Being ‘green’ fits with this group’s self identity and members of this group are less likely to cite barriers of time, effort and lifestyle fit than 4, 5, 6 and 7 (though these are concerns for some). - Knowledge levels are lower than for groups 1 and 2, though most say they want more information and to do more. - Members of this group are on above average income levels though are not yet choosing to pay more for environmentally friendly products to the same extent as segment 1. - They are less likely to be led by the levels of government activity, or to support government led top-down measure that are seen to ‘force’ people to change their behaviours
- There is an opportunity to try to motivate this group to do more. Perhaps there is a need for emotional engagement; a range of behaviour specific incentives; or for some challenging of current behaviours to encourage this group to be more environmentally friendly. - Engage with this group prior to implementing top-down measures
Segment 4: Sideline supporters HIGH POTENTIAL (High willingness and low ability)
14% - This segment has a green ecological worldview, similar to segment 1. They do not see themselves as acting in ‘green’ ways. Members of this group have the greatest gap between their attitudes and their behaviours (attitude-action gap). - They have a sense of guilt about environmental damage. They say they are willing to do more and call for more information. The need for behaviours to fit with current lifestyle is more of an issue (and also is for segments 5, 6 and 7).
- The challenge will be to encourage them to think about both the environment and their behaviour (e.g. in terms of resource saving) and adapt their behaviours to fit more closely with their principles. - Guilt about environmental damage is a big issue for a number of groups. The challenge is to investigate whether guilt alleviation is a motivator and understand how such messaging could be used (this may be a more appropriate message from organisations other than government).
58

% OF POPULATION
OPPORTUNITIES/ ISSUES IMPLICATIONS
- Alongside this, there may be a need for policy measures to ensure they then move beyond some of the small behaviours.
Segment 5: Cautious participants MEDIUM POTENTIAL Medium willingness and medium ability
14% - It seems they may be greener in their behaviours than their self-assessment implies (which puts them very close to segments 6 and 7). They are doing more to help the environment than segment 4; they just hold less self-consciously environmentalist attitudes. They know slightly more than segment 4 (still low though) and are keen for more information. - They are keen to do more, but seem more fatalistic about their likely lack of impact. They need to see others are acting. Their perceptions of the level of action by other individuals, countries and government all impact on whether they will really do more. They are also ‘thinking’ about doing a number of behaviours, which is as expected for a group who ‘follow’ (the late majority). - They are, perhaps surprisingly, anti-car in their attitudes. After segment 1, they are the most supportive of car and plane users paying for the environmental damage they cause.
- Their latent interest needs converting into action: show that others are acting, and that actions have impacts (and personal benefits). - Consider how a package of interventions demonstrates collective action. For example, ongoing and creative ways of showing others are acting integrated into their life, such as in supermarkets, or at work. - Develop life-stage prompts to encourage and support their move from ‘thinking’ to doing. - Communicate what government is doing, whether legislative, procurement, or behaviours at a staff, MP or Departmental level.
Segment 6: Stalled starters LOW POTENTIAL (low willingness and low ability to act)
10% - Difficult to establish their precise attitudes to the environment through surveying, as they seem so disengaged are they from the issues. - This segment has a number of serious life priorities to address before they can begin to consciously consider their impact on the environment. Their everyday behaviours are often low impact for reasons other than environmental. However, they say they do not think much about saving energy and water in the home. They do not have ‘green’ attitudes to travel and are keen to protect their rights
- Non-environmental motivations have a role and this group does regularly read specific tabloids, which could provide an opportunity. However, for example, note the long-term commitment and time taken to build awareness of health messages with a similar population group. - It seems this group would not be opposed to ‘others’ ensuring that their life was more environmentally friendly, for example through landlords for the significant proportion in rented accommodation or through choice-editing.
59

% OF POPULATION
OPPORTUNITIES/ ISSUES IMPLICATIONS
to drive and fly. - They deny that climate change is a serious threat and that their behaviour contributes to it. - They have very low knowledge, but it seems they are unlikely to take in more information.
Segment 7: Honestly disengaged LOW POTENTIAL (low willingness and medium ability to act)
18% - One of the largest segments, but also hardest to reach. Strongly negative attitudes to environmental issues but also a massive amount of indifference and a lack of interest in environmental issues. - Less likely to support government led top-down measures to ‘force’ people to be more environmentally friendly - More likely to say it is not worth acting if others do not (though this is not seen to be a barrier to their becoming more environmentally friendly, in the way that it is for segment 5) - They do not feel guilty about their environmental impacts and are unwilling to pay more for ethical or environmentally friendly products. Indeed they strongly deny that their lifestyle impacts on the environment.
- It is likely that approaches which are not explicitly environment-related and use non-environmental motivations offer the best hope of engaging them. (Indeed there is a role for this with some behaviours for all groups).
60
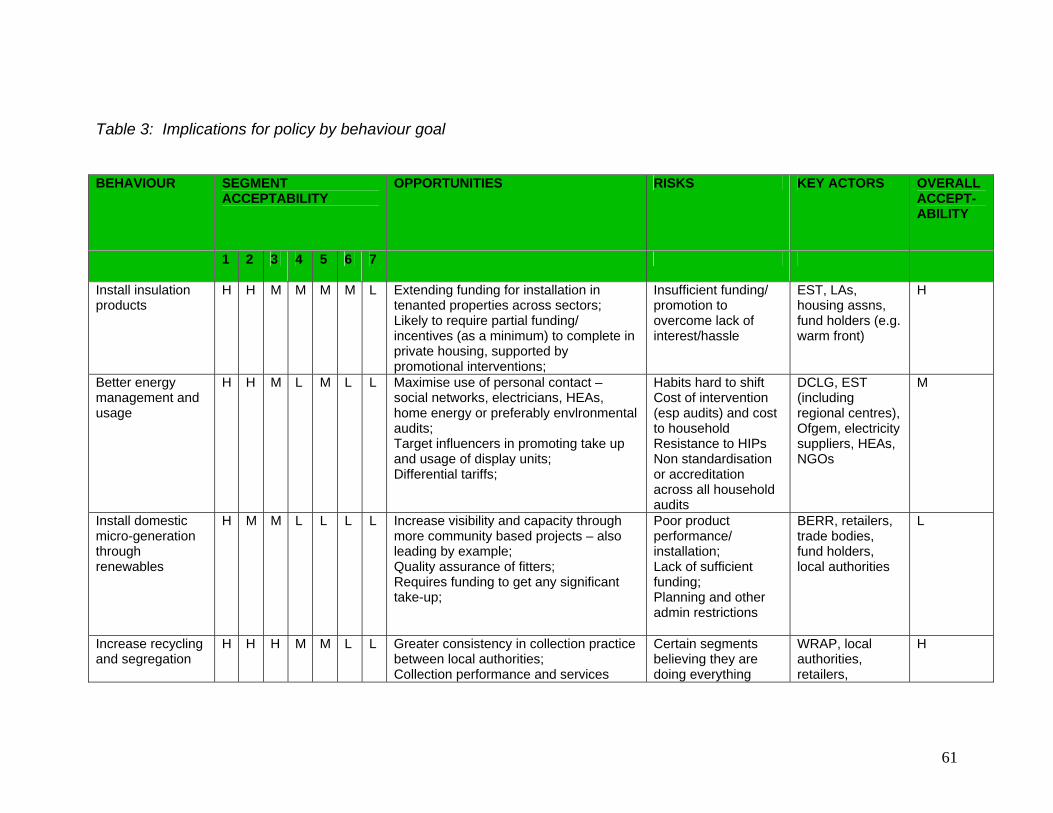
Table 3: Implications for policy by behaviour goal BEHAVIOUR SEGMENT
ACCEPTABILITY OPPORTUNITIES RISKS KEY ACTORS OVERALL
ACCEPT-ABILITY
1 2 3 4 5 6 7
Install insulation products
H H M M M M L Extending funding for installation in tenanted properties across sectors; Likely to require partial funding/ incentives (as a minimum) to complete in private housing, supported by promotional interventions;
Insufficient funding/ promotion to overcome lack of interest/hassle
EST, LAs, housing assns, fund holders (e.g. warm front)
H
Better energy management and usage
H H M L M L L Maximise use of personal contact – social networks, electricians, HEAs, home energy or preferably envlronmental audits; Target influencers in promoting take up and usage of display units; Differential tariffs;
Habits hard to shift Cost of intervention (esp audits) and cost to household Resistance to HIPs Non standardisation or accreditation across all household audits
DCLG, EST (including regional centres), Ofgem, electricity suppliers, HEAs, NGOs
M
Install domestic micro-generation through renewables
H M M L L L L Increase visibility and capacity through more community based projects – also leading by example; Quality assurance of fitters; Requires funding to get any significant take-up;
Poor product performance/ installation; Lack of sufficient funding; Planning and other admin restrictions
BERR, retailers, trade bodies, fund holders, local authorities
L
Increase recycling and segregation
H H H M M L L Greater consistency in collection practice between local authorities; Collection performance and services
Certain segments believing they are doing everything
WRAP, local authorities, retailers,
H
61

BEHAVIOUR SEGMENT ACCEPTABILITY
OPPORTUNITIES RISKS KEY ACTORS OVERALL ACCEPT-ABILITY
1 2 3 4 5 6 7
offered need to reach high standard before interventions such as variable waste charging brought in; Work with retailers to incentivise re-useable bags as “feel good” social norm (as opposed to “punitive” tax) and extend recycling provision;
already; Consumer backlash against stronger measures; Lack of infrastructure, esp for certain housing types (flats)
producers
Waste less (food) H H H M M M L Keep offering discounted compost bins; Work with FSA and retailers on “bogofs” and best before dates; Strengthen understanding of origins and value of food: e.g. box schemes, grow your own; cooking with left-overs; Build understanding of links to ghg/environmental impacts; Build evidence and understanding using life-cycle analysis;
Possible conflicts with consumer beliefs about health and safety
WRAP, FSA, local authorities, retailers, producers, media
H
More responsible water usage53
H H H L M L L More metering in water scarce areas and encouraging some groups to install meters and buy more water efficient appliances; Keep offering discounted water butts; Labelling water efficient appliances, alongside energy efficiency ratings; Extend choice-editing through voluntary agreements to remove the most inefficient products from the market;
Fears of added costs e.g. for larger families Feasibility of extending existing labelling in coherent way – it’s not about more different labels
CC Water, Waterwise, Water suppliers, trade bodies, social housing providers
M
53 Would include metering
62

BEHAVIOUR SEGMENT ACCEPTABILITY
OPPORTUNITIES RISKS KEY ACTORS OVERALL ACCEPT-ABILITY
1 2 3 4 5 6 7
Advice to trades assns/people on recommending products; Myth-busting perceptions of water efficient products with some groups;
Buy/use more energy efficient (low carbon) vehicles
H H H M M M L Stronger marketing of labelling and tax benefits; Aim to increase status of energy efficient vehicles;
Labelling and tax differentials insufficient to drive behaviour Competing trends (e.g. towards larger vehicles, rising car use)
Dft, producers, Tfl, local authorities, fleet managers (including rental), media
H
Use car less – seek alternatives for short trips (<3 miles)
H L L L L L L Design of local environment to favour the alternatives (potentially linked to other behaviour goals and strengthening local identity); Improvements in quality of PT provision; Promote health benefits of walking/cycling; Promotion of EST regional centres’ advice on sustainable transport;
Lack of PT alternatives; Fears over safety
DCLG, Dft, local authorities, PT providers, employers
L
Reduce non-essential flying (short haul)
H L M M M L L Recognise domestic aviation has important role to play for longer journeys; Respect people’s desire for annual summer holiday; work with travel industry to make those holidays more sustainable; Ensure attractive alternative to flying available where feasible; promote UK holidays; Develop clear script on rationale for
Polarisation between interest groups; mistrust (lack of exemplification); projected growth
Dft, DCMS, SDC, flight operators, travel industry, Visit Britain
L
63

64
BEHAVIOUR SEGMENT ACCEPTABILITY
OPPORTUNITIES RISKS KEY ACTORS OVERALL ACCEPT-ABILITY
1 2 3 4 5 6 7
government policy.
Buy energy efficient products
H H H M M L L Extend choice-editing through voluntary agreements to remove the most inefficient products from the market; Advice to trades assns/people on recommending products; Myth busting on light bulb performance; challenge energy “waste” from high consuming electrical products; associate energy saving products with quality; Extend energy efficiency labelling to wider range of products; Extend product range covered by EST ‘Recommended’;
Disadvantageous price differentials Demand for new (unlabelled) high energy consumption products
EST, Carbon Trust, MTP, manufacturers and retailers, NGOs
H
Eat more food that is locally in season
H H M L M L L Work with retailers and producers to market seasonal food, linked to education (e.g. seasonal recipe cards);
Perceptions of cost; Lack of knowledge
Retailers, producers, farmers markets, box schemes, restaurants, media
M
Adopt diet with lower GHG/env impacts
M L L L L L L Focus on quality and health, work with DH messages; Work with all parts of the food chain to reduce environmental impacts, e.g. through product roadmaps; Choice edit most unsustainable products; Build evidence base – LCAs of key products;
Resistance due to culture/ tradition ; Lack of knowledge about alternatives
DH, FSA, retailers, producers, schools, catering, consumer organisations, media
L

CHAPTER 7: DELIVERY Implementing the framework within Defra The principal purpose of this report, and the work of Defra’s environmental behaviours unit, is to provide an evidence base and an analytical capacity to support policy development and implementation where there is a strong consumer dimension. Figure 10 illustrates how we anticipate this process working. The functions highlighted in green would be the responsibility of the environmental behaviours unit:
• Assembling the evidence; prioritising headline behaviour goals; promoting a common set of principles and approaches; and developing and maintaining the segmentation model;
• Translating and interpreting the evidence and applying it to Defra’s strategic objectives by identifying potential options;
• Working with policy programmes/projects and external partners to refine options and develop and implement policy (signified by the hashed box);
• Overall monitoring and evaluation of the framework (rather than individual projects); commissioning of further research; piloting new approaches.
The benefits to Defra of this approach will include establishing greater clarity of purpose across the long list of 30 behaviours; one core evidence base of behaviour change research and consumer insight to inform policy, communications and research development; expert social research and social marketing support to priority projects and programmes in Defra; an enhanced capacity to innovate, pilot and evaluate.
65

Figure 10: Implementing the environmental behaviours framework
Principles/approaches
BehavioursEvidence Segmentation
Translation (of research), insight, analysis, option development
Sectoral policies, e.g. energy eff, food, waste
Cross-cutting actions, e.g. Act on CO2, capacity building
Partnerships (public, private, 3rd sectors)
Refine aims and objectives, creative development, testing
Monitoring and evaluation, further research, piloting
Implementation
We have identified a number of priority projects where expert support and input from the environmental behaviours unit is required over the coming year54. These are:
• the Act on CO2 campaign; • Water efficiency in households; • Fiscal incentives for recycling; • Personal carbon trading; • Product road maps (e.g. on clothing, milk, fish, TVs, lighting, cars); • Food Chain Programme; • Energy efficiency; • Sustainable tourism.
In general the kinds of services being sought by policy leads are providing wider research and insights on consumer behaviour and target population groups, identification of research needs and assistance with scoping out research/pilot specifications, identification and translation of evidence, identifying potential opportunities for interventions, capacity building, contact with stakeholder groups (e.g. in identifying opportunities for dissemination or partnership marketing).
54 Interviews were conducted in July/August with relevant policy leads to assess their needs
66

This framework will also feed into the design of future third sector programmes on environmental behaviours, helping to identify specific behaviour goals and priorities and providing the opportunity to apply common segmentation and evaluation models. Further proposals on this will be published later in 07/08. Box 9 : Case Study – Product Roadmaps
There are several international, EU and UK sources providing evidence on the environmental impacts of products and an increasing consensus that specific product areas and services, including food and drink, buildings, transport, energy-using products, tourism, and clothing, generate most of the overall impact on the environment at both a domestic and international level. Defra is undertaking a 'road mapping' process, targeting ten priority products to identify their environmental impacts and develop interventions to address them. A product roadmap is a tool to help better understand the environmental and social impacts of a particular product, the ways in which these impacts can be mitigated and the most effective points to intervene in the product life cycle. Through the road mapping process Defra will work with stakeholders to agree a range of practical actions and interventions to improve sustainability performance. Interventions could include:
o voluntary agreements o product standards o better labelling o improved consumer information o sustainable procurement o fiscal instruments o better regulation
The evidence base generated through the environmental behaviours framework will support this work, in particular to help identify opportunities for policy development, and to inform the direction of policy interventions or communication. For example, the environmental behaviours unit has identified and developed research to inform the strategic direction taken by the clothing roadmap – to explore public understanding of the concept of sustainable clothing and to identify key drivers to provide the context for further development of the roadmap. Engagement with key stakeholders, through the links established by the behaviours framework, will also help in identifying priorities and opportunities to join up activity with wider environmental behaviours work.
Working with stakeholders We are heavily dependent on a wide variety of stakeholders within government, business and the third sector to reach consumers, with only a limited number of direct routes available to Defra itself (such as Direct Gov, Act on CO2 or the carbon calculator). Figure 11 gives some indication of the variety and complexity of the stakeholder map.
67
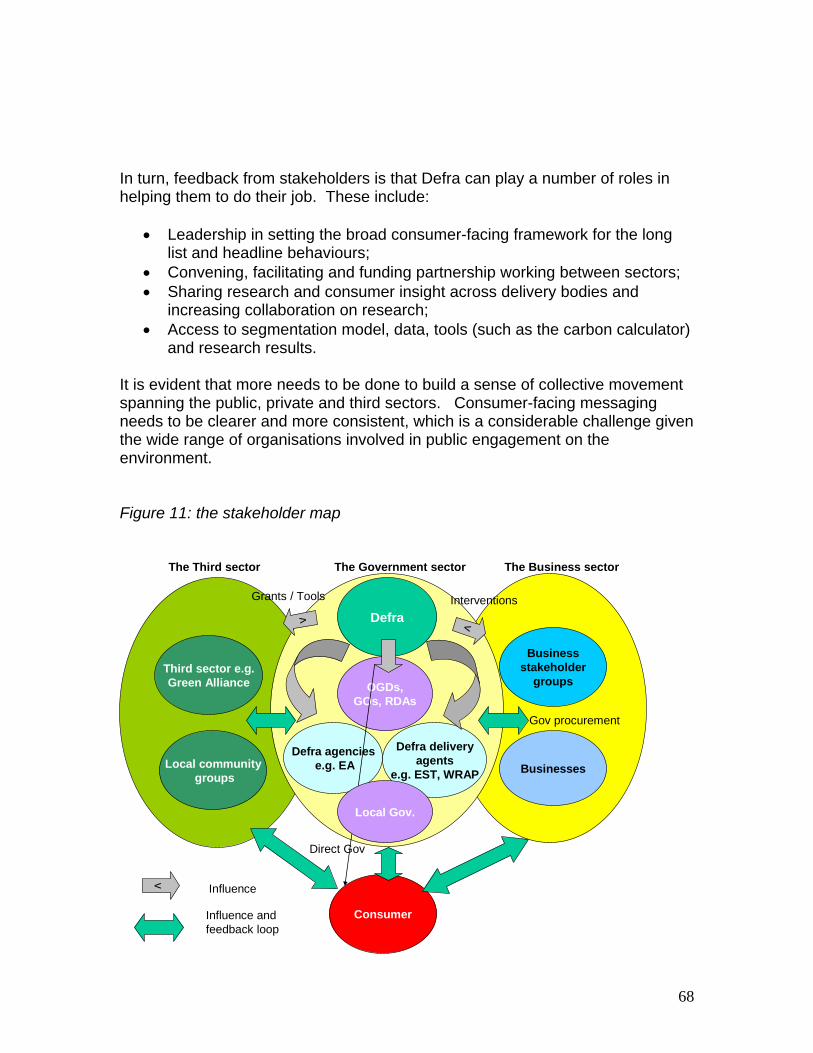
In turn, feedback from stakeholders is that Defra can play a number of roles in helping them to do their job. These include:
• Leadership in setting the broad consumer-facing framework for the long list and headline behaviours;
• Convening, facilitating and funding partnership working between sectors; • Sharing research and consumer insight across delivery bodies and
increasing collaboration on research; • Access to segmentation model, data, tools (such as the carbon calculator)
and research results. It is evident that more needs to be done to build a sense of collective movement spanning the public, private and third sectors. Consumer-facing messaging needs to be clearer and more consistent, which is a considerable challenge given the wide range of organisations involved in public engagement on the environment. Figure 11: the stakeholder map
Businessstakeholder
groupsThird sector e.g.Green Alliance
Local communitygroups
Businesses
Consumer
The Third sector The Business sector
The Gov sector
Defra agenciese.g. EA
Defra deliveryagents
e.g. EST, WRAP
Defra
OGDs,GOs, RDAs
v v
v
Influence
Influence and feedback loop
The Government sector
Grants / Tools Interventions
Gov procurement
Direct Gov
Local Gov.
68

In many cases, stakeholder organisations are not just interested in one or two goals relating to a particular environmental sector, but are seeking to work with consumers across the whole of their lifestyle. There is therefore a need for us to engage with stakeholders both on the delivery of cross-cutting or lifestyle based solutions and to help prioritise certain more specific messages. We envisage a three tiered approach to stakeholder engagement. In broad terms this would entail (i) a small core group of strategic partners; (ii) a larger forum of nationally based stakeholders; and (iii) a process for regional dissemination and shared learning. The core group would have potential for mass reach; be actively interested in pro-environmental behaviours across a range of goals; be keen to work in partnership with Defra and others; and would be prepared to share knowledge. Its prime role would be to identify opportunities for partnerships and coordinate marketing and communications in areas of joint interest. Its membership would ideally include strategic partners from the third sector, business groupings, key public sector and Defra delivery partners, therefore representing a cross-society coalition with potentially extensive reach and influence. The larger stakeholder forum could share evidence and consumer insight, act as a consultative forum on behaviour change and facilitate partnership working between participants. It would essentially be an extension of the forum which Defra organised in April 2007. We would also wish to ensure an effective process of dissemination and, where needed, capacity building at regional and local levels. The behaviour change framework and supporting materials will be generally applicable, subject however to any local specificities (for example availability of infrastructure and services, or different balance between population segments).
69

CHAPTER 8 – EXTENDING THE EVIDENCE BASE Developing the evidence base – both drawing on existing research and commissioning new work – is critical to supporting policy development and implementation in Defra, in other Government Departments and externally in terms of:
• Understanding current behaviour; • Influence more sustainable behaviours in future; and • Assessing the impact of the framework.
This chapter discusses a number of strands of work which are key to developing the evidence base going forward: monitoring and evaluation; a proposal for a Research Centre on sustainable behaviours; the ongoing research programme, and pilots and evaluation of community level interventions. Monitoring and Evaluation of the Pro-environmental Behaviours Framework The pro-environmental behaviours framework will be evaluated through a combined approach of social, consumer, economic and statistical analysis and research to assess both its impact and whether it has achieved its desired outcomes. Due to the wide scope of the framework, the main focus will be on assessing change across those areas where activity has taken place. Through the Defra survey55 (and the wider evidence base) we have established a baseline measure of people’s attitudes and behaviours. Repeating the survey at appropriate points in time, will enable us to monitor any subsequent changes, assess progress against the behaviour goals, and measure impact. Repeating the survey a number of years after implementation of the framework will also enable us to monitor if any shifts in behaviour are sustained over time. Other work will supplement the survey and forms part of the monitoring and evaluation plan, including:
• Economic and statistical analysis, modelling and forecasting; • Economic and social research projects; • Monitoring of wider society trends, behavioural and purchasing trends
related to the behavioural goals; • Economic cost benefit analysis;
55 Defra attitudes and behaviours survey, 2007 (BMRB)
70

• Sustainable development indicators; • Communications tracking, evaluation and trends in media coverage.
Whilst the environmental behaviours unit will be responsible for evaluating overall impact of the framework, separate monitoring and evaluation plans will need to be developed by policy leads for specific interventions, albeit with support from the unit where appropriate. Research Programme - Understanding and influencing pro-environmental behaviours Social Research Social research is an essential component of the evidence base for the pro-environmental behaviours framework. The annual social research programme will encompass both qualitative and quantitative analysis – research may involve primary data collection using social surveys, interviews and case studies, but equally important is the analysis and interpretation of existing research and data (for example, through systematic reviews). Part of the ongoing work within the research programme will be to provide evidence to further understand the Defra segmentation model. For example, it will help to investigate more deeply the motivations and barriers of selected segments and enhance our understanding of the implications of the model for the way we develop new interventions, e.g. in relation to the use of social networks and influencers. 2006/07 and 2007/08 Research Programmes The research programmes in 2006/07 and 2007/08 have addressed the need to underpin or even re-assess assumptions upon which policy and communications initiatives may be based, where these attempt to influence people directly. Research in 06/07 has worked towards providing a baseline of behaviour, aspirations, expectations and assumptions. Moving forward from this the social research programme for 07/08 reflects the known barriers to behaviour change and means of overcoming internal, psychological barriers as well as identifying the more concrete, infrastructure type hurdles to change. Research in 07/08 builds and enhances the existing evidence base on consumer behaviour and will extend understanding of:
• public knowledge and emotional engagement around the main policy areas of sustainable consumption and production;
• the precursors to pro-environmental behaviour; • how to engage and motivate pro-environmental behaviour.
71

Findings from the programme are applicable across a number of the policy areas (e.g. food, energy, travel, waste, water). The under-pinning research generated through the evidence base programme of work should be of interest across Defra, in other Government Departments and externally. Going forward, further consideration needs to be given to the added value that could be gained from developing tailored social research programmes for key priority projects, where there are substantive evidence needs that cannot be filled by the pro-environmental social research programme alone. 2007/08 Economic Assessment The economic research programme for 07/08 identifies and draws together the (potential) costs and benefits of the headline behaviours, including indirect effects such as rebound effects or other unintended consequences that (may occur or) have occurred as a result of the framework/ policy interventions – these may be positive or negative impacts. This should help to ensure value for money of the developing proposals for inclusion in the framework, and for adjusting those we have already implemented. Research Centre – In Development Defra, in collaboration with other potential funding partners across the UK (e.g. the Economic and Social Research Council), is considering establishing an independent Research Centre. It is envisaged that the focus of the Centre would be on the research challenges of informing moves within UK society towards more environmentally sustainable patterns of consumption and ways of living, and of achieving more effective pro-environmental behaviour to help to address the challenges faced by the UK in the wider world. If established, the Research Centre will provide the core evidence base for the pro-environmental framework and an important shared resource across Defra. A Research Centre of this nature would represent a major new investment in independent, policy-relevant research. The proposed Centre would be designed to build upon and enhance existing UK research strengths, complement existing centres of expertise and other planned initiatives and help to build future research capacity. It is envisaged that the Centre would engage, and work in partnership with, a wide range of stakeholders at all stages of its research to facilitate, and promote dialogue on, the provision and utilisation of independent and high quality research and evidence. Research Centres are normally established for a period of 3-5 years. If Defra, alongside other funding partners, takes the decision to proceed with the Centre, the call for proposals could be announced in spring 2008 with a view to the Centre starting work in the second half of 2008.
72
Pilots and Evaluating Community Level Interventions/ Innovation Projects Pilots Policy or programme pilots allow new initiatives to be tested, evaluated and adjusted where necessary, before roll out. Where possible any major new policy developments or new interventions introduced by priority projects should be piloted and a framework for monitoring and evaluation will need to be developed (where the policy owners will have overall responsibility for the plans, with support from the framework). The behaviours framework can be used to identify opportunities for, and feed into the design of pilots. Evaluating community level interventions or innovation projects In some instances, it may be desirable to influence pro-environmental behaviour through working with or supporting others at a community level or undertaking innovation projects as a way of trialling ideas/ projects that may never be envisaged for national rollout. Projects of this nature may be used for specific areas or segments/ groups of people. Valuable insights could be gained by learning from the small scale (and perhaps explicitly experimental) nature of projects of this type. A framework for monitoring and evaluating projects of this nature must be built into the design of the programme at an early stage to capture impacts and lessons learnt including, for example reasons why an intervention did not meet its objectives.
73

CHAPTER 9: CONCLUSIONS 1. The framework for pro-environmental behaviours which is described in this report, provides a core set of behaviour goals, principles and approaches, insight and tools to help guide Defra’s consumer-facing work over the medium term. One important benefit from establishing this framework and the resources to support it will be the ability to update our understanding continuously and feed as and when necessary into policy design and implementation. This should be a key role of the environmental behaviours unit, supported by the proposed Research Centre on sustainable behaviours. 2. From the research and analysis that has been done it is hard to see much appetite for radical lifestyle change, but there is much that can be done within the parameters of current lifestyles – such as challenging wasteful habitual behaviours; encouraging take up of greener products and services; or removing external barriers. But apart from seeking some direct behavioural outcomes an important secondary benefit from public engagement has to be in widening the mandate for government and business to play their respective parts. 3. As might have been expected there is not one but a multiplicity of ways of promoting greener lifestyles, confirming the need for packages of mutually supporting measures. In most cases we are quite likely to require combinations of top down mass engagement, some targeting of key segments (or groups within those segments), partnering with other public, private or third sector bodies, or community-based action. This framework can help with the design and implementation of all of these possible interventions as well as the evaluation of their effectiveness. 4. There is both scope and appetite for innovation – for example in terms of social marketing or new forms of campaigning and partnership working. We need to be prepared to take risks (since it is clear that innovation often does not succeed first time), but equally to make the best use of the evidence base and the opportunity to pilot and evaluate innovative approaches before they are rolled out. There are useful opportunities to do this cross-governmentally, for example with the Department for Transport on sustainable lifestyles and travel behaviours, with Communities and Local Government on eco-towns or with the Department of Health on obesity and diet. 5. Whilst the scope of the work on environmental behaviours is designed to cover both climate change and natural resources, relatively more of the analysis has so far focused on the carbon impacts of behaviours. There is an opportunity now to review the definition and application of those behaviour goals (in the
74

headline and longer lists) relating more to the natural environment and to ensure that they are adequately covered within the overall framework. 6. Finally, whilst this framework is designed to support policy development and implementation within Defra, it (and all the under pinning research) is also intended to be shared with our many external stakeholders and delivery partners. An effective process for involving stakeholders and identifying priorities will not only help us to make best use of our resources but allow us to benefit more from the considerable experience and expertise that resides outside government. Next steps will be to:
• Disseminate the environmental behaviours framework across Defra and delivery partners at national, regional and local scales;
• Work with key partners to identify new opportunities for partnership working, for example embedding the framework within Defra’s third sector strategy;
• Provide advice and support to a range of priority projects where there is a strong consumer dimension, including the Act on CO2 campaign, energy and water efficiency, the food chain programme, personal carbon trading, incentives for waste minimisation and recycling, product road maps, sustainable tourism;
• Continue to strengthen the evidence base, including the 07/08 programme of research, development of a proposal for a Research Centre on sustainable behaviours, piloting new approaches and evaluating community level interventions, strengthening the natural environment content;
• Review progress, including the selection of headline goals, by end 2008.
75

76

REPORT SUPPLEMENT – SEGMENT PROFILES
Positive greens Segment 1 18% of the population “I think we need to do some things differently to tackle climate change. I do what I can and I feel bad about the rest” 1. Sociogeodemographics • Most likely of all groups to be AB, and least likely to be C2DE • Highest average household income of all groups and one third (34%) on £40k
or more • Middle age bias. Nearly half (47%) aged 41-64; highest of all groups • Very slightly more female (4% above population average) • Least likely of all groups to read a daily paper regularly but most likely of all to
read the Guardian, Independent, Times, Independent on Sunday and Observer
• More likely than average to be owner occupiers and less likely to be renting • Most likely to be living in a pre-1929 house1 • Highest level living in a Housing Association property • Most likely of all groups to have a degree; one third (33%) do so • Tend to live in more affluent areas; half (50%) live in top 4 IMD deciles2 • Slightly more likely to live in South East and East (34% compared with 27% of
the population and the highest levels with group 2) 2. Ecological worldview This group has the most positive environmental attitudes and beliefs. Members of this group hold the strongest conviction that the ecological crisis is pressing; for instance, nearly 9 in 10 agree that a disaster is imminent (88%), and reject the view that the environmental crisis has been exaggerated (87%). They are also the most likely to think that we our reaching our natural limits to growth on Earth. They are the most likely to believe that human behaviour has played a significant role in creating this situation and that it is up to individuals, through behaviour change, and not scientists, to redress the balance. They are, on balance, optimistic that environmental solutions can be found, with 7 in 10 (71%) agreeing that ‘humans are capable of finding ways to overcome the world’s environmental problems’; they are the most likely of all groups to agree with this statement.
1 However segments 3,4,5,6 and 7 all have over 11% of respondents saying ‘don’t know’ for this question. 2 IMD – Index of multiple deprivation
i

They reject the view that the environmental crisis has been exaggerated and they are the most likely of all groups to see climate change as an immediate concern; 8 in 10 (80%) say that it is not too late to act. 3. Lifestyle When asked to assess their own behaviour, this group emerge as the most environmentally friendly of all. About half (52%) say they are doing ‘quite a few things’ which are environmentally friendly, and a further third (32%) say they are environmentally friendly in ‘most things’ or ‘everything’ they do. Notwithstanding these high levels of current action, three quarters (77%) say they would like to be more environmentally friendly, making them the most likely of all groups to want to do more. Of all the groups, this group is least embarrassed about being seen to have an environmentally friendly lifestyle and 8 in 10 (82%) disagree that ‘green’ is an alternative or minority lifestyle. 4. Motivations and barriers The environment is a high priority for this group. They are much more likely than any other group to disagree that the environment is a low priority compared with a lot of other things in their life – 9 in 10 (87%) disagree with nearly half (45%) disagreeing strongly. They are the most likely to believe that their own behaviour and lifestyle contributes to climate change (77%), and that individual behaviour change can make a difference. They are also the most likely group to believe both that individuals and Britain as a whole should act to tackle climate change, regardless of whether others do. As well as acknowledging their impacts, they also feel the most guilty about harming the environment; more than 8 in 10 (84%) sometimes do so. Members of this group are the least motivated by saving money, and are the most willing to spend more on environmentally friendly products. They are also the least likely to see practical considerations such as time, effort and habits as barriers to environmentally friendly behaviours. They are by far the most willing to change their lifestyle to help the environment: 60% disagree that any changes they make would need to fit in with their lifestyle (against 28% of the whole population), although 21% of this group still agreed with this statement. Notably this group is by far the least likely to believe the Government is doing a lot to tackle climate change: only 16% agree that it is. However this belief is not then used as an excuse for not taking action themselves, as it is by other groups, nor are they opposed to government led measures that make people change their behaviour to help the environment.
ii

5. Knowledge and engagement This group has the highest levels of self-reported knowledge about environmental terms, and certified and assurance labels ranging from Fair Trade to freedom food. 88% saying they know ‘a lot’ or ‘a fair amount’ about global warming, and 85% saying the same about climate change. However there is room for improvement in other areas: 50% say they know ‘little’ or ‘nothing’ about carbon footprinting, and 61% say the same about offsetting. Notwithstanding their high levels of knowledge, they are keen to know more about what they can do – 67% say they’d like more information on what they can do to be more environmentally friendly. They are the most likely group to be involved with environment-related organisations, whether as members or by making donations, and most likely to volunteer their time to environmental and non-environmental groups. While 24% of this group are National Trust members, it should be noted that only a small minority are members of more committed pro-environmental organisations, for example 8% belong to Greenpeace, and 7% to Friends of the Earth. By this measure it can be said that the majority of this group are not activists on the pro-environmental agenda. They are the most likely group to try to encourage others to be more environmentally friendly (socially and at work); around half (54%) talk to friends and family about these issues, while slightly fewer (44%) have tried to persuade others to adopt more pro-environmental behaviours. 6. Attitudes to behaviours and current behaviours - In the home This group is currently the most environmentally active in the home, on the basis of the behaviours assessed. Members of this group are the most likely to report having reduced their energy and water use (and to intend to keep it up) 74% and 70% having done so respectively. The majority (65%) are willing to sacrifice home comforts to save energy. They are consistently less likely than all other groups (segment 2 is generally the next least likely) to behave ‘wastefully’ across a range of energy and water management habitual behaviours, such as leaving lights on and taps running. They are most likely (again with segment 2) to have requested a water meter, and more likely to think bills will stay the same. They are the second most likely group (after segment 2) to identify with a ‘waste not, want not’ approach to life. In terms of action, group 1 are the strongest waste
iii

minimisers. 88% (equal with group 2) are already ‘recycling more’ (and intend to keep it up). Meanwhile they are the most likely group to avoid over-packaged products, to reuse containers and envelopes, and to waste less food. Of those people with a garden, those in group 1 are most likely to have a compost bin/heap (51% do so). - Purchasing Vastly more of this group than any other (78%) say they are willing to pay more for environmentally friendly products, and they are twice as likely as any other segment to express this strongly (30% do so). They are the most likely (along with segment 2) to spend more on energy efficient kitchen appliances and to have purchased energy efficient lightbulbs. In terms of renewable energy, they are the most likely to be considering installing solar panels, although it is only a small minority who say this (18% for electricity, and 16% for water heating). Fewer than 1% have actually installed either kind of panel. They are the most likely group to buy electricity on a green tariff (or to be seriously considering doing so), but as yet only 6% have actually done so. They are also the most active shoppers for certified/assured food, ethical products and eco-products. They are the most likely to be aware of different food labels and the most likely to buy these. They are also most likely to say that they check where fruit and vegetables are from before purchase, to report buying local food (just over half (53%) already do so and intend to keep it up) and to make an effort to buy from local producers. They are much more likely than other groups to say they avoid buying products from companies whose ethics they disagree with. They are the most likely group to shop regularly at independent shops (43%) and farmers markets (22%), though the majority still shop at supermarkets (75% - the same proportion as for the whole population). - Travel They express very pro-environmental attitudes towards car and plane travel that are strongly differentiated from other groups, as well as positive attitudes towards bus and train travel and cycling. They are pro car and plane users paying for the environmental damage their activity causes, disagree that more roads are the answer, and are less attached to their cars. This group has the highest levels that report they are already using a car less (and intend to keep it up), although this is reported by a minority of the group (43%). They are more likely than any other group to reject the view that driving is too convenient to give up for the sake of the environment (57% do so). However, 62% cite the lack of alternatives as a barrier to reducing their car use and 56% say they would not find it easy to do so. Their level of car ownership is similar to the population average, although car travel does represent a slightly lower proportion of their overall travel. They are the most likely to either be thinking about, or to have switched to, a more fuel efficient car. They are the most likely
iv
group to use bicycles and to use overland trains several times a year; they report average usage of buses. They are the most likely group already to have reduced their air travel (and to intend to keep that up) – yet only a minority of those in this group who fly have actually reduced their air travel (38%). A similar minority (41%) say they feel guilty about taking shorthaul flights (again the highest proportion for any group). Group 1 is the second most frequent flying of all groups after group 3, though after control for socio-economic factors (such as their higher incomes) they are slightly less likely to fly than most other groups.3 Members of group 1 are the most likely to have used carbon offsetting schemes (3% have done so, compared to 1% for the whole population), and they are the most likely to think they will use it in the future (36% do so). However, the majority have some concerns about offsetting: 67% agree that offsetting encourages people to continue with behaviours that harm the environment, while 45% say they would not trust an offsetting company to spend their money appropriately.
3 The average number of flights per year per segment refers to the total UK, European and non-European flights taken. The segment averages range from 0.71 flights last year for segment 6 to 1.39 flights last year for segment 3.
v
Waste watchers Segment 2 12% of the population “’Waste not, want not’ that’s important, you should live life thinking about what you’re doing and using” 1. Sociogeodemographics • The oldest age profile of any group. One third (34%) are aged 65 and over,
nearly twice as likely as average; a further 44% are aged 41-64 (highest after group 1); with less than one quarter aged 40 and under
• Population average across social grades • Many on low incomes, eg. more than 1/3 (37%) have household incomes of
£20k or less (second highest level, after group 7) • Most likely of all groups to be retired (37% vs. 23% population average) • Very slightly more male (3% above population average) • Most likely to be owner occupiers: over half (52%) own their own home –
highest of all groups. Most likely to have lived in their home for over 10 years and to be living in a detached house or bungalow
• Most likely to be living in home built 1966-944 • Most likely of all groups to have qualifications connected with work; fewer
than average hold degrees • Most likely of all groups regularly read the Daily Mail (21%) and Telegraph
(10%) • Under-represented in the least affluent areas • Least likely to live in a big city and most likely to live in rural and semi-rural
areas. Less likely than average to live in London, slightly more likely to live in South East and East (highest levels with group 1). Most likely of all groups to live in the South West
2. Ecological worldview In general this group has a slightly stronger ecological worldview than average. Members of this group are slightly more likely than average to agree that we are reaching the planet’s natural limits; for instance, 64% agree we are close to the maximum number of people the earth can support. The majority agree that humans are abusing the environment, though they are more sceptical than most that an ecological crisis is looming. More than a third (37%) agree that the ecological crisis has been ‘greatly exaggerated’ (they are the third most likely group to agree with this statement, after groups 6 and 7). Only a small number of this group believe that it is too late to act or that climate change is too far away. They are particularly concerned, relative to other groups, about the threat to the countryside and biodiversity in the UK (93% express such a concern, second 4 However groups 3,4,5,6 and 7 all have over 11% of respondents saying ‘don’t know’ for question about when their house was built
vi

only to group 1). This suggests a local rather than global focus to their environmental concerns. 3. Lifestyle This group rate their own behaviour as nearly as environmentally friendly as do those in group 1. 50% say they are doing ‘quite a few things’ which are environmentally friendly, and a further 32% say they are environmentally friendly in ‘most things’ or ‘everything’ they do. However in sharp contrast to group 1, the vast majority of group 2 (71%) are happy with their levels of environmentally friendly behaviour; only segment 7 are more likely to say they do not want to do any more. Similarly they are the third least likely group to say they would like to do ‘a bit’ or ‘a lot’ more (29% say so, against 52% of the whole population) and the 1% of this group who would like to do a ‘lot more’ compares to 24% of group 1. Just over a half (51%) disagree that being ‘green’ is an alternative lifestyle, which is significantly less than groups 1 and 3. 4. Motivations and barriers The vast majority of this group (82% - more than any other segment) agree that ‘waste not, want not sums up my general approach to life’; this attitude drives many of their behaviours. In addition, the environment is a high priority for this group: 60% (second after group 1) reject the view that the environment is a low priority compared to other issues in their life (although less disagree strongly, 14%). Only a small number of this group believe it is too late to act or that climate change is too far away. However there is an element of denial – nearly one third (30%) deny that their behaviour contributes to climate change (this is in line with the population average of 28% though significantly more than groups 1, 3 and 5). They are more likely than average to cite what other countries are doing as an excuse for Britain not acting. This group is the second least likely to think that the government is doing a lot to tackle climate change (only 21% think so), and just over half (52%) say they would do more if the government did. They tend to be opposed to government led measures that ‘force’ people to change their behaviour (similar to group 3). Notably, this group is less likely than all others (except group 7) to feel guilty about doing things that harm the environment: only a minority (45%) sometimes do so. They tend not to cite other factors such as effort, habit or cost as barriers to taking action and they reject the view that it is only worth being environmentally friendly if it saves you money. While a minority (38%) cite time as a barrier, this is nearly twice the levels agreeing in groups 1 and 3. The half
vii

agreeing that changes need to fit with their lifestyle is close to the population average of 46%. 5. Knowledge and engagement This group generally have the second highest levels of knowledge about environmental terms, with 73% saying they know ‘a lot’ or ‘a fair amount’ about global warming, and 71% saying the same about climate change. Yet 68% say they know ‘little’ or ‘nothing’ about carbon footprinting, and 75% say the same about offsetting. However, again in sharp contrast to group 1, only just over half (55%) say they would like further information about leading an environmentally friendly lifestyle; this is the second lowest proportion of any group (after group 7). Just over half of this group (54%) are members of, or make donations to, environment-related organisations (making them the second most likely after group 1). The two most popular organisations are Oxfam (among 19%) and the National Trust (17%); only 2% each are members of Greenpeace or Friends of the Earth. They are no more likely than average to act as opinion formers, with 29% saying they often talk to friends and family about what they can do to help the environment, and 20% saying they try to persuade people to become more environmentally friendly, the same level as for groups 3 and 4. They are less likely than all other groups (except 6 and 7) to have told relatives or friends to avoid buying from companies they think damage the environment – only 10% have done so. 6. Attitudes to behaviours and current behaviours - In the home This group is greener than most in their everyday behaviours in the home. They are particularly resource conscious: they give as much thought as group 1 to saving energy in the home, and pay more attention to the amount of water they use. In both cases they give far more attention to these than the other five groups. In terms of reported behaviour change, they are nearly as likely as group 1 to have cut down on the energy and water they use (and to intend to keep doing so), 71% and 69% respectively having done so. They are also second only to group 1 in the proportion undertaking the smaller positive energy and water management habitual behaviours. Across most of these positive habitual behaviours, they are the least likely group to say they never do them. However they are no more likely than average to say that they would sacrifice their home comforts to save energy: only 45% are prepared to do this. In keeping with their ‘waste not want not’ mindset, they are the biggest recyclers of all seven groups: 9 out of 10 (88%) are already ‘recycling more’ and intend to keep it up. They are also the most likely to say that they cannot recycle any more as they already recycle all they can: just over half (55%) of the group say
viii

this. They are also more likely than average to reuse and avoid food wastage; for instance, one fifth (21%) never throw away any food even if it has gone off (they are the most likely group to say this). Where this group has cavity walls, they are the most likely to have insulation (6 in 10 do so); they are also the most likely to have fitted double-glazing or draught proofing. With cluster 1, they are the most likely to have asked for a water meter to be fitted (two-fifths have done so). - Purchasing The focus on saving energy in the home is evident in the four-fifths (79%) who say they would only buy kitchen appliances with high energy efficiency ratings even if they cost more, and they are more likely to have fitted energy efficient lightbulbs, both along with group 1. However the principal driver for this behaviour appears to be avoiding wastage; only just over one third (36%) are prepared to pay more for environmentally friendly products, the lowest of all groups except segment 7. Yet segment 2 is more likely than average to avoid buying from companies that they do not agree with the ethics of, and to buy free-range eggs and poultry. They are more likely to purchase local and seasonal products, which may be through a desire to support the local and national economy. - Travel Overall their attitudes to car use have more in common with groups 6 and 7; for instance, only 6% support car users paying more tax to cover their environmental impacts (against 25% of the whole population). They are the least likely to feel it would be easy for them to reduce their car use (only 22% feel they could do so easily), and they are more likely than average to say they lack practical alternatives. They are the most likely to own a car and the most reliant on their cars with the highest car dependency score, though it is seen that this is related to key demographics.5 It is notable that they are the most likely to say they have already switched to a more fuel-efficient car. 32% of this group say they have already reduced their car use (and they intend to keep it up); they are the second most likely group to have done so, after group 1. However, 29% say they do not want to cut down on car usage (only groups 6 and 7 are more likely to say so). Being more likely to live in rural areas may contribute to below average bus usage levels; however they are still more likely to say they’d only travel by bus if they had no other choice. 5 After controlling for key demographics (their age, income, tenure and working status), only group 1 have lower levels of car use and groups 4 and 7 both use a car more than group 2.
ix

They are also the second most likely (after group 1) to have reduced the amount they fly (and to intend to keep it up): 32% say they have done so. However a slightly greater proportion say (34%) say they do not want to do so. They are the third most frequent flyers of all segments.
x

Concerned consumers Segment 3 14% of the population “I think I do more than a lot of people. Still, going away is important, I’d find that hard to give up..well I wouldn’t, so carbon offsetting would make me feel better” 1. Sociogeodemographics • More ABC1 (5% above population average) • Very slightly more female (3% above population average) • Above average incomes: 32% on £40k and above household income (second
highest after group 1), including 16% on £60k and above (highest of all groups)
• Early middle age profile: 28% are aged 30-40 (highest of all segments), with lowest levels of 65 and over (10%)
• With group 5, the most likely group to have dependent children (37% vs. 32% population average)
• Most likely of all groups to be buying with a mortgage • After group 1, the second most likely to have a degree (23% have one); the
least likely of all groups to have no qualifications (17% have none) • Less likely than all but group 1 to read a daily paper regularly. When they do,
slightly more likely than average to read the Times, or a local/regional newspaper
• As population average across regions and types of areas that they live in; very slightly more likely to live in London or the South West
2. Ecological worldview This group hold broadly pro-environmental values and beliefs, although with less conviction than groups 1 and 4. They believe that there is an environmental threat and that it requires action now. They are more likely than average to reject the view that the environmental crisis has been exaggerated. Along with cluster 4 they reject the view that scientists will solve the problems without people making big lifestyle changes, with only cluster 1 more likely to reject this view. They are more confident that humans will find ways to overcome the solution, with two thirds agreeing behind 1 and 4. However, it is notable that they are the least likely of all groups to agree that we are reaching our natural limits to growth. Only 21% agree that we are close to the number of people the earth can support, while 37% disagree (only group 7 come near to this level of rejection). Similarly, while a majority of the group (53%) agree that an ecological disaster is imminent if we continue as we are, this is the second lowest rate of agreement of
xi

any group (second to group 7). In addition, while three quarters are concerned about changes to the UK countryside, this is less than other groups except 7. By contrast, group 3’s pro-environmental attitudes appear far stronger in relation to the threat of climate change. They are the second most likely group (only after group 1) to disagree that climate change is too far in the future to worry about, or that it is out of control. Similarly they are the second most likely group to acknowledge the impact of their behaviour and lifestyle on climate change (59% do so). 3. Lifestyle This group fall into the second tier of pro-environmental activity, based on their own assessment. While nearly as many as in groups 1 and 2 say they are doing ‘quite a few things’ which are environmentally friendly (50%), only 17% say they are environmentally friendly in ‘most things’ or ‘everything’ they do. However they resemble segment 1 in that the majority of this group (65%) say they would like to do ‘a bit’ or ‘a lot’ more to help the environment. Like group 1, the majority of this group disagree that being ‘green’ is an alternative lifestyle not for the majority (62%) and they are not embarrassed to be seen to be green (87% disagree). It seems ‘green’ self-identity may be a motivator for this group. 4. Motivations and barriers The environment is a high priority for this group: three fifths (59%) reject the view that the environment is a low priority compared to other issues in their life. (This makes them third among all groups, but only one point behind group 2 on 60% and far less than group 1 on 87%.) This group do not tend to report generic barriers to environmentally friendly behaviour. Indeed only group 1 is less likely to agree that most of the specified barriers prevented them from changing their behaviour. They are less likely than all but group 1 to say that pro-environmental changes need to fit in with their lifestyle (42% disagree, although 32% agree, indicating that this is still a strong barrier for many in group 3, as in all other groups). Similarly, guilt is not the issue for this group that it is for 1, 4 and 5, yet 6 in 10 (63%) reported sometimes feeling guilty about their environmental impacts, which is similar to the population average. They are also much less likely than average to cite other barriers such as cost, time, effort, or the difficulty of changing habits. Again showing their apparent interest in climate change, group 3 are the second most likely of all segments to think that the government is doing a lot to tackle climate change (although still less than one third (27%) of the group think so). Group 3 say they are committed to acting on climate change whatever others are doing, whether individuals, countries or government. Indeed just 6% agreed that
xii

it was not worth Britain making changes as other countries will cancel out what they doing – the lowest level of agreement of all the groups. They are less likely than other groups to favour government led action to make people change their behaviour. For example, this group recycle more than average though just under half (48%) would favour a system that ‘rewards those who recycle more and penalizes those who don’t’, which is the second lowest level after group 7. 5. Knowledge and engagement This group see themselves as quite knowledgeable about environmental terms, their levels are the third highest (between groups 2 and 5). Thus 74% say they know ‘a lot’ or ‘a fair amount’ about global warming, and 64% say the same about climate change. However large majorities of this group know ‘little’ or ‘nothing’ about carbon footprinting (74%), and offsetting (78%). The majority (61%) say they would like further information on what they can do to be more environmentally friendly (though this is less than groups 1, 4 and 5). As with group 2, their likelihood of encouraging others to be more environmentally friendly is the same as the population average – for example 21% claim they try to persuade people they know to be more environmentally friendly. They are slightly more likely to volunteer than average and this is more likely to be for school or youth related activities than the environment. Their level of membership of, or donation to, environment-related organisations (46%) is in line with the population average. 6. Attitudes to behaviours and current behaviours - In the home They have taken the small steps to being environmentally friendly in the home, and give more thought than all groups except 1 and 2 to saving water and energy. The group also ranks third in terms of reported behaviour change: 64% have already reduced their energy use in the home (and intend to keep it up), while 60% have done the same for water use. Their levels of doing the small positive energy and water management habitual behaviours are above average – generally after groups 1 and 2 and similar to group 5. They are more likely to think their bills would stay the same if they had a water meter. They do not appear to be opposed to water meters, although they are unlikely to be proactive in getting one. In terms of renewable energy, group 3’s levels of use are about average (ie. very low): only 2% buy electricity on a green tariff, and fewer than 1% have solar panels for electricity or water heating. It is notable that group 3 are the second least likely to identify with a ‘waste not, want not’ approach: just over half (52%) agree, and only group 7 are less likely to agree. It may be that this does not fit with their self identity though it also seems that their focus in this area is recycling. Their levels of recycling (including the
xiii

amounts they say they recycle and their usage of local recycling centres) put them third behind groups 1 and 2. - Purchasing Their attitudes to purchasing are similar to the population average (in this area this is the case for groups 3, 4 and 5). Despite their apparently ‘green’ identity and above average levels of income, only around half (47%) say they would be prepared to pay more for environmentally friendly products. A similar proportion (46%) say they make an effort to buy from local producers, while 50% say they try not to buy from a company whose ethics they don’t agree with. Meanwhile 60% say they would only buy energy efficient appliances (against a population average of 63%). They are more likely than average to buy organic food, free-range poultry, and Fair Trade products (indeed half have heard of and buy Fair Trade products which is second to group 1). - Travel Their attitudes towards car travel are also greener than average (ie. greener than groups 2, 6 and 7 in this area). Nearly two-thirds (64%) disagreed that people should be able to use their cars as much as they liked, regardless of the impact. They do not see higher taxes for car users as the solution (as fitting with their being less likely to favour government led action to make people change their behaviour, reported earlier). Just one in six (16%) of the group agree that cars users should pay higher taxes for the environment, only groups 2 and 7 are less likely to agree and this is significantly less than group 1. Their levels of car ownership and usage are also about average. For example, 31% say they have reduced their car use (and intend to keep it up), though only 14% say they don’t want to do so (the second lowest, after group 1). In line with average figures, 26% feel it would be easy for them to reduce their car use. However, 51% disagree that driving cars is too convenient to sacrifice for environmental reasons - only group 1 are more likely to disagree. They are less likely to cycle regularly though they are more positive about bus use and have higher levels of bus usage than any other group after controlling for key demographics.6 Group 3 appear attached to flying, indeed they are the most frequent flyers of all seven segments. Nonetheless, 27% report having reduced the amount they fly (and intend to keep it up); however, 28% of the group say they don’t want to do this. Fewer people in group 3 agree (34%) than disagree (37%) that people who fly should bear the cost of their impacts – only group 7 is more likely to disagree with this statement. 6 Age, sex, tenure, and income
xiv

While just over 1% have used carbon offsetting (similar to the population average), 27% say they are likely to do so in future, second only to group 1. Group 3 is more positive about offsetting in terms of the likely impacts and appropriate management. These findings suggest that carbon offsetting may have an increasing role for this group, rather than them looking to cut back on air travel.
xv
Sideline supporters Segment 4 14% of the population “I think climate change is a big problem for us. I suppose I don’t think much about how much water or electricity I use, and I forget to turn things off..I’d like to do a bit more” 1. Sociogeodemographics • Less ABC1 and more likely to be C2DE (60%) • Slightly more female (5% above population average) • Span all ages, but slightly more 16-29 (5% above population average) • Population average owner occupier and renting (though slightly more likely to
live in a council owned property (4% above population average)) • Less likely to have a degree (13% do so - only groups 6 and 7 have lower
levels) • More likely than average to read a daily newspaper regularly; when they do,
more likely to read the Sun and Daily Mail • Similar to population average in terms of urban/rural profile but bias towards
less affluent areas (38% in bottom three IMD deciles) • Less likely than average to live in South; most likely of all groups to live in the
North West, North East, and Yorkshire and Humberside
2. Ecological worldview Their ecological worldview is similar to group 1 though with slightly less conviction, in that they believe that all is not well with the environment and that it is up to individuals to do something about it. Theirs is a greener worldview than groups 2 and 3. Group 4 particularly feel that there is an imminent ecological crisis; for instance, 80% agree that if things continue on their current course we will soon experience an environmental disaster. Similarly nearly two-thirds (64%) disagree that the environmental crisis has been exaggerated. These levels are second only to group 1. They are also more likely than average to feel we are reaching the planet’s natural limits to growth. Again with group 1, they are more likely than average to agree that humans are capable of overcoming environmental problems, and more likely to disagree that scientists will find a solution without people making big lifestyle changes. This group also exhibit pro-environmental views in relation to climate change (nearly as strongly as groups 1 and 3). They are the third most likely of all groups to disagree that it is too late to act on climate change (75% disagree), and the second most likely to disagree that climate change is too far in the future to worry about (72% disagree).
xvi
3. Lifestyle Group 4 report lower levels of pro-environmental behaviour than groups 1, 2 and 3: only one third (36%) say they are doing ‘quite a few things’ which are environmentally friendly, and only 15% say they are environmentally friendly in ‘most things’ or ‘everything’ they do. The biggest subgroup (44%) say they are doing ‘one or two things’. Their assessment is closer to that of group 5 rather than group 3. The majority of this group (62%) say they would like to do ‘a bit’ or ‘a lot’ more to help the environment, a level similar to group 3. This group is not embarrassed to be green though nearly 4 in 10 (38%) see being green as a minority lifestyle. This is higher than all but groups 6 and 7, and closer to group 5 than 3. Again like group 5, half this segment (50%) believes their behaviour and lifestyle contributes to climate change (with clusters 1 and 3 more convinced of the link). 4. Motivations and barriers While their worldview is distinctly greener than most, group 4 is much more ambivalent about pro-environmental behaviour than groups 1, 2 and 3. Only 45% of group 4 disagree that the environment is a low priority for them, and this level is below average. This group acknowledges generic barriers more readily than groups 1 and 3. In contrast to groups 1 and 3, the majority of people in group 4 agree that changes must fit in with their lifestyle (54% agreeing, against only 22% disagreeing). Similarly more people in this group agree than disagree that they find it hard to change their habits. These levels are similar to those for group 5. The actions of others, time and effort are also important barriers to change for smaller numbers in this group. However, group 4 resemble segments 1, 2 and 3 in their reported willingness to do more irrespective of financial gain. 74% disagree that it is only worth doing environmentally friendly things if it saves you money. There is a big gap between this group and group 5 in response to this question (only 50% of group 5 disagree). Notably this group report high levels of guilt: 69% sometimes feel guilty about doing things that harm the environment. While group 1 reports the highest level (84%), group 4’s level is second equal with that of group 5 - although group 4 has many more people agreeing strongly with the statement (22% vs. 10% in group 5). Only 25% think that government is doing a lot to tackle climate change, and this level is average for the whole population. However group 4 is much more likely than average to say that if government did more they would do more too; 72% say this, and again this level is closer to that of group 5 than to 1, 2 and 3.
xvii

5. Knowledge and engagement This group reports below average levels of knowledge about environmental terms, significantly lower than those in group 3. 63% say they know ‘a lot’ or ‘a fair amount’ about global warming, and 54% say the same about climate change. Similarly, large majorities of this group know ‘little’ or ‘nothing’ about carbon footprinting (85%), and offsetting (86%). Notably this group is the second most likely to say they would like more information on what they can do to be more environmentally friendly: 78% say so. It is possible that this statement represents as much an excuse for inaction as a signal of their potential interest in acting. (It is notable that group 6 reports the highest level of agreement of all with this statement). As with groups 2 and 3, their likelihood of encouraging others to be more environmentally friendly is the same as the population average – for example 19% claim they try to persuade people they know to be more environmentally friendly. They are slightly less likely to volunteer than average, with 30% having done so in the last 12 months. They are also less likely than average to be members of (or to have donated to) environment-related organisations (41% report this). 6. Attitudes to behaviours and current behaviours - In the home This group’s ecological worldview has not translated into their behaviours in the home. They are less likely than groups 1, 2, 3, and 5 to be undertaking energy saving, water saving, or recycling behaviours in the home. Fewer than half of group 4 report that they have already reduced their resource use (and intend to keep it up) in relation to energy (49%) and water (39%). They are the most likely of all groups to say they don’t give much thought to saving energy at home (53%) or the amount of water they use (74%). They are more likely to put home comforts above saving energy and more likely to behave ‘wastefully’ across smaller energy and water management habitual behaviours, such as turning the tap off when cleaning your teeth or turning lights off in rooms you are not using. They do have slightly ‘greener’ attitudes and behaviours relating to recycling, with 67% saying they recycle more than they throw away; again, this level is similar to group 5 and significantly less than groups 1, 2 and 3. - Purchasing Despite 74% of this group disagreeing that it is only worth undertaking pro-environmental behaviours if they save you money, slightly fewer than average (42%) say they’d be prepared to pay more for environmentally-friendly products. Similarly 46% say they make an effort to buy from local producers, and 52% say
xviii
they try not to buy from a company whose ethics they don’t agree with. They are less likely than average to have changed their behaviour to buy food produced locally: while 30% say they do, 25% say they haven’t thought about it. They are less likely than average to buy free-range eggs and poultry, or Fair Trade products. Fewer than average (56% vs. 63% of all) say they would only buy energy efficient appliances. Only 1% buy their electricity on a green tariff, and only 2% are seriously thinking about doing so (against 6% of the whole population). They are less likely to have energy efficient lightbulbs than all but groups 6 and 7 and more likely to say this is because they ‘haven’t thought about it’. - Travel While their ecological worldview may imply a group that is concerned about the global environment, they do not have particularly green travel attitudes or behaviours. Only one quarter (24%) of group 4 say they have reduced their levels of car use (and intend to keep it up) – only groups 6 and 7 are less likely to have done so. Meanwhile a larger proportion (28%) say they do not really want to do so. At the same time, group 4’s favourable views towards car use are evident. Only 19% agree that car users should pay more tax to cover their environmental impacts (this level is below average). Only 21% disagree that people should be allowed to use their cars as much as they like even if it causes damage to the environment; this level is significantly lower than that for groups 1, 3 and 5 and closer to group 2. However, they continue to signal their good intentions in principle: they are as likely as groups 1 and 2 to agree they would like to reduce their car use if there were adequate alternatives available. Nonetheless, a higher proportion than average of their travel is by car (rather than cycling or bus). One quarter (25%) of group 4 say they have reduced the amount they fly (and intend to keep it up); only group 7 are less likely to have done so. More than one third (36%) of group 4 say they do not really want to do so. However, it should be noted that group 4 is one of the least frequent flying segments; though after controlling for socio-economic factors they fly a little more than most other groups, although still less than group 3.
xix

Cautious participants Segment 5 14% of the population “I do a couple of things to help the environment. I’d really like to do more..well as long as I saw others were”
1. Sociogeodemographics • Younger than average group: 26% under 30 and only 14% aged 65 and over • A middling group - social grades, household income and geodemographic
profile similar to population average • Slightly more likely to be renting or living with parents. Those renting more
likely to rent from a private landlord • Third most likely group to have school, college or university qualifications
(after 1 and 3) • 19% have a degree: third most likely group to do so (after 1 and 3) • Most likely group to have dependent children, with group 3 (37% vs. 32%
population average)
2. Ecological worldview This group’s ecological worldview is much like the average for the whole population. Members of this group recognise climate change is an issue, they tend to think we are reaching the planet’s natural limits to growth, and that man should not interfere with nature. They are more likely than average to think that an ecological disaster is imminent; three quarters (73%) agree that we are heading for an environmental disaster (highest after groups 1 and 4) and only 19% agree that the current ‘environmental crisis’ has been greatly exaggerated. 60% of people in group 5 agree that humans can find ways to overcome the world’s environmental problems, though this level is below average. They are also notably less optimistic than most about climate change: for instance, only 53% disagree that it is too late to act on climate change (against 75% in group 4). Likewise only 60% disagree that the effects of climate change are too far in the future to worry about, which is less than group 4. 3. Lifestyle Group 5’s assessment of their own levels of pro-environmental behaviour is very similar to that of group 4. Slightly more people in group 5 (41%) say they are doing ‘quite a few things’ which are environmentally friendly, but slightly fewer (11%) say they are environmentally friendly in ‘most things’ or ‘everything’ they do. The biggest subgroup of group 5 (43%) say they are doing ‘one or two things’ (similar to 44% in group 4).
xx

By contrast with group 4, group 5 are the second most likely (after group 1) to say they would like to do more: 74% of group 5 say they would like to do ‘a bit’ or ‘a lot’ more to help the environment, while only 26% say they are happy with what they are currently doing. Like group 4, half this segment (49%) acknowledges that their behaviour and lifestyle contributes to climate change, behind groups 1 and 3. Also like group 4, group 5 perceive being green as an alternative lifestyle: only 39% disagree which is less than groups 1, 2 and 3. 4. Motivations and barriers Many people in group 5 do not currently act for the sake of the environment: only 40% disagree that the environment is not a low priority for them. Only groups 6 and 7 are less likely to disagree (albeit they do so at much lower levels). Group 5 cite a wide range of generic barriers. Over half (54%) say that changes need to fit with their lifestyle (54% of group 4 also say this), while 40% say it is hard to change their habits (this is above the average level of 33%). Time and effort are also notable barriers, more so than for all but groups 6 and 7. Group 5 are also much more likely than groups 1, 2 ,3 and 4 to say that it is only worth acting pro-environmentally if it saves them money (22% agree, against 11% for group 4). The majority of group 5 (69%) sometimes feel guilty about harming the environment; this is the second highest level after group 1, and is equal with group 4 (although fewer in group 5 - 10% - agree strongly with this statement). Higher than average guilt does not however lead to an environmental identity for many in group 5 – just over half (54%) say they wouldn’t be embarrassed to be seen as environmentally friendly (putting them with groups 6 and 7 and 25% lower than any of groups 1, 2, 3 and 4). Others acting is important for this group and a key distinction between this group and groups 1, 2, 3 and 4. They think more about their behaviour with regard to others acting (individuals, countries and government). They are as likely as average to say government is doing a lot to tackle climate change (23% say so), although they are much more likely than average to say they would do more if the Government did more (70% say so, similar to group 4’s 72%). They are also more likely than most groups to point to the actions of other individuals and countries as an excuse for inaction. 5. Knowledge and engagement This group reports below average levels of knowledge about environmental terms (yet they are marginally higher than those of group 4). 65% say they know ‘a lot’ or ‘a fair amount’ about global warming, and 63% say the same about
xxi

climate change. 75% of group 5 know ‘little’ or ‘nothing’ about carbon footprinting and 83% know ‘little’ or ‘nothing’ about offsetting. 73% say they would like more information on what they can do to be more environmentally friendly; this is above average levels, but lower than that reported by group 4. Group 5 are slightly less likely to encourage people to be more environmentally friendly, though the 18% that report they have suggested improvements in the workplace is slightly above average. Their engagement with voluntary organisations is average for the population; for example 33% say they’ve volunteered in the last 12 months. 6. Attitudes to behaviours and current behaviours - In the home They are more likely than average to pay attention to the amount of energy and water they use in the home (74% and 64% do this respectively). These levels are also massively higher than the very low levels reported by group 4 (26% and 14% respectively). Just over half of group 5 (55%) have already reduced their energy use (and intend to keep it up), and half (50%) have done the same for their water use. Two thirds (67%) have done likewise regarding recycling more. Thus across these three areas group 5 report behaviour change at average levels. Additionally they are above average supporters of recycling: 84% agree that people have a duty to recycle, and 56% would support a system that rewards people who recycle all they can and penalises those who don’t (the latter second to group 1). They are least likely to have a water meter and more likely to think bills would increase with a water meter. - Purchasing Their attitudes to purchasing are similar to the population average (in this area similar to groups 3, 4 and 5). 47% say they’d be prepared to pay more for environmentally friendly products (a slightly higher level than for group 4), while 43% say they make an effort to buy from local producers. A similar level (46%) say they try not to buy from a company whose ethics they don’t agree with. 63% would only buy energy efficient appliances (again, higher than group 4’s 56%). Group 5 buy electricity on a green tariff at around average levels. - Travel Their views on environmentally damaging behaviour centre on travel, with only group 1 having less favourable attitudes towards car and plane use. 68% of group 5 disagree that people should be able to use their car as much as they want regardless of environmental damage (only group 1 disagree more). Similarly 40% agree that car users should pay higher taxes for the sake of the environment (against the average of 25%). However, 45% agree that they would like to reduce their car use but they lack practical alternatives – this is in line with the population average. Generally, they have less attachment to their cars than most other groups and are more likely to see car travel as stressful. Despite
xxii

these greener attitudes, group 5’s car use is broadly in line with the average: 29% say they have reduced their level of car use (and intend to keep it up). However, only 17% say they don’t want to do so, and this is below the average level of 24%. Interestingly group 5 are the most likely segment to say they are thinking about reducing their car use (14% say this), suggesting there is potential for future change here. Yet getting in the car is still an automatic choice for a large proportion of this group: 42% say they don’t consider alternatives when they are going out. However, they are more likely than average to use bicycles and buses. Group 5 report having reduced their air travel at the same level as average: 28% have already done so (and intend to keep it up), while only 25% don’t want to do this (against the average of 31%). They are the fourth most frequently flying segment.
xxiii
Stalled starters Segment 6 10% of the population “I don’t know much about climate change. I can’t afford a car so I use public transport..I’d like a car though” 1. Sociogeodemographics • Lowest social economic group profile of any group: 46% DE (highest of all),
29% C2 (above population average) • Lowest levels of household income: 44% under £20k household income • Younger and older people over-represented; least likely group to be aged 41-
54 • Slight male bias (5% above average) and young male bias (16% male aged
16-29) • Highest levels renting (46%) and lowest level of owner occupiers • Least likely of all groups to be working (44% full or part time) • By far the least likely to hold any qualifications – 48% have none. Least likely
to hold a degree (6% do so) • Most likely of all groups to be in local council owned property • Most likely group to live in a big city, and most likely to live in London (20%). • Most ethnically diverse group: 21% non-white • Most likely to read a daily paper regularly; most likely of all groups to read the
Sun (23%), the Mirror (16%), as well as the News of the World (23%) 2. Ecological worldview It is hard to take the findings on group 6’s ecological worldview at face value, as it is noticeable that they are more likely than average to agree with each of the statements in this section of the survey (whether the statements are positive or negative). This pattern suggests that they are not properly weighing each question before responding and other findings across the survey suggest they may not have the knowledge or inclination to do so in this area. Such distorted answering effects are known as satisficing (giving the answer the researcher may be looking for), and acquiescence (saying yes). Where statements on a given issue are positive and negative, such as on the ecological crisis, group 6 will agree with both. They are the second most likely to say we will soon experience a major environmental disaster, but they are also the most likely to agree that the ecological crisis has been greatly exaggerated. Group 6 also appear to think that we are reaching the earth’s natural limits to growth; however, they may just be agreeing with the two negative statements on the issue. Group 6 are also far more likely than any other to agree with two negative statements about climate change: 45% say it’s too late to do anything about climate change, while 68% agree that climate change is too far in the future to worry about (against the population average levels of 17% and 21% respectively).
xxiv

3. Lifestyle Based on their own assessment, group 6 have the second lowest levels of pro-environmental behaviour. The biggest subgroup (34%) say they do only ‘one or two things’, and 16% say they do nothing at all. Only group 7 report doing less (59% report doing one or two things or nothing). Only 29% of group 6 say they do ‘quite a few things’ (the same level as group 7). Despite these low levels of activity, 68% say they are happy with what they are currently doing, and only 31% say they would like to do more (the third lowest level, after groups 7 and 2). However, group 6 lead all others in denying the impact of their behaviour on climate change: 57% agree that they don’t believe their behaviour and lifestyle contribute to climate change (against a population average of 28%). Group 6 are also the strongest believers that being ‘green’ is an alternative lifestyle not for the majority at 69% (against the average level of 30% agreement). 4. Motivations and barriers This group is the most likely by far to agree that the environment is a low priority for them: 64% do so (against the population average of 27%). In a similar pattern to the worldview questions, members of this group are the most likely to agree with each of the statements relating to generic barriers though the overall picture is less confused. Thus 73% say that behaviour changes need to fit with their lifestyle, and 68% agree that it is only worth doing environmentally friendly things if they save money. Time and effort are also barriers for group 6, as well as others’ actions.
The vast majority say they would do more if government did (84%), though this group are by far the most likely to agree that government is doing a lot to tackle climate change (47% say so) so this may be affected by their tendency to agree with some statements. Guilt is not a key issue for this group. While this group are more likely than average to agree strongly that they sometimes feel guilt about harming the environment, as a whole they show only average levels of agreement, with 60% agreeing that they sometimes feel guilty. 5. Knowledge and engagement Group 6 report the lowest levels of knowledge about environmental issues. Only 49% say they know ‘a lot’ or ‘a fair amount’ about global warming, and only 39% say the same about climate change. Meanwhile 73% say they know ‘little’ or ‘nothing’ about carbon footprinting, and 72% say the same about offsetting. Group 6 are the most likely to say they would like more information on what they
xxv

can do to be more environmentally friendly (77% say this) but it is more likely that this is another case of acquiescing than a signal of intent on their part. Group 6 are however less likely than average to report talking to other people about the environment, or to try to persuade them to behave in more environmentally friendly ways (only group 7 are less likely to report this). Group 6 are also the second least likely group to be a member of (or donate to) environment-related organisations: 31% report this. 6. Attitudes to behaviours and current behaviours - In the home They are much less likely than average to save energy and water in the home. They are the second least likely to have reduced their energy use: 44% have done so (and intend to keep it up), and they are the least likely (equal with group 7) to have done the same for their water use (35% have done so). 50% say they don’t give much thought to saving energy, and 58% say the same about saving water; only group 4 are less likely to think about resource saving. Along with group 7, they are consistently least likely to be doing any of the positive water and energy management habitual behaviours. They are more likely to have fitted or had fitted improved loft insulation – this may be linked to the higher levels of local authority renting. It seems this group would not be opposed to others (eg. landlords) fitting more environmentally friendly products in their homes. For example, they are more likely to agree they would like to install insulation but that it costs too much. Interestingly they are as likely as average to say they buy their electricity on a green tariff (3% do so). However they are the least likely group to have installed energy-saving lightbulbs (33% do not have any). Group 6 have slightly more positive attitudes towards recycling; for instance, 75% agree that people have a duty to recycle (albeit slightly lower than the average level of 80%). Just over half (53%) report recycling more (and intending to keep doing so); this is the second lowest level, after group 7. - Purchasing They are fractionally less likely than the average for the population to say they would be prepared to pay more for environmentally friendly products (43% vs 45%). However, they are less likely than average to say they try not to buy from a company whose ethics they don’t agree with, and less likely than average to buy local food. Fewer than average buy free range eggs (60%), poultry (15%), or Fair Trade products (28%).
xxvi

- Travel This group have very ungreen travel attitudes. Despite being the least likely to own a car, they are the most likely to say that car use is a right regardless of environmental impact (42% say this), and that more roads are the answer to congestion (65% say this). They are the second least likely group to have reduced their car use (and to intend to keep it up): 23% of those with cars have done so. A greater proportion (33%) do not really want to do so. They do not like buses, and are the most likely group to see them as a last resort for those who cannot afford better (27% say this, against an average of 12%). Group 6 are also the second least likely group to have reduced their air travel (and to intend to keep it up): 25% of those who fly have done so. Again, a larger group (33%) don’t really want to do so. However group 6 are the least frequent flying of all segments.
xxvii

Honestly disengaged Segment 7 18% of population “Maybe there’ll be an environmental disaster, maybe not. Makes no difference to me, I’m just living my life the way I want to” 1. Sociogeodemographics • Spread across social classes but ABs under-represented • More likely to be male (7% above average) and slight young male bias • Spread of ages but more likely than average to be younger: 27% under 30
(against 22% population average) • Most likely to be working full time: 43% do so (6% above population average) • Tend to be on lower incomes: 59% earn under £40k, and most likely of all
groups to be on between £20k and £25k (10% are) • Less likely than average to have a degree (13% do so) • More likely to be renting (36% do so) • Slightly more likely than average to read a daily paper regularly. Most likely
of all (equal with group 6) to read the News of the World (23%); more likely than average to read the Sun (20%), as well as the Star (5%)
2. Ecological worldview Group 7 has one of the most negative ecological worldviews of all segments. Members of this group are the least inclined to agree that an ecological crisis is imminent: only 26% agree we will soon experience a major environmental disaster, while 31% disagree. Similarly they are the second most likely group to agree that the environmental crisis has been greatly exaggerated (51% think so, behind group 6 on 56%). Only a minority of group 7 think we are reaching the planet’s natural limits to growth (only group 3 are less likely to think so). They are also the least likely group to think that humans are capable of overcoming the world’s environmental problems (only 53% agree with this statement). As well as holding some of the most negative views, group 7 can also be characterised by their sense of indifference on environmental issues. On each of the main issues, roughly a third of this group (more than any other) does not express an opinion one way or the other, instead saying that they ‘neither agree or disagree’. It appears that they do not choose to let debates about the environment and climate change touch their lives. 39% of group 7 say that climate change is too far in the future to worry about, and 22% say that it is too late to act on climate change. These are the second highest levels of agreement with these statements, after group 6, and more than 20% higher levels of agreement than any other group. Their lack of conviction that humans are capable of overcoming the world’s environmental problems is seen in their responses to questions about the impacts of specific behaviours – they were by far the least likely to see that any of them could have a major impact.
xxviii

3. Lifestyle Group 7 rate their own levels of pro-environmental behaviour as the lowest of all the segments. The biggest subgroup (45%) say they do only ‘one or two things’, and 14% say they do nothing at all. Only 29% say they do ‘quite a few things’ (the same level as group 6). Alongside these lowest levels of environmentally friendly behaviour, they also have the highest proportion of people saying they are happy with what they do: 75% say this. About a quarter say they would like to do a bit more. Only 15% disagree that being ‘green’ is an alternative lifestyle not for the majority - but their view on this question is much more ambivalent than that of group 6. 40% of group 7 don’t have a view on the question either way (against the population average of 24%). 4. Motivations and barriers This group is honest about their indifference to environmental issues: 50% agree that the environment is a low priority for them (the second highest level after group 6) and only 12% disagree (the lowest of any group). They are the second most likely after group 6 to deny the impact of their behaviour on climate change: 43% agree that they don’t believe their behaviour and lifestyle contribute to climate change (against a population average of 28%). They do not seek excuses for their lifestyles; they are only slightly more likely than average to say that it is too much effort or hard to find the time. They are more likely than average to say that they find it difficult to change their habits (42% say so), or that change needs to fit with their lifestyle (53% say so), though these levels are only third or fourth highest. They are also more likely to think it is not worth acting if others do not. On all these statements, they are the most likely of any group to say they do not have a view either way. Along with their indifference, group 7 exhibit cynicism in relation to the role of government. Only 20% agree that government is doing a lot to tackle climate change, making them the second least likely group to agree with this statement. They are also disarmingly honest on the issue: they are the least likely of all groups to say they would do more if government did too (only 40% say this). Their honesty is also apparent in response to the question on guilt: group 7 are the least likely by far to say they sometimes feel guilty about their environmentally-harmful behaviour: only 23% say so (nearly half as many as the next least likely group, group 2, of whom 45% say they sometimes feel guilty). Of course, the biggest subgroup of group 7 (41%) do not have a view either way on this question.
xxix

5. Knowledge and engagement This group has some of the lowest levels of knowledge about environmental terms. Only 49% say they know ‘a lot’ or ‘a fair amount’ about global warming (equal lowest with group 6), and only 45% say the same about climate change (second only to group 6). However, they have the highest proportions saying they know ‘little’ or ‘nothing’ about carbon footprinting (81%), and offsetting (84%). With characteristic honesty, group 7 are the least likely of all to say they would like more information on what they can do to be more environmentally friendly: only 41% do so, in sharp contrast to group 6 who are the most likely of all groups to say this. Group 7 are the least likely by far to report talking to other people about environmental issues (only 15% do so, against an average of 31%), or to try to persuade them to behave in more environmentally friendly ways (only 4% do so, against 20% of all). They are also the least likely of any group to be a member of (or donate to) environment-related organisations: only 29% report this. They are less engaged in their community than most, and when they do volunteer it is more likely to be for sport and youth activities. 6. Attitudes to behaviours and current behaviours - In the home Group 7 is the least likely to have reduced their energy use: 40% have done so (and intend to keep it up), and they are also the least likely (equal with group 6) to have done the same for their water use (35% have done so). Group 7 are the most likely of all groups to say they haven’t really thought about reducing their energy and water use (17% and 23% say this respectively). In fact this group is the most willing group to say that they don’t want to or haven’t thought about doing all the pro-environmental behaviours considered. They pay less attention than average to the amount of energy and water they use, with around a third saying they think about their use of these resources. Along with cluster 6, they are the most likely to say they regularly undertake small ‘wasteful’ behaviours in the home, like leaving the TV on standby. While they are one of the least likely groups to have energy efficient lightbulbs (with group 6), 69% have at least one. They are more likely to think that their bills would increase with water meter. Group 7 is the least waste focused of all, being least likely to recycle, avoid waste, or re-use. They are the least likely group to say they are already recycling more: 48% have done so (and intend to keep it up). Nonetheless, at least 70% claim they put out different materials for collection.
xxx

xxxi
- Purchasing Group 7 again display their honesty in response to the questions on ethical purchasing. They are by far the least likely segment to say they would be prepared to pay more for environmentally friendly products. Only 13% say they’d be prepared to pay more, nearly three times lower than the next least likely group (group 2, on 37%). While 28% of group 7 are neutral on this question, 54% explicitly say they would not pay more. In keeping with this response, they are the least likely group to say they try not to buy from a company whose ethics they don’t agree with, and they are least likely to buy local food. They are the least likely group to buy free range eggs (although notably the majority -57% - still do regularly), and Fair Trade products (36%). - Travel Group 7 is the least likely to have reduced their car use (and to intend to keep it up): only 15% have done so. People in this group are nearly three times as likely not to want to do so: 40% do not really want to (again, the highest of all groups). Group 7’s attitudes to travel are consistent with their negative views on the environment; they are the second most likely to agree that people should be able to use their cars regardless of environmental impact (38% say this), and they are the second least likely to call for higher taxes for car users (only 10% do so). Their levels of car use and ownership are broadly average, although they are slightly more likely to drive cars with larger engines (which may explain why they are the least likely of all groups to have switched to a more fuel efficient car). Group 7 is also the least likely of all groups to have reduced their air travel (and to intend to keep it up): 18% have done so, while more than twice as many (45%) don’t really want to do so, again the highest level of all groups. Group 7 fly at around average rates for the population.