a framework for modeling the complex interaction … · a framework for modeling the complex...
TRANSCRIPT
Proceedings of the 2014 Winter Simulation Conference
J A. Tolk, S. D. Diallo, I. O. Ryzhov, L. Yilmaz, S. Buckley, and J. A. Miller, eds.
A FRAMEWORK FOR MODELING THE COMPLEX INTERACTION
BETWEEN BREAST CANCER AND DIABETES
Shadi Hassani Goodarzi
Kendall McKenzie
Nisha Nataraj
Julie S. Ivy
Maria Mayorga
Industrial & Systems Engineering
North Carolina State University
Raleigh, NC 27695, USA
Jennifer Mason Jeremy Tejada
Department of Public Health Sciences SIMCON Solutions, LLC
University of Virginia 5041 Lahoma Street
Charlottesville, VA 22908, USA Dallas, TX 75235, USA
ABSTRACT
In 2010, over 200,000 women in the U.S. were diagnosed with invasive breast cancer, and an estimated
17% of those women died from the disease, according to the Centers for Disease Control and Prevention
(CDC). Also in 2010, the CDC reported that 12.6 million women had diabetes, the seventh leading cause
of death in the U.S. Recent medical literature provides conflicting evidence regarding a link between
insulin resistance and breast cancer risk. Although models have characterized these prevalent diseases
individually, little research has been conducted regarding the interaction between breast cancer and
diabetes. We build a simulation model framework that explores this complex relationship, with an initial
goal of assessing the prognosis for women diagnosed with diabetes considering their breast cancer risk.
Using data from national survey and surveillance consortium studies, we estimate morbidity and
mortality. This framework could be extended to study other diseases that interact with breast cancer.
1 MOTIVATION
The lifetime risk of developing diabetes for a woman born in 2000 is 2 in 5 (Narayan et al. 2003), while 1
in 8 women will develop breast cancer in their lifetime (National Cancer Institute 2012). Some women
must manage both diseases. Recent evidence suggests that there may be a link between diabetes and the
risk of developing breast cancer (Hardelfeldt et al. 2012). However, to the best of our knowledge, no
work has been done to understand the impact that diabetes and its care may have on breast cancer
incidence at the population level, and no recommendations exist about how to tailor diabetes treatment for
women given their future breast cancer risk. We believe that a systematic approach that creates an
integrated model for the progression of both diseases and associated comorbidities can be used to inform
and ultimately improve treatment.
Almost 26 million adults and children have diabetes in the U.S., and the direct and indirect costs of
the disease are estimated at $245 billion/year, according to the American Diabetes Association (ADA
2014). It is estimated that, by the year 2020, diabetes mellitus and pre-diabetes could impact 53% of adult
women (up from 43% in 2007-2008) (Huffman 2012). The impact on women’s lives is significant, as

Hassani Goodarzi, McKenzie, Nataraj, Ivy, Mayorga, Mason, and Tejada
diabetes is associated with several micro- and macro-vascular complications, including renal disease,
cardiovascular disease and stroke.
Breast cancer is one of the leading causes of cancer-related death among U.S. women (USCS 2013).
A Surveillance, Epidemiology and End Results (SEER) study estimated that approximately 232,000 U.S.
women will be diagnosed with breast cancer in 2013 and over 39,000 will die of the disease (Howlader et
al. 2010). Furthermore, breast cancer is associated with the psychological impact and trauma of long-term
screening and treatment. Treatment can result in complications and side-effects, such as lymphedema
(Shah 2011), and increased risk of other cancers due to metastasis (Van Leeuwen 1994). The projected
costs associated with breast cancer in the U.S. for 2012 were $17.35 billion (Liebman 2012).
1.1 Impact of diabetes on breast cancer
Diabetes mellitus and breast cancer both negatively impact quality of life. A meta-analysis by Hardefeldt
et al. (2012) on 40 previous studies investigating the link between diabetes and breast cancer found that
the odds ratio for breast cancer in women with type 2 diabetes is 1.22. All but one of the studies reached
one of two conclusions: either diabetes medication had no association with breast cancer risk, or diabetes
medication increased breast cancer risk. Chlebowski et al. (2012) found that women taking metformin had
lower breast cancer incidence (HR = 0.75), whereas women on other diabetes medications had a slightly
higher incidence of breast cancer (HR = 1.16). Hsieh et al. (2012), Jordan et al. (2009), and Khachatryan
et al. (2011) reported that patients with type 2 diabetes, specifically, had significant increases in breast
cancer risk with odds ratios of 1.11, 8.4, and 5.53, respectively. However, Cleveland et al. (2012) and 24
(of 40) other studies in the Hardefeldt et al. (2012) meta-analysis reported the relationship between
diabetes and breast cancer risk was not statistically significant. The clearly contradictory results of this
meta-analysis suggest that further study of the complex interaction between these two diseases and the
medications used to treat diabetes is necessary.
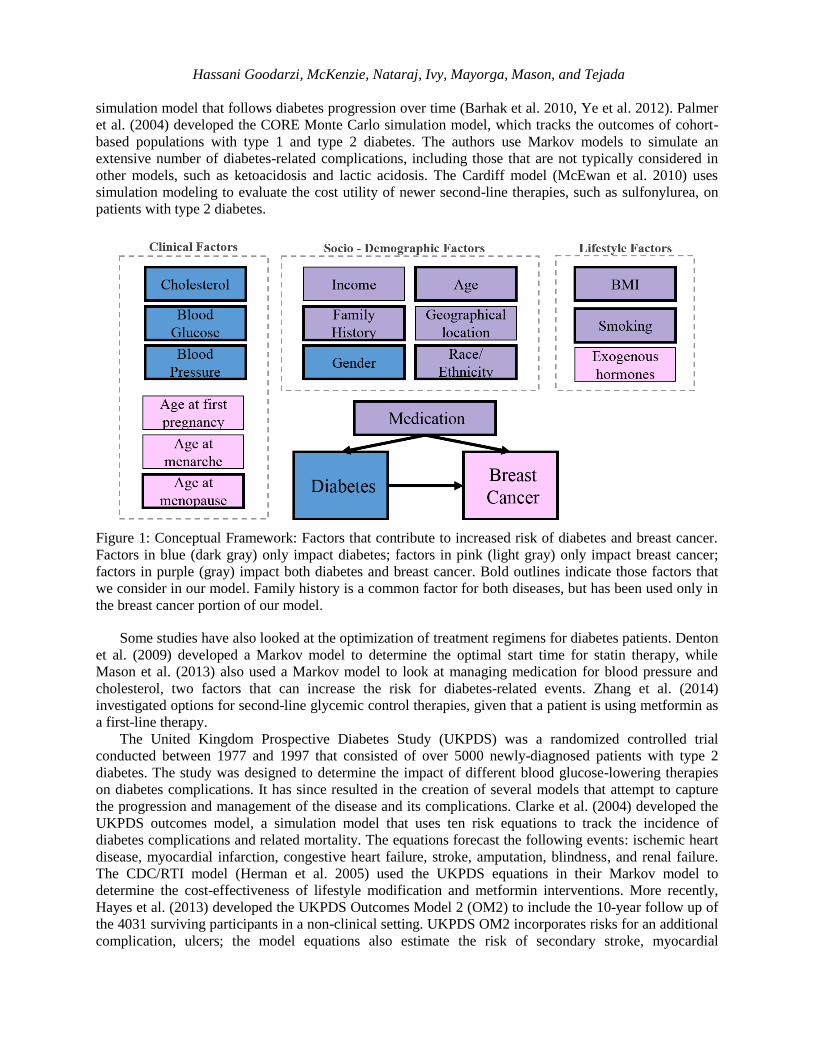
Individually, diabetes mellitus and breast cancer are complicated diseases that have different effects
on people of different ages, races, and socio-economic status. Figure 1 describes clinical, socio-
demographic, and lifestyle risk factors that have been associated with diabetes and breast cancer
incidence. Some risk factors including age, smoking, race, and body mass index (BMI) increase the risk
for both diseases, while others are thought to impact only one of the two. Diabetes and other clinical
factors can impact the type of medication an individual is prescribed. While insulin may control diabetes
and thereby reduce the risk of associated comorbidities and complications, it can also have unintended
consequences. For example, insulin has been linked to an increased breast cancer mortality (Currie et al.
2012). There is evidence to suggest that obesity increases insulin resistance, which accelerates the onset
and complicates the prognosis of diabetes (Orgel and Mittelman 2013). Obesity, represented in the figure
by BMI, will remain a consistent problem in the U.S. population with a projected 86.3% of adults being
overweight or obese by 2030 (Wang et al. 2008). Increased insulin resistance results in higher doses of
insulin, which in turn increases the risk of developing breast cancer. Clinical decision making will
continue to remain a challenge until we can fully capture the potential links between these two diseases
and the role of these risk factors.
2 RELEVANT LITERATURE
In the discussion below, we present a brief review of the common disease models for each disease, as well
as a summary of the medical evidence related to their interaction.
2.1 Diabetes Models
Natural history models provide a foundation for understanding disease prognosis with the goal of
improving treatment decision making. Zhou et al. (2005) used data from the Wisconsin Epidemiologic
Study of Diabetic Retinopathy to simulate a semi-Markov model of the natural history of diabetes
progression. The Michigan model (based on (Zhou et al. 2005)), has evolved to become an interactive
Hassani Goodarzi, McKenzie, Nataraj, Ivy, Mayorga, Mason, and Tejada
simulation model that follows diabetes progression over time (Barhak et al. 2010, Ye et al. 2012). Palmer
et al. (2004) developed the CORE Monte Carlo simulation model, which tracks the outcomes of cohort-
based populations with type 1 and type 2 diabetes. The authors use Markov models to simulate an
extensive number of diabetes-related complications, including those that are not typically considered in
other models, such as ketoacidosis and lactic acidosis. The Cardiff model (McEwan et al. 2010) uses
simulation modeling to evaluate the cost utility of newer second-line therapies, such as sulfonylurea, on
patients with type 2 diabetes.
Figure 1: Conceptual Framework: Factors that contribute to increased risk of diabetes and breast cancer.
Factors in blue (dark gray) only impact diabetes; factors in pink (light gray) only impact breast cancer;
factors in purple (gray) impact both diabetes and breast cancer. Bold outlines indicate those factors that
we consider in our model. Family history is a common factor for both diseases, but has been used only in
the breast cancer portion of our model.
Some studies have also looked at the optimization of treatment regimens for diabetes patients. Denton
et al. (2009) developed a Markov model to determine the optimal start time for statin therapy, while
Mason et al. (2013) also used a Markov model to look at managing medication for blood pressure and
cholesterol, two factors that can increase the risk for diabetes-related events. Zhang et al. (2014)
investigated options for second-line glycemic control therapies, given that a patient is using metformin as
a first-line therapy.
The United Kingdom Prospective Diabetes Study (UKPDS) was a randomized controlled trial
conducted between 1977 and 1997 that consisted of over 5000 newly-diagnosed patients with type 2
diabetes. The study was designed to determine the impact of different blood glucose-lowering therapies
on diabetes complications. It has since resulted in the creation of several models that attempt to capture
the progression and management of the disease and its complications. Clarke et al. (2004) developed the
UKPDS outcomes model, a simulation model that uses ten risk equations to track the incidence of
diabetes complications and related mortality. The equations forecast the following events: ischemic heart
disease, myocardial infarction, congestive heart failure, stroke, amputation, blindness, and renal failure.
The CDC/RTI model (Herman et al. 2005) used the UKPDS equations in their Markov model to
determine the cost-effectiveness of lifestyle modification and metformin interventions. More recently,
Hayes et al. (2013) developed the UKPDS Outcomes Model 2 (OM2) to include the 10-year follow up of
the 4031 surviving participants in a non-clinical setting. UKPDS OM2 incorporates risks for an additional
complication, ulcers; the model equations also estimate the risk of secondary stroke, myocardial

Hassani Goodarzi, McKenzie, Nataraj, Ivy, Mayorga, Mason, and Tejada
infarction and amputation events. Because these equations also use additional clinical and historical
predictors, such as estimated glomerular filtration rate and presence of micro- and macro-albuminuria,
they are thought to represent the risks of diabetes-related complications more accurately than the
outcomes model developed by Clarke et al. (2004).
2.2 Breast Cancer Models
Natural history models for breast cancer have been developed to aid in the selection of better treatment
and screening policies. There have been several analytic models developed for assessing screening
policies. Kirch and Klein (1974) used mathematical modeling, Shwartz (1978) used a Markov model, and
later, Baker (1998) developed a continuous-time non-Markov model. Maillart et al. (2008) developed a
partially observable Markov process model to evaluate various dynamic screening policies.
Although these analytic models provide insights about breast cancer progression and effective
screening policies, the simplifying assumptions necessitated by the model structures limit their ability to
capture the complex dynamics of the disease behavior. By using simulation, it is possible to more
accurately model disease progression and complex interactions between the diseases under various
interventions. Simulation can be used to study disease progression for each individual, while allowing for
observation of a group as a whole as different system-wide and individual policies are applied.
De Koning et al. (1995) extended the MIcrosimulation Screening Analysis (MISCAN) computer
simulation package (first developed for all diseases by Habbema et al. (1985); later developed for breast
cancer by Van Oortmarssen et al. (1990)) to evaluate five different screening policies. They assumed six
discrete stages for breast cancer, starting in a disease-free stage and assuming time spent in each of the
stages follows an exponential distribution. Michaelson et al. (1999) developed a Monte Carlo-based
simulation that uses a Poisson distribution to estimate the number of cell metastasis based on tumor size.
Another important series of models were developed by the Cancer Intervention and Surveillance
Modeling Network (CISNET) program to evaluate the impact of screening policies for breast cancer. The
CISNET program, comprised of seven models (six of which are simulation models), evaluates the impact
of adjuvant therapy and screening policies on the U.S. population from 1975-2000 under different
scenarios (Clarke et al. 2006). The Wisconsin model by Fryback et al. (2006) uses discrete event
simulation (DES) to model breast cancer progression, where tumors grow according to a Gompertz
distribution, in the population of the state of Wisconsin. The Erasmus University Rotterdam model
developed by Tan et al. (2006) used the MISCAN-Fadia model to predict and compare different screening
policies in a dynamic population. The DES model generates independent individual life histories
including events like birth, initiation of a breast cancer tumor, clinical diagnosis of the tumor, death from
breast cancer, and death from other causes. Tejada et al. (2013a, 2013b) developed a combined DES and
system dynamics (SD) simulation model for breast cancer screening for older women, ages 65 to 80.
3 INTEGRATED SIMULATION MODEL
We chose to use a DES framework for several reasons. First, in the medical setting patients are typically
observed at discrete points in time. Furthermore, the integrated simulation model is based on the DES
portion of the Tejada et al. (2013a, 2013b) model as explained below. As a result, we annualized the
UKPDS OM2 equations to fit within our DES framework.
Breast cancer progression. The breast cancer natural history model developed by Tejada et al.(2013a,
2013b) was used with some modifications as the basis for our combined simulation model. The diabetes
model, described next, was then overlaid on the breast cancer progression model. The integrated model
uses the cancer incidence, disease progression, and survival and mortality from breast cancer from Tejada
et al. Each year, the breast cancer incidence probability is determined for each woman. A woman may
either develop invasive breast cancer, in which case a lethal breast cancer age is determined, or she may
develop non-invasive Ductal Carcinoma In-situ (DCIS).
Individual attributes. We modified the DES part of the Tejada et al. (2013a, 2013b) model to
accommodate women of all ages between 35 and 84. Data from the Breast Cancer Surveillance
Hassani Goodarzi, McKenzie, Nataraj, Ivy, Mayorga, Mason, and Tejada
Consortium (Barlow et al. 2006) was used to simulate individual women of ages 35 to 84 with different
attributes. Premenopausal and postmenopausal regression risk models from Barlow et al. (2006) were
used to estimate probability of breast cancer diagnosis for each woman, every year. Statistically
significant risk factors for breast cancer diagnosis among premenopausal women include age, breast
density, family history of breast cancer, and history of a prior breast procedure. For postmenopausal
women, the statistically significant factors include age, breast density, race, ethnicity, family history of
breast cancer, history of a prior breast procedure, BMI, menopause, hormone therapy, and a prior false-
positive mammogram. Since the Tejada et al. model only included postmenopausal women over age 65,
we updated the model to reflect variations in age at menopause by race. The subset of women from the
BCSC data set who were premenopausal were assigned a menopausal age according to an empirical
distribution, based on Henderson et al. (2008), as shown in Table 1, assuming that all women will reach
menopause naturally. After assigning each woman to one of the four age groups for menopausal age, the
exact age at menopause within the selected age group was assigned uniformly.
Table 1: Percentage of menopause for each age group based on race, based on Henderson et al. (2008).
RACE AGE AT NATURAL MENOPAUSE
40-44 45-49 50-54 >=55
White, Non-Latina 15.03 % 34.68 % 40.46 % 9.83 %
African-American 20.58 % 31.86 % 36.06 % 11.50 %
Diabetes-related events. The UKPDS OM2 served as the basis for the development of our diabetes
sub-models. We incorporated all first-instance diabetes-related events modeled by Hayes et al. (2013) into
our framework, including myocardial infarction (MI), stroke (ST), renal failure (RF), blindness (BL),
ulcer (UL), amputation (AMP), congestive heart failure (CHF), and ischemic heart disease (IHD). Only a
few diabetes-related demographic and clinical attributes (current age, race, and BMI) could be obtained
from the available BCSC clinical data. The distributions for the remaining clinical attributes were
obtained from the National Health and Nutrition Examination Survey (NHANES) data sets, continuous
cycles 2009-2010 and 2011-2012 (Huffman et al. 2012), as well as from the diabetes literature. We
determined race-based prevalence estimates on a subset of 202 women between the ages of 35 and 80
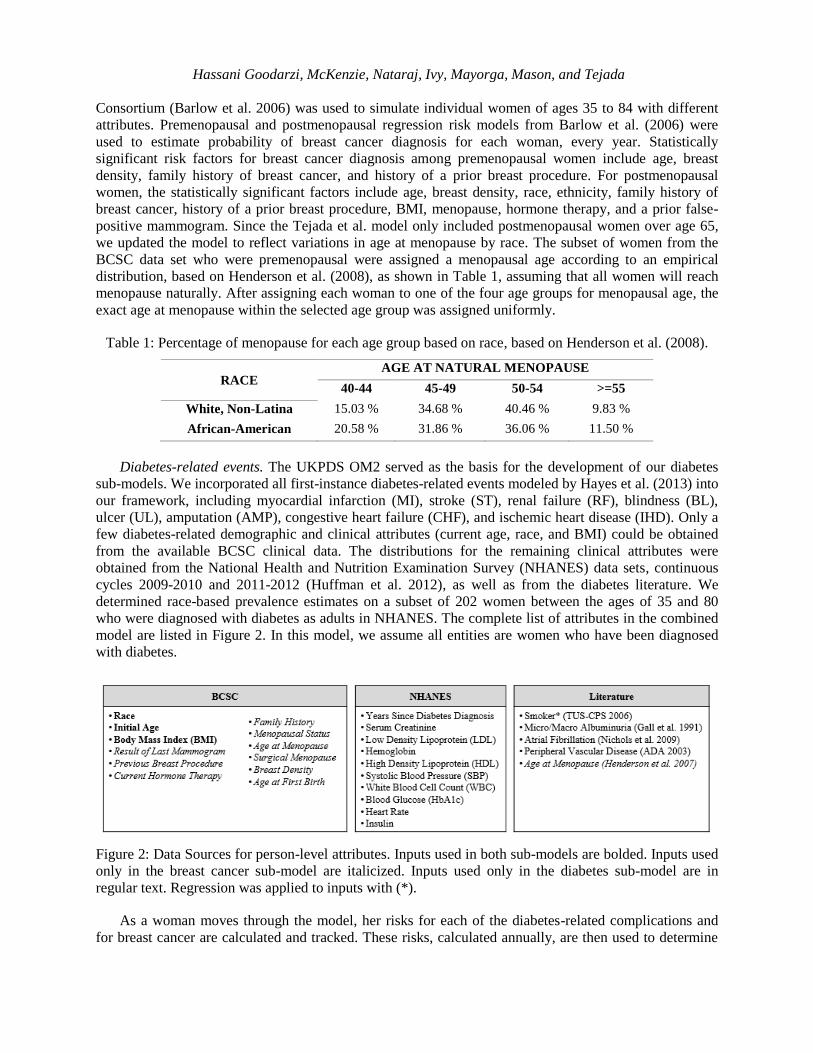
who were diagnosed with diabetes as adults in NHANES. The complete list of attributes in the combined
model are listed in Figure 2. In this model, we assume all entities are women who have been diagnosed
with diabetes.
Figure 2: Data Sources for person-level attributes. Inputs used in both sub-models are bolded. Inputs used
only in the breast cancer sub-model are italicized. Inputs used only in the diabetes sub-model are in
regular text. Regression was applied to inputs with (*).
As a woman moves through the model, her risks for each of the diabetes-related complications and
for breast cancer are calculated and tracked. These risks, calculated annually, are then used to determine

Hassani Goodarzi, McKenzie, Nataraj, Ivy, Mayorga, Mason, and Tejada
which complication(s), if any, an individual will experience during the upcoming year. Event history is
also updated and tracked for each woman as events occur. Tables showing the distributions used to
calculate risk for each diabetes-related event can be found in Hayes et al. (2013).
Mortality. A woman’s death will be attributed to one of three causes: diabetes-related complications,
breast cancer, or other-cause. Death from breast cancer is determined by the tumor reaching lethal size as
mentioned above. Diabetes-related deaths depend on her diabetes-related event history, and are based on
death equations from Hayes et al. (2013). These equations calculate the risk of death in the current year
for women with the following (mutually exclusive) characteristics: event this year but no previous event
history, no event this year but previous event history, or both - an event this year and previous event
history. Lastly, if a woman does not die from diabetes-related complications then she may die of other
causes. In this model, to determine other-cause mortality, we use one of the UKPDS equations (D1)
(Hayes et al. (2013)) to calculate the annual probability of death for a diabetes patient with no diabetes-
related event history. If a woman dies in a given year, then she moves into a sub-model where cause of
death is evaluated, statistics are recorded and then leaves the system. If a woman does not die in a given
year, her age is incremented by one year, her HbA1c level is updated as described next, and then she
moves back to the risk assignment sub-model to begin her next cycle through the model.
Diabetes progression and medication. Each woman’s HbA1c level is evaluated on an annual basis,
and a decision is made about the diabetes medications she should be prescribed. At the end of each annual
cycle, the HbA1c attribute is increased by 0.2% as used in other models (CDC 2002). Two different
interventions are modeled, each following a different American Association of Clinical Endocrinologists
(AACE) guideline-based medication policy, driven by the HbA1c (Garber et al. 2013). In the first
intervention, women with an HbA1c > 9% are started on insulin which we assume immediately decreases
their HbA1c to 6.5%, and they remain on insulin for the remainder of their time in the simulation. In the
second intervention, metformin is prescribed once an individual’s HbA1c level exceeds 6.5%, and
treatment commencement drops the HbA1c level by a percentage according to a triangular distribution as
shown in Table 2 (Hirst et al. 2012). If the HbA1c level exceeds 7.5% at entry, a second-line therapy is
initiated, and the woman is dually treated with both metformin and insulin, resulting in a drop of her
HbA1c level to 6.5%. Once a woman is on insulin, it is assumed that HbA1c remains constant at 6.5%,
otherwise HbA1c increases annually by 0.2%. The two interventions are summarized in Table 2 below.
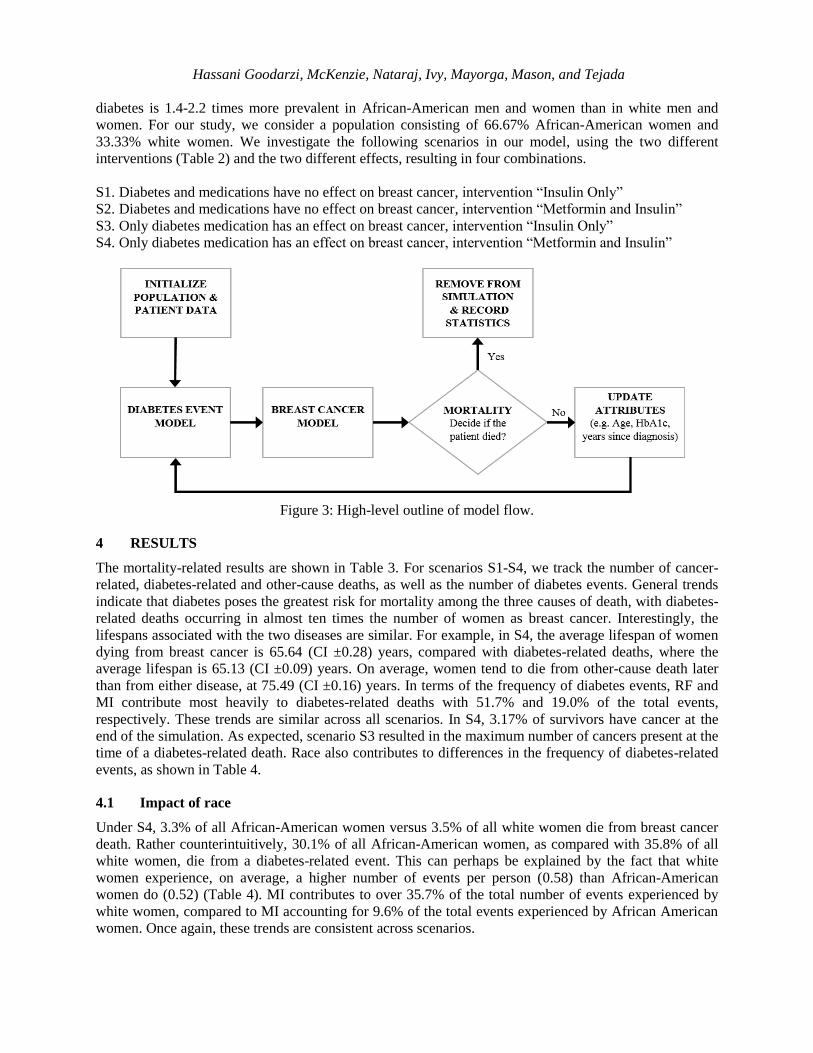
Figure 3 presents a high-level overview of entity flow through the model.
Table 2: Intervention by medication and HbA1c level per the AACE guidelines (Garber et al. 2013).
INTERVENTION – INSULIN ONLY
HbA1c level Intervention Impact of intervention on HbA1c level
> 9% Insulin Drops to 6.5%
≤ 9% None Increases by 0.2%
INTERVENTION – METFORMIN AND INSULIN
HbA1c level Intervention Impact of intervention on HbA1c level
≥ 7.5% Metformin + Insulin Drops to 6.5%
> 6.5% and < 7.5% Metformin Drops by Tri(0.92%, 1.12%, 1.32%)
≤ 6.5% None Increases by 0.2%
Diabetes and breast cancer. The interaction between breast cancer and diabetes is incorporated into
our model primarily through changes in breast cancer annual incidence risk due to treatment regimens.
We assume metformin has a protective effect, resulting in an annual 25% decrease in risk of developing
localized breast cancer (Chlebowski et al. 2012). Insulin increases the annual incidence risk by 13%,
while dual treatment (both metformin and insulin) results in an overall annual relative increase in
incidence risk by 7.8% (Currie et al. 2012).
Arena is run with a population of 20,582 women (ages 35 to 84), as suggested in Tejada et al.
(2013a). The model is run for 10 replications of 20 years each, per scenario. We design the sampling to be
racially representative of our target population, women with diabetes. Carter et al. (1996) found that
Hassani Goodarzi, McKenzie, Nataraj, Ivy, Mayorga, Mason, and Tejada
diabetes is 1.4-2.2 times more prevalent in African-American men and women than in white men and
women. For our study, we consider a population consisting of 66.67% African-American women and
33.33% white women. We investigate the following scenarios in our model, using the two different
interventions (Table 2) and the two different effects, resulting in four combinations.
S1. Diabetes and medications have no effect on breast cancer, intervention “Insulin Only”
S2. Diabetes and medications have no effect on breast cancer, intervention “Metformin and Insulin”
S3. Only diabetes medication has an effect on breast cancer, intervention “Insulin Only”
S4. Only diabetes medication has an effect on breast cancer, intervention “Metformin and Insulin”
Figure 3: High-level outline of model flow.
4 RESULTS
The mortality-related results are shown in Table 3. For scenarios S1-S4, we track the number of cancer-
related, diabetes-related and other-cause deaths, as well as the number of diabetes events. General trends
indicate that diabetes poses the greatest risk for mortality among the three causes of death, with diabetes-
related deaths occurring in almost ten times the number of women as breast cancer. Interestingly, the
lifespans associated with the two diseases are similar. For example, in S4, the average lifespan of women
dying from breast cancer is 65.64 (CI ±0.28) years, compared with diabetes-related deaths, where the
average lifespan is 65.13 (CI ±0.09) years. On average, women tend to die from other-cause death later
than from either disease, at 75.49 (CI ±0.16) years. In terms of the frequency of diabetes events, RF and
MI contribute most heavily to diabetes-related deaths with 51.7% and 19.0% of the total events,
respectively. These trends are similar across all scenarios. In S4, 3.17% of survivors have cancer at the
end of the simulation. As expected, scenario S3 resulted in the maximum number of cancers present at the
time of a diabetes-related death. Race also contributes to differences in the frequency of diabetes-related
events, as shown in Table 4.
4.1 Impact of race
Under S4, 3.3% of all African-American women versus 3.5% of all white women die from breast cancer
death. Rather counterintuitively, 30.1% of all African-American women, as compared with 35.8% of all
white women, die from a diabetes-related event. This can perhaps be explained by the fact that white
women experience, on average, a higher number of events per person (0.58) than African-American
women do (0.52) (Table 4). MI contributes to over 35.7% of the total number of events experienced by
white women, compared to MI accounting for 9.6% of the total events experienced by African American
women. Once again, these trends are consistent across scenarios.

Hassani Goodarzi, McKenzie, Nataraj, Ivy, Mayorga, Mason, and Tejada
4.2 Impact of increased breast cancer risk
When observing the impact of increased risk in the insulin-only intervention, it appears that diabetes and
breast cancer are competing mortality risks. Breast cancer deaths across both races in the risk (S3) and no
risk (S1) scenarios are as expected (812 versus 749, respectively; see Table 3). Diabetes-related events
result in slightly fewer deaths (6,646) when breast cancer risk is considered, compared to diabetes-related
deaths (6,664) when breast cancer risk is not considered. Studying the numbers of total deaths, other-
cause deaths, and survivors from the two diseases, we see that they are comparable under both types of
risk assumptions. Therefore, in the insulin-only intervention, when the number of deaths from one disease
decreases, the number of deaths in the other increases, indicating competing risks.
Under S4, the reduction in risk associated with metformin has a larger impact than dual therapy does,
resulting in a fewer cancer deaths. This is consistent with the fact that metformin is the preferred first-line
therapy as compared with insulin, which is only used at entry when HbA1c levels cannot be controlled by
metformin alone.
Table 3: Distribution of Outcomes by Scenario
Scenario
Breast
Cancer Half- Diabetes Half-
Other-
cause Half-
Survivors
Half-
Total Death width Death width Death width width
S1 Insulin only, No risk
White 242 11.3 2473 27.0 1185 23.9 2937 14.2 6837
AA 507 14.2 4191 31.5 2370 44.4 6677 34.2 13745
Total 749 19.6 6664 38.4 3555 39.1 9614 39.7 20582
S2 Insulin + metformin, No risk
White 238 11.1 2441 26.2 1192 15.6 2994 32.1 6865
AA 508 23.2 4128 52.8 2369 30.9 6712 50.6 13717
Total 746 27.0 6569 56.8 3561 35.0 9706 44.5 20582
S3 Insulin only, Risk
White 260 11.8 2468 20.7 1187 18.8 2933 26.5 6848
AA 552 13.7 4178 29.8 2365 24.9 6639 46.0 13734
Total 812 16.9 6646 40.0 3552 32.4 9572 51.2 20582
S4 Insulin + metformin, Risk
White 237 6.1 2451 38.1 1193 23.7 2970 31.4 6851
AA 458 18.4 4134 33.0 2394 35.8 6745 47.2 13731
Total 695 18.8 6585 49.3 3587 43.7 9715 36.5 20582
Table 4: Number of Diabetes Events in S4
Category
Myocardial
Infarction
Ischemic
Heart
Disease
Coronary
Heart
Failure Stroke
Renal
Failure Blindness Ulcer Amputation Total
White 1424 355 295 180 1485 52 22 178 3991
Half-width 35.9 10.8 10.4 9.7 31.3 5.5 2.9 8.1 --
AA 678 583 719 407 4236 94 46 316 7079
Half-width 19.8 22.0 10.7 17.0 32.2 7.4 4.5 13.7 --
Total 2102 938 1014 587 5721 146 68 494 11070
Half-width 33.0 28.1 14.2 22.8 40.9 7.9 4.6 19.6 --
4.3 Impact of intervention type
As expected, the number of diabetes-related events decreases with the metformin and insulin
interventions, resulting in an increase in the number of survivors. While the medication does not have an
impact on the breast cancer risk by design in scenario S1, the medication regimen S2, including both
metformin and insulin, initiates treatment earlier and leads to fewer diabetes-related deaths (Table 3).
Hassani Goodarzi, McKenzie, Nataraj, Ivy, Mayorga, Mason, and Tejada
Comparing scenarios with an increased risk of breast cancer, S3 and S4, we notice that the protective
impact of metformin comes into play and both diabetes and breast cancer deaths reduce in S4.
5 DISCUSSION & CONCLUSION
Our model represents the first effort to create an integrated model for breast cancer and diabetes, which
will ultimately serve as a test-bed for studying the complex interactions in comorbid diseases. Currently
diabetes treatment guidelines are the same for all women, regardless of their breast cancer risk. This may
not be optimal. Our model has the potential to improve care decision-making for women with diabetes.
As an initial effort, we realize this model has limitations, some of which are discussed here. Due to
data limitations, we had to create empirical distributions according to NHANES data and overlay it on
BCSC to fill in the missing values for diabetes status and other attributes needed for the diabetes model
that are not included in the BCSC dataset. Patient attributes like BMI and HDL change for each woman
throughout her lifetime. In this paper we assume that values for all attributes (except for HbA1c) are
static, as assigned in the beginning of the model. The increased or decreased risk of breast cancer based
on these drugs is derived from multiple papers. In our scenarios, we assumed diabetes patients are either
using insulin or insulin and metformin. We did not run the model with other glycemic control regimes or
in the absence of any of these drugs. Further study should be done in order to see how patient’s status
changes when other treatment plans are used or she is not using any drugs to control her diabetes, and the
risk associated with diabetes and medications should be examined in more detail. More research needs to
be done to explore ways of attributing mortality to cause of death because the available sources are not
ideal for comparing more than one disease. In the future, we would like to explore alternative models for
diabetes (particularly those that are based on samples from the US population) and compare the results
with the current model.
ACKNOWLEDGEMENT
Data collection for this work was supported by the National Cancer Institute-funded Breast Cancer
Surveillance Consortium co-operative agreement (U01CA63740, U01CA86076, U01CA86082,
U01CA63736, U01CA70013, U01CA69976, U01CA63731, U01CA70040). The collection of cancer data
used in this study was supported in part by several state public health departments and cancer registries
throughout the United States. For a full description of these sources, please see:
http://www.breastscreening.cancer.gov/work/acknowledgement.html.
REFERENCES
American Diabetes Association. Fast facts: Data and statistics about diabetes. DiabetesPro.
http://professional.diabetes.org/admin/UserFiles/0 - Sean/FastFacts March 2013.pdf (accessed May
20, 2014).
Baker, R. D. 1998. Use of a mathematical model to evaluate breast cancer screening policy. Health Care
Management Science, 1(2), 103-113.
Barhak, J., D. J. M. Isaman, W. Ye, and D. Lee. 2010. Chronic disease modeling and simulation
software. Journal of Biomedical Informatics, 43(5), 791-799.
Barlow, W. E., E. White, R. Ballard-Barbash, P. M. Vacek, L. Titus-Ernstoff, P. A. Carney, J. A. Tice et
al. 2006. Prospective breast cancer risk prediction model for women undergoing screening
mammography. Journal of the National Cancer Institute, 98(17), 1204-1214.
CPS_TUS--US Department of Commerce, Census Bureau 2006, National Cancer Institute and Centers
for Disease Control and Prevention co-sponsored Tobacco Use Special Cessation Supplement to the
Current Population Survey 2003. http://riskfactor.cancer.gov/studies/tus-cps (accessed May 20, 2014)

Hassani Goodarzi, McKenzie, Nataraj, Ivy, Mayorga, Mason, and Tejada
CDC, Diabetes Cost-effectiveness Group. 2002. Cost-effectiveness of intensive glycemic control,
intensified hypertension control, and serum cholesterol level reduction for type 2 diabetes. JAMA: the
Journal of the American Medical Association, 287(19), 2542.
Chlebowski, R. T., K. Margolis, A. K. Aragaki, J. E. Manson, J. Wactawski-Wende, A. Mctiernan, D. M.
Euhus, H. Strickler, L. S. Phillips, M. Gunter, R. Wallace, M. Vitolins, V. G. Kaklamani, E. Ipp, and
T. Rohan. 2012. Diabetes, Metformin, and Breast Cancer in Postmenopausal Women. Journal of
Clinical Oncology, 30(23), 2844-2852.
Clarke, P.M., A.M. Gray, A. Briggs, et al. 2004. A model to estimate the lifetime health outcomes of
patients with Type 2 diabetes: the United Kingdom Prospective Diabetes Study (UKPDS) Outcomes
Model (UKPDS no. 68). Diabetologia, 47(10), 1747-1759.
Clarke, L. D., S. K. Plevritis, R. Boer, K. A. Cronin, and E. J. Feuer. 2006. A comparative review of
CISNET breast models used to analyze US breast cancer incidence and mortality trends. JNCI
Monographs, 36, 96-105.
Currie, C. J., C. D. Poole, S. Jenkins-Jones, E. A. M. Gale, J. A. Johnson, and C. L. Morgan. 2012.
Mortality After Incident Cancer in People With and Without Type 2 Diabetes: Impact of metformin
on survival. Diabetes Care, 35(2), 299-304.
De Koning, H. J., R. Boer, P. G. Warmerdam, and P. MM Beemsterboer. 1995. Quantitative
interpretation of age-specific mortality reductions from the Swedish breast cancer-screening
trials. Journal of the National Cancer Institute,87(16), 1217-1223.
Denton, B. T., M. Kurt, N. D. Shah, S. C. Bryant, and S. A. Smith. 2009. Optimizing the Start Time of
Statin Therapy for Patients with Diabetes. Medical Decision Making, 29(3), 351-367.
Fryback, D. G., N. K. Stout, M. A. Rosenberg, A. Trentham-Dietz, V. Kuruchittham, and P. L.
Remington. 2006. The Wisconsin breast cancer epidemiology simulation model. JNCI Monographs,
36, 37-47.
Garber, A. J., M. J. Abrahamson, J. I. Barzilay, L. Blonde, Z. T. Bloomgarden, M. A. Bush, S. Dagogo-
Jack et al. 2013. AACE comprehensive diabetes management algorithm 2013. Endocrine Practice,
19(2), 327-336.
Habbema, J. D. F., G. J. Van Oortmarssen, J. Th N. Lubbe, and P. J. Van der Maas. 1985. The MISCAN
simulation program for the evaluation of screening for disease. Computer Methods and Programs in
Biomedicine, 20(1) (1985): 79-93.
Hardefeldt, P. J., S. Edirimanne, and G. D. Eslick. 2012. Diabetes increases the risk of breast cancer: a
meta-analysis. Endocrine related Cancer, 19(6), 793-803.
Hayes, A. J., J. Leal, A. M. Gray, R. R. Holman, and P. M. Clarke. 2013. UKPDS Outcomes Model 2: a
new version of a model to simulate lifetime health outcomes of patients with type 2 diabetes mellitus
using data from the 30 year United Kingdom Prospective Diabetes Study: UKPDS 82.Diabetologia,
56(9), 1925-1933.
Henderson, K. D., L. Bernstein, B. Henderson, L. Kolonel, and M. C. Pike. 2008. Predictors of the timing
of Natural Menopause in the Multiethnic Cohort Study. American Journal of Epidemiology, 167(11),
1287-1294.
Herman, W. H., T. J. Hoerger, M. Brandle, K. Hicks, S. Sorensen, P. Zhang, R. F. Hamman, R. T.
Ackermann, M. M. Engelgau, and R. E. Ratner. 2005. The cost-effectiveness of lifestyle modification
or metformin in preventing type 2 diabetes in adults with impaired glucose tolerance. Annals of
Internal Medicine, 142(5), 323-332.
Hirst, J. A., A. J. Farmer, R. Ali, N. W. Roberts, and R. J. Stevens. 2012. Quantifying the effect of
metformin treatment and dose on glycemic control. Diabetes Care, 35(2), 446-454.
Hsieh, M. C., T. C. Lee, S. M. Cheng, S. T. Tu, M. H. Yen, and C. H. Tseng. 2012. The Influence of Type
2 Diabetes and Glucose-Lowering Therapies on Cancer Risk in the Taiwanese. Experimental
Diabetes Research, 2012, 1-6.
Hassani Goodarzi, McKenzie, Nataraj, Ivy, Mayorga, Mason, and Tejada
Howlader, N., A. Noone, and M. Krapcho, SEER Cancer Statistics Review, 1975-2010 (Vintage 2009
Populations). National Cancer Institute. http://seer.cancer.gov/csr/1975_2009_pops09/ (accessed May
20, 2014).
Huffman, M. D., S. Capewell, H. Ning, C. M. Shay, E. S. Ford, and D. M. Lloyd-Jones. 2012.
Cardiovascular Health Behavior and Health Factor Changes (1988-2008) and Projections to 2020:
Results From the National Health and Nutrition Examination Surveys (NHANES). Circulation,
125(21), 2595-2602.
Jordan, S., L. Lim, D. Vilainerun, E. Banks, N. Sripaiboonkij, S. Seubsman, A. Sleigh, and C. Bain. 2009.
Breast cancer in the Thai Cohort Study: An exploratory case-control analysis. The Breast, 18(5), 299-
303.
Khachatryan L, Scharpf R, Kagan S. 2011. Influence of diabetes mellitus type 2 and prolonged estrogen
exposure on risk of breast cancer among women in Armenia. Health Care Women Int., 32(11), 953-
71.
Kirch, R. L. A., and M. Klein. 1974. Surveillance schedules for medical examinations. Management
Science, 20(10), 1403-1409.
Liebman, A. 2012. National Latino Cancer Summit Focus on the Environment: From Science to Social
Justice. Keynote speech, National Cancer Latino Summit from Latinas Contra Cancer, San Francisco,
CA, July 25, 2012.
Maillart, L., J. Ivy, S. Ransom, and K. Diehl. 2008. Assessing Dynamic Breast Cancer Screening Policies,
Operations Research, 56(6), 1411–1427.
Mason, J. E, B. T. Denton, N. D. Shah, and S. A. Smith. 2014. Optimizing the simultaneous management
of blood pressure and cholesterol for type 2 diabetes patients. European Journal of Operational
Research, 233(3), 727-738.
McEwan, P., M. Evans, H. Kan, and K. Bergenheim. 2010. Understanding the inter‐relationship between
improved glycaemic control, hypoglycaemia and weight change within a long‐term economic
model. Diabetes, Obesity and Metabolism, 12(5), 431-436.
Michaelson, J. S., E. Halpern, and D. B. Kopans. 1999. Breast cancer: computer simulation method for
estimating optimal intervals for screening. RADIOLOGY-OAK BROOK IL- 212, 551-560.
Narayan, K. M. V., J. P. Boyle, T. J. Thompson, S. W. Sorensen, and D. F. Williamson. 2003. Lifetime
Risk For Diabetes Mellitus In The United States. JAMA: The Journal of the American Medical
Association, 290(14): 1884-1890.
Orgel, E., and S. D. Mittelman. 2013. The Links Between Insulin Resistance, Diabetes, and Cancer.
Current Diabetes Reports, 13(2), 213-222.
Palmer, A. J., S. Roze, W. J. Valentine, M. E. Minshall, V. Foos, F. M. Lurati, M. Lammert, and G. A.
Spinas. 2004. The CORE Diabetes Model: projecting long-term clinical outcomes, costs and cost
effectiveness of interventions in diabetes mellitus (types 1 and 2) to support clinical and
reimbursement decision-making. Current Medical Research and Opinion, 20(S1), S5-S26.
Shwartz, M. 1978. A mathematical model used to analyze breast cancer screening strategies. Operations
Research, 26(6), 937-955.
Shah, C., and F. A. Vicini. 2011. Breast Cancer-Related Arm Lymphedema: Incidence Rates, Diagnostic
Techniques, Optimal Management and Risk Reduction Strategies. International Journal of Radiation
Oncology, Biology, Physics, 81(4), 907-914.
Tan, S., YGL, Gerrit, J. Van Oortmarssen, H. J. De Koning, R. Boer, and J. Dik F. Habbema. 2006. The
MISCAN-Fadia continuous tumor growth model for breast cancer. JNCI Monographs, 36, 56-65.
Tejada, J. J., J. S. Ivy, R. E. King, J. R. Wilson, M. J. Ballan, M. Kay, K. Diehl, and B. C. Yankaskas.
2013a. Combined DES/SD Model of Breast Cancer Screening for Older Women, II: Screening-and-
Treatment Simulation. IIE Transactions, in press.
Tejada, J. J., J. S. Ivy, J. R. Wilson, R. E. King, M. J. Ballan, M. Kay, K. Diehl, and B. C. Yankaskas.
2013b. Combined DES/SD Model of Breast Cancer Screening for Older Women: An
Overview. Proceedings of the 2013 Winter Simulation Conference, 41-53.
Hassani Goodarzi, McKenzie, Nataraj, Ivy, Mayorga, Mason, and Tejada
U.S. Cancer Statistics (USCS). 2013. 1999–2010 Incidence and Mortality Web-based Report. U.S.
Department of Health and Human Services, Centers for Disease Control and Prevention, and National
Cancer Institute. http://www.cdc.gov/uscs.
Van Leeuwen, F. E., J. Benraadt, L. A. Kiemeney, J. W. Coebergh, H. Van Tinteren, F. W. Diepenhorst,
A.W. Van Den Belt-Dusebout, M. Bontenbal, R. A. Damhuis, L. J. Schouten, R. Otter, and C. H.
Gimbrère. 1994. Risk of Endometrial Cancer after Tamoxifen Treatment of Breast Cancer." The
Lancet, 343(8895), 448-452.
Van Oortmarssen, Gerrit J., J. Dik F. Habbema, Paul J. Van Der Maas, Harry J. De Koning, Hubertine JA
Collette, André LM Verbeek, Ada T. Geerts, and Koos TN Lubbe. 1990. A model for breast cancer
screening. Cancer 66(7), 1601-1612.
Wang, Y., M. A. Beydoun, L. Liang, B. Caballero, and S. K. Kumanyika. 2008. Will all Americans
become overweight or obese? estimating the progression and cost of the US obesity
epidemic. Obesity, 16(10), 2323-2330.
Ye, W., D. J. M. Isaman, and J. Barhak. 2012. Use of secondary data to estimate instantaneous model
parameters of diabetic heart disease: Lemonade Method. Information Fusion, 13(2), 137-145.
Zhang, Y., R. G. McCoy, J. E. Mason, S. A. Smith, N. D. Shah, and B. T. Denton. 2014. Second-line
Agents for Glycemic Control for Type 2 Diabetes: Are Newer Agents Better? Diabetes Care, in
press.
Zhou, H., D. J. M. Isaman, S. Messinger, M. B. Brown, R. Klein, M. Brandle, and W. H. Herman. 2005.
A Computer Simulation Model of Diabetes Progression, Quality of Life, and Cost. Diabetes Care,
28(12), 2856-2863.
AUTHOR BIOGRAPHIES
SHADI HASSANI GOODARZI is a PhD student and a Graduate Research Assistant in Industrial and
Systems Engineering department at North Carolina State University. Her email address is
KENDALL MCKENZIE is a graduate Research and Teaching Assistant on the PhD track in the
Industrial and Systems Engineering department at North Carolina State University. Her email address is
NISHA NATARAJ is a PhD student and Graduate Teaching Assistant in the Industrial and Systems
Engineering department at North Carolina State University. Her email address is [email protected].
JULIE S. IVY is Associate Professor in the Edward P. Fitts Department of Industrial and Systems
Engineering at North Carolina State University. Her email address is [email protected].
MARIA E. MAYORGA is Associate Professor in the Edward P. Fitts Department of Industrial and
Systems Engineering at North Carolina State University. Her email address is [email protected].
JENNIFER MASON is an Assistant Professor of Public Health Sciences with a courtesy appointment in
the Department of Systems and Information Engineering at the University of Virginia. Her email address
JEREMY TEJADA is the founder and President of SIMCON Solutions, LLC. His e-mail address is
[email protected], the company web address is simcon-solutions.com.