a framework for mapping, visualisation and automatic model creation of signal-transduction networks
TRANSCRIPT

A framework for mapping, visualisation and
automatic model creation of signal-transduction
networks
Carl-Fredrik Tiger, Falko Krause, Gunnar Cedersund, Robert Palmér, Edda Klipp,
Stefan Hohmann, Hiroaki Kitano and Marcus Krantz
Linköping University Post Print
N.B.: When citing this work, cite the original article.
Original Publication:
Carl-Fredrik Tiger, Falko Krause, Gunnar Cedersund, Robert Palmér, Edda Klipp, Stefan
Hohmann, Hiroaki Kitano and Marcus Krantz, A framework for mapping, visualisation and
automatic model creation of signal-transduction networks, 2012, Molecular Systems Biology,
(8), 578.
http://dx.doi.org/10.1038/msb.2012.12
Copyright: Nature Publishing Group / European Molecular Biology Organization
http://npg.nature.com/
Postprint available at: Linköping University Electronic Press
http://urn.kb.se/resolve?urn=urn:nbn:se:liu:diva-77734

Page 1 of 49
A framework for mapping, visualisation and automatic model
creation of signal transduction networks
Carl-Fredrik Tiger1,2§
, Falko Krause2§
, Gunnar Cedersund1,3,4
, Robert Palmér3, Edda Klipp
2,
Stefan Hohmann1, Hiroaki Kitano
3,6-8 and Marcus Krantz
1,2,6*.
1 Department of Cell and Molecular Biology, University of Gothenburg, Box 462, 40530
Göteborg, Sweden
2 Theoretical Biophysics, Humboldt-Universität zu Berlin, Invalidenstr. 42, 10115 Berlin,
Germany
3 Department of Clinical and Experimental Medicine, Diabetes and Integrative Systems
Biology, Linköping University, 58185 Linköping, Sweden
4 Freiburg Institute of Advanced Sciences, School of Life Sciences, Freiburg, Germany
5 Mathematical Sciences, Chalmers University of Technology, SE41296 Gothenburg, Sweden
6 The Systems Biology Institute, 5F, Falcon Building, 5-6-9 Shirokanedai, Minato-ku, Tokyo
108-0071 Japan
7 Sony Computer Science Laboratories, Inc, Tokyo, Japan
8 Okinawa Institute of Science and Technology, Okinawa, Japan
§ These authors contributed equally
* Corresponding author; [email protected]

Page 2 of 49
ABSTRACT
Intracellular signalling systems are highly complex. This complexity makes handling, analysis,
and visualisation of available knowledge a major challenge in current signalling research.
Here, we present a novel framework for mapping signal transduction networks that avoids the
combinatorial explosion by breaking down the network in reaction and contingency
information. It provides two new visualisation methods and automatic export to mathematical
models. We use this framework to compile the presently most comprehensive map of the
yeast MAP kinase network. Our method improves previous strategies by combining (I) more
concise mapping adapted to empirical data, (II) individual referencing for each piece of
information, (III) visualisation without simplifications or added uncertainty, (IV) automatic
visualisation in multiple formats, (V) automatic export to mathematical models, and (VI)
compatibility with established formats. The framework is supported by an open source
software tool that facilitates integration of the three levels of network analysis: definition,
visualisation and mathematical modelling. The framework is species independent and we
expect that it will have wider impact in signalling research on any system.
Keywords: Signal transduction/Mathematical modelling/Visualisation/Combinatorial
complexity/Network mapping
Page 3 of 49
INTRODUCTION
All living cells interact with and respond to their environment via the cellular signal
transduction network. This network encompasses all cellular components and processes that
are required to receive, transmit and interpret information. Due to its key role in cellular
physiology, the signalling network, and several of its sub-networks, have been intensely
studied in a range of organisms. However, such networks are highly complex and difficult to
analyse due to the so-called combinatorial explosion (Hlavacek et al, 2003). This explosion
refers to the fact that the specific state of each component is determined by multiple covalent
modifications or interaction partners, and that these possibilities rapidly combine to a very
large number of possible specific states. Experimental data do not generally distinguish
between all these specific states, but instead focus mostly on reactions between pairs of
components, usually giving no or limited information on other modifications or interaction
partners of the reactants. Hence, there is a discrepancy between the granularity of the
empirical data and the highly defined specific states used in most mathematical models. This
makes the interpretation and use of empirical data in the context of such model states
ambiguous and often arbitrary. These problems pose major challenges for systems biology, as
they prevent us from (i) unambiguously describing a network, (ii) visualising it without
simplifications or unsupported assumptions, and (iii) automatically generating mathematical
models from knowledge in data repositories.
Large efforts have been invested in addressing these issues. Signalling systems are commonly
visualised through the informal “biologist’s graph” that is simple and intuitive, but lacks the
stringent formalism and precision required to meet the three criteria above (exemplified by
(Thorner et al, 2005)). The lack of standardised glyphs (defining e.g., mechanism of
information transfer and how edges combines to regulate target nodes) makes the information
in the “biologist’s graph” ambiguous and difficult to reuse. To address this, the community
has developed the Systems Biology Graphical Notation, SBGN (Le Novere et al, 2009). This
includes three visual formats; the activity flow diagram, the entity relationship diagram and
the process description (or process diagram). The activity flow diagram shares many
properties with the “biologist´s graph”, but the entity relationship diagram and process
description allow precise representations. The process description corresponds to the state
transition reaction format used in most models developed by the systems biology community,
and which have been standardised in the Systems Biology Markup Language (SBML; (Hucka
Page 4 of 49
et al, 2003)). The process description could meet each of the three criteria above but its utility
is severely affected by the combinatorial explosion. It is based on a specific state description,
which means that, for each component, each possible combination of modifications and
interaction partners must be accounted for explicitly. Hence, only very simple systems can be
described completely and only very few models include the entire state space (Kiselyov et al,
2009) while the vast majority include simplifying omissions. While simplifications are often
necessary, the lack of discrimination between arbitrary omissions and exclusions based on
experimental evidence is a significant shortcoming. These issues are partially addressed in the
entity relationship diagram, or molecular interaction map, which comes in two flavours;
explicit and implicit (called heuristic and combinatorial by the author (Kohn et al, 2006)). The
explicit version requires all specific states to be displayed and hence share the limitations of
the process description. In contrast, the implicit version displays only the possible reaction
types (or elemental reactions, as we will call them below) and hence largely avoids the
combinatorial explosion. The entity relationship diagram represents each component as a
single node and reactions in a condensed format. While not as intuitive as the other SBGN
formats, it has the advantage of concentrating all information on a given protein and works
especially well for simple regulatory circuits, as the concentrated information makes it
difficult to trace the order of events in more complex networks. The three SBGN format has
complementary strengths, but there is currently no software available for conversion between
the three different visualisation formats. However, the SBGN standards are under continuous
development and these issues will likely be addressed in the future through the SBGN markup
language, SBGN-ML.
Similar efforts on the modelling side have resulted in rule based modelling and associated
visualisation formats (Faeder et al, 2005). Briefly, rules are defined as reactions that are valid
under a particular set of contingencies, and each reaction is specified for each such
contingency set. This means that when a reaction’s rate is increased by phosphorylation of
one component it will be defined by two rules; one where that component is phosphorylated
and one where it is not. While these rules define the entire state space and the system stays
subject to the full combinatorial explosion, the rule description has alleviated the
combinatorial problem in two respects: (1) the system has been described more compactly and
(2) the actualised state-space might be significantly reduced by introducing only those states
that are actually populated (Lok & Brent, 2005), or by using agent based stochastic modelling
(Sneddon et al, 2011). The rule definition format is also a significant step towards the

Page 5 of 49
granularity of empirical data, as compared to the abstract specific states. These advantages are
mirrored on the visualisation side by graphical reaction rules, which use the process
description format to display individual rules (Blinov et al, 2006). Network level visualisation
has used either topological contact maps (Danos, 2007) or entity relationship diagrams (Le
Novere et al, 2009), and these complementary visualisation formats have recently been
combined in the extended contact map (Chylek et al, 2011). Contact maps have software
support, but neither entity relationship diagrams nor extended contact maps can be generated
automatically from the rule based models. Hence, the rule based format partially addresses the
automatic creation of models from data repositories (iii), as it provides the tools to generate
mathematical models automatically once the knowledge has been reformulated as rules.
However, the rule-based system provides a cumbersome format for (i) unambiguous network
description and is not developed for (ii) comprehensive visualisations. Taken together, this
raises the question whether graphical and model based formats are the most appropriate for
stringent network definition, or whether there are more suitable network definition formats
that allow both visualisation and automatic model generation.
Here, we present a new framework to describe cellular signal transduction networks. Our
network definition has the same granularity as experimental data, avoids the combinatorial
complexity, can be automatically visualised in complementary graphical formats including all
three SBGN formats and unambiguously defines mathematical models. The rxncon software
tool complements the framework by automating visualisation and model creation. The key
feature of our framework is the strict separation of elemental reactions (and their
corresponding states); which defines the possible signalling events in the network, from
contingencies; which describes the contextual constrains on these reactions. Importantly, each
elemental reaction corresponds directly to a single empirical observation, such as a protein-
protein interaction or a specific phosphorylation. The contingencies define the constraints on
these elemental reactions in terms of one or more elemental states, e.g., by defining the active
state of a protein kinase or the composition of a functional protein complex. Hence, the format
directly link model states to empirical observations at the same level of granularity, which
pre-empts the need for additional assumptions or extrapolations. Moreover, the separation
between reactions and contingencies largely avoids the combinatorial explosion as only
combinatorial states with known functional influence are considered. The rxncon tool
provides automatic export to established visual formats and to two new visualisation methods,
which allow compact comprehensive representation. Finally, the framework is stringent and

Page 6 of 49
unambiguously defines a mathematical model, and the rxncon tool support export to SBML
and rule or agent based models. This allows coding of models in a format that mirrors
empirical data, which can be automatically visualised and which is highly suitable for
iterative model building. We illustrate our new approach by conducting the most
comprehensive literature survey to date of the complete MAP kinase signalling network of
Saccharomyces cerevisiae. Taken together, we provide a framework that integrates the three
levels of network analysis; definition, visualisation and mathematical modelling and a
supporting software tool for automatic visualisation and export to mathematical models. We
expect this to be highly useful for the community and envision a common framework to
bridge different standards as well as experimental and theoretical systems biology efforts.
Page 7 of 49
RESULTS
This section describes the architecture of the framework, including its data structure, the
different methods of visualisation and how it relates to a mathematical model (Fig 1A). In the
first part, we present the results of the methods development and describe the system in detail.
In the second part, we present our results using the MAP kinase network. The framework has
been implemented in the rxncon software tool that is distributed freely under the open source
LGPL license and can be downloaded from www.rxncon.org.
The data structure
The events in a signal-transduction network can be categorized in four types: (1) catalytic
modifications, (2) bindings and interactions, (3) degradation and synthesis, (4) changes in
localisation. Due to the limited information on spatial (re)distribution of components, we have
focused on types 1-3 here (Table 1). However, the framework is fully capable to include
localisation reactions and the rxncon tool will be upgraded to encompass these in the future.
The first step of the network definition is to distil the available knowledge into two distinct
categories of information: what can happen, and when it can happen. The what-aspect
(referred to as C1, or elemental reactions) specifies the possible events, including the event
type (1-3 above), and which components and sites that are involved. The when-aspect
(referred to as C2, or contingencies) specifies how the reaction rate is affected by the state of
the involved components. For instance, the MAP kinase Hog1 phosphorylate its target Hot1
(C1 – “what”; Fig 1B), and this reaction only occurs when Hog1 is phosphorylated on both
Thr174 and Tyr176 (C2 – “when”). This second category of knowledge therefore represents
the causal relationships, or contingencies, between the reactions characterised in the first class
of knowledge. The separation of C1 from C2 allows us to define even large complex networks
stringently in a concise format, as exemplified with the yeast MAP kinase network below.
The what-aspects of the knowledge are represented in the reaction list (Fig 1C; simplified
example). Importantly, we have broken down the reaction network in elemental reactions,
which change elemental states. An elemental state is similar to an empirical observation, such
as an interaction between two proteins or a specific modification at a specific site on a
specific protein. If a protein has been phosphorylated on two sites, this corresponds to two
different elemental states. In other words, the elemental states correspond to overlapping
(non-disjoint) sets. This is different from the specific states in ordinary state transition models,

Page 8 of 49
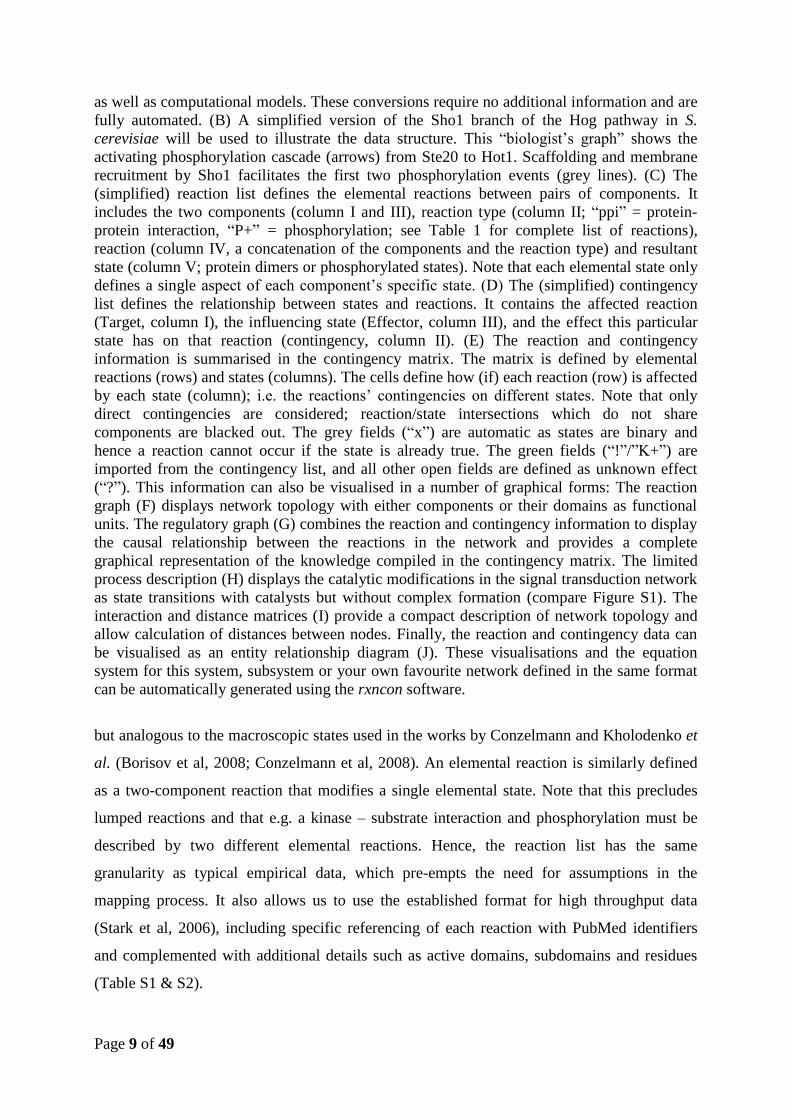
Fig 1: Schematic representation of the data structure. (A) The input data is the reaction and
contingency lists, which contains the “what-aspects” and “when-aspects” of the reaction
network, respectively. The rxncon software uses these lists to create a range of visualisations
Page 9 of 49
as well as computational models. These conversions require no additional information and are
fully automated. (B) A simplified version of the Sho1 branch of the Hog pathway in S.
cerevisiae will be used to illustrate the data structure. This “biologist’s graph” shows the
activating phosphorylation cascade (arrows) from Ste20 to Hot1. Scaffolding and membrane
recruitment by Sho1 facilitates the first two phosphorylation events (grey lines). (C) The
(simplified) reaction list defines the elemental reactions between pairs of components. It
includes the two components (column I and III), reaction type (column II; “ppi” = protein-
protein interaction, “P+” = phosphorylation; see Table 1 for complete list of reactions),
reaction (column IV, a concatenation of the components and the reaction type) and resultant
state (column V; protein dimers or phosphorylated states). Note that each elemental state only
defines a single aspect of each component’s specific state. (D) The (simplified) contingency
list defines the relationship between states and reactions. It contains the affected reaction
(Target, column I), the influencing state (Effector, column III), and the effect this particular
state has on that reaction (contingency, column II). (E) The reaction and contingency
information is summarised in the contingency matrix. The matrix is defined by elemental
reactions (rows) and states (columns). The cells define how (if) each reaction (row) is affected
by each state (column); i.e. the reactions’ contingencies on different states. Note that only
direct contingencies are considered; reaction/state intersections which do not share
components are blacked out. The grey fields (“x”) are automatic as states are binary and
hence a reaction cannot occur if the state is already true. The green fields (“!”/”K+”) are
imported from the contingency list, and all other open fields are defined as unknown effect
(“?”). This information can also be visualised in a number of graphical forms: The reaction
graph (F) displays network topology with either components or their domains as functional
units. The regulatory graph (G) combines the reaction and contingency information to display
the causal relationship between the reactions in the network and provides a complete
graphical representation of the knowledge compiled in the contingency matrix. The limited
process description (H) displays the catalytic modifications in the signal transduction network
as state transitions with catalysts but without complex formation (compare Figure S1). The
interaction and distance matrices (I) provide a compact description of network topology and
allow calculation of distances between nodes. Finally, the reaction and contingency data can
be visualised as an entity relationship diagram (J). These visualisations and the equation
system for this system, subsystem or your own favourite network defined in the same format
can be automatically generated using the rxncon software.
but analogous to the macroscopic states used in the works by Conzelmann and Kholodenko et
al. (Borisov et al, 2008; Conzelmann et al, 2008). An elemental reaction is similarly defined
as a two-component reaction that modifies a single elemental state. Note that this precludes
lumped reactions and that e.g. a kinase – substrate interaction and phosphorylation must be
described by two different elemental reactions. Hence, the reaction list has the same
granularity as typical empirical data, which pre-empts the need for assumptions in the
mapping process. It also allows us to use the established format for high throughput data
(Stark et al, 2006), including specific referencing of each reaction with PubMed identifiers
and complemented with additional details such as active domains, subdomains and residues
(Table S1 & S2).
Page 10 of 49
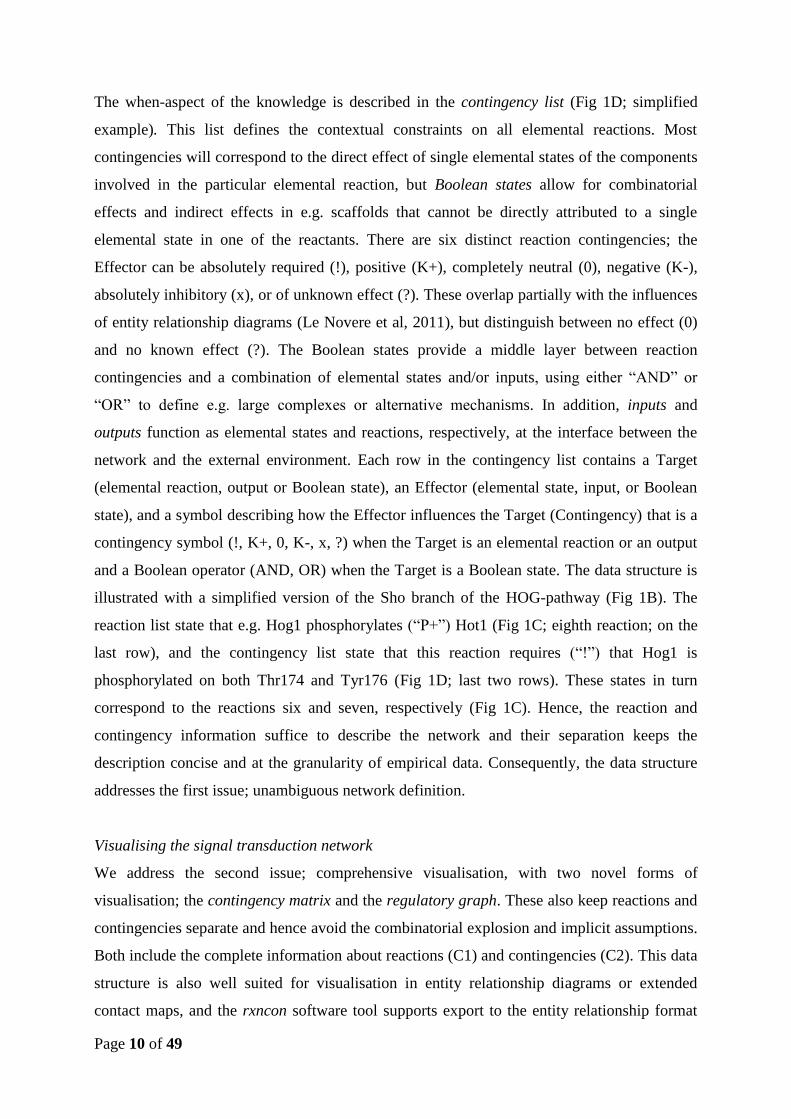
The when-aspect of the knowledge is described in the contingency list (Fig 1D; simplified
example). This list defines the contextual constraints on all elemental reactions. Most
contingencies will correspond to the direct effect of single elemental states of the components
involved in the particular elemental reaction, but Boolean states allow for combinatorial
effects and indirect effects in e.g. scaffolds that cannot be directly attributed to a single
elemental state in one of the reactants. There are six distinct reaction contingencies; the
Effector can be absolutely required (!), positive (K+), completely neutral (0), negative (K-),
absolutely inhibitory (x), or of unknown effect (?). These overlap partially with the influences
of entity relationship diagrams (Le Novere et al, 2011), but distinguish between no effect (0)
and no known effect (?). The Boolean states provide a middle layer between reaction
contingencies and a combination of elemental states and/or inputs, using either “AND” or
“OR” to define e.g. large complexes or alternative mechanisms. In addition, inputs and
outputs function as elemental states and reactions, respectively, at the interface between the
network and the external environment. Each row in the contingency list contains a Target
(elemental reaction, output or Boolean state), an Effector (elemental state, input, or Boolean
state), and a symbol describing how the Effector influences the Target (Contingency) that is a
contingency symbol (!, K+, 0, K-, x, ?) when the Target is an elemental reaction or an output
and a Boolean operator (AND, OR) when the Target is a Boolean state. The data structure is
illustrated with a simplified version of the Sho branch of the HOG-pathway (Fig 1B). The
reaction list state that e.g. Hog1 phosphorylates (“P+”) Hot1 (Fig 1C; eighth reaction; on the
last row), and the contingency list state that this reaction requires (“!”) that Hog1 is
phosphorylated on both Thr174 and Tyr176 (Fig 1D; last two rows). These states in turn
correspond to the reactions six and seven, respectively (Fig 1C). Hence, the reaction and
contingency information suffice to describe the network and their separation keeps the
description concise and at the granularity of empirical data. Consequently, the data structure
addresses the first issue; unambiguous network definition.
Visualising the signal transduction network
We address the second issue; comprehensive visualisation, with two novel forms of
visualisation; the contingency matrix and the regulatory graph. These also keep reactions and
contingencies separate and hence avoid the combinatorial explosion and implicit assumptions.
Both include the complete information about reactions (C1) and contingencies (C2). This data
structure is also well suited for visualisation in entity relationship diagrams or extended
contact maps, and the rxncon software tool supports export to the entity relationship format

Page 11 of 49
(Chylek et al, 2011; Le Novere et al, 2011). We also provide export to the reaction
graph/activity flow diagram and the process description, though neither of these can fully and
accurately represent the network as discussed below. Nevertheless, they all provide their
unique advantages and can be automatically generated with the rxncon tool and the
information in the reaction and contingency lists.
The contingency matrix integrates the information in the reaction and contingency lists (Fig
1E). The matrix is spanned by the reactions and their corresponding states (C1) and populated
by the contingencies of reactions on states (C2). Each row corresponds to one elemental
reaction and each column corresponds to one elemental state. The symbol in each reaction-
state intersection specifies how that specific reaction depends on that specific state. Together,
one row contains the complete set of rules a reaction follows, and hence describes how it
works in every specific state. This is related to a dependency matrix (Yang et al, 2010),
although the entries in the contingency matrix are more detailed and unambiguous. In the
example (Fig 1E), the first row shows that (a) the binding of Sho1 to Ste11 cannot occur if
either of the components is already part of such a dimer (column 1), (b) that we do not know
whether the prior binding of Sho1 to Pbs2 (column 2) or phosphorylation of Ste11 (column 3)
effects the Sho1-Ste11 binding, and (c) that the other states appearing in the row are irrelevant
for this specific binding reaction – as they do not describe properties of Sho1 or Ste11. The
primary advantages of the contingency matrix are that it (1) allows a comprehensive
documentation/visualisation of all reactions and dependencies within the network, (2) that it
does so without requiring assumptions, (3) that it explicitly defines unknowns and hence gaps
in our knowledge, and (4) that the matrix constitutes a template from which mathematical
models can be derived automatically (see below).
The reaction graph displays a topological, directed reaction network (Fig 1F). It represents
each entity as a single node and each relationship between a pair of entities as a single edge.
Edges can be non-directional (e.g. protein-protein interaction), unidirectional (e.g.
phosphorylation) or bidirectional (e.g. phosphotransfer). The full reaction graph displays the
domains and residues involved in each reaction. The protein parts are independent nodes and
defined as neighbours (proteins can have domains or residues, domains can have subdomains
or residues, subdomains can have residues). The inclusion of domain information makes the
reaction graph similar to the (extended) contact maps (Chylek et al, 2011; Danos, 2007). The
reaction graph and contact maps are both purely topological and do not include any contextual
Page 12 of 49
information, in contrast to the extended contact map which e.g. may show that binding only
occurs to phosphorylated residues. We also use a condensed variant that displays only the
central node for each component and collapses multiple reactions of the same kind between a
pair of components to a single edge, and hence corresponds closely to the activity flow
diagram of SBGN (Fig S1B; (Le Novere et al, 2009). The advantages of the reaction graph
are (1) the relative simplicity that makes it useful for visualisation of even large networks, and
(2) that it is suited for visualisation of large scale datasets within the context of that network
(see below).
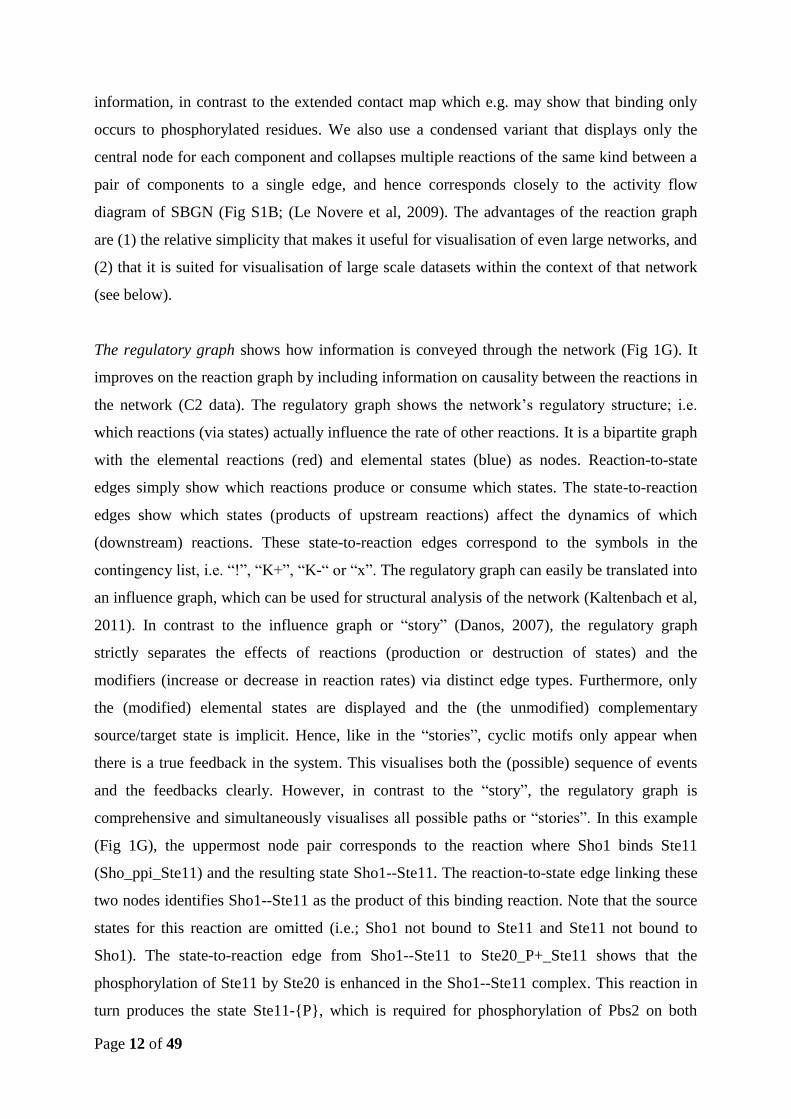
The regulatory graph shows how information is conveyed through the network (Fig 1G). It
improves on the reaction graph by including information on causality between the reactions in
the network (C2 data). The regulatory graph shows the network’s regulatory structure; i.e.
which reactions (via states) actually influence the rate of other reactions. It is a bipartite graph
with the elemental reactions (red) and elemental states (blue) as nodes. Reaction-to-state
edges simply show which reactions produce or consume which states. The state-to-reaction
edges show which states (products of upstream reactions) affect the dynamics of which
(downstream) reactions. These state-to-reaction edges correspond to the symbols in the
contingency list, i.e. “!”, “K+”, “K-“ or “x”. The regulatory graph can easily be translated into
an influence graph, which can be used for structural analysis of the network (Kaltenbach et al,
2011). In contrast to the influence graph or “story” (Danos, 2007), the regulatory graph
strictly separates the effects of reactions (production or destruction of states) and the
modifiers (increase or decrease in reaction rates) via distinct edge types. Furthermore, only
the (modified) elemental states are displayed and the (the unmodified) complementary
source/target state is implicit. Hence, like in the “stories”, cyclic motifs only appear when
there is a true feedback in the system. This visualises both the (possible) sequence of events
and the feedbacks clearly. However, in contrast to the “story”, the regulatory graph is
comprehensive and simultaneously visualises all possible paths or “stories”. In this example
(Fig 1G), the uppermost node pair corresponds to the reaction where Sho1 binds Ste11
(Sho_ppi_Ste11) and the resulting state Sho1--Ste11. The reaction-to-state edge linking these
two nodes identifies Sho1--Ste11 as the product of this binding reaction. Note that the source
states for this reaction are omitted (i.e.; Sho1 not bound to Ste11 and Ste11 not bound to
Sho1). The state-to-reaction edge from Sho1--Ste11 to Ste20_P+_Ste11 shows that the
phosphorylation of Ste11 by Ste20 is enhanced in the Sho1--Ste11 complex. This reaction in
turn produces the state Ste11-{P}, which is required for phosphorylation of Pbs2 on both

Page 13 of 49
Ser514 and Thr518. Hence, the information flow can be followed throughout the network as
all edges are unidirectional. The main advantages of the regulatory graph are that it (1) allows
a comprehensive documentation/visualisation of all reactions and contingencies within the
network, (2) that it does so in a very compact format (3) without forcing non-supported
assumptions, (4) that it can be used for structural analysis of the network, and (5) that it
clearly shows the information flow through the network.
Process descriptions are well established and allow visualisation of the information flow and
mechanistic detail simultaneously (Kitano et al, 2005). They are excellent for representation
of small networks which are completely known, but lack of data (of the right granularity)
invariably lead to unsupported assumptions. In addition, these diagrams rapidly become very
complex, generally forcing ad hoc reduction and additional implicit and unsupported
assumptions. Therefore, process descriptions do not allow a complete description of the
network with the stringency we require. However, the process description can be clear and
easy to read, and we generate a limited version which excludes complex formation and hence
avoids most of the combinatorial complexity. The difference is highlighted by the upper three
nodes in the example (Fig 1H), where Ste20 phosphorylates Ste11. In contrast to full process
description, the binding of Ste11 to Sho1, and how this binding would affect the
phosphorylation, is not included (compare Figure S1). The (limited) process description has
several advantages: It (1) is intuitive to read and (2) defines in which internal state(s) an
enzyme is active, its substrate and the exact target residue, which (3) conveys the information
flow through the pathway, the enzyme-substrate relationships as well as the gaps in our
understanding of these aspects.
The information can also be used to generate interaction matrices that specify which
components react with which components. These can be rendered at several levels of detail
ranging from a complete interaction matrix including protein domains and target residues that
defines each interaction type, via condensed interaction matrices with only one row and
column per protein that still contains reaction type information (Fig 1I, upper matrix), to
numerical matrices that only include information on connection and directionality. We used
the latter to calculate the distances within the network to generate a distance matrix (Fig 1I,
lower matrix).

Page 14 of 49
Finally, the rxncon tool provides export to entity relationship diagrams (Fig 1J). Like the
regulatory graph, the entity relationship diagram displays reactions and contingencies
separately and hence largely avoids the combinatorial complexity. The entity relationship
diagram has the advantage of concentrating all information on a given protein around a
central node, which works especially well for simple regulatory circuits. This emphasises the
role of each component within the network, in contrast to the regulatory graph which
emphasises the information flow through the network. The entity relationship diagram is
generated automatically by the rxncon software and visualised via Biographer (Biographer).
In the same way, the rxncon software can be used to generate the contingency matrix, the
reaction graphs, the regulatory graph, and, via BioNetGen (Blinov et al, 2004), the SBML file
that constitute the basis for the process description. These generations are fully automated and
hence the framework addresses the issue of (ii) automatic network visualisation without
further assumptions and - in the case of the contingency matrix and regulatory graph –
without any simplifications.
Generation of mathematical models
The contingency matrix is a template for automatic generation of mathematical models. Each
elemental reaction corresponds to a basic (context free) rule in a rule or agent based model
(Table 2), or, in other words, a set of rules that share a reaction centre (Chylek et al, 2011).
All contextual constrains on an elemental reaction is defined in a single row in the
contingency matrix, and this row defines the elemental reaction’s implementation in the rule
based format. The basic rule suffices if there are no known modifiers of a particular elemental
reaction (i.e. only “0” and “?” apart from the intersection with its own state(s) (which is
always “x” for a product state and “!” for a source state)). Every other contingency splits the
expression in two rules; one when that elemental state is true and one when it is false. The
number of rules needed only increases with the number of quantitative modifiers (“K+” and
“K-“) as the qualitative modifiers sets the rate constant to zero in either the “true” (for “x”) or
false (for “!”) case (see Supplementary methods for details). The expansion to rules is fully
defined in our data format and the rxncon software tool automatically generates the input file
for the computational tool BioNetGen (Blinov et al, 2004). This file can be used for rule-
based modelling, network free simulation and creation of SBML files. The translation to and
from the rule based format is unambiguous in both directions, and we illustrate this with
translation of a rule based model of the pheromone response pathway
(yeastpheromonemodel.org). This model contains lumped reactions which we translate to
Page 15 of 49
combinations of elemental reactions, resulting in a different equation structure but the same
functionality given appropriate choice of rate constants (Table S3). Furthermore, we cannot
distinguish different identical proteins in e.g. homodimers, and can therefore not define strict
trans-reactions within such dimers. Apart from these issues, we can reproduce the same model
with only cosmetic/nomenclature differences (see supplementary material for details). Hence,
the framework addresses the issue of (iii) automatic model generation from the database of
biological information.
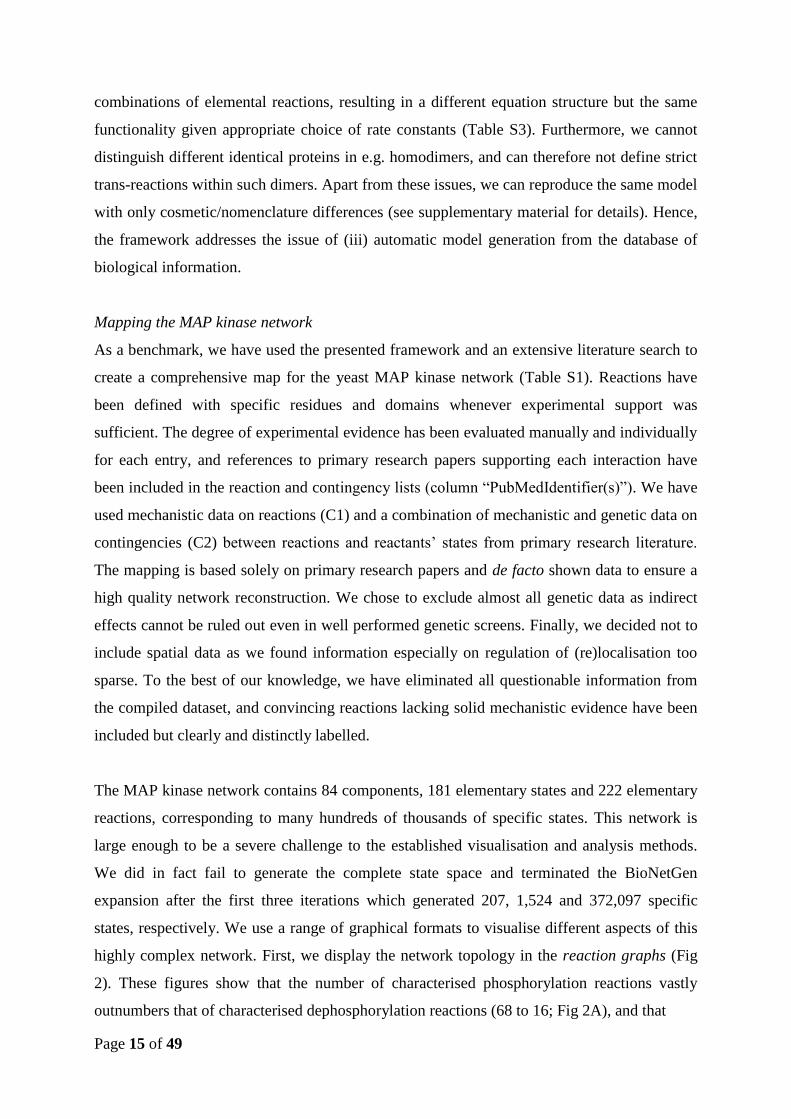
Mapping the MAP kinase network
As a benchmark, we have used the presented framework and an extensive literature search to
create a comprehensive map for the yeast MAP kinase network (Table S1). Reactions have
been defined with specific residues and domains whenever experimental support was
sufficient. The degree of experimental evidence has been evaluated manually and individually
for each entry, and references to primary research papers supporting each interaction have
been included in the reaction and contingency lists (column “PubMedIdentifier(s)”). We have
used mechanistic data on reactions (C1) and a combination of mechanistic and genetic data on
contingencies (C2) between reactions and reactants’ states from primary research literature.
The mapping is based solely on primary research papers and de facto shown data to ensure a
high quality network reconstruction. We chose to exclude almost all genetic data as indirect
effects cannot be ruled out even in well performed genetic screens. Finally, we decided not to
include spatial data as we found information especially on regulation of (re)localisation too
sparse. To the best of our knowledge, we have eliminated all questionable information from
the compiled dataset, and convincing reactions lacking solid mechanistic evidence have been
included but clearly and distinctly labelled.
The MAP kinase network contains 84 components, 181 elementary states and 222 elementary
reactions, corresponding to many hundreds of thousands of specific states. This network is
large enough to be a severe challenge to the established visualisation and analysis methods.
We did in fact fail to generate the complete state space and terminated the BioNetGen
expansion after the first three iterations which generated 207, 1,524 and 372,097 specific
states, respectively. We use a range of graphical formats to visualise different aspects of this
highly complex network. First, we display the network topology in the reaction graphs (Fig
2). These figures show that the number of characterised phosphorylation reactions vastly
outnumbers that of characterised dephosphorylation reactions (68 to 16; Fig 2A), and that

Page 16 of 49
Fig 2: The reaction graph compactly displays the topology of the S. cerevisiae MAP kinase
network. (A) The reaction graph of the MAPK network displays the components as nodes and
the reactions as edges. Each component is defined by a central major node and peripheral
minor nodes indicating domains, subdomains and specific residues (blue). When interacting
domains and target residues are known, reactions are displayed as edges between these minor
nodes. In contrast, the condensed reaction graph (B) displays each component as a single node,

Page 17 of 49
and each type of reaction between two nodes as a single edge. Nodes are either proteins
(circles), small molecules (diamonds) or DNA (square). Edge colours indicate reaction type
(co-substrates and co-products): Grey; protein-protein interaction (N/A), red; phosphorylation
(-ATP, +ADP), orange; guanine nucleotide exchange (-GTP, +GDP), blue; dephosphorylation
or GTPase activation (+Pi), gold; ubiquitination (-ubiquitin, -ATP, +ADP, +Pi), black;
phosphotransfer or proteolytic cleavage (N/A). The domain layout in (A) prioritises
readability and domain organisation does not reflect linear sequence or protein structure.
Arrowheads indicate directionality for unidirectional or reciprocal catalytic modifications.
Reactions for which we found no direct evidence but which are supported by convincing
genetic data has been included as dashed lines. Note the much higher frequency of reported
phosphorylation reactions as compared to dephosphorylation reactions; in total the network
includes 68 phosphorylation reactions but only 16 dephosphorylation reactions (A).
several well established processes are only supported by genetic data (including the entire
MAP kinase cascade below Pkc1; Fig 2B, dashed lines). The reaction graph also allows
comparison between the established pathway architecture and the unbiased global protein-
protein interaction studies and synthetic lethal networks (Fig 6A and 6B, respectively).
In the contingency matrix (Fig 3), we visualise the combined knowledge we have about the
MAP kinase system (C1 and C2). The core matrix (red block of rows and blue block of
columns) describe all the elemental reactions, elemental states, and the (possible)
contingencies of reaction on states. The black fields here show when there is no overlap
between the components in the reactions and those defined in the states. Therefore, the matrix
will always be sparsely populated. However, we also see that most of the remaining fields are
grey; i.e. effect not known (“?”). This means that our knowledge of reactions (C1; which
defines rows and columns) is much stronger than our knowledge of the causality between
these reactions (C2; the cells). We only have data on a minority of all possible contingencies,
and these gaps are explicitly shown in the contingency matrix. It should also be noted that not
all effects can be ascribed to single elemental states. We have added an outer layer of Boolean
states (purple rows and columns) to account for these cases. The Boolean states describe
complex mechanisms such as scaffolding and can in principle correspond to the specific states
of e.g. process descriptions. However, they are only added when needed to describe empirical
results. Note that only a small fraction of the states are Boolean, which reflects the low
abundance of empirical data on the combinatorial effect of elemental states (i.e. specific
states). Therefore, we believe it to be better to use mapping strategies which do not require
such data. Finally, the matrix contains a layer of inputs and outputs (grey; columns and rows,
respectively). These constitute the system’s interface with the outside.

Page 18 of 49
Fig3: The contingency matrix provides a complete description of the network or network
module. The core contingency matrix is spanned by the elemental reactions (rows, in red) and
the elemental states (columns, in blue). The additional blocks are derived from the
contingency list and contain the formation rules (rows) and effects (columns) of Boolean
states (both purple) as well as the output of (rows) and input to (columns) the network (both
grey). The cells in the matrix define how each reaction (row) depends on each state (column).
The effects range from being absolutely required (“!”), via positive effector (“K+”), no effect
(“0”) and negative effector (“K-“) to absolutely inhibitory (“x”), or it can be unknown or
undefined (“?”). Each Boolean state is defined by a single operator (“AND” or “OR”) for the
elemental states, other Booleans and/or inputs that defines it. The contingency matrix
displayed here contains the complete MAPK network. Note that the contingency matrix is
sparsely populated. This is both because most combinations of reactions and states lack
overlap in components (black squares) and because we have very limited knowledge of the
possible contingencies (grey squares). Overall, the information on what reactions can occur is
much more abundant than on how they are regulated.
Page 19 of 49
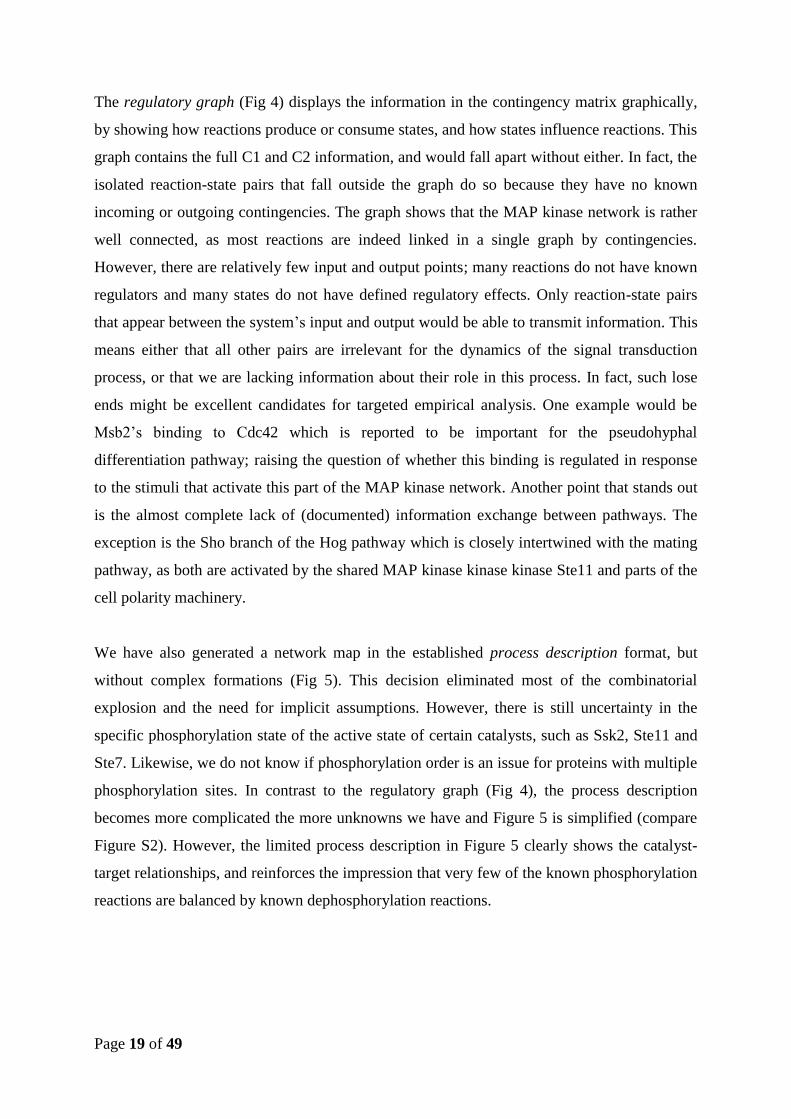
The regulatory graph (Fig 4) displays the information in the contingency matrix graphically,
by showing how reactions produce or consume states, and how states influence reactions. This
graph contains the full C1 and C2 information, and would fall apart without either. In fact, the
isolated reaction-state pairs that fall outside the graph do so because they have no known
incoming or outgoing contingencies. The graph shows that the MAP kinase network is rather
well connected, as most reactions are indeed linked in a single graph by contingencies.
However, there are relatively few input and output points; many reactions do not have known
regulators and many states do not have defined regulatory effects. Only reaction-state pairs
that appear between the system’s input and output would be able to transmit information. This
means either that all other pairs are irrelevant for the dynamics of the signal transduction
process, or that we are lacking information about their role in this process. In fact, such lose
ends might be excellent candidates for targeted empirical analysis. One example would be
Msb2’s binding to Cdc42 which is reported to be important for the pseudohyphal
differentiation pathway; raising the question of whether this binding is regulated in response
to the stimuli that activate this part of the MAP kinase network. Another point that stands out
is the almost complete lack of (documented) information exchange between pathways. The
exception is the Sho branch of the Hog pathway which is closely intertwined with the mating
pathway, as both are activated by the shared MAP kinase kinase kinase Ste11 and parts of the
cell polarity machinery.
We have also generated a network map in the established process description format, but
without complex formations (Fig 5). This decision eliminated most of the combinatorial
explosion and the need for implicit assumptions. However, there is still uncertainty in the
specific phosphorylation state of the active state of certain catalysts, such as Ssk2, Ste11 and
Ste7. Likewise, we do not know if phosphorylation order is an issue for proteins with multiple
phosphorylation sites. In contrast to the regulatory graph (Fig 4), the process description
becomes more complicated the more unknowns we have and Figure 5 is simplified (compare
Figure S2). However, the limited process description in Figure 5 clearly shows the catalyst-
target relationships, and reinforces the impression that very few of the known phosphorylation
reactions are balanced by known dephosphorylation reactions.

Page 20 of 49
Fig4: The regulatory graph visualise the causality between reactions and reveals the
regulatory structure of the network. This bipartite graph illustrates the relationships between
the reactions (red nodes) and states (blue nodes) within the network. Edges from reactions to

Page 21 of 49
states define how states are produced (blue) or consumed (purple), and each such edge
corresponds to a single elemental reaction. Edges from states to reactions define how states
regulate other reactions, and each such edge correspond to a single contingency (Green;
absolute requirement (“!”) or positive effector (“K+”), red; negative effector (“K-“) or
absolutely inhibitory (“x”)). Booleans are used when the effect on a reaction cannot be
attributed to single elemental states (white diamonds (OR) or triangles (AND) connected to
the states/Booleans/inputs that define them with black lines). Inputs are displayed in grey and
connected to the elemental reaction(s) they influence. Likewise, outputs are displayed in grey
and connected to the states they are influenced by. Signals can be followed through the
network from external cues (grey; top) to transcriptional response (grey; bottom) as all edges
are directional. Reactions without input are not (known to be) regulated and would therefore
be expected to have constant rates; likewise states without output have no (defined) impact on
the system. We have also included likely but undocumented requirements for enzyme-
substrate bindings before catalysis as dashed lines. The regulatory graph is the only graphical
representation using the complete information in the contingency matrix, and hence the only
complete and completely graphical visualisation of the network. It is also the most potent
visualisation to evaluate the degree of knowledge about the network. For example,
visualisation of high throughput data would result in disconnected reaction-state pairs only,
due to the lack of regulatory information (no C2 data).
Finally, we automatically generated a mathematical description of the entire network as a
proof of principle. The rxncon software used the contingency matrix to generate the input file
for BioNetGen (Blinov et al, 2004). The corresponding network is too large to create but
could be simulated with the network free simulator NFSim (Sneddon et al, 2011). Further
analysis of this system falls outside the scope of this paper, but the input file to BioNetGen
and/or NFSim with trivial parameters is included as a supplement. Hence, a complete
mathematical model can be automatically generated from the reaction and contingency data,
and to our knowledge this is the first framework that integrates network definition at the
granularity of empirical data with automatic visualisation and automatic model creation.

Page 22 of 49
Fig5: The limited process description displays all posttranslational modifications and their
catalysts, but excludes complex formation. Each specific internal state is represented as a
distinct node, although some intermediate phosphorylation states have been excluded.

Page 23 of 49
Phosphorylations are indicated by red arrows (ATP as co-substrate and ADP as co-product),
GEF reactions as orange arrows (-GTP, +GDP), and dephosphorylation or GAP reactions as
blue arrows (+Pi). Only a fraction of the catalytic modifications have a known catalyst for
both forward and reverse reactions, and the required state of the catalyst known is in even
fewer cases. Therefore, even this highly simplified process description includes uncertainty in
the required states of both catalysts and substrates. In this visualisation, this uncertainty has
been shown by using a single catalysis arrow from a box including all potentially active state
of the catalyst to the basic state of the substrate (completely unphosphorylated for kinase
reactions, or completely phosphorylated for phosphatase reactions). While these
simplifications are unsupported, including additional catalytic arrows would be equally
arbitrary with the added drawback of making the figure more complex (see Figure S2).
Despite the need for implicit assumptions, the process description is useful as it is very
explicit and intuitive to read.

Page 24 of 49
DISCUSSION
It is clear that the complexity of signal transduction networks is one of the major challenges in
systems biology, impeding our ability to visualise, simulate, and ultimately understand these
networks. This issue has been widely recognised and substantial efforts have been committed
to improve and standardise our tools for visualisation and modelling of cellular networks
(Hucka et al, 2003; Le Novere et al, 2009). These standardisation efforts are essential for data
exchange and reusability, but many of the existing tools are unsuitable for definition,
visualisation and mathematical modelling of large networks. The arguably most important
problems are the combinatorial complexity, the granularity difference between empirical and
theoretical data, and the lack of exchange formats between different theoretical descriptions.
Here, we have introduced a new framework for network definition at the same granularity as
most empirical data. This format was already available for C1 (reaction) information, as our
list of elemental reactions uses the same format as high throughput data (PSICQUIC). We
describe contextual information at the same granularity in our contingency list (C2), which
not only allows an intuitive and accurate translation of empirical data but also largely avoids
the combinatorial complexity. Contrary to state transition based descriptions but like the
related rule based format, the reaction and contingency based description becomes smaller the
less knowledge we have as only known reactions and contingencies are considered. This
format also provides for highly detailed referencing as each elemental reaction and
contingency can and should be tied to empirical evidence (i.e., research paper(s)).
Furthermore, we show that this format is stringent and unambiguously define both rule based
models and graphical formats, such as the activity flow diagram (condensed reaction graph),
entity relationship diagram, and process description formats of SBGN. Our framework also
supports two new visualisation formats that we introduce here and that can display our
complete knowledge database (the complete reaction and contingency lists). Finally, our
framework provides a very high reusability and extendibility, as the underlying network
definition - in list format - is very easy to extend, merge and reuse in other context, which is
not the case for most graphically or mathematically defined systems. Of course, this level of
definition still leaves the issues of parameter estimation and graphical layout, but these would
typically need to be repeated even when merging graphical and mathematical network
definitions. Hence, we advocate a more fundamental level of network definition than
graphical or mathematical formalism. We envisage this or a similar framework as a standard
to greatly facilitate model/network construction, exchange and reusability.

Page 25 of 49
Fig6: The condensed reaction graph is an excellent tool for visualisation of high throughput
data. (A) Physical interactions within the MAPK network. The global protein-protein
interaction network was retrieved from Biogrid (Stark et al, 2006), filtered for physical

Page 26 of 49
interactions excluding two hybrid, and visualised on the condensed reaction graph (Fig 2A).
Purple edges indicate protein-protein interactions and their thickness indicates the number of
times they were picked up, ranging from a single time (dashed line) to 19 times. Nodes that
appear faded have no interactions with any other component in the MAPK network reported
in this dataset. Note that the nodes that do not correspond to single ORFs would be excluded
automatically (e.g. the SCF complex, DNA, lipids). The smaller, boxed network display the
corresponding two hybrid interaction network. (B) Genetic interactions within the MAPK
network. Synthetic lethal interactions were retrieved from Biogrid and visualised as per (A).
Also quantitative data, such as mutant phenotypes and gene expression levels, can be directly
visualised on the network.
We have applied this method to map out the MAP kinase network of S. cerevisiae. This
network was chosen as a benchmark since it is both well characterised and representative for
signal transduction in general. It consists of three clear subgraphs, which have traditionally
been considered more or less insulated pathways; the High Osmolarity Glycerol (Hog)
pathway, the Protein Kinase C (PKC) pathway, and the MATing (MAT) pathway, which
almost completely overlaps with the PseudoHyphal Differentiation (PHD) pathway. These
pathways have also been mapped or documented in several other efforts. KEGG presents a
combined map of the traditional MAP kinase pathways in a format similar to its metabolic
pathways (Kanehisa et al, 2010; Kanehisa et al, 2006). However, the stringent edge
definitions used for the metabolic networks have been abandoned and this is a “biologist’s
graph”. The picture is similar with the maps of yeast MAP kinase pathways at Science STKE
(e.g.; (Thorner et al, 2005)). For example, these maps display Ste11 with four upstream
regulators, but it is unclear how they regulate Ste11 and how their contributions combine
(e.g.; AND or OR?). Therefore, these network maps may provide an excellent introduction to
the networks by providing a components list and a rough idea of the components’ roles in the
network, but they neither define reactions (C1) nor contingencies (C2) unambiguously. On the
opposite end, we have the recently published process description of the cell cycle and its
surrounding signalling network (Kaizu et al, 2010). This contains explicit definition of both
C1 and C2 information. However, the tremendous number of specific states in such a network
forces simplifications, which not only leads to a loss of knowledge, but also mixes up known
contingencies (C2) with arbitrary assumptions made to simplify the network. One example in
this particular case would be the separation of the upstream activation of Ste11 and its
downstream effect on the Hog and Mating pathways. The output of this module is defined by
the context of its activation, and this information is lost due to these arguably necessary
simplifications. In addition, the granularity difference between the highly specific map states
and the underlying biological data makes the mapping ambiguous, leading to further

Page 27 of 49
unsupported assumptions. Despite these shortcomings, the process description is useful for
visualisation of certain network properties due to the explicit representation of highly detailed
knowledge such as target residues. However, we stress that neither of these established and
widely used methods are sufficient to accurately capture the entire signal transduction
network. Instead, we introduce the contingency matrix and the bipartite regulatory graph as
alternative methods which are able to fully capture the entire knowledge database without
simplifications or assumptions. Together with the established methods, these visualisations
provide an unprecedented view on the chosen benchmark system, and we trust that this
completely referenced and comprehensive map of the MAP kinase signalling network in S.
cerevisiae will be a useful reference material for the research community.
These results have direct bearing on the many efforts to create large data repositories. Pure
reaction (C1) data, such as protein-protein interaction networks, can be retrieved using the
standardised Molecular Interaction Query Language (MIQL; which our reaction list is
designed to be compatible with) and PSICQUIC (PSICQUIC). PSICQUIC accesses e.g.,
ChEMBL (Overington, 2009), BioGrid (Breitkreutz et al, 2010), IntAct (Aranda et al, 2010),
DIP (Xenarios et al, 2002), MatrixDB (Chautard et al, 2009), and Reactome (Croft et al,
2010). Several of these databases have additional information including contingency (C2)
information and a standardised (non-graphical) format for definition and retrieval would
further improve the usefulness of these resources and facilitate further analysis of the stored
information. The framework we propose here provides such a format with the key advantage
of including export to mathematical models. Since mathematical modelling is the most central
and natural step to bring the knowledge in these databases into a useful form, where
quantitative systems properties can most exhaustively be analysed, the introduction of such an
export is an important step forward. This framework is still not as flexible as direct model
definition but it provides distinct advantages. Formulating models directly using classical
state transition reactions is either subjective or very cumbersome in practice due to the
combinatorial explosion, and state transition based models for the networks of the size we
consider here are too large to be simulated. The closest related modelling framework is rule-
based modelling, in which models can be formulated without these combinatorial explosion
problems, and it is also to a rule-based format that we export our models. However, the
classical rule-based modelling frameworks lack all the database properties of our framework,
such as the contingency matrix and its export to various novel visualisation formats. In short,
Page 28 of 49
one could therefore say that our framework combines the best of existing knowledge
databases with new visualisation tools and rule-based modelling.
In conclusion, we present a method to document and visualise signal transduction networks
that improves on previous strategies in the following respects; (I) it allows concise mapping at
the same granularity as biological data, hence pre-empting the need for implicit, unsupported
assumptions, (II) it allows referencing of each elemental reaction and contingency separately
and handles unknowns explicitly, (III) the network can be visualised without any
simplifications or assumptions that increase the uncertainty, (IV) the visualisations can be
automatically generated from the data files, (V) the network definition is a template from
which a mathematical model can be automatically generated (VI) and exported to SBML, and
(VII) the supplied template and rxncon tool makes the method immediately useful for anyone
with an interest in signal transduction. Hence, our framework bridge three critical levels of
signal transduction network analysis; definition, visualisation and mathematical modelling, as
well as empirical data and theoretical analysis.
Page 29 of 49
MATERIALS AND METHODS
The MAP kinase network map is based on the papers listed below. The specific reference(s)
are listed for each reaction and contingency individually in the reaction and contingency lists
in the “PubMedIdentifier(s)” column with their PMID number.
(Ai et al, 2002; Alepuz et al, 2003; Alepuz et al, 2001; Andrews & Herskowitz, 1989;
Andrews & Moore, 1992; Apanovitch et al, 1998; Baetz & Andrews, 1999; Baetz et al, 2001;
Ballon et al, 2006; Bao et al, 2004; Bao et al, 2010; Bar et al, 2003; Bardwell et al, 1996;
Bardwell et al, 1998a; Bardwell et al, 1998b; Bender & Sprague, 1986; Bilsland-Marchesan et
al, 2000; Blumer et al, 1988; Breitkreutz et al, 2001; Bruckner et al, 2004; Butty et al, 1998;
Chou et al, 2004; Chou et al, 2006; Cismowski et al, 2001; Clark et al, 1993; Collister et al,
2002; Cook et al, 1996; Crosby et al, 2000; Cullen et al, 2004; Davenport et al, 1999; de
Nadal et al, 2003; Dodou & Treisman, 1997; Doi et al, 1994; Dolan et al, 1989; Dowell et al,
1998; Drogen et al, 2000; Elion et al, 1993; Errede et al, 1993; Escote et al, 2004; Feng et al,
1998; Fitch et al, 2004; Flandez et al, 2004; Flotho et al, 2004; Friant et al, 2001; Garcia-
Gimeno & Struhl, 2000; Garrison et al, 1999; Gartner et al, 1998; Gartner et al, 1992; Good et
al, 2009; Green et al, 2003; Guo et al, 2009; Hagen et al, 1986; Hagen et al, 1991; Hahn &
Thiele, 2002; Heenan et al, 2009; Heise et al, 2010; Ho et al, 2002; Horie et al, 2008; Inagaki
et al, 1999; Inouye et al, 1997a; Inouye et al, 1997b; Irie et al, 1993; Jacoby et al, 1997; Jung
et al, 2002; Kamada et al, 1995; Kamada et al, 1996; Ketela et al, 1999; Kim et al, 2010; Kim
et al, 2008; Kranz et al, 1994; Kusari et al, 2004; Lamson et al, 2002; Lee & Levin, 1992;
Leeuw et al, 1995; Leeuw et al, 1998; Li et al, 1998; Liu et al, 2005; MacKay et al, 1991;
MacKay et al, 1988; Madden et al, 1997; Madhani & Fink, 1997; Madhani et al, 1997; Maeda
et al, 1995; Maeda et al, 1994; Maleri et al, 2004; Mapes & Ota, 2004; Martin et al, 2000;
Mattison & Ota, 2000; Mattison et al, 1999; Medici et al, 1997; Melcher & Thorner, 1996;
Metodiev et al, 2002; Miyajima et al, 1987; Murakami et al, 2008; Nasmyth & Dirick, 1991;
Nehlin et al, 1992; Neiman & Herskowitz, 1994; Nern & Arkowitz, 1998; Nern & Arkowitz,
1999; Nonaka et al, 1995; Olson et al, 2000; Ostrander & Gorman, 1999; Ozaki et al, 1996;
Paravicini & Friedli, 1996; Parnell et al, 2005; Pascual-Ahuir et al, 2001; Peter et al, 1996;
Peterson et al, 1994; Philip & Levin, 2001; Posas & Saito, 1997; Posas & Saito, 1998; Posas
et al, 1998; Posas et al, 1996; Proft et al, 2005; Proft et al, 2001; Proft & Serrano, 1999; Proft
& Struhl, 2002; Raicu et al, 2005; Raitt et al, 2000; Rajavel et al, 1999; Reiser et al, 2000;
Remenyi et al, 2005; Rep et al, 2000; Rep et al, 1999; Roberts & Fink, 1994; Schmelzle et al,
Page 30 of 49
2002; Schmidt et al, 1997; Schmidt et al, 2002; Schmitz et al, 2002; Shi et al, 2005; Shimada
et al, 2004; Sidorova & Breeden, 1993; Siegmund & Nasmyth, 1996; Siekhaus & Drubin,
2003; Simon et al, 1995; Skowyra et al, 1997; Smith et al, 2002; Soler et al, 1995; Song et al,
1996; Taba et al, 1991; Takahashi & Pryciak, 2007; Tao et al, 2002; Tarassov et al, 2008;
Tatebayashi et al, 2003; Tatebayashi et al, 2007; Tatebayashi et al, 2006; Tedford et al, 1997;
Truckses et al, 2006; Truman et al, 2009; Vadaie et al, 2008; Valtz et al, 1995; Varanasi et al,
1996; Verna et al, 1997; Vilella et al, 2005; Wang & Konopka, 2009; Wang et al, 2005;
Warmka et al, 2001; Wassmann & Ammerer, 1997; Watanabe et al, 1994; Watanabe et al,
1995; Watanabe et al, 1997; Winters & Pryciak, 2005; Wu et al, 2006; Wu et al, 1999; Wu et
al, 1995; Wu et al, 2004; Wurgler-Murphy et al, 1997; Yablonski et al, 1996; Yamamoto et al,
2010; Yesilaltay & Jenness, 2000; Young et al, 2002; Yuan & Fields, 1991; Zarrinpar et al,
2004; Zarrinpar et al, 2003; Zarzov et al, 1996; Zeitlinger et al, 2003; Zhan et al, 1997; Zhan
& Guan, 1999; Zhao et al, 1995; Zheng & Guan, 1994; Zheng et al, 1994; Zhou et al, 1993).
The methods used are an integral part of the results and are outlined in that section. For
additional details, please see supplementary methods.

Page 31 of 49
ACKNOWLEDGEMENTS
The authors would like to thank past and present colleagues for helpful discussions; in
particular Akira Funahashi, Noriko Hiroi and Douglas Murray for suggestions in the
conception phase, Hans-Michael Kaltenbach for introduction to the bipartite graph, Clemens
Kühn for introduction to NFsim, Jens Nielsen for the suggestion to use matrix multiplication
to calculate network distance and Nina Arens for proofreading. We acknowledge support
from JSPS and SSF (Japan-Sweden collaborative postdoc grant to MK), Lions and the
Swedish Research Council (to GC), the German Ministry for Education and Research (BMBF,
SysMO2 project Translucent 2 to EK), the European Commission (UNICELLSYS, grant
201142, AQUAGLYCEROPORIN, grant 35995, CELLCOMPUT, grant 043310, and
SYSTEMSBIOLOGY, grant 514169, all to SH and EK) and from the
MULTIDISCIPLINARY BIO Sweden-Japan initiative (Sweden: Foundation for Strategic
Research SSF and Vinnova, Japan: Japan Science and Technology Agency JST) to SH and
HK. Work in the lab of SH was also supported by a grant from the Swedish Research Council
(grant 2007-4905).
AUTHOR CONTRIBUTIONS
HK initiated the mapping project. MK conceived the framework. GC and MK developed the
framework with input from all authors. CFT and MK mapped the MAP kinase network. FK
and RP implemented the framework with guidance from GC and MK. FK created the rxncon
software tool. MK drafted the first manuscript with help from GC. SH and EK contributed
biological and theoretical background knowledge, respectively. SH, EK and HK provided the
research environments and contributed to completion of the manuscript. All authors read,
edited and approved the final manuscript.

Page 32 of 49
CONFLICT OF INTEREST
The authors declare that they have no conflict of interest.
Page 33 of 49
Table 1: Thirteen reaction types were used to map the MAP kinase network. The table
indicates reaction type and classification. Additional details are provided in the “Reaction
Definition” sheet of Table S1 and S2.
Table 2: Implementation of elemental reactions in the rule based format. The table displays
how the different elemental reactions in Table 1 are translated to the rule based format. See
supplementary methods for additional details.

Page 34 of 49
REFERENCES
Ai W, Bertram PG, Tsang CK, Chan TF, Zheng XF (2002) Regulation of subtelomeric
silencing during stress response. Mol Cell 10: 1295-1305
Alepuz PM, de Nadal E, Zapater M, Ammerer G, Posas F (2003) Osmostress-induced
transcription by Hot1 depends on a Hog1-mediated recruitment of the RNA Pol II. EMBO J
22: 2433-2442
Alepuz PM, Jovanovic A, Reiser V, Ammerer G (2001) Stress-induced map kinase Hog1 is
part of transcription activation complexes. Mol Cell 7: 767-777
Andrews BJ, Herskowitz I (1989) Identification of a DNA binding factor involved in cell-
cycle control of the yeast HO gene. Cell 57: 21-29
Andrews BJ, Moore LA (1992) Interaction of the yeast Swi4 and Swi6 cell cycle regulatory
proteins in vitro. Proc Natl Acad Sci U S A 89: 11852-11856
Apanovitch DM, Slep KC, Sigler PB, Dohlman HG (1998) Sst2 is a GTPase-activating
protein for Gpa1: purification and characterization of a cognate RGS-Galpha protein pair in
yeast. Biochemistry 37: 4815-4822
Aranda B, Achuthan P, Alam-Faruque Y, Armean I, Bridge A, Derow C, Feuermann M,
Ghanbarian AT, Kerrien S, Khadake J, Kerssemakers J, Leroy C, Menden M, Michaut M,
Montecchi-Palazzi L, Neuhauser SN, Orchard S, Perreau V, Roechert B, van Eijk K et al
(2010) The IntAct molecular interaction database in 2010. Nucleic Acids Res 38: D525-531
Baetz K, Andrews B (1999) Regulation of cell cycle transcription factor Swi4 through auto-
inhibition of DNA binding. Mol Cell Biol 19: 6729-6741
Baetz K, Moffat J, Haynes J, Chang M, Andrews B (2001) Transcriptional coregulation by
the cell integrity mitogen-activated protein kinase Slt2 and the cell cycle regulator Swi4. Mol
Cell Biol 21: 6515-6528
Ballon DR, Flanary PL, Gladue DP, Konopka JB, Dohlman HG, Thorner J (2006) DEP-
domain-mediated regulation of GPCR signaling responses. Cell 126: 1079-1093
Bao MZ, Schwartz MA, Cantin GT, Yates JR, 3rd, Madhani HD (2004) Pheromone-
dependent destruction of the Tec1 transcription factor is required for MAP kinase signaling
specificity in yeast. Cell 119: 991-1000
Bao MZ, Shock TR, Madhani HD (2010) Multisite phosphorylation of the Saccharomyces
cerevisiae filamentous growth regulator Tec1 is required for its recognition by the E3
ubiquitin ligase adaptor Cdc4 and its subsequent destruction in vivo. Eukaryot Cell 9: 31-36
Bar EE, Ellicott AT, Stone DE (2003) Gbetagamma recruits Rho1 to the site of polarized
growth during mating in budding yeast. J Biol Chem 278: 21798-21804

Page 35 of 49
Bardwell L, Cook JG, Chang EC, Cairns BR, Thorner J (1996) Signaling in the yeast
pheromone response pathway: specific and high-affinity interaction of the mitogen-activated
protein (MAP) kinases Kss1 and Fus3 with the upstream MAP kinase kinase Ste7. Mol Cell
Biol 16: 3637-3650
Bardwell L, Cook JG, Voora D, Baggott DM, Martinez AR, Thorner J (1998a) Repression of
yeast Ste12 transcription factor by direct binding of unphosphorylated Kss1 MAPK and its
regulation by the Ste7 MEK. Genes Dev 12: 2887-2898
Bardwell L, Cook JG, Zhu-Shimoni JX, Voora D, Thorner J (1998b) Differential regulation of
transcription: repression by unactivated mitogen-activated protein kinase Kss1 requires the
Dig1 and Dig2 proteins. Proc Natl Acad Sci U S A 95: 15400-15405
Bender A, Sprague GF, Jr. (1986) Yeast peptide pheromones, a-factor and alpha-factor,
activate a common response mechanism in their target cells. Cell 47: 929-937
Bilsland-Marchesan E, Arino J, Saito H, Sunnerhagen P, Posas F (2000) Rck2 kinase is a
substrate for the osmotic stress-activated mitogen-activated protein kinase Hog1. Mol Cell
Biol 20: 3887-3895
Biographer. http://code.google.com/p/biographer/.
Blinov ML, Faeder JR, Goldstein B, Hlavacek WS (2004) BioNetGen: software for rule-
based modeling of signal transduction based on the interactions of molecular domains.
Bioinformatics (Oxford, England) 20: 3289-3291
Blinov ML, Yang J, Faeder JR, Hlavacek WS (2006) Depicting signaling cascades. Nature
biotechnology 24: 137-138; author reply 138
Blumer KJ, Reneke JE, Thorner J (1988) The STE2 gene product is the ligand-binding
component of the alpha-factor receptor of Saccharomyces cerevisiae. J Biol Chem 263:
10836-10842
Borisov NM, Chistopolsky AS, Faeder JR, Kholodenko BN (2008) Domain-oriented
reduction of rule-based network models. IET Syst Biol 2: 342-351
Breitkreutz A, Boucher L, Tyers M (2001) MAPK specificity in the yeast pheromone
response independent of transcriptional activation. Curr Biol 11: 1266-1271
Breitkreutz A, Choi H, Sharom JR, Boucher L, Neduva V, Larsen B, Lin ZY, Breitkreutz BJ,
Stark C, Liu G, Ahn J, Dewar-Darch D, Reguly T, Tang X, Almeida R, Qin ZS, Pawson T,
Gingras AC, Nesvizhskii AI, Tyers M (2010) A global protein kinase and phosphatase
interaction network in yeast. Science (New York, NY 328: 1043-1046
Bruckner S, Kohler T, Braus GH, Heise B, Bolte M, Mosch HU (2004) Differential regulation
of Tec1 by Fus3 and Kss1 confers signaling specificity in yeast development. Curr Genet 46:
331-342
Page 36 of 49
Butty AC, Pryciak PM, Huang LS, Herskowitz I, Peter M (1998) The role of Far1p in linking
the heterotrimeric G protein to polarity establishment proteins during yeast mating. Science
282: 1511-1516
Chautard E, Ballut L, Thierry-Mieg N, Ricard-Blum S (2009) MatrixDB, a database focused
on extracellular protein-protein and protein-carbohydrate interactions. Bioinformatics (Oxford,
England) 25: 690-691
Chou S, Huang L, Liu H (2004) Fus3-regulated Tec1 degradation through SCFCdc4
determines MAPK signaling specificity during mating in yeast. Cell 119: 981-990
Chou S, Lane S, Liu H (2006) Regulation of mating and filamentation genes by two distinct
Ste12 complexes in Saccharomyces cerevisiae. Mol Cell Biol 26: 4794-4805
Chylek LA, Hu B, Blinov ML, Emonet T, Faeder JR, Goldstein B, Gutenkunst RN, Haugh
JM, Lipniacki T, Posner RG, Yang J, Hlavacek WS (2011) Guidelines for visualizing and
annotating rule-based models. Molecular bioSystems 7: 2779-2795
Cismowski MJ, Metodiev M, Draper E, Stone DE (2001) Biochemical analysis of yeast
G(alpha) mutants that enhance adaptation to pheromone. Biochem Biophys Res Commun 284:
247-254
Clark KL, Dignard D, Thomas DY, Whiteway M (1993) Interactions among the subunits of
the G protein involved in Saccharomyces cerevisiae mating. Mol Cell Biol 13: 1-8
Collister M, Didmon MP, MacIsaac F, Stark MJ, MacDonald NQ, Keyse SM (2002)
YIL113w encodes a functional dual-specificity protein phosphatase which specifically
interacts with and inactivates the Slt2/Mpk1p MAP kinase in S. cerevisiae. FEBS Lett 527:
186-192
Conzelmann H, Fey D, Gilles ED (2008) Exact model reduction of combinatorial reaction
networks. BMC Syst Biol 2: 78
Cook JG, Bardwell L, Kron SJ, Thorner J (1996) Two novel targets of the MAP kinase Kss1
are negative regulators of invasive growth in the yeast Saccharomyces cerevisiae. Genes Dev
10: 2831-2848
Croft D, O'Kelly G, Wu G, Haw R, Gillespie M, Matthews L, Caudy M, Garapati P, Gopinath
G, Jassal B, Jupe S, Kataskaya I, Mahajan S, May B, Ndegwa N, Schmidt E, Shamovsky V,
Yung C, Birney E, Hermjakob H et al (2010) Reactome: a database of reactions, pathways
and biological processes. Nucleic Acids Res
Crosby JA, Konopka JB, Fields S (2000) Constitutive activation of the Saccharomyces
cerevisiae transcriptional regulator Ste12p by mutations at the amino-terminus. Yeast 16:
1365-1375
Cullen PJ, Sabbagh W, Jr., Graham E, Irick MM, van Olden EK, Neal C, Delrow J, Bardwell
L, Sprague GF, Jr. (2004) A signaling mucin at the head of the Cdc42- and MAPK-dependent
filamentous growth pathway in yeast. Genes Dev 18: 1695-1708

Page 37 of 49
Danos V (2007) Rule-Based Modelling of Cellular Signalling. Cellular Signalling: 17-41
Davenport KD, Williams KE, Ullmann BD, Gustin MC (1999) Activation of the
Saccharomyces cerevisiae filamentation/invasion pathway by osmotic stress in high-
osmolarity glycogen pathway mutants. Genetics 153: 1091-1103
de Nadal E, Casadome L, Posas F (2003) Targeting the MEF2-like transcription factor Smp1
by the stress-activated Hog1 mitogen-activated protein kinase. Mol Cell Biol 23: 229-237
Dodou E, Treisman R (1997) The Saccharomyces cerevisiae MADS-box transcription factor
Rlm1 is a target for the Mpk1 mitogen-activated protein kinase pathway. Mol Cell Biol 17:
1848-1859
Doi K, Gartner A, Ammerer G, Errede B, Shinkawa H, Sugimoto K, Matsumoto K (1994)
MSG5, a novel protein phosphatase promotes adaptation to pheromone response in S.
cerevisiae. EMBO J 13: 61-70
Dolan JW, Kirkman C, Fields S (1989) The yeast STE12 protein binds to the DNA sequence
mediating pheromone induction. Proc Natl Acad Sci U S A 86: 5703-5707
Dowell SJ, Bishop AL, Dyos SL, Brown AJ, Whiteway MS (1998) Mapping of a yeast G
protein betagamma signaling interaction. Genetics 150: 1407-1417
Drogen F, O'Rourke SM, Stucke VM, Jaquenoud M, Neiman AM, Peter M (2000)
Phosphorylation of the MEKK Ste11p by the PAK-like kinase Ste20p is required for MAP
kinase signaling in vivo. Curr Biol 10: 630-639
Elion EA, Satterberg B, Kranz JE (1993) FUS3 phosphorylates multiple components of the
mating signal transduction cascade: evidence for STE12 and FAR1. Mol Biol Cell 4: 495-510
Errede B, Gartner A, Zhou Z, Nasmyth K, Ammerer G (1993) MAP kinase-related FUS3
from S. cerevisiae is activated by STE7 in vitro. Nature 362: 261-264
Escote X, Zapater M, Clotet J, Posas F (2004) Hog1 mediates cell-cycle arrest in G1 phase by
the dual targeting of Sic1. Nature cell biology 6: 997-1002
Faeder JR, Blinov ML, Goldstein B, Hlavacek WS (2005) Rule-based modeling of
biochemical networks. Complexity 10: 22-41
Feng Y, Song LY, Kincaid E, Mahanty SK, Elion EA (1998) Functional binding between
Gbeta and the LIM domain of Ste5 is required to activate the MEKK Ste11. Curr Biol 8: 267-
278
Fitch PG, Gammie AE, Lee DJ, de Candal VB, Rose MD (2004) Lrg1p Is a Rho1 GTPase-
activating protein required for efficient cell fusion in yeast. Genetics 168: 733-746
Flandez M, Cosano IC, Nombela C, Martin H, Molina M (2004) Reciprocal regulation
between Slt2 MAPK and isoforms of Msg5 dual-specificity protein phosphatase modulates
the yeast cell integrity pathway. J Biol Chem 279: 11027-11034
Page 38 of 49
Flotho A, Simpson DM, Qi M, Elion EA (2004) Localized feedback phosphorylation of Ste5p
scaffold by associated MAPK cascade. J Biol Chem 279: 47391-47401
Friant S, Lombardi R, Schmelzle T, Hall MN, Riezman H (2001) Sphingoid base signaling
via Pkh kinases is required for endocytosis in yeast. EMBO J 20: 6783-6792
Garcia-Gimeno MA, Struhl K (2000) Aca1 and Aca2, ATF/CREB activators in
Saccharomyces cerevisiae, are important for carbon source utilization but not the response to
stress. Mol Cell Biol 20: 4340-4349
Garrison TR, Zhang Y, Pausch M, Apanovitch D, Aebersold R, Dohlman HG (1999)
Feedback phosphorylation of an RGS protein by MAP kinase in yeast. J Biol Chem 274:
36387-36391
Gartner A, Jovanovic A, Jeoung DI, Bourlat S, Cross FR, Ammerer G (1998) Pheromone-
dependent G1 cell cycle arrest requires Far1 phosphorylation, but may not involve inhibition
of Cdc28-Cln2 kinase, in vivo. Mol Cell Biol 18: 3681-3691
Gartner A, Nasmyth K, Ammerer G (1992) Signal transduction in Saccharomyces cerevisiae
requires tyrosine and threonine phosphorylation of FUS3 and KSS1. Genes Dev 6: 1280-1292
Good M, Tang G, Singleton J, Remenyi A, Lim WA (2009) The Ste5 scaffold directs mating
signaling by catalytically unlocking the Fus3 MAP kinase for activation. Cell 136: 1085-1097
Green R, Lesage G, Sdicu AM, Menard P, Bussey H (2003) A synthetic analysis of the
Saccharomyces cerevisiae stress sensor Mid2p, and identification of a Mid2p-interacting
protein, Zeo1p, that modulates the PKC1-MPK1 cell integrity pathway. Microbiology 149:
2487-2499
Guo S, Shen X, Yan G, Ma D, Bai X, Li S, Jiang Y (2009) A MAP kinase dependent
feedback mechanism controls Rho1 GTPase and actin distribution in yeast. PLoS One 4:
e6089
Hagen DC, McCaffrey G, Sprague GF, Jr. (1986) Evidence the yeast STE3 gene encodes a
receptor for the peptide pheromone a factor: gene sequence and implications for the structure
of the presumed receptor. Proc Natl Acad Sci U S A 83: 1418-1422
Hagen DC, McCaffrey G, Sprague GF, Jr. (1991) Pheromone response elements are necessary
and sufficient for basal and pheromone-induced transcription of the FUS1 gene of
Saccharomyces cerevisiae. Mol Cell Biol 11: 2952-2961
Hahn JS, Thiele DJ (2002) Regulation of the Saccharomyces cerevisiae Slt2 kinase pathway
by the stress-inducible Sdp1 dual specificity phosphatase. J Biol Chem 277: 21278-21284
Heenan EJ, Vanhooke JL, Temple BR, Betts L, Sondek JE, Dohlman HG (2009) Structure
and function of Vps15 in the endosomal G protein signaling pathway. Biochemistry 48: 6390-
6401

Page 39 of 49
Heise B, van der Felden J, Kern S, Malcher M, Bruckner S, Mosch HU (2010) The TEA
transcription factor Tec1 confers promoter-specific gene regulation by Ste12-dependent and -
independent mechanisms. Eukaryot Cell 9: 514-531
Hlavacek WS, Faeder JR, Blinov ML, Perelson AS, Goldstein B (2003) The complexity of
complexes in signal transduction. Biotechnol Bioeng 84: 783-794
Ho Y, Gruhler A, Heilbut A, Bader GD, Moore L, Adams SL, Millar A, Taylor P, Bennett K,
Boutilier K, Yang L, Wolting C, Donaldson I, Schandorff S, Shewnarane J, Vo M, Taggart J,
Goudreault M, Muskat B, Alfarano C et al (2002) Systematic identification of protein
complexes in Saccharomyces cerevisiae by mass spectrometry. Nature 415: 180-183
Horie T, Tatebayashi K, Yamada R, Saito H (2008) Phosphorylated Ssk1 prevents
unphosphorylated Ssk1 from activating the Ssk2 mitogen-activated protein kinase kinase
kinase in the yeast high-osmolarity glycerol osmoregulatory pathway. Molecular and cellular
biology 28: 5172-5183
Hucka M, Finney A, Sauro HM, Bolouri H, Doyle JC, Kitano H, Arkin AP, Bornstein BJ,
Bray D, Cornish-Bowden A, Cuellar AA, Dronov S, Gilles ED, Ginkel M, Gor V, Goryanin,
II, Hedley WJ, Hodgman TC, Hofmeyr JH, Hunter PJ et al (2003) The systems biology
markup language (SBML): a medium for representation and exchange of biochemical
network models. Bioinformatics (Oxford, England) 19: 524-531
Inagaki M, Schmelzle T, Yamaguchi K, Irie K, Hall MN, Matsumoto K (1999) PDK1
homologs activate the Pkc1-mitogen-activated protein kinase pathway in yeast. Mol Cell Biol
19: 8344-8352
Inouye C, Dhillon N, Durfee T, Zambryski PC, Thorner J (1997a) Mutational analysis of
STE5 in the yeast Saccharomyces cerevisiae: application of a differential interaction trap
assay for examining protein-protein interactions. Genetics 147: 479-492
Inouye C, Dhillon N, Thorner J (1997b) Ste5 RING-H2 domain: role in Ste4-promoted
oligomerization for yeast pheromone signaling. Science 278: 103-106
Irie K, Takase M, Lee KS, Levin DE, Araki H, Matsumoto K, Oshima Y (1993) MKK1 and
MKK2, which encode Saccharomyces cerevisiae mitogen-activated protein kinase-kinase
homologs, function in the pathway mediated by protein kinase C. Mol Cell Biol 13: 3076-
3083
Jacoby T, Flanagan H, Faykin A, Seto AG, Mattison C, Ota I (1997) Two protein-tyrosine
phosphatases inactivate the osmotic stress response pathway in yeast by targeting the
mitogen-activated protein kinase, Hog1. J Biol Chem 272: 17749-17755
Jung US, Sobering AK, Romeo MJ, Levin DE (2002) Regulation of the yeast Rlm1
transcription factor by the Mpk1 cell wall integrity MAP kinase. Mol Microbiol 46: 781-789
Kaizu K, Ghosh S, Matsuoka Y, Moriya H, Shimizu-Yoshida Y, Kitano H (2010) A
comprehensive molecular interaction map of the budding yeast cell cycle. Mol Syst Biol 6:
415

Page 40 of 49
Kaltenbach H-M, Constantinescu S, Feigelman J, Stelling J (2011) Graph-Based
Decomposition of Biochemical Reaction Networks into Monotone Subsystems
Algorithms in Bioinformatics. Przytycka T, Sagot M-F (eds), Vol. 6833, pp 139-150. Springer
Berlin / Heidelberg
Kamada Y, Jung US, Piotrowski J, Levin DE (1995) The protein kinase C-activated MAP
kinase pathway of Saccharomyces cerevisiae mediates a novel aspect of the heat shock
response. Genes Dev 9: 1559-1571
Kamada Y, Qadota H, Python CP, Anraku Y, Ohya Y, Levin DE (1996) Activation of yeast
protein kinase C by Rho1 GTPase. J Biol Chem 271: 9193-9196
Kanehisa M, Goto S, Furumichi M, Tanabe M, Hirakawa M (2010) KEGG for representation
and analysis of molecular networks involving diseases and drugs. Nucleic Acids Res 38:
D355-360
Kanehisa M, Goto S, Hattori M, Aoki-Kinoshita KF, Itoh M, Kawashima S, Katayama T,
Araki M, Hirakawa M (2006) From genomics to chemical genomics: new developments in
KEGG. Nucleic Acids Res 34: D354-357
Ketela T, Green R, Bussey H (1999) Saccharomyces cerevisiae mid2p is a potential cell wall
stress sensor and upstream activator of the PKC1-MPK1 cell integrity pathway. J Bacteriol
181: 3330-3340
Kim KY, Truman AW, Caesar S, Schlenstedt G, Levin DE (2010) Yeast Mpk1 cell wall
integrity mitogen-activated protein kinase regulates nucleocytoplasmic shuttling of the Swi6
transcriptional regulator. Mol Biol Cell 21: 1609-1619
Kim KY, Truman AW, Levin DE (2008) Yeast Mpk1 mitogen-activated protein kinase
activates transcription through Swi4/Swi6 by a noncatalytic mechanism that requires
upstream signal. Mol Cell Biol 28: 2579-2589
Kiselyov VV, Versteyhe S, Gauguin L, De Meyts P (2009) Harmonic oscillator model of the
insulin and IGF1 receptors' allosteric binding and activation. Mol Syst Biol 5: 243
Kitano H, Funahashi A, Matsuoka Y, Oda K (2005) Using process diagrams for the graphical
representation of biological networks. Nature biotechnology 23: 961-966
Kohn KW, Aladjem MI, Kim S, Weinstein JN, Pommier Y (2006) Depicting combinatorial
complexity with the molecular interaction map notation. Mol Syst Biol 2: 51
Kranz JE, Satterberg B, Elion EA (1994) The MAP kinase Fus3 associates with and
phosphorylates the upstream signaling component Ste5. Genes Dev 8: 313-327
Kusari AB, Molina DM, Sabbagh W, Jr., Lau CS, Bardwell L (2004) A conserved protein
interaction network involving the yeast MAP kinases Fus3 and Kss1. J Cell Biol 164: 267-
277
Lamson RE, Winters MJ, Pryciak PM (2002) Cdc42 regulation of kinase activity and
signaling by the yeast p21-activated kinase Ste20. Mol Cell Biol 22: 2939-2951

Page 41 of 49
Le Novere N, Hucka M, Mi H, Moodie S, Schreiber F, Sorokin A, Demir E, Wegner K,
Aladjem MI, Wimalaratne SM, Bergman FT, Gauges R, Ghazal P, Kawaji H, Li L, Matsuoka
Y, Villeger A, Boyd SE, Calzone L, Courtot M et al (2009) The Systems Biology Graphical
Notation. Nature biotechnology 27: 735-741
Le Novere N, Le Novere N, Demir E, Mi H, Moodie S, Villeger A (2011) Systems Biology
Graphical Notation: Entity Relationship language Level 1 (Version 1.2). Nature Precedings
Lee KS, Levin DE (1992) Dominant mutations in a gene encoding a putative protein kinase
(BCK1) bypass the requirement for a Saccharomyces cerevisiae protein kinase C homolog.
Mol Cell Biol 12: 172-182
Leeuw T, Fourest-Lieuvin A, Wu C, Chenevert J, Clark K, Whiteway M, Thomas DY,
Leberer E (1995) Pheromone response in yeast: association of Bem1p with proteins of the
MAP kinase cascade and actin. Science 270: 1210-1213
Leeuw T, Wu C, Schrag JD, Whiteway M, Thomas DY, Leberer E (1998) Interaction of a G-
protein beta-subunit with a conserved sequence in Ste20/PAK family protein kinases. Nature
391: 191-195
Li E, Cismowski MJ, Stone DE (1998) Phosphorylation of the pheromone-responsive Gbeta
protein of Saccharomyces cerevisiae does not affect its mating-specific signaling function.
Mol Gen Genet 258: 608-618
Liu K, Zhang X, Lester RL, Dickson RC (2005) The sphingoid long chain base
phytosphingosine activates AGC-type protein kinases in Saccharomyces cerevisiae including
Ypk1, Ypk2, and Sch9. J Biol Chem 280: 22679-22687
Lok L, Brent R (2005) Automatic generation of cellular reaction networks with Moleculizer
1.0. Nature biotechnology 23: 131-136
MacKay VL, Armstrong J, Yip C, Welch S, Walker K, Osborn S, Sheppard P, Forstrom J
(1991) Characterization of the Bar proteinase, an extracellular enzyme from the yeast
Saccharomyces cerevisiae. Adv Exp Med Biol 306: 161-172
MacKay VL, Welch SK, Insley MY, Manney TR, Holly J, Saari GC, Parker ML (1988) The
Saccharomyces cerevisiae BAR1 gene encodes an exported protein with homology to pepsin.
Proc Natl Acad Sci U S A 85: 55-59
Madden K, Sheu YJ, Baetz K, Andrews B, Snyder M (1997) SBF cell cycle regulator as a
target of the yeast PKC-MAP kinase pathway. Science 275: 1781-1784
Madhani HD, Fink GR (1997) Combinatorial control required for the specificity of yeast
MAPK signaling. Science 275: 1314-1317
Madhani HD, Styles CA, Fink GR (1997) MAP kinases with distinct inhibitory functions
impart signaling specificity during yeast differentiation. Cell 91: 673-684

Page 42 of 49
Maeda T, Takekawa M, Saito H (1995) Activation of yeast PBS2 MAPKK by MAPKKKs or
by binding of an SH3-containing osmosensor. Science 269: 554-558
Maeda T, Wurgler-Murphy SM, Saito H (1994) A two-component system that regulates an
osmosensing MAP kinase cascade in yeast. Nature 369: 242-245
Maleri S, Ge Q, Hackett EA, Wang Y, Dohlman HG, Errede B (2004) Persistent activation by
constitutive Ste7 promotes Kss1-mediated invasive growth but fails to support Fus3-
dependent mating in yeast. Mol Cell Biol 24: 9221-9238
Mapes J, Ota IM (2004) Nbp2 targets the Ptc1-type 2C Ser/Thr phosphatase to the HOG
MAPK pathway. The EMBO journal 23: 302-311
Martin H, Rodriguez-Pachon JM, Ruiz C, Nombela C, Molina M (2000) Regulatory
mechanisms for modulation of signaling through the cell integrity Slt2-mediated pathway in
Saccharomyces cerevisiae. J Biol Chem 275: 1511-1519
Mattison CP, Ota IM (2000) Two protein tyrosine phosphatases, Ptp2 and Ptp3, modulate the
subcellular localization of the Hog1 MAP kinase in yeast. Genes Dev 14: 1229-1235
Mattison CP, Spencer SS, Kresge KA, Lee J, Ota IM (1999) Differential regulation of the cell
wall integrity mitogen-activated protein kinase pathway in budding yeast by the protein
tyrosine phosphatases Ptp2 and Ptp3. Mol Cell Biol 19: 7651-7660
Medici R, Bianchi E, Di Segni G, Tocchini-Valentini GP (1997) Efficient signal transduction
by a chimeric yeast-mammalian G protein alpha subunit Gpa1-Gsalpha covalently fused to
the yeast receptor Ste2. EMBO J 16: 7241-7249
Melcher ML, Thorner J (1996) Identification and characterization of the CLK1 gene product,
a novel CaM kinase-like protein kinase from the yeast Saccharomyces cerevisiae. J Biol
Chem 271: 29958-29968
Metodiev MV, Matheos D, Rose MD, Stone DE (2002) Regulation of MAPK function by
direct interaction with the mating-specific Galpha in yeast. Science 296: 1483-1486
Miyajima I, Nakafuku M, Nakayama N, Brenner C, Miyajima A, Kaibuchi K, Arai K, Kaziro
Y, Matsumoto K (1987) GPA1, a haploid-specific essential gene, encodes a yeast homolog of
mammalian G protein which may be involved in mating factor signal transduction. Cell 50:
1011-1019
Murakami Y, Tatebayashi K, Saito H (2008) Two adjacent docking sites in the yeast Hog1
mitogen-activated protein (MAP) kinase differentially interact with the Pbs2 MAP kinase
kinase and the Ptp2 protein tyrosine phosphatase. Mol Cell Biol 28: 2481-2494
Nasmyth K, Dirick L (1991) The role of SWI4 and SWI6 in the activity of G1 cyclins in yeast.
Cell 66: 995-1013
Nehlin JO, Carlberg M, Ronne H (1992) Yeast SKO1 gene encodes a bZIP protein that binds
to the CRE motif and acts as a repressor of transcription. Nucleic Acids Res 20: 5271-5278

Page 43 of 49
Neiman AM, Herskowitz I (1994) Reconstitution of a yeast protein kinase cascade in vitro:
activation of the yeast MEK homologue STE7 by STE11. Proc Natl Acad Sci U S A 91: 3398-
3402
Nern A, Arkowitz RA (1998) A GTP-exchange factor required for cell orientation. Nature
391: 195-198
Nern A, Arkowitz RA (1999) A Cdc24p-Far1p-Gbetagamma protein complex required for
yeast orientation during mating. J Cell Biol 144: 1187-1202
Nonaka H, Tanaka K, Hirano H, Fujiwara T, Kohno H, Umikawa M, Mino A, Takai Y (1995)
A downstream target of RHO1 small GTP-binding protein is PKC1, a homolog of protein
kinase C, which leads to activation of the MAP kinase cascade in Saccharomyces cerevisiae.
EMBO J 14: 5931-5938
Olson KA, Nelson C, Tai G, Hung W, Yong C, Astell C, Sadowski I (2000) Two regulators
of Ste12p inhibit pheromone-responsive transcription by separate mechanisms. Mol Cell Biol
20: 4199-4209
Ostrander DB, Gorman JA (1999) The extracellular domain of the Saccharomyces cerevisiae
Sln1p membrane osmolarity sensor is necessary for kinase activity. J Bacteriol 181: 2527-
2534
Overington J (2009) ChEMBL. An interview with John Overington, team leader,
chemogenomics at the European Bioinformatics Institute Outstation of the European
Molecular Biology Laboratory (EMBL-EBI). Interview by Wendy A. Warr. J Comput Aided
Mol Des 23: 195-198
Ozaki K, Tanaka K, Imamura H, Hihara T, Kameyama T, Nonaka H, Hirano H, Matsuura Y,
Takai Y (1996) Rom1p and Rom2p are GDP/GTP exchange proteins (GEPs) for the Rho1p
small GTP binding protein in Saccharomyces cerevisiae. EMBO J 15: 2196-2207
Paravicini G, Friedli L (1996) Protein-protein interactions in the yeast PKC1 pathway: Pkc1p
interacts with a component of the MAP kinase cascade. Mol Gen Genet 251: 682-691
Parnell SC, Marotti LA, Jr., Kiang L, Torres MP, Borchers CH, Dohlman HG (2005)
Phosphorylation of the RGS protein Sst2 by the MAP kinase Fus3 and use of Sst2 as a model
to analyze determinants of substrate sequence specificity. Biochemistry 44: 8159-8166
Pascual-Ahuir A, Posas F, Serrano R, Proft M (2001) Multiple levels of control regulate the
yeast cAMP-response element-binding protein repressor Sko1p in response to stress. J Biol
Chem 276: 37373-37378
Peter M, Neiman AM, Park HO, van Lohuizen M, Herskowitz I (1996) Functional analysis of
the interaction between the small GTP binding protein Cdc42 and the Ste20 protein kinase in
yeast. EMBO J 15: 7046-7059
Peterson J, Zheng Y, Bender L, Myers A, Cerione R, Bender A (1994) Interactions between
the bud emergence proteins Bem1p and Bem2p and Rho-type GTPases in yeast. J Cell Biol
127: 1395-1406

Page 44 of 49
Philip B, Levin DE (2001) Wsc1 and Mid2 are cell surface sensors for cell wall integrity
signaling that act through Rom2, a guanine nucleotide exchange factor for Rho1. Mol Cell
Biol 21: 271-280
Posas F, Saito H (1997) Osmotic activation of the HOG MAPK pathway via Ste11p
MAPKKK: scaffold role of Pbs2p MAPKK. Science 276: 1702-1705
Posas F, Saito H (1998) Activation of the yeast SSK2 MAP kinase kinase kinase by the SSK1
two-component response regulator. The EMBO journal 17: 1385-1394
Posas F, Witten EA, Saito H (1998) Requirement of STE50 for osmostress-induced activation
of the STE11 mitogen-activated protein kinase kinase kinase in the high-osmolarity glycerol
response pathway. Molecular and cellular biology 18: 5788-5796
Posas F, Wurgler-Murphy SM, Maeda T, Witten EA, Thai TC, Saito H (1996) Yeast HOG1
MAP kinase cascade is regulated by a multistep phosphorelay mechanism in the SLN1-
YPD1-SSK1 "two-component" osmosensor. Cell 86: 865-875
Proft M, Gibbons FD, Copeland M, Roth FP, Struhl K (2005) Genomewide identification of
Sko1 target promoters reveals a regulatory network that operates in response to osmotic stress
in Saccharomyces cerevisiae. Eukaryot Cell 4: 1343-1352
Proft M, Pascual-Ahuir A, de Nadal E, Arino J, Serrano R, Posas F (2001) Regulation of the
Sko1 transcriptional repressor by the Hog1 MAP kinase in response to osmotic stress. EMBO
J 20: 1123-1133
Proft M, Serrano R (1999) Repressors and upstream repressing sequences of the stress-
regulated ENA1 gene in Saccharomyces cerevisiae: bZIP protein Sko1p confers HOG-
dependent osmotic regulation. Mol Cell Biol 19: 537-546
Proft M, Struhl K (2002) Hog1 kinase converts the Sko1-Cyc8-Tup1 repressor complex into
an activator that recruits SAGA and SWI/SNF in response to osmotic stress. Mol Cell 9:
1307-1317
PSICQUIC http://www.ebi.ac.uk/Tools/webservices/psicquic/view/main.xhtml.
Raicu V, Jansma DB, Miller RJ, Friesen JD (2005) Protein interaction quantified in vivo by
spectrally resolved fluorescence resonance energy transfer. Biochem J 385: 265-277
Raitt DC, Posas F, Saito H (2000) Yeast Cdc42 GTPase and Ste20 PAK-like kinase regulate
Sho1-dependent activation of the Hog1 MAPK pathway. EMBO J 19: 4623-4631
Rajavel M, Philip B, Buehrer BM, Errede B, Levin DE (1999) Mid2 is a putative sensor for
cell integrity signaling in Saccharomyces cerevisiae. Mol Cell Biol 19: 3969-3976
Reiser V, Salah SM, Ammerer G (2000) Polarized localization of yeast Pbs2 depends on
osmostress, the membrane protein Sho1 and Cdc42. Nat Cell Biol 2: 620-627

Page 45 of 49
Remenyi A, Good MC, Bhattacharyya RP, Lim WA (2005) The role of docking interactions
in mediating signaling input, output, and discrimination in the yeast MAPK network. Mol Cell
20: 951-962
Rep M, Krantz M, Thevelein JM, Hohmann S (2000) The transcriptional response of
Saccharomyces cerevisiae to osmotic shock. Hot1p and Msn2p/Msn4p are required for the
induction of subsets of high osmolarity glycerol pathway-dependent genes. The Journal of
biological chemistry 275: 8290-8300
Rep M, Reiser V, Gartner U, Thevelein JM, Hohmann S, Ammerer G, Ruis H (1999) Osmotic
stress-induced gene expression in Saccharomyces cerevisiae requires Msn1p and the novel
nuclear factor Hot1p. Mol Cell Biol 19: 5474-5485
Roberts RL, Fink GR (1994) Elements of a single MAP kinase cascade in Saccharomyces
cerevisiae mediate two developmental programs in the same cell type: mating and invasive
growth. Genes Dev 8: 2974-2985
Schmelzle T, Helliwell SB, Hall MN (2002) Yeast protein kinases and the RHO1 exchange
factor TUS1 are novel components of the cell integrity pathway in yeast. Mol Cell Biol 22:
1329-1339
Schmidt A, Bickle M, Beck T, Hall MN (1997) The yeast phosphatidylinositol kinase
homolog TOR2 activates RHO1 and RHO2 via the exchange factor ROM2. Cell 88: 531-542
Schmidt A, Schmelzle T, Hall MN (2002) The RHO1-GAPs SAC7, BEM2 and BAG7 control
distinct RHO1 functions in Saccharomyces cerevisiae. Mol Microbiol 45: 1433-1441
Schmitz HP, Lorberg A, Heinisch JJ (2002) Regulation of yeast protein kinase C activity by
interaction with the small GTPase Rho1p through its amino-terminal HR1 domain. Mol
Microbiol 44: 829-840
Shi C, Shin YO, Hanson J, Cass B, Loewen MC, Durocher Y (2005) Purification and
characterization of a recombinant G-protein-coupled receptor, Saccharomyces cerevisiae
Ste2p, transiently expressed in HEK293 EBNA1 cells. Biochemistry 44: 15705-15714
Shimada Y, Wiget P, Gulli MP, Bi E, Peter M (2004) The nucleotide exchange factor Cdc24p
may be regulated by auto-inhibition. EMBO J 23: 1051-1062
Sidorova J, Breeden L (1993) Analysis of the SWI4/SWI6 protein complex, which directs
G1/S-specific transcription in Saccharomyces cerevisiae. Mol Cell Biol 13: 1069-1077
Siegmund RF, Nasmyth KA (1996) The Saccharomyces cerevisiae Start-specific transcription
factor Swi4 interacts through the ankyrin repeats with the mitotic Clb2/Cdc28 kinase and
through its conserved carboxy terminus with Swi6. Mol Cell Biol 16: 2647-2655
Siekhaus DE, Drubin DG (2003) Spontaneous receptor-independent heterotrimeric G-protein
signalling in an RGS mutant. Nat Cell Biol 5: 231-235
Simon MN, De Virgilio C, Souza B, Pringle JR, Abo A, Reed SI (1995) Role for the Rho-
family GTPase Cdc42 in yeast mating-pheromone signal pathway. Nature 376: 702-705
Page 46 of 49
Skowyra D, Craig KL, Tyers M, Elledge SJ, Harper JW (1997) F-box proteins are receptors
that recruit phosphorylated substrates to the SCF ubiquitin-ligase complex. Cell 91: 209-219
Smith GR, Givan SA, Cullen P, Sprague GF, Jr. (2002) GTPase-activating proteins for Cdc42.
Eukaryot Cell 1: 469-480
Sneddon MW, Faeder JR, Emonet T (2011) Efficient modeling, simulation and coarse-
graining of biological complexity with NFsim. Nat Methods 8: 177-183
Soler M, Plovins A, Martin H, Molina M, Nombela C (1995) Characterization of domains in
the yeast MAP kinase Slt2 (Mpk1) required for functional activity and in vivo interaction with
protein kinases Mkk1 and Mkk2. Mol Microbiol 17: 833-842
Song J, Hirschman J, Gunn K, Dohlman HG (1996) Regulation of membrane and subunit
interactions by N-myristoylation of a G protein alpha subunit in yeast. J Biol Chem 271:
20273-20283
Stark C, Breitkreutz BJ, Reguly T, Boucher L, Breitkreutz A, Tyers M (2006) BioGRID: a
general repository for interaction datasets. Nucleic Acids Res 34: D535-539
Taba MR, Muroff I, Lydall D, Tebb G, Nasmyth K (1991) Changes in a SWI4,6-DNA-
binding complex occur at the time of HO gene activation in yeast. Genes Dev 5: 2000-2013
Takahashi S, Pryciak PM (2007) Identification of novel membrane-binding domains in
multiple yeast Cdc42 effectors. Mol Biol Cell 18: 4945-4956
Tao W, Malone CL, Ault AD, Deschenes RJ, Fassler JS (2002) A cytoplasmic coiled-coil
domain is required for histidine kinase activity of the yeast osmosensor, SLN1. Mol Microbiol
43: 459-473
Tarassov K, Messier V, Landry CR, Radinovic S, Serna Molina MM, Shames I, Malitskaya Y,
Vogel J, Bussey H, Michnick SW (2008) An in vivo map of the yeast protein interactome.
Science 320: 1465-1470
Tatebayashi K, Takekawa M, Saito H (2003) A docking site determining specificity of Pbs2
MAPKK for Ssk2/Ssk22 MAPKKKs in the yeast HOG pathway. EMBO J 22: 3624-3634
Tatebayashi K, Tanaka K, Yang HY, Yamamoto K, Matsushita Y, Tomida T, Imai M, Saito
H (2007) Transmembrane mucins Hkr1 and Msb2 are putative osmosensors in the SHO1
branch of yeast HOG pathway. The EMBO journal 26: 3521-3533
Tatebayashi K, Yamamoto K, Tanaka K, Tomida T, Maruoka T, Kasukawa E, Saito H (2006)
Adaptor functions of Cdc42, Ste50, and Sho1 in the yeast osmoregulatory HOG MAPK
pathway. EMBO J 25: 3033-3044
Tedford K, Kim S, Sa D, Stevens K, Tyers M (1997) Regulation of the mating pheromone
and invasive growth responses in yeast by two MAP kinase substrates. Curr Biol 7: 228-238

Page 47 of 49
Thorner J, Westfall PJ, Ballon DR. (2005) High Osmolarity Glycerol (HOG) Pathway in
Yeast. Sci. Signal. (Connections Map in the Database of Cell Signaling, as seen 10 January
2011) http://stke.sciencemag.org/cgi/cm/stkecm;CMP_14620.
Truckses DM, Bloomekatz JE, Thorner J (2006) The RA domain of Ste50 adaptor protein is
required for delivery of Ste11 to the plasma membrane in the filamentous growth signaling
pathway of the yeast Saccharomyces cerevisiae. Mol Cell Biol 26: 912-928
Truman AW, Kim KY, Levin DE (2009) Mechanism of Mpk1 mitogen-activated protein
kinase binding to the Swi4 transcription factor and its regulation by a novel caffeine-induced
phosphorylation. Mol Cell Biol 29: 6449-6461
Vadaie N, Dionne H, Akajagbor DS, Nickerson SR, Krysan DJ, Cullen PJ (2008) Cleavage of
the signaling mucin Msb2 by the aspartyl protease Yps1 is required for MAPK activation in
yeast. J Cell Biol 181: 1073-1081
Valtz N, Peter M, Herskowitz I (1995) FAR1 is required for oriented polarization of yeast
cells in response to mating pheromones. J Cell Biol 131: 863-873
Varanasi US, Klis M, Mikesell PB, Trumbly RJ (1996) The Cyc8 (Ssn6)-Tup1 corepressor
complex is composed of one Cyc8 and four Tup1 subunits. Mol Cell Biol 16: 6707-6714
Verna J, Lodder A, Lee K, Vagts A, Ballester R (1997) A family of genes required for
maintenance of cell wall integrity and for the stress response in Saccharomyces cerevisiae.
Proc Natl Acad Sci U S A 94: 13804-13809
Vilella F, Herrero E, Torres J, de la Torre-Ruiz MA (2005) Pkc1 and the upstream elements
of the cell integrity pathway in Saccharomyces cerevisiae, Rom2 and Mtl1, are required for
cellular responses to oxidative stress. J Biol Chem 280: 9149-9159
Wang HX, Konopka JB (2009) Identification of amino acids at two dimer interface regions of
the alpha-factor receptor (Ste2). Biochemistry 48: 7132-7139
Wang Y, Chen W, Simpson DM, Elion EA (2005) Cdc24 regulates nuclear shuttling and
recruitment of the Ste5 scaffold to a heterotrimeric G protein in Saccharomyces cerevisiae. J
Biol Chem 280: 13084-13096
Warmka J, Hanneman J, Lee J, Amin D, Ota I (2001) Ptc1, a type 2C Ser/Thr phosphatase,
inactivates the HOG pathway by dephosphorylating the mitogen-activated protein kinase
Hog1. Mol Cell Biol 21: 51-60
Wassmann K, Ammerer G (1997) Overexpression of the G1-cyclin gene CLN2 represses the
mating pathway in Saccharomyces cerevisiae at the level of the MEKK Ste11. J Biol Chem
272: 13180-13188
Watanabe M, Chen CY, Levin DE (1994) Saccharomyces cerevisiae PKC1 encodes a protein
kinase C (PKC) homolog with a substrate specificity similar to that of mammalian PKC. J
Biol Chem 269: 16829-16836
Page 48 of 49
Watanabe Y, Irie K, Matsumoto K (1995) Yeast RLM1 encodes a serum response factor-like
protein that may function downstream of the Mpk1 (Slt2) mitogen-activated protein kinase
pathway. Mol Cell Biol 15: 5740-5749
Watanabe Y, Takaesu G, Hagiwara M, Irie K, Matsumoto K (1997) Characterization of a
serum response factor-like protein in Saccharomyces cerevisiae, Rlm1, which has
transcriptional activity regulated by the Mpk1 (Slt2) mitogen-activated protein kinase
pathway. Mol Cell Biol 17: 2615-2623
Winters MJ, Pryciak PM (2005) Interaction with the SH3 domain protein Bem1 regulates
signaling by the Saccharomyces cerevisiae p21-activated kinase Ste20. Mol Cell Biol 25:
2177-2190
Wu C, Jansen G, Zhang J, Thomas DY, Whiteway M (2006) Adaptor protein Ste50p links the
Ste11p MEKK to the HOG pathway through plasma membrane association. Genes &
development 20: 734-746
Wu C, Leberer E, Thomas DY, Whiteway M (1999) Functional characterization of the
interaction of Ste50p with Ste11p MAPKKK in Saccharomyces cerevisiae. Mol Biol Cell 10:
2425-2440
Wu C, Whiteway M, Thomas DY, Leberer E (1995) Molecular characterization of Ste20p, a
potential mitogen-activated protein or extracellular signal-regulated kinase kinase (MEK)
kinase kinase from Saccharomyces cerevisiae. J Biol Chem 270: 15984-15992
Wu YL, Hooks SB, Harden TK, Dohlman HG (2004) Dominant-negative inhibition of
pheromone receptor signaling by a single point mutation in the G protein alpha subunit. J Biol
Chem 279: 35287-35297
Wurgler-Murphy SM, Maeda T, Witten EA, Saito H (1997) Regulation of the Saccharomyces
cerevisiae HOG1 mitogen-activated protein kinase by the PTP2 and PTP3 protein tyrosine
phosphatases. Mol Cell Biol 17: 1289-1297
Xenarios I, Salwinski L, Duan XJ, Higney P, Kim SM, Eisenberg D (2002) DIP, the Database
of Interacting Proteins: a research tool for studying cellular networks of protein interactions.
Nucleic Acids Res 30: 303-305
Yablonski D, Marbach I, Levitzki A (1996) Dimerization of Ste5, a mitogen-activated protein
kinase cascade scaffold protein, is required for signal transduction. Proc Natl Acad Sci U S A
93: 13864-13869
Yamamoto K, Tatebayashi K, Tanaka K, Saito H (2010) Dynamic control of yeast MAP
kinase network by induced association and dissociation between the Ste50 scaffold and the
Opy2 membrane anchor. Mol Cell 40: 87-98
Yang J, Meng X, Hlavacek WS (2010) Rule-based Modeling and Simulation of Biochemical
Systems with Molecular Finite Automata. 23
yeastpheromonemodel.org.

Page 49 of 49
Yesilaltay A, Jenness DD (2000) Homo-oligomeric complexes of the yeast alpha-factor
pheromone receptor are functional units of endocytosis. Mol Biol Cell 11: 2873-2884
Young C, Mapes J, Hanneman J, Al-Zarban S, Ota I (2002) Role of Ptc2 type 2C Ser/Thr
phosphatase in yeast high-osmolarity glycerol pathway inactivation. Eukaryot Cell 1: 1032-
1040
Yuan YL, Fields S (1991) Properties of the DNA-binding domain of the Saccharomyces
cerevisiae STE12 protein. Mol Cell Biol 11: 5910-5918
Zarrinpar A, Bhattacharyya RP, Nittler MP, Lim WA (2004) Sho1 and Pbs2 act as coscaffolds
linking components in the yeast high osmolarity MAP kinase pathway. Mol Cell 14: 825-832
Zarrinpar A, Park SH, Lim WA (2003) Optimization of specificity in a cellular protein
interaction network by negative selection. Nature 426: 676-680
Zarzov P, Mazzoni C, Mann C (1996) The SLT2(MPK1) MAP kinase is activated during
periods of polarized cell growth in yeast. EMBO J 15: 83-91
Zeitlinger J, Simon I, Harbison CT, Hannett NM, Volkert TL, Fink GR, Young RA (2003)
Program-specific distribution of a transcription factor dependent on partner transcription
factor and MAPK signaling. Cell 113: 395-404
Zhan XL, Deschenes RJ, Guan KL (1997) Differential regulation of FUS3 MAP kinase by
tyrosine-specific phosphatases PTP2/PTP3 and dual-specificity phosphatase MSG5 in
Saccharomyces cerevisiae. Genes Dev 11: 1690-1702
Zhan XL, Guan KL (1999) A specific protein-protein interaction accounts for the in vivo
substrate selectivity of Ptp3 towards the Fus3 MAP kinase. Genes Dev 13: 2811-2827
Zhao ZS, Leung T, Manser E, Lim L (1995) Pheromone signalling in Saccharomyces
cerevisiae requires the small GTP-binding protein Cdc42p and its activator CDC24. Mol Cell
Biol 15: 5246-5257
Zheng CF, Guan KL (1994) Activation of MEK family kinases requires phosphorylation of
two conserved Ser/Thr residues. EMBO J 13: 1123-1131
Zheng Y, Cerione R, Bender A (1994) Control of the yeast bud-site assembly GTPase Cdc42.
Catalysis of guanine nucleotide exchange by Cdc24 and stimulation of GTPase activity by
Bem3. J Biol Chem 269: 2369-2372
Zhou Z, Gartner A, Cade R, Ammerer G, Errede B (1993) Pheromone-induced signal
transduction in Saccharomyces cerevisiae requires the sequential function of three protein
kinases. Mol Cell Biol 13: 2069-2080