a framework for evaluating user acceptance of …...functionalities: a case study on the editor role...
TRANSCRIPT

A Framework for Evaluating User Acceptance of Individual System
Functionalities: A Case Study on the Editor Role for the PUMA Glossary
David Seth Madison
University of Tampere
Faculty of Communication Sciences
Human-Technology Interaction
M.Sc. thesis
UTA Supervisor: Dr. Markku Turunen
PUMA Supervisor: Michaela Meusel
August 2017

i
University of Tampere
Faculty of Communication Sciences
Human-Technology Interaction
David Seth Madison: A framework for evaluating user acceptance of individual system
functionalities: a case study on the editor role for the PUMA glossary
M.Sc.: thesis, 44 pages 5 index and 17 appendix pages
August 2017
With the rise of the digital workplace and enterprise cloud technologies, the modern corporate
intranet has evolved substantially; from a static information hub to a dynamic and interactive
ecosystem of applications and services. Prior research has validated the technology acceptance
model as a reliable method for evaluating the user acceptance of information systems. However,
it is not always practical to evaluate an entire system when feedback on an individual
functionality within that system is needed. Established methods for evaluating individual
functionalities within information systems remains scarce. This thesis presents the seven-step
PUMA user acceptance framework, created to evaluate user acceptance of a current
implementation of the editor role for the PUMA glossary, an application within the company
global intranet. A SharePoint Site Collection was created for the evaluation environment. A
questionnaire containing Likert scale ratings and open-ended questions was used for data and
feedback acquisition. A sample of ten participants from the target user group took part in the user
acceptance evaluation process. A Top Box report was compiled to communicate the findings,
and the open-ended feedback was used for insight to future development. The proposed
framework establishes a valid method for acquiring actionable user acceptance data for steering
development of individual functionalities within a system for the PUMA IT ecosystem
specifically. This thesis provides a foundation on which further research may be conducted to
evaluate user acceptance of other system functionalities in the future.
Key words and terms: Intranet, Glossary, User experience, Technology acceptance model

ii
Contents
1. Introduction 1
1.1. Thesis outline 3
2. Background 4
2.1. What is a business glossary? 4
2.2. Intranet platform 6
2.3. Overview of SharePoint Online 6
2.3.1. Site Collection 6
2.3.2. Sites 7
2.4. The glossary as one of many collaborative functionalities 11
2.4.1. The PUMA Glossary 11
2.4.2. User submitted content functionality 12
2.4.3. Editor role functionality 14
2.5. User Centered Design 17
2.6. The Technology Acceptance Model 19
2.7. The PUMA User Acceptance framework 20
3. Methodology 25
3.1. Selecting a functionality and aim of analysis 25
3.2. Defining user criteria 26
3.3. Selecting users 26
3.4. Presenting functionality to users 27
3.5. Functionality Presentation 29
3.6. Creating the Survey Questionnaire Content 29
3.6.1. Perceived Usefulness (PU) 30
3.6.2. Perceived Ease of Use (PEU) 30
3.6.3. Positive / negative and open-ended questions 31
3.7. Survey Implementation 31
3.8. Data Collection 36
3.9. Data Interpretation and reporting method 37
4. Results & Discussion 38
4.1. Improvement recommendations 43

iii
5. Conclusions 44
References 45
Appendices 50

1
1. Introduction
As the needs of businesses have evolved in the two decades since the digital intranet concept was
first introduced in 1996, the role and scope of intranet services within the digital workplace have
changed significantly (Wodehouse, 1997; Mentis, 2016). The principles of user centered design
and user acceptance testing have become an increasingly important component of corporate
intranets as businesses have begun to focus on not just the public facing experience but also the
internal, employee experience (Sikorski, 2006). The modern corporate intranet is no longer a
resource-heavy ecosystem of client side applications with passively consumed static content
hosted on a company’s own servers. For many companies, the intranet is increasingly becoming a
cloud-hosted central hub for new-hire onboarding processes, content creation, news updates,
employee specific services, communication portals and team collaboration (Jadeja & Modi,
2012). Cloud hosted intranets, provided through platforms such as Microsoft’s Office 365, are
revolutionizing the workplace further by enabling a global workforce to conduct daily business
from anywhere with an internet connection (Diffin, Chirombo, & Nangle, 2010; Lakshman &
Thuijs, 2011). New systems and features can be developed and installed in an ad hoc manner
within cloud based platforms like SharePoint (Hillier & Pattison, 2013). This means that a
company’s intranet becomes increasingly specialized to its specific needs over time, shredding
the “one size fits all” approach of the past.
Additional advances in information systems (IS) technology and the rise of “Enterprise
2.0” have led to the concept of the “Social Workplace” (Li, 2010). In the social workplace, the
intranet contains services with collaborative features and applications like those commonly found
in social networking websites (e.g. personal profile management, custom home pages, news
feeds, instant messaging and video calling). Social technologies in the workplace enable workers
to communicate and collaborate on business objectives across otherwise discrete or distant
departments (Sultan, 2013). The social workplace concept has seen increased adoption by
businesses as it has been shown to empower employees and increase productivity (Lauby, 2013).
Adoption of social technologies in the workplace is not just a trend among business strategists
and management; young employees entering the workforce are expecting to use social
technologies on the job (Leidner, Koch, & Gonzalez, 2010).
Companies, with a global audience utilizing the social workplace concept, must strategize

2
accordingly to develop implementation methods to include user feedback and user acceptance
testing for use-cases as they are developed. Developing applications and services alongside user
feedback enables an organization to predict user acceptance of new systems and functionalities
ahead of launch dates, increasing overall user acceptance of services provided and increasing
overall business value of the applications within the company intranet (Davis, 1993; Yogesh
Malhotra & Galletta, 2004).
Past studies have found the Technology Acceptance Model (TAM) (Davis, 1985) to be a
reliable method for predicting user acceptance of new information systems in workplace settings
(Horton, Buck, Waterson, & Clegg, 2001; Lee & Kim, 2009). However, these studies providing
the foundation for the efficacy of using TAM are evaluating the user acceptance of entire
systems, not individual functionalities within those systems. While an entire system approach to
evaluating user acceptance can identify different aspects of a system that may lead to user
acceptance overall, the user acceptance of individual functionalities within a system is left largely
unknown (Thong, Hong, & Tam, 2004). Therefore, the total system approach is not an efficient
way to collect actionable insights to steer development of an individual functionality within a
system. For this thesis, a PUMA User Acceptance (UA) framework was created to evaluate user
acceptance of functionalities within an overall system to address this gap.
The framework aims to streamline the process of collecting actionable user acceptance
data for use cases that add new functionalities to an overall system. Instead of evaluating the
entire system, the framework uses the constructs of perceived usefulness and perceived ease of
use from the larger Technology Acceptance Model to evaluate the user acceptance of an
individual functionality within a system. This thesis utilizes the PUMA UA framework to collect
and evaluate data on the user acceptance of the editor functionality within the PUMA glossary
system currently under development.
Participants for the research were selected from the company’s COO organization as the
first rollout group for the glossary as they work across all departments and areas of expertise. The
pilot was conducted first with plans for the broader test including other departments to be
administered after the results of this pilot are collected and analyzed for this case study.

3
1.1. Thesis outline
This thesis contains five chapters. Chapter 2 provides the background and use case for which the
framework was created. It begins with an introduction to the role of corporate glossary systems,
followed by a brief overview of the SharePoint intranet platform, as it is used to deliver the
glossary system for the company. Additionally, the background provides a literature review on
the core research used to create the PUMA UA framework; Principles of User Centered Design
and the Technology Acceptance Model. Chapter 3 describes how the PUMA UA framework is
implemented for the research conducted in this thesis followed by the results and discussion of
the findings in Chapter 4. Chapter 5 provides the conclusions and remarks on the research
analysis and suggestions for future implementation of the PUMA UA framework.

4
2. Background
This chapter presents the background of the research in the thesis including an explanation of
business glossaries, the intranet platform, a brief overview of SharePoint is included for
illustrating the context in which the Glossary system is placed as well as how the collaborative
functionalities of the glossary system are accessed and used. Moreover, the core research that
forms the foundation for the implementation framework, principles of user centered design and
the technology acceptance model, are described.
2.1. What is a business glossary?
A business glossary is the central tool used to provide enterprise-wide terminology within most
corporate intranets (Fryman, 2015). The benefits of a corporate glossary within an enterprise
include: terminology and definitions for concepts, vocabulary commonly used within the
enterprise and minimizing misunderstandings in communication between coworkers and business
units (Kremer, Kolbe, & Brenner, 2005). As employees go about their daily jobs, they may
encounter terminology that they would either not encounter in day-to-day experiences or
experience the use of a term by the organization in an unfamiliar context. The internal business
glossary provides a reference for users to check business-approved meanings of terms officially
defined by the company. Conducting business with a common understanding of terms enables
users to complete their tasks with clarity and efficiency (Fryman, 2008). Additionally, the
glossary has the potential to vastly improve the employee onboarding process with the organic
submission of terminologies sought after by individuals referencing the glossary when they are
new to their jobs. While the benefits may seem obvious, challenges remain for designers and
application developers to provide these glossary systems in a way that is easy to use, encourage
user engagement, and provide a salient value to the user’s daily workflow.
Urban Dictionary defines a glossary as “the thing in the back of the book that teachers
torcher students with” (Tupitza, 2010). Indeed, it is all too common for a glossary to be a difficult
to read, flat, static list of terms and definitions; something that is not a lot of fun to look at and
even less fun to use (reference Figure 2.1.).

5
Figure 2.1. An online glossary of a real estate company (Accessed 25 April 2017)
Thus, the user experience of traditional glossary systems leave much to be desired. Users
that find a new system difficult to use will increasingly find the system not worth the effort and
less likely to return. When a system has low user acceptance, it becomes underutilized within an
organization and the resources invested into it are effectively negated (Davis, 1993).

6
2.2. Intranet platform
The glossary is provided through the company’s intranet which is implemented through a
Microsoft SharePoint Online as a service deployment. Microsoft SharePoint Online is a web-
based collaborative platform integrated with Microsoft’s Office 365 application suite. SharePoint
Online provides both basic pre-built features as well as can be integrated with custom developed
applications (“SharePoint Online,” 2017).
2.3. Overview of SharePoint Online
A SharePoint intranet solution typically consists of a Site collection (or multiple Site collections),
and Sites within the Site collection (reference Figure 2.2.).
Figure 2.2. A representative graph describing the structure of a SharePoint Online Site collection
(Accessed from (“SharePoint Online,” 2017)
2.3.1. Site Collection
The SharePoint Site Collection is the highest-level site acting as the key distributor of individual
sites within it. A Site Collection can be configured with permissions that are granted
automatically to subsequent individual Sites that are created and populated within it. Different
Site Collection strategies exist depending on a company’s individual information architecture

7
requirements. For example, a business might find that their needs can be satisfied by a single Site
Collection with individual Sites and Subsites underneath it. However, for larger companies with a
global workforce, this approach can become difficult to manage. With a large global workforce, it
becomes advantageous to provide an entire Site Collection for more complex use-cases like the
Glossary system since it will need to be accessible by all employees in the company (Zelfond,
2015).
2.3.2. Sites
The SharePoint Site is what connects “content, information, and apps” used in the day-to-
day workflow (Office Support, 2017). In other words, it is a fundamental element of SharePoint
Online. Sites are accessed by users that have been assigned to user groups within the Site. User
groups can be individually configured and assigned different permissions reflecting
organizational hierarchy, allowing administrators to grant access to site content and features that
are most relevant to individual groups (reference Figure 2.3.).
Figure 2.3. a list of site permission user groups within a SharePoint Online site

8
Pages are the primary component of SharePoint Online sites as they are used to provide
the user interface and interactive features for end users. Pages are initially very basic containing
only a minimal number of interactive features (reference Figure 2.4.). However, pages can be
extensively customized and themed (reference Figure 2.5.) by an enterprise.
Figure 2.4. a standard, uncustomized SharePoint Online landing page

9
Figure 2.5. A PUMA customized intranet team site landing page (accessed 21st of July 2017)
Content between sites and pages within sites are tied together by SharePoint Search, the
built-in search engine. An organization can configure SharePoint Search per their individual use
case needs displaying content within specific pages or specific applications for designated user
groups (reference Figure 2.6.).

10
Figure 2.6. A word search using SharePoint Search showing additional options to broaden
the search reference (accessed 2nd of June 2017)
The SharePoint Online platform is integrated with Microsoft’s other native online
applications in the cloud (e.g. Outlook, Teams, Word). This integration within the cloud-based
environment provides users the ability to access and manage their individual workflow from any
location with an internet connection.
Since it released in early 2013, SharePoint Online has become the leading platform for
intranets providing customizable, social workplace services in a cloud-based ecosystem (Hobert
et al., 2016; Meske et al., 2017). In addition to the platform being highly configurable and
customizable it also allows for a company to develop their own in-house solutions that can then
be integrated into their SharePoint Online ecosystem (Hillier & Pattison, 2013). This allows an
enterprise to use SharePoint Online as a base for expanding available features and services
beyond what is initially included in the service. The PUMA intranet takes advantage of this as it
is heavily customized to incorporate features and services (e.g. the PUMA Glossary) developed
exclusively for use within the PUMA SharePoint Online ecosystem.
Because of its location in the cloud, the SharePoint Online platform is also scalable
(Jadeja & Modi, 2012; Sultan, 2013). If an enterprise’s intranet needs change over time,
modifications can be made to the service subscription to allow for more storage or additional
capabilities and features (Srirama & Ostovar, 2014). Having intranet services located in the cloud
allow a company more flexibility in providing more dynamic intranet services and applications

11
with investment resources that would otherwise be required to maintain additional database
hardware management and personnel (Sadiku, Musa, & Momoh, 2014).
2.4. The glossary as one of many collaborative functionalities
Collaborative functionalities in a given system provide users a way to communicate, share, and
work on tasks together to produce a product much faster than if those individuals had worked on
their own (Horvath, 2001; Lococo & Yen, 1998). For the present thesis, collaborative
functionalities are defined as a feature that “provides a unit of information created with two or
more individuals”. Information produced this way has multiple avenues available for realizing
content creation from content ideation. In the PUMA Glossary, users may submit new suggested
terminologies through the interface that are then evaluated and approved, edited, or declined by
another user that has been designated as a glossary editor. The glossary editor acts as a
gatekeeper to ensure quality and relevance of submitted terminology aligns with business
processes. The glossary contains two primary collaborative functionalities: the user submission
functionality (briefly described below in subsection 2.4.2.) and the editor role functionality
(described in detail in subsection 2.4.3).
2.4.1. The PUMA Glossary
This section provides a brief overview of the glossary available in the testing environment.
Additionally, this section describes in greater detail the interaction between the system’s
collaborative functionalities unique to this specific use-case
The Glossary system is a custom-coded application residing in a Site Collection where the
foundation of the application including the source for its User Interface display is located. The
glossary system is accessed only by test users in the current test phase through a beta instance of
the PUMA intranet where it can be prototyped in a near-live environment. From the glossary
landing page (reference Figure 2.7), a user can search for terms as well as see featured entries,
latest entries (entries recently added to the glossary term set) or suggest a new term.

12
Figure 2.7 the glossary system landing page (accessed 11th April 2017)
2.4.2. User submitted content functionality
To encourage user interaction with the system further than just searching for terms, the glossary
provides the ability for users to submit new term suggestions via the glossary interface by:
1. Clicking on the “Suggestion” button (Reference Figure 2.8.)
Figure 2.8. the glossary landing page with mouse hovering over the Suggestion button (Accessed
5/12/2017)
In the suggestion interface (reference Figure 2.9.), users are prompted to provide
information to the following fields:
1.) “TITLE” refers to the name of the term being suggested.
2.) “CONTENT” refers to the definition of the word they are suggesting, or

13
3.) “GLOSSARY” clicking this button returns the user to the glossary interface if
they change their mind (the “CANCEL” button provides the same function) about
submitting a term and wish to return to the Glossary home page.
4.) “SUBMIT SUGGESTION”: Clicking this button instructs the system to inform
an editor of the new submission setting into motion the editor functionality
(described in detail in subsection 2.9.).
Figure 2.9. the glossary suggestion interface (Accessed 5/12/2017)
The purpose for the submission functionality is to enable users to address for the
possibility a certain term or terms may have a significantly different meaning across different
departments. For example, the definition of what a “customer” is, which can be a single person or
a company of persons depending on the respective department definition of customer. In addition,
department leaders may suggest terms to the glossary contextually identified per their
interpretation of the word, which, upon approval by the editor, the term becomes available for
reference in the glossary for clarification. Furthermore, if a general user identifies a good
candidate or candidates for new term suggestions in their day-to-day conversations with
colleagues, the user may suggest the terms independently, directly to the glossary themselves. If
the suggested term or terms are approved by glossary editors the term is added to the official
company lexicon for all to see.

14
The glossary adds additional value to PUMA through the suggestion functionality
enabling users to provide terminology directly relevant to them both in official contexts as well as
day-to-day conversations within the company and with greater clarity of meaning with others.
While the glossary will initially contain terminology seeded by designated users prior to the
system release, going forward, it would not be cost effective for designated users to manually poll
general users for submissions every time the glossary needed to be updated. With the suggestion
functionality, the glossary can account for situations that may arise where additional relevant
terminology may be added organically by users. Users may suggest new terms as they become
aware of the need for them without having to store them to submit later or otherwise forget them
when the time for a surveyed content submission opportunity would arise.
2.4.3. Editor role functionality
Because new terminology can be submitted by all users, an editor role was needed to act as a
gateway and filter to ensure a standard of quality and consistency with term submissions while
also avoiding duplicate entries. One of the aims for evaluating the editor functionality is to
measure the user acceptance of the editor functionality as it is in its current state. It currently uses
default SharePoint Online list alert systems and is not a custom-coded solution. If the current
functionality is acceptable for users, it could save the company additional development costs.
However, if the current functionality is not acceptable to users or there is a lot of negative
feedback for the editor alerts, development resources can be organized to improve user
acceptance for the editor functionality. User acceptance by editors is especially important because
the editor role functionality is an integral part of the glossary system process in providing
content.
To streamline the term quality gate-keeping process, the editor role has a direct
relationship with the content that is provided via user submitted suggestions. The editor role is
filled by general users with special permissions (Edit permissions granted for the term list).
Editors may interact with suggested terms in the following ways:
Approval of terms: terms suggested by users are added to the official glossary lexicon
when an editor approves of the submission.
Edit: an editor may evaluate, refine, or change the definition of a term that has been
suggested before adding it to the glossary. Editors can also correct for any grammar or spelling
mistakes contained within suggested terms before they are approved and appear in the glossary.

15
Delete terms: in the case of an outdated term or duplicate suggestions that have been
submitted, the editor may delete the term or terms.
When a term is submitted by a user through the glossary interface, editors will receive an
email alerting them (according to their preferences when the alert was created either they can
have submitted terms provided on a daily basis or in a lump on a weekly basis) that the new term
has been submitted for review (reference Figure 2.10.) the editor may then click the link “view
PUMAGlossary” sending them directly to the list containing all current glossary terms (most
recent and unapproved terms appearing at the top (reference Figure 2.11.).
Figure 2.10. An email alert informing the editor about a new term

16
Figure 2.11. The glossary list page within SharePoint where it contains the newly submitted
terms for editors to review
Once the editor is directed to the term list page, editors may approve, edit, or delete the
suggested terms from the built-in SharePoint Online list function interface. To edit a term, the
editor must first click on the term, navigating to the term page, click “edit item” from the
SharePoint interface, and provide the information within the Metadata fields for the term
(reference Figure 2.12.).
Figure 2.12. the term page, illustrating the placement of the “Edit item” button
Once the editor has set the “PUMAGlossarySuggestionState” to released, and clicked
“SAVE”, the term then becomes available in the glossary system for all users to see (reference
Figure 2.13.). At any time, an editor can return to terms that have been released and change or
alter their attributes. Terms may also be deleted even after they have been saved to the term list
(e.g. if the use of a term or group of terms becomes deprecated at a future time).

17
Figure 2.13. When “PUMAGlossarySuggestionState” is set to “released” the term will be
unavailable
2.5. User Centered Design
The concept of ‘user centered design’ was first used by Donald A. Norman, an American
research Psychologist from the University of California, San Diego. The goal of user centered
design is to deliver a series of principles that aid in developing products considered to have very
high usability. User centered design consists of four main principles applied to a rhetorical
situation (Norman, 1988; 2016).
The four core principles of user-centered design are:
1. Visibility
2. Accessibility
3. Legibility
4. Language
Visibility refers to a user’s ability to tell from very little exposure to a product what they
can and cannot do through interaction with the product.
Accessibility refers to the user’s ability to quickly navigate the contents of a product with
clearly labeled buttons or interactive elements and consistent use of interactions providing similar
functions.
Legibility refers to the ease of readability and contrast of informational text contained
within a product, for example black text on a white background.
Language refers to how the information within a product is provided to a user. For
example, omitting unnecessary technical jargon when simpler word choices can be used to
communicate the same information.

18
The Rhetorical Situation is a theoretical use case where the previously described
principles of user-centered design are applied to the product being examined.
The rhetorical situation is made up of three main concepts:
1. Audience
2. Purpose
3. Context.
The Audience, in effect are the users that the product is intended for. An audience is
created by the description of demographics such as education, nationality, job title, or department
to which they belong in an organization or population demographic subset.
The Purpose in the rhetorical situation refers to the problem that the product intends to
solve for the Audience. A purpose can be a description of the ways in which a product can be
used by the audience, and the intention of the product’s use.
The Context sets the tone for how the purpose affects the audience. For example, in what
situations would the audience use the product and how will the product solve the issue in which it
is intended for use.
Utilizing user-centered design as a concept for developing user acceptance testing
frameworks gained widespread acceptance and appeal after the publication of Norman’s book
“The Design of Everyday Things” (Originally titled “The Psychology of Everyday Things”)
which ties judgments of the design of environmental objects to human psychology explaining
how psychological processes are involved in deriving what makes a design essentially “good” or
“bad” (Norman, 1988). The principles of user-centered design were quickly applied to
information systems and products because information systems have long been tied to human
psychology because of the direct influences in how we use and interact with any external stimuli
in the outside world (Allen, 1996.; Borlund, 1997; Jank, 2012; Kubie, et al., 1996).
Incorporating user-centered design into an implementation process provides an important
framework for optimizing a product or service around how users would naturally interact with the
system rather than requiring users to adapt their behavior to facilitate the product (Grudin, 1991).
A user-centered design approach to product implementation keeps the user’s needs and
requirements at the center of design and development decisions throughout the development
lifecycle (Göransson, Gulliksen, & Boivie, 2003). A product developed around a user’s needs
substantially increases user acceptance and subsequent system utilization thus providing greater
return on investment resources allocated to the product (Davis, 1993; Gulliksen et al., 2003).

19
2.6. The Technology Acceptance Model
User acceptance of new information systems is paramount for the adoption and successful rollout
of any new IS product. Reliably anticipating user acceptance of new systems as early as possible
in the design and development process is key to ensuring investments are maximized for a
company (Davis, 1993). Based on psychological principles and human factors research, the
technology acceptance model (TAM), developed by Davis (1985) provides a reliable framework
in which user acceptance of new information systems can be predicted before resources and time
are allocated to system development (Davis, 1985).
The Technology Acceptance Model (TAM, reference Figure 2.14.) is still the most widely
accepted model in information technologies for predicting user acceptance and usage of new
information systems (Legris, Ingham, & Collerette, 2003; Malhotra & Galletta, 1999; Mathieson,
1991; Marangunić, 2015). The model proposes that application usage can be predicted by factors
related to perceived ease of use and perceived usefulness, derived from a rating scale survey
(Davis, 1985).
Figure 2.14. the Technology Acceptance Model, adapted from Davis (1985)
The TAM can be administered in a variety of ways and for varying purposes
(Marangunić, 2015). Since its conception, TAM has been replicated with consistent and reliable

20
results in a variety of studies as well as used to evaluate user acceptance of collaborative systems
in business contexts (Malhotra & Galletta, 1999). Typically, for products that have not yet been
pushed live, TAM can offer insights into user preferences that can be used to empirically
communicate change requests to development teams (Davis, 1993). Therefore, using TAM
constructs for user acceptance surveys provides insights that in turn can be used to steer
development with the user at the forefront of design decisions. Keeping the user in focus
throughout the development process results in more usable systems and an increased level of user
acceptance for a system. Making iterations based on user feedback and acceptance testing
throughout the development process leads to more efficient product development lifecycles
(Mayhew, 1999).
For information systems in an intranet, prior research indicates that perceived usefulness
is a stronger indicator for user acceptance than perceived ease of use, however, both constructs
have a direct effect on user acceptance of new system usage within an enterprise (Lee & Kim,
2009). Therefore, testing for strong user acceptance using constructs of Perceived Usefulness and
Perceived Ease of Use within an enterprise framework can be used to further maximize
development investment for new systems. Gauging user perceptions of a system can inform
designers’ and developers’ implementation decisions to provide changes and/or additions as
needed, before the system is deployed to a live environment (Davis, 1993).
2.7. The PUMA User Acceptance framework
To evaluate new system functionality acceptance for the editor functionality of the glossary
system, a method that could be applied to the specific use case of the glossary system editor
functionality was created. In addition, the framework must be adaptable for evaluating additional
functionalities when needed. To fulfill this need, a seven-step, general framework was created
(reference Figure 2.15.).

21
Figure 2.15. the PUMA UA framework process map
The seven-step framework is outlined and explained as follows:
I. Selecting new system functionality:
The new system functionality is selected by the individual tasked with performing the
functional testing for a system use case.
II. Defining user criteria:
An analysis of the intended user audience for the new functionality is conducted and user
participation criteria is defined.
III. Selecting users:
Users are selected based on the criteria defined in the previous step and sent an email
invitation. The email invitation contains a direct link to the site presenting the
functionality process.
IV. Presenting functionality to users:
The new system functionality is detailed in an overview format and provided to users
through presentation software.

22
V. Users respond to survey
After the presentation(s), users are directed to a survey application. The survey contains
15 total items. 12 items are Likert scale rating questions and three open ended questions.
Likert scale items 1-6 measure the construct of perceived usefulness. Likert scale items 7-
12 measure the construct of perceived ease of use. The three open ended questions include
one question requesting user opinion on the most positive aspect of the system, one
question requesting user opinion on most negative aspect, and lastly one question
requesting general comments by the user on the overall system and/or framework. All
Likert scale items and the positive and negative open ended opinion questions are
required to submit the survey. The general comments open ended question is optional, and
does not need to contain information for the user to submit the survey. A survey window
timeframe is also defined (e.g. the survey will be available for one week after which the
survey is closed and the administrator will proceed to step six).
VI. Analyzing and evaluating survey data:
Once the survey window timeframe has closed, the data is collected and analyzed. The
Likert scale ratings are compiled and sorted per their respective construct (PU & PEU).
Open ended questions are collected and sorted into positive and negative (per the answers
provided by users) and a general feedback pool, then open ended question feedback is
categorized by content of the feedback.
VII. Presenting data on user acceptance of functionality
After survey data analysis, the results are compiled into a report and communicated to
development and design teams for next steps.
The framework was created following the principles of user centered design as a
foundation paradigm for the approach and flow of the steps within it. The Technology
Acceptance Model was used for data acquisition within the structure and design of the survey.
In step I, the new functionality that is to be tested for the system is identified and
described. The framework keeps the user at the center of the process in the following steps once
identifying the new functionality. If a new functionality is part of a system that has not yet been
introduced to any user, then an overview introduction presentation to the system should be
provided. This can be indicated when identifying the user criteria for the functionality testing
during the framework process (e.g. user criteria requires users that are provided an overview of
the system before the functionality presentation).

23
In step II, the user criteria are defined for users contacted to participate in evaluating the
functionality. Because users for new system functionalities within an enterprise are the enterprise
employees themselves, intended user audiences should be identified as “users that will be or
potentially be using the new functionality as part of a system they use in their daily workflow
now or in the future”. Therefore, traditional demographics data and user system usage preference
do not need to be collected because this information is already available within the company’s
internal social networking services (e.g. Delve, Skype).
In step III, users that satisfy the defined user criteria of the previous step are then selected.
Because the company uses Microsoft Office 365 services in association with the SharePoint
intranet solution, all defined user criteria can be collected from user profiles in Microsoft Delve.
At least five qualifying users are sent an email invitation to participate in the survey testing and
may access the survey site directly from the emailed invitation. Users are informed that no
answer to the survey can be incorrect, no negative consequences will result from participation
and their submissions will be safely stored and anonymized.
In step IV, users are guided to the new functionality presentation (or alternatively, a
testing environment) within a SharePoint site. The presentation is a brief PowerPoint presentation
embedded into the SharePoint page describing the new functionality as it would relate to a user’s
workflow within the system. The intended purpose of the new functionality is outlined and the
steps involved for a user are explained sequentially leading to the completion of the task
addressed by the new functionality.
In step V, users are directed to the survey after reading through the presentation of the
new functionality. The survey is a 12 item, seven-point Likert response survey that has
standardized wording modeled after items in the technology acceptance model to address
perceived ease of use and perceived usefulness. Because of the standardized wording of the
survey questions and survey response items, the placement of the system and functionality name
has a standard location within the sentence structure of the survey items. Therefore, it can be
easily altered in future functionality feedback surveys by simply changing out the system specific
words.
In step VI, the framework administrator conducts an analysis on the data collected from
the survey. Various data analysis techniques can be used depending on response rates to the
survey; however, at least five users from discrete departments should be the aim of user feedback
sampling. Therefore, the framework requires at least five users to be selected for response to a

24
functionality survey. This is not to say that five users should be the end goal sample for the
research but rather that at least five of the users are in different organizational departments to
ensure a wide range of expertise and user preference feedback is collected for this functionality.
Step VII of the framework guides the framework administrator to compile the data and
provide actionable recommendations based on the results collected from user feedback on the
functionality. The results and recommendations are then sent to the team leader of the project
where a decision on future steps would be made.

25
3. Methodology
This chapter describes the methods of the research through the lens of the PUMA UA framework.
Aligning to the seven-step PUMA UA framework described in the previous chapter, the author
details the process of selecting the editor functionality, and defining the user criteria. The user
sample is compiled and invited for participation to evaluate the functionality. Following the
description of the editor functionality implementation and presentation, the survey creation
process is depicted. Finally, the data collection and reporting methods are detailed.
3.1. Selecting a functionality and aim of analysis
The functionality for the editor role was selected for user acceptance evaluation. The editor is a
general user, or group of general users that may edit the term list of the PUMA glossary system.
The basic functionality for the editor role may be implemented using standard SharePoint
systems requiring no additional development (see Table 1.). However, user acceptance of this
approach cannot be assumed.
Basic Function for Editor Role Corresponding SharePoint system
A notification that a term has been suggested List alert
A function to approve the suggested term List item interface
A function to edit the suggested term List item interface
A function to delete the suggested term List item interface
Table 1. The editor role functionalities and corresponding SharePoint systems
The aim of this analysis is to evaluate user acceptance of an implementation using
standard SharePoint functionalities. In addition, the analysis aims to collect target-group insights
to steer development efforts (if needed) of additional functionality for the editor role.
26
3.2. Defining user criteria
User criteria for the editor role in the glossary is defined as “A general user of the glossary
with expertise in terminology of their respective fields”. Therefore, a qualifying user must be
within two organizational positions of the global head of their respective department and/or
contain the title of “manager” in their profile.
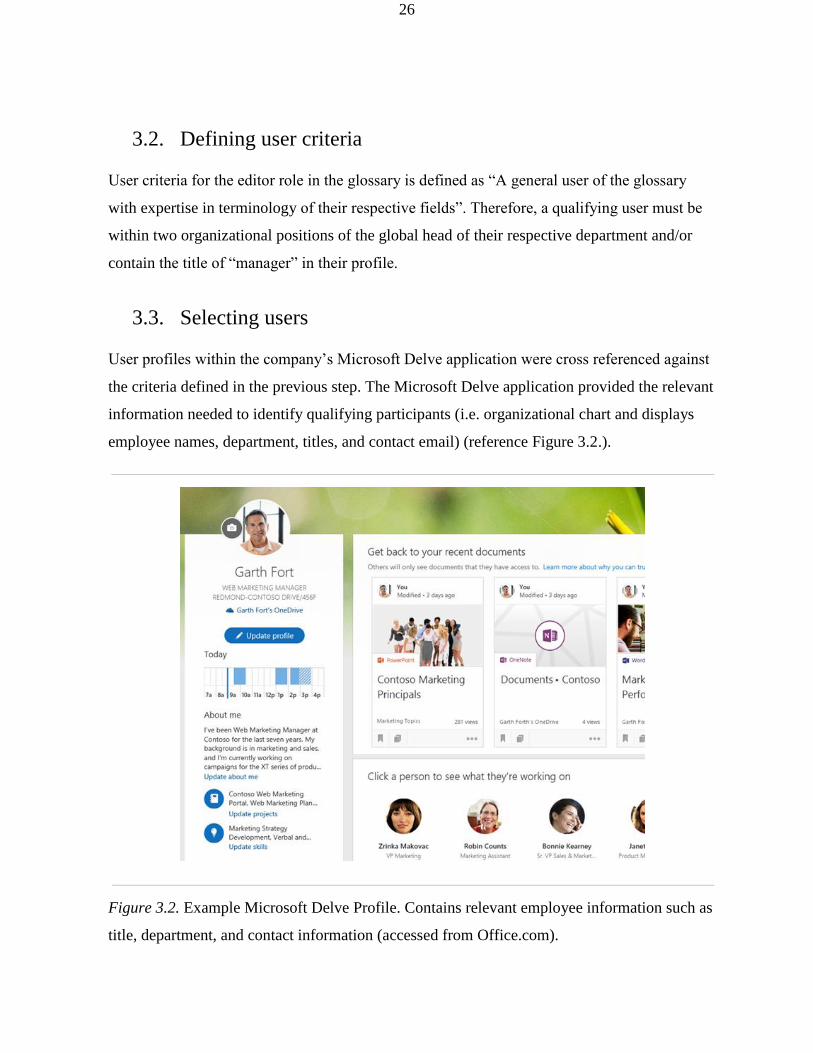
3.3. Selecting users
User profiles within the company’s Microsoft Delve application were cross referenced against
the criteria defined in the previous step. The Microsoft Delve application provided the relevant
information needed to identify qualifying participants (i.e. organizational chart and displays
employee names, department, titles, and contact email) (reference Figure 3.2.).
Figure 3.2. Example Microsoft Delve Profile. Contains relevant employee information such as
title, department, and contact information (accessed from Office.com).

27
18 users were assigned to a SharePoint group within the SharePoint Site (named Survey
Respondents). The Survey Respondents group was granted “contribute” level permissions to
ensure users could access the SharePoint site when receiving the invitation email as well as
submit survey responses.
As the company has an international workforce, many of whom English is a second
language, the invitation email defined three key words used in the survey (Productive, Efficient
and Effective) due to their subtle differences (see Appendix B).
Productive was defined as “Referring to the ability produce an amount of data, or
something of value in large amounts.”
Efficient was defined as “Referring to achieving productivity with a minimum amount of
wasted effort and expense.”
Effective was defined as “Referring to the successful ability to produce a desired or
intended result.
Each user was invited individually by the author using an email template
(See Appendix A).
3.4. Presenting functionality to users
The presentations were created with Microsoft PowerPoint and uploaded to a SharePoint
Document Library. The PowerPoints are embedded into a SharePoint Page from their location in
the Document Library (Reference figure 3.3).
Figure 3.3. Presentations are uploaded to a Document Library to be embedded in SharePoint
Pages

28
When a user clicks the link in the email invitation, they are directed to the introduction
page of the New Functionalities SharePoint site (Reference Appendix B). From the introduction
page, users may proceed to the Glossary overview presentation by clicking the “CONTINUE”
link located at the bottom of the page. Users are instructed to read through the 9 supplied slides
embedded within the SharePoint page (reference Figure 3.4.).
Figure 3.4. The Glossary overview page as seen by users (detailed in full in Appendix C)
The overview presentation provides the user a brief description of basic functionalities of
the overall glossary system in nine slides. The Glossary Overview presentation acts to give
context to the overall system interaction between general users and editors. Once the user has
read the presentation slides, they are instructed to proceed to the following functionality
presentation.

29
3.5. Functionality Presentation
The functionality presentation was created with Microsoft PowerPoint, using nine slides to
describe the role of the editor and the functionality as it would be used in its current
implementation state (reference Figure 3.5.).
Figure 3.5. The editor role presentation embedded into the SharePoint Page (detailed in full in
Appendix D)
The functionality presentation provides a description of the editor process when a new
term is suggested to the system. Once the user reaches the final presentation slide, they receive
instructions to continue to the survey by clicking the “CONTINUE” button located below the
presentation slides.
3.6. Creating the Survey Questionnaire Content
12 Likert scale rating questions and three open-ended feedback responses questions were created
for the survey. Questions 1-6 of the Likert scale items measure the construct of perceived

30
usefulness. Questions 7-12 of the Likert scale items measure the construct of perceived ease of
use. Question 13 and 14, the open-ended feedback questions, ask respondents to identify the most
negative and most positive aspect of the functionality respectively. Question 15 asks for
respondents to provide any general feedback related to the system overall. Questions 1-14 are
required to submit the survey. Question 15 is left optional.
3.6.1. Perceived Usefulness (PU)
Defined by Davis (1985) Perceived Usefulness is “the degree to which an individual believes that
using a particular system would enhance his or her job performance (Davis, 1985) ”. In other
words, how useful a user perceives a proposed system and/or the functionality that it provides.
Previous research has demonstrated the reliability of using this construct for purposes of intranet
system user acceptance (Lee & Kim, 2009). The questionnaire implements six items evaluating
this construct by adapting the original scales used by Davis (1985). The endpoints of “likely” and
“unlikely” based on a Likert scale rating of 1-7 as in the original Davis scales on predicting user
acceptance of new systems is used (see Appendix E.).
The individual question items are framed to ask the extent the user would find a new
functionality useful within the current system.
As a content editor for the glossary…
1. Using the editor functionality would enable me to quickly manage suggested terms.
2. Using the editor functionality would improve my performance when managing suggested
terms.
3. Using the editor functionality would increase my productivity when managing suggested
terms.
4. Using the editor functionality would enhance my effectiveness to manage suggested
terms.
5. Using the editor functionality would make it easier for me to manage suggested terms.
6. I would find the editor functionality useful when managing suggested terms for the
glossary.
3.6.2. Perceived Ease of Use (PEU)
Referencing Davis (1985) again, Perceived Ease of Use is defined as “the degree to which an
individual believes that using a particular system would be free of physical and mental effort

31
(Davis, 1985)”. In other words, how a user perceives the proposed system and/or functionality to
be easy to learn and use. Again, previous research has demonstrated the reliability in using the
construct of perceived ease of use to evaluate enterprise information systems (Lee & Kim, 2009).
The questionnaire implements six items evaluating this construct adapting the original scales
used by Davis (1985). The individual question items for PEU, like PU are framed within the
context of the system to ask the extent a user would find the functionality easy to use based on a
Likert scale of 1-7. The endpoints of “unlikely” and “likely” are utilized again as in the original
Davis (1985) scales (see Appendix E.).
As a content editor for the glossary…
7. Learning to operate the editor functionality would be easy for me
8. I would find it easy to get the editor functionality to do what I want it to do.
9. My interaction with the editor functionality would be clear and understandable.
10. I would find the editor functionality to be flexible to interact with.
11. It would be easy for me to become skillful at using the editor functionality.
12. I would find the editor functionality easy to use.
3.6.3. Positive / negative and open-ended questions
Open ended questions are important both for the usability of a survey and can provide valuable
information and feedback that cannot be communicated by Likert scale ratings (O’Cathain &
Thomas, 2004). For example, a user could find the functionality both useful and easy to use but
also tedious or time consuming, the latter of which could be communicated through the open-
ended feedback responses. In this way, open-ended questions serve as an additional reference for
making actionable decisions in reporting the data (Renner & Taylor-Powell, 2003).
1. In your opinion, what is the most negative aspect of the editor functionality?
2. In your opinion, what is the most positive aspect of the editor functionality?
3. If you have any additional comments or questions about the editor functionality, please
feel free to write them here.
3.7. Survey Implementation
Upon completion of the Functionality Presentation (detailed in section 3.5), users navigate to the
survey clicking the continue link located below the embedded presentation on the page.

32
The survey was available for two weeks. Participant identities were hidden by the SharePoint
Survey application but since the application also allows for this setting to be reversed, participant
data was collected and coded into an excel sheet to anonymize the data.
The survey application was added to a SharePoint site created specifically for providing
the embedded presentations and distributing the survey to users. Individual questions were
created within the Survey application which also acts as a repository for the responses submitted
to it. Simply linking users directly to the survey application needed to be avoided, because a
direct link to the application provides a view of the survey’s name, creation time and number of
responses, all of which is information irrelevant to participating users (reference Figure 3.6.). To
streamline the response submission process and reduce response effort, a link to the survey
response page (effectively functioning as a user clicking the “Respond to this survey” button on
the application page) needed to be linked directly to bypass the Survey application overview
page.
Figure 3.6. the Survey Application Landing Page (which is avoided by linking to the
button “Respond to this Survey” instead of linking to the survey application itself.)
Creating an individual question for each PU and PEU item within the Survey application
would make the survey’s visual presentation to the user overly large spanning multiple pages.
This would make the response process too tedious and time-consuming for users. The solution
was to provide the general leading statement (“As a content editor for the glossary…”) for each

33
construct with six sub-questions each. One question would be made for each open-ended
response totaling five Survey application questions. (reference Figure 3.7.). Setting the two
questions containing the Likert scale rating items to “Required” would be answered if a survey
was successfully submitted.
Figure 3.7. List of questions for the survey in SharePoint
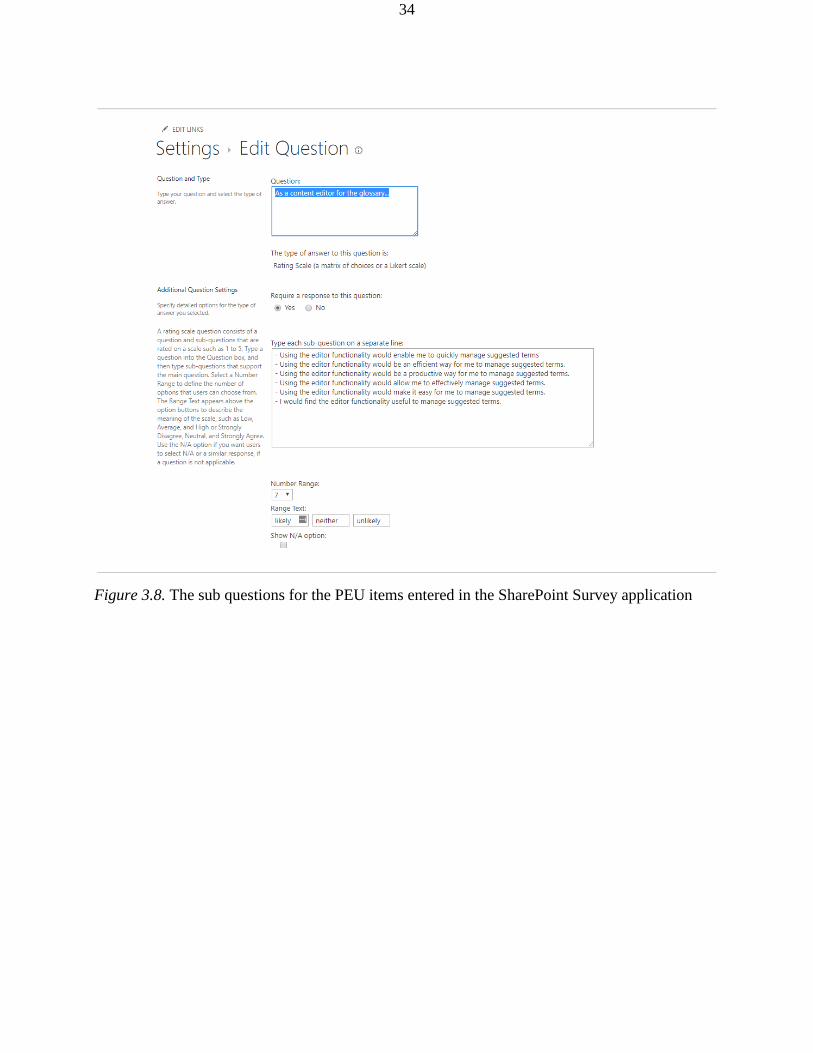
The sub-questions were an efficient solution for fitting questions on a single page
(reference figure 3.8.). A dash was placed before the first word of each sub-question in the series
to help users differentiate when a new item started in the sequence item placement is presented
on the page in a relatively close, and somewhat hard to differentiate manner (reference Figure
3.9.) (recommendations to improve the presentation of question items for future surveys are
discussed in Chapter 5).
34
Figure 3.8. The sub questions for the PEU items entered in the SharePoint Survey application

35
Figure 3.9. The sub questions for PEU items as they appear to the user
The Survey application page was edited to include brief instructions for users. This was
done by “editing” the page within the SharePoint interface and putting a text box above the
survey response element containing the text (reference figure 3.10.).
Figure 3.10. Survey Response page with instructions added

36
A page was created to communicate to any invited users that had not submitted a survey
response by the time the survey response window closed. The homepage was updated with a brief
message (reference Figure 3.11.).
Figure 3.11. Survey response site homepage updated to communicate closure of survey response
window to users
3.8. Data Collection
Survey responses for both the Likert scale items and open-ended question items were
collected from the SharePoint response page (reference Figures 3.12. and 3.13.). The data was
then coded to an Excel sheet for evaluation.
Figure 3.12. Response page

37
Figure 3.13. Example of an individual user response page with submitted answers.
3.9. Data Interpretation and reporting method
The Top Box report method was used to interpret the data and report results to the company team
leader. A Top Box report refers to the “boxes” of response items for a Likert scale survey. The
“Top Box” is the strongest positive report value (for the survey used in this thesis, a value of “1”
is the strongest positive value). A Top 3 Box method was used to get an overall view of the rating
of perceived usefulness and perceived ease of use for the individual items within the survey. A
rating value of “1”,”2”, or “3” is included in the Top 3 Box report. The Top Box results are
analyzed as a percentage of ratings that fall within their respective value-range.
For this thesis. the survey data was exported from the SharePoint site to an excel sheet. An
initial Top Box analysis was conducted on the Likert scale items from all users and compiled for
an overall report for both Perceived Usefulness and Perceived Ease of Use. Open ended questions
were categorized into four feedback groups in which another Top Box analysis was conducted.

38
4. Results & Discussion
A total of 11 responses were collected for analysis. Once an initial examination of the data was
conducted, one participant had marked all Likert scale items with a score of “4” and placed a
single “,” for each required open-ended question. This participant’s data provided no value (other
than to suggest the participant wanted to rush through the survey) so it was expunged from the
final analysis, resulting in a final dataset of 10 user survey responses. All Likert scale item data
(numbers and corresponding items see Appendix F and G, respectively) was compiled into a
“Top 3 Box” report for both Perceived Usefulness and Perceived Ease of Use (see Appendix H
and I, respectively).
91% of user ratings for the construct of Perceived Usefulness were rated likely above the
neutral entry (4). 76% of user ratings for the construct of Perceived Ease of Use were rated as “1”
of the three top boxes correlated with “likely” (see Figure 4.1.). An analysis of all ratings for the
construct of Perceived Usefulness shows 20% corresponded to the strongest “Likely” Likert
rating. All ratings of the construct of Perceived Ease of Use shows 23% corresponded to the
strongest “Likely” Likert rating (see Figure 4.2.). These results indicate that the current
implementation state of the editor role functionality has both strong perceived usefulness and
perceived ease of use by prospective users.
Figure 4.1. Percentage of positive responses by users for the given constructs
91%76%
10%
100%
Perceived Usefulness Perceived Ease of Use
Percentage Likely (Top 3 Box)

39
Figure 4.2. Comparing overall positive ratings of Perceived Usefulness (Blue) and Perceived
Ease of Use (Red) (Top bar) and overall strongest positive ratings for each construct (bottom bar)
The open-ended questions expectedly provided more detail about the system and
functionality overall as well as additional insights that cannot be attained by a Likert scale rating
question alone. Per open-ended feedback of users reporting the lowest perceived usefulness, were
concerns of time and number of clicks needed to complete the task, as well as the need to learn a
new system. Users reporting the highest perceived usefulness indicated the alert for new terms
and ability to edit terms as the most positive aspects of the functionality. For users reporting the
lowest perceived ease of use, users expressed concern that an editor might make an incorrect
amendment to a term if they aren’t an expert in the subject pertaining to the term (due to an
inability currently for the system to filter specific terms to specific editors) For users reporting the
highest perceived ease of use, users identified the editing terms and global accessibility to term
lists as the easiest aspects of the current functionality.
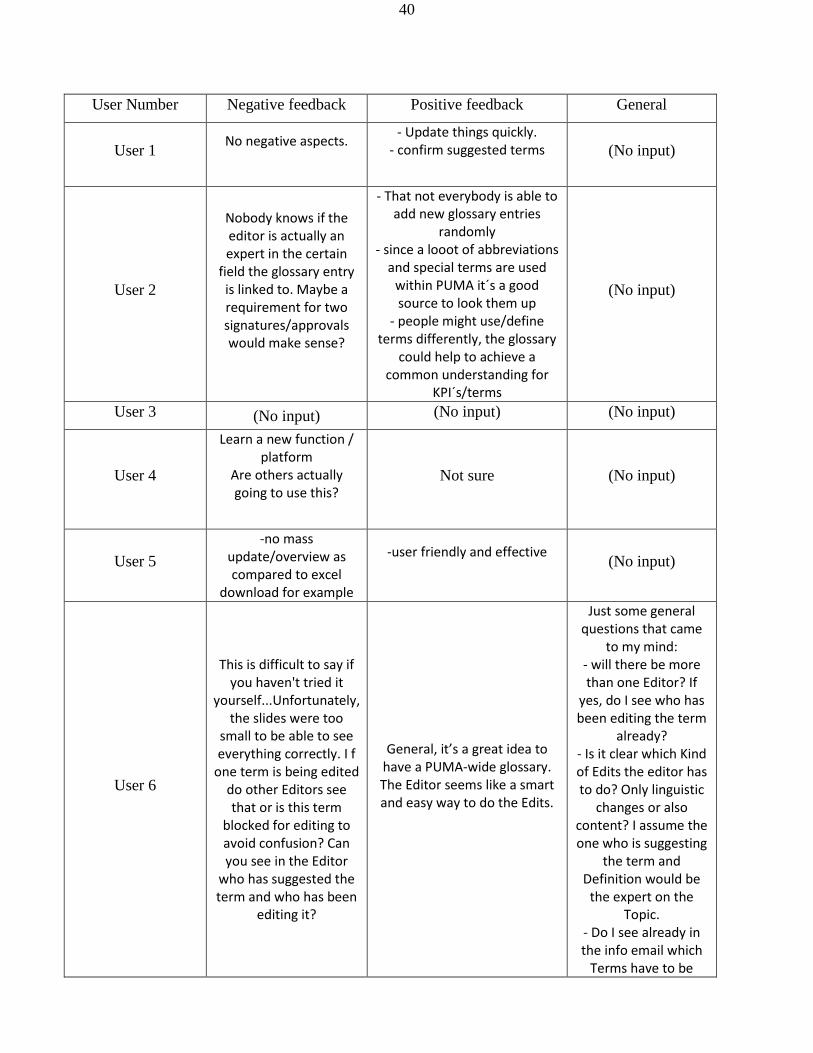
The open-ended feedback was first collected and compiled into a list organized by user
and category of feedback (negative, positive and general) (reference Table 2.)
20%
91%
23%
76%
0% 10% 20% 30% 40% 50% 60% 70% 80% 90% 100%
Top Box
Top 3 Box
Perceived Usefulness Perceived Ease of Use
40
User Number Negative feedback Positive feedback General
User 1 No negative aspects.
- Update things quickly. - confirm suggested terms
(No input)
User 2
Nobody knows if the editor is actually an expert in the certain
field the glossary entry is linked to. Maybe a requirement for two signatures/approvals would make sense?
- That not everybody is able to add new glossary entries
randomly - since a looot of abbreviations
and special terms are used within PUMA it´s a good source to look them up
- people might use/define terms differently, the glossary
could help to achieve a common understanding for
KPI´s/terms
(No input)
User 3 (No input) (No input) (No input)
User 4
Learn a new function / platform
Are others actually going to use this?
Not sure (No input)
User 5
-no mass update/overview as compared to excel
download for example
-user friendly and effective
(No input)
User 6
This is difficult to say if you haven't tried it
yourself...Unfortunately, the slides were too
small to be able to see everything correctly. I f
one term is being edited do other Editors see that or is this term
blocked for editing to avoid confusion? Can you see in the Editor
who has suggested the term and who has been
editing it?
General, it’s a great idea to have a PUMA-wide glossary. The Editor seems like a smart and easy way to do the Edits.
Just some general questions that came
to my mind: - will there be more than one Editor? If
yes, do I see who has been editing the term
already? - Is it clear which Kind of Edits the editor has to do? Only linguistic
changes or also content? I assume the one who is suggesting
the term and Definition would be
the expert on the Topic.
- Do I see already in the info email which
Terms have to be

41
edited? That would be helpful to see if I'm
the right Person who is knowledgeable
enough to do Edits in Terms of Content. - One Suggestion: could you add a
category to Terms, such as Apparel,
Sustainability, Running, Intranet, or
anything alike? Would be a good additional Option for filtering
entries.
User 7
Wrong amendment of the suggested contents
in case of misinterpretation (if
there wasn't any feedback requested from author/user)
Quick amendment of the suggested contents if
necessary
(No input)
User 8
Cannot edit item right next to the list of items and have to go thru a
few clicks / pages
The alert
(No input)
User 9
So far don't see any negative aspects. Would
be helpful for us to maintain standard
glossary.
Getting definitions and standardized kex figures under
control and harmonize the reporting landscape around
the globe
Management support needed to make sure that the definitions
from the glossary are set and all users
around the globe have to follow to use the
definitions accordingly.
User 10 Nevertheless how easy it is to operate - time is
needed
quick reaction direct opportunity for changes
(No input)
Table 2. Individual User open-ended question feedback
Next, the open-ended response feedback was categorized into four separate groups. Users
who gave any general feedback (two users), Users who only provided negative feedback and/or
inapplicable positive feedback such as “I don’t know” or “n/a” (one user), users who only
provided positive feedback and/or inapplicable negative feedback such as “I don’t know” or “n/a”

42
(one user), and users who provided both positive and negative feedback but no general feedback
(five users) (reference Table 3.). One user submitted Likert scale ratings but no open-ended
feedback.
Percentage averages
Perceived Usefulness Perceived Ease of Use
General Feedback Responses (2) 82% 90%
Only Negative Feedback Responses (1) 71% 57%
Only Positive Feedback Responses (1) 74% 74%
Positive and Negative Feedback with no
General Feedback responses (5) 75% 74%
Table 3. Comparison of construct agreement percentage to open-ended feedback responses
The results were compiled into a PowerPoint presentation to demonstrate and communicate
the findings to the company. The results indicate user ratings of the current implementation of the
glossary editor functionality to be both strong in overall usefulness (92%) and ease of use (76%).
Users in general view the functionality to be more useful than it is easy to use in its current state,
with open-ended feedback indicating which aspects of the functionality can be improved for
greater ease of use. The top box analysis indicates users tend to rate the Perceived Ease of Use
items with the strongest likely rating when rating any level of likeliness with the item (20% top
box for PU items as opposed to 23% top box for PEU items). When comparing the averages of
users’ Likert scale ratings with the type of open-ended feedback they provide, users providing
general feedback have higher overall averages related to other users. The user submitting only a
negative open-ended feedback response found the functionality to be useful but substantially less
easy to use than any other user. The five users providing both positive and negative feedback
with no general feedback may indicate a contrast between users who are enthusiastic about the
system overall (those providing additional, optional, open-ended feedback and rating it higher on

43
average) and those that provide only required information (those providing both positive and
negative open-ended feedback but no additional general feedback). However, due to the limited
sample, inferences on the potential correlation of these data points cannot be assumed for
application to broader populations within the workforce.
4.1. Improvement recommendations
The following improvement recommendations were created from the author’s experience in
conducting the pilot research and the content provided by users to the open-ended questionnaire
feedback. Recommendations are first sorted per an overall category. Within the category, a
statement of the discovered problem is detailed and a recommended solution is provided.
1. Questionnaire Look & Feel
Problem Statement: Creating the survey with the standard SharePoint Survey
application is time consuming and presents additional challenges in the visual
representation of questions and response items in a user-friendly manner.
Recommended Solution: Microsoft Forms was recently announced and should be
used for administering future surveys. This new application is integrated into the
Office 365 platform, provides a modern user interface, streamlines the survey
creation process and can be embedded directly into SharePoint Online pages
(“What is Microsoft Forms?” 2017).
2. Indicating term area of expertise
Problem Statement: Editors are not experts in all business areas and need a way
of knowing if a suggested term is intended for their area of expertise.
Recommended Solution: Add a form field within the suggestion interface to
enable users to select from a list of available areas of expertise when submitting a
term.
3. Effort required by editors
Problem Statement: In the current implementation, editors receive an email
notification, and then must navigate to the term list to manually edit metadata
fields of individual terms.
Recommended Solution: Implement automated workflow processes to reduce the
number of steps involved when editors approve or reject suggested terms.

44
5. Conclusions
This thesis introduced the PUMA UA framework, a method enabling user researchers to evaluate
user acceptance of individual functionalities within a system. It was used to evaluate the user
acceptance of the editor role functionality for the PUMA intranet glossary system currently in
development. This chapter reiterates the aims of the framework described in the introduction and
reflects on the results concluding strong evidence of the efficacy of the framework.
The PUMA UA framework streamlines the process of collecting actionable user
acceptance data and user-insights to steer development considerations for individual
functionalities of a system. The PUMA UA framework achieves this goal through a dynamic,
user-centered approach using established evaluation methods of the technology acceptance
model. A researcher may adapt the questionnaire content to any future or present system /
functionality combination by simply changing the standardized wording of the Likert scale items,
and embed relevant, brief PowerPoint presentations into a SharePoint page within a SharePoint
Site Collection. Target groups are easily identified and participants are recruited quickly due to
the company utilization of the various Microsoft Office 365 services integrated into the
SharePoint Online platform (e.g. Outlook, Delve).
It should be noted that the PUMA UA framework processes and steps may not be
universally applicable outside of PUMA’s information system infrastructure, for which it was
exclusively developed and deployed. Many alternative intranet platforms could be utilized by
other companies rendering the above framework incompatible or ineffectual. Therefore, this case-
study may only be used as a starting point for the general efficacy of evaluating user acceptance
of individual functionalities outside of PUMA. In addition, it could be that the individuals within
the COO organization are especially motivated to respond to operational surveys and provide
actionable feedback for the ongoing development of a future system, whereas users in other
organizational departments may not.
The limitations of this study do not, however, detract from the business value of the
PUMA UA framework for which it was developed. As additional functionalities and features are
considered for future systems, the PUMA UA framework has established a foundation from
which further development insights may easily be communicated and realized within the PUMA
intranet ecosystem.

45
References
Allen, B. (1996). Designing Systems to Meet Expressed Information Needs. In Library and Information
Science (pp. 152–187). https://doi.org/10.1108/s1876-0562(1996)0000096007
Borlund, P. (1997). Information tasks: Toward a user-centred approach to information systems.
Information Processing & Management, 33(6), 807. https://doi.org/10.1016/s0306-4573(97)89364-8
Davis, F. D. (1985). A Technology Acceptance Model for Empirically Testing New End-user Information
Systems: Theory and Results. Retrieved from
https://books.google.com/books/about/A_Technology_Acceptance_Model_for_Empiri.html?hl=&id
=hbx8NwAACAAJ
Davis, F. D. (1993). User acceptance of information technology: system characteristics, user perceptions
and behavioral impacts. International Journal of Man-Machine Studies, 38(3), 475–487.
https://doi.org/10.1006/imms.1993.1022
Diffin, J., Chirombo, F., & Nangle, D. (2010). Cloud Collaboration: Using Microsoft SharePoint as a Tool
to Enhance Access Services. Journal of Library Administration, 50(5-6), 570–580.
https://doi.org/10.1080/01930826.2010.488619
Fryman, L. (2008). The Business Value of a Business Glossary: How IBM Helps Businesses
Communicate more Efficiently and Effectively.
Fryman, L. (2015). Business Glossaries and Metadata. Retrieved April 24, 2017, from
http://tdan.com/business-glossaries-and-metadata/18814
Göransson, B., Gulliksen, J., & Boivie, I. (2003). The usability design process - integrating user-centered
systems design in the software development process. Software Process Improvement and Practice,
8(2), 111–131. https://doi.org/10.1002/spip.174
Grudin, J. (1991). Interactive systems: bridging the gaps between developers and users. Computer, 24(4),
59–69. https://doi.org/10.1109/2.76263
Gulliksen, J., Göransson, B., Boivie, I., Blomkvist, S., Persson, J., & Cajander, Å. (2003). Key principles

46
for user-centred systems design. Behaviour & Information Technology, 22(6), 397–409.
https://doi.org/10.1080/01449290310001624329
Hillier, S., & Pattison, T. (2013). Microsoft SharePoint 2013 App Development. Pearson Education.
Retrieved from
https://books.google.com/books/about/Microsoft_SharePoint_2013_App_Developmen.html?hl=&id=
1bRCAwAAQBAJ
Hobert, K.A., Tay. G., & Mariano, J. (2016). Magic Quadrant for Enterprise Content Management.
Gartner. Retrieved August 23, 2017, from https://www.gartner.com/doc/reprints?id=1-
3L09I3B&ct=161031&st=sg
Horton, R. P., Buck, T., Waterson, P. E., & Clegg, C. W. (2001). Explaining intranet use with the
technology acceptance model. Journal of Information Technology Impact, 16(4), 237–249.
https://doi.org/10.1080/02683960110102407
Horvath, L. (2001). Collaboration: the key to value creation in supply chain management. Supply Chain
Management: An International Journal, 6(5), 205–207. https://doi.org/10.1108/eum0000000006039
Jadeja, Y., & Modi, K. (2012). Cloud computing - concepts, architecture and challenges. In 2012
International Conference on Computing, Electronics and Electrical Technologies (ICCEET).
https://doi.org/10.1109/icceet.2012.6203873
Jank, D. A. (2012). Understanding User Attitudes toward Information Systems. In Systems Science and
Collaborative Information Systems (pp. 121–137). https://doi.org/10.4018/978-1-61350-201-3.ch006
Kremer, S., Kolbe, L. M., & Brenner, W. (2005). Towards a procedure model in terminology
management. Journal of Documentation, 61(2), 281–295.
https://doi.org/10.1108/00220410510585223
Kubie, J. J., Melkus, L. A., Johnson, R. C., & Flanagan, G. A. (1996). USER–CENTERED DESIGN FOR
PRODUCTIVE SYSTEMS. Information Systems Management, 13(2), 38–48.
https://doi.org/10.1080/10580539608906986
Lakshman, T. K., & Thuijs, X. (2011). Enhancing enterprise field productivity via cross platform mobile

47
cloud apps. In Proceedings of the second international workshop on Mobile cloud computing and
services - MCS ’11. https://doi.org/10.1145/1999732.1999741
Lauby, S. (2013). The new social workplace. Human Resource Management International Digest, 21(3),
3–5. https://doi.org/10.1108/09670731311318352
Lee, S., & Kim, B. G. (2009). Factors affecting the usage of intranet: A confirmatory study. Computers in
Human Behavior, 25(1), 191–201. https://doi.org/10.1016/j.chb.2008.08.007
Legris, P., Ingham, J., & Collerette, P. (2003). Why do people use information technology? A critical
review of the technology acceptance model. Information & Management, 40(3), 191–204.
https://doi.org/10.1016/s0378-7206(01)00143-4
Leidner, D., Koch, H., & Gonzalez, E. (2010). Assimilating Generation Y IT New Hires into USAA’s
Workforce: The Role of an Enterprise 2.0 System. MIS Quarterly Executive, 9(4).
Li, C. (2010). Groundswell. Winning in a world transformed by social technologies. Strategic Direction,
26(8). Retrieved from https://doi.org/10.1108/sd.2010.05626hae.002
Lococo, A., & Yen, D. C. (1998). Groupware: computer supported collaboration. Telematics and
Informatics, 15(1-2), 85–101. https://doi.org/10.1016/s0736-5853(98)00006-9
Lord Wodehouse. (1997). Building a better intranet. In IEE Colloquium on Corporate Intranets - Users’
Experiences (Vol. 1997, pp. 4–4). London, UK: IEE. https://doi.org/10.1049/ic:19971020
Malhotra, Y., & Galletta, D. F. (1999). Extending the technology acceptance model to account for social
influence: theoretical bases and empirical validation. In Proceedings of the 32nd Annual Hawaii
International Conference on Systems Sciences. 1999. HICSS-32. Abstracts and CD-ROM of Full
Papers (p. 14). Maui, HI, USA: IEEE Comput. Soc. https://doi.org/10.1109/HICSS.1999.772658
Malhotra, Y., & Galletta, D. F. (2004). Building systems that users want to use. Communications of the
ACM, 47(12), 88–94. https://doi.org/10.1145/1035134.1035139
Mathieson, K. (1991). Predicting User Intentions: Comparing the Technology Acceptance Model with the
Theory of Planned Behavior. Information Systems Research, 2(3), 173–191.
https://doi.org/10.1287/isre.2.3.173

48
Mayhew, D. J. (1999). The usability engineering lifecycle. In CHI ’99 extended abstracts on Human
factors in computing systems - CHI '99. https://doi.org/10.1145/632716.632805
Mentis, C. (2016, June 29). The Rapid Evolution of the Digital Workplace. Retrieved October 8, 2017,
from https://www.claromentis.com/blog/rapid-evolution-digital-workplace/
Meske, C., Brockmann, T., Wilms, K., & Stieglitz, S. (2017). Social Collaboration and Gamification. In S.
Stieglitz, C. Lattemann, S. Robra-Bissantz, R. Zarnekow, & T. Brockmann (Eds.), Gamification
(Vol. 5, pp. 93–109). Cham: Springer International Publishing. https://doi.org/10.1007/978-3-319-
45557-0_7
Nikola Marangunić, A. G. A. (2015). Technology acceptance model: a literature review from 1986 to
2013. Universal Access in the Information Society, 14(1), 81–95.
Norman, D. (2016). The Design of Everyday Things. https://doi.org/10.15358/9783800648108
Norman, D. A. (1988). The Psychology of Everyday Things. Basic Books. Retrieved from
https://books.google.com/books/about/The_Psychology_of_Everyday_Things.html?hl=&id=TI5wnq
1PimMC
O’Cathain, A., & Thomas, K. J. (2004). “Any other comments?” Open questions on questionnaires – a
bane or a bonus to research? BMC Medical Research Methodology, 4(1).
https://doi.org/10.1186/1471-2288-4-25
Office Support. (2017). What is a SharePoint team site? Retrieved August 23, 2017, from
https://support.office.com/en-us/article/What-is-a-SharePoint-team-site-75545757-36c3-46a7-beed-
0aaa74f0401e
Renner, M., & Taylor-Powell, E. (2003). Analyzing qualitative data. Programme Development &
Evaluation, University of Wisconsin-Extension Cooperative Extension.
Sadiku, M. N. O., Musa, S. M., & Momoh, O. D. (2014). Cloud Computing: Opportunities and
Challenges. IEEE Potentials, 33(1), 34–36. https://doi.org/10.1109/MPOT.2013.2279684
SharePoint Online. (2017). Retrieved October 8, 2017, from https://support.office.com/en-
us/article/SharePoint-Online-Planning-Guide-for-Office-365-for-business-d5089cdf-3fd2-4230-acbd-
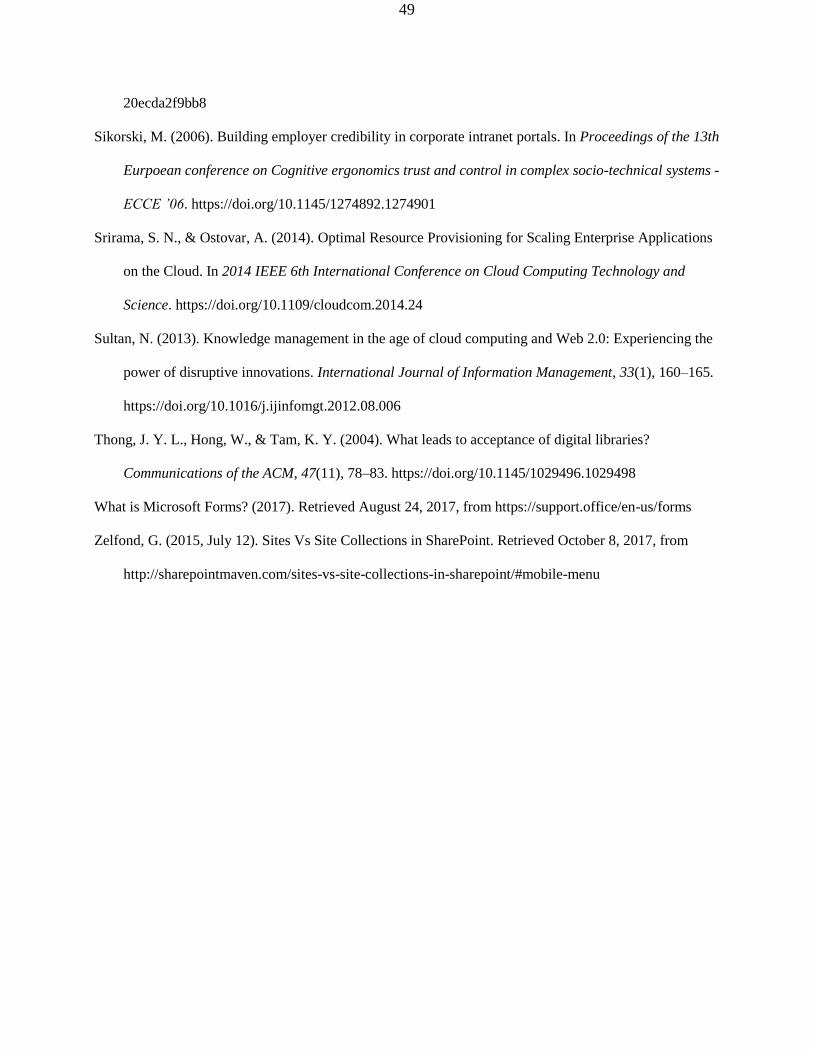
49
20ecda2f9bb8
Sikorski, M. (2006). Building employer credibility in corporate intranet portals. In Proceedings of the 13th
Eurpoean conference on Cognitive ergonomics trust and control in complex socio-technical systems -
ECCE ’06. https://doi.org/10.1145/1274892.1274901
Srirama, S. N., & Ostovar, A. (2014). Optimal Resource Provisioning for Scaling Enterprise Applications
on the Cloud. In 2014 IEEE 6th International Conference on Cloud Computing Technology and
Science. https://doi.org/10.1109/cloudcom.2014.24
Sultan, N. (2013). Knowledge management in the age of cloud computing and Web 2.0: Experiencing the
power of disruptive innovations. International Journal of Information Management, 33(1), 160–165.
https://doi.org/10.1016/j.ijinfomgt.2012.08.006
Thong, J. Y. L., Hong, W., & Tam, K. Y. (2004). What leads to acceptance of digital libraries?
Communications of the ACM, 47(11), 78–83. https://doi.org/10.1145/1029496.1029498
What is Microsoft Forms? (2017). Retrieved August 24, 2017, from https://support.office/en-us/forms
Zelfond, G. (2015, July 12). Sites Vs Site Collections in SharePoint. Retrieved October 8, 2017, from
http://sharepointmaven.com/sites-vs-site-collections-in-sharepoint/#mobile-menu

50
Appendices
Appendix A
Hello [Name],
I am a master thesis project intern with the business support applications team. I am currently
running a pilot of a new framework for evaluating new system functionalities. In addition, I am
writing my master thesis on this concept.
You have been invited to participate because the current pilot is being conducted within the
COO organization first.
The research process simply includes a brief overview of the system, an explanation of the
functionality and then answering a short survey. The expected time to completion is ~10
minutes.
For purposes of the research it is important to clarify how the following terms will be used:
“Productive” refers to the ability to produce an amount of data, or something of value in large
amounts.
“Efficient” refers to achieving productivity with a minimum amount of wasted effort and
expense.
“Effective” refers to the successful ability to produce a desired or intended result.
An introduction page explaining in greater detail is provided on the site itself.
You can find the site at the link here:[Link]
Thank you!

51
Appendix B
Introduction
I am David Madison, currently writing my master's thesis with the Business Support Applications team
within the IT department under the guidance of Michaela Meusel. I am developing a framework in which
to evaluate user acceptance of new functionalities for new applications and systems. On this page I will
provide to you an overview of the work and how you will proceed through to the survey.
Purpose of the research
The purpose of the research is to gather feedback for an editor functionality for a new Intranet Glossary
system. Using a research framework based on user centered design and the technology acceptance
model. Feedback from this research will guide the development of the editor functionality for the new
Puma Glossary as well as provide insights for future work.
Participant Selection
You have been invited to take part in this research because we feel that your experience with the
company can contribute valuable insights to the editor functionality for the glossary system.
Procedure overview
● When you click the CONTINUE button at the bottom of this page, you will be provided a brief
overview presentation of the glossary system itself and how the Editor functionality comes into
play.
● From there (reminders will be provided) you will continue to a presentation on the editor
functionality itself.
● Once you have read through the slides of the editor functionality you may then proceed to the
survey.
● The survey contains 12 Likert Scale questions and 3 open ended questions for additional
feedback.
● Once you submit your answers that's it! You're done.

52
Confidentiality
Survey responses are protected and your individual information will not be collected or provided to
anyone for any reason.
Right to refuse or withdraw at any time
It is your right as a participant that you may stop participating at any time and withdraw from the
research with no penalty or questions asked.
Who to contact
The content of the questions in the survey has been approved by the Worker's council on 6th of July,
2017. If you have any questions please contact [name redacted] or [name redacted].
Once you have read and understand the above
information please click [Link redacted] to proceed to the
overview presentation page.

53
Appendix C

54

55

56
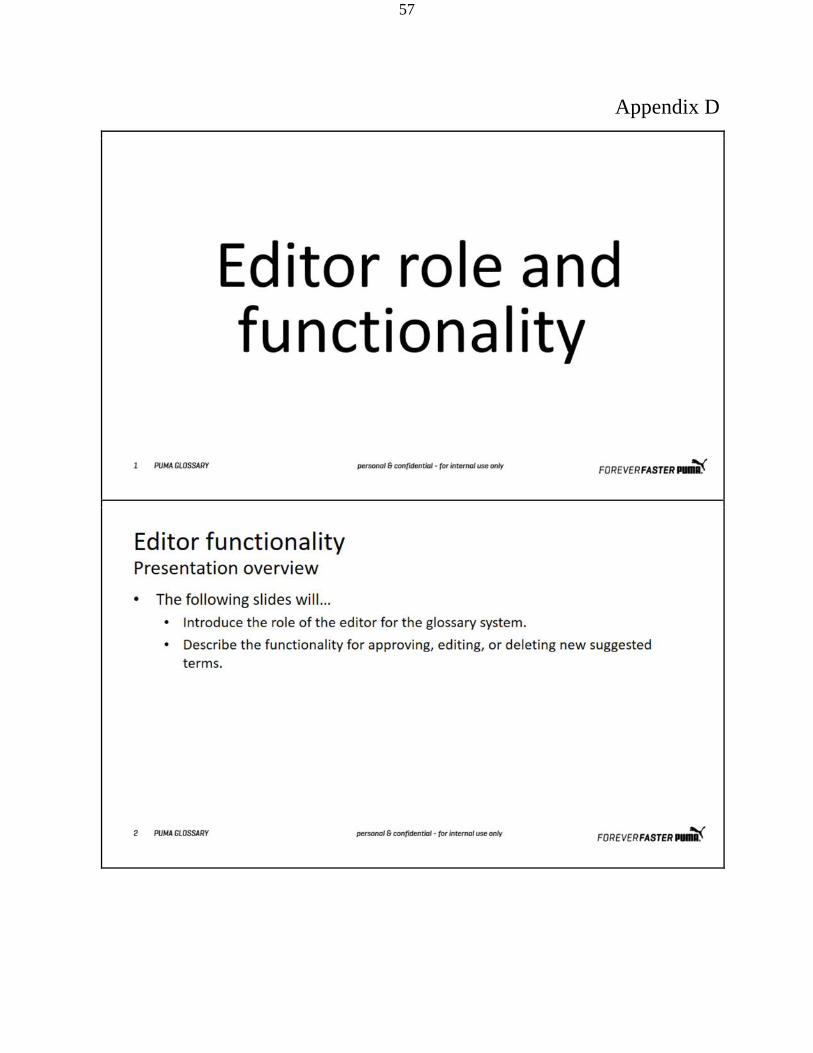
57
Appendix D

58

59

60

61

62
Appendix E

63

64
Appendix F
Perceived Usefulness
• Item 1
Using the editor functionality would
enable me to quickly manage suggested
terms.
• Item 2
Using the editor functionality would
improve my performance when managing
suggested terms.
• Item 3
Using the editor functionality would
increase my productivity when managing
suggested terms.
• Item 4
Using the editor functionality would
enhance my effectiveness to manage
suggested terms.
• Item 5
Using the editor functionality would make
it easier for me to manage suggested
terms.
• Item 6
I would find the editor functionality useful
when managing suggested terms for the
glossary.
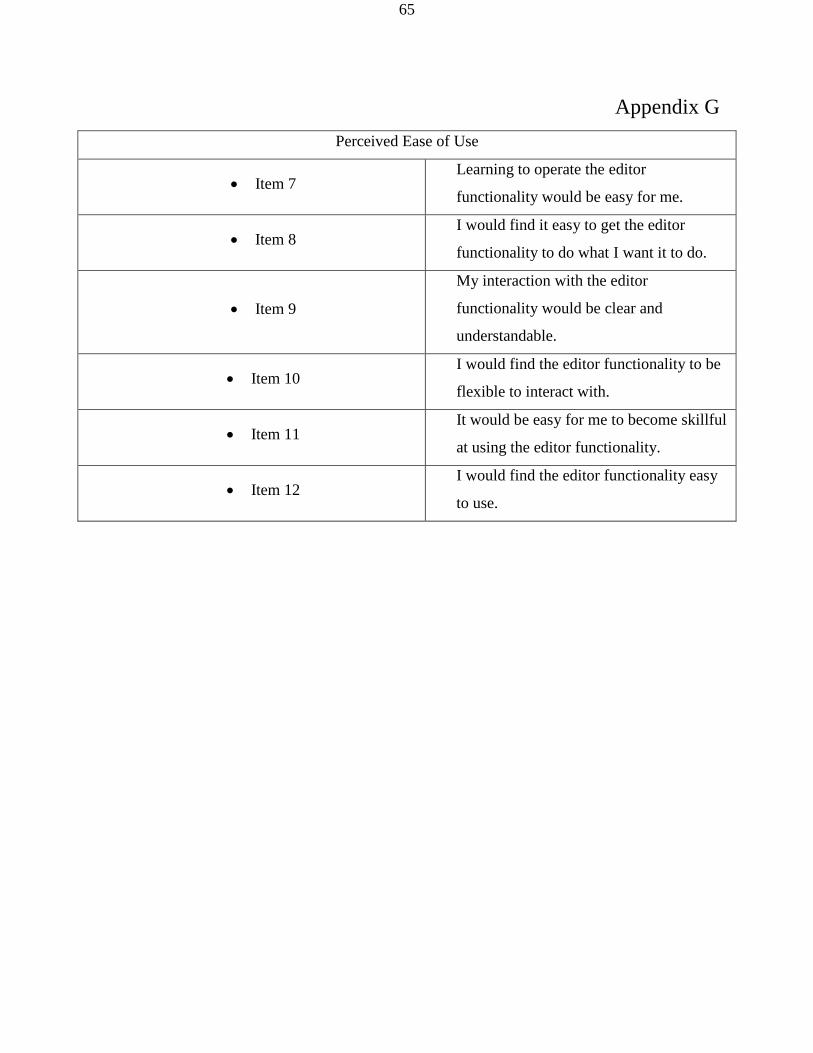
65
Appendix G
Perceived Ease of Use
• Item 7 Learning to operate the editor
functionality would be easy for me.
• Item 8 I would find it easy to get the editor
functionality to do what I want it to do.
• Item 9
My interaction with the editor
functionality would be clear and
understandable.
• Item 10 I would find the editor functionality to be
flexible to interact with.
• Item 11 It would be easy for me to become skillful
at using the editor functionality.
• Item 12 I would find the editor functionality easy
to use.

66
Appendix H
Perceived Usefulness
Item 1 Item 2 Item 3 Item 4 Item 5 Item 6
User 1 3 3 2 3 3 3
User 2 3 3 3 4 2 2
User 3 1 1 1 1 1 1
User 4 1 4 4 1 4 4
User 5 1 1 6 1 2 2
User 6 2 2 3 2 2 1
User 7 2 2 2 2 2 2
User 8 4 4 5 2 3 2
User 9 3 3 2 3 2 2
User 10 2 4 3 2 5 3
Top Box 3 2 1 3 1 2
Top Two
Box 6 4 4 7 6 7
Total Likely
(out of 10) 9 7 7 9 8 9
Top Box 3 2 -1 3 0 2

67
Appendix I
Perceived Ease of Use
Item 7 Item 8 Item 9 Item 10 Item 11 Item 12
User 1 2 2 2 3 4 4
User 2 1 1 2 3 3 1
User 3 2 1 2 1 2 2
User 4 4 4 4 4 4 4
User 5 1 2 1 5 1 1
User 6 1 1 2 3 1 1
User 7 4 4 4 4 4 4
User 8 2 2 2 4 2 2
User 9 2 2 2 2 2 1
User 10 3 3 4 3 5 5
Top Box 3 3 1 1 2 4
Top Two
Box 7 7 7 2 5 6
Total
Likely (out
of 10)
8 8 7 6 6 6
Top Box 3 3 1 0 1 3