a fleet experience - bfff
TRANSCRIPT

A FLEET EXPERIENCE The Good & The Bad
BFFF H&S Seminar 2016

• The difference between a well performing Fleet and a poor one in terms of costs
• What can be done to remedy this • Case Study • Focus on Technology • H&S Benefits • The Result
88
CONTENT
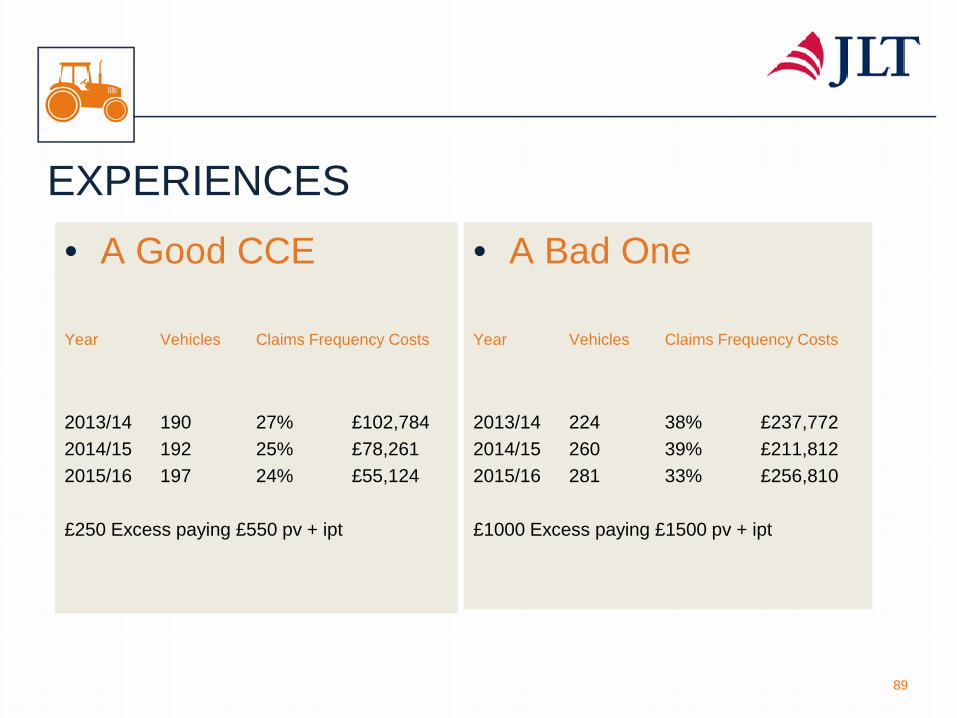
EXPERIENCES • A Good CCE Year Vehicles Claims Frequency Costs
2013/14 190 27% £102,784 2014/15 192 25% £78,261 2015/16 197 24% £55,124 £250 Excess paying £550 pv + ipt
• A Bad One
Year Vehicles Claims Frequency Costs
2013/14 224 38% £237,772 2014/15 260 39% £211,812 2015/16 281 33% £256,810 £1000 Excess paying £1500 pv + ipt
89

A REMEDY
90
Total Cost of Risk
Program design / premium
Risk Audit / Review
Detailed Claims
Analysis
Review Claims
Management / Systems
Review Risk Management
Initiatives
Review Performance
/ KPI's/Claims Performance
Create Steering Group
Create Accident
Reduction scheme

STEERING GROUPS
91

CONTROLLING CLAIMS COSTS
92

THE BREAKDOWN OF A CLAIM
93

THE HIDDEN COSTS OF AN ACCIDENT • Insurance excess • Premium increases • Personnel time off (injury, suspension) • Agency staff cost / overtime payments • Additional administration / clerical work • Loss of expertise • Legal costs • Clearing up costs • Delays in productivity • Fines • Contractual impacts • Reputation
94

CLAIMS ANALYSIS
95

96

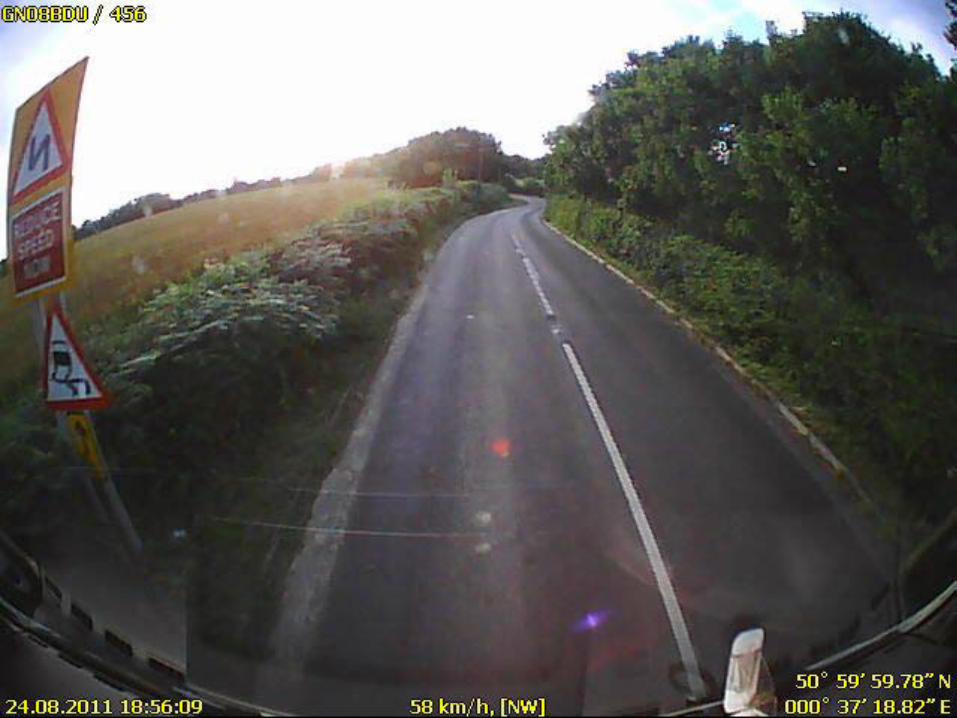
FOCUS ON TECHNOLOGY
97
THE BENEFITS OF VEHICLE CCTV
98
• Protecting Drivers • Mitigation • Reducing Costs associated with Accidents • Providing Powerful Retrospective Data • Improving Driver Behaviour • Eliminating Blind Spots • Recording Loading & Unloading – EL/PL Benefits
PROOF IN THE PUDDING?
99

TELEMATICS BENEFITS
100
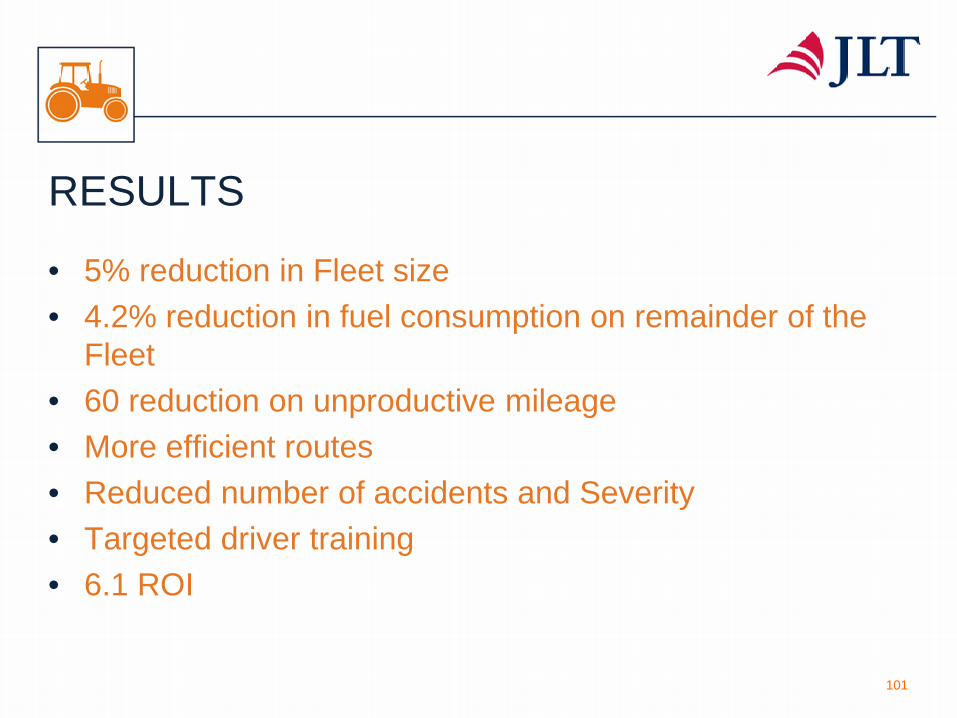
RESULTS
• 5% reduction in Fleet size • 4.2% reduction in fuel consumption on remainder of the
Fleet • 60 reduction on unproductive mileage • More efficient routes • Reduced number of accidents and Severity • Targeted driver training • 6.1 ROI
101

END RESULT • Case Study client Year Vehicles Claims Frequency Costs
2006/07 1859 42% £2,285,598 2007/08 2731 36% £2,073,023 2008/09 2948 32% £2,226,701 2009/10 2563 38% £1,900,476 Average Claims cost per vehicle in 2006/07 = £1229 Average Claims cost per vehicle in 2013/14 = £551
Year Vehicles Claims Frequency Costs
2010/11 2211 37% £2,209,419 2011/12 2029 38% £1,408,423 2012/13 1920 34% £1,066,825 2013/14 1822 34% £1,004,994
102
NET result of £500k Premium reduction at 2014 renewal