a field experiment on turbulent concentration fluctuations of an atmospheric tracer gas in the...
TRANSCRIPT

ARTICLE IN PRESS
1352-2310/$ - se
doi:10.1016/j.at
�CorrespondE-mail addr
Atmospheric Environment 39 (2005) 4999–5012
www.elsevier.com/locate/atmosenv
A field experiment on turbulent concentration fluctuationsof an atmospheric tracer gas in the vicinity of a
complex-shaped building
J.M. Santosa,�, R.F. Griffithsb, I.D. Robertsc, N.C. Reis Jr.a
aDepartamento de Engenharia Ambiental, UFES, Av. Fernando Ferrari s/n, 29.060-970 Vitoria, ES, BrazilbEnvironmental Technology Centre, School of Chemical Engineering and Analytical Science, The University of Manchester, UK
cDefence Science & Technology Laboratories, Porton, UK
Received 10 November 2004; received in revised form 28 April 2005; accepted 11 May 2005
Abstract
This work investigates the turbulent flow and dispersion of atmospheric contaminants in the vicinity of an isolated
building. Field experiments were carried out to measure the fluctuating concentration time-series on the walls of a
complex-shaped building, and to investigate the influence of atmospheric stability and building dimensions on certain
statistics of the concentration distribution on the walls of the building. Meteorological conditions varied from neutral to
unstable. The measurements were conducted for two different wind directions (west and south, corresponding
respectively to directions normal and parallel to the long axis of the building). The experiments were performed in flat
terrain with uncut vegetation. The gas detectors used were photo ionisation detectors (PIDs) with a response time of
approximately 1/50 s. Sixteen such detectors were deployed, with 14 located on the building walls, and 2 on the roof.
The analysis presented here is for the 14 detectors on the walls. Statistical parameters of the concentration time-series
and the wind flow are presented, including mean and standard deviation. Intermittency and concentration fluctuation
intensity are also presented. Results were analysed based on the turbulent structures of the fluid flow around the
building. The experimental work revealed that the atmospheric stability conditions significantly influenced the
concentration levels on the external walls of the building, except on the windward wall. It was also revealed that mean
conditional concentration values on the walls were significantly influenced by the ratio between building width and
height.
r 2005 Published by Elsevier Ltd.
Keywords: Field experiments; Building effects; Concentration fluctuation; Stability conditions
1. Introduction
The presence of a building profoundly alters the
atmospheric turbulent flow structure in a region of the
flow, which depends on the building dimensions. The
e front matter r 2005 Published by Elsevier Ltd.
mosenv.2005.05.005
ing author. Fax: +5527 3335 2648.
ess: [email protected] (J.M. Santos).
building not only disturbs the mean wind field, but also
increases the local turbulence by generating a large
amount of shear stress in the flow. These effects
considerably modify the local pattern of pollutant
dispersion. The wind flow approaching the building
depends on the atmospheric conditions, since the
velocity and temperature profiles and turbulent proper-
ties are determined by the prevailing stability conditions.

ARTICLE IN PRESSJ.M. Santos et al. / Atmospheric Environment 39 (2005) 4999–50125000
The atmospheric stability conditions can assist or
suppress the vertical turbulent transport according to
the density stratification (buoyancy forces). These
atmospheric conditions can vary from a strongly
unstable atmosphere with a deep mixed boundary layer
that promotes the contaminant spreading, to a stably
stratified boundary layer that damps the vertical mixing
of contaminants. Thus, in order to understand the
atmospheric flow and dispersion around a building, it is
necessary to include the effects of atmospheric stability.
There is a considerable amount of work in the
literature about field and wind tunnel experiments on
atmospheric flow and dispersion around single buildings
(for example, Ogawa et al. (1983a, b); Jones and
Griffiths (1984); Higson et al. (1994); Saathoff et al.
(1995) and Higson et al. (1996)) and more recently
researchers have investigated dispersion over building
arrays and urban areas (for example, Macdonald et al.
(1997); Mavroidis and Griffiths (2001); Allwine et al.
(2002); Yee and Biltof (2004)). There has been great
interest in numerical simulations of both configurations
(for example, Zhang et al. (1996); Meroney et al. (1999);
Sada and Sato (2002); Cheng et al. (2003)) due to
advances in turbulence models, numerical tools and
high-performance computers. However, comparatively
little work has been concerned with investigations under
different stability conditions and complex-shaped build-
ings. In fact, there is little field experimental work, no
wind tunnel experiments and no numerical simulations
of the atmospheric flow under unstable stratification
with an obstacle present. In the case of wind tunnel
investigations, it is only recently that wind tunnel
facilities that are capable of simulating the unstable
atmosphere have been built. Thus, the majority of
studies investigating the effects of atmospheric stratifi-
cation on the flow and dispersion around a building are
concerned with near-neutral stratified conditions. Only
very recently, a few works studying unstable conditions
in the atmosphere have been reported in the literature,
such as Mavroidis et al. (1999, 2003), but these are
mainly focussed on dispersion around cubic-shaped
buildings. The ratio between building width and height
can strongly influence the fluid flow and dispersion
patterns, since a wider obstacle can cause the contami-
nants to be more dispersed. The concentration levels
seen on the walls of the building can thus be strongly
affected by the building dimensions.
This work extends the previous studies, by investigat-
ing the turbulent flow and dispersion of atmospheric
contaminants in the vicinity of an isolated complex-
shaped building, in neutral and unstable atmospheric
conditions. Field experiments were carried out to
measure the concentration fluctuations on the walls of
a complex-shaped building, and to analyse the influence
of atmospheric stability and building dimensions on the
mean and fluctuation intensity of concentrations on the
walls of the building. The results also reveal the
progressive reduction of the fluctuation intensity as the
measurement location progresses from windward to
leeward locations in the flow paths around the building.
2. Experimental details
Field experiments were conducted at Dugway Proving
Ground, 85 miles south west of Salt Lake City in Utah,
USA. The experiments were conducted during August
1998 at different times of the day in order to collect data
for distinctly different stability conditions. This region
reliably experiences unstable atmospheric conditions
during daytime.
The experiments involved placing a source of propy-
lene gas at a fixed distance from the building and using
gas detectors (photo ionisation detectors—PIDs) to
measure concentration time-series close to the walls
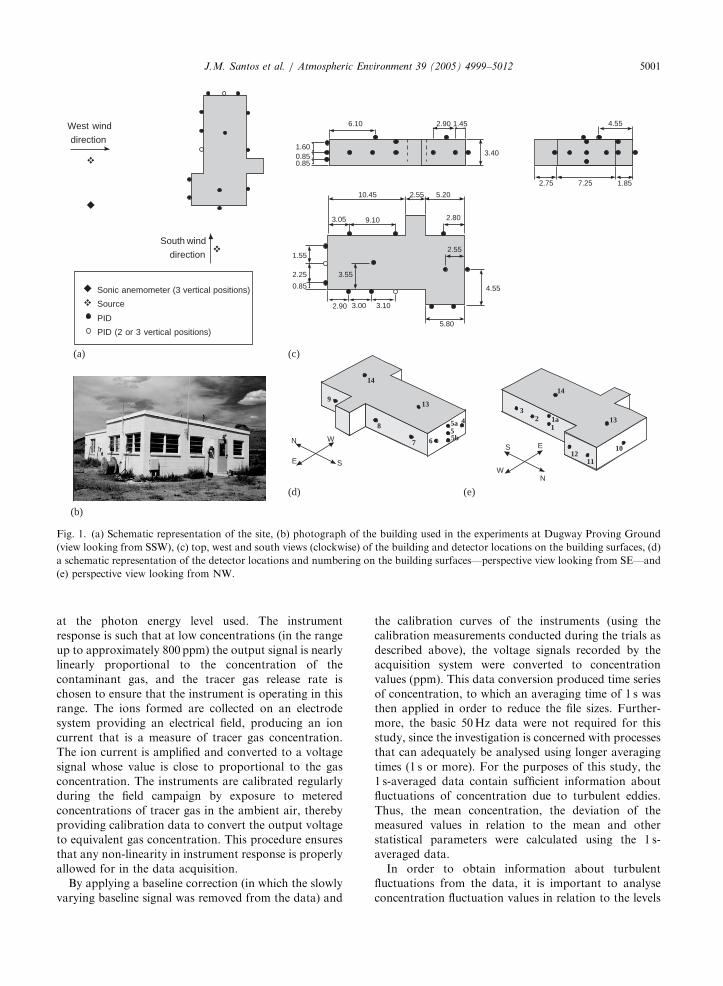
and on the roof of the building. Fig. 1 presents a view of
the building used in the trials and shows a schematic
representation of the site, indicating the location of the
gas source and the PIDs. The xyz co-ordinate system is
specified here, respectively, as the along wind direction,
the lateral and vertical directions. The source was
located upwind at a distance of about 3.5 building
heights (x ¼ 3:5Hb) from the face of the building, at a
height of 0.5Hb. The source released propylene gas
through an open-ended pipe of about 1 cm diameter
with a flow rate of 50 lmin�1.
The terrain where the experiments were conducted is
flat for many kilometres to the west and south of the
building, with some hills at about 1–2 km to the east and
north. In order to avoid the influence of these hills on
the wind profile, the experiments were conducted only
when the wind was blowing from the west or the south,
to guarantee that the wind profile was similar to a
boundary layer flow. The vegetation is low patchy grass
(maximum height 15 cm) and the terrain roughness is
about 10mm calculated from the velocity profile in
neutral stability.
2.1. Gas monitoring and method of analysis
Concentration measurements were made by sampling
using a number of digital fast-response PIDs. This
instrument has a response time corresponding to about
50Hz. It continuously samples the ambient air at a flow
rate of 1 lmin�1 and this air stream is exposed to a high-
energy ultra-violet light, which ionises molecules having
ionisation energy levels at or below the lamp photon
energy. The gas tracer is selected to be such that it will be
detected. The release rate of the tracer gas is set to
ensure that the signal due to tracer gas is far in excess of
any ionisable species that may be present as a back-
ground. The gaseous constituents of air are not ionisable
ARTICLE IN PRESS
4.55
1.85
5.80
4.55
2.75
3.40
5.20
1.45
2.80
2.55
3.05
1.55
2.25 3.55
0.85
9.10
2.906.10
0.850.851.60
3.103.002.90
2.5510.45
7.25
Sonic anemometer (3 vertical positions)
Source
PID
PID (2 or 3 vertical positions)
South wind
direction
West wind
direction
12
31a
10
13
14
1211
14
9
8
7
13
455a
5b6
N
E
W
SN
E
W
S
(a) (c)
(d)
(b)
(e)
Fig. 1. (a) Schematic representation of the site, (b) photograph of the building used in the experiments at Dugway Proving Ground
(view looking from SSW), (c) top, west and south views (clockwise) of the building and detector locations on the building surfaces, (d)
a schematic representation of the detector locations and numbering on the building surfaces—perspective view looking from SE—and
(e) perspective view looking from NW.
J.M. Santos et al. / Atmospheric Environment 39 (2005) 4999–5012 5001
at the photon energy level used. The instrument
response is such that at low concentrations (in the range
up to approximately 800 ppm) the output signal is nearly
linearly proportional to the concentration of the
contaminant gas, and the tracer gas release rate is
chosen to ensure that the instrument is operating in this
range. The ions formed are collected on an electrode
system providing an electrical field, producing an ion
current that is a measure of tracer gas concentration.
The ion current is amplified and converted to a voltage
signal whose value is close to proportional to the gas
concentration. The instruments are calibrated regularly
during the field campaign by exposure to metered
concentrations of tracer gas in the ambient air, thereby
providing calibration data to convert the output voltage
to equivalent gas concentration. This procedure ensures
that any non-linearity in instrument response is properly
allowed for in the data acquisition.
By applying a baseline correction (in which the slowly
varying baseline signal was removed from the data) and
the calibration curves of the instruments (using the
calibration measurements conducted during the trials as
described above), the voltage signals recorded by the
acquisition system were converted to concentration
values (ppm). This data conversion produced time series
of concentration, to which an averaging time of 1 s was
then applied in order to reduce the file sizes. Further-
more, the basic 50Hz data were not required for this
study, since the investigation is concerned with processes
that can adequately be analysed using longer averaging
times (1 s or more). For the purposes of this study, the
1 s-averaged data contain sufficient information about
fluctuations of concentration due to turbulent eddies.
Thus, the mean concentration, the deviation of the
measured values in relation to the mean and other
statistical parameters were calculated using the 1 s-
averaged data.
In order to obtain information about turbulent
fluctuations from the data, it is important to analyse
concentration fluctuation values in relation to the levels

ARTICLE IN PRESSJ.M. Santos et al. / Atmospheric Environment 39 (2005) 4999–50125002
of the mean concentration, since a certain absolute value
of fluctuation can represent a relatively large fluctuation
if the mean value is low or a relatively small fluctuation
if the mean is high. Thus, concentration fluctuation
intensity, i, is presented as the ratio of the standard
deviation to the mean concentration.
A detector will experience periods of zero concentra-
tion due to pockets of clean air brought into the plume
by the small-scale atmospheric turbulence and due to the
large-scales of turbulence that will cause the plume to
meander. The term intermittency is used to describe this
characteristic of the concentration time series. Although
this characteristic appears, at first, as a simple idea, the
literature contains several definitions of intermittency.
Chatwin and Sullivan (1989) discussed this topic and
proposed a definition that was suitable for both
theoretical and practical applications. Here, for consis-
tency with other field work in which intermittency has
been measured (for example, Higson et al., 1994;
Mavroidis and Griffiths, 2001), the definition adopted
is that the intermittency is the proportion of the
concentration time series for which the concentration
is at or below a threshold value, which in this case is the
nominal zero concentration. Complete statistics are
calculated using the whole data record (including zero
concentrations), whilst conditional statistics refer only
to those portions greater than a threshold (i.e., excluding
zero concentrations).
Another important parameter is the cumulative
frequency, which represents the cumulative distribution
function (cdf) of a concentration time series. As
illustrated in Figs. 4–6, the cdf gives the proportion of
concentration readings which are below a given con-
centration (expressed as the ratio between the instanta-
neous and mean concentration values), and provides the
following information: (a) the concentration fluctuation
intensity which is indicated by the slope of the central
part of the curve (the lower the intensity the steeper the
gradient); (b) intermittency, which is indicated by the
intercept on the vertical axis; and (c) the ratio between
peak and mean obtained from the value where the cdf
reaches 1.
2.2. Meteorological instrumentation and method of
analysis
Meteorological data were acquired using three ultra-
sonic anemometers located in a vertical array (z ¼ 0:44,0.88 and 1.76Hb) at a distance of 30m west of the
building (Fig. 1a). These instruments provided three
orthogonal components of the velocity vector of the
wind and the speed of sound in air at a frequency of
20Hz. Since the speed of sound is related to the air
temperature, temperature at these locations can be
deduced from the measurement. The ultrasonic anem-
ometer measurements were complemented by measure-
ments of ambient pressure, humidity and temperature
provided by a meteorological station located within
500m of the building.
2.3. Averaging time
The averaging time was chosen based on the time
scale of turbulence in the near-wake of the obstacle,
which is of the order of Hb/Ub (where Ub is the wind
speed at one building height). This time scale is about 1 s
for these experiments, since the wind speed is higher
than 2.5m s�1. Mavroidis et al. (2003) pointed out that a
minimum averaging time is required to obtain stable
repeatable data, due to the randomness of the turbulent
fluctuations. However, it is important to note that as the
averaging time increases the variations of mean wind
speed and direction start to affect the measurements
more intensely. In fact, the authors point out that eddy
scales beyond about 10–20 times the obstacle size are not
distinguishable as turbulence related to the obstacle, but
as variations in mean wind speed and direction. In this
sense, it is desirable to consider an averaging time long
enough to be representative of the process, but avoiding
large variations of the mean wind speed and direction.
According to these authors, this can be achieved by
using an averaging time of the order of hundreds of Hb/
Ub. Thus, in this work, the time series of 1 s-averaged
data are averaged over a number of periods of 5min.
Over the whole period of the campaign, seven basic
episodes of 5min were selected for analysis and were
chosen from episodes when the mean wind direction
(averaged over the 5min period) was normal to the
building wall within 7101 and the wind speed was
greater than 2m s�1. Table 1 shows the meteorological
data averaged over the 5min period for the chosen
scenarios, except the coefficient of variation, which was
calculated as the ratio between standard deviation and
mean of the ten 30-s values of Richardson-flux number
(Rif ) in order to enable the examination of its variability
during the 5min periods.
3. Results and discussion
This section presents the results obtained from the
selected episodes. The analysis is carried out in two sub-
sections that describe, firstly, the influence on concen-
trations of the building dimensions, and then the
influence of atmospheric stability.
3.1. Concentration distribution and the influence of
building dimensions
As stated earlier, experiments were carried out for
wind impinging on the longer wall of the building (west
wind direction) and wind impinging on the shorter wall

ARTICLE IN PRESS
Table 1
Chosen scenarios and their meteorological parameters
Exp. Windward wall /
stability
Speed
(m s�1)
y (1) sy L (m) u�(m s�1)
Rif CVbT (1C) TKEa
(m2/s2)
1 Short wall/neutral 6.15 180.7 8.30 �50.84 0.57 �5.90� 10�2 �9.42 41.25 1.38
2 Short wall/neutral 5.31 182.4 12.33 �54.14 0.54 �5.54� 10�2 �1.72 41.54 1.53
3 Long wall/neutral 4.61 267.1 14.53 �24.87 0.47 �1.21� 10�1 �6.93 42.90 1.41
4 Long wall/neutral 2.79 261.4 17.42 �43.69 0.54 �6.87� 10�2 �1.95 42.10 1.43
5 Long wall/extremely
unstable
2.48 265.1 21.38 �0.98 0.15 �3.07� 10+0�1.51 40.36 1.28
6 Long wall/slightly
unstable
2.86 264.43 16.78 �14.31 0.33 �2.09� 10�1 �5.88 42.03 1.16
aTKE represents the turbulent kinetic energy of the incident flow.bCV represents the coefficient of variation (calculated as the ratio between standard deviation and mean) of the 10 30-s values of Rif
during the 5min-period selected for analysis.
J.M. Santos et al. / Atmospheric Environment 39 (2005) 4999–5012 5003
of the building (south wind direction). In the first
configuration, the ratio between the building width and
height (Wbwest/Hb) is 5.35 and in the second configura-
tion this ratio (Wbsouth/Hb) is 1.34, where Wb
west and
Wbsouth denote the length of the west and south walls of
the building, respectively.
Fig. 2 presents the normalised mean concentration on
the building walls, which is expressed as o� ¼
CUbH2b=Q � 106 (where C is the concentration in
ppm, Ub is wind speed at the building height, Hb is the
building height and Q is the volumetric flow rate emitted
from the source). Fig. 2a and b present the concentra-
tion distribution on the building walls for the west wind
direction (Exp. 3 and 4, neutral stability) and for the
south wind direction (Exp. 1 and 2, neutral stability),
respectively. The corresponding results for unstable
conditions are presented in Fig. 2c, and are discussed
in Section 3.2.
The source is located such that the plume dimension
reaching the obstacle is less than or comparable to the
building width. There is a clear indication from the
experimental data that, in general, the means are higher
for the plume reaching the shorter windward wall
(Figs. 2a and b). The region of the flow disturbed by
the building is smaller when the flow is impinging on the
shorter wall, thus the plume is less spread and higher
concentration values occur. Given this behaviour on the
windward wall, these higher concentrations would be
expected to persist in the subsequent passage around the
building, and this is shown in Fig. 2, where the
concentrations on the leeward and lateral walls are in
general greater in the south wind configuration than in
the west wind configuration.
In all cases the maximum value of concentration is
seen on the windward wall. Fig. 2a shows that when the
wind direction is within a few degrees of normal to the
building wall this maximum is seen on the central
detector on the windward wall and that the mean
concentration decreases steadily with lateral distance
from this central position. However, in the case of Exp.
4 the maximum concentration on the windward wall is
displaced from the central to the neighbouring detector.
This is consistent with the wind direction in this case,
which (at 261.41) is close to the 101 limit of the selection
criterion. In Fig. 2b the maximum is on the windward
wall, but as only one detector is located on this wall, the
lateral behaviour is not apparent.
The mean values of concentration on the leeward wall
are nearly uniform and comparable to the minimum
values measured on the windward wall. It is interesting
to note that although the concentration values on the
leeward wall are nearly uniform, concentration values
for detectors 8 and 9 (in Fig. 2a) are noticeably different,
since they are just beside the step-shaped structure on
this wall.
It can be seen in Fig. 2a that the mean concentrations
on the left lateral walls are also lower than the windward
wall maximum, and nearly constant. This may be related
to the turbulent structures on these walls. These lateral
and leeward walls are characterised by a boundary layer
separation, producing recirculation zones where there
are high levels of turbulent kinetic energy, but with a
relatively small length scale, since these zones are mainly
generated by mechanical forces. In Fig. 2b the concen-
trations on the right lateral wall are less than the value
on the windward wall, but are not uniform. In spite of
the fact that these regions are fairly well mixed, there is
considerable complexity on the longer walls given their
stepped shape.
The turbulence characteristics can be observed in
more detail in Figs. 3–5, which show concentration
fluctuation intensity (Fig. 3) and the cdf’s on the
building (Figs. 4 and 5). Figs. 3a and b show that the
concentration fluctuation intensity is nearly uniform on
each of the building walls, except for detectors 11 and 12
on the windward wall and for the detector 9 on the

ARTICLE IN PRESS
0 0.5 10.00
0.20
0.40
0.60
0.80
1.00
ω*
(con
ditio
nal -
5 m
in a
vera
ging
)
11 12
12
3
0 0.5 1
4 56
0 0.5 1
10
0 0.5 1
7 89
Exp. 3Exp. 4
windward wall left lateral wall right lateral wallleeward wall
windward wall left lateral wall right lateral wallleeward wall
windward wall left lateral wall right lateral wallleeward wall
0 0.5 10.00
0.20
0.40
0.60
0.80
1.00
ω *(c
ondi
tiona
l - 5
min
ave
ragi
ng)
10
Exp. 2Exp. 1
0 0.5 1
1112
1 23
0 0.5 1
7
8
9
0 0.5 1
4 5 6
South wind direction
West winddirection
0 0.5 1
d/Lwest
0.00
0.20
0.40
0.60
0.80
1.00
ω*
(con
ditio
nal -
5m
in a
vera
ging
)
11 12
1
23
Exp. 6Exp. 5
0 0.5 1
d/Lnorth
4 5 6
0 0.5 1
d/Lsouth
10
0 0.5 1
d/Least
d/Lwest d/Lnorthd/Lsouth d/Least
d/Lwest d/Lnorth d/Lsouthd/Least
7 89
West winddirection
(a)
(b)
(c)
Fig. 2. Conditional normalised mean concentration in (a) neutral conditions for source located upwind of the centre of the long face of
the building (W Exp. 3, J Exp. 4), (b) neutral conditions for source located upwind of the centre of the short face of the building (WExp. 2,J Exp. 1), (c) unstable conditions for source located upwind of the centre of the long face of the building (J Exp. 5,W Exp. 6).
J.M. Santos et al. / Atmospheric Environment 39 (2005) 4999–50125004

ARTICLE IN PRESS
(a)
(b)
(c)
0 0.5 1
d/Lwest
0.0
1.0
2.0
3.0i
(con
dito
nal-
5 m
in a
vera
ging
)11
12
12 3
0 0.5 1
d/Lnorth
4 5 6
0 0.5 1
d/Lsouth
10
0 0.5 1
d/Least
d/Lwest d/Lnorthd/Lsouth d/Least
d/Lwest d/Lnorth d/Lsouthd/Least
7 8
9
windward wall left lateral wall right lateral wallleeward wall
windward wall left lateral wall right lateral wallleeward wall
windward wall left lateral wall right lateral wallleeward wall
0 0.5 10.0
1.0
2.0
3.0
i(c
ondi
tona
l-5
min
ave
ragi
ng)
10
0 0.5 1
11 121 2 3
0 0.5 1
4 5 6
0 0.5 1
78
9
South wind direction
West winddirection
0 0.5 10.0
1.0
2.0
3.0
i(c
ondi
tiona
l-5
min
ave
ragi
ng)
11
12
12 3
0 0.5 1
4 5 6
0 0.5 1
10
0 0.5 1
7 8
9
West winddirection
Fig. 3. Conditional concentration fluctuation intensity in (a) neutral conditions for source located upwind of the centre of the long face
of the building (W Exp. 3, J Exp. 4), (b) neutral conditions for source located upwind of the centre of the short face of the building
(W Exp. 2, J Exp. 1), (c) unstable conditions for source located upwind of the centre of the long face of the building (J Exp. 5, WExp. 6). & Higson et al. (1996) with plume width comparable to L, ’ Higson et al. (1996) with plume width less than L.
J.M. Santos et al. / Atmospheric Environment 39 (2005) 4999–5012 5005
ARTICLE IN PRESS
0 2 4 6 8 10
0
0.2
0.4
0.6
0.8
1
0 1 2 3 4 5
0
20
40
60
80
0 1 2 3 4 5t (mins)
0
20
40
60
80C
(pp
m)
0 2 4 6 8 10C/Cmean
t (mins) C/Cmean
0 2 4 6 8 100 1 2 3 4 5t (mins) C/Cmean
t (mins) C/Cmean
t (mins) C/Cmean
0
0.2
0.4
0.6
0.8
1
Con
ditio
nal c
df
C (
ppm
)
Con
ditio
nal c
df
C (
ppm
)
Con
ditio
nal c
df
C (
ppm
)
Con
ditio
nal c
df
C (
ppm
)
Con
ditio
nal c
df
0
0.2
0.4
0.6
0.8
1
0
20
40
60
80
0 2 4 6 8 100
0.2
0.4
0.6
0.8
1
0 1 2 3 4 50
20
40
60
80
0 2 4 6 8 100
0.2
0.4
0.6
0.8
1
0 1 2 3 4 50
20
40
60
80
West winddirectio n
1
53
10
8
(a)
(b)
(c)
(d)
(e)
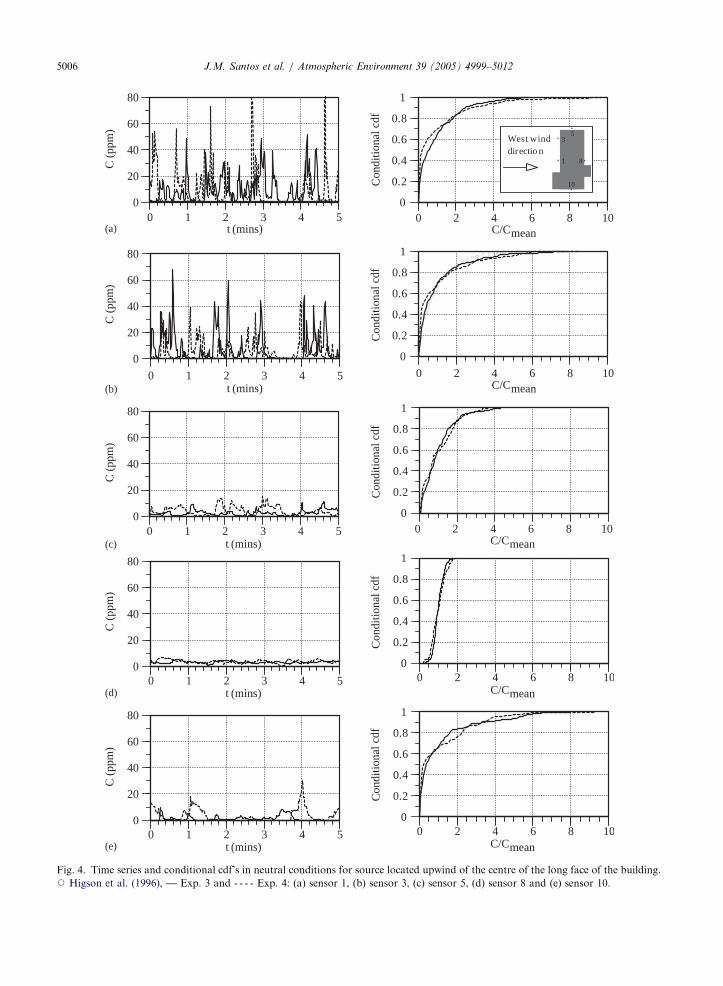
Fig. 4. Time series and conditional cdf’s in neutral conditions for source located upwind of the centre of the long face of the building.J Higson et al. (1996), — Exp. 3 and - - - - Exp. 4: (a) sensor 1, (b) sensor 3, (c) sensor 5, (d) sensor 8 and (e) sensor 10.
J.M. Santos et al. / Atmospheric Environment 39 (2005) 4999–50125006

ARTICLE IN PRESS
0 2 4 6 8 10C/ Cmean
0
0.2
0.4
0.6
0.8
1
0
0.2
0.4
0.6
0.8
1
0
0.2
0.4
0.6
0.8
1
0
0.2
0.4
0.6
0.8
1
Con
ditio
nal c
df
0 2 4 6 8 100 1 2 3 4 5
0
20
40
60
80
0 1 2 3 4 5t (mins)
C/ Cmeant (mins)
C/ Cmeant (mins)
C/ Cmeant (mins)
0
20
40
60
80
C (
ppm
)
Con
ditio
nal c
df
C (
ppm
)
Con
ditio
nal c
df
C (
ppm
)
Con
ditio
nal c
df
C (
ppm
)
0 2 4 6 8 100 1 2 3 4 5
0
20
40
60
80
0 2 4 6 8 100 1 2 3 4 5
0
20
40
60
80
South wind direction
1
810 5
(a)
(b)
(c)
(d)
Fig. 5. Time series and conditional cdf’s in neutral conditions for source located upwind of the centre of the short face of the building.J Higson et al. (1996), — Exp. 1 and - - - - Exp. 2: (a) sensor 10, (b) sensor 1, (c) sensor 5 and (d) sensor 8.
J.M. Santos et al. / Atmospheric Environment 39 (2005) 4999–5012 5007
leeward wall for the west wind configuration due to the
complex and asymmetric shape of the building. These
Figures also indicate that the distributions of concentra-
tion fluctuation on the windward, leeward and lateral
walls display a very similar pattern for the two building/
source orientations in relation to the wind direction,
ARTICLE IN PRESSJ.M. Santos et al. / Atmospheric Environment 39 (2005) 4999–50125008
with larger values on the windward wall, smaller values
on the leeward wall, and intermediate values on the
lateral walls. This is consistent with the progressive
reduction of intermittency by the action of the shear and
small-scale turbulence generated by the interaction of
building with the flow. On the windward wall the mean
intermittency (average value between all sensors on the
windward wall) is 0.05 for Exp. 1 and 2, and 0.05 for
Exp. 3 and 4, while for the leeward walls mean
intermittency is zero for all experiments. This can also
be understood in terms of large values of fluctuation
intensity being related to the large-scale upstream
turbulent motion, and small values being associated
with the small-scale local turbulent motion. Further-
more, the concentration in the recirculation region
behind the building will display a significant decay time
(Mavroidis et al., 1999), since the contaminants are
partially ‘‘trapped’’ in this region. This behaviour tends
to buffer the intense concentration fluctuations.
In order to evaluate the influence of the building
shape, the results presented here are compared with field
experimental data obtained by Higson et al. (1996). Both
experimental investigations used complex-shaped, but
not identical, buildings. Therefore, a comparison be-
tween these two sets of data can indicate the influence of
changes in building shape on the distribution of
concentration and related statistics on the obstacle
walls. Higson et al. (1996) carried out experimental
investigations at Altcar Rifle Range (England) on
dispersion around an isolated rectangular obstacle with
an L-shaped ‘‘penthouse’’ added on the roof. The
building dimensions are similar to those of the building
used in the work presented here. A tracer gas was
released upwind of the building (x ¼ 4:07 and 12.20Hb)
and concentrations were measured using a PID detector
system with response time of approximately 1 s. The
experiments were undertaken under near neutral atmo-
spheric stability conditions paying attention to the
fluctuating components of concentration for the purpose
of comparing the concentration distribution measured in
the field with those measured in experiments conducted
in a wind tunnel. Higson et al. (1996) have used
conditional statistics to enable comparison between field
and wind tunnel data and avoid evaluating two sets of
data with different intermittency, which would be
meaningless. Thus, conditional average and fluctuations
were used in the present work to allow for the
comparison with the field experiments carried out by
Higson et al. Moreover, the data for this analysis were
previously chosen from the whole experiment for which
the intermittency was low.
There is a similarity between the results obtained in the
field experiments carried out by Higson et al. (1996) and
those reported here, which can be seen in Figs. 3a and b.
The fluctuation intensity values obtained in this work are
higher than those obtained by Higson et al. (1996), except
on the leeward wall where the values are comparable. In
fact, there are more similarities in the case with the wind
impinging on the shorter wall; the levels of fluctuation
intensities are quite similar in this case.
Figs. 4 and 5 present the progression of the cdf shapes
around the building using two different runs (Exp. 3 and
4 in Fig. 4 and Exp. 1 and 2 in Fig. 5) to illustrate the
representativeness of the sample selected.
Fig. 4b presents the cdf for the sensor at the left
corner of the windward wall for the present experiments
and for the experiments performed by Higson et al.
(1996). It can be seen that the shapes of the cdf’s are
remarkably similar. The same tendency can be observed
in Figs. 5a and c, which also present a comparison
between the cdf0s for the present experiments and for the
experiments performed by Higson et al. (1996). This fact
may indicate that the differences in the building shape
between these two configurations do not significantly
affect the cumulative distribution frequency of concen-
tration fluctuations on the building walls.
It is clear from the time series and the shapes of the
cdf’s presented in Figs. 4 and 5 that there is significantly
more fluctuation intensity on the windward wall than on
the leeward wall. The progressive steepening of the slope
of the central portion of the cdf0s indicates a gradual
reduction of the fluctuation intensity as the measure-
ment location progresses from windward to leeward via
the lateral wall, i.e. via the two sensor sequences 1, 3, 5, 8
and 1, 10, 8. Furthermore, on the leeward wall, the
values of concentration peak divided by the mean are
lower due to lower velocities and high levels of turbulent
kinetic energy in the region downwind of the obstacle (in
comparison with the free upstream flow). As discussed
previously, these features may indicate a considerable
variation in the turbulence length scale, due to shear
generated turbulence.
The cdf’s obtained for the two different building
orientations (Figs. 4 and 5) analysed are quite similar
despite the fact that the mean concentration is higher for
the case where the shorter wall is normal to the wind.
The time series presented shows clearly that the
turbulence scales on the windward and leeward walls
do not vary according to the ratio between building
width and height, which implies that the concentration
fluctuation intensity on the building walls is more
influenced by the building height than by the width for
the configurations studied. Thus, it is suggested that the
building height is the characteristic dimension determin-
ing the dominant size of the scales of turbulent eddies
close to the obstacle. Despite the values of concentration
fluctuation intensity presented by Higson et al. being,
for all detectors, lower than those reported here, the
shapes of the cdf’s shown in Figs. 4 and 5 are similar for
both field experiments. This can be understood to mean
that the characteristic behaviour of dispersion on the
different walls of the obstacle was not strongly
ARTICLE IN PRESSJ.M. Santos et al. / Atmospheric Environment 39 (2005) 4999–5012 5009
influenced by the slightly different building shape in the
two experiments.
3.2. Atmospheric stability
According to Robins (1994), in strongly convective
conditions, the high levels of atmospheric turbulence
significantly modify the flow and dispersion features
generated in the vicinity of an obstacle. Moreover, in
strongly stable conditions (Frp2:5), the reattachment ofthe flow on the top and lateral sides of the building is
enhanced and that dramatically changes the concentra-
tion field (Snyder, 1994). Thus, it seems that there is a
range of atmospheric conditions, centred upon neutral
conditions, outside of which the vertical structure of
temperature significantly affects the dispersion of con-
taminants in the vicinity of the obstacle.
In this section the concentration measurements
obtained under unstable atmospheric conditions are
presented, which correspond to Exp.5 and 6 described in
Table 1. Exp.5 is characterised by a very small negative
Monin–Obukhov length (�0.98), which corresponds to
an extremely unstable condition on a Pasquill–Gilford
classification scheme, while Exp. 6 has a Monin–Obu-
khov length equal to �14.31, which corresponds to a
slightly unstable condition. Fig. 2c shows that the mean
concentration levels are markedly smaller than the
values obtained for neutral conditions with similar
building orientation in relation to the wind (Fig. 3a),
especially for Exp. 5 (extremely unstable). This may be
related to an enhanced degree of atmospheric dispersion
before the plume reaches the windward face of the
building. On the other hand, the concentration fluctua-
tion intensity presented in Fig. 3c is not significantly
different from the values obtained for neutral conditions
with similar building orientation. In fact the fluctuation
intensity is only marginally larger on some sensors,
especially on the lateral walls of the building.
Fig. 6 shows the concentration time series and cdf’s
for different detector positions on the building surface
(detectors 1, 5, 8 and 10). The concentration time series
are markedly different from the time series under neutral
conditions for a similar building orientation (Fig. 4).
Although the mean concentration values are smaller for
the unstable cases, as shown in Fig. 2, there are
significant higher concentration peaks. It can be seen
that the unstable time series exhibit much larger
intermittency. While for the neutral cases the mean
intermittency on the windward wall is 0.05, tending to
zero at the leeward wall, the mean intermittency on the
windward wall is 0.12 for Exp. 5 (extremely unstable
condition) and 0.07 for Exp. 6 (slightly unstable
condition), also tending to zero on the leeward wall.
This is probably related to the presence of turbulent
motions of larger scales for the more unstable condi-
tions. It is important to remember that the data
presented here were selected according to the criteria
stated in Section 2.3 for wind direction (7101 from
normal) and the wind speed (42m s�1). Therefore, the
intermittency of the concentration data is related to the
meandering due to the larger scales of turbulence rather
than to the meandering due to the changing direction of
the mean wind.
The cdf0s related to the time series of each sensor are
presented on the right of Fig. 6. The maximum
concentration (C/Cmean) lies beyond the scale presented,
but the graphs have been shown on the same scale as the
one used in Figs. 4 and 5 to emphasise the differences/
similarities between the distributions. As for the experi-
ments under neutral conditions, the time series and cdf
shapes show that there is significantly more fluctuation
intensity on the windward wall than on the leeward wall.
The progression in the slope of the central portion of the
cdf0s indicates a gradual reduction of the fluctuation
intensity as the measurement location progresses from
windward to leeward via the lateral wall, i.e. via the two
sensor sequences 1, 5, 8 and 1, 10, 8. In spite of the
differences in the time series, the conditional cdf0s
exhibit comparable shapes. The slopes of the cdf0s for
unstable and neutral conditions display very similar
behaviour. In fact, this corresponds to the fluctuation
intensity values presented in Fig. 3, where the values
obtained for neutral and unstable conditions were
approximately the same.
The main difference in the cdf0s presented is in the
value of the peak to mean ratio. While for the neutral
cases the maximum values of peak to mean ratio
observed in the cdf0s are 12.3, 4.31, 1.86 and 9.24 (for
the windward, left lateral, leeward and right lateral
walls, respectively), the values for the experiment under
unstable conditions (Exp. 6) were 14.7, 3.76, 2.55 and
11.7, and for the experiment under extremely unstable
conditions (Exp. 5) they were 14.2, 7.17, 3.23 and 22.03.
These values indicate a significant increase in the peak to
mean ratio under unstable conditions. Even inside the
recirculation region behind the building, which is
considered to be a well-mixed region, the peak to mean
ratio presents relatively high values. Again, this effect is
probably related to the presence of turbulent motions of
larger scales for the more unstable conditions.
4. Conclusions
Field experiments were carried out to measure the
fluctuating concentration time series on the walls of a
complex-shaped building, and to investigate the influ-
ence of atmospheric stability and building dimensions
on certain statistics of the concentration distribution on
the walls of the building. The experiments were
performed in flat terrain with uncut vegetation. Meteor-
ological conditions varied from neutral to extremely

ARTICLE IN PRESS
0 1 2 3 4 5t (mins)
0
40
80
120
160
C (
ppm
)
0 2 4 6 8 10C/ Cmean
t (mins) C/ Cmean
t (mins) C/ Cmean
t (mins) C/ Cmean
0
0.2
0.4
0.6
0.8
1
Con
ditio
nal c
df
C (
ppm
)
Con
ditio
nal c
df
C (
ppm
)
Con
ditio
nal c
df
C (
ppm
)
Con
ditio
nal c
df
West winddirection
0 2 4 6 8 100
0. 2
0. 4
0. 6
0. 8
1
0 1 2 3 4 50
20
40
60
80
0 2 4 6 8 100
0. 2
0. 4
0. 6
0. 8
1
0 1 2 3 4 50
20
40
60
80
0 2 4 6 8 100
0. 2
0. 4
0. 6
0. 8
1
0 1 2 3 4 50
20
40
60
80
(a)
(b)
(c)
(d)
Fig. 6. Time series and conditional cdf’s in unstable conditions for source located upwind of the centre of the long face of the building.
— Exp. 5 and - - - - Exp. 6: (a) sensor 1, (b) sensor 5, (c) sensor 8 and (d) sensor 10.
J.M. Santos et al. / Atmospheric Environment 39 (2005) 4999–50125010
unstable. The experimental work carried out on the
complex building revealed that the mean conditional
concentration on the walls was significantly influenced
by the building orientation in relation to the wind
direction. There is a clear indication from the experi-
mental data that: (1) the mean concentration and
concentration fluctuations on the windward wall are
higher than on the other three walls; (2) the concentra-
tions on all walls are higher when the shorter wall faces
the wind. The region of the flow disturbed by the

ARTICLE IN PRESSJ.M. Santos et al. / Atmospheric Environment 39 (2005) 4999–5012 5011
building is smaller when the flow is impinging on the
shorter wall, thus the plume is less spread and higher
concentration values occur. Concentration fluctuation
intensity is nearly uniform on each of the building walls,
and the distributions of concentration fluctuations on
the windward, leeward and lateral walls are comparable
for both Wb=Hb ratios analysed.
Comparison with the work published by Higson et al.
(1996), which also studies atmospheric dispersion
around an isolated building, indicated that although
the fluctuation intensity of the gas tracer concentration
carried in the incoming flow was larger in this study, the
values of concentration fluctuation intensity on the
other building walls were comparable. This behaviour
was also observed in the comparisons of the cdf’s for the
concentrations on each building wall, which displayed a
remarkably similar shape. This can be understood to
mean that the characteristic behaviour of dispersion on
the different walls of the obstacle was not significantly
affected by the slightly different building shapes used in
the two experiments.
The changes in the fluid flow pattern, together with
the greater degree of plume spreading before impinge-
ment on the obstacle, produce lower mean concentration
levels under extremely unstable conditions. Concentra-
tion fluctuation intensity displayed a consistent pattern
in neutral conditions, with larger values on the wind-
ward wall, smaller values on the leeward wall, and
intermediate values on the lateral walls. This pattern was
also displayed in extremely unstable conditions, though
with slightly less consistency. Values of conditional
fluctuation intensity on the building walls were not
significantly influenced by atmospheric stability condi-
tions, but the effect of intermittency due to large-scale
turbulent motion on unstable conditions was clearly
observed. The main effect of the atmospheric stability
was related to values of peak to mean concentration
ratio observed on the building walls, which exhibited a
considerable increase under unstable conditions.
Acknowledgements
The authors would like to acknowledge the sponsor-
ship of the CNPq (the Brazilian Government Agency for
Technological Development and Scientific Research).
The authors also would like to acknowledge the
Meteorology Division, Dugway Proving Ground, Utah,
USA, and staff of DSTL, Porton, UK for enabling Dr
Santos to participate in the field experiments.
References
Allwine, K.J., Shinn, J.H., Streit, G.E., Clawson, K.L., Brown,
M., 2002. Overview of urban 2000: a multiscale field study
of dispersion through an urban environment. Bulletin of the
American Meteorogical Society 83 (4), 521–536.
Chatwin, P.C., Sullivan, P.J., 1989. The intermittency factor of
scalars in turbulence. Physics of Fluids 1 (4), 761–763.
Cheng, Y., Lien, F.S., Yee, E., Sinclair, R., 2003. A comparison
of large eddy simulations with a standard k–e Reynolds-
averaged Navier–Stokes models for the prediction of a fully
developed turbulent flow over a matrix of cubes. Journal of
Wind Engineering and Industrial Aerodynamics 91,
1301–1328.
Higson, H.L., Griffiths, R.F., Jones, C.D., Hall, D.J., 1994.
Concentration measurements around isolated buildings: a
comparison between wind tunnel and field data. Atmo-
spheric Environment 28, 1827–1835.
Higson, H.L., Griffiths, R.F., Jones, C.D., Hall, D.J., 1996.
Flow and dispersion around an isolated building. Atmo-
spheric Environment 30 (16), 2859–2870.
Jones, C.D., Griffiths, R.F., 1984. Full-scale experiments on
dispersion around an isolated building using an ionised air
tracer technique with a very short averaging time. Atmo-
spheric Environment 18, 903–916.
Macdonald, R.W., Griffiths, R.F., Chea, S.C., 1997. Field
experiments of dispersion through arrays of cubic struc-
tures. Atmospheric Environment 31 (6), 783–795.
Mavroidis, I., Griffiths, R.F., 2001. Local characteristics of
atmospheric dispersion within building arrays. Atmospheric
Environment 35, 2941–2954.
Mavroidis, I., Griffiths, R.F., Jones, C.D., Biltoft, C.A., 1999.
Experimental investigation of the residence of contaminants
in the wake of an obstacle under different stability
conditions. Atmospheric Environment 33 (6), 939–949.
Mavroidis, I., Griffiths, R.F., Hall, D.J., 2003. Field and wind
tunnel investigations of plume dispersion around single
surface obstacles. Atmospheric Environment 37, 2903–2918.
Meroney, R.N., Leitl, B.M., Rafailidis, S., Schatzmann, M.,
1999. Wind-tunnel and numerical modelling of flow and
dispersion around several building shapes. Journal of Wind
Engineering and Industrial Aerodynamics 81, 333–345.
Ogawa, Y., Oikawa, S., Uehara, K., 1983a. Field and wind
tunnel study of the flow and diffusion around a model
cube—I. Flow measurements. Atmospheric Environment 17
(6), 1145–1159.
Ogawa, Y., Oikawa, S., Uehara, K., 1983b. Field and wind
tunnel study of the flow and diffusion around a model
cube—II. Nearfield an cube surface flow and concentration
patterns. Atmospheric Environment 17 (6), 1161–1171.
Robins, A., 1994. Flow and dispersion around buildings
in light wind conditions. In: Castro, I.P., Rockliff, N.J.
(Eds.), Stably Stratified Flows—Flow and Dispersion
over Topography. The Institute of Mathematics and its
Applications Conference Series. Clarendon Press, Oxford,
pp. 323–358.
Saathoff, P.J., Stathopoulos, T., Dobrescu, M., 1995. Effects of
model scale in estimating pollutant dispersion near build-
ings. Journal of Wind Engineering and Industrial Aero-
dynamics 54/55, 549–559.
Sada, K., Sato, A., 2002. Numerical calculation of flow and
stack-gas concentration fluctuation around a cubical build-
ing. Atmospheric Environment 36, 5527–5534.
Snyder, W.H., 1994. Some observations of the influence of
stratification on diffusion in building wakes. In: Castro, I.P.,

ARTICLE IN PRESSJ.M. Santos et al. / Atmospheric Environment 39 (2005) 4999–50125012
Rockliff, N.J. (Eds.), Stably Stratified Flows—Flow and
Dispersion over Topography in The Institute of Mathe-
matics and its Applications Conference Series. Clarendon
Press, Oxford, pp. 301–324.
Yee, E., Biltof, C.A., 2004. Concentration fluctuation mea-
surements in a plume dispersing through a regular
array of obstacles. Boundary-Layer Meteorology 111,
363–415.
Zhang, Y.Q., Arya, S.P., Snyder, W.H., 1996. A comparison of
numerical and physical modelling of stable atmospheric
flow and dispersion around a cubical building. Atmospheric
Environment 30, 1327–1345.