a dynamic shift share analysis of economic growth in...
TRANSCRIPT

1
A Dynamic Shift Share Analysis of Economic Growth in West Virginia
Janaranjana Herath, Tesfa G.Gebremedhin and Blessing M. Maumbe1
RESEARCH PAPER 2010-12
Abstract
A regional economy consists of industries with a variety of economic potentials. A growth or
decline in any of these sectors affects the overall growth of the economy. Analysis of economic
growth by sector of a particular region helps policy makers, community leaders and researchers
in better decision making and problem solving. This study attempts to analyze the employment
growth pattern and policy implications in the economic development of West Virginia using a
dynamic shift share analysis. The study uses employment data for 38 years from 1970 to 2007
for the empirical analysis. Results indicate that agriculture, mining and manufacturing are no
longer the backbone of the economy of West Virginia. The three sectors showed employment
declined within the 38-year period. Service and financial insurance and real estate are the most
robust sectors contributing 91 percent of employment growth from 1970 to 2007. Apart from
these two sectors, the wholesale and retail and construction sectors showed positive economic
growth. Identification of investment priorities within these potential sectors and implementation
of a comprehensive regional development policy plan would definitely accelerate the economic
growth of West Virginia.
Key Words: Dynamic shift share, employment, economic growth, West Virginia
1 Graduate Research Assistant, Professor, and Assistant Professor, Division of Resource Management, West Virginia
University, Morgantown. The authors acknowledge and appreciate the review comments and suggestions of Archana Pradhan, Gerard D’Souza and Michael Dougherty

2
A Dynamic Shift Share Analysis of Economic Growth in West Virginia
1. Introduction
The dynamic and changing regional economies have been capturing the attention of
policy makers, community leaders, and researchers (McNamara 1991; Knudsen, 2000.). A
regional economy consists of firms and industries with a variety of economic potentials. Growth
or decline in any of these sectors occurs by technological innovation, capital and labor
productivity, location, changes in product demand, and shifts in input costs, which directly or
indirectly affect the overall growth of the economy (Gebremedhin and Lass, 1995; Bartik 2004).
As various sectors affect economic growth of a particular region differently, understanding the
comparative advantage of these sectors becomes important in development decisions of the
region (Deming, 1996; Melachroinos, 2002). Thus, it is essential to know the competitiveness of
a particular state or region in economic development endeavors, as it makes the opportunity for
policy options or investment decisions.
The identification of comparative advantage of sectors and services becomes more
important in less developed regions than the developed regions. West Virginia is a low income
state that seeks economic growth and development. The total population of West Virginia was
1,819,777 in year 2009, of which 56 percent of the population lived within an urban area and the
remaining 44 percent lived in rural areas (ERS-USDA). West Virginia reported the 5th highest
poverty rate, 17.4 percent in year 2008 (Bureau of Labor Statistics, 2008). At present, the rural
poverty rate is 19.9 percent and the figure is five points higher than the urban poverty rate. The
unemployment rate is 9.5 percent which is one of the highest rates in the country compared to
rates of many other states (Bureau of Labor Statistics).
3
The average population density was about 75 people per square mile and the average per
capita income was $31,624 in 2008 (ERS-USDA). The per capita income in rural area was
$29,200 compared to $33,578 in urban area. Manufacturing, services, mining and tourism are the
major economic sectors in West Virginia. The leading production of bituminous coal, natural gas
stone, cement salt and oil contribute significantly to the state‘s economy. Farming is practiced
throughout West Virginia, but not in a form of large scale cash-crop agriculture (ERS-USDA).
Nearly 82 percent of total agricultural production comes from livestock products and the
remaining 18 percent comes from crops. Moreover, major manufacturing goods in West Virginia
are machinery, plastic and hard wood products, fabricated metals, chemicals, aluminum,
automotive parts and steel. The largest share of gross product in the service sector is comprised
of the community, business and personal services groups and most of these services are provided
by private health care, law firms, repair shops and hotels. Tourist activities such as skiing and
white-water rafting are popular and bring significant revenue to the state. Thus, the main
objective of this paper is to analyze the employment growth pattern and policy implications in
relation to the economic development of West Virginia at sector level, using a dynamic shift
share analysis.
The rest of the paper is organized into four sections. Section two provides the theoretical
framework. Section three covers the methodology and data sources. Section four describes the
empirical results and analysis. Section five presents the conclusions and policy implications.
2. Background and Framework
The shift share method of analyzing regional growth was originated in the 1940s by
Daniel Creamer and was summarized by Dunn in 1960 (Shi and Yang, 2008). According to
Dunn (1960), the main feature of shift share analysis is the computation of geographical shifts in

4
economic activity. The analysis has been used heavily since its formal inception in the 1960s
(Ashby 1968; Fothergill and Gudgin, 1979). It has been popular in the fields of regional
economy, political economy, urban studies, geography and marketing in the last 40 years
(Knudsen, 2000; Shi and Yang, 2008). The technique is generally applied to describe historical
growth trends, forecast regional growth, analyze the effects of policy initiatives, or develop
strategic planning for communities (Selting and Loveridge, 1992). However, the analysis has
generally been used for describing regional and industrial growth and examining the
competitiveness of regional and industrial growth in a particular time period (Sirkaya, Uysal and
Toepper, 1995). Ireland and Moomaw (1981) and Andrikopoulos, Brox, and Carvalho (1987)
showed the suitability of shift-share analysis in predicting investment decisions at the regional
level. Rigby and Anderson (1993) investigated variations in labor productivity, by incorporating
average labor productivity in an industry at a given time and by estimating the change when
output is held constant. The authors showed the potential gains in employment with the
productivity changes under constant output. McDonough and Sihag (1991) expanded the shift-
share technique by developing a methodology for selecting and including both primary- and
secondary-base economies in the shift-share model. This becomes practical when the technique
is applied to sub-regional economies, whose economic performance is usually tied to the
economies of both the state and the nation.
The technique has been used heavily in analyzing regional and international growth
impacts. Barff and Knight III (1988) applied dynamic shift share analysis to measure the
employment growth from 1939 to 1984 in New England by using data from U.S Bureau of Labor
Statistics. They found that either large changes in regional industrial mix or major differences

5
between regional and national growth rates were the main factors affecting employment growth
in New England.
Harris et. al (1994) used dynamic shift share analysis to investigate the economic
impacts of the State of Nevada. They examined the differential impacts of the state of Nevada
and three sub-regional economics from 1981 to1982 recession and from 1990 to 1991 recession.
The results indicated that the two recessions periods had different impacts while different sub-
regions of the state reacted differently to the impacts.
Gebremedhin and Lass (1995) used traditional static shift share analysis in comparing the
economic changes of industrial sectors in West Virginia and Massachusetts. The study was done
for the period 1981 to 1991. The results showed that employment in West Virginia and
Massachusetts decreased their share to total U.S. employment. Moreover, employment has
declined in agriculture, manufacturing and the government sectors of the two states.
A study done by Fernandez et. al (2005) in Spain using spatial shift share analysis
showed that higher competitive effects are found in the agriculture and construction sectors,
while the industry and services sectors showed lower results in employment growth in Spain.
The study by Andrikopoulos, Brox, and Carvalho (1990) based on shift-share analysis,
produced more accurate results compared to an analysis using aggregate employment changes.
They reported in the study the measurement of regional attractiveness in the manufacturing
sector in the province of Quebec in Canada. The study revealed that shift-share is useful for
analyzing historical employment patterns and identifying their causes through regression
analysis.
Shift share analysis has been used significantly to study trade issues with the effect of
globalization, especially in Europe. Markusen, Noponen, and Driessen (1991) used dynamic shift

6
share analysis in tracking the sensitivity of regional growth to international flows, decomposing
shift-share components into import, export, and domestic market segments and a productivity
component. They merged data on regional employment, national employment and output, and
international trade, to compare the experience of U.S. regions for the period from 1978 to 1986.
Results revealed that some regions, like New England and the Pacific, have relatively positive
industrial mixes for both export and domestic market growth, while others, particularly the East
and North Central region, have negative ones.
Esteban (2000) used shift share analysis to elucidate the existing interregional inequality
in aggregate productivities per worker within the European Union instead of productivity gaps
which are uniform across sectors. Result showed that interregional variation can be explained
only by uniform productivity gaps and the role of regional specialization is a minor one. The
findings became important in regional development policies focusing on actions producing
uniform increases in regional productivities like infrastructures and human capital.
Melachroinos (2002) examined the dynamics of manufacturing-employment change in
thirteen European Union countries between 1978 and 1996, using shift-share techniques. Results
revealed the gains of European integration over this period and they found that the geography of
manufacturing employment has remained almost unharmed too. The processes operating at
European scale also seemed to have the biggest impact on labor increment in each member state.
Wilson et. al. (2005) used dynamic shift share analysis to examine the export
performances of China in electronics compared to the East Asian Newly Industrialized
Economies exporting to the U.S, European Union and Japan from 1988 to 2001. They found that
China emerged as a serious competitor in the export market for electronic goods, but this

7
position in the market has not been a dominant one. China‘s main gains have been in consumer
electronics and telecommunication equipments.
Hoppes, (1997) used a shift share model to investigate, describe, and analyze disease and
death rates in Missouri. Using statistical data on death rates by type of disease, shift share
components of change were estimated at national, structural and regional scope. The results are
useful in allocating health care funding and targeting specific diseases for funding.
Shi et. al. (2007), applied the technique of shift share analysis to tourism in China, based
on international tourism receipts from 1995 to 2004. The study examined the spatial
competitiveness of international tourism in Jiangsu Province in comparison with its neighbors by
applying a spatially extended shift-share model and a modified dynamic shift-share model. The
results indicated that the growth of international tourism receipts in Jiangsu is mainly attributable
to the national component and the competitive component. Further, Zhejiang is the most
important rival to Jiangsu during the period of 1995 and 2004. In order to upgrade the
competitiveness of tourism in China, it was essential for Jiangsu to undertake proper positioning,
promoting and marketing strategies and to cooperate and integrate with its main rivals.
In the context of regional economic growth analysis, various methods like optimization
technique, shift-share, economic base, input-output, and benefit-cost analysis, have been used
(Selting and Loveridge, 1992; Quintero, 2007). Even though these models show some variations
in measurement, precision, accuracy, and simplicity, each method of analysis have been used as
a guide for policy makers and researchers in answering basic questions related to state or
regional problems (Hustedde et al. 2005). Shift share analysis, in particular, compared to the
other methods, is widely used by regional development practitioners, where data limitations are
minimal (Knudsen, 2000; Quintero, 2007). Furthermore, shift share analysis is important in
8
selecting and understanding the key leading sectors in a region, which needs developing local
industry partnership.
3. Methodology
Analyzing the factors affecting economic growth can be done using a variety of different
methods of analysis (Selting and Loveridge, 1992). Shift share analysis is a popular and simple
technique used in analyzing employment growth in a region over a specific period of time (Barff
and Knight III, 1988; Hoppes, 1991; Esteban, 2000; Knudsen, 2000; Wilson and Chern, 2005;
Herzog and Olsen, 2006). Shift share analysis decomposes total regional growth into three
distinct effects for better analyses of employment growth (Richardson, 1978). Moreover, it
focuses on comparing the regional employment growth to the national employment growth. The
three distinct effects are: (1) national growth effect (NGE), which is the part of the change in
total employment in a region ascribed to the rate of growth of employment at the national level;
(2) industrial mix effect (IME), which is the amount of change the region would have
experienced if each of its industrial sector had grown at the national rates, less the national
growth effect; and (3) competitive effect (CE), which is the difference between the actual
change in employment and the employment change to be expected, if each industrial sector
grows at the national rate. The sum of these three effects gives the actual change in total
employment within a region over a considered time period.
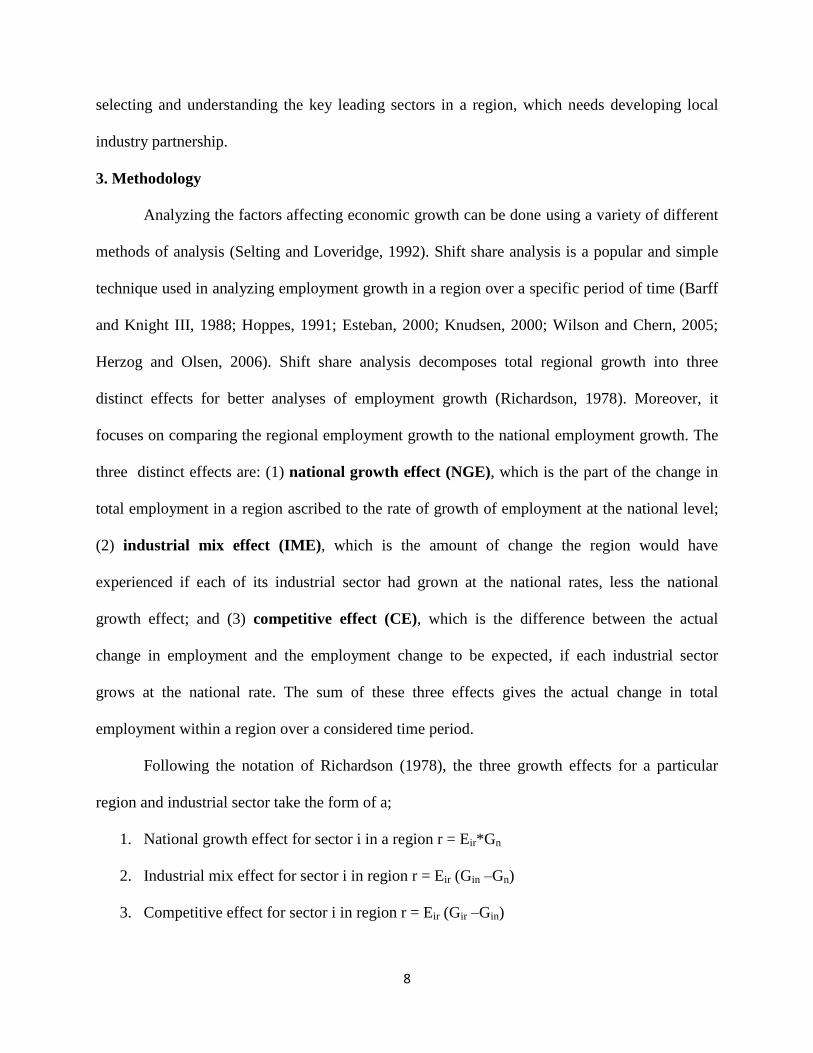
Following the notation of Richardson (1978), the three growth effects for a particular
region and industrial sector take the form of a;
1. National growth effect for sector i in a region r = Eir*Gn
2. Industrial mix effect for sector i in region r = Eir (Gin –Gn)
3. Competitive effect for sector i in region r = Eir (Gir –Gin)

9
Where,
Eir = employment in sector i in region r at the beginning of the time period
Gn = growth rate for total employment for the nation over the time period
Gin = growth rate in sector i for the nation for the time period
Gir = growth rate in sector i in region r for the time period
Comparative static and dynamic shift share analyses are commonly used approaches in the
literature. The use of comparative static approach that considers only the beginning and end
years of the time period, presents problems in measuring the industrial mix effect as it does not
take into account the changes overtime. Further, it does not account for the changes in the size of
the region‘s total employment over time, which leads to ‗compounding effect‘ (Barff and Knight
III, 1988; Harris et al, 1994). A dynamic shift share analysis can overcome these problems and
presents an appropriate analysis of the employment changes. A dynamic shift share approach
adjusts annually for changes in industrial mix, constantly updates the total regional employment,
and uses annual growth rates (Barff and Knight III, 1988). This makes it easy to present the
empirical results on an annual basis for any period of time. Adding annual results over the time
period is an effective way of summarizing and presenting accurate changes in employment
growth (Barff and Knight III, 1988; Harris et al, 1994; Wilson, 2005). Moreover, according to
Barff and Knight III, a dynamic shift share approach becomes important in the presence of large
changes in regional industrial mix or in the presence of major discrepancies between regional
and national growth rates.
This study is unique as it uses a dynamic shift share analysis to examine the employment
growth in West Virginia using employment data for 38 years from 1970 to 2007. Apart from the
analysis of total employment growth, the farm and nonfarm subsectors are independently and

10
closely examined to evaluate the growth impacts. Major employment subsectors of West
Virginia namely mining, manufacturing, and services are scrutinized separately to examine the
impacts which have not been adequately attempted before. The study examines the beneficial
subsectors for rapid economic growth with potential policy implications for investments in West
Virginia.
Types and Source of Data
As the study attempts to utilize a dynamic shift share analysis of employment growth in West
Virginia, a panel data set was considered for a period of 38 years (1970 to 2007) based on the
data availability. Two sets of data were selected, one for employment growth in West Virginia
and the other for national employment growth in the United States. U.S. Bureau of Labor
Statistics and U.S. Bureau of Census were the main sources of data. As the focus was on
examining the growth of various sectors of West Virginia, the data collected on total
employment was categorized into two main sectors, farm employment and nonfarm employment.
Nonfarm employment was further divided into nine subsectors (1) mining, (2) construction, (3)
manufacturing, (4) wholesale and retail trade, (5) transportation and public utilities, (6) finance,
insurance and real estate, (7) services (8) government and (9) agricultural services, forestry
fishing and others. Further, the change in unemployment was examined to conduct a comparative
analysis with the change in employment.
4. Results
The total civilian labor force in the United States was 82.8 million in 1970 and increased
by 62 percent to153 million in year 2007. In West Virginia, labor force increased by 21 percent
from 0.79 million in 1975 to 0.97 million in 2007 (Bureau of Labor Statistics). The national
unemployment rate decreased from 5.9 percent to 4.6 percent during the38-year period, with an
11
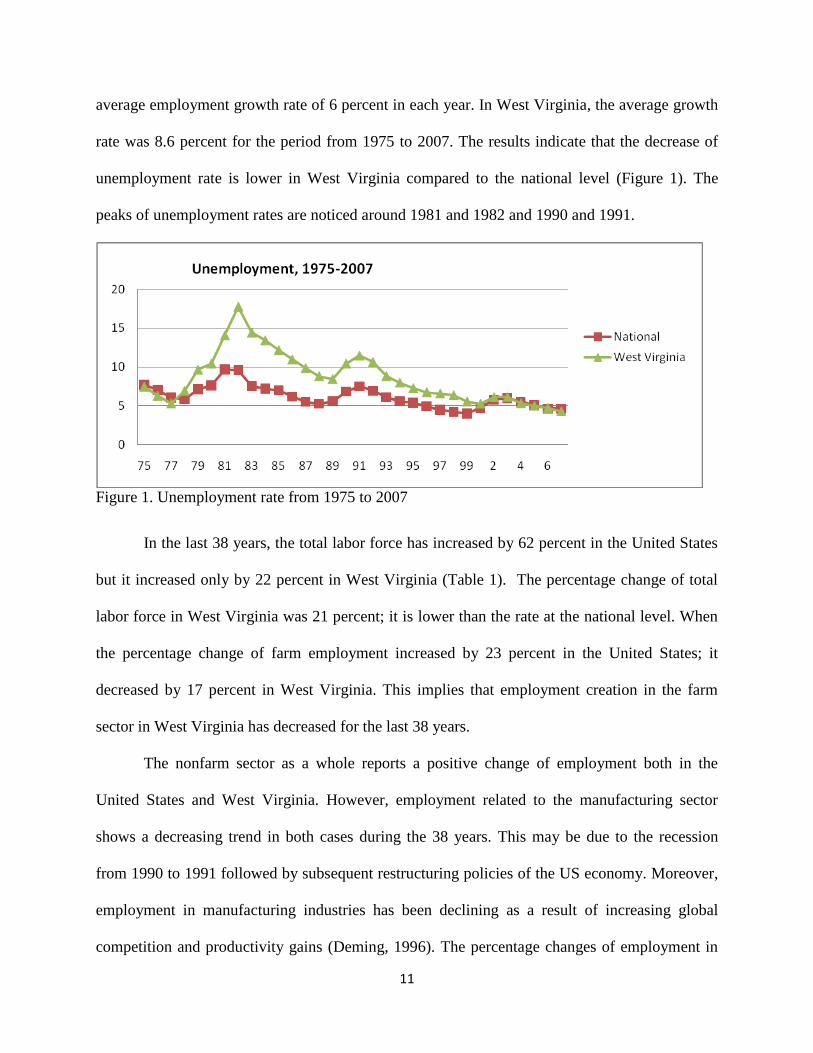
average employment growth rate of 6 percent in each year. In West Virginia, the average growth
rate was 8.6 percent for the period from 1975 to 2007. The results indicate that the decrease of
unemployment rate is lower in West Virginia compared to the national level (Figure 1). The
peaks of unemployment rates are noticed around 1981 and 1982 and 1990 and 1991.
Figure 1. Unemployment rate from 1975 to 2007
In the last 38 years, the total labor force has increased by 62 percent in the United States
but it increased only by 22 percent in West Virginia (Table 1). The percentage change of total
labor force in West Virginia was 21 percent; it is lower than the rate at the national level. When
the percentage change of farm employment increased by 23 percent in the United States; it
decreased by 17 percent in West Virginia. This implies that employment creation in the farm
sector in West Virginia has decreased for the last 38 years.
The nonfarm sector as a whole reports a positive change of employment both in the
United States and West Virginia. However, employment related to the manufacturing sector
shows a decreasing trend in both cases during the 38 years. This may be due to the recession
from 1990 to 1991 followed by subsequent restructuring policies of the US economy. Moreover,
employment in manufacturing industries has been declining as a result of increasing global
competition and productivity gains (Deming, 1996). The percentage changes of employment in
12
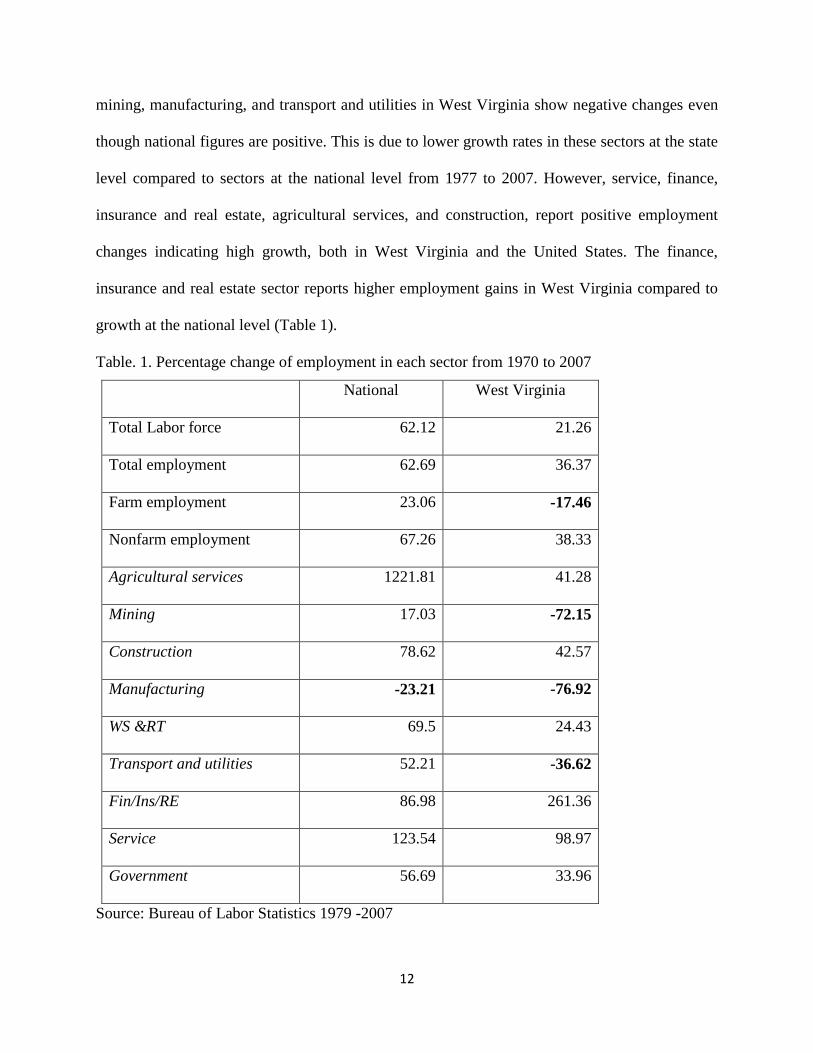
mining, manufacturing, and transport and utilities in West Virginia show negative changes even
though national figures are positive. This is due to lower growth rates in these sectors at the state
level compared to sectors at the national level from 1977 to 2007. However, service, finance,
insurance and real estate, agricultural services, and construction, report positive employment
changes indicating high growth, both in West Virginia and the United States. The finance,
insurance and real estate sector reports higher employment gains in West Virginia compared to
growth at the national level (Table 1).
Table. 1. Percentage change of employment in each sector from 1970 to 2007
National West Virginia
Total Labor force 62.12 21.26
Total employment 62.69 36.37
Farm employment 23.06 -17.46
Nonfarm employment 67.26 38.33
Agricultural services 1221.81 41.28
Mining 17.03 -72.15
Construction 78.62 42.57
Manufacturing -23.21 -76.92
WS &RT 69.5 24.43
Transport and utilities 52.21 -36.62
Fin/Ins/RE 86.98 261.36
Service 123.54 98.97
Government 56.69 33.96
Source: Bureau of Labor Statistics 1979 -2007
13
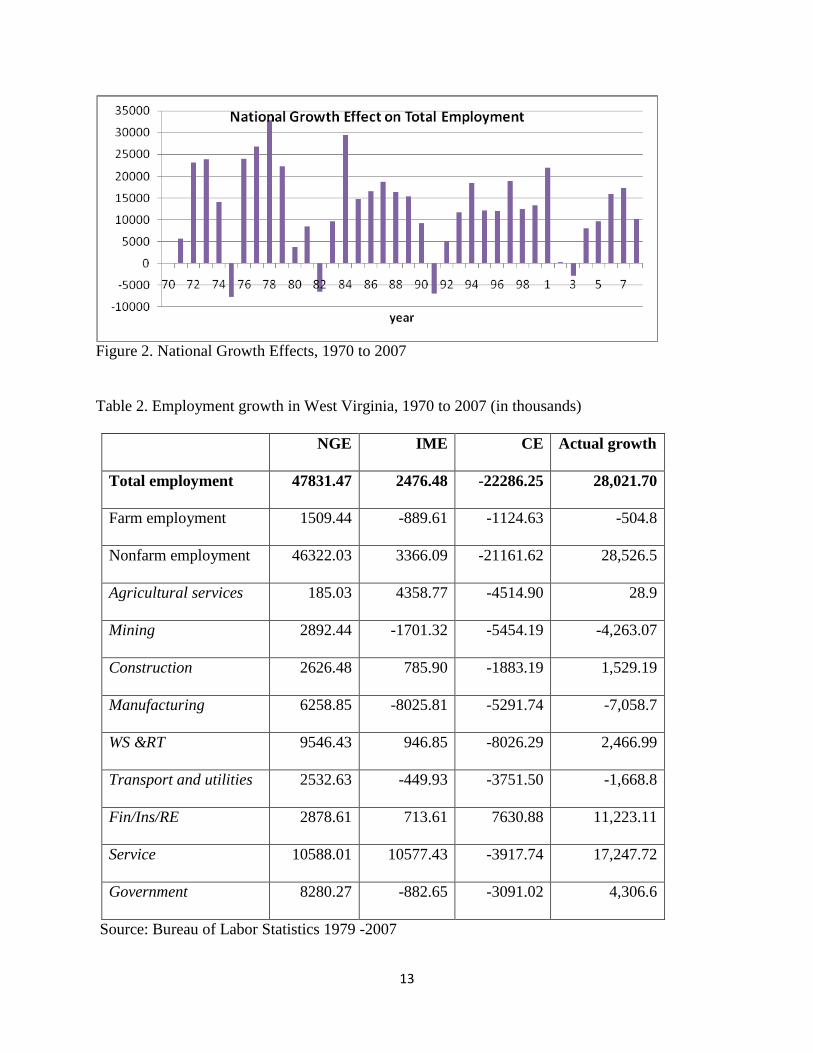
Figure 2. National Growth Effects, 1970 to 2007
Table 2. Employment growth in West Virginia, 1970 to 2007 (in thousands)
NGE IME CE Actual growth
Total employment 47831.47 2476.48 -22286.25 28,021.70
Farm employment 1509.44 -889.61 -1124.63 -504.8
Nonfarm employment 46322.03 3366.09 -21161.62 28,526.5
Agricultural services 185.03 4358.77 -4514.90 28.9
Mining 2892.44 -1701.32 -5454.19 -4,263.07
Construction 2626.48 785.90 -1883.19 1,529.19
Manufacturing 6258.85 -8025.81 -5291.74 -7,058.7
WS &RT 9546.43 946.85 -8026.29 2,466.99
Transport and utilities 2532.63 -449.93 -3751.50 -1,668.8
Fin/Ins/RE 2878.61 713.61 7630.88 11,223.11
Service 10588.01 10577.43 -3917.74 17,247.72
Government 8280.27 -882.65 -3091.02 4,306.6
Source: Bureau of Labor Statistics 1979 -2007

14
The national growth effect (NGE) shows employment growth that would have occurred if
a sector in a regional or local economy had grown at the same rate as the national economy.
Regarding West Virginia, national growth effect in all sectors is positive (Table 2). The nonfarm
employment sector shows a higher contribution for total employment growth compared to the
farm employment sector. Service, wholesale and retail, and the government subsectors of
nonfarm employment sector show significant impact on national growth effect of the nonfarm
sector. Thus, if the same rate of national growth has occurred, the change in employment would
be higher in those subsectors in West Virginia. Figure 2 shows a slightly decreasing trend of
national growth effect on total employment in West Virginia from 1970 to 2007. The national
growth effect associated with a negative sign during national recessions.
The industrial mix effect (IME) measures the amount of local or regional employment
sector growth compared to the national employment growth. It can be used in identifying the fast
or slow growing sectors or industries in an economy. A positive industrial mix effect in a
particular local employment sector indicates that it is growing faster than the national economy.
If the industrial mix effect is negative, that sector is growing at a slower rate compared to the
national economy. In this study, the farm employment sector shows a negative industrial mix
effect indicating a slower growth rate compared to the national employment growth while the
nonfarm sector exhibits a positive industrial mix effect indicating a faster growth of the sector.
However, the subsectors of mining, transport and utilities, manufacturing and government show
negative industrial mix effects, indicating that employment in these sectors at the state level is
part of relatively slow-growing national sectors (Table 2). The positive industrial mix effects of
the sub-sectors of construction, finance insurance and real estate, wholesale and retail, and
service (which includes the services of business, health, engineering, management, professional

15
services, hotels, and personal services) show employment in these sectors at the state level is
growing faster than employment at the national levels. The results indicate that the subsectors of
construction, finance insurance and real estate, wholesale and retail, and service have been
playing a major role in employment growth in West Virginia from 1970 to 2007 as shown in
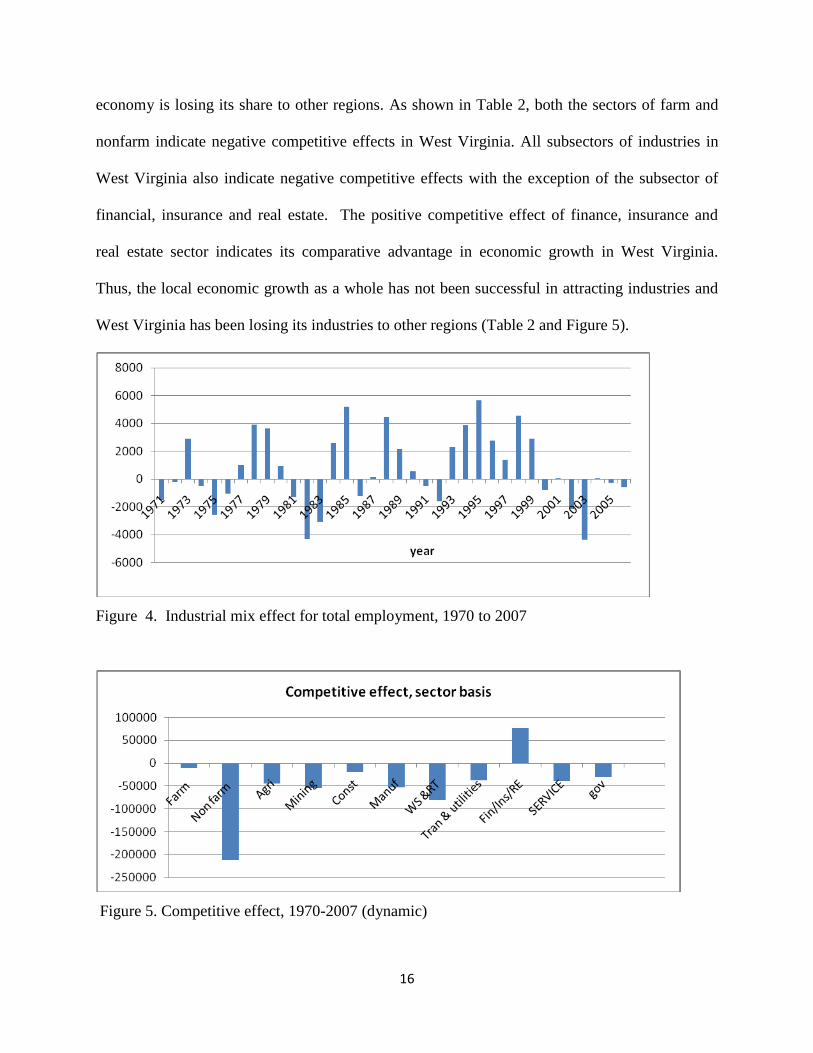
Figure 3. Figure 4 shows the change of industrial mix effect for total employment from 1970 to
2007, which was calculated by adding each sectors‘ industrial mix effect. It shows some negative
values in certain periods especially in some years in 1970‘s, early 1980‘s and in 2000‘s. This
may be as a result of the recessions of the national economy in those periods. The industrial mix
effect for the total employment sector also indicates a negative value for the period of 1999 to
2007, showing that the growth of total economy is slower than the overall U.S economy.
Figure. 3. Sector level industrial mix effects, 1970 to 2007
The competitive position effect (CPE) measures how a particular sector is growing in an area
compared to growth of the same sector at the national level. A positive effect means that the
local economy has been successful in attracting investment to a particular sector. Moreover,
positive competitive effect indicates the comparative advantage for a region in a particular
sector. A positive local share combined with a positive industrial mix effect show a potential
competitive advantage in that sector. A negative competitive effect indicates that the local
16
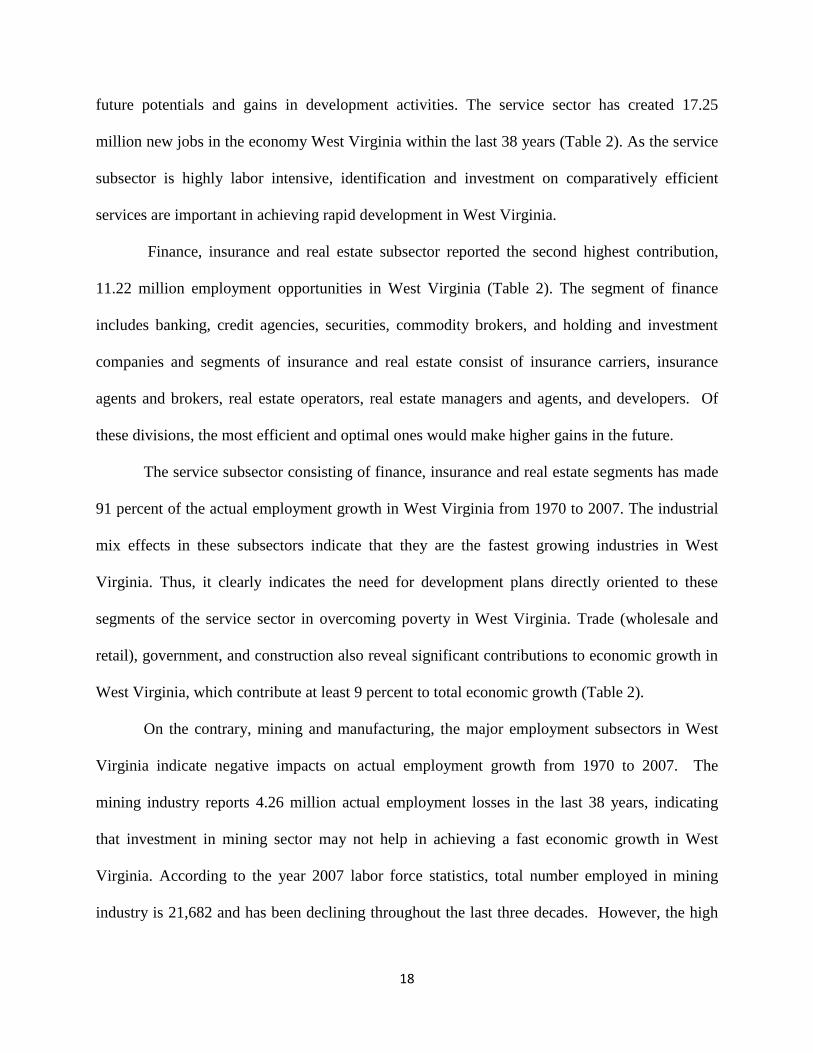
economy is losing its share to other regions. As shown in Table 2, both the sectors of farm and
nonfarm indicate negative competitive effects in West Virginia. All subsectors of industries in
West Virginia also indicate negative competitive effects with the exception of the subsector of
financial, insurance and real estate. The positive competitive effect of finance, insurance and
real estate sector indicates its comparative advantage in economic growth in West Virginia.
Thus, the local economic growth as a whole has not been successful in attracting industries and
West Virginia has been losing its industries to other regions (Table 2 and Figure 5).
Figure 4. Industrial mix effect for total employment, 1970 to 2007
Figure 5. Competitive effect, 1970-2007 (dynamic)
17
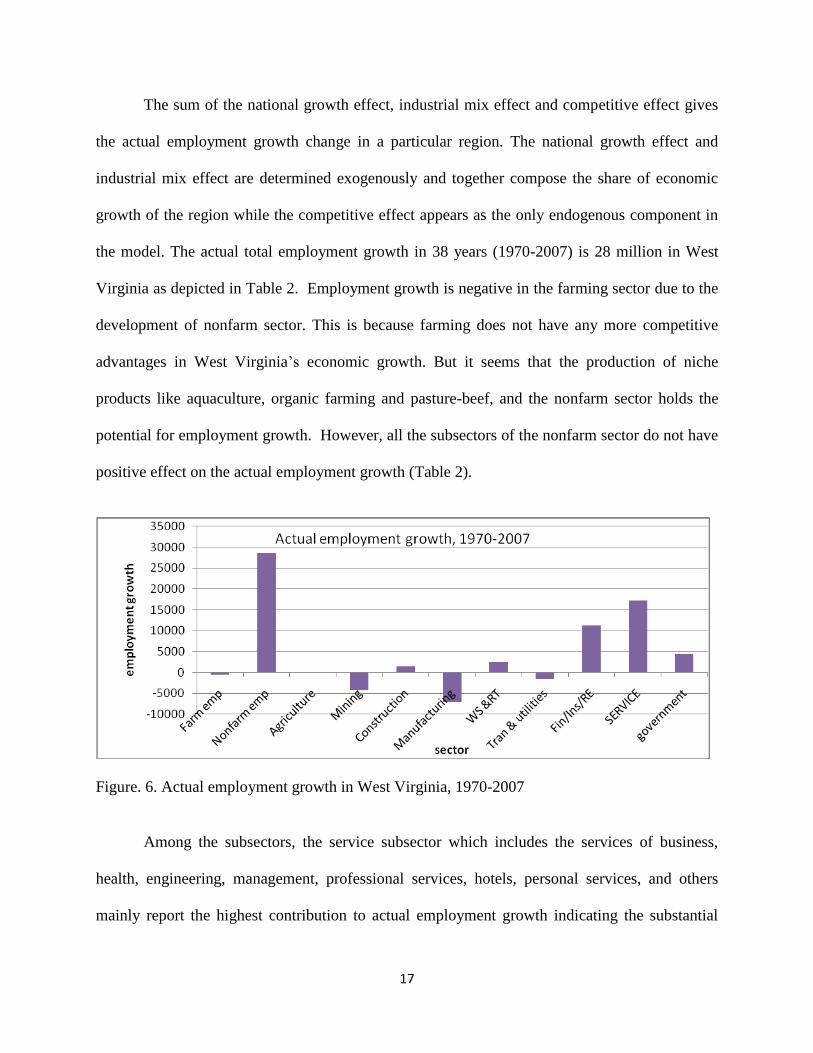
The sum of the national growth effect, industrial mix effect and competitive effect gives
the actual employment growth change in a particular region. The national growth effect and
industrial mix effect are determined exogenously and together compose the share of economic
growth of the region while the competitive effect appears as the only endogenous component in
the model. The actual total employment growth in 38 years (1970-2007) is 28 million in West
Virginia as depicted in Table 2. Employment growth is negative in the farming sector due to the
development of nonfarm sector. This is because farming does not have any more competitive
advantages in West Virginia‘s economic growth. But it seems that the production of niche
products like aquaculture, organic farming and pasture-beef, and the nonfarm sector holds the
potential for employment growth. However, all the subsectors of the nonfarm sector do not have
positive effect on the actual employment growth (Table 2).
Figure. 6. Actual employment growth in West Virginia, 1970-2007
Among the subsectors, the service subsector which includes the services of business,
health, engineering, management, professional services, hotels, personal services, and others
mainly report the highest contribution to actual employment growth indicating the substantial
18
future potentials and gains in development activities. The service sector has created 17.25
million new jobs in the economy West Virginia within the last 38 years (Table 2). As the service
subsector is highly labor intensive, identification and investment on comparatively efficient
services are important in achieving rapid development in West Virginia.
Finance, insurance and real estate subsector reported the second highest contribution,
11.22 million employment opportunities in West Virginia (Table 2). The segment of finance
includes banking, credit agencies, securities, commodity brokers, and holding and investment
companies and segments of insurance and real estate consist of insurance carriers, insurance
agents and brokers, real estate operators, real estate managers and agents, and developers. Of
these divisions, the most efficient and optimal ones would make higher gains in the future.
The service subsector consisting of finance, insurance and real estate segments has made
91 percent of the actual employment growth in West Virginia from 1970 to 2007. The industrial
mix effects in these subsectors indicate that they are the fastest growing industries in West
Virginia. Thus, it clearly indicates the need for development plans directly oriented to these
segments of the service sector in overcoming poverty in West Virginia. Trade (wholesale and
retail), government, and construction also reveal significant contributions to economic growth in
West Virginia, which contribute at least 9 percent to total economic growth (Table 2).
On the contrary, mining and manufacturing, the major employment subsectors in West
Virginia indicate negative impacts on actual employment growth from 1970 to 2007. The
mining industry reports 4.26 million actual employment losses in the last 38 years, indicating
that investment in mining sector may not help in achieving a fast economic growth in West
Virginia. According to the year 2007 labor force statistics, total number employed in mining
industry is 21,682 and has been declining throughout the last three decades. However, the high
19
cost associated with environmental and health cost of mining hinders further investment,
especially in coal mining. Nevertheless, 99 percent of the electricity supply of the state is
generated by the coal industry in West Virginia (Union of concerned scientists, 2009).
Metal, chemical, plastic, wood products, aluminum, automobile and many others are
included in the manufacturing subsector of West Virginia. Even though some of these industries
like automobile, plastic wood products are thriving (Department of Commerce, WV, 2010);
manufacturing sector reports a total of 7.06 million employment losses from 1970 to 2007 as
shown in Table 2. At present, the manufacturing subsector supplies only 6 percent of the
employment opportunities in West Virginia (Labor Statistics, 2010). The declining employment
trend in the last two to three decades indicates that manufacturing is no longer the major driver
for development of the state.
According to Federal statistics (WV Department of Commerce, 2010), 97 percent of state
investments are small businesses which play a major role in the economy of West Virginia.
Within the prevailing policies on new investments in West Virginia, financial supports, tax
credits, research and technical support and other data based facilities are given by the state to
investors. Enhancing these supports with the identified, competitive growth sectors, namely
service and finance, real estate, and insurance can yield high economic gains. For instance, since
2005, West Virginia has made more than $12.4 billion worth of new business investments in the
state‘s economy (Department of Commerce, WV, 2010) and not all of them were in the
competitive growth sectors. If those investments had been made in the competitive sectors only,
present employment gains would have been much higher than what they are today.
5. Conclusion and Policy Implications
The dynamic version of shift share analysis eliminates some of the problems associated
with the traditional comparative static approach and provides a more accurate allocation of
20
employment change among the three shift share effects. The empirical estimation on an annual
basis also allows an unlimited time period and years of economic transition to be properly
identified. However, the magnitude of the difference in results produced by dynamic and static
approaches depends on the magnitudes of changes in the industrial mix and on the amount of
difference in growth rates for total employment for the region versus the nation. Shift share
analysis is mostly applied to employment changes at much lower levels of aggregation, where
the potentials for significant change in industrial mix or having growth rates much different from
the nation is much greater. Therefore, the technique is appropriate in measuring the economic
effect in West Virginia. Moreover, the use of dynamic approach is thus especially important to
relatively small economic sectors and can be utilized for analysis of a long period of time.
The dynamic shift share analysis in West Virginia provides interesting insights of
employment changes in various sectors which provides better investment planning for economic
development of the region. In general, the actual total employment growth is positive and has a
lower percentage change compared to the rate at the national level. This provides insights about
the lower growth rate of the state and the need for better policy options.
Employment growth of the farm sector has declined in the last 38 years, even though 50
percent of the state farmers consider farming as their primary occupation. Thus, agriculture is no
longer the backbone of the economy of West Virginia and the future expectation in economic
growth in farming is minimal. However, reconsideration of economically efficient agricultural
policies that supports state farmers would be imperative as the majority of the state population is
low-income small-scale farmers.
The nonfarm sector plays a major role of promoting actual economic growth in West
Virginia. Significant positive changes are seen in the subsectors of trade, finance, insurance and
21
real estate and services. Services, and finance, insurance and real estate are the most important
fast growing employment subsectors. Policy programs to invest more in these subsectors would
make higher gains than any other sectors. Thus, policy development and investments targeting
those sectors, with adequate facilities would boost the economic growth of the state which would
attract giant investors in the long run.
The presence of negative competitive effects in many subsectors indicates the loss of
shares to other economies. Even though, mining and manufacturing are two major industries in
the economy of West Virginia, significant employment declines suggest that further dependency
in these sectors would jeopardize the state‘s economy. Considerable attention on revitalization of
these industries is essential to future costs and loss of revenues. In particular, issues of the
environmental pollution should be addressed and mitigated with increased awareness of
sustainable development.
The main implication of the findings is that agriculture, manufacturing and mining which
are considered as the major sectors are no longer the major contributors of economic growth in
West Virginia. Instead services, finance, insurance and real estate, wholesale and retail, and
sometimes construction sectors play a significant role in the economic development of the states.
Identification of investment priorities with these potential industries and implementation of a
comprehensive regional development policy, and public private partnership would definitely
enhance the future development of West Virginia.

22
References
1. Andrikopoulos A., J.A. Brox, and E. Carvalho, 1987. ―A Further Test of the Competitive
Effect in Shift-Share Analysis,‖ The Review of Regional Studies 17: 23-30.
2. _____, 1990. ―Shift-Share Analysis and the Potential for Predicting Regional Growth
Patterns: Some Evidence for the Region of Quebec, Canada,‖ Growth and Change 21: 1-
10.
3. Ashby, L.D., 1968. ―The Shift and Share Analysis: A Reply,‖ Southern Economic Journal
34: 423-25.
4. Barff, Richard A. and Prentice L. Knight III. 1988. ―Dynamic Shift Share Analysis‖.
Growth and Change19 (2):1-10.
5. Bartik, T. J. 2004. ―Economic Development‖ in J. Richard Aronson and Eli Schwartz,
eds.,, Management Policies in Local Government Finance (5th
ed.): 355-395
6. Deming, W.G.1996. ―Decade of economic change and population shifts in U.S. regions.‖
Regional Economic Changes. Monthly Labor Review 3.
7. Dunn, E.S.1960 ―A statistical and analytical technique for regional analysis, ‖Papers of
the Regional science association 6: 97-112
8. Esteban, J. 2000. ―Regional convergence in Europe and the industry mix: a shift-share
analysis‖ Regional Science and Urban Economics 30 (3): 353-364.
9. Fernandez, M. M. and Menendez, A. J. L. 2005. ―Spatial Shift Share Analysis: new
development and new findings for the Spanish case.‖ 45th
congress of the European
Regional Science Association.
10. Fothergill, S. and G. Gudgin, 1979. ―In Defense of Shift-Share,‖ Urban Studies 17: 193-
210
11. Gebremedhin, T. W. and Daniel A. Lass. 1995 ―A Shift-share analysis of employment
growth in West Virginia and Massachusetts.‖ Paper presented at the Northeastern
Agricultural and Resource Economics Association annual meeting, Vermont, June 18-20.
12. Harris, T.R., C.B. Gillberg., R. Narayan., J.S. Shonkwiler and D.K. Lambert. 1994. ―A
Dynamic Shift Share Analysis in Nevada Economy.‖ Technical Report, UCED.
13. Hoppes, R.B. 1991. ‗Regional versus Industrial Shift-Share Analysis—With Help from
the Lotus Spreadsheet.‖ Economic Development Quarterly 5:258-267
14. _________. 1997.‖Shift –Share analysis for regional health care policy.‖ The Journal of
Regional Analysis and Policy, 27 (1): 35-45
15. Hustedde, Ronald, Shaffer, Ron, and Glen Pulver. 2005. Community economic analysis: A
how to manual. Ames: Iowa State University Printing Services.
16. Ireland, T.C. and R.L. Moomaw, 1981. ―The Competitive Effect in Shift-Share Analysis:
A Will of the Wisp?‖ The Review of Regional Studies 11: 72-82.
17. Knudsen, Daneil C. 2000. ―Shift Share Analysis: further examination of models for the
description of economic change.‖ Socio-Economic Planning Sciences 34:17-198.
18. Markusen, A.R., H. Noponen, and K. Driessen. 1991. ―International Trade, Productivity,
and U.S. Regional Job Growth: A Shift-Share Interpretation,‖ International Regional
Science Review 14(1): 15-39.
19. McDonough, C.C. and B.S. Sihag, 1991. ―The Incorporation of Multiple Bases into Shift-
Share Analysis,‖ Growth and Change 22(1), 1-9.
20. McNamara K. T. 1991. ―Employment Growth in Indiana: A State and Regional Analysis.‖
Purdue University Corporative Extension Service, EC 660.

23
21. Melachroinos, K.A., 2002. ―European Integration and the Spatial Dynamics of
Manufacturing-Employment Change,‖ Environment and Planning A 34(11), 2017-36.
22. Quintero, J.P.(2007).Regional Economic Development: ―An Economic Base Study and
Shift-Share Analysis of Hays County‖, Texas State University-San Marcos, Dept. of
Political Science, Public Administration
23. Selting, Anne C. and Scott Loveridge. 1990. ―Testing Dynamic Shift share.‖ www.Jrap-
journal.org 24:23-41
24. Shi, C and Y. Yang . 2008. ―Review of Shift Share Analysis and Its Application in
Tourism,‖ International Journal of Management Perspectives ISSN:1307-1629, I(1) 21-
30
25. Shi, C., Z. Jie., Y. Yang and Z. Zhang. 2007. ―Shift share analysi on international tourism
competitiveness: A case of Jiansu Province.‖ Chinese Geographical Science 17(2): 173-
178
26. Sirakaya, E. Uysal, M. and Toepper, L.1999. ―Measuring tourism performances using
shift share analysis: the case of South-Carolina‖. Journal of Travel Research 34 (2): 55-
62.
27. U.S. Department of Commerce, Bureau of Census (2008). Statistical Abstracts of the
United States. Washington D.C.
28. www.wvcommerce.org/business/businessassistance/smallbusiness/default.aspx, 2010,
West Virginia Department of Commerce, Charleston, WV 25305-0311
29. Wilson, Peter and Ting Su Chern. 2005. ―A Dynamic Shift Share Analysis of the
Electronics Export Market 1988-2001: Can the NIEs Compete with China? Department of
Economics, SCAPE Working Paper Series, Paper No. 2005/07-May2005.
http/nt2.fas.nus.edu.sg/es/pub/wp-scape/0507.pdf.