a discussion of measurement of uncertainty for life
TRANSCRIPT

The Association of Public Health Laboratories (APHL) sponsors educational programs on critical issues in laboratory science.
For more information, visit www.aphl.org/courses
Webinar
A Discussion of Measurement of Uncertainty for Life Science Laboratories 12/3/2015
Speakers Roger M. Brauninger, Biosafety Program Manager, A2LA (American Association for Laboratory Accreditation), Frederick, Maryland
Roger M. Brauninger, Biosafety Program Manager has been employed with the American Association for Laboratory Accreditation since February 1999. He provides assistance in the day-to-day laboratory accreditation operations for laboratories in the Environmental, Biological, and Chemical fields and Reference Material Producers and serves as staff contact to organizations dealing with food and drug safety, biodefense and threat monitoring in the Biological and Chemical fields. Objectives At the conclusion of this program, participants will be able to:
Identify the types of analytical methods which require an estimate of measurement uncertainty Discuss ways the laboratory can use commonly collected laboratory data to calculate an acceptable
estimate of uncertainty and when it needs to be recalculated Continuing Education Credit CE credit is not available for this program, but you will receive a Certificate of Attendance. Evaluation/Certificate of Attendance Process Continuing education credit is not available for this program. Individuals who successfully complete the program and evaluation by 10/20/2016 will receive a Certificate of Attendance. Go to https://www.surveymonkey.com/r/100-0:00-15jr to complete the evaluation.
1. After you complete the evaluation, you will automatically receive the Certificate of Attendance. 2. Type or print your name on the certificate.
Archived Program The archived streaming video will be available within two days. Anyone from your site can register view the program. URL: http://eventcenter.commpartners.com/se/Meetings/Playback.aspx?meeting.id=598436 Comments, opinions, and evaluations expressed in this program do not constitute endorsement by APHL. The APHL does not authorize any program faculty to express personal opinion or evaluation as the position of APHL. The use of trade names and commercial sources is for identification only and does not imply endorsement by the program sponsors. © This program is copyright protected by the speaker(s) and APHL. The material is to be used for this APHL program only. It is strictly forbidden to record the program or use any part of the material without permission from the author or APHL. Any unauthorized use of the written material or broadcasting, public performance, copying or re-recording constitutes an infringement of copyright laws.
ACKNOWLEDGEMENT These webinars are supported by a Cooperative Agreement funded by FDA, through which APHL, AFDO and AAFCO are working to build an Integrated Laboratory System to Advance the Safety of Food and Animal Feed.
For more information about ISO/IEC 17025 Accreditation go to: http://www.aphl.org/aphlprograms/food/laboratory-accrediation/pages/default.aspx
This project was 100% funded with federal funds from a federal program of $1,100,000.

11/30/2015
1
Simple Measurement Uncertainty:
Roger Brauninger American Association for Laboratory
Accreditation Frederick, Maryland
2
Topics• Why do we need to determine MU?
• When do we need to recalculate?
• How large is too large?
• How do we calculate MU?• RSS• LCS• Replicates and MPN
3
Measurement uncertainty
• Helps determine the quality of the testing.• Measurable basis to determine improvements. • Estimates variability of testing over time:
• materials, • equipment, • environment, and people;
• Tells the range of values that are about equally likely to appear as the result of the same measurement procedure on a particular sample.

11/30/2015
2
4
ISO/IEC 17025
• 5.4.6.2 Testing laboratories shall have and shall apply procedures for estimating uncertainty of measurement. Reasonable estimation shall be based on knowledge of
the performance of the method and… Shall make use of, for example, previous experience and
validation data.
5
A Few Terms…
• Variance: Average of the squared differences from the Mean.
• Standard Deviation (SD): Square root of the Variance.• Relative Standard Deviation (RSD): SD divided by the Mean
x 100)• Standard Uncertainty (u): Total of the combined uncertainty
contributors (or the single contributor, if there is only one component).
• Expanded Uncertainty (U): Combined uncertainty contributors (or the single contributor, if there is only one component), multiplied by the coverage factor (k) @ 95% confidence interval, assuming normal distribution.
6
Students t test
coverage factor (k)=

11/30/2015
3
7
Measurement uncertainty’s Essence:• There are two major factors to consider
• Repeatability describes the variability of results when doing the testing sequentially; time after time under the same conditions.
• Reproducibility describes the variability across different testing conditions; changes in time, personnel, environment, and equipment.
• Both must be considered to get accurate picture of process variability.
8
• Variation in method performance• Different analysts• Sampling effects• Different weighing/pipetting
techniques• Differences in platting techniques• Background Effects
Sources of Measurement Uncertainty:
9
Sources of Measurement Uncertainty: ofmicrobiologicaltestmethods?
• Variation in controls/RM• Storage Conditions• Sample or Matrix Effects
• Living positive/process control• Unable to count the CFU directly• Unable to determine viable CFU directly
• Different sources of CRMs/RMs• Purity differences• Uncertainties differ

11/30/2015
4
10
Sources of Measurement Uncertainty:
• Variation in media/reagents/equipment• Each batch of media prepared
• Different technician, • Different lot # of media,• Different autoclave cycle
• Each reagent solution preparation• Reagent Purity
• Variation in equipment• Sensitivity• LOD• Detectors
11
Sources of Measurement Uncertainty ofmicrobiologicaltestmethods?
• Variation in incubation conditions• Method allows range in incubation time• Method allows range in incubation
temperature• Extractions times, solvents, temps,
matrices• Organisms are unpredictable!
12
• When something in the process changes•New analyst(s)•New equipment•New method for testing or for
preparing control•New Reagents/ Positive controls
• Annually?
When to Consider Recalculating MU?

11/30/2015
5
13
How large an MU estimate is too large?
Ask yourself if it is…• Acceptable to the lab if need to
report?• Acceptable to the customer/regulator
if need to report?• Reflective of laboratory capability?
14
A few Measurement uncertaintyestimation variations….
• Root Sum Squared Method
• LCS (e.g., SD x k )Method
• Using Data Generated From Replicates and Most Probable Number (MPN) Method
15
Root Sum Squared Method

11/30/2015
6
16
Root Sum Squared Method: Microbiology
• Lab Control data: SD[or RSD*] x k Methods • Values obtained for RSS must be in the same unit• The formula requires the data to be linear.• But microbiological data is logarithmic • Therefore MUST convert to base 10 (or natural base)`
• *NOTE: Because it is not relative to the concentration of the sample, when using SD of data sets, the uncertainty value is added/ subtracted., thus it would be the same across all concentrations for that method.
• When using RSD of data sets, the uncertainty value is multiplied, as the value is being compared and is relative to the data produced.
17
Root Sum Squared Method
•A Hypothetical Example:• a = uncertainty due to analyst (5%)• b = uncertainty due to equipment (1%)• c = uncertainty due to media prep
(4%)• n = the rest (<1%)
18
Hypothetical example usingRoot Sum Squared Method
• Root Sum Squared Method• “Bottoms Up” approach• Must Identify all contributors• Must assign a value
u = √

11/30/2015
7
19
Hypothetical example usingRoot Sum Squared Method
• u = √(0.05)2 + (0.01)2 + (0.04)2 + (0.01)2
• u = √0.0025 + 0.0001 + 0.0016 + 0.0001
• u = 0.066
• Ue = 2 x 0.066 = 0.132 = 13.2%
20
e.g., count of 120 CFU• Step 1 – Transform the CFU value to log10 value. (e.g., 120 CFU = 2.0792 (log10))• Step 2 – Calculate the SD of the log10 values. SD= 0.066. • Step 3 –Apply the coverage factor (95%, k=2) to the SD to obtain the relative Ue.
(e.g., rUe = 0.0.132 or 13.2%).• Step 4 –The log value is multiplied by rUe (e.g., Ue= 2.0792 x 0.132 = 0.2724) • Step 5 – The Ue is added and subtracted from the log value.
(e.g., (2.0792 – 0.2724) = 1.8068 and (2.0792 + 0.2724) = 2.3516• Step 6 - Convert the log value for the sample measurement back to CFU for the
reported result. This is accomplished by taking the anti-log of each of the endpoints of the interval (anti-log of x = 10x). (e.g., 101.8068 = 64.1 = 64 CFU and 102.3516 = 224.7 = 225 CFU)
• Uncertainty interval = 64 – 225 CFU
21
LCS Data(e.g., SD x k Method)

11/30/2015
8
22
Chemical: Aflatoxin exampleValues of method from the spiked recoveries of the aflatoxin results were plotted
on control charts and the standard deviations then determined
Sample Alfatoxin (ppb) Statistics
1 10 Mean 11.11538
2 12 SD 1.142871
3 10 RSD 10.08222
4 10 MU (SD x k) 2.285742
5 10 MU (RSD x k) 20.56377%6 10
7 10
8 10
9 10
10 10
11 10
12 12
13 12
14 10
15 10
16 12
17 12
18 12
19 12
20 12
21 13
22 13
23 11
24 11
25 12
26 13
23
Laboratory Control Data with Same Target Value(e.g.,100CFU)
Raw Data (actual CFU recovered)
Log10 Value
X= 1.8860
Difference from Mean(Log10 Value)
Difference SquaredVAR=0.1121SD= 0.3348
131 2.1173 0.2313 0.053569 1.8388 -0.0472 0.002245 1.6532 -0.2328 0.054240 1.6021 -0.2839 0.080631 1.4914 -0.3946 0.155733 1.5185 -0.3675 0.135131 1.4914 -0.3946 0.155737 1.5682 -0.3178 0.1010
186 2.2695 0.3835 0.1471218 2.3385 0.4525 0.2048200 2.3010 0.415 0.172239 1.5911 -0.2949 0.0870217 2.3365 0.4505 0.2030119 2.0755 0.1895 0.035928 1.4472 -0.4388 0.1925
106 2.0253 0.1393 0.0194107 2.0294 0.1434 0.020645 1.6532 -0.2328 0.054298 1.9912 0.1052 0.0111
240 2.3802 0.4942 0.2442
24
Microbial Laboratory Control Data Using the Standard Deviation (SD)
• Step 1 – Transform the CFU values to log10 value.
• Step 2 – Calculate the SD of the log10 values.
SD= 0.3348.
• Step 3 –Apply the coverage factor (95%, k=2) to the SD to obtain Ue. The Ue in this example is 0.6696.
If using the student t-tables, with n=20 (19 degrees of freedom), the coverage factor k would be 2.09, which would provide an expanded uncertainty of 0.6998.

11/30/2015
9
25
Microbial Laboratory Control DataUsing the Standard Deviation
• Step 4 – To calculate the uncertainty for any subsequent laboratory result using SD x k, the result is first converted to log base 10 value (log10), and the expanded uncertainty of 0.6696 is added and subtracted from the log value.
• Step 5 - Convert the log value for the sample measurement back to CFU for the reported result. This is accomplished by taking the anti-log of each of the endpoints of the interval (anti-log of x = 10x).
For example, estimating the uncertainty using SD x k for a result of 150 CFU: 150 in log10 = 2.1761. Adding and subtracting 0.6696 from 2.1761 gives an interval from 1.5065 to 2.8457; transforming back to counts: 101.5065 =32.10, and 102.8457 =700.97. Therefore the uncertainty interval is 32 to 701 CFU.
26
Microbial Laboratory Control DataUsing the Relative Standard Deviation
• Step 1 – Transform the CFU values to log10.
• Step 2 – Calculate the mean and relative standard deviation (RSD) of the log10 values. The percentage SD (or relative SD), in log units: 0.3348/1.8860 = 0.1775, or 17.8%;
• Step 3 – Apply the coverage factor to the RSD to obtain the relative expanded uncertainty. For 95% coverage we use a coverage factor of k=2.
The relative expanded uncertainty is thus 2 x 0.1775=0.3550, or 35.5%.
Note: If using the student t-tables, with n=20 (19 degrees of freedom), the coverage factor k would be 2.09, which would provide an relative expanded uncertainty of 0.3710 or 37.10%.
27
Microbial Laboratory Control DataUsing the Relative Standard Deviation
• Step 4 – To estimate MU for any subsequent laboratory result using RSD x k: The result is first converted to the log10 value, Multiplied by 0.355 (35.5% converted to decimal) and The expanded uncertainty is added and subtracted from the
log value.• Step 5 – To obtain CFU for the reported result Convert the log value for the sample measurement back. by
taking the anti-log of each of the endpoints of the interval (anti-log of x = 10x).

11/30/2015
10
28
Microbial Laboratory Control DataUsing the Relative Standard Deviation
• For estimating MU using RSD x k for a result of 150 CFU: 150 in log10 = 2.1761 and the relative expanded uncertainty in
log counts is 2.1761 x 0.355 = 0.7725. Add and subtract from 2.1761 gives an interval from 1.4036 to
2.9486; • Transform back to counts: 101.4036 =25.33, and 102.9486 =
888.41.
Therefore the uncertainty interval is 25 to 889 CFU.
• NOTE: UM can also remain as a % and the lab can express upper and lower control limits as the mean (in CFU) ± 3 x RSD.
29
But Not all are the same…
Microbial Replicates
30
Sources of uncertainty reflected in different types of replicates
Type of Replicate
Source Reproducibility Recovery True Plate
Random error X X X X
Counting error X X X X
Dilutions X X X
Environment X X
Equipment X X
Analyst X X
11/30/2015
11
31
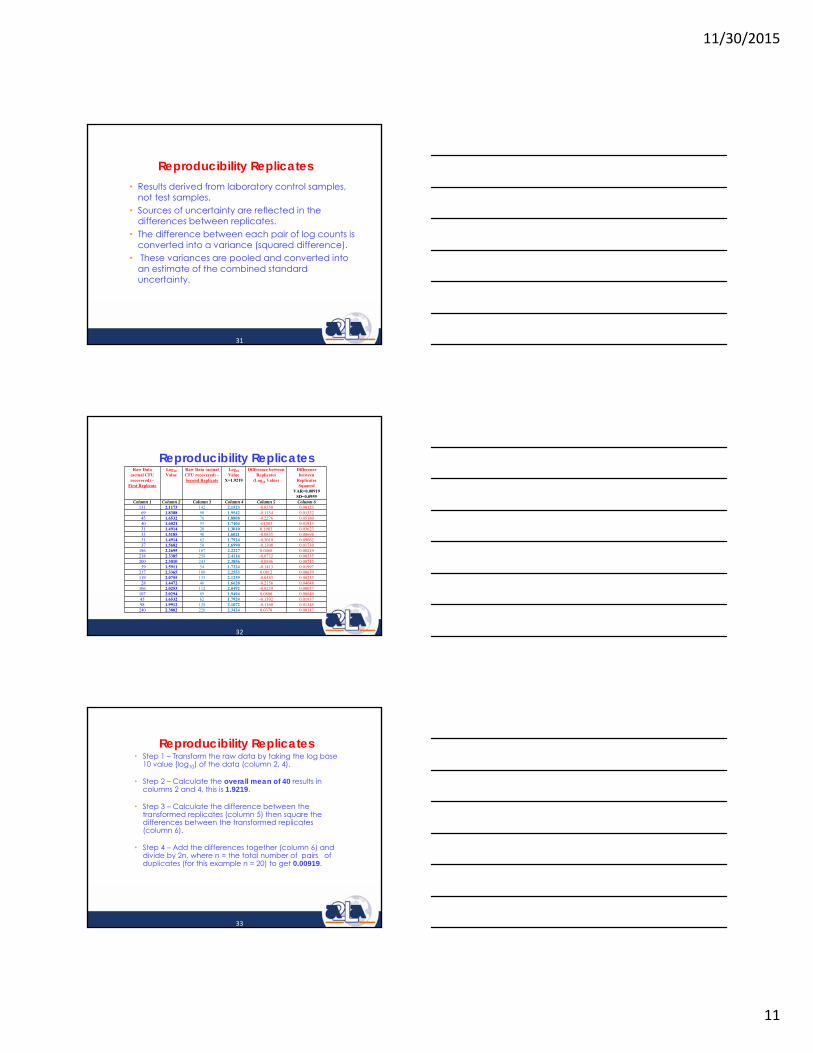
Reproducibility Replicates• Results derived from laboratory control samples,
not test samples.• Sources of uncertainty are reflected in the
differences between replicates. • The difference between each pair of log counts is
converted into a variance (squared difference).• These variances are pooled and converted into
an estimate of the combined standard uncertainty.
32
Reproducibility ReplicatesRaw Data
(actual CFU recovered) –
First Replicate
Log10
ValueRaw Data (actual CFU recovered) –Second Replicate
Log10
ValueX=1.9219
Difference between Replicates
(Log10 Value)
Difference between
Replicates Squared
VAR=0.00919SD=0.0959
Column 1 Column 2 Column 3 Column 4 Column 5 Column 6131 2.1173 142 2.1523 -0.0350 0.0012369 1.8388 90 1.9542 -0.1154 0.0133245 1.6532 76 1.8808 -0.2276 0.0518040 1.6021 55 1.7404 -01383 0.0191331 1.4914 20 1.3010 0.1903 0.0362333 1.5185 40 1.6021 -0.0835 0.0069831 1.4914 62 1.7924 -0.3010 0.0906237 1.5682 50 1.6990 -0.1308 0.01710186 2.2695 167 2.2227 0.0468 0.00219218 2.3385 258 2.4116 -0.0732 0.00535200 2.3010 243 2.3856 -0.0846 0.0071539 1.5911 54 1.7324 -0.1413 0.01997217 2.3365 180 2.2553 0.0812 0.00659119 2.0755 133 2.1239 -0.0483 0.0023328 1.4472 46 1.6628 -0.2156 0.04648106 2.0253 112 2.0492 -0.0239 0.00057107 2.0294 89 1.9494 0.0800 0.0064045 1.6532 62 1.7924 -0.1392 0.0193798 1.9912 128 2.1072 -0.1160 0.01345240 2.3802 220 2.3424 0.0378 0.00143
33
Reproducibility Replicates• Step 1 – Transform the raw data by taking the log base
10 value (log10) of the data (column 2, 4).
• Step 2 – Calculate the overall mean of 40 results in columns 2 and 4, this is 1.9219.
• Step 3 – Calculate the difference between the transformed replicates (column 5) then square the differences between the transformed replicates (column 6).
• Step 4 – Add the differences together (column 6) and divide by 2n, where n = the total number of pairs of duplicates (for this example n = 20) to get 0.00919.

11/30/2015
12
34
Reproducibility Replicates• Step 5 – Take the square root of the result in step 4; this equals
the pooled reproducibility standard deviation, which is 0.0959.
• Step 6 – Convert this standard deviation into a relative standard deviation (RSD) by dividing by the mean (1.9219) from Step 2, which produces an RSD of .0499. (e.g., 0.0959÷1.9219= 0.0499)
• Step 7 – Apply the coverage factor (k=2 for 95% coverage) to the RSD to get the estimate of the expanded uncertainty, 0.0998 (Note this is a log10 value). (e.g., Ue= 2 x 0.0499= 0.0988)
If using the student t-tables, with n=20 (19 degrees of freedom), k would be 2.09, which would provide an relative expanded uncertainty of 0.1043.
35
Reproducibility Replicates• Step 9 –To calculate the uncertainty for any subsequent laboratory result,
the subsequent result is first converted to the log base 10 value (log10), multiplied by 0.0998 and then this expanded uncertainty is added and subtracted from the log10 value.
• Step 10 – To estimate the MU of a sample, convert the log value for the sample measurement back to CFU for the reported result. This is accomplished by taking the anti-log of each of the endpoints of the interval (anti-log of x = 10x).
For example, using a result of 150 CFU: 150 in log10 = 2.1761. The relative Ue (rUe) in log counts is 0.2172 (2.1761 x 0.0998) . Add and subtract rUe from 2.1761 gives an interval from 1.9589 to 2.3933; transformed back to counts: 101.9589 =90.97, and 102.3933 = 247.33. Therefore the uncertainty interval is 90 to 248 CFU.
36
Recovery replicates
• The same amount of inoculum plated both with/without matrix. The sources of uncertainty are reflected in the difference between different sets of replicates.
• A single SD is calculated as the estimate of combined standard uncertainty.

11/30/2015
13
37
Recovery replicatesCFU Inoculated
Column 1
Log10 Value
Column 2
CFU recovered in Spike
Column 3
Log10 Value
Column 4
% Recovery of Log Values
X=97.0% SD=3.6%Column 5
30,000 4.4771 20,000 4.3010 96.117,000 4.2304 12,000 4.0792 96.436,000 4.5563 49,000 4.6902 102.9150 2.1761 90 1.9542 89.82,400 3.3802 1,300 3.1139 92.143,000 4.6335 32,000 4.5051 97.2100 2.0000 98 1.9912 99.6
42,000 4.6232 31,000 4.4914 97.119,000 4.2788 12,000 4.0792 95.3100 2.0000 120 2.0792 104.0
580,000 5.7634 410,000 5.6128 97.42,500 3.3979 2,000 3.3010 97.11,100 3.0414 930 2.9685 97.618,000 4.2553 12,000 4.0792 95.92,000 3.3010 1,900 3.2788 99.31,700 3.2304 2,100 3.3222 102.82,100 3.3222 1,700 3.2304 97.2150 2.1761 100 2.0000 91.92,000 3.3010 1,600 3.2041 97.1150 2.1761 110 2.0414 93.8
Mean % Recovery = 97.0% SD = 3.6%
38
Recovery replicates
• Step 1 – Transform the CFU values (columns 1, 3) to log base 10 value (log10) (columns 2, 4).
• Step 2 – Calculate the % recovery of the log10 values by dividing column 4 by column 2 and multiplying by 100 (column 5).
• Step 3 – Calculate the mean and standard deviation (SD) of the % recovery of the log10 values.
• The mean recovery is 97.0% and the SD of % recovery is 3.6%. The SD is an estimate of the combined standard uncertainty, which can be used as a relative uncertainty.
39
Recovery replicates
• Step 4 – For reporting purposes, apply the coverage factor to the SD to obtain Ue. For 95% coverage we use a coverage factor of k=2. The expanded uncertainty in this example is thus 7.2%. (If using the student t-tables, with n=20 (19 degrees of freedom), the coverage factor k would be 2.09, which would provide an expanded uncertainty of 7.5%.)
• Step 5 – Because the recovery is expressed as a percentage, when calculating the expanded uncertainty for a sample, this percentage needs to be multiplied by the log10 value in order to estimate the uncertainty in log units.
For example, for a result of 150 CFU: 150 in log10 = 2.1761. The Ue in log counts is 0.1567 (2.1761 x 0.072). Add and subtract Ue from 2.1761 gives an interval from 2.0194 to 2.3328; transforming back to counts: 102.0194
=104.6, and 102.3328 = 215.2.
Therefore the uncertainty interval is 104 to 216 CFU.

11/30/2015
14
40
Most Probable Number data
41
Measurement uncertainty –MPN
• LCS results should be used provided these are an appropriate matrix and concentration.
• If all method steps are included, can use SD or RSD.
• If <20 LCS results, the CF should be the appropriate t statistic for 95% confidence for the associated DF.
• The estimate of combined uncertainty is then expanded using the formula:
MPN MU(LCS) = k x SD, where k equals 2 (for 95% confidence).
42
For 3 tubes each at 0.1, 0.01, and 0.001 g inocula, the MPNs per gram and 95 percent confidence intervals.
Pos. tubes
MPN/g
Conf. lim. Pos. tubes
MPN/g
Conf. lim.
0.10 0.01 0.001 Low High 0.10 0.01 0.001 Low High
0 0 0 <3.0 – 9.5 2 2 0 21 4.5 42
0 0 1 3.0 0.15 9.6 2 2 1 28 8.7 94
0 1 0 3.0 0.15 11 2 2 2 35 8.7 94
0 1 1 6.1 1.2 18 2 3 0 29 8.7 94
0 2 0 6.2 1.2 18 2 3 1 36 8.7 94
0 3 0 9.4 3.6 38 3 0 0 23 4.6 94
1 0 0 3.6 0.17 18 3 0 1 38 8.7 110
1 0 1 7.2 1.3 18 3 0 2 64 17 180
1 0 2 11 3.6 38 3 1 0 43 9 180
1 1 0 7.4 1.3 20 3 1 1 75 17 200
1 1 1 11 3.6 38 3 1 2 120 37 420
1 2 0 11 3.6 42 3 1 3 160 40 420
1 2 1 15 4.5 42 3 2 0 93 18 420
1 3 0 16 4.5 42 3 2 1 150 37 420
2 0 0 9.2 1.4 38 3 2 2 210 40 430
2 0 1 14 3.6 42 3 2 3 290 90 1,000
2 0 2 20 4.5 42 3 3 0 240 42 1,000
2 1 0 15 3.7 42 3 3 1 460 90 2,000
2 1 1 20 4.5 42 3 3 2 1100 180 4,100
2 1 2 27 8.7 94 3 3 3 >1100 420 –
Most Probable Number, FDA Bacteriological Analytical Manual

11/30/2015
15
43
Laboratory Control Data with Same Target Value(e.g., 100 CFU)
MPN value(Pos. Tubes)
Predicted CFU Log10 ValueSD= 0.2943
2 2 2 35 1.54412 3 1 36 1.55633 1 3 160 2.20413 1 2 120 2.07923 2 0 93 1.96853 2 1 150 2.17613 2 2 210 2.32223 1 1 75 1.87513 1 0 43 1.63353 3 0 240 2.38023 0 2 64 1.80623 1 1 75 1.87513 1 2 120 2.07923 0 2 64 1.80622 1 2 27 1.43143 1 2 120 2.07923 2 3 290 2.46243 1 3 160 2.20413 0 2 64 1.8064
44
Measurement uncertainty –MPN
• Step 1 – Locate the MPN predicted CFU based on the number of positive tubes
• Step 2 – Transform the CFU values to log10 value.
• Step 2 – Calculate the SD of the log10 values.
SD= 0.2943.
• Step 3 –Apply the coverage factor (95%, k=2) to the SD to obtain Ue. The Ue in this example is 0.5886.
(Students t table with n=20 = 2.09. Ue =0.6151
45
Measurement uncertainty –MPN
• Step 4 – To calculate the uncertainty for any subsequent laboratory result using SD x k, the result is first converted to log base 10 value (log10), and the expanded uncertainty of 0.5586 is added and subtracted from the log value.
• Step 5 - Convert the log value for the sample measurement back to CFU for the reported result. This is accomplished by taking the anti-log of each of the endpoints of the interval (anti-log of x = 10x).
For example, estimating the uncertainty using SD x k for a result of 160 CFU: 160 in log10 = 2.2041. Adding and subtracting 0.5886 from 2.2041 gives an interval from 1.6155 to 2.7927; transforming back to counts: 101.6155 =41.27, and 102.7927 =620.44. Therefore the uncertainty interval is 41 to 621 CFU.

11/30/2015
16
46
Acknowledgements
A2LAG108‐ GuidelinesforEstimatingUncertaintyforMicrobiologicalCountingMethods
ByDawnMettlerandDanTholen
Andpersonalcommunication
47
Questions / Comments
48
Contact: Roger M. BrauningerPhone: 301 644 3233
Email: [email protected]
American Association for Laboratory Accreditation5301 Buckeystown Pike, Suite 350
Frederick, MD 21704
www.a2la.org
For Further Information
Comments/concerns about this program? Email: [email protected]