a dialogue on converting qualitative data into ... · pdf filea dialogue on converting...
TRANSCRIPT

A Dialogue on Converting Qualitative Data into Quantitative Data
Mary Krulia CCT-771
December 17, 2010
Krulia 1
Introduction
Among the numerous ways to obtain information, there are two typical methods for
analyzing and interpreting acquired data: quantitatively and qualitatively. Both methods have
their successes and obstacles, and can be conducted independently of one another. In this
research, however, the goal is to meld the data together by transforming qualitative information
into measurable data and examining possible relationships. The data set was compiled from
three sources.
The Green and Healthy Homes Initiative
Healthy housing plays a critical role in daily life. Weatherization is a process for making
homes healthy by refurbishing houses to increase sustainability and energy efficiency, as well as
to protect houses from weather-related damage. For many people living in low-to moderate-
income communities, weatherization can be too economically burdensome to pursue.
Recognizing the need to enhance healthy and safe housing intervention programs in
economically challenged communities, the Green and Healthy Homes Initiative (the GHHI)
formed as a public-private partnership. Uniting with The National Coalition to End Childhood
Lead Poisoning, the federal government, national and local philanthropy, and local partners in 14
GHHI project sites - 12 cities and two Native American Tribes – the GHHI aims to lead a
national strategy to ensure that all families and children live in homes that are healthy, safe,
energy-efficient and sustainable. In performing these functions across this large and diverse
community, the GHHI “brings together funding sources, erases bureaucratic boundaries and
addresses all of the problems of a family home at one time1.”
1 The National Dialogue on Green and Healthy Homes. http://www.greenandhealthyhomes.org/content/what-is-GHHI/.

Krulia 2
The National Dialogue on Green & Healthy Homes
The National Academy of Public Administration (NAPA) and the Collaboration Project
conduct online dialogues that are designed as collaborative spaces for online discussion on any
particular topic clients may request. These dialogues can be public or private and have different
goals depending on the project. In the fall of 2010, the GHHI partnered with NAPA to host an
online discussion with the green and healthy homes community called The National Dialogue on
Green & Healthy Homes (the Dialogue)2. The Dialogue served as a platform to solicit ideas and
feedback from November 4-22. Outreach consisted of contacting government agencies, non-
profit and philanthropic organizations, academics, and bloggers via email, phone, and social
networking.
NAPA’s expertise in conducting dialogues offered GHHI several benefits. First, there
were no limits to the number of participants, and those involved could be as active as they
deemed necessary. The Dialogue platform enabled users of the green and healthy homes
community to suggest ideas, refine and build on them in open discussion, and rate those they
found most compelling. Second, there is a low barrier to entry for participants. When interested
users visited the site, they were prompted to create a username and password, as well as their
employment sector and areas of interest. This process permits anonymity and prompt access to
the Dialogue for participants, while this information provides data for NAPA to use in its report
to GHHI. Third, the Dialogue served as a collaborative opportunity for the green and healthy
homes community to form a more cohesive group, discuss innovative strategies, and suggest best
practices based on their experiences.
All of these benefits were important to achieving the goal of the Dialogue: to identify
ways to overcome the barriers that prevent children, families, and communities from having 2 Site archived online at http://www.greenandhealthyhomesdialogue.org.

Krulia 3
healthy, safe, and energy efficient housing3. The 24-hour National Dialogue on Green &
Healthy Homes launched on Thursday, November 4th and closed two and a half weeks later on
Monday, November 22, 2010. Due to a glitch with Google Analytics which was assigned to
gather information on the Dialogue, data was not collected the first four days the Dialogue was
live. Therefore, the analysis contained in this report is based on data collected starting on
November 8, 2010. From November 8-22, the Dialogue received 2,513 visits from 1,175 unique
visitors, which equates to an average of 168 visits and 78 unique visitors each day4.
While the Dialogue was an exciting opportunity for a robust conversation among a wide array of
participants, it was not designed to produce statistically significant results. As stated above,
NAPA collected demographic statistics from Google Analytics applied to the Dialogue site for
user activity; however, NAPA does not traditionally produce statistical data.
The Green and Healthy Homes Initiative Weatherization Survey
Prior to the coordinated effort between GHHI and NAPA in the Dialogue, GHHI
conducted a survey entitled, “Green and Healthy Homes Initiative Site Questionnaire –
Weatherization” (the Survey). The Survey was conducted from July to August 2010 to obtain an
accurate analysis of the health and safety issues encountered during the weatherization process.
GHHI had heard anecdotally about the barriers in the Department of Energy Weatherization
Assistance Program (WAP), so the survey was targeted to the WAP grantees and weatherization
providers in 12 of the 14 GHHI designated sites5. The purpose of the Survey was to advance the
3 The National Dialogue on Green and Healthy Homes One Pager. http://www.napawash.org/wp-content/uploads/2010/10/GHHI-One-Pager.pdf .4 Accessed on Google Analytics, December 2010. For a full list of Dialogue metrics from NAPA’s interim report, please see Appendix C. 5 “Identified Barriers and Opportunities to Make Housing Green and Healthy Through Weatherization: A Report from Green and Healthy Homes Initiative Sites.” November 2010. P. 12.

Krulia 4
goal of integrating weatherization, energy efficiency, and health and safety into best practices –
as well as address any barriers found in implementing this work6.
The task for this paper was to find a relationship, if any, between the Survey and
Dialogue data and to inform both GHHI and NAPA of any significant findings. The following
sections will outline research questions and hypotheses and a description of the methodology
including variable definitions. This research will then include interpretations of the statistical
analysis based on the output from SPSS. Finally, this study will conclude with a discussion and
suggestion of methods for future analysis.
Research Questions and Hypotheses
R1: What are the correlations between the variables for the GHHI Survey? R2: What variables in the Survey were addressed in the Dialogue? R3: What cities in the Dialogue have more visitors than the sites that answered the GHHI Survey?
In an attempt to address and test the research questions regarding the relationships and
significance of the Dialogue and Survey data, the following two hypotheses are presented:
H1: Sites that answered the GHHI Survey were more likely to participate in the Dialogue than sites not represented in the Survey. H2: Variables in the Survey were more likely to be represented in ideas and comments in the Dialogue than other variables introduced in the Dialogue.
Data
The data for this project is derived from three sources. The first set is from Section B of
the GHHI Survey raw data. GHHI designed this section as a way “to gain insight into the
prevalence of health and safety issues in WAP inspected housing and the impact these issues
have on homes being denied or delayed for weatherization work7.” Of the 12 GHHI sites
surveyed, 9 sites produced measurable data, so this study is analyzing 9 sites. The second set of
6 GHHI Report, 11.7 Ibid.

Krulia 5
data is from the Dialogue registration and participation metrics. This information was collected
on the Dialogue administrative Control Panel. The third set is from the Google Analytics
collected from November 8-22. As stated above, there was a glitch on the Dialogue hosting site
preventing data collection from the first four days of the Dialogue, which is a factor that may
have affected the findings in this study8. However, the data from November 8-22 is useful for
examining the hypotheses.
Methodology
The method for constructing the data set consisted of six steps. The first was an
exploratory data analysis to determine what was measurable from the raw data provided in
Section B of the GHHI survey entitled, “Home Health and Safety Hazards.” Survey respondents
were asked to identify the total number of homes with hazards found during the weatherization
process. The hazards in the Survey served as numeric variables in the data set. Therefore, each
site (n=9) had numeric values associated with the variables.
The second step in this process was to identify measurable data from the Dialogue.
Google Analytics provides the number of visits to the Dialogue site by country, state, and city.
For this data set, the 2,423 visits from the United States (including the District of Columbia)
were added as a string, nominal-level variable in the data set.
The third step was identifying the cities represented in the Dialogue. Google Analytics
highlighted the number of visitors from each city, which was identifiable both visually on a map
and in rank order. An example is pictured below in Figure 1.
8 NAPA is unable to determine if the metrics for the first four days were significantly higher than the rest of the Dialogue based on comparing the varying results from metrics collected in the first four days of previous NAPA dialogues.

Krulia 6
Figure 1
Figure 1 highlights that 12 cities from Virginia were represented in the Dialogue and that
Alexandria was the city with the most visits (286). In order to test the relationship between
Survey sites and Dialogue cities, the cities chosen for the data set were the 9 sites and the cities
from the remaining states with the highest number of visitors. For example, Baltimore,
Maryland is a GHHI site, so the number of visits to the Dialogue was recorded in the data set
(152).
The fourth step in the process was creating a dummy variable to identify sites verses
cities that are not GHHI sites. Each site was labeled “1” and each city was labeled “2”. The fifth
step was adding the n value from the Section B survey raw data to test the relationships, if any,
for the number of surveys answered per site and the number of visits to the Dialogue per site and
per city. Finally, a numeric filter further provided information as a dummy variable by labeling
Survey sites “1” and non-Survey sites “0.”

Krulia 7
List of Variables and Definitions
Since the data set is a collection of raw data and was organized in a strategic manner, there
are no missing variables and no transformations. In addition, there are no value labels so the
conceptual and operational definitions are the same. The variables are listed in the order they
were entered into SPSS.
• Region: The states that visited The National Dialogue on Green & Healthy Homes site.
• VisitsReg: The number of visits per state to The National Dialogue on Green & Healthy Homes.
• Cities: The cities that answered the GHHI Weatherization Survey and/or the cities with
the most number of visits to The National Dialogue on Green & Healthy Homes.
There were 10 numeric variables derived from the hazard choices in Section B. The Survey
respondents could choose all that apply. The variables are listed below with the variable names
in parentheses.
• Moisture/mold/mildew (Moisture_Mold_Mildew) • Fire and safety (Fire_Safety) • Structural defects (Structural) • Electrical hazards (Electrical) • Clutter/harborage (Clutter_Harborage) • Environmental air hazards (Environmental_Air) • Ventilation problems (Ventilation) • Asbestos (Asbestos) • Lead paint hazards (Lead_Paint) • Pests (Pests)
• VisitCity: The number of participants per city who visited The National Dialogue on
Green & Healthy Homes.
• Site: The dummy variable for Cities. This variable made the data interpretable on the nominal level. The Dialogue cities that were also Survey sites were labeled “1” and the Dialogue cities that were not Survey sites were labeled “2” in SPSS.
• n: The total number of surveys from a GHHI site.
• filter_$: The filter was used as a dummy variable in addition to Site. It listed the Survey
sites as “1” and the non-Survey sites as “0.”

Krulia 8
Frequencies
The frequencies for each of the variables are listed below. The output for all of the tests
is in Appendix A.
Region The frequencies indicate that there was an even representation: each state was represented once. VisitsReg
The range for this variable is very large: from 1.00 through 407.00. This indicates that
there is a large variation for the 47 entries (there are 36 values). The values in Table 1 (below)
list the visits per region with a frequency higher than 1. This means that, for example, there were
2 states where there were 61 visits to the Dialogue.
Table 1 Visits to the Dialogue Per Region Frequency
1.00 3 2.00 2 3.00 2 4.00 2 7.00 2 8.00 2 10.00 2 13.00 2 14.00 2 61.00 2
Hazard Variables
The mean values were calculated to see the average number of times that houses in the
GHHI Survey identified each hazard. For example, there was an average of 173 houses with
moisture/mold/mildew problems. Table 2 lists the mean values for each variable.

Krulia 9
Table 2
Hazard Mean Moisture_Mold_Mildew 173.56
Fire_Safety 376.33 Structural 207.00 Electrical 78.00
Clutter_Harborage 233.22 Environmental_Air 103.00
Ventilation 246.22 Asbestos 141.00
Lead_Paint 116.11 Pest 135.11
Cities
Similar to the Region variable, there is an equal representation. There is one city per
state in the data set.
VisitCity Similar to the VisitsReg variable, the range for this variable is very large: from 1.00
through 407.00, indicating that there is a large variation for the 47 entries. However, there are
fewer values (26) than VisitReg, meaning that there are more cities with the same number of
visitors. The values in Table 3 (below) list the visits per city with a frequency higher than 1.
This means that, for example, there were 3 cities where there were 8 visits to the Dialogue site.
The mean is 30.21, meaning that there was an average of about 30 visits to the Dialogue per city.
Table 3

Krulia 10
Visits to the Dialogue Per City Frequency 1.00 4 2.00 3 3.00 3 4.00 5 5.00 3 6.00 3 7.00 2 8.00 3 12.00 2 14.00 2 35.00 2
n The mean for n is 728.78. This value is the average number of submitted surveys. Analysis
This section will identify the variables used to examine each research question and
hypothesis and the tests used to examine them. Based on the output and frequencies, the
remaining portion of the Analysis is a discussion about the research gaps and findings.
R1: What are the correlations between the variables for the GHHI survey?
Crosstab Correlations (Pearson’s R) in SPSS across all of the hazard variables produced
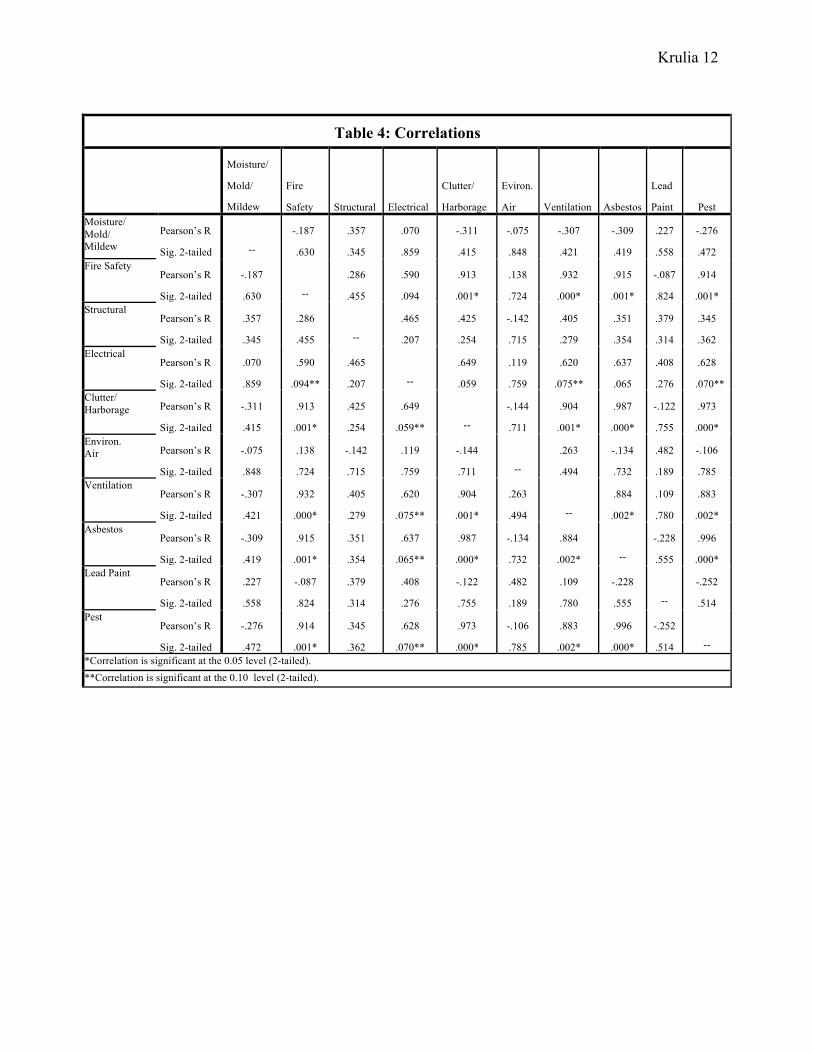
significant correlations and positive relationships between variables. Table 4 lists the statistical
significance and the Pearson’s R coefficients, which provides a numerical statement of the linear
relationship between two or more variables.
It was interesting to see that there are no significant correlations with the
Moisture_Mold_Mildew, Structural, Environmental_Air, or Lead_Paint variables. The variables
approaching a significant correlation with another variable at p≤ .10 and those that have a
significant correlation at p≤ .05 are identified with asterisks. Most notably, Fire_Safety has four
significant correlations at p≤ .05 and one at p≤ .10, meaning that houses with fire safety hazards
also had clutter/harborage, ventilation, asbestos, and pest problems. Of these, based on the

Krulia 11
Pearson’s R values, the closer to being significant at p≤ .05, the closer the variables are to having
a perfect positive relationship (when Pearson’s R is equal to 1). For Fire_Safety, the near perfect
positive relationships are with Clutter_Harborage (Pearson’s R=.913), Ventilation (Pearson’s
R=.932), Asbestos (Pearson’s R=.915), and Pest (Pearson’s R=.914).
Krulia 12
Table 4: Correlations
Moisture/
Mold/
Mildew
Fire
Safety Structural Electrical
Clutter/
Harborage
Eviron.
Air Ventilation Asbestos
Lead
Paint Pest Moisture/ Mold/ Mildew
Pearson’s R
Sig. 2-tailed
--
-.187
.630
.357
.345
.070
.859
-.311
.415
-.075
.848
-.307
.421
-.309
.419
.227
.558
-.276
.472 Fire Safety
Pearson’s R
Sig. 2-tailed
-.187
.630
--
.286
.455
.590
.094
.913
.001*
.138
.724
.932
.000*
.915
.001*
-.087
.824
.914
.001* Structural
Pearson’s R
Sig. 2-tailed
.357
.345
.286
.455
--
.465
.207
.425
.254
-.142
.715
.405
.279
.351
.354
.379
.314
.345
.362 Electrical
Pearson’s R
Sig. 2-tailed
.070
.859
.590
.094**
.465
.207
--
.649
.059
.119
.759
.620
.075**
.637
.065
.408
.276
.628
.070** Clutter/ Harborage Pearson’s R
Sig. 2-tailed
-.311
.415
.913
.001*
.425
.254
.649
.059**
--
-.144
.711
.904
.001*
.987
.000*
-.122
.755
.973
.000* Environ. Air Pearson’s R
Sig. 2-tailed
-.075
.848
.138
.724
-.142
.715
.119
.759
-.144
.711
--
.263
.494
-.134
.732
.482
.189
-.106
.785 Ventilation
Pearson’s R
Sig. 2-tailed
-.307
.421
.932
.000*
.405
.279
.620
.075**
.904
.001*
.263
.494
--
.884
.002*
.109
.780
.883
.002* Asbestos
Pearson’s R
Sig. 2-tailed
-.309
.419
.915
.001*
.351
.354
.637
.065**
.987
.000*
-.134
.732
.884
.002*
--
-.228
.555
.996
.000* Lead Paint
Pearson’s R
Sig. 2-tailed
.227
.558
-.087
.824
.379
.314
.408
.276
-.122
.755
.482
.189
.109
.780
-.228
.555
--
-.252
.514 Pest
Pearson’s R
Sig. 2-tailed
-.276
.472
.914
.001*
.345
.362
.628
.070**
.973
.000*
-.106
.785
.883
.002*
.996
.000*
-.252
.514
-- *Correlation is significant at the 0.05 level (2-tailed). **Correlation is significant at the 0.10 level (2-tailed).
Krulia 13
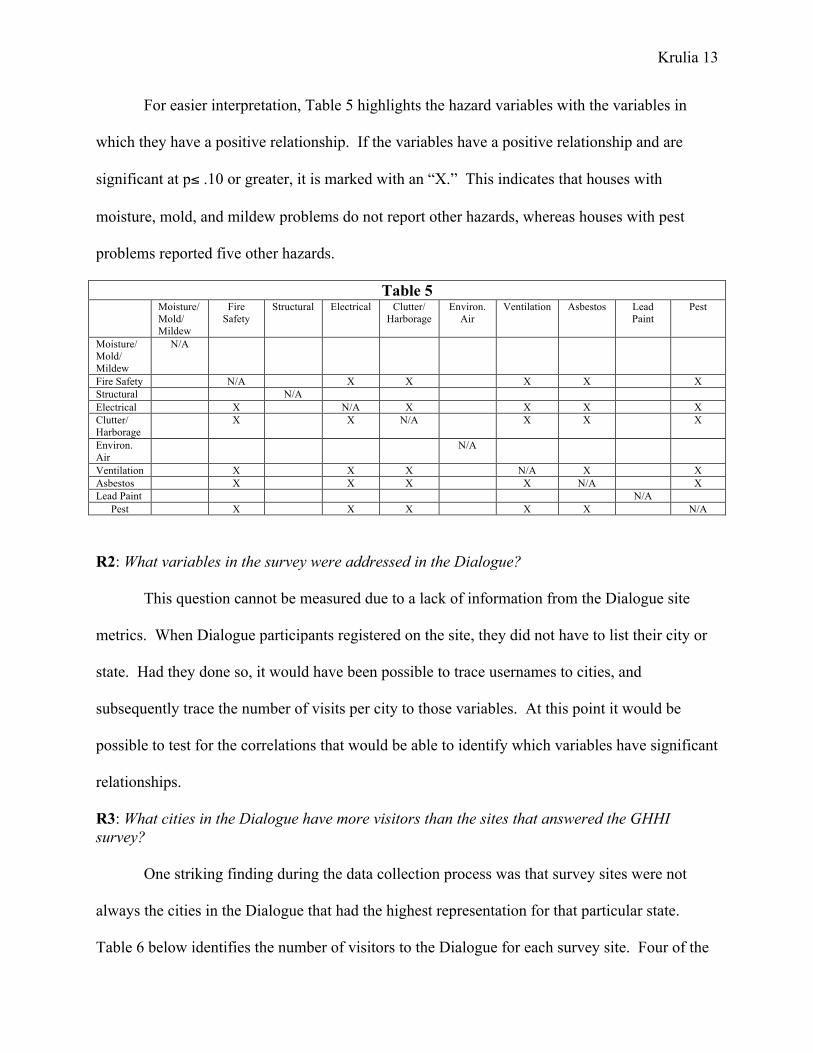
For easier interpretation, Table 5 highlights the hazard variables with the variables in
which they have a positive relationship. If the variables have a positive relationship and are
significant at p≤ .10 or greater, it is marked with an “X.” This indicates that houses with
moisture, mold, and mildew problems do not report other hazards, whereas houses with pest
problems reported five other hazards.
Table 5 Moisture/
Mold/ Mildew
Fire Safety
Structural Electrical Clutter/ Harborage
Environ. Air
Ventilation Asbestos Lead Paint
Pest
Moisture/ Mold/ Mildew
N/A
Fire Safety N/A X X X X X Structural N/A Electrical X N/A X X X X Clutter/ Harborage
X X N/A X X X
Environ. Air
N/A
Ventilation X X X N/A X X Asbestos X X X X N/A X Lead Paint N/A
Pest X X X X X N/A
R2: What variables in the survey were addressed in the Dialogue?
This question cannot be measured due to a lack of information from the Dialogue site
metrics. When Dialogue participants registered on the site, they did not have to list their city or
state. Had they done so, it would have been possible to trace usernames to cities, and
subsequently trace the number of visits per city to those variables. At this point it would be
possible to test for the correlations that would be able to identify which variables have significant
relationships.
R3: What cities in the Dialogue have more visitors than the sites that answered the GHHI survey?
One striking finding during the data collection process was that survey sites were not
always the cities in the Dialogue that had the highest representation for that particular state.
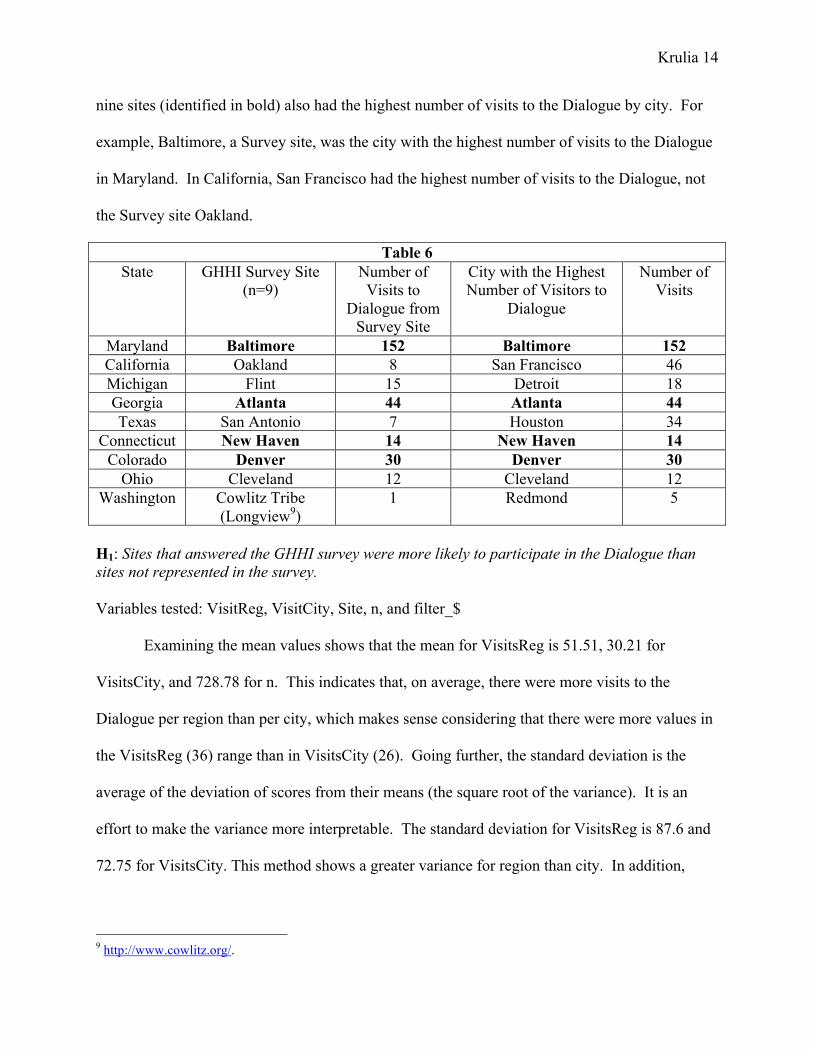
Table 6 below identifies the number of visitors to the Dialogue for each survey site. Four of the
Krulia 14
nine sites (identified in bold) also had the highest number of visits to the Dialogue by city. For
example, Baltimore, a Survey site, was the city with the highest number of visits to the Dialogue
in Maryland. In California, San Francisco had the highest number of visits to the Dialogue, not
the Survey site Oakland.
Table 6 State GHHI Survey Site
(n=9) Number of Visits to
Dialogue from Survey Site
City with the Highest Number of Visitors to
Dialogue
Number of Visits
Maryland Baltimore 152 Baltimore 152 California Oakland 8 San Francisco 46 Michigan Flint 15 Detroit 18 Georgia Atlanta 44 Atlanta 44 Texas San Antonio 7 Houston 34
Connecticut New Haven 14 New Haven 14 Colorado Denver 30 Denver 30
Ohio Cleveland 12 Cleveland 12 Washington Cowlitz Tribe
(Longview9) 1 Redmond 5
H1: Sites that answered the GHHI survey were more likely to participate in the Dialogue than sites not represented in the survey. Variables tested: VisitReg, VisitCity, Site, n, and filter_$
Examining the mean values shows that the mean for VisitsReg is 51.51, 30.21 for
VisitsCity, and 728.78 for n. This indicates that, on average, there were more visits to the
Dialogue per region than per city, which makes sense considering that there were more values in
the VisitsReg (36) range than in VisitsCity (26). Going further, the standard deviation is the
average of the deviation of scores from their means (the square root of the variance). It is an
effort to make the variance more interpretable. The standard deviation for VisitsReg is 87.6 and
72.75 for VisitsCity. This method shows a greater variance for region than city. In addition,
9 http://www.cowlitz.org/.

Krulia 15
obviously these numbers indicate that, on average, the number of Surveys (728.78) is greater
than the average number of visits to the Dialogue per city (30.21).
Four separate t-tests were applicable in this instance to see if the average number of
Dialogue visitors is higher or lower than the average number of Dialogue visitors from the
Survey sites. The first t-test was conducted as a paired samples test between VisitsReg and
VisitsCity. The pair was significant (.000) with a correlation of .94. This indicates that the two
are highly correlated but are not very different because the mean values were similar
(VisitsReg=51.51 and VisitCity=30.21). In other words, having a site does not change the
number of visits to the Dialogue; because a city was a Survey site does not necessarily increase
the number of visits to the Diaogue for that city.
The second t-test was an Independent Samples/Levene’s Test for Equality of Variances
between VisitCity and Site. Since the significance value for VisitCity was .786 it was therefore
not significant at the p≤ .05, equal variances are assumed and there is no statistically significant
difference between the means. The same is true for VisitsReg and Site because the significance
value was .833. The confidence bands are very wide as well, but more so for VisitsReg. For
VisitCity, the true mean value lies between -53.39 and 56.44, while the true mean value for
VisitsReg lies between -24.11 and 105.85.
The third examination consisted of a one-sample t-test of VisitCity and n. Considering
that the mean for VisitsReg is 51.51 and for n is 728.78, it indicates that more Survey
respondents participated in the Dialogue than did not. This supports the hypothesis because
VisitCity is significant at .000 and n is significant at .010.
Krulia 16
H2: Variables in the survey were more likely to be represented in ideas and comments in the Dialogue than other variables introduced in the Dialogue.
This hypothesis, if the information was available, could address the second Research
Question. However, there was one unscientific method to observe variables in both the Survey
and the Dialogue. When users submitted ideas and comments to the Dialogue they could tag
their ideas with key words. Other users could tag ideas based on the content in the ideas and
comments as well. Tags were then collected in a tag cloud on the sidebar, to enable users to
search for topics based on these key words.
There are four aspects to consider about the tagging function: 1) tags are relative; 2) tags
are user-generated; 3) the number of tags per idea are unlimited; and 4) it is possible that the
ideas and comments added toward the end of the Dialogue did not permit enough time for other
users to tag before the Dialogue closed. Once the Dialogue closed, however, it was possible to
count the number of times each tag was associated with each idea. Appendix B lists the tags and
the number of times an idea was tagged with that key word or words. For example, “Best
practice” was tagged 32 times, meaning that in either the idea or the subsequent comments, a
user or users suggested best practices for addressing the problem indicated in the idea.
An interesting observation was that not all of the hazard variables were tags in the
Dialogue. Table 7 lists each hazard variable and the number of times it was tagged in the
Dialogue, compared with the top ten tags in the Dialogue. This analysis is not statistically
significant because it is relative and immeasurable, but it is noteworthy, nonetheless. It means,
generally speaking, that the Dialogue discussed more broad topics geared toward solutions for
the problems associated with weatherization and healthy housing. In that sense, it would seem
that the Dialogue ideas and comments provide some solutions to barriers identified in the GHHI
survey.

Krulia 17
Table 7
Hazard Variable from GHHI Survey Number of Tags in Dialogue
Moisture/Mold/Mildew 14 Moisture: 5
Mold: 9 Fire Safety 0
Structural Defects 0
Clutter/Harborage 0
Environmental Air Hazards 5 Air Quality: 1 Indoor Air: 2
Indoor Policies: 3 Ventilation 6
Air Quality: 1 Indoor Air: 2
Indoor Policies: 3 Vapor Intrusion: 1
Asbestos 1
Lead Paint Lead: 9
Pest 2
Top 10 Tags Number of Tags in Dialogue
Innovative Strategy 55
Education 36
Best Practice 32
Collaboration 32
Government Facilitation 32
Barriers 23
Health 21
Healthy Homes 20
Resources 20
Energy Efficiency 18

Krulia 18
Gaps
There are many gaps in the research. First, Dialogues are not designed to be statistically
significant and they are opt-in, meaning there are no requirements for participation. In addition,
the results may or may not change depending on the missing data from the first four days of the
Dialogue; there may have been more visits from the Survey sites, for example.
Second, not all of the regions in the Dialogue answered the Survey, and some of the cities
that were chosen as variables were chosen because they answered the survey, even though other
cities within the same region had more visits to the Dialogue (see Table 6).
Third, as stated above, the metrics for the Dialogue lacks the ability to track data in terms
of, essentially, who said what from where. Even though entering location-based information
during the Dialogue registration process is a barrier to entry, asking registrants for a city or state
would be helpful. Had the Dialogue asked this question, it would have enabled correlating the
variables in the survey with the tags on ideas in the Dialogue or correlating the cities with the
ideas to answer what is being said in a particular location. The data in this analysis was
restricted to only what was added in the Dialogue verses what was said in the Dialogue from
Survey sites: none of the data is tied to the respondents, respectively.
Fourth, the n values are small (i.e. VisitCity=47 and n=9), so overall this study could be
considered not statistically significant. However, this research should not be discounted because
of the small sample size; rather, it could be considered a pilot study for future research.

Krulia 19
Summary of Findings
Turning qualitative data into quantitative data involves a comprehensive and creative
process. It is a method of transforming ideas into numbers that can be measured and tested.
Determining which method for obtaining information involves considering the community factor
with dialogues verses a population snapshot with more traditional surveys.
GHHI and NAPA partnered on The National Dialogue on Green & Healthy Homes as a
collaborative opportunity to engage members of the green and healthy community. Participants
were encouraged to discuss and identify ways for overcoming the barriers that prevent children,
families, and communities from having healthy, safe, and energy efficient housing. The
Dialogue was not designed to product statistical data; however, prior to the Dialogue, GHHI
conducted a survey to obtain an accurate analysis of health and safety issues encountered during
the weatherization process. Combining data from both the Dialogue and the Survey, in addition
to the Google Analytics assigned to the Dialogue, produced interesting findings to identify
relationships.
The research questions and hypotheses concerned the correlations between Dialogue and
Survey variables. There were gaps in the research, namely that there is missing data from the
first four days of the Dialogue, not all of the regions and cities participating in the Dialogue also
answered the Survey, the lack of location-based metrics from the Dialogue registration limited
statistical analysis, and the sample size overall is small.
Despite the drawbacks, this research produced interesting observations including
similarities between the Dialogue and the Survey as well as findings independent of the other.
One similarity between the Dialogue and the Survey is that tenants may not be personally
represented in either. One tenant identified as such for the Dialogue registration, and the Survey

Krulia 20
respondents were grantees and weatherization experts. While underrepresented on a personal
level, the experts can be considered as speaking for the tenants in both the Dialogue and the
Survey. For a full list of Dialogue users’ sectors and interests as well as other Dialogue metrics
from NAPA’s interim report, please see Appendix C.
One observation for the Dialogue data was that the range for VisitCity and VisitReg was
large, indicating a wide variance among visitors to the Dialogue. There were more visits to the
Dialogue per region than per city, and the average number of Surveys is greater than the average
number of visits to the Dialogue per city. However, after completing a paired samples t-test, the
findings indicated that because a city was a Survey site does not necessarily increase the number
of visits to the Dialogue for that city.
Addressing the Survey data, one observation is that half of the variables had positive
correlations with other variables in the Survey. Second, only four of the nine Survey sites had
the highest representation in the Dialogue for that particular state. Third, even though this
finding is based on relative data, the Survey variables were overwhelmingly not represented by
tags in the Dialogue ideas and comments. Instead, the tags indicated that the Dialogue was a
discussion platform to discuss solutions for weatherization and healthy housing. Assumedly this
could be interpreted that Dialogue ideas and comments provide some solutions to barriers
identified in the Survey. Finally, the first hypothesis is supported according to the results of the
one-sample t-test of VisitCity and n. More Survey respondents participated in the Dialogue than
did not participate in the Dialogue.
While the Dialogue did not produce a large amount of measurable data, examining both
the Dialogue and Survey was an insightful exercise for creating a data set from both qualitative
and quantitative data. Future research would be enhanced if dialogues asked simple location-

Krulia 21
based questions for analysis. With this data, it would be possible to examine trends for different
health and safety hazards and their prevalence in various cities as well as test for correlations in
different cities. Whether the data was measurable or not, however, both The National Dialogue
on Green & Healthy Homes and the GHHI Weatherization Survey produced informative results
to enhance future green and healthy initiatives.

Krulia 22
Appendix A
Please see the attached output from SPSS.

Krulia 23
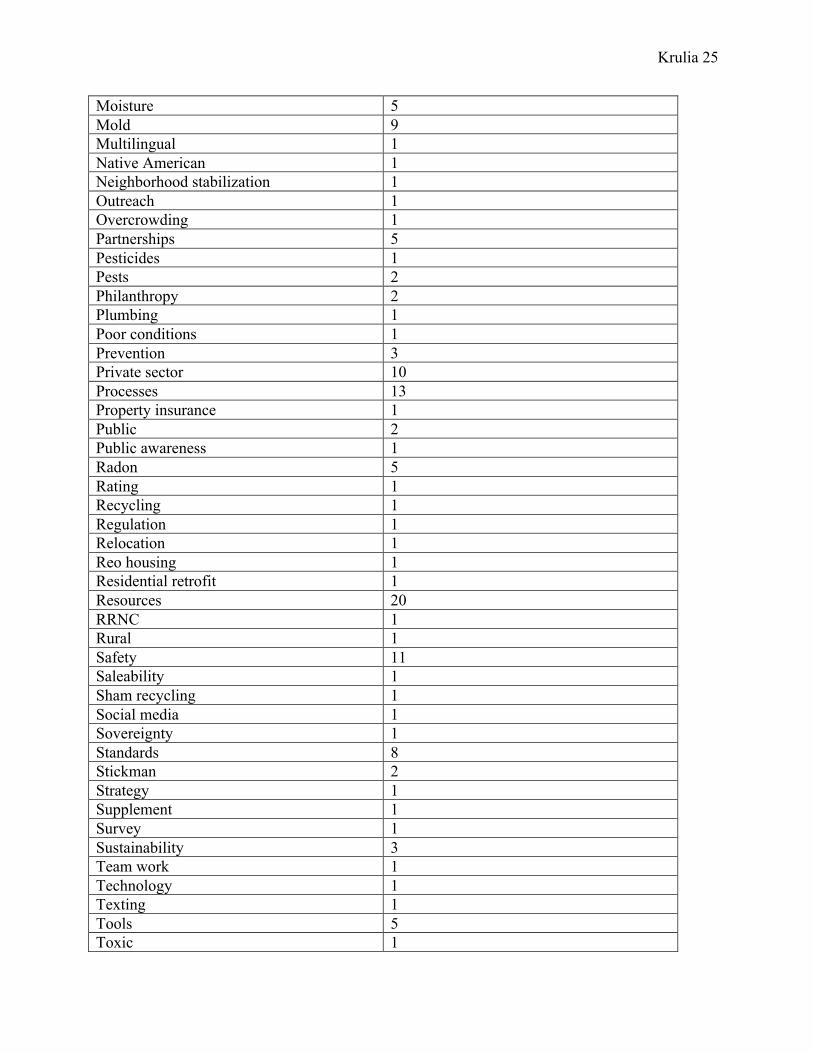
Appendix B
Number of Tags: 165 Tags per Idea: 1.6 Tag Name Number of Ideas Adhd 1 Air quality 1 Applications 1 Asbestos 1 Asthma 5 Awareness 2 Ban 1 Banking industry 1 Barriers 23 Behavior change 5 Best practice 32 Brand 1 Branding 1 Building products 2 Cancer 2 Categorical funding 1 Children 1 Cleaning products 1 Coal waste 1 Code enforcement 1 Collaboration 32 Common standards 1 Community foundations 1 Community members 3 Complement 1 Comprehensive approach 15 Consistency 1 Consumption 1 Coordination 1 Cost 1 Cost benefit 1 Cost saving 1 Dampness 1 Data 1 DOE 3 Economic Benefits 6 Economic development 1 Education 36 Eight elements 1 Energy efficiency 18 EPA 5

Krulia 24
Equity 1 Family 3 Federal 1 Fly ash 1 Foreclosure prevention 4 Foreclosures 1 Foster care 1 Funding 13 GHH Label 1 Government Facilitation 32 Green 3 Green Building 3 Green Communities 2 Hazards 1 HBCU 1 HDHHS 1 Health 21 Healthy Homes 20 Historic Homes 1 Home Inspector 2 Housing 4 Housing Choice 1 HUD 1 Incentive 4 Indoor air 2 Indoor policies 3 Influence 1 Innovative Strategy 55 Inspection Process 3 Insurer 1 Integration 11 IPM 1 Jobs 1 Labeling 1 Lead 9 Leadership 1 Legislation 1 Leverage 2 Local government 4 Low literacy 1 Maintenance 1 Measure results 3 Media 1 Medicaid 1 Mobilize 1
Krulia 25
Moisture 5 Mold 9 Multilingual 1 Native American 1 Neighborhood stabilization 1 Outreach 1 Overcrowding 1 Partnerships 5 Pesticides 1 Pests 2 Philanthropy 2 Plumbing 1 Poor conditions 1 Prevention 3 Private sector 10 Processes 13 Property insurance 1 Public 2 Public awareness 1 Radon 5 Rating 1 Recycling 1 Regulation 1 Relocation 1 Reo housing 1 Residential retrofit 1 Resources 20 RRNC 1 Rural 1 Safety 11 Saleability 1 Sham recycling 1 Social media 1 Sovereignty 1 Standards 8 Stickman 2 Strategy 1 Supplement 1 Survey 1 Sustainability 3 Team work 1 Technology 1 Texting 1 Tools 5 Toxic 1

Krulia 26
Toxics 1 Training 19 Transparency 1 Tribes 2 Uniform 3 Vapor intrusion 1 Volunteers 1 WAP 5 Weatherization 18 Wellness house 1 Window replacement 2

Krulia 27
Appendix C10
Participation Metrics Live Dates 11/4-11/22 (19 days) Registered Users (per day)
320 (16.84)
Unique Ideas (per day) (per registered user)
100 (5.26) (0.31)
Comments (per day) (per registered user)
375 (19.74) (1.17)
Ratings (per day) (per registered user)
290 (15.26) (0.91)
Avg. Comments/Idea 3.75 Avg. Ratings/Idea 2.90
Traffic Metrics Time period 11/8-11/22 (15 days)* Visits (visits/day)
2,513 (168)
Unique visitors** (new visitors/day)
1,175 (78)
Avg. Page Views 7.83 Bounce Rate (%)*** 33.78% Avg. Time on Site 8:20 Direct Traffic (%)**** 79.63% *Although the Dialogue was life for 19 days from 11/4-11/22, traffic numbers were only captured from 11/8-11/22 **Unique visitors (or absolute unique visitors) represent the number of unduplicated (counted only once) visitors to the website over the course of a specified time period. Although each visitor is identified as unique, it constitutes an unique visit from an IP address. Thus, an individual could have visited the Dialogue site from three separate computers or IP addresses. In this case, Google would count each visit as a unique visitor. ***The bounce rate is the percentage of visits that entailed only visiting the first page of the site. This metric provides an indication of how much users felt enticed to view other pages and engage with the site. ****Direct traffic measures the percentage of visits to the site that came from users clicking an email link or directly typing the URL into their web browser.
10 Data compiled in The National Academy of Public Administration’s Interim Report to The Green and Healthy Homes Initiative in December 2010.

Krulia 28
Registered Users by Sector
Non-profit-Local 63 Local Government 47 Non-Profit – National 47 Federal Government 33 State Government 27 Private Sector 23 Construction/Contractor 16 Homeowner/Landlord 6 Philanthropy – Local 5 Philanthropy – National 4 Tribal Government 3 Tenant 1 Other 44 Total Registered Users 320 *Count of registered users excludes administrative and test accounts created by Deliv and the National Academy
Registered Users by Interest Environmental Health 93 Public Health 89 Energy Efficiency 33 Housing Rehabilitation 20 Community Development 16 Government Innovation 14 Neighborhood Stabilization 14 Weatherization 11 Housing Policy 10 Children/Youth 9 Education 9 Workforce 9 Older Adults 3 Safety 2 Other 21 *During registration, participants were allowed to select up to two interests