a demand driven assessment of farmers-to … · a demand driven assessment of farmers-to-consumer...
TRANSCRIPT

A DEMAND DRIVEN ASSESSMENT OF FARMERS-TO-CONSUMER DIRECT MARKETING AGRI-TOURISM INDUSTRY IN THE MID-ATLANTIC UNITED STATES
FY 2009
Agri-tourism, along with direct marketing and subsequent farm-related activities and locally produced goods, constitutes one of the more considerable industries in New Jersey, Pennsylvania, and Delaware, which jointly form the Mid-Atlantic region of the United States. The industry itself allows farmers to make a profitable living while providing goods and services that satisfy the wide range of consumers’ needs and wants. This research study evaluates results from a survey administered to consumers in the three states and analyzes the current characteristics of the business, including which direct market outlet types appear to be the most utilized and most successful as well as consumer preferences and habits with respect to goods, services, and agricultural site visits. Farmers in the region will be able to improve their businesses and offer more to consumers based on the information provided by the study, and may also be used in similar farming states outside of the specified region. FINAL REPORT APPENDIX 1 – Demographics of Consumers Participating in Hay Rides APPENDIX 2 – Success Attributes--Direct Farmers Markets and Agri-Tourism APPENDIX 3 – Agri-Tourism Consumers’ Participation in Wine Tasting Events APPENDIX 4 – Survey Instrument Contact: Ramu Govindasamy Professor, Dept. of Agricultural, Food and Resource Economics Associate Director, New Use Agriculture and Natural Plant Products Extension Specialist, Rutgers Cooperative Extension Rutgers-The State University of New Jersey 848-932-9192 [email protected]

A Demand Driven Assessment of Farmer-to-Consumer Direct
Marketing and Agri-Tourism Industry in the Mid-Atlantic
United States
Final Report Submitted to Agricultural Marketing Service, USDA
Prepared by
Ramu Govindasamy
Gianna Mazella
Stephen Komar
John Bernard
and
Kathleen Kelley
Professor, Department of Agricultural, Food and Resource Economics, Rutgers, the State
University of New Jersey;
Graduate Student, Department of Agricultural, Food and Resource Economics, Rutgers, the State
University of New Jersey;
County Agricultural Agent, Sussex County, Rutgers, the State University of New Jersey;
Professor, Department of Food and Resource Economics, University of Delaware;
Professor, Horticultural Marketing and Business Management, The Pennsylvania State
University.
October 2013
This project was supported with matching funds by The Federal-State Marketing Improvement
Program (FSMIP), Agricultural Marketing Service, USDA,
Contract # 12-25-G-0894.

i
TABLE OF CONTENTS Page
Table of Contents ....................................................................................................................... i
List of Tables ............................................................................................................................. ii
List of Figures ............................................................................................................................ v
Executive Summary ................................................................................................................... vi
Introduction ................................................................................................................................ 1
Methodology .............................................................................................................................. 8
Sample Details ................................................................................................................. 10
Study Results ............................................................................................................................. 11
Characteristics of Survey Respondents ...................................................................................... 64
Conclusions ................................................................................................................................ 71
References .................................................................................................................................. 74
Appendix -1: Demographic Characteristics of Consumers Who Participated in Hayride
Event of an Agritourism Activity: A Predictive Model Approach………………...............
76
Appendix -2: Uncovering success attributes for the direct farmers markets and agri-
tourism in the Mid-Atlantic region of the United States: A Factor Analysis…………........
90
Appendix -3: Agritourism Consumer’s Participation in Wine Tasting Events: An
Econometric Analysis………………………………………………...................................
111
Appendix-4: FSMIP Direct Marketing and Agritourism Consumer Survey………........... 146

ii
LIST OF TABLES
Page
Table 1. Distribution of Respondents by Marketing Outlets ....................................................11
Table 2. Respondents’ Participation in Agri-tourism Activities and/or Events........................12
Table 3. In General, in the Past Five Years (Since 2005), Changes in the Consumption of Fruits
and/or Vegetables in Respondents’ Household ............................................................13
.......................................................................................................................................
Table 4. In General, in the Past Five Years (Since 2005), Changes in the Consumption of
Wider Variety of Fruits and/or Vegetables in Respondents’ Household ......................14
Table 5. Respondents’ Opinion in Comparing Product Among Direct Marketing Outlets ......18
Table 6. Percentage Distribution of Fresh Fruits/Vegetables Purchased from Outlets ............19
Table 7.1. Respondents’ Plans to Visit Direct Marketing Outlets (Pick-your-own, Community
Farmers’ Market and On-Farm Market) in 2010 ..........................................................20
Table 7.2. Respondents’ Plan to Visit Direct Marketing Outlets (Roadside stand, Community
Supported Agriculture and other) in 2010 ....................................................................22
Table 8. Respondents’ First Time Sources of Marketing Outlets Information.........................23
Table 9.1. Respondents’ Purchasing Behavior of Fresh Apples and Strawberries from Direct
Marketing Outlets .........................................................................................................24
Table 9.2. Respondents’ Purchasing Behavior of Fresh Peaches and Blueberries from Direct
Marketing Outlets .........................................................................................................25
Table 9.3. Respondents’ Purchasing Behavior of Fresh Melons and Watermelon from Direct
Marketing Outlets .........................................................................................................26
Table 9.4. Respondents’ Purchasing Behavior of Other Fresh Fruits from Direct Marketing
Outlets ...........................................................................................................................27
Table 10.1. Respondents’ Purchasing Behavior of Fresh Tomato and Pepper from Direct
Marketing Outlets .........................................................................................................28
Table 10.2. Respondents’ Purchasing Behavior of Fresh Sweet Corn and Snap Beans from
Direct Marketing Outlets ..............................................................................................29
Table 10.3. Respondents’ Purchasing Behavior of Fresh Broccoli and Onion from Direct
Marketing Outlets .........................................................................................................30
Table 10.4. Respondents’ Purchasing Behavior of Fresh Potato and Squash from Direct
Marketing Outlets .........................................................................................................32

iii
Table 10.5. Respondents’ Purchasing Behavior of Fresh Cucumber and Other Vegetables from
Direct Marketing Outlets ..............................................................................................33
Table 11. Percentage Distribution of Respondents’ Willingness to Pay for Products from Direct
Marketing Outlets .........................................................................................................35
Table 12. Respondents’ Opinion Towards Willingness to Buy Specific Products from Direct
Marketing Outlets .........................................................................................................36
Table 13. Respondents’ Awareness About Agri-tourism Concepts .........................................37
Table 14.1. Different Products Purchased by Consumer during Agri-tourism Activity (Fresh
Fruits and Vegetables, Decorative/Crafts, Wine, Honey, Firewood and Ornamentals)
.......................................................................................................................................38
Table 14.2. Different Products Purchased by Consumer during Agri-tourism Activity
(Vegetable Transplants, Seasonal Decorations, Pumpkin/Corn Stalks, Christmas Trees,
etc.)................................................................................................................................39
Table 15. Respondents’ Visiting Seasons for Agri-tourism Activity .......................................42
Table 16. Respondents in Advance Planning to Attend Agri-tourism Activity .......................43
Table 17.1. Important Factors (Facilities, Farm Products and Educational Activities)
Influencing Visit to Agri-tourism Location) .................................................................44
Table 17.2. Important Factors (Natural Scenes, Petting Zoos and Proximity) Influencing Visit
to Agri-tourism Location ..............................................................................................46
Table 17.3. Important Factors (Events, Activities and Restaurants) Influencing Visit to Agri-
tourism Location ...........................................................................................................47
Table 18.1. Respondents’ Rating the Quality of the Products from the Agri-tourism and Direct
Marketing Outlets .........................................................................................................49
Table 18.2. Respondents’ Rating the Quantity of the Products from the Agri-tourism and Direct
Marketing Outlets .........................................................................................................50
Table 18.3. Respondents’ Rating the Variety of the Products from the Agri-tourism and Direct
Marketing Outlets .........................................................................................................51
Table 18.4. Respondents’ Rating the Price of the Products from the Agri-tourism and Direct
Marketing Outlets .........................................................................................................52
Table 18.5. Respondents’ Rating the Establishment Appearance of Agri-tourism and Direct
Marketing Outlets .........................................................................................................53
Table 18.6. Respondents’ Rating the Cleanliness of the Establishment of Agri-tourism and
Direct Marketing Outlets ..............................................................................................54

iv
Table 18.7. Respondents’ Rating Towards Convenience of Opening Days and Timings of the
Establishment ................................................................................................................56
Table 18.8. Respondents’ Rating Towards Convenience of Location of Agri-tourism and Direct
Marketing Outlets .........................................................................................................57
Table 18.9. Respondents’ Rating the Employee Attitude of Agri-tourism and Direct Marketing
Outlets ...........................................................................................................................58
Table 18.10. Respondents Rating the Employee Knowledge of Agri-tourism and Direct
Marketing Outlets .........................................................................................................59
Table 19.1. Important Deciding Reasons (Purchase Produce/Value-Added Products and
Support Local Farmers) to Visit an Agri-tourism Location for an Activity or Event ..61
Table 19.2. Important Deciding Reasons (Enjoy the Rural Scenery/Nature, Spend Time with
Family/Friends and Learn How Food is Grown) to Visit an Agri-tourism Location for
an Activity or Event ......................................................................................................62
Table 19.3. Important deciding reasons (To See How Food is Produced, Convenient Location
and Experience of Farm Visit) to Visit an Agri-tourism Location for an Activity or
Event .............................................................................................................................63
Table 20. Number of Years Living at Current Location ...........................................................64
Table 21. Distribution of Respondents’ Household Size ..........................................................67
Table 22. Number of People Under Age 17 in Respondents’ Household ................................67
Table 23. Survey Respondents’ Age Distribution ....................................................................68
Table 24. Survey Respondents’ Education Status ....................................................................69
Table 25. Survey Respondents’ Employment Status ................................................................69
Table 26. Survey Respondents’ Ethnic Distribution.................................................................70
Table 27. Household Annual Income Distribution ...................................................................70

v
LIST OF FIGURES
Page
Figure 1. Distribution of Survey Respondents ..........................................................................10
Figure 2. Average Monthly Household Expenditures on Fresh Fruits/Vegetables and
Value-Added Products ..................................................................................................14
Figure 3. Average Number of Visits per Year to Marketing Outlets ........................................15
Figure 4. Average Expenditures per Visit at Direct Marketing Outlet and Family Size ..........16
Figure 5. Average Proximity (One-Way) to Each Direct Marketing Outlet .............................17
Figure 6. Respondents Willingness to Pay for Products from Direct Marketing Outlets .........34
Figure 7.1. Number of Times Visiting Agri-tourism Site per Year ..........................................40
Figure 7.2. Average Amount ($) Spent During a Visit to an Agri-tourism Activity or Event .40
Figure 7.3. Visiting (Average) Number of Different Agri-tourism Locations per Year ..........41
Figure 7.4. Average Number of Miles Traveled (one way) to Agri-tourism Sites ...................41
Figure 8. Respondents Repeatedly Returning to the Same Agri-tourism Location ..................43
Figure 9. Distribution of Respondents’ Purchase from Direct-Marketing Agri-tourism Outlets
.......................................................................................................................................48
Figure 10. Distribution of Respondents by Location ................................................................64
Figure 11. Respondents’ Support Towards Agriculture Helps Maintain Open Space and
Greenery. .......................................................................................................................65
Figure 12. Respondents Who Have Garden at Home ...............................................................65
Figure 13. Willingness to Pay for Farmland Preservation and Support Local Farmers ...........66
Figure 14. Survey Respondents’ Gender ..................................................................................68

vi
EXECUTIVE SUMMARY
Agri-tourism, along with direct marketing and subsequent farm-related activities and
locally produced goods, constitutes one of the more considerable industries in New Jersey,
Pennsylvania, and Delaware, which jointly form the Mid-Atlantic region of the United States.
The industry itself allows farmers to make a profitable living while providing goods and
services that satisfy the wide range of consumers’ needs and wants. This research study
evaluates results from a survey administered to consumers in the three states and analyzes the
current characteristics of the business, including which direct market outlet types appear to be
the most utilized and most successful as well as consumer preferences and habits with respect
to goods, services, and agricultural site visits. Consequently, farmers in the region will be able
to improve their businesses and offer more to consumers based on the information provided by
the study, and may also be used in similar farming states outside of the specified region.
More often than not, consumers demonstrated that they were generally happy with the
current quality, quantity, and variety of goods and services offered at direct marketing outlets
they visited. The study also indicates that most consumers were willing to pay for the goods
and services from these sites. This is critical since respondents also claimed that they have
begun to consume a wider variety and a greater amount of vegetables and fruits in the past five
years, showing there is potential for outlets to grow by offering produce they currently do not
supply. According to the survey, it seems many individuals do not know about certain agri-
tourism concepts, like “ecotourism” and “green tourism,” which they could be interested in,
and thus shows that there is even further potential for businesses to expand and/or appeal to
interested consumers.
Aside from these factors, study results suggest other steps that may be followed to
improve business at direct marketing outlets. One suggestion is based on part of the survey
where consumers were asked about the importance of additional amenities offered at agri-
tourism locations, such as restrooms, shops, and classes. While only a minority claimed
having these available would be ‘extremely important,’ adding these may provide markets with
additional revenue as shops and classes could attract consumers interested in making purchases
and/or who desire to learn about agricultural topics while restrooms allow customers to remain
at a location for a longer period of time. Moreover, it was found that agri-tourism locations are
not patronized as much during the winter season, so owners could capitalize on this shortfall
vii
and develop ideas to attract audiences during slower periods in an effort to become more
economically sustainable.
Based on survey responses, one can assume that consumers will continue to patronize
these businesses in the future regardless of any changes being made. However, patronage
could definitely increase if more goods and services that appeal to clientele were offered.
Suggestions based on responses may encourage farmers and direct marketing outlet owners to
develop new plans involving more crops, improve quality, offer events, and select appropriate
advertising techniques to attract more consumers to their business. By having a better
understanding of what consumers want and like, both patrons and owners will be able to
benefit from these efforts and potential outcomes.

1
INTRODUCTION
In recent years, changes in agriculture, population, and urban development have
occurred, significantly impacting the existing framework of agricultural businesses in the Mid-
Atlantic region of the U.S. In response, farmers in these areas have turned to direct marketing
and agri-tourism strategies in order to ensure that their farms remain profitable and viable. By
using these alternative business methods, they have also increased the range of the goods and
services they provide to consumers to satisfy their preferences and for themselves to remain key
players in the agricultural market. In this region, as well as around the globe, agri-tourism and
direct marketing are seemingly logical and imperative practices, allowing farmers and
landowners to capitalize on new economic opportunities.
Direct marketing is a technique that allows farmers to sell their products directly to their
targeted consumers, rather than having their goods pass through several hands before it reaches
the consumer, as it often has. This practice typically results in the farmer receiving a greater
profit for their goods. Products most commonly sold at direct markets include fruits, vegetables,
bakery products, flowers, nursery products, eggs, and dairy products (Nayga et al., 1995;
Govindasamy, 1996b). By using direct marketing, producers can cut out the “middleman” in a
lot of their operations and eliminate additional expenditures on services such as packaging,
storing, transporting, and marketing the goods. There are several forms of farmer-to-consumer
direct markets, including: pick-your-own operations (PYO), roadside stands, community
supported agriculture (CSA) farms, community farmers’ markets, and on-farm markets. PYO
operations enable consumers to harvest their own produce from the farmers’ fields, allowing
them to choose and buy only the amount and quality of food they desire. Roadside stands are
structures set up near roadways by farmers in order to sell their own seasonally grown produce.

2
CSA farms are supported by a group of members who create a relationship with the farmer by
paying a fee and investing in the farm in exchange for a weekly assortment of produce.
Community farmers’ markets are establishments where farmers can bring their goods to be sold
to consumers alongside those of other farmers. In contrast, on-farm markets are permanent
structures built on the farmer’s property where they sell their own produce to consumers. Each
of these outlets provides opportunities for consumers to obtain the goods and services they
desire.
Though not every direct marketing outlet type is currently recognized by the public, the
idea of such establishments has been in practice for decades and is not a new practice for
farmers. To help develop the industry in the past, the Farmer-to-Consumer Direct Marketing Act
of 1976 was established to provide $3 million in federal grants to initiate, promote, facilitate,
develop, or coordinate methods of direct marketing from farmers to consumers. This act
recognized the importance, potential, and promise of direct marketing operations in the future,
especially in its role in improving the agricultural economy (Linstrom, 1978). To prove its
success, the USDA’s Agricultural Marketing Service recorded a growing number of farmers’
markets in the U.S. in just recent years. It found an increase from 4,385 farmers’ markets
nationwide in August 2006 to 4,685 in August 2008 (AMS, 2008). Also in recent years, the
Grow New York Enterprise Program was established to also help boost the industry by making
loans to help develop and expand production agriculture and agribusinesses (GNYEP). In 2007,
it invested nearly $1.5 million in 88 projects specifically to develop farm business strategies,
support innovative research projects, improve farmers’ markets and assist in agri-tourism
projects (NYSDAM, 2007). With the help of grants and loans to farm enterprises, agribusinesses

3
have clearly been successful over time, and have thus also prospered from individuals who visit
the businesses nationwide.
Some of the more lucrative and popular agribusinesses are farms that offer agri-tourism.
Agri-tourism can generally be described as any farm or agriculturally based operation that
attracts visitors for recreational or educational purposes and generates additional income for the
owner. In many cases, the infrastructure at these locations is not utilized year-round, and thus
becomes the perfect stage for agri-tourism activities, such as corn mazes, hayrides, and food
festivals. However, agri-tourism can also include activities that are also considered direct
markets, such as PYO operations. Many consumers in the region take advantage of these
offerings because of their interest in having agricultural experiences, making agri-tourism a
general success.
Patrons from the Mid-Atlantic region patronize farms and farm-based activities, like
agri-tourism, because they recognize the quality and value of fresh agricultural products that
come directly from farms, rather than products that are packaged and shipped to other wholesale
and retail markets. This, along with feeling that they can get fresh, high quality produce for a
better price than products sold at supermarkets, while producers know that they can get a higher
margin directly from the consumers, has stimulated a growth in direct marketing (Tracy et al.,
1982). Also, the annual per capita consumption of fresh fruit and fresh vegetables increased by
21 percent and 14 percent, respectively, from 1980 to 1994, even when prices for the fresh
produce was almost double than processed produce (Govindasamy et al., 1998). This has
prompted consumers to patronize direct marketing outlets more frequently, and continues to
provide opportunities for business growth. Even more importantly, the projected increase for per
capita food expenditures between 2000 and 2020 are anticipated to be an increase of 8.1 percent

4
for fruits and 7.2 percent for vegetables (Blisard et al., 2002). Thus such outlets may provide
even greater monetary value for consumers who frequent direct markets.
To give an idea of recent agri-tourism and direct markets successes, one may examine the
volume of travelers that stop at the previously mentioned enterprises. Between 2000 and 2001,
the U.S. Department of Agriculture estimated that more than 62 million Americans, who were at
least 16 years of age or older, and 20 million children, under age 16, visited a farm (NSRE 2002;
Wilson, Thilmany and Sullins 2006). Their genuine interest in agri-tourism and supporting
direct marketing also fuels travel and tourism. In fact, prior to this study, the Purdue Tourism
Hospitality Research Center had projected that between 1997 and 2007, nature and agricultural-
based tourism would be the fastest growing segment of the travel and tourism industry (Industry
Development, 2011). It is clear that the desire for tourism, along with value of quality goods and
services, will continue to attract consumers in the future, assuming that demand will continue to
be met by agribusinesses.
Not only are direct marketing and agri-tourism economically advantageous, but they also
provide social benefits for business owners and consumers alike. Farmers can build relationships
with the individuals using their resources and consuming their products, and may even form a
community around their business by dealing directly with consumers. These aspects become
critical in a business where customer satisfaction is highly impacted by the quality and freshness
of products. The two practices may also enhance the overall quality of life in some areas,
especially urbanizing areas, by offering recreational outlets for individuals and a business that
would generate income and employment in that area, by preserving agricultural lands and open
spaces, and by contributing to community development simultaneously (Henderson and
Linstrom, 1982; Linstrom, 1978; Govindasamy, 1996a;). A cooperative relationship is essential

5
for agricultural businesses to succeed and strive in an area where urbanization and changes are
always taking place.
Since marketing has become a new challenge that faces many farmers in the Mid-Atlantic
region of the U.S, this study was designed to investigate and document the characteristics, needs,
motivations, and interests of direct marketing and agri-tourism consumers in order to make
adjustments that would better serve consumers and allow farmers to enhance their agricultural
businesses. However, agri-tourism is not limited to this region. It is becoming a nationwide
practice, and thus the need for consumer demand information is imperative and could benefit all
regions in the U.S. Existing literature shows that studies and data have been evaluated in
specific states, as well as across the U.S., to determine factors that influence visitations to agri-
tourism locations.
A recent study was completed on Colorado agri-tourism and factors that affect potential
tourists’ travel plans to visit agri-tourism sites within the state. Factors studied during
implementation of the Colorado study, including participants’ tastes and preferences, were based
on similar activities to the Mid-Atlantic study, but topics investigated also included ranch related
recreation, which is not as commonly found in the Northeastern region of the U.S. The Colorado
study found that income level, urban influence, planned travel through either the Colorado
Tourism Office or through magazines positively influenced travel and related expenditures
(Gascoigne, Sullins, and McFadden, 2008). Characteristics of travelers who were more likely to
visit were also defined. In particular, age, income, marital status, family composition, and race
were all considered, with travelers from higher-income and white households being more likely
to visit (Gascoigne, Sullins, and McFadden, 2008). Upon a closer look, one may find that some
of these findings hold true across the U.S. as well as in the Mid-Atlantic region.

6
Research has also focused on the agri-tourism industry in Pennsylvania, providing a basis
of information for states located in the Northeast. The study surveyed both visitors and operators
of agri-tourism ventures to define the characteristics of agritourists and their visits. Results
showed that visitors to Pennsylvania agri-tourism sites, especially lodging businesses, had a
stable disposable income and leisure time to visit and stay at such places (Ryan, DeBord, and
McClellan, 2006). Clientele at the selected agri-tourism venues were generally couples or
families who drove two to three hours to Southeast Pennsylvania, or who were within 50 miles
of the area (Ryan, DeBord, and McClellan, 2006). More importantly, they found that only 34%
of respondents recognized the term agri-tourism, showing that even if they participated in such
activities, they did not identify with the market itself.
On a national level, a group of researchers used data from the 2000 National Survey on
Recreation and the Environment to define factors that affect visits to farms, and the
corresponding consumer demands. Across the U.S., they found that the average farm visitor was
more educated, had a higher family income, is younger, and belongs to a household with more
family members than non-visitors (Carpio, Wohlgenant, and Boonsaeng, 2008). Like most
studies, it also evaluated the likeliness of an individual to visit a farm based on their ethnicity and
marital or family status. They found that whites were more likely to visit a farm, and Hispanics
were less likely; however, independent of ethnicity, if children under six years old were present
in the household, this would increase the likeliness of visiting an agri-tourism site (Carpio,
Wohlgenant, and Boonsaeng, 2008). As evaluated in this study, the required travel distance to
the farm, as well as the cost of travel, also impacted the decision to visit. Generally, in the U.S.,
the cost of the trip has a negative effect on the number of trips taken by individuals, and those
who live in rural areas make more trips on average than those living in urban areas (Carpio,

7
Wohlgenant, and Boonsaeng, 2008). Many of the influencing factors and characteristics of
visitors found in the nationally based study are very similar to those found in the research
explained by this paper based on the Mid-Atlantic region.
Research has also found that visits to direct market types may vary by location and
consumer economic and demographic characteristics (Govindasamy and Nayga, 1997). For
example, a consumer may decide to buy from a roadside stand because of its convenient
location, while a family may drive a longer distance to a PYO operation for its recreational
qualities (Govindasamy, 1996c; Govindasamy and Nayga, 1996
b). Or, a low-income consumer
may shop at a farmers’ market due to lower prices for products compared to supermarket prices,
while high-income individuals could be motivated to patronize farm markets due to their desire
to keep in touch with farm life (Govindasamy et al., 1995). However, these characteristics are
constantly evolving, continually providing opportunities for entrepreneurial farmers to respond
to consumers’ changing food preferences and eating patterns, especially as the U.S. population
ages and becomes more affluent and diverse (Ballenger and Blaylock, 2003).
Factors that derive demand for agri-tourism businesses and determine who will visit are
imperative to know in order to further develop plans on an individual level. Since both direct
marketing and agri-tourism are key regional business development strategies, all information that
comes directly from consumers could motivate owners to plan, act, and improve their businesses
in accordance with the findings. Results could also be applied to other regions, especially in
areas where agriculture businesses are facing issues such as urbanization pressures, which could
lead to a decline in the number of farms or direct markets.

8
METHODOLOGY
An Internet survey of consumers residing in Delaware, New Jersey, and Pennsylvania
was conducted 21 to 29 June 2010 to document the characteristics of consumers who buy at
farmer-to-consumer direct market outlets and/or visit agri-tourism operations in the Northeast
and identify factors that influence their purchase behavior.
The survey instrument was developed using SurveyMonkey.com (Palo Alto, CA), an on-
line survey tool that allows researchers to design and implement an on-line survey. The survey
was pre-tested on a subset of the target consumer population (n=93) to refine and clarify
misleading or misunderstood questions prior to full deployment of the survey. Participants were
selected at random from a panel of participants managed by Survey Sampling International, LLC
(Shelton, CT), a provider of sampling solutions for survey research. Panelists received a
consent statement along with a link to the survey developed by researchers and approved by the
Office of Research and Sponsored Programs at Rutgers Univ. and the Office of Research
Protections at the Penn. State Univ. All potential participants were screened and asked to
participate if they were: 1) age 18 and older, to ensure that only adults participated; 2) the
primary food shopper for the household; and 3) had attended agri-tourism and direct marketing
events or activities in the past. Panelists were informed of this criterion as well as their
compensation, an entry into Survey Sampling International, LLC’s quarterly $25,000
sweepstakes and an instant win game play, which is standard compensation for these panelists, in
the consent statement. To begin the survey, panelists clicked on a hyperlink at the bottom of the
consent statement, which then directed them to the survey welcome screen.
Of the 2594 members who were registered with this panel and accessed the survey (309
from DE, 952 from NJ, and 1384 from PA), 1134 (1110) met the screener criteria and began the

9
questionnaire, with 993 (972) completing the 15-min survey (122 (121) from DE, 364 (358) from
NJ, and 507 (493) from PA). Panelists were asked to quantify the amount of produce purchased
at direct marketing outlets, type of produce bought, number of visits per month, and dollars spent
during visits to each of the farmer-to-consumer direct market outlets and agri-tourism operations
targeted, as well as demographic questions (e.g., age; gender; 2009 annual gross household
income; household size). After participants submitted their completed survey they were directed
to a thank you page.

10
SAMPLE DETAILS
Survey participants were selected randomly from direct marketing and agri-tourism
consumers in the Mid-Atlantic region, specifically in the states of New Jersey, Delaware, and
Pennsylvania. In order to develop a sample that would accurately capture agri-tourism
operations in the specified geographic area, the total number of samples from each state was
based accordingly on the current population of the respective state, meaning that Pennsylvania
would have the most respondents, followed by New Jersey, and lastly Delaware. The
distribution of survey respondents is shown in Figure 1 below.
This distribution and population numbers are not surprising given the size of each state and the
corresponding number of farms. In 2007, the USDA reported 63,163 farms in Pennsylvania,
10,327 farms in New Jersey, and 2,546 in Delaware, supporting the apportionment of
respondents (USDA). Having a large scope and variety of farms and participants involved in the
study, as seen here, will ensure that data collected is appropriate and will be applicable to all
interested individuals from the Mid-Atlantic region chosen for the study.

11
STUDY RESULTS
An important piece of information needed in order to properly apply any findings from
the study is to know which direct market outlets are visited most. Participants were asked about
all of the types of direct market outlets types they typically patronize. The survey included four
of the outlet types described in the introduction: Pick-your-own (PYO) farms, community
farmers’ markets, community supported agriculture (CSA) farms, and on-farm markets.
Distribution of respondents per outlet type and per state is detailed in Table 1.
Table 1. Distribution of Respondents by Marketing Outlets
Direct Market Outlets
State
TOTAL Delaware New Jersey Pennsylvania
N % N % N % N %
Pick-your-own farm 71 53.38% 225 53.07% 259 44.89% 555 48.94%
Community Farmers' Market 110 82.71% 340 80.19% 491 85.10% 941 82.98%
Community Supported Agriculture
(CSA) farm 9 6.77% 49 11.56% 51 8.84% 109 9.61%
On-Farm Market 77 57.89% 241 56.84% 309 53.55% 627 55.29%
All 133 100.00% 424 100.00% 577 100.00% 1134 100.00%
Note: N = Frequency, % = Percent, since respondents selected more than one choice,
total percentages do not add to 100%
Across the board, community farmers’ markets were the most frequented, with approximately 80
percent of respondents from each state saying they support this outlet type. CSA farms were the
least popular outlet type, perhaps due to the more elaborate procedure it takes to participate and
obtain goods from such operations. About 50 percent of respondents claim that they visited and
shopped at both on-farm markets and PYO farms in the three states. Many times, on-farm
markets also offer PYO resources, and vice versa, giving consumers the opportunity to do
business with both outlets in one visit. For example, a shopper may visit a PYO farm to pick
blueberries first, but then also shop around in the on-farm market retail area for something like
jams and jellies before they leave.
Table 2 details what activities consumers participate in the most in terms of agri-tourism.
Of the broad variety of activities, only about one-third to one-half of these leisure activities had a
12
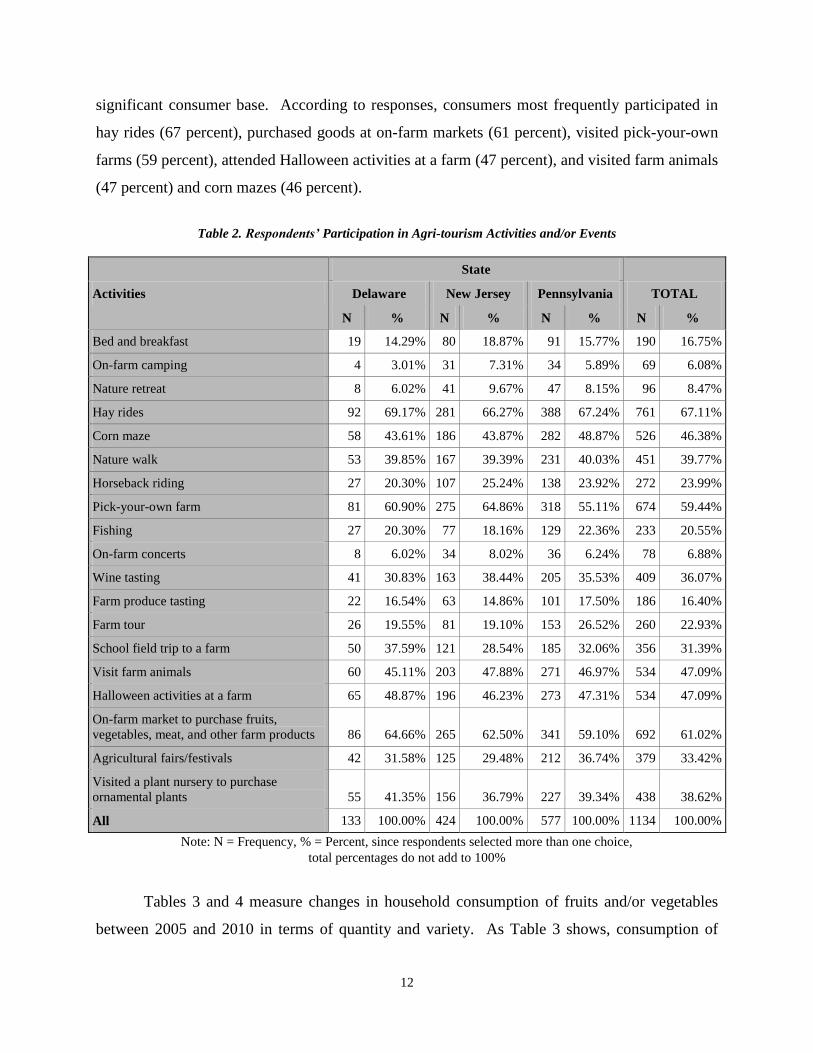
significant consumer base. According to responses, consumers most frequently participated in
hay rides (67 percent), purchased goods at on-farm markets (61 percent), visited pick-your-own
farms (59 percent), attended Halloween activities at a farm (47 percent), and visited farm animals
(47 percent) and corn mazes (46 percent).
Table 2. Respondents’ Participation in Agri-tourism Activities and/or Events
Activities
State
TOTAL Delaware New Jersey Pennsylvania
N % N % N % N %
Bed and breakfast 19 14.29% 80 18.87% 91 15.77% 190 16.75%
On-farm camping 4 3.01% 31 7.31% 34 5.89% 69 6.08%
Nature retreat 8 6.02% 41 9.67% 47 8.15% 96 8.47%
Hay rides 92 69.17% 281 66.27% 388 67.24% 761 67.11%
Corn maze 58 43.61% 186 43.87% 282 48.87% 526 46.38%
Nature walk 53 39.85% 167 39.39% 231 40.03% 451 39.77%
Horseback riding 27 20.30% 107 25.24% 138 23.92% 272 23.99%
Pick-your-own farm 81 60.90% 275 64.86% 318 55.11% 674 59.44%
Fishing 27 20.30% 77 18.16% 129 22.36% 233 20.55%
On-farm concerts 8 6.02% 34 8.02% 36 6.24% 78 6.88%
Wine tasting 41 30.83% 163 38.44% 205 35.53% 409 36.07%
Farm produce tasting 22 16.54% 63 14.86% 101 17.50% 186 16.40%
Farm tour 26 19.55% 81 19.10% 153 26.52% 260 22.93%
School field trip to a farm 50 37.59% 121 28.54% 185 32.06% 356 31.39%
Visit farm animals 60 45.11% 203 47.88% 271 46.97% 534 47.09%
Halloween activities at a farm 65 48.87% 196 46.23% 273 47.31% 534 47.09%
On-farm market to purchase fruits,
vegetables, meat, and other farm products 86 64.66% 265 62.50% 341 59.10% 692 61.02%
Agricultural fairs/festivals 42 31.58% 125 29.48% 212 36.74% 379 33.42%
Visited a plant nursery to purchase
ornamental plants 55 41.35% 156 36.79% 227 39.34% 438 38.62%
All 133 100.00% 424 100.00% 577 100.00% 1134 100.00%
Note: N = Frequency, % = Percent, since respondents selected more than one choice,
total percentages do not add to 100%
Tables 3 and 4 measure changes in household consumption of fruits and/or vegetables
between 2005 and 2010 in terms of quantity and variety. As Table 3 shows, consumption of

13
both fresh fruits and vegetables has generally increased in a majority of respondents’ households
since 2005. Specifically, nearly 74 percent of all survey participants increased their consumption
of fruit, and about 68 percent increased vegetable consumption. About a quarter of respondents’
consumption had stayed the same for both produce types, and very few (less than 2 percent for
each) responded that their consumption decreased. This shows that there is little chance that
demand for fresh produce will decrease, but rather it will either remain constant or increase.
Table 3. In General, in the Past Five Years (Since 2005), Changes in the Consumption
of Fruits and/or Vegetables in Respondents’ Household
Consumption
State
ALL Delaware New Jersey Pennsylvania
N % N % N % N %
Consumption of fresh fruits
98 74.24% 294 70.84% 426 75.67% 818 73.69% Increased
Stayed the same 31 23.48% 113 27.23% 129 22.91% 273 24.59%
Decreased 3 2.27% 8 1.93% 8 1.42% 19 1.71%
Total 132 100.00% 415 100.00% 563 100.00% 1110 100.00%
Consumption of fresh vegetables
87 65.91% 277 66.75% 395 70.16% 759 68.38% Increased
Stayed the same 41 31.06% 129 31.08% 159 28.24% 329 29.64%
Decreased 4 3.03% 9 2.17% 9 1.60% 22 1.98%
Total 132 100.00% 415 100.00% 563 100.00% 1110 100.00%
Note: N = Frequency, % = Percent
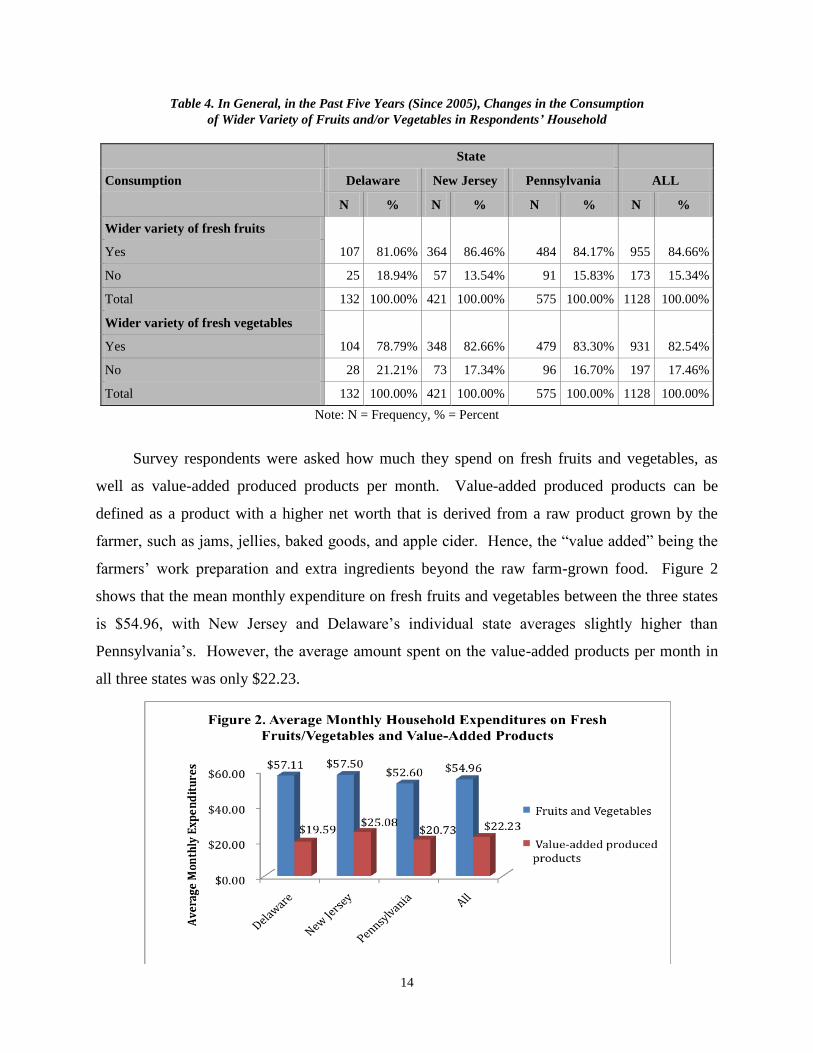
Table 4 shows that the majority of participants’ households had incorporated a wider variety of
fresh fruits and vegetables in their diet. Results show that respondents increased their fruit
consumption only slightly more than their vegetable consumption, with a little over 2 percent
difference between the pair.
14
Table 4. In General, in the Past Five Years (Since 2005), Changes in the Consumption
of Wider Variety of Fruits and/or Vegetables in Respondents’ Household
Consumption
State
ALL Delaware New Jersey Pennsylvania
N % N % N % N %
Wider variety of fresh fruits
107 81.06% 364 86.46% 484 84.17% 955 84.66% Yes
No 25 18.94% 57 13.54% 91 15.83% 173 15.34%
Total 132 100.00% 421 100.00% 575 100.00% 1128 100.00%
Wider variety of fresh vegetables
104 78.79% 348 82.66% 479 83.30% 931 82.54% Yes
No 28 21.21% 73 17.34% 96 16.70% 197 17.46%
Total 132 100.00% 421 100.00% 575 100.00% 1128 100.00%
Note: N = Frequency, % = Percent
Survey respondents were asked how much they spend on fresh fruits and vegetables, as
well as value-added produced products per month. Value-added produced products can be
defined as a product with a higher net worth that is derived from a raw product grown by the
farmer, such as jams, jellies, baked goods, and apple cider. Hence, the “value added” being the
farmers’ work preparation and extra ingredients beyond the raw farm-grown food. Figure 2
shows that the mean monthly expenditure on fresh fruits and vegetables between the three states
is $54.96, with New Jersey and Delaware’s individual state averages slightly higher than
Pennsylvania’s. However, the average amount spent on the value-added products per month in
all three states was only $22.23.

15
To demonstrate how much consumers value direct marketing outlets and what they have
to offer, respondents were asked several questions concerning visitations, expenditures, and
accessibility to determine if there is a correlation between the patronization of one type of farm-
direct marketing outlets over other types. Figure 3 shows that community farmers’ markets get
the most visits per year in each state, approximately seven visits on average, with slightly more
in Delaware and slightly less in New Jersey than Pennsylvania. However, respondents said that
on average they only visit pick-your-own farms and on-farm markets about two and four times a
year, respectively. Community supported agriculture farms are visited the least out of all the
outlets, with a mere less than one visit per year in each state.
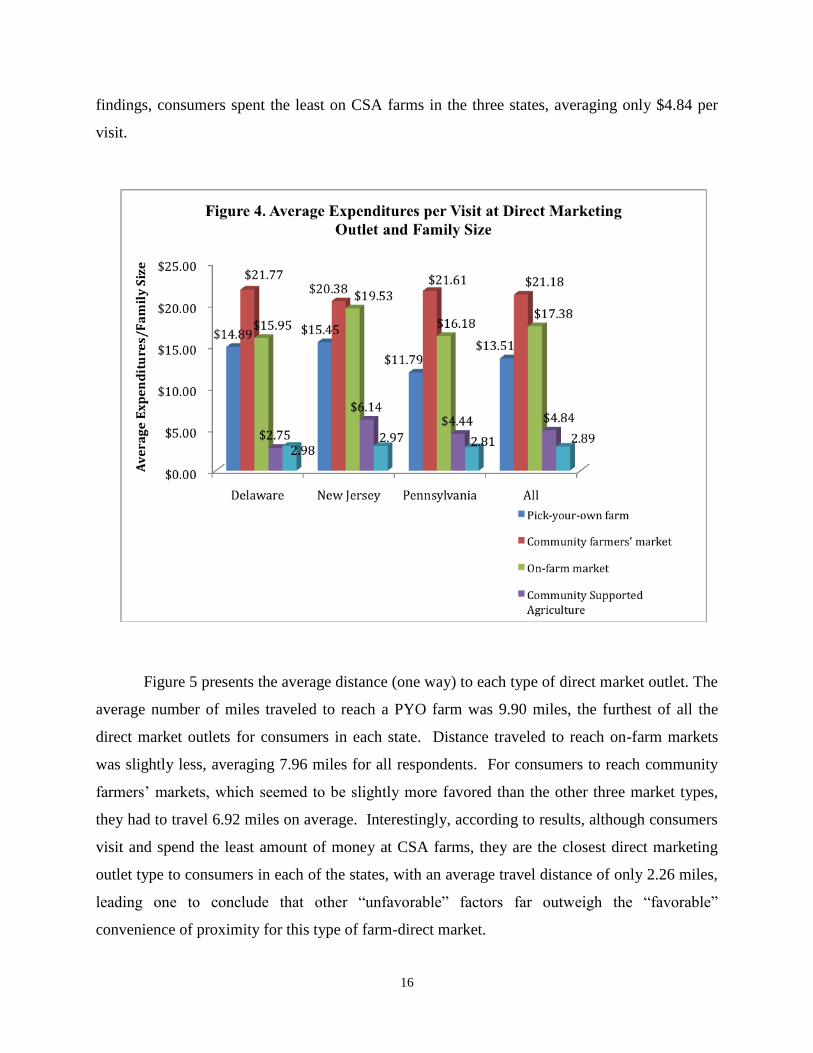
Figure 4 shows the combined per visit average market outlet expenditure as well as
averages segmented by state. As results illustrate, consumers spent the most money at
community farmers’ markets, with an overall average of $21.18 per visit, followed by on-farm
markets, where the average expenditure was $17.38. However, there was some variation based
on participant’s state of residence. New Jersey residents paid up to $19.53 on average at on-farm
market outlets, whereas Delaware residents only paid up to $15.95 per visit. Pertaining to PYO
operations, $13.51 was the average amount; however, there was also some dissimilarity based on
state of residence. Pennsylvania residents claimed they only spent $11.79 per visit at PYO farms,
while New Jersey residents spent up to $15.45 per visit. In accordance with our previous
16
findings, consumers spent the least on CSA farms in the three states, averaging only $4.84 per
visit.
Figure 5 presents the average distance (one way) to each type of direct market outlet. The
average number of miles traveled to reach a PYO farm was 9.90 miles, the furthest of all the
direct market outlets for consumers in each state. Distance traveled to reach on-farm markets
was slightly less, averaging 7.96 miles for all respondents. For consumers to reach community
farmers’ markets, which seemed to be slightly more favored than the other three market types,
they had to travel 6.92 miles on average. Interestingly, according to results, although consumers
visit and spend the least amount of money at CSA farms, they are the closest direct marketing
outlet type to consumers in each of the states, with an average travel distance of only 2.26 miles,
leading one to conclude that other “unfavorable” factors far outweigh the “favorable”
convenience of proximity for this type of farm-direct market.

17
Survey respondents were asked their opinions regarding produce bought from direct
market outlets in comparison to produce bought from more common commercial food outlets
(e.g., grocery stores/supermarkets). Participants were asked whether produce bought from direct
market outlets were better, the same, or worse than produce bought from commercial food
outlets. As shown in Table 5, the majority of respondents from each of the states, nearly 90% of
them, concluded that the quality of produce from farm-direct marketing outlets is better, with
only about 10% of respondents claiming that the quality was the same or worse. However,
feedback on comparing the other two attributes was not as black and white. Only about 60
percent felt that the variety of produce found at direct marketing outlets was better. Thirty
percent felt it was the same, and close to 11 percent thought the variety was worse than what
they could purchase at other produce outlets. A similar perception was found with regard to the
price attribute. Almost two-thirds (61%) of participants responded that direct marketing outlets
have better prices, while nearly 25% said prices were the same, and around 14% responded that
the prices were worse than other consumer outlets.

18
Table 5. Respondents’ Opinion in Comparing Produce Among Direct Marketing Outlets
Produce
Attributes
State
ALL Delaware New Jersey Pennsylvania
N % N % N % N %
Quality attribute
110 88.00% 350 88.16% 492 90.94% 952 89.56% Better
Same 15 12.00% 44 11.08% 47 8.69% 106 9.97%
Worse . . 3 0.76% 2 0.37% 5 0.47%
Total 125 100.00% 397 100.00% 541 100.00% 1063 100.00%
Variety attribute
69 55.20% 226 56.93% 327 60.44% 622 58.51% Better
Same 44 35.20% 131 33.00% 150 27.73% 325 30.57%
Worse 12 9.60% 40 10.08% 64 11.83% 116 10.91%
Total 125 100.00% 397 100.00% 541 100.00% 1063 100.00%
Price attribute
80 64.00% 211 53.15% 360 66.54% 651 61.24% Better
Same 22 17.60% 110 27.71% 129 23.84% 261 24.55%
Worse 23 18.40% 76 19.14% 52 9.61% 151 14.21%
Total 125 100.00% 397 100.00% 541 100.00% 1063 100.00%
Note: N = Frequency, % = Percent
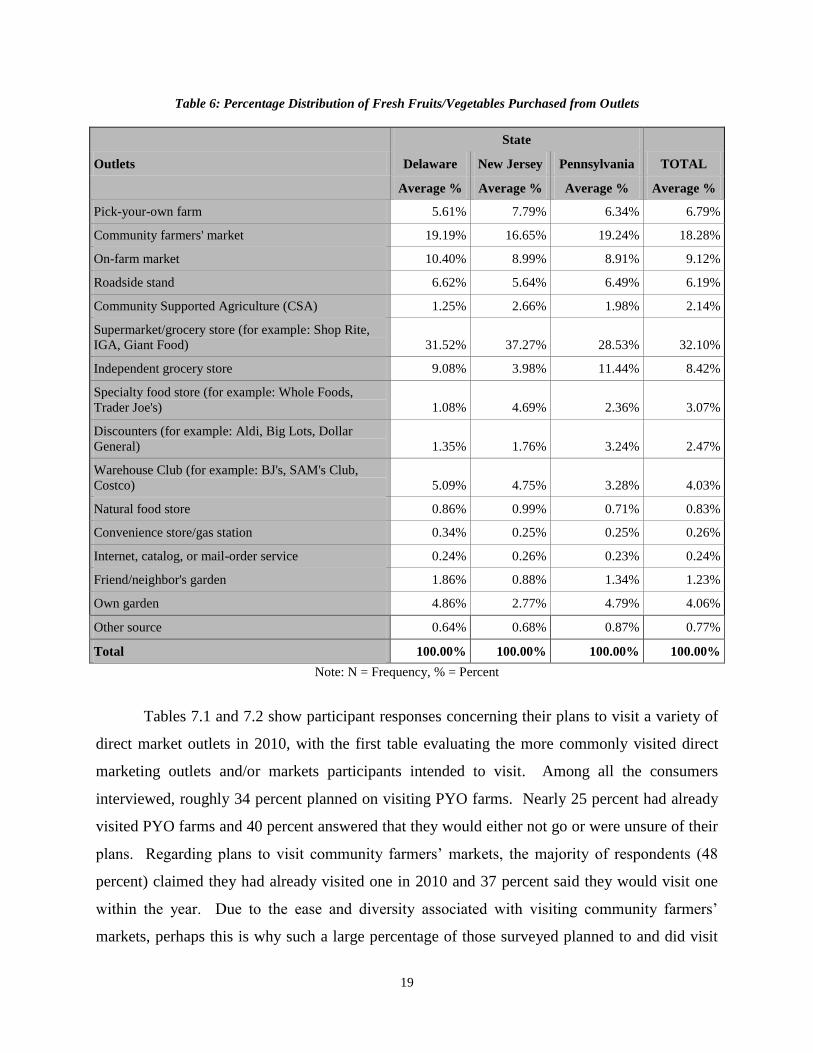
Table 6, shown below, evaluates the percentage distribution of fresh fruits and vegetables
that respondents and members of their households purchased from various outlets. The primary
sources where fruits and vegetables are purchased are supermarket and grocery stores, from
which consumers said they bought an average of 32% of their total produce. The second most
utilized source was community farmers’ markets, where they bought roughly 18% of their total
desired produce. Other notable outlets reported included on-farm markets (9%), independent
grocery stores (around 8%), PYO farms (7%), and roadside stands (6%). The rest of the outlet
types were generally found to be statistically insignificant.
19
Table 6: Percentage Distribution of Fresh Fruits/Vegetables Purchased from Outlets
Outlets
State
TOTAL Delaware New Jersey Pennsylvania
Average % Average % Average % Average %
Pick-your-own farm 5.61% 7.79% 6.34% 6.79%
Community farmers' market 19.19% 16.65% 19.24% 18.28%
On-farm market 10.40% 8.99% 8.91% 9.12%
Roadside stand 6.62% 5.64% 6.49% 6.19%
Community Supported Agriculture (CSA) 1.25% 2.66% 1.98% 2.14%
Supermarket/grocery store (for example: Shop Rite,
IGA, Giant Food) 31.52% 37.27% 28.53% 32.10%
Independent grocery store 9.08% 3.98% 11.44% 8.42%
Specialty food store (for example: Whole Foods,
Trader Joe's) 1.08% 4.69% 2.36% 3.07%
Discounters (for example: Aldi, Big Lots, Dollar
General) 1.35% 1.76% 3.24% 2.47%
Warehouse Club (for example: BJ's, SAM's Club,
Costco) 5.09% 4.75% 3.28% 4.03%
Natural food store 0.86% 0.99% 0.71% 0.83%
Convenience store/gas station 0.34% 0.25% 0.25% 0.26%
Internet, catalog, or mail-order service 0.24% 0.26% 0.23% 0.24%
Friend/neighbor's garden 1.86% 0.88% 1.34% 1.23%
Own garden 4.86% 2.77% 4.79% 4.06%
Other source 0.64% 0.68% 0.87% 0.77%
Total 100.00% 100.00% 100.00% 100.00%
Note: N = Frequency, % = Percent
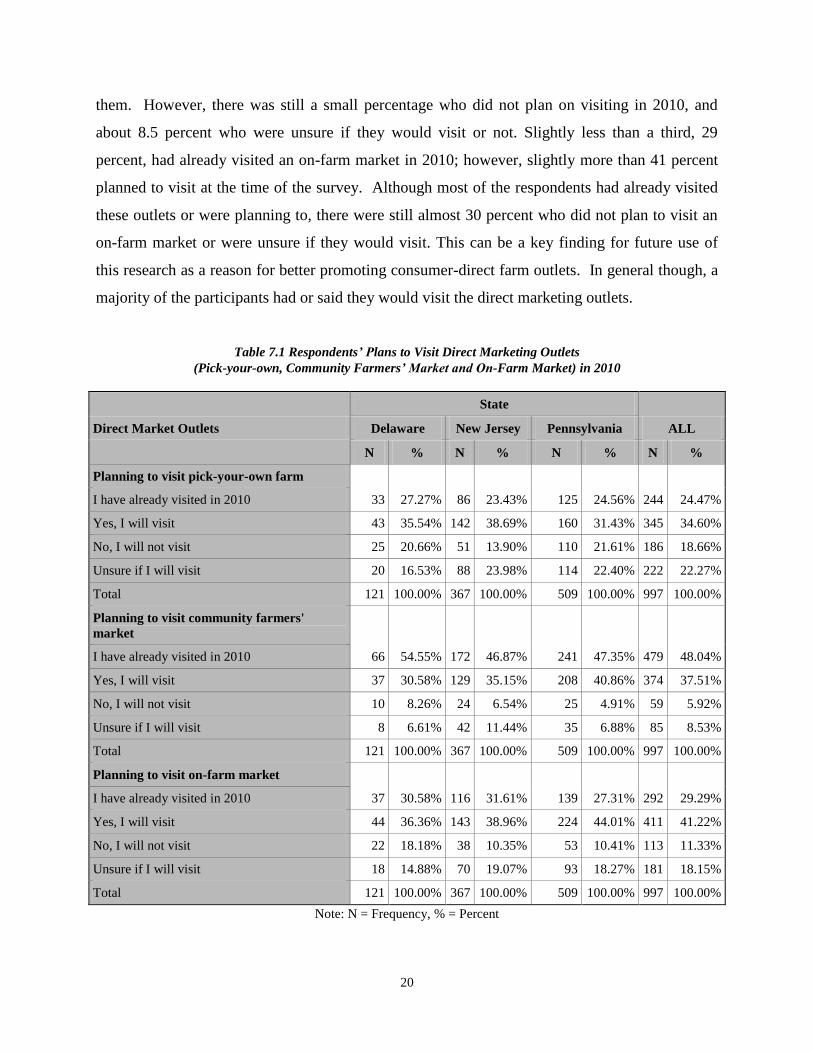
Tables 7.1 and 7.2 show participant responses concerning their plans to visit a variety of
direct market outlets in 2010, with the first table evaluating the more commonly visited direct
marketing outlets and/or markets participants intended to visit. Among all the consumers
interviewed, roughly 34 percent planned on visiting PYO farms. Nearly 25 percent had already
visited PYO farms and 40 percent answered that they would either not go or were unsure of their
plans. Regarding plans to visit community farmers’ markets, the majority of respondents (48
percent) claimed they had already visited one in 2010 and 37 percent said they would visit one
within the year. Due to the ease and diversity associated with visiting community farmers’
markets, perhaps this is why such a large percentage of those surveyed planned to and did visit
20
them. However, there was still a small percentage who did not plan on visiting in 2010, and
about 8.5 percent who were unsure if they would visit or not. Slightly less than a third, 29
percent, had already visited an on-farm market in 2010; however, slightly more than 41 percent
planned to visit at the time of the survey. Although most of the respondents had already visited
these outlets or were planning to, there were still almost 30 percent who did not plan to visit an
on-farm market or were unsure if they would visit. This can be a key finding for future use of
this research as a reason for better promoting consumer-direct farm outlets. In general though, a
majority of the participants had or said they would visit the direct marketing outlets.
Table 7.1 Respondents’ Plans to Visit Direct Marketing Outlets
(Pick-your-own, Community Farmers’ Market and On-Farm Market) in 2010
Direct Market Outlets
State
ALL Delaware New Jersey Pennsylvania
N % N % N % N %
Planning to visit pick-your-own farm
33 27.27% 86 23.43% 125 24.56% 244 24.47% I have already visited in 2010
Yes, I will visit 43 35.54% 142 38.69% 160 31.43% 345 34.60%
No, I will not visit 25 20.66% 51 13.90% 110 21.61% 186 18.66%
Unsure if I will visit 20 16.53% 88 23.98% 114 22.40% 222 22.27%
Total 121 100.00% 367 100.00% 509 100.00% 997 100.00%
Planning to visit community farmers'
market
66 54.55% 172 46.87% 241 47.35% 479 48.04% I have already visited in 2010
Yes, I will visit 37 30.58% 129 35.15% 208 40.86% 374 37.51%
No, I will not visit 10 8.26% 24 6.54% 25 4.91% 59 5.92%
Unsure if I will visit 8 6.61% 42 11.44% 35 6.88% 85 8.53%
Total 121 100.00% 367 100.00% 509 100.00% 997 100.00%
Planning to visit on-farm market
37 30.58% 116 31.61% 139 27.31% 292 29.29% I have already visited in 2010
Yes, I will visit 44 36.36% 143 38.96% 224 44.01% 411 41.22%
No, I will not visit 22 18.18% 38 10.35% 53 10.41% 113 11.33%
Unsure if I will visit 18 14.88% 70 19.07% 93 18.27% 181 18.15%
Total 121 100.00% 367 100.00% 509 100.00% 997 100.00%
Note: N = Frequency, % = Percent

21
Table 7.2 shows participant responses when asked about their plans to visit smaller or
less common forms of direct marketing outlets. Surprisingly, almost half (45 percent) of
respondents had claimed that they would visit a roadside stand within the year and almost a
quarter (23 percent) had said they already visited one. Roughly 1 in 5 of consumers reported that
they were unsure about visiting a roadside stand, and 1 in 10 said they would not visit. As noted
before, CSA farms still do not have as strong of a customer base as other investigated operations
do, and this is seen clearly by the participants’ future plans to visit. The majority (46 percent)
answered that they had no intentions of visiting a CSA farm and nearly 35 percent said they were
unsure, again not showing much support for this type of operation. Only a mere 5 percent
confirmed that they had indeed visited a CSA farm. A similar outlook was found for plans to
visit other, not specified direct marketing operations. Generally, most of the respondents said
they would not or were unsure if they would visit, while very few respondents said that they had
or would visit one.

22
Table 7.2 Respondents’ Plan to Visit Direct Marketing Outlets
(Roadside Stand, Community Supported Agriculture and Other) in 2010
direct market outlets
State
all Delaware New Jersey Pennsylvania
N % N % N % N %
Planning to visit roadside stand
15 25.86% 45 25.42% 51 20.99% 111 23.22% I have already visited in 2010
Yes, I will visit 28 48.28% 72 40.68% 114 46.91% 214 44.77%
No, I will not visit 5 8.62% 21 11.86% 22 9.05% 48 10.04%
Unsure if I will visit 10 17.24% 39 22.03% 56 23.05% 105 21.97%
Total 58 100.00% 177 100.00% 243 100.00% 478 100.00%
Planning to visit Community Supported
Agriculture (CSA)
. . 12 6.78% 12 4.94% 24 5.02% I have already visited in 2010
Yes, I will visit 9 15.52% 22 12.43% 35 14.40% 66 13.81%
No, I will not visit 31 53.45% 80 45.20% 110 45.27% 221 46.23%
Unsure if I will visit 18 31.03% 63 35.59% 86 35.39% 167 34.94%
Total 58 100.00% 177 100.00% 243 100.00% 478 100.00%
Planning to visit other
4 6.90% 12 6.78% 9 3.70% 25 5.23% I have already visited in 2010
Yes, I will visit 1 1.72% 11 6.21% 15 6.17% 27 5.65%
No, I will not visit 32 55.17% 67 37.85% 108 44.44% 207 43.31%
Unsure if I will visit 21 36.21% 87 49.15% 111 45.68% 219 45.82%
Total 58 100.00% 177 100.00% 243 100.00% 478 100.00%
Note: N = Frequency, % = Percent
Regarding advertising these markets use to promote products to consumers, respondents
were asked to identify the source through which they first learned and received information
about direct marketing outlets, as shown in Table 8. Most commonly, information was shared by
way of friends/family/word-of-mouth (two-thirds of all respondents) or by signs at the market’s
entrance (approximately 45 percent). Other significantly popular means included: newspaper
sources, billboard or roadside signs, mailed farm advertisements, promotional flyers, and
websites. Surprisingly, Internet based sources, such as email, blogs, and social networking sites
generally were not sources which consumer used to first learn about and receive information
from direct marketing outlets.

23
Table 8. Respondents First Time Sources of Marketing Outlets Information
Sources of Information
State
TOTAL Delaware New Jersey Pennsylvania
N % N % N % N %
Billboard or Roadside sign 57 42.86% 138 32.55% 196 33.97% 391 34.48%
Sign at the market's entrance 69 51.88% 190 44.81% 251 43.50% 510 44.97%
Newspaper 58 43.61% 168 39.62% 218 37.78% 444 39.15%
Magazine 3 2.26% 25 5.90% 27 4.68% 55 4.85%
Friends/family/word-of-mouth 96 72.18% 265 62.50% 395 68.46% 756 66.67%
Television 7 5.26% 19 4.48% 33 5.72% 59 5.20%
School activity at the direct market outlet 8 6.02% 29 6.84% 39 6.76% 76 6.70%
Radio 10 7.52% 17 4.01% 47 8.15% 74 6.53%
Farm advertisement (sent through the mail to
the home) 15 11.28% 51 12.03% 55 9.53% 121 10.67%
Promotional flyer 13 9.77% 52 12.26% 53 9.19% 118 10.41%
Agri-tourism map with direct markets listed 4 3.01% 15 3.54% 25 4.33% 44 3.88%
Tourism guide book 8 6.02% 12 2.83% 19 3.29% 39 3.44%
WIC program 3 2.26% 11 2.59% 35 6.07% 49 4.32%
Website 13 9.77% 44 10.38% 39 6.76% 96 8.47%
Email 8 6.02% 29 6.84% 18 3.12% 55 4.85%
Blogs 1 0.75% 12 2.83% 5 0.87% 18 1.59%
Social networking sites (for example:
Facebook, Twitter, MySpace) 4 3.01% 16 3.77% 17 2.95% 37 3.26%
All 133 100.00% 424 100.00% 577 100.00% 1134 100.00%
Note: N = Frequency, % = Percent, since respondents selected more than one choice,
total percentages do not add to 100%
Tables 9.1 through 9.4 present the purchasing behavior and rank of how often consumers
buy various fresh fruits from direct marketing operations. Among the three states, buyers
claimed that apples were purchased most often (Table 9.1). Strawberries were ranked second
most often, with 29 percent of respondents across all three states. Also, when taking a closer
look, residents of Delaware actually responded that strawberries were their primary purchases at
outlets, followed by apples, whereas New Jersey and Pennsylvania had the opposite result.

24
Table 9.1 Respondents’ Purchasing Behavior of Fresh Apples and Strawberries from Direct Marketing Outlets
Fresh Fruits
State
ALL Delaware New Jersey Pennsylvania
N % N % N % N %
Apples
2 1.77% 10 2.97% 9 1.89% 21 2.27% Do not purchase
Most often purchased 29 25.66% 137 40.65% 177 37.26% 343 37.08%
2nd
17 15.04% 56 16.62% 89 18.74% 162 17.51%
3rd
21 18.58% 42 12.46% 61 12.84% 124 13.41%
4th
16 14.16% 22 6.53% 41 8.63% 79 8.54%
5th
10 8.85% 34 10.09% 33 6.95% 77 8.32%
6th
11 9.73% 24 7.12% 46 9.68% 81 8.76%
Least often purchased 7 6.19% 12 3.56% 19 4.00% 38 4.11%
Total 113 100.00% 337 100.00% 475 100.00% 925 100.00%
Strawberries
. . 4 1.19% 8 1.68% 12 1.30% Do not purchase
Most often purchased 39 34.51% 79 23.44% 155 32.63% 273 29.51%
2nd
26 23.01% 111 32.94% 145 30.53% 282 30.49%
3rd
17 15.04% 56 16.62% 70 14.74% 143 15.46%
4th
19 16.81% 50 14.84% 43 9.05% 112 12.11%
5th
8 7.08% 19 5.64% 28 5.89% 55 5.95%
6th
3 2.65% 10 2.97% 19 4.00% 32 3.46%
Least often purchased 1 0.88% 8 2.37% 7 1.47% 16 1.73%
Total 113 100.00% 337 100.00% 475 100.00% 925 100.00%
Note: N = Frequency, % = Percent
A quarter of the respondents, across all three states, ranked peaches as the third most frequently
purchased fruit at direct marketing outlets (Table 9.2). However, almost the same percentage
ranked it as the fourth most often bought, with only a few less participants ranking it there.
Buyers expressed that generally blueberries are their fourth most often purchased fruit.
However, consumers’ feed back at this level became more “gray” with five of the eight response
choices falling into a much narrower range of percentages. For example, fourth most often had
nearly 20% of respondents choose this rank, while almost 19% chose third most often.

25
Table 9.2 Respondents’ Purchasing Behavior of Fresh Peaches and Blueberries
from Direct Marketing Outlets
Fresh Fruits
State
ALL Delaware New Jersey Pennsylvania
N % N % N % N %
Peaches
4 3.54% 10 3.13% 18 3.99% 32 3.62% Do not purchase
Most often purchased 11 9.73% 27 8.46% 43 9.53% 81 9.17%
2nd
28 24.78% 53 16.61% 72 15.96% 153 17.33%
3rd
20 17.70% 82 25.71% 119 26.39% 221 25.03%
4th
22 19.47% 70 21.94% 85 18.85% 177 20.05%
5th
14 12.39% 33 10.34% 60 13.30% 107 12.12%
6th
7 6.19% 31 9.72% 43 9.53% 81 9.17%
Least often purchased 7 6.19% 13 4.08% 11 2.44% 31 3.51%
Total 113 100.00% 319 100.00% 451 100.00% 883 100.00%
Blueberries
5 4.42% 14 4.39% 28 6.21% 47 5.32% Do not purchase
Most often purchased 3 2.65% 35 10.97% 23 5.10% 61 6.91%
2nd
15 13.27% 49 15.36% 58 12.86% 122 13.82%
3rd
20 17.70% 65 20.38% 79 17.52% 164 18.57%
4th
21 18.58% 64 20.06% 91 20.18% 176 19.93%
5th
21 18.58% 47 14.73% 71 15.74% 139 15.74%
6th
18 15.93% 36 11.29% 57 12.64% 111 12.57%
Least often purchased 10 8.85% 9 2.82% 44 9.76% 63 7.13%
Total 113 100.00% 319 100.00% 451 100.00% 883 100.00%
Note: N = Frequency, % = Percent
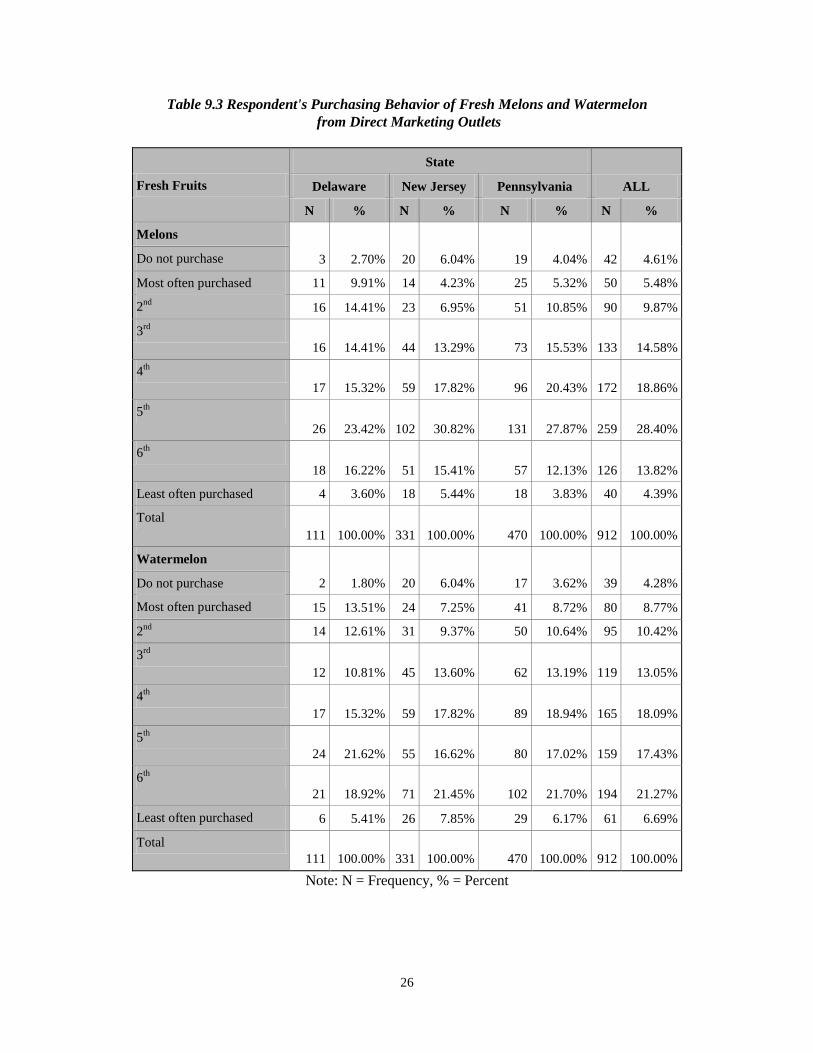
Following the same pattern, melons (e.g., cantaloupes and honeydews) are the fifth most often
purchased fruit with around 28 percent of participants selecting that rank. Similarly,
watermelons are the next most frequently purchased fruit with more than 21 percent of
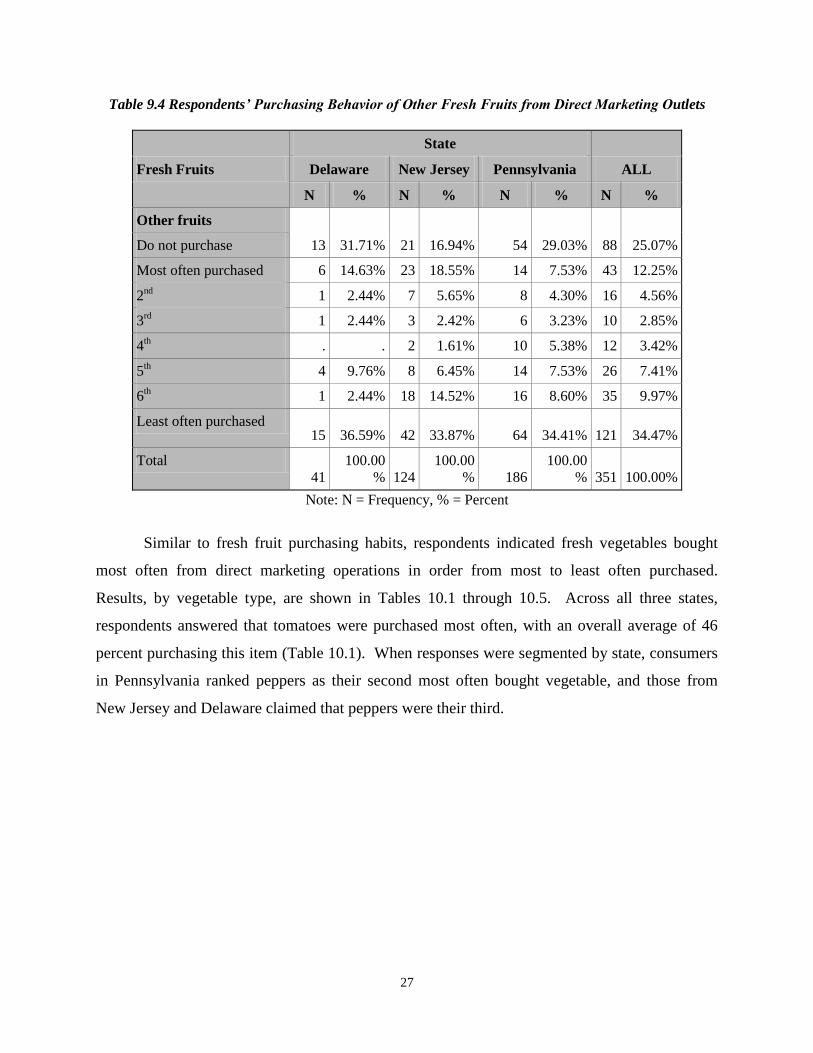
respondents choosing it as the sixth most often purchased (Table 9.3). The survey also
considered other fresh fruits and grouped them into one category in Table 9.4. Here, results
showed that consumers had little interest in these, as roughly 34 percent answered as ‘least
often’, and 25% said they did not purchase other fruits at all.
26
Table 9.3 Respondent's Purchasing Behavior of Fresh Melons and Watermelon
from Direct Marketing Outlets
Fresh Fruits
State
ALL Delaware New Jersey Pennsylvania
N % N % N % N %
Melons
3 2.70% 20 6.04% 19 4.04% 42 4.61% Do not purchase
Most often purchased 11 9.91% 14 4.23% 25 5.32% 50 5.48%
2nd
16 14.41% 23 6.95% 51 10.85% 90 9.87%
3rd
16 14.41% 44 13.29% 73 15.53% 133 14.58%
4th
17 15.32% 59 17.82% 96 20.43% 172 18.86%
5th
26 23.42% 102 30.82% 131 27.87% 259 28.40%
6th
18 16.22% 51 15.41% 57 12.13% 126 13.82%
Least often purchased 4 3.60% 18 5.44% 18 3.83% 40 4.39%
Total
111 100.00% 331 100.00% 470 100.00% 912 100.00%
Watermelon
2 1.80% 20 6.04% 17 3.62% 39 4.28% Do not purchase
Most often purchased 15 13.51% 24 7.25% 41 8.72% 80 8.77%
2nd
14 12.61% 31 9.37% 50 10.64% 95 10.42%
3rd
12 10.81% 45 13.60% 62 13.19% 119 13.05%
4th
17 15.32% 59 17.82% 89 18.94% 165 18.09%
5th
24 21.62% 55 16.62% 80 17.02% 159 17.43%
6th
21 18.92% 71 21.45% 102 21.70% 194 21.27%
Least often purchased 6 5.41% 26 7.85% 29 6.17% 61 6.69%
Total
111 100.00% 331 100.00% 470 100.00% 912 100.00%
Note: N = Frequency, % = Percent
27
Table 9.4 Respondents’ Purchasing Behavior of Other Fresh Fruits from Direct Marketing Outlets
Fresh Fruits
State
ALL Delaware New Jersey Pennsylvania
N % N % N % N %
Other fruits
13 31.71% 21 16.94% 54 29.03% 88 25.07% Do not purchase
Most often purchased 6 14.63% 23 18.55% 14 7.53% 43 12.25%
2nd
1 2.44% 7 5.65% 8 4.30% 16 4.56%
3rd
1 2.44% 3 2.42% 6 3.23% 10 2.85%
4th . . 2 1.61% 10 5.38% 12 3.42%
5th 4 9.76% 8 6.45% 14 7.53% 26 7.41%
6th 1 2.44% 18 14.52% 16 8.60% 35 9.97%
Least often purchased 15 36.59% 42 33.87% 64 34.41% 121 34.47%
Total
41
100.00
% 124
100.00
% 186
100.00
% 351 100.00%
Note: N = Frequency, % = Percent
Similar to fresh fruit purchasing habits, respondents indicated fresh vegetables bought
most often from direct marketing operations in order from most to least often purchased.
Results, by vegetable type, are shown in Tables 10.1 through 10.5. Across all three states,
respondents answered that tomatoes were purchased most often, with an overall average of 46
percent purchasing this item (Table 10.1). When responses were segmented by state, consumers
in Pennsylvania ranked peppers as their second most often bought vegetable, and those from
New Jersey and Delaware claimed that peppers were their third.

28
Table 10.1 Respondents’ Purchasing Behavior of Fresh Tomato and Pepper
from Direct Marketing Outlets
Fresh Vegetables
State
ALL Delaware New Jersey Pennsylvania
N % N % N % N %
Tomato
. . 10 3.13% 17 3.83% 27 3.08% Do not purchase
Most often purchased 52 46.43% 161 50.31% 190 42.79% 403 46.00%
2nd
32 28.57% 75 23.44% 90 20.27% 197 22.49%
3rd
8 7.14% 16 5.00% 52 11.71% 76 8.68%
4th
5 4.46% 15 4.69% 25 5.63% 45 5.14%
5th
6 5.36% 9 2.81% 23 5.18% 38 4.34%
6th
2 1.79% 9 2.81% 14 3.15% 25 2.85%
7th
2 1.79% 6 1.88% 11 2.48% 19 2.17%
8th
. . 6 1.88% 10 2.25% 16 1.83%
9th
4 3.57% 8 2.50% 4 0.90% 16 1.83%
Least often purchased 1 0.89% 5 1.56% 8 1.80% 14 1.60%
Total 112 100.00% 320 100.00% 444 100.00% 876 100.00%
Pepper
5 4.46% 7 2.19% 8 1.80% 20 2.28% Do not purchase
Most often purchased 4 3.57% 13 4.06% 12 2.70% 29 3.31%
2nd
9 8.04% 64 20.00% 113 25.45% 186 21.23%
3rd
20 17.86% 88 27.50% 102 22.97% 210 23.97%
4th
19 16.96% 35 10.94% 57 12.84% 111 12.67%
5th
15 13.39% 33 10.31% 46 10.36% 94 10.73%
6th
14 12.50% 26 8.13% 36 8.11% 76 8.68%
7th
5 4.46% 19 5.94% 23 5.18% 47 5.37%
8th
10 8.93% 14 4.38% 15 3.38% 39 4.45%
9th
4 3.57% 11 3.44% 18 4.05% 33 3.77%
Least often purchased 7 6.25% 10 3.13% 14 3.15% 31 3.54%
Total 112 100.00% 320 100.00% 444 100.00% 876 100.00%
Note: N = Frequency, % = Percent
When asked about sweet corn, consumers from each state generally showed that it is one
of the vegetable varieties that they purchased most often. Interestingly, an equal number of
Delaware participants responded that sweet corn was their first and second most often purchased
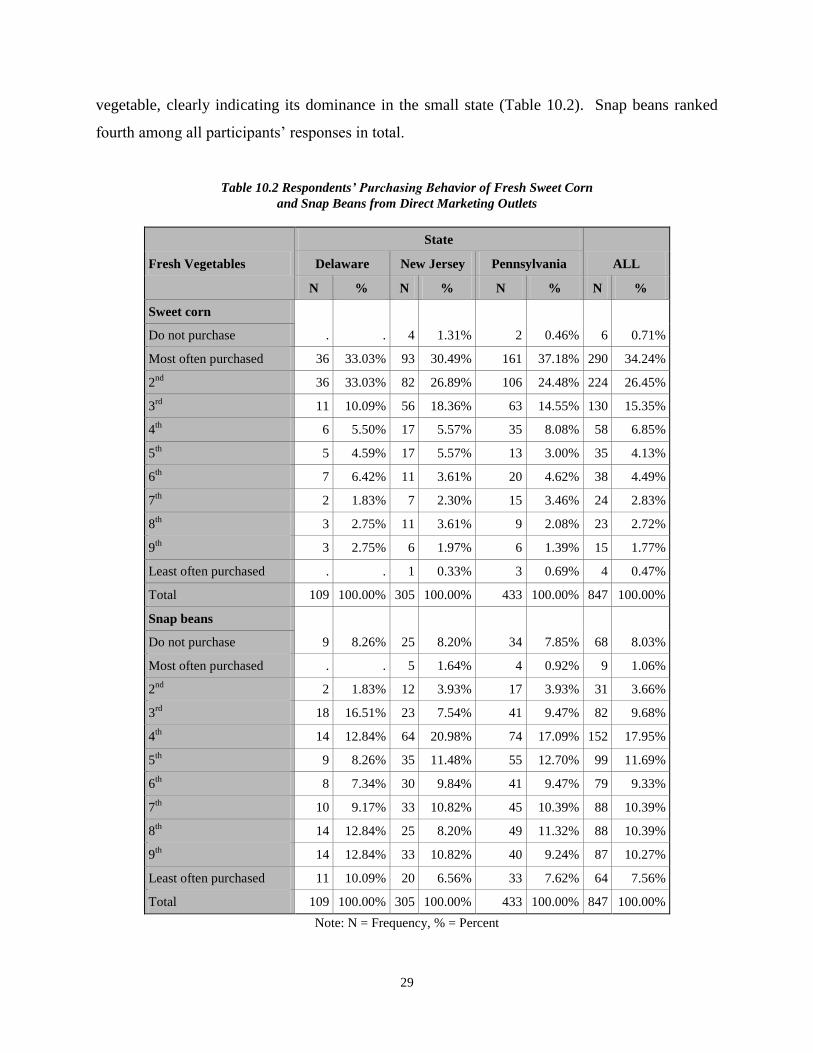
29
vegetable, clearly indicating its dominance in the small state (Table 10.2). Snap beans ranked
fourth among all participants’ responses in total.
Table 10.2 Respondents’ Purchasing Behavior of Fresh Sweet Corn and Snap Beans from Direct Marketing Outlets
Fresh Vegetables
State
ALL Delaware New Jersey Pennsylvania
N % N % N % N %
Sweet corn
. . 4 1.31% 2 0.46% 6 0.71% Do not purchase
Most often purchased 36 33.03% 93 30.49% 161 37.18% 290 34.24%
2nd
36 33.03% 82 26.89% 106 24.48% 224 26.45%
3rd
11 10.09% 56 18.36% 63 14.55% 130 15.35%
4th
6 5.50% 17 5.57% 35 8.08% 58 6.85%
5th
5 4.59% 17 5.57% 13 3.00% 35 4.13%
6th
7 6.42% 11 3.61% 20 4.62% 38 4.49%
7th
2 1.83% 7 2.30% 15 3.46% 24 2.83%
8th
3 2.75% 11 3.61% 9 2.08% 23 2.72%
9th
3 2.75% 6 1.97% 6 1.39% 15 1.77%
Least often purchased . . 1 0.33% 3 0.69% 4 0.47%
Total 109 100.00% 305 100.00% 433 100.00% 847 100.00%
Snap beans
9 8.26% 25 8.20% 34 7.85% 68 8.03% Do not purchase
Most often purchased . . 5 1.64% 4 0.92% 9 1.06%
2nd
2 1.83% 12 3.93% 17 3.93% 31 3.66%
3rd
18 16.51% 23 7.54% 41 9.47% 82 9.68%
4th
14 12.84% 64 20.98% 74 17.09% 152 17.95%
5th
9 8.26% 35 11.48% 55 12.70% 99 11.69%
6th
8 7.34% 30 9.84% 41 9.47% 79 9.33%
7th
10 9.17% 33 10.82% 45 10.39% 88 10.39%
8th
14 12.84% 25 8.20% 49 11.32% 88 10.39%
9th
14 12.84% 33 10.82% 40 9.24% 87 10.27%
Least often purchased 11 10.09% 20 6.56% 33 7.62% 64 7.56%
Total 109 100.00% 305 100.00% 433 100.00% 847 100.00%
Note: N = Frequency, % = Percent

30
As shown in Table 10.3, respondents ranked broccoli their fourth to seventh most
purchased vegetable, in general. As for onions, most ranked it from fifth to seventh, making
both vegetables appear to be some of the least often purchased vegetables compared to the
previous samples.
Table 10.3 Respondents’ Purchasing Behavior of Fresh Broccoli and Onion
from Direct Marketing Outlets
Fresh Vegetables
State
ALL Delaware New Jersey Pennsylvania
N % N % N % N %
Broccoli
1 0.94% 11 3.68% 11 2.59% 23 2.77% Do not purchase
Most often purchased 2 1.89% 12 4.01% 12 2.82% 26 3.13%
2nd
7 6.60% 13 4.35% 22 5.18% 42 5.06%
3rd
4 3.77% 25 8.36% 35 8.24% 64 7.71%
4th
14 13.21% 43 14.38% 56 13.18% 113 13.61%
5th
14 13.21% 51 17.06% 66 15.53% 131 15.78%
6th
14 13.21% 42 14.05% 71 16.71% 127 15.30%
7th
19 17.92% 39 13.04% 57 13.41% 115 13.86%
8th
13 12.26% 31 10.37% 50 11.76% 94 11.33%
9th
14 13.21% 19 6.35% 27 6.35% 60 7.23%
Least often purchased 4 3.77% 13 4.35% 18 4.24% 35 4.22%
Total 106 100.00% 299 100.00% 425 100.00% 830 100.00%
Onion
3 2.83% 5 1.67% 11 2.59% 19 2.29% Do not purchase
Most often purchased 2 1.89% 3 1.00% 22 5.18% 27 3.25%
2nd
3 2.83% 20 6.69% 14 3.29% 37 4.46%
3rd
14 13.21% 24 8.03% 34 8.00% 72 8.67%
4th
16 15.09% 31 10.37% 45 10.59% 92 11.08%
5th
13 12.26% 40 13.38% 61 14.35% 114 13.73%
6th
21 19.81% 53 17.73% 77 18.12% 151 18.19%
7th
17 16.04% 47 15.72% 72 16.94% 136 16.39%
8th
11 10.38% 42 14.05% 43 10.12% 96 11.57%
9th
2 1.89% 24 8.03% 31 7.29% 57 6.87%
Least often purchased 4 3.77% 10 3.34% 15 3.53% 29 3.49%
Total 106 100.00% 299 100.00% 425 100.00% 830 100.00%
Note: N = Frequency, % = Percent

31
Table 10.4 shows purchasing behaviors for potatoes and squash. Potatoes ranked seventh
most frequently bought vegetable, overall, with only a slight discrepancy from Delaware’s
customers (ranked fifth most often purchased by 19 percent). However, participants in all three
states reported squash as their eighth most often purchased vegetable. Results of all ranking
choices for both potatoes and squash, however, did not lean more heavily to a particular rank and
were distributed more evenly than the other vegetables’ ranks, making it hard to truly determine
how high a priority purchasing those items were compared to others. This also applies to the
findings in Table 10.5 for cucumbers. Although about 14% of participants ranked cucumbers as
their fourth most purchased, many consumers also ranked it third, fifth, and eighth, with the
differences in distribution only being a few participants in total. For any vegetables besides the
ones specifically described consumers generally had either not purchased those items, or as the
majority stated, they would purchase them least often.

32
Table 10.4 Respondents’ Purchasing Behavior of Fresh Potato and Squash
from Direct Marketing Outlets
Fresh Vegetables
State
ALL Delaware New Jersey Pennsylvania
N % N % N % N %
Potato
5 4.81% 7 2.36% 6 1.40% 18 2.17% Do not purchase
Most often purchased 6 5.77% 11 3.70% 21 4.88% 38 4.57%
2nd
6 5.77% 19 6.40% 35 8.14% 60 7.22%
3rd
7 6.73% 21 7.07% 36 8.37% 64 7.70%
4th
11 10.58% 26 8.75% 42 9.77% 79 9.51%
5th
20 19.23% 38 12.79% 69 16.05% 127 15.28%
6th
13 12.50% 48 16.16% 60 13.95% 121 14.56%
7th
17 16.35% 59 19.87% 73 16.98% 149 17.93%
8th
10 9.62% 39 13.13% 47 10.93% 96 11.55%
9th
8 7.69% 18 6.06% 29 6.74% 55 6.62%
Least often purchased 1 0.96% 11 3.70% 12 2.79% 24 2.89%
Total 104 100.00% 297 100.00% 430 100.00% 831 100.00%
Squash
6 5.77% 26 8.75% 43 10.00% 75 9.03% Do not purchase
Most often purchased 2 1.92% 3 1.01% 6 1.40% 11 1.32%
2nd
1 0.96% 12 4.04% 16 3.72% 29 3.49%
3rd
9 8.65% 19 6.40% 25 5.81% 53 6.38%
4th
9 8.65% 30 10.10% 34 7.91% 73 8.78%
5th
14 13.46% 28 9.43% 46 10.70% 88 10.59%
6th
13 12.50% 23 7.74% 39 9.07% 75 9.03%
7th
16 15.38% 46 15.49% 56 13.02% 118 14.20%
8th
17 16.35% 55 18.52% 78 18.14% 150 18.05%
9th
11 10.58% 33 11.11% 46 10.70% 90 10.83%
Least often purchased 6 5.77% 22 7.41% 41 9.53% 69 8.30%
Total 104 100.00% 297 100.00% 430 100.00% 831 100.00%
Note: N = Frequency, % = Percent

33
Table 10.5 Respondents Purchasing Behavior of Fresh Cucumber and Other Vegetables
from Direct Marketing Outlets
Fresh Vegetables
State
ALL Delaware New Jersey Pennsylvania
N % N % N % N %
Cucumber
. . 2 2.82% 2 1.68% 4 1.84% Do not purchase
Most often purchased 2 7.41% 4 5.63% 2 1.68% 8 3.69%
2nd
3 11.11% 4 5.63% 10 8.40% 17 7.83%
3rd
5 18.52% 7 9.86% 16 13.45% 28 12.90%
4th
3 11.11% 12 16.90% 16 13.45% 31 14.29%
5th
3 11.11% 11 15.49% 13 10.92% 27 12.44%
6th
2 7.41% 6 8.45% 15 12.61% 23 10.60%
7th
2 7.41% 6 8.45% 12 10.08% 20 9.22%
8th
5 18.52% 9 12.68% 14 11.76% 28 12.90%
9th
1 3.70% 9 12.68% 12 10.08% 22 10.14%
Least often purchased 1 3.70% 1 1.41% 7 5.88% 9 4.15%
Total 27 100.00% 71 100.00% 119 100.00% 217 100.00%
Other vegetables
8 29.63% 19 26.76% 38 31.93% 65 29.95% Do not purchase
Most often purchased . . 1 1.41% 5 4.20% 6 2.76%
2nd
. . 3 4.23% . . 3 1.38%
3rd
2 7.41% 3 4.23% 4 3.36% 9 4.15%
4th
. . 3 4.23% 3 2.52% 6 2.76%
5th
. . 3 4.23% 5 4.20% 8 3.69%
6th
2 7.41% 1 1.41% 6 5.04% 9 4.15%
7th
1 3.70% 3 4.23% 3 2.52% 7 3.23%
8th
. . 5 7.04% 4 3.36% 9 4.15%
9th
3 11.11% 4 5.63% 15 12.61% 22 10.14%
Least often purchased 11 40.74% 26 36.62% 36 30.25% 73 33.64%
Total 27 100.00% 71 100.00% 119 100.00% 217 100.00%
Note: N = Frequency, % = Percent
Additional survey questions asked participants about their willingness to pay more for
products from direct marketing outlets versus products purchased from other providers. First, as
shown in Figure 6, participants were simply asked if they were willing or unwilling to pay more.

34
Overall, nearly two-thirds of all respondents said that they would indeed be willing to pay more
for products from direct marketing outlets. The distribution percentage of Delaware’s
respondents was slightly higher than the other two states, showing that residents there are
slightly more willing to pay than individuals residing in New Jersey and Pennsylvania.
Participants who replied ‘yes,’ that they would be willing to pay more, were asked to indicate
what percentage increase they would be willing to accept, which is outlined in Table 11. The
majority (41 percent) were willing to pay at least 6-10% more for products from direct marketing
outlets, while 28 percent were willing to pay at least an additional 1-5% more. Around 14
percent of consumers were willing to pay an increase of 11-15%, while 9 percent would pay 16-
20% more, and 4 percent would pay an increase of 21-25% more. Of note, a little over 5% of
consumers from all three states would pay above 25% more for products from direct marketing
outlets.

35
Table 11. Percentage Distribution of Respondents’ Willingness to Pay
for Products from Direct Marketing Outlets
Willingness to Pay (%)
State
TOTAL Delaware New Jersey Pennsylvania
N % N % N % N %
1 to 5% 22 26.83% 75 31.91% 88 26.43% 185 28.46%
6 to 10% 37 45.12% 91 38.72% 136 40.84% 264 40.62%
11 to 15% 9 10.98% 24 10.21% 54 16.22% 87 13.38%
16 to 20% 8 9.76% 18 7.66% 30 9.01% 56 8.62%
21 to 25% 4 4.88% 10 4.26% 11 3.30% 25 3.85%
26 to 30% 1 1.22% 6 2.55% 1 0.30% 8 1.23%
31 to 35% . . 3 1.28% 2 0.60% 5 0.77%
36 to 40% . . 2 0.85% 3 0.90% 5 0.77%
41 to 45% . . 2 0.85% 2 0.60% 4 0.62%
46 to 50% . . 1 0.43% 5 1.50% 6 0.92%
51 to 55% . . . . 1 0.30% 1 0.15%
66 to 70% . . 1 0.43% . . 1 0.15%
81 to 85% . . 1 0.43% . . 1 0.15%
86 to 90% . . 1 0.43% . . 1 0.15%
96 to 100% 1 1.22% . . . . 1 0.15%
All 82 100.00% 235 100.00% 333 100.00% 650 100.00%
Note: N = Frequency, % = Percent
Table 12 shows how willing participants would be to buy produce from direct marketing
outlets under certain conditions. The majority of respondents from all the states (96 percent)
reported that they would be willing to buy locally grown produce. Only 67 percent of those
individuals said that they would be willing to buy certified organic produce. A significant
number of respondents were unsure about buying certified organic produce (20 percent) or said
they would not buy those items (13 percent). Surprisingly, a little over two-thirds (67 percent) of
all the respondents claimed that they were willing to buy a new or unfamiliar produce item if it
were offered; however, 23 percent were uncertain if they would buy an unfamiliar item.
Provided with information about genetically modified products, almost one-half (49 percent) said

36
they would not buy such products, whereas roughly a third (35 percent) were unsure about
buying these products.
Table 12. Respondents’ Opinion Towards Willingness to Buy Specific Products
from Direct Marketing Outlets
Willing to Buy
State
ALL Delaware New Jersey Pennsylvania
N % N % N % N %
WTB Locally grown
118 97.52% 347 94.29% 503 97.67% 968 96.41% Yes
No 1 0.83% 7 1.90% 5 0.97% 13 1.29%
Unsure 2 1.65% 14 3.80% 7 1.36% 23 2.29%
Total 121 100.00% 368 100.00% 515 100.00% 1004 100.00%
WTB Certified organic
82 67.77% 262 71.20% 324 62.91% 668 66.53% Yes
No 20 16.53% 47 12.77% 68 13.20% 135 13.45%
Unsure 19 15.70% 59 16.03% 123 23.88% 201 20.02%
Total 121 100.00% 368 100.00% 515 100.00% 1004 100.00%
WTB New fruits and vegetables, or those you
are unfamiliar with
84 69.42% 252 68.48% 343 66.60% 679 67.63% Yes
No 9 7.44% 40 10.87% 47 9.13% 96 9.56%
Unsure 28 23.14% 76 20.65% 125 24.27% 229 22.81%
Total 121 100.00% 368 100.00% 515 100.00% 1004 100.00%
WTB Genetically modified
13 10.74% 79 21.47% 74 14.37% 166 16.53% Yes
No 62 51.24% 179 48.64% 248 48.16% 489 48.71%
Unsure 46 38.02% 110 29.89% 193 37.48% 349 34.76%
Total 121 100.00% 368 100.00% 515 100.00% 1004 100.00%
Note: N = Frequency, % = Percent
Presented with several agri-tourism terms, Table 13 shows if participants responded that
they had heard of these concepts or if they were unfamiliar with the terms. In general, consumer
awareness about each of the terms was split, and in most cases more people did not know about
the concept than those who did. For example, roughly 56 percent of all respondents answered
that they did not know about the concept of agri-tourism and green tourism. However, it seemed

37
that more residents of New Jersey and Delaware did know about ecotourism than those who did
not.
Table 13. Respondents’ Awareness About Agri-tourism Concepts
Agri-tourism
Concepts
State
ALL Delaware New Jersey Pennsylvania
N % N % N % N %
Agri-tourism
54 45.76% 171 47.11% 210 40.70% 435 43.63% Yes
No 64 54.24% 192 52.89% 306 59.30% 562 56.37%
Total 118 100.00% 363 100.00% 516 100.00% 997 100.00%
Ecotourism
68 57.63% 190 52.34% 228 44.19% 486 48.75% Yes
No 50 42.37% 173 47.66% 288 55.81% 511 51.25%
Total 118 100.00% 363 100.00% 516 100.00% 997 100.00%
Green tourism
56 47.46% 156 42.98% 222 43.02% 434 43.53% Yes
No 62 52.54% 207 57.02% 294 56.98% 563 56.47%
Total 118 100.00% 363 100.00% 516 100.00% 997 100.00%
Note: N = Frequency, % = Percent
Tables 14.1 and 14.2 show if consumers purchased items commonly available for
purchase during an agri-tourism event. Overall, the most popular products purchased were fresh
fruits and vegetables, purchased by 87 percent of participants (Table 14.1), followed by locally
made value-added products and pumpkin/corn stalks (72 and 69 percent, respectively; Table
14.2). Other considerably purchased products include honey products, agricultural decorations
and crafts, locally produced wine, and fresh-cut flowers. Seasonal decorations were bought by
half of consumers, while a little less than half bought farm festival products and Christmas trees.
Vegetable transplants, plants grown from seeds in separate growing containers before the typical
growing season starts and then later transplanted into a garden, were the least popular products
purchased.

38
Table 14.1. Different Products Purchased by Consumer During Agri-tourism Activity
(Fresh Fruits and Vegetables, Decorative/Crafts, Wine, Honey, Firewood and Ornamentals)
Products
State
ALL Delaware New Jersey Pennsylvania
N % N % N % N %
Fresh fruits and vegetables
101 89.38% 307 87.97% 431 85.52% 839 86.85% Yes
No 12 10.62% 42 12.03% 73 14.48% 127 13.15%
Total 113 100.00% 349 100.00% 504 100.00% 966 100.00%
Agricultural decorations/crafts
49 43.36% 161 46.13% 236 46.83% 446 46.17% Yes
No 64 56.64% 188 53.87% 268 53.17% 520 53.83%
Total 113 100.00% 349 100.00% 504 100.00% 966 100.00%
Locally produced wine
38 33.63% 155 44.41% 223 44.25% 416 43.06% Yes
No 75 66.37% 194 55.59% 281 55.75% 550 56.94%
Total 113 100.00% 349 100.00% 504 100.00% 966 100.00%
Honey products
62 54.87% 164 46.99% 242 48.02% 468 48.45% Yes
No 51 45.13% 185 53.01% 262 51.98% 498 51.55%
Total 113 100.00% 349 100.00% 504 100.00% 966 100.00%
Fresh-cut flowers
48 42.48% 143 40.97% 178 35.32% 369 38.20% Yes
No 65 57.52% 206 59.03% 326 64.68% 597 61.80%
Total 113 100.00% 349 100.00% 504 100.00% 966 100.00%
Firewood
9 7.96% 44 12.61% 52 10.32% 105 10.87% Yes
No 104 92.04% 305 87.39% 452 89.68% 861 89.13%
Total 113 100.00% 349 100.00% 504 100.00% 966 100.00%
Ornamentals
38 33.63% 100 28.65% 148 29.37% 286 29.61% Yes
No 75 66.37% 249 71.35% 356 70.63% 680 70.39%
Total 113 100.00% 349 100.00% 504 100.00% 966 100.00%
Note: N = Frequency, % = Percent

39
Table 14.2. Different Products Purchased by Consumer During Agri-tourism Activity
(Vegetable Transplants, Seasonal Decorations, Pumpkins/Corn Stalks, Christmas Trees, etc.)
Products
State
ALL Delaware New Jersey Pennsylvania
N % N % N % N %
Vegetable transplants
33 30.84% 74 22.84% 148 31.62% 255 28.36% Yes
No 74 69.16% 250 77.16% 320 68.38% 644 71.64%
Total 107 100.00% 324 100.00% 468 100.00% 899 100.00%
Seasonal decorations
56 52.34% 155 47.84% 241 51.50% 452 50.28% Yes
No 51 47.66% 169 52.16% 227 48.50% 447 49.72%
Total 107 100.00% 324 100.00% 468 100.00% 899 100.00%
Pumpkins/corn stalks
82 76.64% 225 69.44% 312 66.67% 619 68.85% Yes
No 25 23.36% 99 30.56% 156 33.33% 280 31.15%
Total 107 100.00% 324 100.00% 468 100.00% 899 100.00%
Christmas Trees
50 46.73% 146 45.06% 225 48.08% 421 46.83% Yes
No 57 53.27% 178 54.94% 243 51.92% 478 53.17%
Total 107 100.00% 324 100.00% 468 100.00% 899 100.00%
Locally made value added products
(for example: jams, honey, baked
goods)
79 73.83% 231 71.30% 335 71.58% 645 71.75% Yes
No 28 26.17% 93 28.70% 133 28.42% 254 28.25%
Total 107 100.00% 324 100.00% 468 100.00% 899 100.00%
Farm festival products
37 34.58% 122 37.65% 217 46.37% 376 41.82% Yes
No 70 65.42% 202 62.35% 251 53.63% 523 58.18%
Total 107 100.00% 324 100.00% 468 100.00% 899 100.00%
Note: N = Frequency, % = Percent
Participants were then asked several questions concerning their personal experiences
when attending or visiting agri-tourism locations for events and activities. Results are shown in
the following four figures. As Figure 7.1 shows, participants from Pennsylvania visited more

40
agri-tourism sites, on average, than New Jersey and Delaware. New Jersey residents visited the
least amount, on average, out of the three states; however, they spent the most money, on
average, of consumers from the three states (Figure 7.2).

41
Figure 7.3 shows that residents from the Mid-Atlantic region visited approximately two different
agri-tourism locations per year, with those from Pennsylvania and Delaware visiting slightly
more than New Jersey residents. Regarding the distance traveled to an agri-tourism site,
individuals from Pennsylvania traveled the least number of miles to a site, with an average of
only 19.14 miles one way (Figure 7.4). New Jersey and Delaware residents; however, had to
travel an average of 20 miles one way.

42
The survey continued with questions acknowledging more personal experiences and
habits of consumers who attend agri-tourism events, as shown in the following three tables.
Respondents indicated during which season(s) they had visited sites for agri-tourism events and
activities. As expected, consumers visited locations the most during the fall months, as shown in
Table 15. This is not surprising considering the number of activities available during that time of
the year (e.g., hay rides, corn mazes). Many also visited during the summer and spring seasons,
when many crops are harvested and other activities are hosted. Alas, only about 14 percent
responded that they visited during the winter season.
Table 15. Respondents’ Visiting Seasons for Agri-tourism Activity
Season
State
TOTAL Delaware New Jersey Pennsylvania
N % N % N % N %
Spring (March - May) 59 44.36% 170 40.09% 212 36.74% 441 38.89%
Summer (June - August) 71 53.38% 227 53.54% 335 58.06% 633 55.82%
Fall (September - November) 115 86.47% 296 69.81% 432 74.87% 843 74.34%
Winter (December - February) 24 18.05% 50 11.79% 82 14.21% 156 13.76%
All 133 100.00% 424 100.00% 577 100.00% 1134 100.00%
Note: N = Frequency, % = Percent, since respondents selected more than one choice,
total percentages do not add to 100%
If consumers are planning to attend a specific event held at a farm or direct marketing outlet,
they tend to decide to attend the activity during the week in which the event is held, as shown in
Table 16. Many will also make plans to attend more than a week in advance. However, they
generally don’t prefer to wait and decide the day of or the day before an event to attend, so it
seems logical, from the data, that marketing and promotional efforts should be implemented
during the period when the greatest percentage of consumers decide to agri-tourism events.

43
Table 16. Respondents in Advance Planning to Attend Agri-tourism Activity
Event Planning
State
TOTAL Delaware New Jersey Pennsylvania
N % N % N % N %
Advance Planning to Visit
15 12.20% 62 16.89% 81 15.61% 158 15.66% The day of the event or activity
One day before the event or activity 16 13.01% 48 13.08% 63 12.14% 127 12.59%
The week that the event or activity is held 59 47.97% 157 42.78% 240 46.24% 456 45.19%
More than a week in advance (7 days or
more) 33 26.83% 100 27.25% 135 26.01% 268 26.56%
All 123 100.00% 367 100.00% 519 100.00% 1009 100.00%
Note: N = Frequency, % = Percent
A majority of respondents (more than 80 percent) reported that they usually return to the same
agri-tourism location, perhaps even regularly, to purchase products over the course of the year
(Figure 8 below).
What an agri-tourism site has to offer (e.g., activities, facilities, purchasing opportunities)
consumers is key for attracting visitors. Respondents were asked to rank the importance of

44
certain factors and offerings as a matter of influencing their visit. Results are shown in the next
three tables. In Table 17.1, consumers reported that the availability of comfort facilities for use
on the premises was a ‘moderately important’ to ‘very important’ factor when determining if
they would visit or not. Shops and markets to purchase farm products were also substantial
factors, while educational functions were only a ‘neutral’ to ‘moderately important’ concern.
Table 17.1. Important Factors (Facilities, Farm Products and Educational Activities)
Influencing Visit to Agri-tourism Location
Important Factors
State
ALL Delaware New Jersey Pennsylvania
N % N % N % N %
Facilities are available for use (for example:
restrooms, picnic tables)
6 4.92% 21 5.79% 28 5.44% 55 5.50% Not at all important
Low importance 8 6.56% 22 6.06% 30 5.83% 60 6.00%
Slightly Important 13 10.66% 42 11.57% 42 8.16% 97 9.70%
Neutral 6 4.92% 29 7.99% 51 9.90% 86 8.60%
Moderately Important 29 23.77% 100 27.55% 129 25.05% 258 25.80%
Very important 36 29.51% 87 23.97% 146 28.35% 269 26.90%
Extremely important 24 19.67% 62 17.08% 89 17.28% 175 17.50%
Total 122 100.00% 363 100.00% 515 100.00% 1000 100.00%
Shops and markets to purchase farm products
1 0.82% 13 3.58% 11 2.14% 25 2.50% Not at all important
Low importance 7 5.74% 10 2.75% 16 3.11% 33 3.30%
Slightly Important 11 9.02% 31 8.54% 41 7.96% 83 8.30%
Neutral 13 10.66% 40 11.02% 66 12.82% 119 11.90%
Moderately Important 29 23.77% 93 25.62% 167 32.43% 289 28.90%
Very important 44 36.07% 132 36.36% 146 28.35% 322 32.20%
Extremely important 17 13.93% 44 12.12% 68 13.20% 129 12.90%
Total 122 100.00% 363 100.00% 515 100.00% 1000 100.00%
Educational demonstrations, classes, and
workshops
10 8.20% 35 9.64% 45 8.74% 90 9.00% Not at all important
Low importance 22 18.03% 61 16.80% 61 11.84% 144 14.40%
Slightly Important 10 8.20% 36 9.92% 61 11.84% 107 10.70%
Neutral 35 28.69% 103 28.37% 145 28.16% 283 28.30%

45
Important Factors
State
ALL Delaware New Jersey Pennsylvania
N % N % N % N %
Moderately Important 31 25.41% 74 20.39% 133 25.83% 238 23.80%
Very important 11 9.02% 41 11.29% 46 8.93% 98 9.80%
Extremely important 3 2.46% 13 3.58% 24 4.66% 40 4.00%
Total 122 100.00% 363 100.00% 515 100.00% 1000 100.00%
Note: N = Frequency, % = Percent
Whether the prospective location had a view or natural setting and if the location was
convenient to the individuals’ home or work were both ‘moderately important’ to ‘very
important’ factors for all Mid-Atlantic residents (Table 17.2). However, most consumers were
‘neutral’ about the presence of animal or petting zoos at an agri-tourism location, with more New
Jersey participants feeling it was ’moderately important’ to have them than respondents from
Pennsylvania and Delaware.
Offering activities at agri-tourism locations was said to be a ‘moderately important’ to
‘very important’ factor for visiting (Table 17.3). Yet, most had just a ‘neutral’ opinion of
whether the location offered events, like concerts and themed dinners, and having a restaurant or
café there. Additionally, some responded that it was moderately important to have access to
these features while at agri-tourism sites. Overall, out of all the supplemental factors considered,
only a minimal number of respondents considered them ‘extremely important’ when deciding
whether or not to visit a particular location.

46
Table 17.2. Important factors (Natural Scenes, Petting Zoos and Proximity)
Influencing Visit to Agri-tourism Location
Important Factors
State
ALL Delaware New Jersey Pennsylvania
N % N % N % N %
Scenery and view of natural settings
2 1.65% 9 2.47% 14 2.74% 25 2.51% Not at all important
Low importance 6 4.96% 25 6.85% 17 3.33% 48 4.81%
Slightly Important 4 3.31% 26 7.12% 33 6.46% 63 6.32%
Neutral 16 13.22% 41 11.23% 94 18.40% 151 15.15%
Moderately Important 40 33.06% 120 32.88% 165 32.29% 325 32.60%
Very important 33 27.27% 96 26.30% 129 25.24% 258 25.88%
Extremely important 20 16.53% 48 13.15% 59 11.55% 127 12.74%
Total 121 100.00% 365 100.00% 511 100.00% 997 100.00%
Animals or petting zoos
21 17.36% 53 14.52% 70 13.70% 144 14.44% Not at all important
Low importance 19 15.70% 48 13.15% 61 11.94% 128 12.84%
Slightly Important 12 9.92% 40 10.96% 56 10.96% 108 10.83%
Neutral 35 28.93% 77 21.10% 141 27.59% 253 25.38%
Moderately Important 24 19.83% 86 23.56% 105 20.55% 215 21.56%
Very important 8 6.61% 44 12.05% 57 11.15% 109 10.93%
Extremely important 2 1.65% 17 4.66% 21 4.11% 40 4.01%
Total 121 100.00% 365 100.00% 511 100.00% 997 100.00%
Convenience to where I live or work
5 4.13% 15 4.11% 26 5.09% 46 4.61% Not at all important
Low importance 4 3.31% 28 7.67% 25 4.89% 57 5.72%
Slightly Important 8 6.61% 35 9.59% 51 9.98% 94 9.43%
Neutral 14 11.57% 49 13.42% 79 15.46% 142 14.24%
Moderately Important 46 38.02% 108 29.59% 143 27.98% 297 29.79%
Very important 29 23.97% 88 24.11% 126 24.66% 243 24.37%
Extremely important 15 12.40% 42 11.51% 61 11.94% 118 11.84%
Total 121 100.00% 365 100.00% 511 100.00% 997 100.00%
Note: N = Frequency, % = Percent

47
Table 17.3.Important Factors (Events, Activities and Restaurants)
Influencing Visit to Agri-tourism Location
Important Factors
State
ALL Delaware New Jersey Pennsylvania
N % N % N % N %
Events (for example: concerts, theme dinners)
5 4.13% 28 7.65% 40 7.89% 73 7.34% Not at all important
Low importance 11 9.09% 39 10.66% 47 9.27% 97 9.76%
Slightly Important 14 11.57% 31 8.47% 50 9.86% 95 9.56%
Neutral 34 28.10% 95 25.96% 143 28.21% 272 27.36%
Moderately Important 33 27.27% 97 26.50% 100 19.72% 230 23.14%
Very important 18 14.88% 60 16.39% 93 18.34% 171 17.20%
Extremely important 6 4.96% 16 4.37% 34 6.71% 56 5.63%
Total 121 100.00% 366 100.00% 507 100.00% 994 100.00%
Activities (for example: hay rides, farm tours)
1 0.83% 18 4.92% 21 4.14% 40 4.02% Not at all important
Low importance 9 7.44% 26 7.10% 28 5.52% 63 6.34%
Slightly Important 10 8.26% 29 7.92% 35 6.90% 74 7.44%
Neutral 12 9.92% 46 12.57% 82 16.17% 140 14.08%
Moderately Important 43 35.54% 108 29.51% 126 24.85% 277 27.87%
Very important 28 23.14% 99 27.05% 137 27.02% 264 26.56%
Extremely important 18 14.88% 40 10.93% 78 15.38% 136 13.68%
Total 121 100.00% 366 100.00% 507 100.00% 994 100.00%
Restaurant or cafe
10 8.26% 25 6.83% 36 7.10% 71 7.14% Not at all important
Low importance 19 15.70% 48 13.11% 52 10.26% 119 11.97%
Slightly Important 17 14.05% 43 11.75% 45 8.88% 105 10.56%
Neutral 31 25.62% 91 24.86% 155 30.57% 277 27.87%
Moderately Important 29 23.97% 88 24.04% 141 27.81% 258 25.96%
Very important 9 7.44% 50 13.66% 64 12.62% 123 12.37%
Extremely important 6 4.96% 21 5.74% 14 2.76% 41 4.12%
Total 121 100.00% 366 100.00% 507 100.00% 994 100.00%
Note: N = Frequency, % = Percent

48
Respondents were asked about the direct marketing and agri-tourism operations from
which they made a purchase, not just fruits and vegetables. As the data in Figure 9 shows,
results are generally the same as when asked about purchasing produce only. The majority buys
from community farmers’ markets, yet, a substantial number of consumers still made purchases
from PYO and on-farm markets. Community Supported agriculture farmers were still the least
patronized.
Based on what direct marketing or agri-tourism outlets respondents previously selected,
they then rated them based on certain characteristics (e.g., quality of products, variety of
products, price of products) as displayed in Tables 18.1 through 18.10. To start, from the four
market types, almost every respondent said quality of products was either ‘very good’ or ‘good’
for an over 90 percent combined average for each market type (Table 18.1). For example,
approximately 66 percent of respondents say the quality for on-farm markets was ‘very good,’
the most out of all outlet types investigated. Hardly any said that the quality from these markets
was ‘poor,’ especially for on-farm and community farmers’ markets where zero people claimed
quality was ‘poor.’

49
Table 18.1. Respondents’ Rating the Quality of the Products
from the Agri-tourism and Direct Marketing Outlets
Outlets/Rating
State
ALL Delaware New Jersey Pennsylvania
N % N % N % N %
Quality of products available - Pick-your-own
farm
16 66.67% 71 65.74% 98 67.59% 185 66.79% Very good
Good 6 25.00% 35 32.41% 44 30.34% 85 30.69%
Fair 2 8.33% 2 1.85% 2 1.38% 6 2.17%
Poor . . . . 1 0.69% 1 0.36%
Total 24 100.00% 108 100.00% 145 100.00% 277 100.00%
Quality of products available - Community
farmers' market
14 58.33% 61 56.48% 95 65.52% 170 61.37% Very good
Good 9 37.50% 44 40.74% 46 31.72% 99 35.74%
Fair 1 4.17% 3 2.78% 4 2.76% 8 2.89%
Total 24 100.00% 108 100.00% 145 100.00% 277 100.00%
Quality of products available - On-farm market
15 62.50% 70 64.81% 99 68.28% 184 66.43% Very good
Good 8 33.33% 33 30.56% 42 28.97% 83 29.96%
Fair 1 4.17% 5 4.63% 4 2.76% 10 3.61%
Total 24 100.00% 108 100.00% 145 100.00% 277 100.00%
Quality of products available - Community
Supported Agriculture (CSA)
7 29.17% 55 50.93% 63 43.45% 125 45.13% Very good
Good 15 62.50% 42 38.89% 69 47.59% 126 45.49%
Fair 2 8.33% 10 9.26% 12 8.28% 24 8.66%
Poor . . 1 0.93% 1 0.69% 2 0.72%
Total 24 100.00% 108 100.00% 145 100.00% 277 100.00%
Note: N = Frequency, % = Percent
Table 18.2 shows responses regarding the number or products the outlets offered. Most
customers were satisfied with what the markets had for sale, rating were primarily ‘very good’
and ‘good.’ More than half of all the participants rated PYO, community farmers’ markets, and
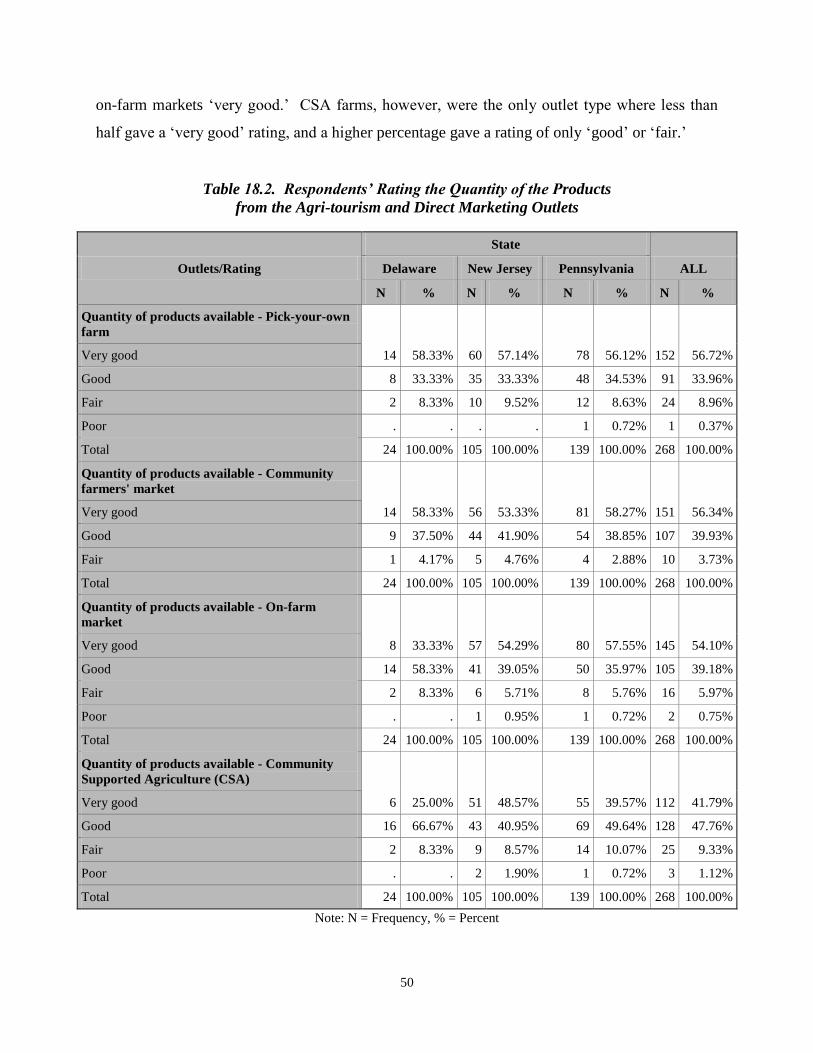
50
on-farm markets ‘very good.’ CSA farms, however, were the only outlet type where less than
half gave a ‘very good’ rating, and a higher percentage gave a rating of only ‘good’ or ‘fair.’
Table 18.2. Respondents’ Rating the Quantity of the Products
from the Agri-tourism and Direct Marketing Outlets
Outlets/Rating
State
ALL Delaware New Jersey Pennsylvania
N % N % N % N %
Quantity of products available - Pick-your-own
farm
14 58.33% 60 57.14% 78 56.12% 152 56.72% Very good
Good 8 33.33% 35 33.33% 48 34.53% 91 33.96%
Fair 2 8.33% 10 9.52% 12 8.63% 24 8.96%
Poor . . . . 1 0.72% 1 0.37%
Total 24 100.00% 105 100.00% 139 100.00% 268 100.00%
Quantity of products available - Community
farmers' market
14 58.33% 56 53.33% 81 58.27% 151 56.34% Very good
Good 9 37.50% 44 41.90% 54 38.85% 107 39.93%
Fair 1 4.17% 5 4.76% 4 2.88% 10 3.73%
Total 24 100.00% 105 100.00% 139 100.00% 268 100.00%
Quantity of products available - On-farm
market
8 33.33% 57 54.29% 80 57.55% 145 54.10% Very good
Good 14 58.33% 41 39.05% 50 35.97% 105 39.18%
Fair 2 8.33% 6 5.71% 8 5.76% 16 5.97%
Poor . . 1 0.95% 1 0.72% 2 0.75%
Total 24 100.00% 105 100.00% 139 100.00% 268 100.00%
Quantity of products available - Community
Supported Agriculture (CSA)
6 25.00% 51 48.57% 55 39.57% 112 41.79% Very good
Good 16 66.67% 43 40.95% 69 49.64% 128 47.76%
Fair 2 8.33% 9 8.57% 14 10.07% 25 9.33%
Poor . . 2 1.90% 1 0.72% 3 1.12%
Total 24 100.00% 105 100.00% 139 100.00% 268 100.00%
Note: N = Frequency, % = Percent

51
In Table 18.3, respondents rated their satisfaction with the variety of products from these same
markets. The majority responded, as with the quality and quantity ratings, that the variety was
either ‘very good’ or ‘good.’ Similarly, the CSA ratings were slightly lower than the other
outlets.
Table 18.3. Respondents’ Rating the Variety of the Products
from the Agri-tourism and Direct Marketing Outlets
Outlets/Rating
State
ALL Delaware New Jersey Pennsylvania
N % N % N % N %
Variety of products available - Pick-your-own
farm
6 25.00% 50 48.08% 56 39.44% 112 41.48% Very good
Good 12 50.00% 37 35.58% 55 38.73% 104 38.52%
Fair 5 20.83% 17 16.35% 28 19.72% 50 18.52%
Poor 1 4.17% . . 3 2.11% 4 1.48%
Total 24 100.00% 104 100.00% 142 100.00% 270 100.00%
Variety of products available - Community
farmers' market
10 41.67% 53 50.96% 70 49.30% 133 49.26% Very good
Good 12 50.00% 44 42.31% 60 42.25% 116 42.96%
Fair 2 8.33% 6 5.77% 11 7.75% 19 7.04%
Poor . . 1 0.96% 1 0.70% 2 0.74%
Total 24 100.00% 104 100.00% 142 100.00% 270 100.00%
Variety of products available - On-farm market
6 25.00% 55 52.88% 63 44.37% 124 45.93% Very good
Good 16 66.67% 36 34.62% 65 45.77% 117 43.33%
Fair 2 8.33% 12 11.54% 12 8.45% 26 9.63%
Poor . . 1 0.96% 2 1.41% 3 1.11%
Total 24 100.00% 104 100.00% 142 100.00% 270 100.00%
Variety of products available - Community
Supported Agriculture (CSA)
5 20.83% 48 46.15% 49 34.51% 102 37.78% Very good
Good 16 66.67% 45 43.27% 78 54.93% 139 51.48%
Fair 3 12.50% 11 10.58% 14 9.86% 28 10.37%
Poor . . . . 1 0.70% 1 0.37%
Total 24 100.00% 104 100.00% 142 100.00% 270 100.00%
Note: N = Frequency, % = Percent

52
The study found that most consumers felt the prices of products offered at the outlets were
generally ‘good’ (approximately 45 percent for all outlet types), followed by ‘very good’
(approximately 30 to 40 percent), as shown in Table 18.4.
Table 18.4. Respondents’ Rating the Price of the Products
from the Agri-tourism and Direct Marketing Outlets
Outlets/Rating
State
ALL Delaware New Jersey Pennsylvania
N % N % N % N %
Price of products available - Pick-your-own farm
5 21.74% 41 39.42% 54 38.03% 100 37.17% Very good
Good 10 43.48% 39 37.50% 73 51.41% 122 45.35%
Fair 8 34.78% 24 23.08% 14 9.86% 46 17.10%
Poor . . . . 1 0.70% 1 0.37%
Total 23 100.00% 104 100.00% 142 100.00% 269 100.00%
Price of products available - Community
farmers' market
5 21.74% 48 46.15% 52 36.62% 105 39.03% Very good
Good 9 39.13% 42 40.38% 67 47.18% 118 43.87%
Fair 8 34.78% 13 12.50% 21 14.79% 42 15.61%
Poor 1 4.35% 1 0.96% 2 1.41% 4 1.49%
Total 23 100.00% 104 100.00% 142 100.00% 269 100.00%
Price of products available - On-farm market
4 17.39% 45 43.27% 62 43.66% 111 41.26% Very good
Good 12 52.17% 39 37.50% 68 47.89% 119 44.24%
Fair 7 30.43% 20 19.23% 10 7.04% 37 13.75%
Poor . . . . 2 1.41% 2 0.74%
Total 23 100.00% 104 100.00% 142 100.00% 269 100.00%
Price of products available - Community
Supported Agriculture (CSA)
3 13.04% 39 37.50% 40 28.17% 82 30.48% Very good
Good 11 47.83% 41 39.42% 76 53.52% 128 47.58%
Fair 7 30.43% 23 22.12% 24 16.90% 54 20.07%
Poor 2 8.70% 1 0.96% 2 1.41% 5 1.86%
Total 23 100.00% 104 100.00% 142 100.00% 269 100.00%
Note: N = Frequency, % = Percent

53
Agri-tourism and direct marketing outlet visitors viewed the appearance of the establishments as
‘good’ and ‘very good’ on the whole, with slightly more leaning towards the ‘good’ rating, as
conveyed in Table 18.5.
Table 18.5. Respondents’ Rating the Establishment Appearance
of Agri-tourism and Direct Marketing Outlets
Outlets/Rating
State
ALL Delaware New Jersey Pennsylvania
N % N % N % N %
Appearance of establishment - Pick-
your-own farm
10 43.48% 50 47.62% 48 33.80% 108 40.00% Very good
Good 9 39.13% 46 43.81% 74 52.11% 129 47.78%
Fair 4 17.39% 7 6.67% 19 13.38% 30 11.11%
Poor . . 2 1.90% 1 0.70% 3 1.11%
Total 23 100.00% 105 100.00% 142 100.00% 270 100.00%
Appearance of establishment -
Community farmers' market
9 39.13% 41 39.05% 49 34.51% 99 36.67% Very good
Good 9 39.13% 51 48.57% 79 55.63% 139 51.48%
Fair 5 21.74% 13 12.38% 14 9.86% 32 11.85%
Total 23 100.00% 105 100.00% 142 100.00% 270 100.00%
Appearance of establishment - On-
farm market
10 43.48% 51 48.57% 51 35.92% 112 41.48% Very good
Good 11 47.83% 40 38.10% 71 50.00% 122 45.19%
Fair 2 8.70% 14 13.33% 19 13.38% 35 12.96%
Poor . . . . 1 0.70% 1 0.37%
Total 23 100.00% 105 100.00% 142 100.00% 270 100.00%
Appearance of establishment -
Community Supported Agriculture
(CSA)
6 26.09% 48 45.71% 46 32.39% 100 37.04% Very good
Good 13 56.52% 42 40.00% 79 55.63% 134 49.63%
Fair 4 17.39% 13 12.38% 17 11.97% 34 12.59%
Poor . . 2 1.90% . . 2 0.74%
Total 23 100.00% 105 100.00% 142 100.00% 270 100.00%
Note: N = Frequency, % = Percent

54
In tandem with appearance, a majority of individuals rated the cleanliness as ‘good’ and ‘very
good’ for all four types of establishments (Table 18.6). These two findings, perception of
appearance and cleanliness, may offer owners an important view towards future improvement
relative to visual appeal for increasing customer visits.
Table 18.6. Respondents’ Rating the Cleanliness of the Establishment
of Agri-tourism and Direct Marketing Outlets
Outlets/Rating
State
ALL Delaware New Jersey Pennsylvania
N % N % N % N %
Cleanliness of establishment - Pick-your-own
farm
10 41.67% 46 43.81% 45 31.91% 101 37.41% Very good
Good 9 37.50% 41 39.05% 72 51.06% 122 45.19%
Fair 5 20.83% 16 15.24% 23 16.31% 44 16.30%
Poor . . 2 1.90% 1 0.71% 3 1.11%
Total 24 100.00% 105 100.00% 141 100.00% 270 100.00%
Cleanliness of establishment - Community
farmers' market
8 33.33% 36 34.29% 48 34.04% 92 34.07% Very good
Good 10 41.67% 55 52.38% 73 51.77% 138 51.11%
Fair 6 25.00% 14 13.33% 18 12.77% 38 14.07%
Poor . . . . 2 1.42% 2 0.74%
Total 24 100.00% 105 100.00% 141 100.00% 270 100.00%
Cleanliness of establishment - On-farm
market
10 41.67% 48 45.71% 49 34.75% 107 39.63% Very good
Good 11 45.83% 41 39.05% 77 54.61% 129 47.78%
Fair 3 12.50% 15 14.29% 15 10.64% 33 12.22%
Poor . . 1 0.95% . . 1 0.37%
Total 24 100.00% 105 100.00% 141 100.00% 270 100.00%
Cleanliness of establishment - Community
Supported Agriculture (CSA)
4 16.67% 45 42.86% 43 30.50% 92 34.07% Very good
Good 15 62.50% 46 43.81% 79 56.03% 140 51.85%
Fair 5 20.83% 12 11.43% 17 12.06% 34 12.59%
Poor . . 2 1.90% 2 1.42% 4 1.48%
Total 24 100.00% 105 100.00% 141 100.00% 270 100.00%

55
Consumers also rated how convenient both the operating hours/days and the locations of
the four business types were, generally saying that they were either ‘good’ or ‘very good’
(Tables 18.7 and 18.8), but certainly indicating room for improvement as shown by a notable
‘fair’ ratings for each type. Community farmers’ markets seemed to be rated as more convenient
than the other three outlet types. These ratings were somewhat expected, due to the nature of
community farmers’ markets, whose purpose is to provide a large variety of products to
consumers and convenience them by having many sellers in one location.
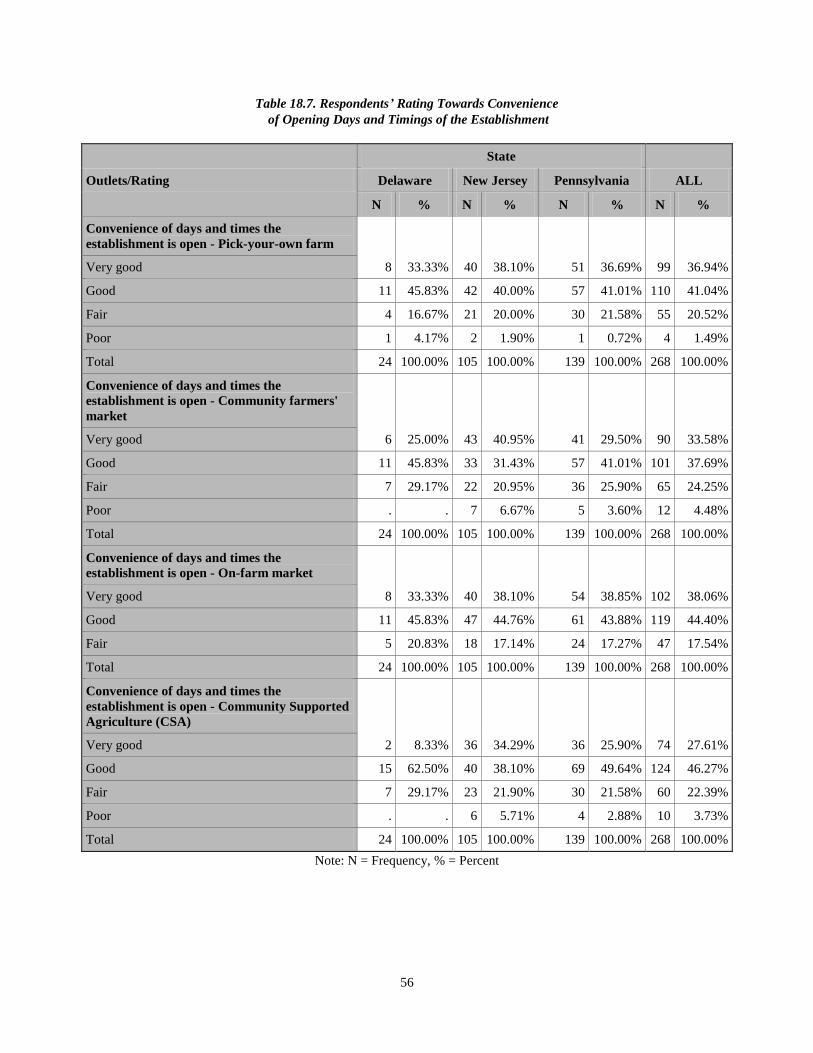
56
Table 18.7. Respondents’ Rating Towards Convenience
of Opening Days and Timings of the Establishment
Outlets/Rating
State
ALL Delaware New Jersey Pennsylvania
N % N % N % N %
Convenience of days and times the
establishment is open - Pick-your-own farm
8 33.33% 40 38.10% 51 36.69% 99 36.94% Very good
Good 11 45.83% 42 40.00% 57 41.01% 110 41.04%
Fair 4 16.67% 21 20.00% 30 21.58% 55 20.52%
Poor 1 4.17% 2 1.90% 1 0.72% 4 1.49%
Total 24 100.00% 105 100.00% 139 100.00% 268 100.00%
Convenience of days and times the
establishment is open - Community farmers'
market
6 25.00% 43 40.95% 41 29.50% 90 33.58% Very good
Good 11 45.83% 33 31.43% 57 41.01% 101 37.69%
Fair 7 29.17% 22 20.95% 36 25.90% 65 24.25%
Poor . . 7 6.67% 5 3.60% 12 4.48%
Total 24 100.00% 105 100.00% 139 100.00% 268 100.00%
Convenience of days and times the
establishment is open - On-farm market
8 33.33% 40 38.10% 54 38.85% 102 38.06% Very good
Good 11 45.83% 47 44.76% 61 43.88% 119 44.40%
Fair 5 20.83% 18 17.14% 24 17.27% 47 17.54%
Total 24 100.00% 105 100.00% 139 100.00% 268 100.00%
Convenience of days and times the
establishment is open - Community Supported
Agriculture (CSA)
2 8.33% 36 34.29% 36 25.90% 74 27.61% Very good
Good 15 62.50% 40 38.10% 69 49.64% 124 46.27%
Fair 7 29.17% 23 21.90% 30 21.58% 60 22.39%
Poor . . 6 5.71% 4 2.88% 10 3.73%
Total 24 100.00% 105 100.00% 139 100.00% 268 100.00%
Note: N = Frequency, % = Percent

57
Table 18.8. Respondents’ Rating Towards Convenience of Location
of Agri-tourism and Direct Marketing Outlets
Outlets/Rating
State
ALL Delaware New Jersey Pennsylvania
N % N % N % N %
Convenience of location - Pick-your-own farm
8 33.33% 40 38.46% 45 32.14% 93 34.70% Very good
Good 12 50.00% 37 35.58% 66 47.14% 115 42.91%
Fair 4 16.67% 24 23.08% 26 18.57% 54 20.15%
Poor . . 3 2.88% 3 2.14% 6 2.24%
Total 24 100.00% 104 100.00% 140 100.00% 268 100.00%
Convenience of location - Community farmers'
market
9 37.50% 53 50.96% 63 45.00% 125 46.64% Very good
Good 12 50.00% 38 36.54% 60 42.86% 110 41.04%
Fair 3 12.50% 13 12.50% 15 10.71% 31 11.57%
Poor . . . . 2 1.43% 2 0.75%
Total 24 100.00% 104 100.00% 140 100.00% 268 100.00%
Convenience of location - On-farm market
10 41.67% 48 46.15% 51 36.43% 109 40.67% Very good
Good 12 50.00% 39 37.50% 65 46.43% 116 43.28%
Fair 1 4.17% 17 16.35% 23 16.43% 41 15.30%
Poor 1 4.17% . . 1 0.71% 2 0.75%
Total 24 100.00% 104 100.00% 140 100.00% 268 100.00%
Convenience of location - Community
Supported Agriculture (CSA)
4 16.67% 40 38.46% 36 25.71% 80 29.85% Very good
Good 13 54.17% 38 36.54% 71 50.71% 122 45.52%
Fair 5 20.83% 20 19.23% 24 17.14% 49 18.28%
Poor 2 8.33% 6 5.77% 9 6.43% 17 6.34%
Total 24 100.00% 104 100.00% 140 100.00% 268 100.00%
Note: N = Frequency, % = Percent

58
Employee attitudes were given high ratings of ‘very good’ and ‘good’ from the entire Mid-
Atlantic region, for an over 90 percent combined average for each market type as shown in Table
18.9.
Table 18.9. Respondents' Rating the Employee Attitude
of Agri-tourism and Direct Marketing Outlets
Outlets/Rating
State
ALL Delaware New Jersey Pennsylvania
N % N % N % N %
Employee attitude - Pick-your-own farm
13 54.17% 51 49.51% 78 56.52% 142 53.58% Very good
Good 10 41.67% 43 41.75% 55 39.86% 108 40.75%
Fair 1 4.17% 9 8.74% 5 3.62% 15 5.66%
Total 24 100.00% 103 100.00% 138 100.00% 265 100.00%
Employee attitude - Community farmers'
market
10 41.67% 45 43.69% 73 52.90% 128 48.30% Very good
Good 10 41.67% 48 46.60% 60 43.48% 118 44.53%
Fair 4 16.67% 9 8.74% 4 2.90% 17 6.42%
Poor . . 1 0.97% 1 0.72% 2 0.75%
Total 24 100.00% 103 100.00% 138 100.00% 265 100.00%
Employee attitude - On-farm market
12 50.00% 59 57.28% 75 54.35% 146 55.09% Very good
Good 11 45.83% 37 35.92% 59 42.75% 107 40.38%
Fair 1 4.17% 7 6.80% 4 2.90% 12 4.53%
Total 24 100.00% 103 100.00% 138 100.00% 265 100.00%
Employee attitude - Community Supported
Agriculture (CSA)
7 29.17% 47 45.63% 65 47.10% 119 44.91% Very good
Good 14 58.33% 46 44.66% 63 45.65% 123 46.42%
Fair 3 12.50% 10 9.71% 8 5.80% 21 7.92%
Poor . . . . 2 1.45% 2 0.75%
Total 24 100.00% 103 100.00% 138 100.00% 265 100.00%
Note: N = Frequency, % = Percent

59
Finally, as might be expected, employee’s knowledge at all of the outlet types was either ‘very
good’ or ‘good,’ with very few respondents claiming otherwise (Table 18.10). Interestingly,
respondents rarely gave ‘poor’ or ‘fair’ ratings for most of the characteristics listed and for all of
the outlet types.
Table 18.10. Respondents Rating the Employee Knowledge
of Agri-tourism and Direct Marketing Outlets
Outlets/Rating
State
ALL Delaware New Jersey Pennsylvania
N % N % N % N %
Employee knowledge - Pick-your-own farm
15 62.50% 61 59.80% 88 63.31% 164 61.89% Very good
Good 8 33.33% 33 32.35% 45 32.37% 86 32.45%
Fair 1 4.17% 8 7.84% 6 4.32% 15 5.66%
Total 24 100.00% 102 100.00% 139 100.00% 265 100.00%
Employee knowledge - Community farmers'
market
9 37.50% 51 50.00% 73 52.52% 133 50.19% Very good
Good 11 45.83% 43 42.16% 55 39.57% 109 41.13%
Fair 4 16.67% 7 6.86% 10 7.19% 21 7.92%
Poor . . 1 0.98% 1 0.72% 2 0.75%
Total 24 100.00% 102 100.00% 139 100.00% 265 100.00%
Employee knowledge - On-farm market
15 62.50% 67 65.69% 83 59.71% 165 62.26% Very good
Good 8 33.33% 30 29.41% 54 38.85% 92 34.72%
Fair 1 4.17% 5 4.90% 2 1.44% 8 3.02%
Total 24 100.00% 102 100.00% 139 100.00% 265 100.00%
Employee knowledge - Community Supported
Agriculture (CSA)
7 29.17% 49 48.04% 61 43.88% 117 44.15% Very good
Good 13 54.17% 42 41.18% 67 48.20% 122 46.04%
Fair 4 16.67% 11 10.78% 9 6.47% 24 9.06%
Poor . . . . 2 1.44% 2 0.75%
Total 24 100.00% 102 100.00% 139 100.00% 265 100.00%
Note: N = Frequency, % = Percent

60
Each participant was asked to classify how important a set of reasons was when deciding
whether to visit an agri-tourism location for an event or activity. A primary reason identified by
all the respondents for wanting to visit was to purchase fresh fruit and vegetables, where more
than half of the participants said it was either ‘very important’ or ‘extremely important,’ as
shown in Table 19.1. Supporting local farmers was also among the ‘very important’ reasons to
support local farmers, while purchasing value-added products were only ‘moderately important’
reasons. Aside from those, Table 19.2 shows that consumers felt spending time with family and
friends was also a ‘very important’ deciding factor for wanting to visit an agri-tourism location
or event. A significant number of individuals also felt that the opportunity to enjoy the rural
scenery or nature was a deciding factor for them. However, being able to learn or to be taught
how food is produced/grown at farm establishments did not appear to be a compelling reason for
individuals who wished to visit. Table 19.3 shows that both wanting the experience of a farm
visit and seeing where and how food is produced/grown were said to be a ‘neutral’ deciding
factor for visiting an agri-tourism establishment; location, in terms of closeness and convenience
of going there, was found to be a ‘moderately important’ to ‘very important’ reason.
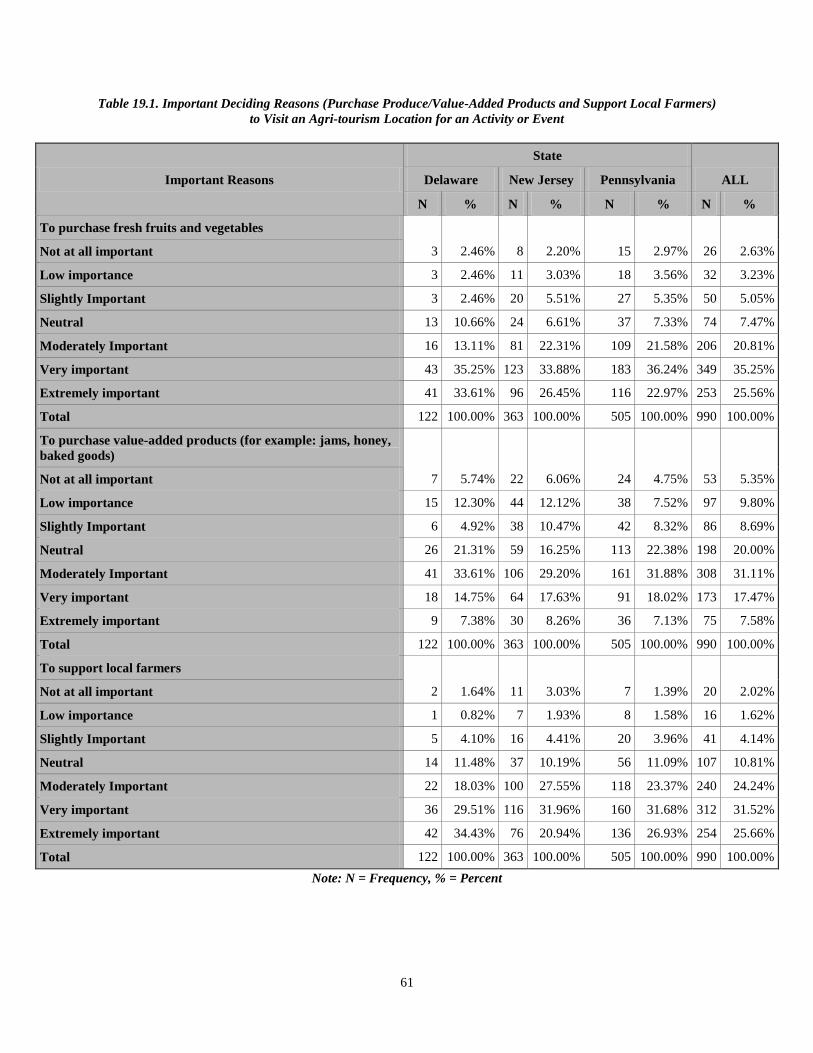
61
Table 19.1. Important Deciding Reasons (Purchase Produce/Value-Added Products and Support Local Farmers)
to Visit an Agri-tourism Location for an Activity or Event
Important Reasons
State
ALL Delaware New Jersey Pennsylvania
N % N % N % N %
To purchase fresh fruits and vegetables
3 2.46% 8 2.20% 15 2.97% 26 2.63% Not at all important
Low importance 3 2.46% 11 3.03% 18 3.56% 32 3.23%
Slightly Important 3 2.46% 20 5.51% 27 5.35% 50 5.05%
Neutral 13 10.66% 24 6.61% 37 7.33% 74 7.47%
Moderately Important 16 13.11% 81 22.31% 109 21.58% 206 20.81%
Very important 43 35.25% 123 33.88% 183 36.24% 349 35.25%
Extremely important 41 33.61% 96 26.45% 116 22.97% 253 25.56%
Total 122 100.00% 363 100.00% 505 100.00% 990 100.00%
To purchase value-added products (for example: jams, honey,
baked goods)
7 5.74% 22 6.06% 24 4.75% 53 5.35% Not at all important
Low importance 15 12.30% 44 12.12% 38 7.52% 97 9.80%
Slightly Important 6 4.92% 38 10.47% 42 8.32% 86 8.69%
Neutral 26 21.31% 59 16.25% 113 22.38% 198 20.00%
Moderately Important 41 33.61% 106 29.20% 161 31.88% 308 31.11%
Very important 18 14.75% 64 17.63% 91 18.02% 173 17.47%
Extremely important 9 7.38% 30 8.26% 36 7.13% 75 7.58%
Total 122 100.00% 363 100.00% 505 100.00% 990 100.00%
To support local farmers
2 1.64% 11 3.03% 7 1.39% 20 2.02% Not at all important
Low importance 1 0.82% 7 1.93% 8 1.58% 16 1.62%
Slightly Important 5 4.10% 16 4.41% 20 3.96% 41 4.14%
Neutral 14 11.48% 37 10.19% 56 11.09% 107 10.81%
Moderately Important 22 18.03% 100 27.55% 118 23.37% 240 24.24%
Very important 36 29.51% 116 31.96% 160 31.68% 312 31.52%
Extremely important 42 34.43% 76 20.94% 136 26.93% 254 25.66%
Total 122 100.00% 363 100.00% 505 100.00% 990 100.00%
Note: N = Frequency, % = Percent

62
Table 19.2. Important Deciding Reasons (Enjoy the Rural Scenery/Nature, Spend Time with Family/Friends
and Learn How Food is Grown) to Visit an Agri-tourism Location for an Activity or Event
Important Reasons
State
ALL Delaware New Jersey Pennsylvania
N % N % N % N %
To enjoy the rural scenery/nature
2 1.67% 9 2.51% 8 1.58% 19 1.93% Not at all important
Low importance 2 1.67% 14 3.90% 9 1.78% 25 2.54%
Slightly Important 4 3.33% 20 5.57% 18 3.55% 42 4.26%
Neutral 18 15.00% 36 10.03% 76 14.99% 130 13.18%
Moderately Important 28 23.33% 99 27.58% 159 31.36% 286 29.01%
Very important 36 30.00% 109 30.36% 133 26.23% 278 28.19%
Extremely important 30 25.00% 72 20.06% 104 20.51% 206 20.89%
Total 120 100.00% 359 100.00% 507 100.00% 986 100.00%
To spend time with family and friends
2 1.67% 12 3.34% 6 1.18% 20 2.03% Not at all important
Low importance 4 3.33% 9 2.51% 17 3.35% 30 3.04%
Slightly Important 6 5.00% 12 3.34% 17 3.35% 35 3.55%
Neutral 16 13.33% 55 15.32% 68 13.41% 139 14.10%
Moderately Important 19 15.83% 77 21.45% 107 21.10% 203 20.59%
Very important 34 28.33% 108 30.08% 155 30.57% 297 30.12%
Extremely important 39 32.50% 86 23.96% 137 27.02% 262 26.57%
Total 120 100.00% 359 100.00% 507 100.00% 986 100.00%
To learn or be taught how food is produced/grown
12 10.00% 39 10.86% 49 9.66% 100 10.14% Not at all important
Low importance 22 18.33% 50 13.93% 40 7.89% 112 11.36%
Slightly Important 12 10.00% 35 9.75% 59 11.64% 106 10.75%
Neutral 27 22.50% 95 26.46% 150 29.59% 272 27.59%
Moderately Important 20 16.67% 66 18.38% 111 21.89% 197 19.98%
Very important 16 13.33% 49 13.65% 67 13.21% 132 13.39%
Extremely important 11 9.17% 25 6.96% 31 6.11% 67 6.80%
Total 120 100.00% 359 100.00% 507 100.00% 986 100.00%
Note: N = Frequency, % = Percent

63
Table 19.3. Important Deciding Reasons (To See How Food is Produced, Convenient Location and Experience of
Farm Visit) to Visit an Agri-tourism Location for an Activity or Event
Important Reasons
State
ALL Delaware New Jersey Pennsylvania
N % N % N % N %
To see where and/or how food is produced/grown
9 7.56% 31 8.86% 38 7.71% 78 8.11% Not at all important
Low importance 21 17.65% 34 9.71% 45 9.13% 100 10.40%
Slightly Important 11 9.24% 35 10.00% 42 8.52% 88 9.15%
Neutral 20 16.81% 77 22.00% 134 27.18% 231 24.01%
Moderately Important 26 21.85% 88 25.14% 110 22.31% 224 23.28%
Very important 19 15.97% 57 16.29% 84 17.04% 160 16.63%
Extremely important 13 10.92% 28 8.00% 40 8.11% 81 8.42%
Total 119 100.00% 350 100.00% 493 100.00% 962 100.00%
Conveniently located near my home or work
1 0.84% 17 4.86% 17 3.45% 35 3.64% Not at all important
Low importance 4 3.36% 14 4.00% 22 4.46% 40 4.16%
Slightly Important 14 11.76% 24 6.86% 29 5.88% 67 6.96%
Neutral 14 11.76% 60 17.14% 98 19.88% 172 17.88%
Moderately Important 40 33.61% 90 25.71% 143 29.01% 273 28.38%
Very important 25 21.01% 102 29.14% 113 22.92% 240 24.95%
Extremely important 21 17.65% 43 12.29% 71 14.40% 135 14.03%
Total 119 100.00% 350 100.00% 493 100.00% 962 100.00%
Want the experience of a farm visit
9 7.56% 24 6.86% 34 6.90% 67 6.96% Not at all important
Low importance 15 12.61% 22 6.29% 36 7.30% 73 7.59%
Slightly Important 6 5.04% 32 9.14% 36 7.30% 74 7.69%
Neutral 23 19.33% 80 22.86% 125 25.35% 228 23.70%
Moderately Important 29 24.37% 78 22.29% 121 24.54% 228 23.70%
Very important 17 14.29% 88 25.14% 90 18.26% 195 20.27%
Extremely important 20 16.81% 26 7.43% 51 10.34% 97 10.08%
Total 119 100.00% 350 100.00% 493 100.00% 962 100.00%
Note: N = Frequency, % = Percent

64
Characteristics of Survey Respondents
As Figure 10 shows, the majority of individuals from all three states (69 percent) lived in
suburban type areas. The least number of participants, only 11 percent, lived in urban areas in
the Mid-Atlantic region.
Interestingly, over 26 percent of these individuals have been living in their current
locations for more than 21 years, and a majority have been living in their respective areas for
over six years, with more details shown in Table 30 below.
Table 20. Number of Years Living at Current Location
Years Living
State
ALL Delaware New Jersey Pennsylvania
N % N % N % N %
Less than 1 year 8 6.61% 22 6.01% 37 7.23% 67 6.71%
1 to 3 years 20 16.53% 53 14.48% 78 15.23% 151 15.12%
4 to 5 years 15 12.40% 48 13.11% 53 10.35% 116 11.61%
6 to 10 years 30 24.79% 69 18.85% 97 18.95% 196 19.62%
11 to 20 years 26 21.49% 78 21.31% 105 20.51% 209 20.92%
More than 21 years 22 18.18% 96 26.23% 142 27.73% 260 26.03%
Total 121 100.00% 366 100.00% 512 100.00% 999 100.00%
Note: N = Frequency, % = Percent

65
As the data in Figure 11 suggests, these individuals, almost unanimously, believe that
agriculture business will help maintain greenery and open space in their respective states, and
would support it.
When asked if they had a garden at home where they grew produce for consumption, less
than half of the respondents said that they have their own personal gardens. This is shown in
Figure 12.

66
Although most seem to be in favor of agriculture and recognize its benefits, only two thirds
of them (67 percent), overall, were willing to pay higher prices to support farmland preservation
and local farmers, as seen in Figure 13.
The most frequently found family size of all the participants was two members, followed
sequentially by three and four people per household, as shown in Table 21. Interestingly, data
shows that, aside from single person households, as family size increases, the number of
respondents drops significantly. From those family sizes, the survey showed that more than half
(59%) of the households had at least one person under the age of 17 living there (Table 22).

67
Table 21. Distribution of Respondents' Household Size
Family Size
State
ALL Delaware New Jersey Pennsylvania
N % N % N % N %
1 16 13.11% 49 13.35% 73 14.23% 138 13.77%
2 38 31.15% 114 31.06% 187 36.45% 339 33.83%
3 27 22.13% 79 21.53% 109 21.25% 215 21.46%
4 22 18.03% 76 20.71% 83 16.18% 181 18.06%
5 16 13.11% 30 8.17% 43 8.38% 89 8.88%
6 1 0.82% 13 3.54% 11 2.14% 25 2.50%
7 1 0.82% 5 1.36% 5 0.97% 11 1.10%
8 . . . . 1 0.19% 1 0.10%
9 1 0.82% 1 0.27% 1 0.19% 3 0.30%
Total 122 100.00% 367 100.00% 513 100.00% 1002 100.00%
Average 2.98 - 2.97 - 2.81 - 2.89 -
Note: N = Frequency, % = Percent
Table 22. Number of People Under Age 17 in Respondents' Household
Number of
people under
age 17
State
ALL Delaware New Jersey Pennsylvania
N % N % N % N %
1 70 57.85% 216 58.70% 308 60.39% 594 59.46%
2 20 16.53% 79 21.47% 94 18.43% 193 19.32%
3 21 17.36% 53 14.40% 72 14.12% 146 14.61%
4 7 5.79% 14 3.80% 23 4.51% 44 4.40%
5 1 0.83% 5 1.36% 6 1.18% 12 1.20%
6 1 0.83% 1 0.27% 5 0.98% 7 0.70%
8 1 0.83% . . 1 0.20% 2 0.20%
9 . . . . 1 0.20% 1 0.10%
Total 121 100.00% 368 100.00% 510 100.00% 999 100.00%
Average 1.82 - 1.68 - 1.73 - 1.72 -
Note: N = Frequency, % = Percent

68
Approximately 75 percent of the respondents from all the states were female, with
roughly the same distribution in each state individually (Figure 14). As Table 23 shows, more
than 90 percent of the respondents were between the ages of 21 and 65, with slightly over one-
third of participants in the 51-65 age bracket. Both of these statistics gives a good snapshot of an
important target market segment.
Table 23. Survey Respondents’ Age Distribution
Age
State
ALL Delaware New Jersey Pennsylvania
N % N % N % N %
18 to 20 years of age 1 0.82% 7 1.92% 16 3.14% 24 2.41%
21 to 35 years of age 41 33.61% 116 31.78% 135 26.52% 292 29.32%
36 to 50 years of age 29 23.77% 111 30.41% 149 29.27% 289 29.02%
51 to 65 years of age 43 35.25% 101 27.67% 174 34.18% 318 31.93%
Over 65 years of age 8 6.56% 30 8.22% 35 6.88% 73 7.33%
Total 122 100.00% 365 100.00% 509 100.00% 996 100.00%
Note: N = Frequency, % = Percent
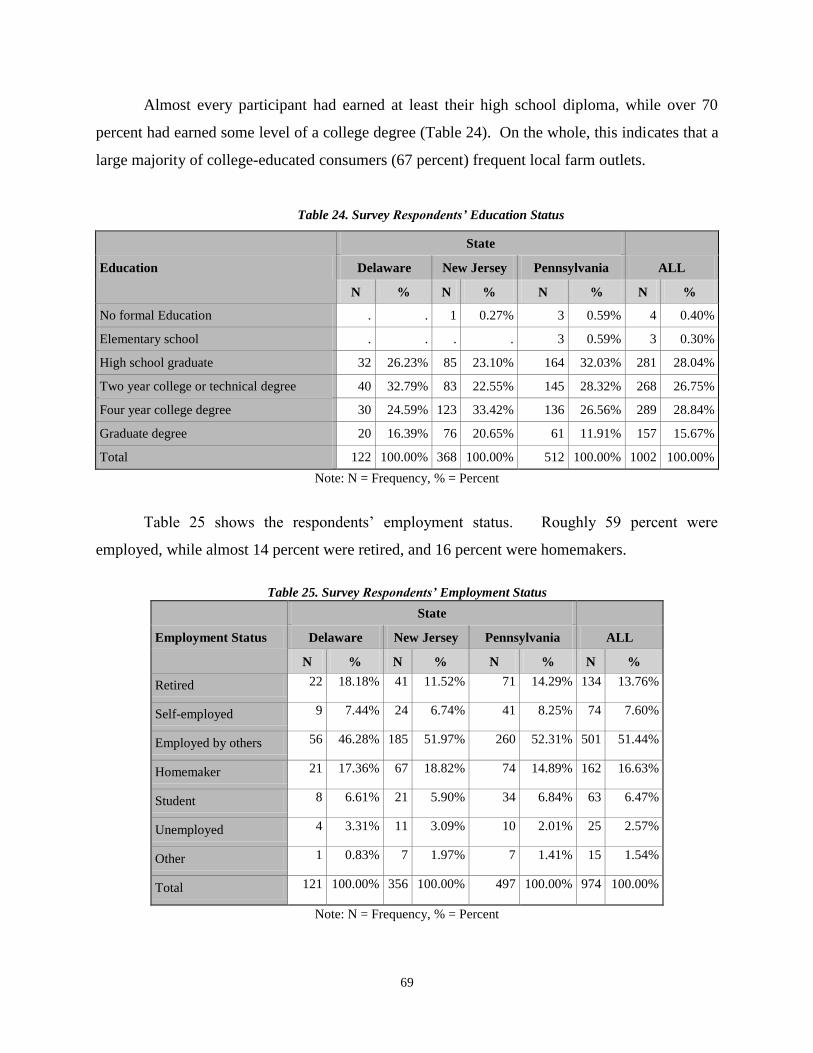
69
Almost every participant had earned at least their high school diploma, while over 70
percent had earned some level of a college degree (Table 24). On the whole, this indicates that a
large majority of college-educated consumers (67 percent) frequent local farm outlets.
Table 24. Survey Respondents’ Education Status
Education
State
ALL Delaware New Jersey Pennsylvania
N % N % N % N %
No formal Education . . 1 0.27% 3 0.59% 4 0.40%
Elementary school . . . . 3 0.59% 3 0.30%
High school graduate 32 26.23% 85 23.10% 164 32.03% 281 28.04%
Two year college or technical degree 40 32.79% 83 22.55% 145 28.32% 268 26.75%
Four year college degree 30 24.59% 123 33.42% 136 26.56% 289 28.84%
Graduate degree 20 16.39% 76 20.65% 61 11.91% 157 15.67%
Total 122 100.00% 368 100.00% 512 100.00% 1002 100.00%
Note: N = Frequency, % = Percent
Table 25 shows the respondents’ employment status. Roughly 59 percent were
employed, while almost 14 percent were retired, and 16 percent were homemakers.
Table 25. Survey Respondents’ Employment Status
Employment Status
State
ALL Delaware New Jersey Pennsylvania
N % N % N % N %
Retired 22 18.18% 41 11.52% 71 14.29% 134 13.76%
Self-employed 9 7.44% 24 6.74% 41 8.25% 74 7.60%
Employed by others 56 46.28% 185 51.97% 260 52.31% 501 51.44%
Homemaker 21 17.36% 67 18.82% 74 14.89% 162 16.63%
Student 8 6.61% 21 5.90% 34 6.84% 63 6.47%
Unemployed 4 3.31% 11 3.09% 10 2.01% 25 2.57%
Other 1 0.83% 7 1.97% 7 1.41% 15 1.54%
Total 121 100.00% 356 100.00% 497 100.00% 974 100.00%
Note: N = Frequency, % = Percent

70
More than 84 percent of respondents were of the White/Anglo ethnicity, by far the
dominant ethnic group, while almost 7 percent were African American, and less than 2 percent
were Hispanic or Latino, further detailed in Table 26. New Jersey interestingly shows a most
diverse ethnic population among the three states by the numbers reported.
Table 26. Survey Respondents’ Ethnic Distribution
Ethnicity
State
ALL Delaware New Jersey Pennsylvania
N % N % N % N %
White/Anglo 101 85.59% 307 84.81% 461 91.29% 869 88.22%
African American 11 9.32% 27 7.46% 27 5.35% 65 6.60%
Hispanic or Latino 1 0.85% 9 2.49% 7 1.39% 17 1.73%
American Indian or Alaska Native 2 1.69% 2 0.55% 3 0.59% 7 0.71%
Asian American 1 0.85% 17 4.70% 7 1.39% 25 2.54%
Native Hawaiian other Pacific Islander 2 1.69% . . . . 2 0.20%
Total 118 100.00% 362 100.00% 505 100.00% 985 100.00%
Note: N = Frequency, % = Percent
Except for the lowest income range (under $20,000), the other five income ranges are fairly
evenly distributed, with the majority of respondents (over 50 percent) reporting a household
income of over $60,000 per year, as shown in Table 27. However, the largest distribution of
participants earned an annual income in the $40,000 to $59,999 income bracket.
Table 27. Household Annual Income Distribution
Income
State
ALL Delaware New Jersey Pennsylvania
N % N % N % N %
Less than $20,000 6 4.92% 23 6.30% 56 10.94% 85 8.51%
$20,000 - 39,999 33 27.05% 53 14.52% 104 20.31% 190 19.02%
$40,000 - 59,999 19 15.57% 69 18.90% 130 25.39% 218 21.82%
$60,000 - 79,999 24 19.67% 58 15.89% 105 20.51% 187 18.72%
$80,000 - 99,999 17 13.93% 57 15.62% 59 11.52% 133 13.31%
$100,000 or more 23 18.85% 105 28.77% 58 11.33% 186 18.62%
Total 122 100.00% 365 100.00% 512 100.00% 999 100.00%
Note: N = Frequency, % = Percent

71
CONCLUSION
In the end, survey results demonstrated that direct marketing and agri-tourism outlets
across the Mid-Atlantic region generally appeal to consumers, with a few areas needing
improvement. Many consumers seemed to be satisfied with features of products offered by the
businesses, such as quality, variety, and price. Patrons also made it clear that they were almost
all willing to buy locally grown products from the outlets, which perhaps should become the
markets’ main promotional focus. Moreover, consumers responded that between 2005 and 2010,
they had begun to consume a greater amount and a wider variety of both fruits and vegetables.
This seems to be very much aligned with the overall trend in health-conscious consumers to eat
healthier and to consume no or little processed food products, particularly by reducing meat
consumption and considering organic options. All of these factors are important because they
ensure that consumers will continue to purchase products from the selected outlet types – even
though there was some evidence in the data that higher prices at the direct markets, as opposed to
those generally offered at supermarket type retailers, may pose a competitive barrier.
There are several courses of actions direct marketing or agri-tourism outlet owners can
take to possibly increase their consumer base. For one, farmers could invest in growing crops (in
either greater quantities and/or increased quality) of the fruits and vegetables bought most often,
as stated by the survey, if they do not already. Business owners could also offer the different
“value-added” products, aside from fresh fruits and vegetables, which are often bought by
visitors in their markets. This could potentially attract more consumers to a particular business if
they know that the items they want will be available there. For example, if individuals plan to
attend a hayride at an agri-tourism location during the fall, they may expect apple cider and
baked goods to also be available for purchase at the site during that time. Knowing that these

72
complimentary goods and services would both be offered at the same outlet may encourage
consumers to do business there rather than another location.
Aside from offering products to increase patronization, using different promotion tactics
could also work. Currently, participants responded that they first learned about an event from
sources other than the Internet. With ever increasing growth of using these sites to market
companies and products, many direct marketing or agri-tourism outlets have the potential to
increase knowledge about their businesses and increase the popularity of similar agri-tourism
ventures through the Internet. In particular, blogs and social networking sites would seem to be
the most beneficial and practical. Also, according to the survey, many individuals do not know
about some of the related agri-tourism concepts mentioned. If word and/or information is spread
about these concepts through increased marketing efforts, such as an article, blog post or
brochure advertising ecotourism, perhaps more people would be interested in visiting the
operation sites, and also become repeat customers for the locally-grown produce.
Regarding how produce from direct marketing outlets compared to non-direct marketing
outlet types, survey participants felt that the quality, variety, and prices at the direct marketing
outlets was superior to the others, such as local grocery stores and chain supermarkets. Perhaps
even more importantly, the study revealed that a majority of consumers are willing to pay more
for products from the direct marketing outlets, even if only a small to medium percentage.
However, some individuals made it clear that the proximity and convenience is an important
factor in deciding whether to visit a direct marketing outlet and that visiting is, in fact, not
always convenient for them. The study also showed that consumers generally visit agri-tourism
sites during the fall, summer, and spring, which is logical. This, however, leaves an opportunity
to incorporate and capitalize on agri-tourism activities during the winter in creative new ways,

73
such as offering educational programs and workshops, to boost visitation and sales. Perhaps
offering winter functions and incorporating new agri-tourism events and activities year-round
will incentivize patrons and help attract patrons to particular outlets, regardless of how
convenient it is to visit.
Aside from offering more or better goods and services, owners should also take the
opportunity to improve their outlets by focusing on factors that respondents considered to be
most important when taking a trip to an outlet. For one, better facilities for comfort and
convenience, such as restrooms, picnic tables, easy parking, and easy road/drive way access may
help to draw even more customer traffic. These fairly simple supplements may make a world of
difference to individuals, especially those who travel from far away or who travel under special
circumstances. Additions like shops and markets also may compel individuals to visit, but are
not as feasible to erect if not already established as part of the outlet.
Overall, it seemed that a majority of consumers were pleased with how agri-tourism and
direct marketing outlets were operated and with what they offered at the time. This probably
stems from a rich history of local farms and farm markets in the areas surveyed and their
successes over the years. Research and data provided by this research study may bring about a
useful understanding of consumers’ perceptions, behaviors, and actions concerning their
purchases, decisions to visit, and general preferences, as individual states and as a composite
whole. It may also generate conversation on how to advance businesses in order to benefit
consumers and owners alike in the Mid-Atlantic region, and perhaps may extend to similar
nearby farming states outside of the region studied.

74
References
Agricultural Marketing Service (AMS). “Number of Farmers Markets Continues to Rise in
U.S.”, USDA, Program Announcement, 2008 [online] at:
http://www.ams.usda.gov/AMSv1.0/getfile?dDocName=STELPRDC5072472&acct=frmrdirmkt.
Ballenger, Nicole, and Blaylock, James. Consumer-Driven Agriculture: Changing U.S. Demographics Influence Eating Habits. Amber Waves, April 2003. http://www.ers.usda.gov/Amberwaves/April03/Features/ConsumerDrivenAg.htm
Blisard, Noel, Biing-Hwan Lin, John Cromartie, and Nicole Ballenger. “America’s Changing
Appetite: Food Consumption and Spending to 2020,” FoodReview Vol. 25, Issue 1, ERS-USDA,
May 2002.
Carpio, Carlos E., Michael K. Wohlgenant, and Tullaya Boonsaeng. “The Demand for
Agritourism in the United States.” Journal of Agricultural and Resource Economics 33 (2008):
254 – 269. Web. 9 Feb. 2011.
Gascoigne, William, Martha Sullins and Dawn Thilmany McFadden. “Agritourism in the West:
Exploring the Behavior of Colorado Farm and Ranch Visitors.” Western Economics Forum
(2008) : 12-24. Web. 9 Feb 2011.
Govindasamy, Ramu and Rodolfo M. Nayga, "Determinants of Farmer-to-Consumer Direct
Marketing Visitations by Type of Facility: A Logit Analysis," Agricultural and Resource
Economics Review, 26(1997) pp.31-38.
Govindasamy, Ramu and Rodolfo M. Nayga, "Characteristics of Farmer_To_Consumer Direct
Market Customers: An Overview," Journal of Extension. Electronic Journal, August, 1996a,
34(4).
[online] at: http://joe.org/joe/1996august/rb1.txt.
Govindasamy, Ramu and Rodolfo M. Nayga, "Farmer-to-Consumer Direct Marketing
Operations in New Jersey: Producer Characteristics," Journal of the American Society of Farm
Managers and Rural Appraisers, 1996b, pp. 116-121
Govindasamy, Ramu and Rodolfo M. Nayga, "Farmer to Consumer Direct Marketing:
Advertising Aspects of New Jersey Operations," Acta Horticulturae. 341, 1996c ,pp. 439-443
Govindasamy, Ramu, et al. “Farmers Markets: Consumer Trends, Preferences, and
Characteristics”. New Jersey Agricultural Experiment Station, 1998.
Govindasamy, Ramu, R.M. Nayga and D.M. Thatch "Farmer-to-consumer Direct-Marketing
Operations: Issues and Analysis". Rutgers Cooperative Extension Fact Sheet, FS800, 1995.
Grow New York’s Enterprise Program (GNYEP). New York State Department of Agriculture &
Markets. http://www.agmkt.state.ny.us/GNYRFP.html

75
Henderson, P.L. and H.R. Linstrom, “Farmer to Consumer Direct Marketing: Selected States,
1979-80,” Statistical Bulletin No. 681, ERS-USDA, February 1982.
Industry Development & Potential. Agritourism. Purdue Tourism Hospitality Research Center.
Purdue University. 15 March 2011.
Linstrom, H.R.,” Farmer to Consumer Marketing,” ESCS-01, Economics, Statistics, and
Cooperative Service, U.S. Department of Agriculture, February 1978.
Nayga Jr., R.M., R. Govindasamy, T. Wall, and D. Thatch, “Characteristics of Farmer-to-
Consumer Direct Market Customers in New Jersey,” New Jersey Agricultural Experiment
Station Publication No. P-02136-3-95, June 1995.
National Survey on Recreation and the Environment (NSRE):2000-2002. The Interagency National Survey Consortium, Coordinated by the USDA Forest Service, Recreation, Wilderness, and Demographics Trends Research Group, Athens, GA and Human Dimensions Research Laboratory, University of Tennessee, Knoxville, TN.
New York Department of Agriculture & Markets, Annual Report, New York, 2007 p.4.
Ryan, Susan, Kristy DeBord, and Kristin McClellan. “Agritourism in Pennsylvania: An
Industry Assessment.” The Center for Rural Pennsylvania. California University of
Pennsylvania. March 2006. http://www.ruralpa.org/agritourism2006.pdf
Tracy, M.H., P.S.Dhillon, and M.C. Varner, “Economic Comparison of Direct Marketing
Alternatives for Fresh Vegetables in New Jersey,” New Jersey Agricultural Experiment Station
P-02551-1-82, Rutgers University, March 1982.
United States Department of Agriculture. 2007 Census of Agriculture, State Profile for
Delaware. USDA, 4 Feb. 2009. Web. 5 January 2011.
United States Department of Agriculture. 2007 Census of Agriculture, State Profile for New
Jersey. USDA, 4 Feb. 2009. Web. 5 January 2011.
United States Department of Agriculture. 2007 Census of Agriculture, State Profile for
Pennsylvania. USDA, 4 Feb. 2009. Web. 5 January 2011.
Wilson, Joshua., Thilmany, Dawn., and Sullins, Martha. Agritourism: A Potential Economic Driver in the Rural West. Economic Development Report. Cooperative Extension. Colorado State University. Department of Agricultural and Resource Economics. February 2006.

76
Appendix-1
Demographic Characteristics of Consumers Who Participated in Hayride
Event of an Agritourism Activity: A Predictive Model Approach
ABSTRACT
An internet survey pertaining to direct marketing and agritourism was conducted to document
characteristics of consumers who buy at farmer-to-consumer direct market outlets and/or visit
agritourism operations from Mid-Atlantic States during June and July 2010. A facet of the study
analyzed the influence of demographic characteristics on the likelihood of a consumer
participating in hay rides event during an agritourism visit. A total of 1,134 participants from
Delaware, New Jersey, and Pennsylvania completed the survey. One of the survey questions
asked respondents to indicate whether they participated in hay ride events during agritourism visits.
Based on responses, a logit model was developed to predict demographic characteristics of
respondents who participated in hay rides. As survey results indicated, approximately 67% of
respondents participated in hay rides during agritourism farm visits. According to model results,
participants are more likely to participate in hay rides if they reside in suburban areas, are male,
between 21 and 35 years of age and between 36 and 50 years age, completed a two year college
degree, and have an annual household income between $40,000 and $59,999. Consumers who
are less likely to participate in hay rides can be described as living in urban areas, have lived at
their current residence for more than 20 years, were under age 20 and who completed a graduate
degree.
Keywords: Mid-Atlantic States, Agritourism, Hayrides, Logit Model
Acknowledgements: This project was supported by The Federal-State Marketing
Improvement Program (FSMIP), USDA, Grant # 2009-51181-06035.

77
INTRODUCTION
In the current agricultural system, small and medium farmers with limited land and capital
resources may be unable to compete in national commodity markets (Gale, 1997). Direct
marketing and agritourism, including pick-your-own farm, community farmers’ markets,
community support agriculture (CSA), agricultural fairs/festivals, corn maize, on-farm markets,
and wine tastings, are used by small and medium sized farms to increase farm income. Growth
of direct marketing has been spurred by the fact that producers capture a greater portion of the
marketing margin by selling directly to the consumer, and consumers understand that they can
get fresh, high quality produce for a better price compared to supermarkets (Tracy et al., 1982).
These economic opportunities can motivate farmers to identify consumer trends, desires,
shopping habits, and value-added product purchasing demands and focus on efforts that provide
profitable on-farm agricultural activities.
In 2007, 23,350 farms offered on-farm recreational activities and generated income of
$566 million in the United States (Thessen, 2010). In 2005, $57.53 million in income was
generated in New Jersey from agritourism (Schilling et al., 2006). Govindasamy et al. (1998)
found that New Jersey farm operators who engaged in direct marketing and agritourism were
likely to attain higher income levels than farmers who did not undertake these activities. A
Pennsylvania agritourism study also found that 43% of farmers were unable to support their
family and/or farm without the income they made from agritourism (Ryan et al., 2006
In addition to the potential to generate revenue by bringing visitors to the farm, direct
marketing and agritourism provide farmers with other benefits. Agritourism and direct
marketing can create positive interactions between farmers and consumer’s, contributing to a

78
“culture of understanding” that is necessary for both to coexist (Shilling, 2006). The
diversification of farm activities also contributes to the well-being of local people in rural areas
and expands recreational opportunities (Henderson and Linstrom, 1982; Linstrom, 1978;
Govindasamy et al., 1999). In addition, they also promote, income, and sustainability of rural
communities (Hall and Mitchell, 2003; Kneafsey, 2000), development of industrial and service
activities. (Feher, 2007).
With the growing number of consumers interested in supporting local farmers, as is the
case in New Jersey (Govindasamy et al., 2002), Mid-Atlantic consumers interested in sourcing
fresh agricultural products directly from the farmer can also choose to patronize other unique
farm based activities, which provide agricultural knowledge, pleasure, and fun (Schilling, 2006).
Past agritourism studies have focused on outcomes and benefits that encourage farmers to
start agritourism and other on-farm activities (Polovitz-Nickerson et al., 2001; McGehee and
Kim, 2004), whereas, other studies focused on demand for on-farm agritourism activities such as
pick-your-own (Govindasamy et al., 1997), farm visits, and on-farm recreational trips (Carpio et
al., 2008). In order to promote direct marketing and agritourism as a method for increasing on-
farm income, it is necessary to explore consumer interests, needs, and preferences pertaining to
these activities and opportunities. Agritourism opportunities in the Mid-Atlantic have not yet
been fully realized. Though a 2005 survey revealed that 63% of New Jersey farms offered hay
rides (Schilling, 2006), it is necessary to identify the consumers who are more likely to participate
in hay rides, one agritourism event.

79
DATA
A15-min Internet survey was conducted 22 to 29 June, 2010, to gather information from
consumers who reported participating in direct marketing and agritourism activities in the United
States Mid-Atlantic region. A total of 1134 participants who resided in Delaware (133), New
Jersey (424) and Pennsylvania (577) completed the survey. Participants were selected at random
from a panel managed by a survey research company (Sampling International, LLC, Shelton,
CT). Potential participants were screened and asked to participate if they were: 1) age 18 and
older; 2) primary food shopper for the household; and 3) had previously attended agritourism and
direct marketing events or activities. Of the questions asked, participants indicated whether they
participated in hay rides, an agritourism activity, and based on this question, a logit model was
developed to predict participation in this activity.
MODEL
Logistic regression analysis is an econometric modeling method and often used to examine the
relationship between binary responses and a set of dependent variables or covariates. For binary
response models, the response variable (Y) can take one of two possible values as 1 and 0 (for
example, 1 if respondent participated in agritourism activity of hay rides; 0=otherwise). Suppose
x is a vector of dependent variables denotes that the respondent’s demographic attributes of π=
Pr(Y=1/x) is the response probability to be modeled and the logistic model can be expressed as:
(1)
The notation indicates the logistic cumulative distribution function and can be
defined as:
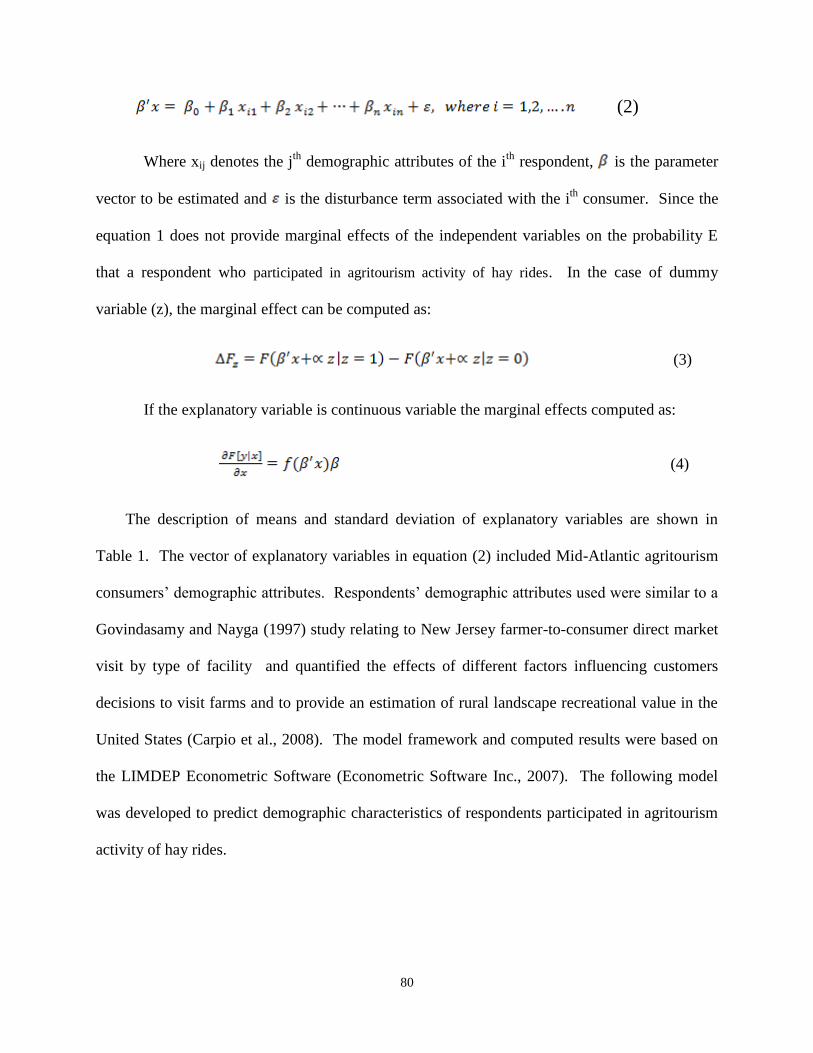
80
(2)
Where xij denotes the jth
demographic attributes of the ith
respondent, is the parameter
vector to be estimated and is the disturbance term associated with the ith
consumer. Since the
equation 1 does not provide marginal effects of the independent variables on the probability E
that a respondent who participated in agritourism activity of hay rides. In the case of dummy
variable (z), the marginal effect can be computed as:
(3)
If the explanatory variable is continuous variable the marginal effects computed as:
(4)
The description of means and standard deviation of explanatory variables are shown in
Table 1. The vector of explanatory variables in equation (2) included Mid-Atlantic agritourism
consumers’ demographic attributes. Respondents’ demographic attributes used were similar to a
Govindasamy and Nayga (1997) study relating to New Jersey farmer-to-consumer direct market
visit by type of facility and quantified the effects of different factors influencing customers
decisions to visit farms and to provide an estimation of rural landscape recreational value in the
United States (Carpio et al., 2008). The model framework and computed results were based on
the LIMDEP Econometric Software (Econometric Software Inc., 2007). The following model
was developed to predict demographic characteristics of respondents participated in agritourism
activity of hay rides.

81
HAY_RIDES = 0 +1 URBAN +2 SUBURBAN +3 LIVE6TO10 +4 LIVE11TO20
+5 LIVE>20 +6 HSIZE +7 GENDER +8 AGE<20 +9 AGE21TO35
+10 AGE36TO50 +11 2YEAR_DEG +12 4YEAR_DEG
+13 GRAD_DEG +14 INC<$20K +15 INC$20K_40k +16 INC$40K_60k
RESULTS
Data Description
Demographic attributes were used as explanatory variables to construct the logit model.
Dependent and independent variables used in the logit model to predict which consumers are
willing to participate in hay ride event are presented in Table 1. Approximately 67% of
agritourism survey respondents participated in hay rides (HAY_RIDES) during their agritourism
farm visit. Of these consumers, 11% resided in urban settings (URBAN) while 69% lived in
suburban area (SUBURBAN). Participants were asked to indicate the number of years they
lived at their current residence. Twenty percent responded that they lived at their current
residence between six and 10 years (LIVE6TO10), 21% of them lived at their residence between
11 and 20 years (LIVE11TO20), and 26% had lived more than 20 years (LIVE>20) at their
current location.
Table 1: Descriptive statistics of dependent and independent variables
Variable Variable Description
Mean
Units/
%
SD
Units/
%
Number
of Cases
HAY_RIDES
(dependent
variable)
1 if respondent participated in hay rides;
0=otherwise 67% 47% 1134
URBAN 1 if respondent resided in an urban area;
0=otherwise 11% 31% 1003
SUBURBAN 1 if respondent resided in a suburban area;
0=otherwise 69% 46% 1003

82
LIVE6TO10 1 if respondent lived in their current
residence for six to 10 years; 0=otherwise 20% 40% 999
LIVE11TO20 1 if respondent live in their current
residence for 11 to 20 years; 0=otherwise 21% 41% 999
LIVE>20 1 if respondent lived in their current
location for more than 10 years;
0=otherwise
26% 44% 999
HSIZE Household Size 2.89 1.40 1002
GENDER 1 if respondent was male; 0=otherwise 25% 43% 971
AGE<20 1 if respondent was less than 20 years old;
0=otherwise 2% 15% 996
AGE21TO35 1 if respondent was between age 21 and 35
years; 0=otherwise 29% 46% 996
AGE36TO50 1 if respondent was between age 36 and 50
years; 0=otherwise 29% 45% 996
2YEAR_DEG 1 if respondent completed a two year
college or technical degree; 0=otherwise 27% 44% 1002
4YEAR_DEG 1 if respondent completed a four year
college degree; 0=otherwise 29% 45% 1002
GRAD_DEG 1 if respondent completed a graduate
degree; 0=otherwise 16% 36% 1002
INC<$20K 1 if respondent’s income was less than
$20,000;0=otherwise 9% 28% 999
INC$20K_40k 1 if respondent’s income was between
$20,000 and $39,999;0=otherwise 19% 39% 999
INC$40K_60k 1 if respondent’s income was between
$40,000 and $59,999;0=otherwise 22% 41% 999
Participants were asked to respond to questions pertaining to their demographic status. Data
revealed that 25% of participants were male (MALE) and that the average household size was
2.89 persons (HSIZE). In terms of respondents’ age distribution, 2% of were less than 20 years
of age (AGE<20) and 29% were between 21 and 35 years (AGE21TO35) and between 36 and 50
years of age (AGE36TO50), respectively. In the case of respondents’ education, 27% of
completed a two year college degree (2YEAR_DEG), 29% had a four year college degree
(4YEAR_DEG) and 16% accomplished graduate education (GRAD_DEG). Lastly, regarding
respondents’ annual household income, only 9% had an annual income of less than $20,000
(INC<$20K), 19% of had an annual income between $20,000 and $39,999 (INC$20K_40K), and

83
22% of had an annual income between $40,000 and $59,999 (INC$40K_60K). No a priori sign
expectations were made on the coefficients of these demographic variables while conducting the
logit model.
Logit Model Results
Logit model analysis results (Table 2 and 3) and predict the likelihood that a respondent
participation in agritourism activity of hay rides. Of the 1134 observations that were used in this
model, 760 (67%) respondents participated in hay ride events, while 374 (33%) did not. The
goodness of fit for this model, shown by the McFadden’s R2, was 0.04 and the chi-squared value
was reported as 56.07. The overall model was significant at 0.00 level and 67.5% of survey
participants were correctly classified as having participated in hay rides. The predictive accuracy
of the logit model is shown in Table 2. Based on the percentage change in marginal effects for
each significant variable the model results analyzed are shown in Table 3. In the logit model, all
the explanatory variables are defined as binary dummy variables. A total of 17 explanatory
variables were used in the logit model, of which, six variables were positively significant and
four were negatively significant. A positive sign indicates that the variable was estimated to
have a positive coefficient with a positive marginal effect, and hence had a positive impact on
the dependent variable. A negative sign indicates that the variable was estimated to have a
negative coefficient with a negative marginal effect, and hence had a negative impact on the
dependent variable. The star symbol represents the significance level of the variable at 1%, 5%
and 10% level, which is interpreted at the bottom of the Table 3.

84
Table 2: Predictive accuracy of logit model
Actual
Value
Predicted Correct
Total
0 1
0 37 (3.3%) 336 (29.6%) 373 (32.9%)
1 31 (2.7%) 730 (64.4%) 761 (67.1%)
Total 68 (6%) 1066 (94%) 1134 (100%)
Number of correct predictions: 767
Percentage of correct predictions: 67.64%
McFadden R2: 0.04;
Chi squared: 56.07;
Degrees of freedom: 16
P-value= 0.38 with degrees of freedom = 8;
Overall Model Significance: 0.00.
Table 3: Logit model results
Variable Coefficient
Standard
Error t-ratio Probabilities
Change in
Marginal
Effects
Constant 0.4341 0.1071 4.051 0.00 0.0948
URBAN** -0.2256 0.0997 -2.262 0.02 -0.0493
SUBURBAN** 0.2139 0.0994 2.151 0.03 0.0467
LIVE6TO10 0.1674 0.1266 1.323 0.19 0.0366
LIVE11TO20 0.1554 0.1237 1.257 0.21 0.0339
LIVE>20*** -0.3224 0.1154 -2.793 0.01 -0.0704
HSIZE 0.0009 0.0014 0.599 0.55 0.0002
GENDER** 0.0008 0.0004 2.214 0.03 0.0002
AGE<20*** -0.5520 0.2173 -2.54 0.01 -0.1205
AGE21TO35** 0.3013 0.1435 2.1 0.04 0.0658
AGE36TO50* 0.2509 0.1433 1.751 0.08 0.0548
2YEAR_DEG*** 0.4037 0.1189 3.397 0.00 0.0882
4YEAR_DEG -0.0746 0.1128 -0.661 0.51 -0.0163
GRAD_DEG*** -0.3228 0.1270 -2.542 0.01 -0.0705
INC<$20K -0.1492 0.1643 -0.908 0.36 -0.0326
INC$20K_40k -0.1283 0.1363 -0.941 0.35 -0.0280
INC$40K_60k** 0.2799 0.1364 2.052 0.04 0.0611
*** Significant at 1%; ** Significant at 5%; * Significant at 10%

85
As can be seen in Table 3, participants are more likely to participate in hay rides if they
reside in suburban areas (SUBURBAN), are male (GENDER), between 21 and 35 years of age
(AGE21TO35) and between 36 and 50 years age (AGE36TO50), completed a two year college
degree (2YEAR_DEG), and have an annual household income between $40,000 and $59,999
(INC$40K_60K). Consumers who are less likely to participate in hay rides can be described as
living in urban areas (URBAN), have lived at their current residence for more than 20 years
(LIVE>20), were under age 20 (AGE<20) and who completed a graduate degree.
Those who reside in suburban (SUBURBAN) areas were 5% more likely to participate in
hay rides event than those who resided in rural areas. Except for some regions in New Jersey
and Pennsylvania, a majority of Mid-Atlantic consumers reside in suburban areas. With a
smaller number of entertainment options available in suburban areas compared to urban regions,
consumers residing in these areas may be more likely to participate in agritourism activities.
With respect to gender (GENDER), males are 0.02% more likely to participate in hay rides than
females. Though the GENDER variable is significant at 5% level, the percentage of impact on
dependent variable is not sizable. Individuals who were between 21 and 35 years of age
(AGE21TO35) were 7% more likely to participate in hay rides than those who were 51 years age
or older. Consumers between 36 and 50 years of age (AGE36TO50) were 6% more likely to
participate in hay rides than those 51 years age and older.
Additionally, individuals who completed a two year degree (2YEAR_DEG) were 9%
more likely to participate in hay rides than those who attained some level of high school
education and those who graduated. Finally, those with an annual household income between
$40,000 and $59,999 (INC$40K_60K) 6% more likely to participate in hay rides event compared
to those whose annual household incomes are over $60,000. This indicates that the low income
86
people are more attracted by low cost entertainment and recreational activities. Those who
reside in urban areas (URBAN) are 5% less likely to participate in hay rides compared to those
who resided in rural areas. This might be due to the greater availability of recreational choices
available in urban areas compared to rural areas. Carlos et al. (2008) obtained the same results
when analyzing the demand for agritourism in the United States.
Lastly, those who lived in their current residence for more than 20 years (LIVE>20) were
7% less likely to participate in hay rides than those who lived in their residence for less than six
years. Those who were younger than 20 years (AGE<20) were 12% less likely to participate in
hay rides than those aged 51 years and older. Those who completed a graduate degree were also
7% less likely to participate in hay rides than those who attained some level of high school
education and those who graduated.
CONCLUSIONS
This paper analyses the influence of demographic characteristics on the likelihood of consumer
participation in hay rides. Among respondents, 67% participated in hay rides during their
agritourism farm visit. As model results indicate participants are more likely to participate in
hay rides if they reside in suburban areas, are male, between 21 and 35 years of age and between
36 and 50 years age, completed a two year college degree, and have an annual household income
between $40,000 and $59,999. Consumers who are less likely to participate in hay rides can be
described as living in urban areas, have lived at their current residence for more than 20 years,
were under age 20 and who completed a graduate degree. . Survey results errand the resulting
logit model should provide valuable information for those developing marketing strategies to
increase agritourism participation and future interest in support of local agriculture. However,

87
some mechanism must be developed to educate the public about agritourism, and the importance
of supporting local agriculture.
The e logistic regression analyses findings were consistent with past agritourism marketing
research. According to these data, a majority of agritourism visitors in the Mid-Atlantic States
had participated in hay rides. Due to higher land values and higher population density,
agritourism farmers in the Mid-Atlantic States may be able to realistically increase the portion of
their land devoted to agritourism events as a method for increasing revenue. Agritourism
farmers should also consider selling value added products to further maximize revenue and
compensate for the amount of land devoted to agritourism use as opposed to using the land for
only agritourism. To encourage farmers to consider such opportunities, they should be educated
about the usefulness of direct marketing and agritourism and the resulting benefits. Additionally,
to encourage stakeholder participation, consumers should be informed about applicable benefits
and how direct marketing and agritourism can be of value to their community.

88
REFERENCES
Carpio, C.E., Wohlgenant, M.K and Boonsaeng, T. 2008. The Demand for Agritourism in the
United States. Journal of Agricultural and Resource Economics 33(2):254-269.
Econometric Software Inc. 2007. LIMDEP Version 9.0, Plainview, New York, 11803.
Feher, I. 2007. Direct marketing practice in Hungarian agriculture, Agric. Econ. – Czech, 53,
2007 (5): 230–234.
Henderson, P.L. and H.R. Linstrom.1982. Farmer to Consumer Direct Marketing: Selected
States, 1979-80. Statistical Bulletin No. 681, ERS-USDA, February.
Gale, F. 1997. “Direct Farm Marketing as a Rural Development Tool.” USDA/ERS, Rural
Perspectives, February 1, 1997. http://www.ers.usda.gov/catalog/OneProductAtATime.asp
?PDT=2&PID=798.
Govindasamy, R., J. Italia, and Adelaja, A. 2002. “Farmers’ Markets: Consumer Trends,
Preferences, and Characteristics.” Journal of Extension (online), 40.
Govindasamy, R., F., Hossain and A. Adelaja. 1999. “Income of Farmers Who Use Direct
Marketing”, Agricultural and Resource Economics Review. 28: 76-83.
Govindasamy, R. and R. M. Nayga. 1997. Determinants of Farmer-to-Consumer Direct Market
Visits by Type of Facility: A Logit Analysis. Agricultural and Resource Economics
Review, 26 (1):31-38.
Hall, D., Roberts, L., Mitchell, M. (Eds.), 2003. New Directions in Rural Tourism. Ashgate,
Aldershot.
Henderson, P.L. and H.R. Linstrom. 1982. “Farmer to Consumer Direct Marketing: Selected
States, 1979-80,” Statistical Bulletin No. 681, ERS-USDA, February.
Kneafsey, M. 2000. Tourism, place identities and social relations in the European rural
periphery. European Urban and Regional Studies 7 (1): 35-50.
Linstrom, H.R. 1978. Farmer to Consumer Marketing. Economics, Statistics, and Cooperative
Service, U.S. Department of Agriculture, ESCS-01, February.
McGehee, N. G., and K. Kim. 2004. Motivation for Agri-Tourism Entrepreneurship. Journal of
Travel Research, 43(2): 161-170.
Polovitz-Nickerson, N., R J. Black, and S. F. McCool. 2001. Agritourism: Motivations Behind
Farm/Ranch Business Diversification. Journal of Travel Research, 40(1):19-26.

89
Ryan,S., DeBord, K. and McClellan, K. 2006. Agritourism in Pennsylvania: An Industry
Assessment,California University of Pennsylvania March.
<http://www.rural.palegislature.us/agritourism2006.pdf > Accessed on 3/2/2011.
Schilling, B., Marxen, L.J. Heinrich, H.H., and Brooks, F.J.A. 2006. The Opportunity for
Agritourism Development in New Jersey, A Report Prepared for the New Jersey
Department of Agriculture by Food Policy Institute, Publication No. RR-0706-010.
http://www.nj.gov/agriculture/pdf/ATReport.pdf
Schilling, B., Sullivan, K. P. and Marxen, L.J. 2006. The Economic Impact of Agritourism in
New Jersey: A 2006 Assessment, New Jersey Agricultural Experiment Station, September
17. <http://www.foodpolicyinstitute.org/docs/pubs/Econ_Impact_AT_NJ_2006.pdf > >
Accessed on 3/2/2011.
Thessen, G. 2010. Measuring the Economic Impact of Agritourism on Farms, USDA National
Agricultural Statistics Service (Online: on 4/28/2011).
http://www.agmrc.org/media/cms/Agritourism_Thessen_A812A9AE31310.pdf.
Tracy, M.H., P.S.Dhillon, and M.C. Varner, “Economic Comparison of Direct Marketing
Alternatives for Fresh Vegetables in New Jersey,” New Jersey Agricultural Experiment
Station P-02551-1-82, Rutgers University, March 1982.

90
Appendix-2
Uncovering success attributes for the direct farmers markets and agri-tourism in the Mid-
Atlantic region of the United States: A Factor Analysis
Abstract
Direct farmers’ markets and agri-tourism operations continue to play significant roles in many
rural economies; however, capacity under- utilization plagues most of them, threatening
viability. Results from factor, cluster and regression analyses show that bundling of farmers’
markets activities/site attributes will spur diverse and steady patronage beyond the traditional
fresh produce and value added products. Additionally, segmentation/customer profiling can be
used by farmers’ markets / agri-tourism operators to market position better in a competitive
environment. The regression results show that a number of socio economic variables are related
with the patronage experience.
Keywords: Farmers’ markets, Agri -tourism, Factor analysis, Product bundling, Consumer
profiling, Market segmentation

91
Introduction
As federal farm support programs become increasingly untenable, farmers are being reminded
and encouraged to innovatively address farming risks and rely less on government support. Some
of the innovative approaches cutting across many of the farming communities are direct (farmer-
consumer) market alternatives. These markets are fast growing in popularity as they confer more
returns to producers while offering consumers a wide array of farm products at affordable prices.
These alternative marketing outlets are known to many as direct agricultural markets. Other
terms used to describe the markets are pick-your-own (PYO), on farm markets, road side stands
and community supported agriculture (CSA). Among many of their advantages are: buffering
farm incomes, providing marketing avenues and addressing price volatilities beyond what futures
markets or any other vestiges of government support programs can do. Major challenges
confronting many of farmer-to-consumer market operations are capacity underutilization and a
narrow consumer base needing expansion to attract a more diverse customer base beyond fresh
produce buyers. It is very clear that farmer-to-consumer market operators may need additional
activities to attract a clientele that may not necessary be produce buyers.
While these market alternatives provide establishments to sell locally grown produce
directly to consumers, some researchers view these alternatives as a practical rural development
strategy. Various farmers’ market economic impact studies demonstrate that farmers’ markets
are good for local economies, farmers, and consumers (Conner, et al 2010; Che, et al, 2005; Das
and Rainey, 2010). These markets provide growers with extra income, since many farmers and
local citizens must work full-time either off the farm or outside the local area to support their
families. Farmers’ markets, by selling directly to consumers, also facilitate higher producer
prices by displacing brokers/middlemen. The benefits do extend to consumers as well, in terms

92
of providing a broader choice of fresh produce and value added products (Bond, et al 2006).
Communities, in which these businesses operate, gain from more money spent in the local
economy, creating spending, re-spending, and higher multiplier effects. Yet, still retail spending
by consumers promotes business development and expansion locally. Additionally, in the recent
past, USDA and other government agencies are recognizing farmers-to-consumer markets a
better vehicle to promote public good of affordable healthy living by increasing consumption of
fruits and vegetables.
Notwithstanding many benefits associated with farmers’ markets/agri-tourism, issues of
capacity utilization require strategic thinking on part of the operators; what is it that they can do
to attract diverse and steady patronage to their businesses. We consider this a void to which our
study seeks to contribute by extending the discourse. The broad objective of this study is
uncovering some of the success strategies farmers’ markets/agri-tourism operators would initiate
to sustain and expand capacity utilization. Specifically, (i) identify and estimate the relative
importance of the factors underlying success of a direct farmers market/agri-tourism site; (ii)
identify distinct consumer segments based on important drivers/forces for visiting direct
market/agri-tourism sites; (iii) develop a profile of these distinct consumer groups; and (iv)
explore the relationship between consumers’ socio-economic characteristics and patronage of
direct farmers markets/agri-tourism sites.
The information generated by this study will be useful not only to farmers but also to
policy makers in improving effectiveness of farmer-to-consumer market channels as well as agri-
tourism activities; it may also contribute toward development of efficient and effective business
strategies. A unique contribution of this study is a better understanding of what underlies
successful operations of farmers’ market/agri-tourism sites.
93
The remainder of this article proceeds with the following section on literature review
followed by a section on data and methods, then a section on results will follow. A final section
will offer concluding thoughts.
Literature
Majority of small to medium scale farmers more often find farmers’ markets a predictable and
less costly outlet absorbing a larger proportion of their production. This market segment has been
growing steadily over time. Hand et al, (2010) findings demonstrate that direct market sales
accounts for a higher percentage of smaller farms sales than for larger farms. According to
USDA’s Agricultural Marketing Service, the number of farmers’ markets rose from 2,756 in
1998 to 5,274 in 2009, over a 90% growth. Direct (farmer)-to-consumer marketing amounted to
$1.2 billion in current dollar sales in 2007, according to the 2007 Census of Agriculture,
compared with $551 million in 1997.
While serving as sure market outlet for small to medium scale farmers, farmers markets
have been hailed as a development strategy. Hughes et al., (2008) view farmers’ markets as a
means to enhance retention of local dollars. Along similar lines, Brown, (2003) puts a
psychological spin to the functionality of these markets in the sense that consumers feel good by
supporting small scale local agriculture, thereby helping to retain dollars in the local economy.
Other studies have focused more deeply on the much greater untapped potential of farmers’
markets/agri-tourism (Jensen et al. 2005; Jolly and Reynolds, 2005). The potential is premised
on the fact that customers are willing to pay more for products from farmers markets and is an
industry that can be operated all year round. The Tennessee study on one hand, shows that
visitors to farmers market or agri-tourism site spend an average of $15.00 with the Californian
agri-tourism study revealing that about 67% of the respondents who purchased products at farm-
94
related tourism sites indicated a willingness to pay a price equal to or more than what they would
pay for the same or similar products in conventional outlets.
Direct marketing and agri-tourism ventures are not only economically advantageous, but
also provide social benefits for business owners and consumers (Tracy et al., 1982). Indeed, a
study by Das and Rainey (2010) strongly collaborates this view that farmers’ markets and agri-
tourism ventures as complimentary in opening up new, profitable markets for farm products and
services, as well as in providing travel experience for part of the public. On the other hand,
Veeck et al., (2006) finds that Agri-tourism gives people opportunity to better understand the
hard work and skill that go into producing the food and fibre we all enjoy.
While profitability and market access are significant functions of farmers/agri-tourism
businesses need for strategy in attracting continuous flow customers for sustainability is
necessary. Tracy et al., (1982) work demonstrates that patronizing farmers markets and agri-
tourism sites is driven by attributes such as superior quality and freshness of produce coming
directly from farms compared to those offered by wholesale and retail markets. Whereas, other
studies overwhelmingly see farmers markets as a better mechanism for rural revitalization and
development (Henderson and Linstrom, 1982; Linstrom, 1978; Govindasamy, 1996). The studies
point out a striking of relationships/community building through direct interaction with
consumers; the relationships are seen as a critical success factor in a business where customer
satisfaction is highly valued. The interaction enhances overall quality of life, more especially for
the urbanized, by offering recreational outlets for individuals and a business that would generate
income and employment in that area, by preserving agricultural lands and open spaces, and by
contributing to community development simultaneously. Additionally, such interaction allows

95
consumers to question farmers freely about pesticide use and production methods and may
ensure that the product is ‘‘chemical-free’’ (Gale, 1997).
Some studies isolate success factors specific to the recreation business portion, here
referred to as agri-tourism. Brown and Reeder, (2007), Ryan, DeBord, and McClellan, (2006)
have shown that agri-tourism is partly driven by such factors as location (region), flow of
visitors, and proximity to urban areas(shorter travel distances). In terms of socioeconomic
factors, such business should target, households with higher education, higher family income,
relatively younger, and have more family members (Carpio, Wohlgenant, and Boonsaeng, 2008).
A Colorado study on agri-tourism found that income level, urban influence, visit promotion (via
Tourism Office and Magazines positively influenced travel and related expenditures (Gascoigne,
Sullins, and McFadden, 2008). Their study further finds that travelers from higher-income and
Caucasian households were more likely to visit agri-tourism sites (Gascoigne, Sullins, and
McFadden, 2008). The business should be better informed that the socioeconomic factors are
constantly evolving as the U.S. population ages and becomes more affluent and diverse , yet this
should provide opportunities for entrepreneurial farmers to respond in terms of consumers’
changing food preferences and eating patterns(Ballenger and Blaylock, 2003).
In addressing capacity underutilization Brown and Reeder, (2007) suggest joint ventures-
farmers markets and recreation-agri-tourism, with recreation naturally fill in for the slack. This is
due to the fact that infrastructure at these locations are not utilized year-round, hence a perfect
stage for agri-tourism activities, such as corn mazes, hayrides, and food festivals.

96
Data and Methods
An Internet survey of consumers residing in Delaware, New Jersey, and Pennsylvania
was conducted between June 21 to 29, 2010 to capture consumer purchasing behavior and other
characteristics relating to visiting agri-tourism operations and shopping from direct (farmer-to-
consumer) market outlets in the Northeast. The survey instrument was developed using
SurveyMonkey.com (Palo Alto, CA), an on-line survey tool that allows researchers to design and
implement an on-line survey. The survey was pre-tested on a subset of the target consumer
population (n=93) to refine and clarify misleading or misunderstood questions prior to full
deployment of the survey. Survey participants were randomly drawn from a panel of participants
managed by Survey Sampling International, LLC (Shelton, CT), a provider of sampling solutions
for survey research. The selected panelists received a consent statement along with a link to the
survey developed by researchers from Rutgers, the State University of New Jersey, and
Pennsylvania State University. All potential participants were screened and asked to participate
if they were: 1) age 18 and older, to ensure that only adults participated; 2) the primary food
shopper for the household; and 3) had attended agri-tourism and direct marketing events or
activities in the past. Panelists were informed of this criteria as well as their compensation, an
entry into Survey Sampling International, LLC’s quarterly $25,000 sweepstakes and an instant
win game play, which is standard compensation for these panelists, in the consent statement. To
begin the survey, panelists clicked on a hyperlink at the bottom of the consent statement, which
then directed them to the survey welcome screen.
Of the 2594 members who were registered with this panel and accessed the survey (309
from DE, 952 from NJ, and 1384 from PA), 1134 met the screener criteria and began the
questionnaire (133 from DE, 424 from NJ, and 577 from PA), with 993 completing the 15
minute survey (122 from DE, 364 from NJ, and 507 from PA). Panelists were asked to quantify

97
the amount of produce purchased at direct marketing outlets, type of produce bought, number of
visits per month, and dollars spent during visits to each of the farmer-to-consumer direct market
outlets and agri-tourism operations targeted. In addition, panelists also responded to
demographic questions (age; gender; 2009 annual gross household income; and household size).
On submission of a completed survey, participants were directed to a thank you page.
The study analysis is based on responses to 17 questions relating factors/motivations/
reasons for visiting an agri-tourism site/farmers’ market. Respondents were asked to rate on a
scale of 1 through 7 the factors/motivations/ reasons for their visit. Where, 1= the reason/factor
was not at all important and 7 = the reason/factor was extremely important with a score =4
denoting an indifferent or neutral response. Two sets of question utilizing the same Likert scale
were applied on site attributes and motivating factors for visiting a farmer’s market/agri-tourism
site rated utilizing on the above scale. The respondents were asked … “How important are the
following factors/attributes/reasons in your decision to visit agri-tourism site for an activity or
event[factors/attributes included hay rides, wine tasting, agricultural festival/fairs, produce
purchases, availability of picnic tables, and other related farmers’ markets and agri-tourism
activities.,”
Principal components factor analysis (PCA) was used to reduce the 17 questions
exploring consumer motivations for visiting a farmers’ market/agri-tourism site to a smaller set
of dimensions (factors). A standard latent root equal to one and a scree test were used to establish
the number of factors to retain, followed by a confirmatory analysis to ensure internal reliability
of the factors. Next, a two-stage cluster analysis was employed to identify clusters of respondents
with similar motivations for visiting a direct market/an agri-tourism site. ANOVA tests were
applied to examine inter-cluster heterogeneity. Finally, a regression analysis was applied on the

98
standardized factor scores obtained from principal component analysis to explore the relationship
between the identified dimensions and the socioeconomic attributes of the consumers.
Empirical Results: Motivation for visiting direct farmer’s market or agri-tourism sites
Table 1 presents the mean, standard deviation, and factor loadings from the principal component
factor analysis obtained after a Varimax rotation of consumer responses to the 17 questions
exploring reasons/motivation for patronizing a farmers market/ and agri-tourism site.
Factors are ranked in order of the proportion of variance explained, and are labeled to reflect the
latent stimuli underlying consumer motivation for the visit. With the exception of one, all the
estimated means of >4, on questions relating to the importance of motivations/reason for the visit
suggest relevance of the variables in defining the latent dimensions on the bundle of factors
underlying the visit. As reported in table 1, the analysis identified five factors underlying the
visit to a farmer’s market/agri-tourism site. Together, these factors accounted for 66% of the
variance, and are summarized in the discussion below
Table 1: Varimax Rotated Factor Loadings Public Motivations/factors For Visiting Farmers’ Market/Agri-
tourism Sites
Description Mean
(Std. Dev.) Factors
1 2 3 4 5
FACTOR 1:Learners Experience
Learn how food is grown 4.03
(1.66)
.865
See where food is
produced
4.29
(1.66)
.846
Experience Farm visit 4.51
(1.61)
.633
Educational class 3.88
(1.57)
.576
FACTOR 2: Naturalist Experience
Enjoy rural scenery 5.33
(1.34)
.778
Spend time with family &
friends 5.44
(1.42)
.764
Appreciate scenery and
natural settings 5.00
(1.42)
.577

99
FACTOR 3: Leisurely Experience
Events
(e.g., concerts) 4.24
(1.59)
.768
Activities(Hayrides, farm
tours) 4.90
(1.56)
.745
Has restaurants & cafes 4.08
(1.53)
.593
Has animal pet zoo 3.75
(1.69)
.547
FACTOR 4:Purchasing/marketing Experience
Buy fruits and vegetables 5.48
(1.45)
.767
Support local farmers 5.51
(1.34)
.664
Buy value added products 4.44
(1.55)
.646
Located near my home 4.93
(1.49)
.606
FACTOR 5: Entertainment/Partying Experience
The site has facilities:
picnic tables and
restrooms
4.94
(1.68)
.725
The site has shops 5.09
(1.40)
.711
Percent of total variance explained 15.8% 13.9% 13.3% 12.5% 10.8%
Total Variance Explained by Factors 1-5=66.39
FACTOR1: Learners Experience (scale of 1-7, where 1 = not at all important and 7 = extremely important).
This dimension captures the importance the Mid-Atlantic public places on agricultural education.
Most of the American people reside in urban areas; it may, therefore, not be farfetched that basic
agricultural knowledge is remote to many. In this respect, a visit to the farmers’ market/agri-
tourism site provides valuable opportunity to tap in to some of the knowledge first-hand. It may
be more pertinent, particularly, to the school going children who may learn something about
agriculture. Some of the questions that may seem obvious but may be of great interest to children
will be: “how food is grown and produced.” The learning experience for some of the visitors
would involve enjoying a farm visit experience. No wonder the learning experience is the most
important of the five factors, accounting for approximately 16% of the variance.
100
FACTOR 2: Naturalist Experience (scale of 1-7, where 1 = not at all important and 7 =
extremely important). Naturalist experience is for that consumer segment that sets aside some
time to reconnect with nature. These consumers can be seen driving around in rural farms for the
mere joy of the rural scenery. It will not be surprising to see naturalists in groups of friends or
families just having a good time. One compelling reason for naturalists to go rural is in an
attempt to get away from the clutter of cities to the countryside to refresh. This naturalist
experience dimension accounts for approximately 14% of the variance.
FACTOR 3: Leisurely Experience (scale of 1-7, where 1 = not at all important and 7 = extremely
important). Accounting for about 13% of the variation is the dimension capturing leisure aspects
motivating a visit to farmers’ market/agri-tourism site. For this segment of consumers, agri-
tourism sites offering such attractions as concerts; hay rides; farm tours; or petting zoos are
winners. One important consideration for this consumer segment is the value they attach to the
eating experience, therefore a good restaurant or café is a major factor for visiting.
FACTOR 4: Purchasing/marketing Experience (scale of 1-7, where 1 = not at all important and 7
= extremely important). This dimension reflects the well established reason of existence of
farmers’ markets; to provide consumers a better shopping alternative for fresh and value added
products. The dimension explains another 13% of the variation. The main attraction for a
successful purchase/market experience is the knowledge that the products will be fresh in
addition to knowing some farmers personally; the more reason to buy local. Interestingly,
support for the local farmers variable correlates highly with the purchasing experience. With
hindsight, this connection makes a lot of sense as expenditures made go a long way to support
the local economy. Additionally, the proximity variable, adds more economic rationale in the
light of rising gas prices that make driving long distances to supermarkets less attractive.

101
FACTOR 5: Partying/ Entertainment Experience (scale of 1-7, where 1 = not at all important
and 7 = extremely important). This dimension captures the importance the Mid- Atlantic public
places on away- from- home activities (e.g., potlucks) and shopping. Although explaining about
11% of the variation, in terms of business strategy it reflects importance of facilities and shops.
In this respect, entertainment facilities (picnic tables and restrooms) and shops should be bundled
or developed simultaneously to make a visit a fulfilling customer experience.
Cluster Analysis
The means and standard deviations of the standardized factor scores and the number of
respondents in each cluster are reported in table 2. The analysis identified four clusters on the
basis of importance respondents placed on the factors identified in the principal component
factor analysis. The results were obtained by subjecting individual cases to non-hierarchical
clustering. The number of clusters was determined on the basis of interpretability and external
validity using the criteria of increases in cluster coefficients as clusters merge. The ANOVA tests
suggest significant inter-group heterogeneity on the importance the Mid-Atlantic public placed
on each of the five factors. In result, four consumer segments were identified and named
describing the dominant issue/bundle of attributes characterizing each segment. For example,
respondents in cluster three, “Buyers”, are significantly different from the other clusters in that
they were more likely to be impacted by the purchasing experience (F [3, 1,130] = 296.10, p <
0.05), as shown by a relatively higher mean score (0.751) on purchasing experience compared to
the other clusters.

102
Table 2: Characteristics of the Consumer groupings indentified through Cluster
Analysis(Means and Standard Deviations)
Dimensions/Factors:
farmer-consumer/agri-tourism
Naturalists
N=453
40%
Learners
N=189
17%
Buyers
N=164
14%
Partiers
N=328
29%
F-Statistic
FACTOR 1:Learners Experience
-.389
.778 .425
.665
-.884
.901
.734
.598
253.38*
FACTOR 2: Naturalist Experience
.539
.689
-.712
.860
-.964
.884
.148
.666
232.82*
FACTOR 3: Leisurely Experience
.201
.764
.085
.812
-.484
1.026
-.085
1.097
23.93*
FACTOR 4:Purchasing/marketing
Experience
-.062
.669
-1.243
.932 .751
.710
.427
.604
296.10*
FACTOR 5: Partying/entertainment
Experience
-.226
.791
-.154
.981
-.222
1.240 .511
.736
51.31*
Notes: values in the table are means and standardized factor scores, with standard deviations in
parenthesis-statistic are from the ANOVA inter-cluster differences, where the asterisk (*) denotes
significance at the 5% level or better.
Naturalists: This group is comprised of respondents who appreciate and enjoy the natural
setting of rural scenery. Most likely the group/segment comprises of urban residents, who in their
weekend-get away, visit agri-tourism sites to spend time with family and friends (note the high
mean score of 0.539 for factor 2). About 40% of the respondents belong to this group/segment
making it the largest of the clusters. The lure of events though minimally associated with this
cluster may suggest that to capture this consumer segment, business operators may bundle
entertainment attractions such as concerts along with rural scenery visits. Interestingly, the group
is not driven by purchasing /buying experience, but by an attraction to rural scenery. Arguably,
farmland preservation becomes a very important component of agricultural sustainability in the
Mid-Atlantic region to continue attracting naturalists. It may therefore be prudent for farmers’
market/agri-tourism business operators to do more in this area to retain and attract this caliber of
clients.

103
Partiers/Entertainment lovers: This is the second largest consumer group/segment, comprising
about 30% of the respondents. The group may be described as a people interested in having a
good time away from home. To realize their objectives of such a consumer group, business
operators may invest more on facilities such as picnic tables and restrooms. Availability and
immediate access to shops will enhance entertainment/good times as customers don’t have to
leave their chosen spots to run somewhere to buy whatever is missing for a potluck or picnic
event. Experience tells us that even good planners sometimes may miss out on something.
Operators will, therefore, place reasonable priority on making their sites attractive, making return
visits compelling by providing what their customers need to make their stay enjoyable.
Learners: The third consumer segment is learners, comprising about 17% of the respondents.
This group may be described as those seeking to have an intimate knowledge of agriculture and
farmland. Although this group may be largely school going children, the group may also be
representative of those people seeking to know more about agriculture. For example, these
people are seeking to know what it takes to produce food and what a farm and those who work in
the farm look like. Do their life styles differ from those in other sectors of the economy?
Organizing a site activity along the interests of this group will be promoting not only the market
aspect but also the touristic aspects of such sites.
Buyers: This is the smallest consumer segment taking about 14% of the respondents. The
segment is basically the traditional customers of the farmers’ markets who patronize the sites to
take advantage of fresh produce and value added products priced reasonably. However, survival
of business will depend on expanding range of activities and attractions, while serving the
primary farmers market’ objective. The operators will, therefore, provide enough in terms of
variety and quality and the right price must be right so that the customers don’t end up shopping

104
in the next retail/wholesale outlet. Of course one of the drivers of buyers group is proximity and
support of local farmers; to these consumers this is a preferable tradeoff.
Explaining factors underlying visits to farmers’ markets/agri-tourism sites
Multiple regressions were carried out on the five factors identified in the principal factor
analysis. The regression analysis identified and estimated the relationships between
socioeconomic variables and direct farmers’ markets/agri-tourism sites patronage. The regression
results provide operators of farmers’ markets/agri-tourism sites segmentation information to
develop promotional strategies in an effort to sustain their businesses. Table 3 presents the
socioeconomic variables used in the regression analysis and their relevant statistics. The
dependent variables in the regression analysis are the standardized factor scores that were
obtained from the principal component analysis. As observed from the regression results
reported in table 4, the adjusted R2 ranged between 0.011 and 0.050 and the F-statistic was
significant across all the models signifying better model performance. Results on significant
factors impacting the five dimensions on direct farmers’ markets/agri-tourism sites patronage are
summarized below.

105
Table 3. Definitions and Descriptive Statistics of Socioeconomic Variables
Variable Definition
Mea
n
Std.
Deviation
MALE =1 if respondent is male;0 otherwise .250 .433
UND_20YEAR =1 if respondent is under 20 years; 0 otherwise .024 .153
A21_35YEAR =1 if respondent is 21-35 years of age; 0 otherwise .293 .455
A36_OLDER* =1 if respondent is 36 years of age and older; 0
otherwise .683 .394
LTHISCH =1 if respondent level of education is below high
school; 0 otherwise
.007 .059
HSC_GRAD =1 if respondent is a high school graduate; 0 otherwise .280 .449
COL_GRAD* =1 if respondent is a college graduate and above; 0
otherwise
.713 .420
U_17SZE =average number of children under 17 in a family 1.7 1.087
URBAN =1 if respondent resides in an urban area; 0 otherwise .11 .313
S_URBAN =1 if respondent resides in a sub- urban area; 0
otherwise
.69 .464
RURAL* =1 if respondent resides in a rural setting ; 0 otherwise .20 .403
ETHNICITY =1 if respondent is Caucasian; 0 otherwise .88 .322
INCBLW_80K
*
=1 if respondent is in the income bracket below $
80,000 and below; 0 otherwise
.68 .369
INC80_99K =1 if respondent is in the income bracket $ 80,000-
$99,000 and below; 0 otherwise
.13 .340
INCAB_100K =1 if respondent is in the high income bracket $
100,000 and above; 0 otherwise
.19 .389
RETIRED* =1 if respondent is either retired or homemaker; 0
otherwise
.32 .365
EMPLOY =1 if respondent is employed; 0 otherwise .54 .499
SELF-
EMPLOY =1 if respondent is self-employed; 0 otherwise
.08 .270
STUDENT =1 if respondent is a student ; 0 otherwise .07 .251
*These variables were dropped during estimation to avoid the dummy variable trap
Learners Experience: General interest in agriculture and farming in particular was the most
important motivation for visiting farmers’ markets/agri-tourism sites for the Mid-Atlantic
population. Variables relating to urban residences compared to rural; number of children 17
years of age and below in a family; adult youths between the ages of 25 to 35 years compared to
those who are 35 years and older positively impacted learning experience. The ethnicity variable

106
(Caucasians compared to other races) had a negative impact on the learning experience. The
ethnicity finding may be explained by the predominance of Caucasians in agriculture in general.
Naturalist Experience: The major attraction defining naturalist experience was interest in rural
scenery and farming. Variables on number of children 17 years of age and below in a family, and
Caucasian compared to other races was positively related to the naturalist experience. On the
other hand, youths 20 years and younger compared to those who are 35 years and older, males
compared to their female counterparts perceived the naturalist experience negatively.
Leisurely Experience: The public motivation for patronizing farmers’ markets/agri-tourism sites
was activities offered, including events such as concerts, hay rides and farm tours, among others.
As expected, variables relating to number of children 17 years of age and below in a family,
adult youths between the ages of 25 to 35 years compared to those who are 35 years and older,
and employed compared to retired positively viewed the leisure experience.
Table 4: Regression Results: Socioeconomic variables impacting farmer-consumer markets/agri-tourism
1. Learners
Experience 2. Naturalist
Experience 3. Leisurely
Experience 4. Buying
Experience 5. Partying
Experience Constant .107
(.649)
-.615
(-3.751)
-.443
(-2.700)
.144
(.867)
.626
(3.828)
Urban residence(vs.
Rural)
.320
(2.352)**
-.050
(-.371)
.116
(.861)
-.139
(-1.022)
.077
(.575)
Suburban
residence(vs. Rural
residence)
-.068
(-.755)
.085
(.955)
.085
(.948)
-.076
(-.839)
-.003
(-.036)
Number of children
under 17 years of
age in a family
.112
(3.286)**
.134
(3.989)**
.094
(2.782)**
-.044
(-1.300)
-.086
(-2.555)**
Male(vs. Female)
.105
(1.270)
-.322
(-3.934)**
-.040
(-.486)
-.175
(-2.115)*
-.102
(-1.247)
Age, under 20
years(Vs. 36 years
and older )
-.205
(-.791)
-.519
(-2.025)*
.081
(.315)
-.202
(-.779)
-.691
(-2.699)**
Age 21-35(Vs. 36
years and older)
.175
(2.082)*
-.014
(-.163)
.209
(2.510)**
-.073
(-.873)
-.291
(-3.506)**

107
Below high school
education(Vs.
college and above)
.085
(.115)
-.111
(-.151)
-.037
(-.050)
-1.046
(-1.407)
.009
(.012)
High school
education(Vs.
college and above)
.001
(.009)
.062
(.753)
-.008
(-.100)
.010
(.119)
-.004
(-.053)
Employed(vs.
retired)
-.068
(-.837)
.099
(1.226)
.163
(2.012)*
-.023
(-.285)
-.162
(-2.005)*
Self employed(vs.
retired)
-.147
(-1.009)
-.011
(-.074)
.063
(.439)
.066
(.456)
-.042
(-.293)
Student(vs. retired)
-.025
(-.143)
.081
(.464)
.202
(1.160)
-.338
(-1.925)*
-.175
(-1.007)
Caucasian(vs. other
races)
-.369
(-3.196)**
.387
(3.382)**
.094
(.818)
.077
(.667)
-.261
(-2.287)**
Income,
80_99K(vs. Income
below 80K)
.044
(.412)
-.085
(-.811)
-.001
(-.007)
.084
(.791)
-.032
(-.304)
Income
over,100K(Vs.
Income below 80K)
-.110
(-1.176)
.089
(.963)
-.127
(-1.365)
.118
(1.265)
-.073
-.794
Adjusted R Square .046 .050 .017 .011 .035
Model F-Statistic 4.024** 4.316** 2.084* 1.693* 3.260**
Notes: Single and double asterisks (*) denote significance at 5% level or better, the values in the
parentheses are t-ratios. The variable categories in the brackets are excluded to avoid the dummy
variable trap.
Purchasing/marketing Experience: The purchasing experience may be premised on a
consumer’s cost/benefit comparisons on prices, and product attributes such as quality, freshness
and a variety offered by farmers’ markets compared to supermarkets and other retail outlets. Our
guess is that those patrons who emerge better off in their decisions will consider purchasing
experience successful. As expected, students compared to those retired and the males compared
to females viewed the buying/purchase experience negatively. Females compared to males will
be more likely to patronize farmers’ markets to make grocery purchases.
Entertainment/Eat away from home/Partying/Experience: As in the purchasing experience, the
major consideration is presence of facilities to make entertainment, partying and eating out

108
experience successful. Variables relating to ethnicity(Caucasians compared to other races), adult
youths between the ages of 25 to 35 years compared to those who are 35 years and older , and
employed compared to retired negatively perceived the partying experience. It may be generally
plausible that young adults will be less keen to carry food from home to eat out somewhere
because they would rather eat out in a fast food outlet and are therefore unlikely candidates for
potlucks. While for consumers 35 years and older, having potlucks away from home is a way of
connecting with family and friends.
Concluding remarks
Although farmers’ market/agri-tourism business operations have proved to be critical for income
stability for majority of small to medium scale farmers, capacity utilization and sustainability
remain challenges that need action on part of business operators. Results from this study show
that bundling of farmers’ markets activities/site attributes, is a workable business strategy. The
study suggests that if implemented, it will spur diverse and steady patronage beyond the
traditional fresh produce and value added products. Patronage to agri-tourism sites/ farmers’
markets may be broken down into five distinct dimensions/experiences: learning, naturalist,
purchasing, leisurely, and entertainment experiences. This is useful information that operators
will capitalize on in their business strategy. Information on the experiences, via cluster analysis
yielded four market segments: (1) those with a strong affection with the rural scenery, (2) a
segment interested in knowing more about agriculture, (3) consumers who visit just to buy the
farmers’ produce and value added products, and finally (4) a group of consumers who visit just
to connect and have fun.
Segmentation/customer profiling stands out as a valuable piece of information that
farmers’ markets/agri-tourism business operators could use to position them better for the future.

109
The business operators now know who their customers are and what it takes to attract them. The
regression results show that a number of socio economic variables are related with the patronage
experience. The study finds that there is potential for generating activity all year round by
bundling attributes/activities to tap on a wider market beyond traditional fresh produce buyers.
References
Ballenger, Nicole, and Blaylock, James. “Consumer-Driven Agriculture: Changing U.S.
Demographics Influence Eating Habits.” Amber Waves, April 2003.
http://www.ers.usda.gov/Amberwaves/April03/Features/ConsumerDrivenAg.htm
Biswa R. Das and Daniel V. Rainey (2010) “Agri-tourism in the Arkansas Delta Byways:
Assessing the Economic Impacts” International Journal of Tourism Research. 12, 265–280
(2010).
Blisard, Noel, Biing-Hwan Lin, John Cromartie, and Nicole Ballenger. “America’s Changing
Appetite: Food Consumption and Spending to 2020,” Food Review Vol. 25, Issue 1,
ERS-USDA, May 2002.
Che,D, Veeck,A and Veeck, G. (2005) “Sustaining production and strengthening the agritourism
product: linkages among Michigan agri-tourism destinations). Journal of Humanities,
Social Sciences and Law.
Carpio, Carlos E., Michael K. Wohlgenant, and Tullaya Boonsaeng. “The Demand for
Agritourism in the United States.” Journal of Agricultural and Resource Economics 33
(2008): 254 – 269. Web. 9 Feb. 2011.
Conner, D, et al., 2010 “Locally grown foods and farmers markets: Consumer attitudes and
Behaviors” vol.2:742-756.
David W. Hughes, Cheryl Brown, Stacy Miller, and Tom McConnell “Evaluating the Economic
Impact of Farmers’ Markets Using an Opportunity Cost Framework” Journal of
Agricultural and Applied Economics, 40, 1(April 2008):253–265.
Dennis M. Brown and Richard J. Reeder (2007) “Farm-Based Recreation: A Statistical Profile”
Economic Research Report Number 53, United States Department of Agriculture.
Hand, M , et al., (2010) “Local Food Systems: Concepts, Impacts, and Issues” Economic
Research Report Number 97, United States Department of Agriculture.

110
Gale, F. ‘‘Direct Farm Marketing as a Rural Development Tool.’’ Rural Development
Perspectives 12(1997):19–25.
Gascoigne, William, Martha Sullins and Dawn Thilmany McFadden. “Agri-tourism in the West:
Exploring the Behavior of Colorado Farm and Ranch Visitors.” Western Economics
Forum (2008): 12-24. Web. 9 Feb 2011.
Govindasamy, et al., (2010) “A Demand Driven Assessment of Farmer-to Consumer Direct
Marketing and Agri-Tourism Industry in the Mid-Atlantic States”.
Govindasamy, Ramu and Rodolfo M. Nayga, "Characteristics of Farmer_To_Consumer Direct
Market Customers: An Overview," Journal of Extension. Electronic Journal, August,
1996, 34(4).[online] at: http://joe.org/joe/1996august/rb1.txt.
Linstrom, H.R.,” Farmer to Consumer Marketing,” ESCS-01, Economics, Statistics, and
Cooperative Service, U.S. Department of Agriculture, February 1978.
Ryan, Susan, Kristy DeBord, and Kristin McClellan. “Agritourism in Pennsylvania: An
Industry Assessment.” The Center for Rural Pennsylvania. California University of
Pennsylvania. March 2006. http://www.ruralpa.org/agritourism2006.pdf.
Tracy, M.H., P.S.Dhillon, and M.C. Varner, “Economic Comparison of Direct Marketing
Alternatives for Fresh Vegetables in New Jersey,” New Jersey Agricultural Experiment
Station P-02551-1-82, Rutgers University, March 1982.

111
Appendix-3
Agritourism Consumer’s Participation in Wine Tasting Events: An
Econometric Analysis
Abstract
Purpose = To determine the likelihood of a United States Mid-Atlantic region consumer’s
willingness to partake in a wine tasting event, an example of an agritourism activity, based on
their responses to an Internet survey conducted 22 to 29 June 2010.
Design/methodology/approach = Potential participants were screened and asked to participate
if they resided in one of the states targeted (Delaware, New Jersey, or Pennsylvania); were age
21 and older; the primary food shopper for the household; and had previously attended an
agritourism and/or direct marketing events or activities.
Findings = A logit model was developed based on responses from 972 consumers who
participated in the 15-minute Internet survey to predict participation in wine tasting activity.
Consumers who are more likely to attend an on-farm wine tasting event include those who: learn
about agritourism events through newspapers, think that the variety and price of produce is better
at direct markets than supermarkets, are older than 50 years, have a graduate degree, and are self-
employed.
Research implications = Empirical results will help agritourism operators enhance marketing
efforts and develop profitable on-farm agricultural activities by identifying consumer segments
likely to participate in wine tourism activities.
Practical implications = This paper helps identify consumer segments more likely to participate
in a wine tasting event and provides marketers with the ability to target likely buyers based on
corresponding demographic characteristics.

112
Originality/value = This paper identifies likely wine tasting participants based on demographic,
psychographics, and behavioral characteristics.
Keywords Agritourism, Consumer behavior, Logit model, Marketing strategy, Mid-Atlantic
states, Wine tasting
Paper type Research paper
Acknowledgements:
This project was supported with matching funds by The Federal-State Marketing Improvement
Program (FSMIP), Agricultural Marketing Service, USDA, Contract # 12-25-G-0894..

113
INTRODUCTION
Across the United States, small family farmers (annual sales of less than $250,000;
Hoppe and Banker, 2010) recognize the need to broaden their offerings in an attempt to remain
or become economically sustainable. To do so, Tubene and Hanson (2002) indicated that small
farmers must be creative and diversify their farm activities through value-added products and/or
services as well as identify new markets. One such activity is agritourism.
Agritourism is an agriculturally-based direct marketing operation or educational
experience such as pick-your-own farm, agricultural fairs/festivals, and school field trips that
brings visitors to a farm or ranch. Agritourism is becoming an important activity that promotes
employment, income, and sustains rural communities (Hall and Robert, 2003; Kneafsey, 2000).
It is an attractive option for farm operators to increase returns on their on-farm activities
(Bernardo et al., 2004; Small Farm Center, 2006), is also a source of economic strength for farms
and businesses in rural areas, and provides higher margins from sales of value-added goods and
services. For example, one third of all farm operations in the United Kingdom support
agritourism activities and the percentage is even greater in France and Italy (Bernardo et al.,
2004). In the U.S., New Jersey Farmers have increasingly received public support for their on-
farm activities (Govindasamy et al., 2002).
Research; however, has shown that agritourism may not be feasible and appropriate for
every agricultural farm since there is an increased level of record keeping, marketing strategies,
labor requirements, and other tasks. Furthermore, diversifying the farm operation to include
agritourism may lead to safety issues, loss of privacy, liability issues, and extra responsibilities
(Tavernier et al., 1992; Schilling et al., 2006).

114
Consumer interest in agritourism
As a natural extension of direct marketing, growers are finding that in addition to fresh
agricultural products, their customers have a genuine interest in the agricultural experience. This
consumer interest can create additional income opportunities for farmers who utilize existing
farm infrastructure in the provision of farm-related agritourism. Furthermore, since consumers
understand the quality and value of sourcing fresh agricultural products directly from farmers,
they are also open to patronizing other unique farm-based activities.
In 2007, approximately 23,350 farms received over $566 million in income from
agritourism and recreational services including hunting, fishing, horseback riding, and other on-
farm activities (Thessen, 2007). U.S. farms providing agritourism and recreational services
generated an average income of $24,276 in 2007, an increase of 236 percent from 2002 (NASS,
2007). Based on NSRE (2000-2002), a total of 82 million people visited farms one or more
times, which included 20 million school children, and spent an average $45 per trip and traveled
an average of 80 miles. In 2002, 2,200 Vermont farms received $19.5 million from agritourism
activities that represented approximately four percent of the total gross farm income and was
86percent percent higher than agritourism income in 2000 (NASS, 2002). New Jersey farms
obtained a total of $57.53 million in income from agritourism activities in 2006 (Schilling et al.,
2006); while, agritourist in Pennsylvania spent approximately $120 per visit in 2004 (Ryan et al.,
2006).
Wine tasting as an agritourism activity
Visiting a winery tasting room, or wine tourism, is a recognized agritourism activity
(Gold and Thompson, 2011; Wicks and Merrett, 2003) and allows consumers to enjoy a farm-

115
produced product and learn about and further understand the farming experience (Dodd, 1995;
Peters, 1997; Skinner, 2000). From 1999 to 2010 the number of wineries in the U.S. grew from
2,688 to 6,668 (Hodgen, 2011). The number of wineries reported in November 2010 was 6,785,
a 9% increase in the number reported the previous November. The growth in number of
wineries in Pennsylvania (144) and New Jersey (45) has matched the U.S. trend with
Pennsylvania ranked seventh out of the 50 states in terms of number of wineries and New Jersey
placing 20th (Fisher, 2011).
In Pennsylvania, one of two states with “exclusive control over both the disruption and
retail components” pertaining to alcohol sales, 81 percent of wine is sold directly at the winery or
winery outlet; hence dependence on wine tourism is significant (Dombrosky and Gajanan, 2013).
Data from 2005 indicate that more than 800,000 winery visits occurred in Pennsylvania alone
(MKF Research LLC, 2007).
In Europe, as well as in the U.S., wine tourism has developed into wine roads or wine
routes (Hall et al., 2000). Farms that maintain vineyards can host vineyard tours, winemaking
demonstrations, wine tastings, wine classes, or events and festivals for visitors or local
businesses. On-farm wineries bring guests to rural areas where they spend the day or weekend
tasting wine, which can evolve into an even greater experience for visitors and provide
opportunities for complementary businesses such as bed-and-breakfast facilities and restaurants
(Collins, 2006). Therefore, incorporating wine tasting into businesses practices and experiential
offerings can assist farmers with diversify their farming operations which may in turn bring more
economic activity to rural areas.

116
Visiting a winery to sample wines, learn about grape production, the wine making
process, and to purchase wines (Tassiopoulos et al., 2004) are widely recognized as being
important wine tourism component. Consumer and industry interest in tasting rooms is logical
as wine consumption in the United States (U.S.) is well recognized as being an integral part of
the mainstream culture and is enjoyed by many on a daily basis (Wine Intelligence LTD, 2011).
According to the 2010 Wine Market Council’s Consumer Tracking Study (Wine Market
Council, n.d.), just over a third (34.3%) of U.S. adults reported drinking wine with a per capita
adult consumption of 3.6 gallons (Hodgen, 2011). Consumption frequency can be segmented
even further into those who consume wine at least once a week (Core wine drinkers, 20.4% of
the U.S. adult population) and those who consume wine less frequently (Marginal wine drinker,
13.9%).
Attracting consumers who are likely to visit wineries is crucial to the industry. Several
efforts have been initiated by individual states to attract the wine tourist and encourage this
consumer to visit one or more wine regions or trails in the region. In 2012, Sonoma County,
California, viticulture, winery, and tourism agencies and associations received $600,000 in
funding to develop a logo and campaign to “experience-seekers, people who value events and are
genuine, independent and adventurous,” based on data collected from wineries and surveying
consumers (Bussewitz, 2012).
Why investigate wine tourism trends in the mid-Atlantic?
The mid-Atlantic region of the United States has been, and will continue to, experiencing
impressive population growth. Based on 2010 U.S. Census data, Pennsylvania (12.7 million)
ranked 6th, New Jersey (8.8 million) 11th in population and the population of Delaware was

117
897,934. In total, the population of the three states was roughly 7.25% of the total U.S.
population. Despite this small combined percentage, each of these states experienced growth
since 2000 (3.4 to 14.6 percent) and U.S. Census projections, based on 2000 data, indicate that
the collective population of these three states will increase over two million people by 2030
(U.S. Census Bureau, 2005). Additionally, the three states, in part, contain two of the most
populous metropolitan statistical areas (New York-Northern New Jersey-Long Island, NY-NJ-
PA and Philadelphia-Camden-Wilmington, PA-NJ-DE-MD) in the country (Mackun and Wilson,
2011). In regards to percentage of residents in each of the three state that live in urban areas,
New Jersey ranks the highest (92.24%) with Pennsylvania (70.68%) and Delaware (68.71%)
ranking lower (U.S. Census Bureau, n.d.). It is suggested that as urban populations grow the
“divide between farmers and urban consumers” increases as well and there is a greater risk of
“misunderstandings and misconceptions about faming and agriculture” (Brieser Stout, 2007).
A report published by researchers in Michigan suggested that urban and suburban
consumers who visit farms could transition into “long-term customers” and become advocates
for the industry (Che et al., n.d.). Farmers have tremendous opportunities in regards to
introducing new goods and services in an attempt to appeal to interested consumer segments.
These activities, particularly in urbanizing areas, contribute to and enhance the overall quality of
life by expanding recreational opportunities, diversify the economic base, promoting retention of
agricultural lands and open spaces, and contribute to community development (Henderson and
Linstrom, 1982; Linstrom, 1978; Govindasamy et al., 1999).

118
LITERATURE REVIEW
Wine Tourism Motivations and Barriers
The positive impact of wine tourism on farmer’s economic sustainability, the potential to
benefit the greater community and encourage regional development (Hall and Mitchell, 2000),
and what motivates consumers to travel to a winery have been investigated on a national and
international scale. Data collected from Spanish wine consumers indicated that being able to
taste wines produced at wineries, visiting wineries, wineries hours of operation were “long,” and
to buy wine at the winey were the main incentives to participate in wine tourism (Marzo-Navarro
and Pedraja-Iglesias, 2012). Others have examined whether visiting wineries was a day activity
or if the visit spanned two or more days. For some, as was discovered by Tassiopoulos et al.
(2004) who focused South African residents, a majority of respondents (73.2%) treated that
activity as a day trip.
It has been suggested that “wine tourism is rarely a discrete activity” (Charters and Ali-
Knight, 2002). Knowledge gained form Cohen and Ben-nun (2009) showed that participants
who had children under age 18 “strongly prefer family activities” compared to those residing in
households without children. Tassiopoulos et al. (2004) reported a similar research outcome with
the presence of children age six to 15 having an impact on wine tourism, due to lack of
“appropriate facilities.” Hence a greater percentage of participants with children in this age range
were “low users,” and were first time wine tourism or visited wineries less than once a year.
Wine Tourist Segmentations
Authors recognize that smaller producers may be well versed in growing grapes and
making wine but know less about who does/could consume their wine and what could inhibit

119
wine-tourism development (Hall and Mitchell, 2000). For example, Houghton (2008) analyzed
survey participant’s attitudes and behaviors to learn whether events such as wine festivals attract
or deter a winery’s core customer or if these activities appeal to just the “novice.”
Segmenting survey participants based on responses to survey questions allows winery
managers and operators to determine if differences exist between groups, based on segmenting
variables, and to use as the basis for identifying and marketing to audiences in an effort to attract
audiences to the winery or wine region (Cohen and Ben-nun, 2009). Wine tourists have been
segmented based on a number of variable: interest in wine, wine purchasing behavior, prior
participating in wine tourism, (Charters and Ali-Knight, 2002), how often the visit wineries,
demographic characteristics, (Cohen and Ben-nun, 2009) and even whether participants had
previously participated in wine tourism (Cohen and Ben-nun, 2009; Marzo-Navarro and Pedraja-
Iglesias, 2009).
Tassiopoulos et al. (2004) found that a greater percentage of consumers who were age 25
to 34 were “medium users” and “high users,” which related to a) consumers who visited a wine
route up to three times a year and b) those who visited more than four times a year, respectively.
The authors indicate that these consumers have a greater disposable income and have devoted
more time to wine tourism activities than their counter parts. “High users” also include
individuals who had higher levels of education, were professional or selected “other profession,”
were married, had children under six years of age, and male.
Marzo-Navarro and Pedraja-Iglesias (2009) found only one socio-demographic
significant difference, which was income level, between wine tourists and non-wine tourists.
Their data revealed that wine tourists had a much higher income level than their counterparts

120
which can assist with developing programs and activities for which a higher price can be
charged.
Marzo-Navarro and Pedraja-Iglesias (2009) stated that defining the wine tourist is “even
more necessary” in regions where wine tourism is still in its “infancy.” A study conducted by
Charters and Ali-Knight (2002) was initiated to better understand the wine tourist in Australia.
The authors site work by others, who segmented survey respondents based on demographic and
psychographics characteristics, and indicated that wine tourism in Europe may “exhibit different
features” than in “new producing regions.” In particular, the authors analyze outcomes of
research conducted it Italy which segmented consumers based on attitudes, behaviors, and age
range. Charters and Ali-Knight suggest that consumption behaviors and attitudes for 50 to 60
year old Australia and New Zealanders wine drinkers may differ from the classification
bestowed on Italian wine tourists in this age range.
Even within a country wine tourists can exhibit differences. Wine tourists in two
separate regions of Australia who participated in a study were demographic and psychographics
different pertaining to age, career level, and interest and knowledge about wine (Charters and
Ali-Knight, 2002). Differences could very well assist winery tasting room staff make
assumptions about level of engagement or involvement during the visit. Charters and Ali-Knight
suggest that since one group appeared to be “less eager to learn about wine” that they may be
“less likely to expect a winery tour, or to meet the winemaker.”
National data is available as to demographics and psychographics of the U.S. wine
consumer: an affluent consumer (64 percent have a household income over $100,000),
homeowner (87 percent of wine consumers), married (75 percent), between the ages of 35 and 65

121
years (74 percent), college educated (47 percent compared to 34 percent of the general public),
with a greater percent have management positions (28 percent) and professional or technical
occupations (51.3 percent) compared to the general public (10.2 and 37.9 percent, respectively)
(Insel, 2009).
The question arises as to whether demographics and psychographics of U.S. wine tourists
mirror this data. Additionally, could demographics and psychographics for wine tourists who
reside in the eastern U.S. differ from those who reside in California? Little, if any, research data
has been published which provide response to these questions. Therefore, this study was
initiated to investigate behaviors, attitudes, and demographic attributes that influence consumers
to participate in on-farm wine tasting as a component of agritourism.
METHODOLOGY
Study design
From 22 to 29 June, 2010, a 15 minute Internet survey was conducted to gather
information from United States mid-Atlantic consumers who reported participating in direct
marketing and agritourism activities. Participants were selected at random from a panel
managed by a survey research company (Sampling International, LLC, Shelton, CT). Potential
participants were screened and asked to participate if they: 1) resided in either Delaware, New
Jersey, or Pennsylvania; 2) were age 21 and older; 3) primary food shopper for the household;
and 4) had previously attended agritourism and direct marketing events or activities.
Panelists received an electronic consent statement along with a link to the survey
developed by researchers and approved by the Office of Research and Sponsored Programs at
Rutgers University (New Brunswick, NJ) and Office of Research Protections at The

122
Pennsylvania State University (University Park, PA). After clicking on the hyperlink at the
bottom of the statement, panelists were directed to www.surveymonky.com where they
responded to the four screener questions, after which they initiated the survey if they met the
criteria. Of the questions asked, participants indicated whether they participated in wine tastings,
an agritourism activity, and based on this question, a logit model was developed to predict
participation in wine tasting activity.
Upon completion of the survey, each participant was entered into Survey Sampling
International, LLC’s $12,000 quarterly drawing to compensate them for their time. Survey
questions were pre-tested and administered to a sample of 93 randomly selected Survey
Sampling International, LLC panelists.
Model framework
This study focuses to identify consumers who are more likely to participate in on-farm
wine tasting activities. The paper analyzes consumers’ likelihood to participate in on-farm wine
tasting activities within the random utility discrete choice framework. Following the random
utility framework, it is assumed that a consumer faces a choice in participating in on-farm wine
tasting activities. The logit model was selected because of its asymptotic characteristics that
constrain the predicted probabilities to a range of zero to one. Additionally, the logit model is
favored given its mathematical simplicity and is often used in a setting where the dependent
variable is binary. The estimation method utilizes the maximum likelihood estimation
procedures (MLE) characterized as they provide consisted parameter estimates that are
asymptotically efficient (Gujarati, 1992; Pindyck and Rubinfeld, 1991).
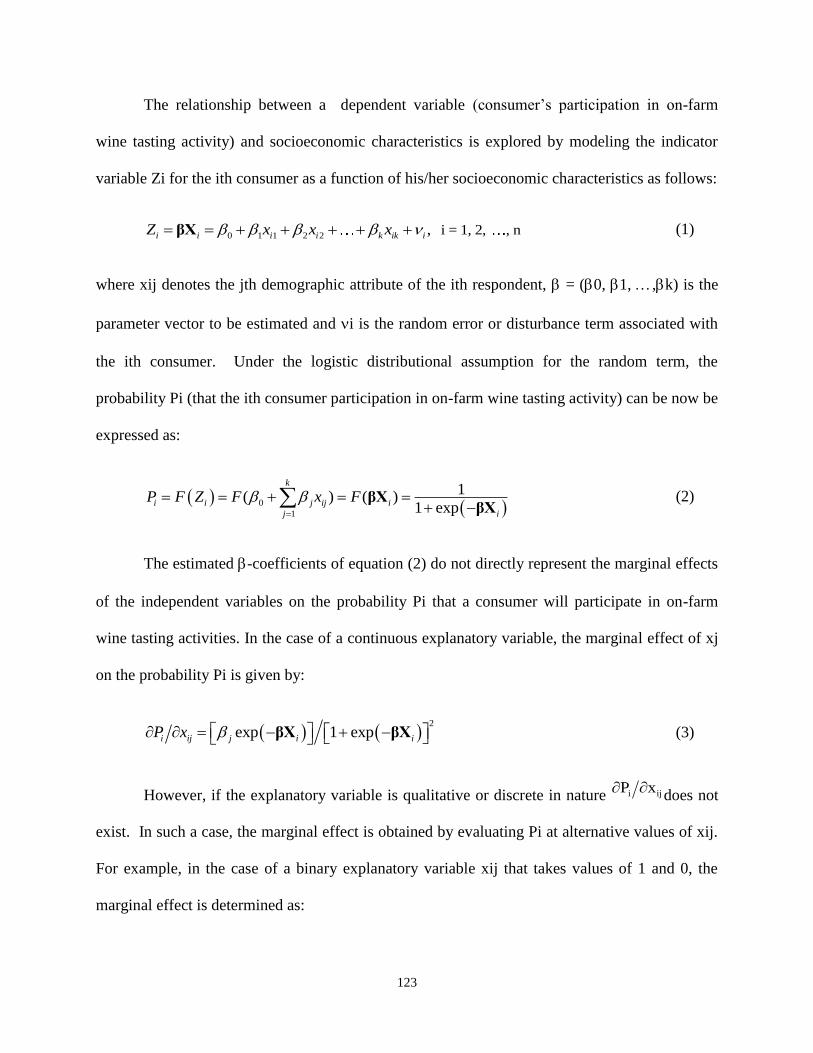
123
The relationship between a dependent variable (consumer’s participation in on-farm
wine tasting activity) and socioeconomic characteristics is explored by modeling the indicator
variable Zi for the ith consumer as a function of his/her socioeconomic characteristics as follows:
0 1 1 2 2 i = 1, 2, , n, i i i i k ik iZ x x x βX (1)
where xij denotes the jth demographic attribute of the ith respondent, = (0, 1, ,k) is the
parameter vector to be estimated and i is the random error or disturbance term associated with
the ith consumer. Under the logistic distributional assumption for the random term, the
probability Pi (that the ith consumer participation in on-farm wine tasting activity) can be now be
expressed as:
0
1
1( ) ( )
1 exp
k
i i j ij i
ij
P F Z F x F
βXβX
(2)
The estimated -coefficients of equation (2) do not directly represent the marginal effects
of the independent variables on the probability Pi that a consumer will participate in on-farm
wine tasting activities. In the case of a continuous explanatory variable, the marginal effect of xj
on the probability Pi is given by:
2
exp 1 expi ij j i iP x βX βX (3)
However, if the explanatory variable is qualitative or discrete in nature P xi ij does not
exist. In such a case, the marginal effect is obtained by evaluating Pi at alternative values of xij.
For example, in the case of a binary explanatory variable xij that takes values of 1 and 0, the
marginal effect is determined as:

124
1 0i ij ij ijP x P x P x (4)
For estimation purposes, in this model, one classification was eliminated from each group
of variables to prevent perfect co linearity.
Based on past literature, hypotheses were constructed to predict which behavioral and
demographic characteristics increased the likelihood of a consumer participation in on-farm wine
tasting activity. Those who participate in on-farm wine tasting activities were predicted to be
more likely to determine and quantify the effects of different factors influencing customers’
decisions to visit farms and to provide an estimation of the recreational value of the rural
landscape in the United States (Carpio et al., 2008). The following empirical model is specified
to capture the relationship between consumers’ behavioral and demographic variables and
participating in on-farm wine tasting activities.
WINE_TST= =0 +1 FVEXPMONTH+2 MILESPYO+3 MILESFMKT +4 MILESOFMKT
+5 MILESCSA +6 BILLBOARD_RSADV+7 NEWSPAPERADV
+8 NOFVISITS+9 EXPAGRITOURISM+10 NOFLOCATIONS
+11 MILESAGRITOURISM
+12 QUALITY+ 13 VARIETY +14 PRICE+15 WTBLOCAL
+16 WTBORGANIC+17 WTBGM+18 SAMEDAY+19 SAMELOCATION
+22 10YEARSLIVE+23 GARDEN +24 WTPPRESERVE
+20 URABN+21 SUBURBAN +25 NOFPEOPLE+26 MALE

125
+27 50YEARSOLD +28 HIGHSCHOOL+29 2YEARCOLLGE
+30 4YEARCOLLEGE +31 GRADUATE+32 SELFEMPLOY
+33 HOMEMAKER +34 CAUCASIAN +35 INC100KPLUS
RESULTS
Participant demographics
Of the 1,110 who met the screener criteria, a total of 972 participants completed the
survey with 942 included in the analysis based on being of legal drinking age in the U.S., which
is age 21 and older. Of these consumers, 121 resided in Delaware, 358 in New Jersey, and 493
in Pennsylvania (Table 1). In regards to demographics, survey respondents mean household size
was 2.86 persons (HSIZE) with 24.8 percent of participants indicating that they were males
(GENDER) (Table 1). Pertaining to age distribution, 29.7 percent of respondents were between
36 and 50 years of age (AGE36-50), and 40.2 percent were older than 50 (AGE>50), and the
remaining 30.1 percent were age 35 and younger. In terms of education, 27.1 percent of
respondents had graduated from high school (HSCHL_GRAD), 27 percent completed a two-year
college degree (2Y_COLLEGE), and 45.4 percent completed either a four year college or
graduate degree (4Y_COLLEGE). Slightly over half, 54.5 percent, of respondents were
employed by others (EMP_OTH). Over half of participants reported having incomes of $60K
and greater: 18.8 percent between $60K and $80K (INC60-80K), 13.2 percent between $80K
and $100k (INC80-100K) and 18.8 percent over $100k (INC>100K). No priori expectations
were made towards behavioral and demographic variables.

126
Table 1: Participant responses (frequency and percentages) to demographic (e.g. gender,
educational level, geographic (e.g. state of residence), and behavioral questions (wine
tasting participation).
Demographic characteristics Frequency Percentage
Female 708 75.2
Male 233 24.8
Participants’ age range
21 to 35 years 292 30.0
35 to 50 years 289 29.7
51 to 65 years 318 32.7
Over 65 years of age 73 7.5
Education level
Less than a high school education 5 0.5
High school graduate 263 27.1
Two year college degree 262 27.0
Four year college degree or graduate
degree
440 45.4
2009 Household income level
Less than $20,000 75 7.8
$20,000 to $39,999 185 19.1
$40,000 to $59,999 215 22.2
$60,000 to $79,999 182 18.8
$80,000 to $99,999 128 13.2
$100,000 or more 182 18.8
Household size
Single adult household 134 13.8
Two individuals 335 34.5
Three or more individuals 501 51.7
Number of children in the household
No children 576 59.5
One child 188 19.4
Two or more children 204 21.1
Employment
Retired 133 14.7
Self-employed 72 8.0
Employed by others 493 54.5
Homemaker 161 17.8
Student 45 5.0
State of residence
Delaware 121 12.4

127
New Jersey 358 36.8
Pennsylvania 493 50.7
Community
Urban 105 10.8
Suburban 668 68.8
Rural 198 20.4
Number of years at current residence
Less than one year 59 6.1
One to three years 148 15.3
Four to five years 113 11.7
Six to 10 years 192 19.9
11 to 20 years 198 20.5
More than 21 years 257 26.6
Has participated in a wine tasting activity 361 38.2
Over one-third (38.2 percent) of respondents had participated in an on-farm wine tasting
activity (Table 1). Participants were also asked to indicate what other direct marketing and
agritrourism activities they participated (Table 2). The activities that were selected by more than
half of participants included: Nature walk (53.6 percent selecting this activity), visit a Pick-Your-
Own farm (62.2 percent), participant in hay rides (67.1 percent) and travel to on-farm markets to
purchase fruits, vegetables, meat, and other farm products (67.1 percent). Activities that were
selected by less than a quarter of participants included: On-farm camping (7.2 percent), nature
retreat (11.3 percent), on-farm concerts (12.7 percent), farm produce tasting (22.1 percent), and
farm tour (24.9 percent).
Table 2: Other agritourism activities wine tasting room visitors (n = 362) reported participating.
Agritourism activity Frequency Percentage
On-farm camping 26 7.2
Nature retreat 41 11.3
On-farm concerts 46 12.7
Farm produce tasting 80 22.1
Farm tour 90 24.9
Fishing 95 26.2

128
School field trip to a farm 109 30.1
Bed and breakfast 110 30.4
Horseback riding 117 32.3
Agricultural fairs/festivals 161 44.5
Visit a plant nursery to purchase ornamental plants 170 47.0
Corn maze 174 48.1
Halloween activities at a farm 174 48.1
Visit farm animals 177 48.9
Nature walk 194 53.6
Pick-your-own farm 225 62.2
Hay rides 243 67.1
On-farm market to purchase fruits, vegetables, meat,
and other farm products
243 67.1
On average, each respondent visited an agritourism site 2.97 times per year (VISITS) and
traveled approximately 19.81 miles one-way (DISTANCE) to reach an agritourism site (Table
3). Specific to wine tasting activities, results indicated that 37.2 percent of respondents had
previously participated in wine tasting activity (WINE_TST) as a part of an agritourism visit.
Among survey respondents, 10.8 percent and 20.4 percent lived in urban (URBAN) and rural
(RURAL) areas, respectively. Approximately 19.9 percent of respondents lived at their current
residence between six and 10 years (LIVE_6TO10), whereas, 47.1 percent lived at their
residence for more than 10 years (LIVE_GT10). When respondents were asked if they were
willing to pay a higher price for products and attend events or activities if the money was used to
help preserve farmland and local agricultural producers, 66.9 percent responded positively
(WTP_PRESERVE).

129
Table 3: Description of Explanatory Variables
Variable Description
Mean
Units/
Percentage
Standard
Deviation
Units/
percentage
WINE_TST 1 if respondent participated in wine tasting
agritourism activity; 0=otherwise 0.37 0.48
FVEXPMONTH Fruits and vegetable expenditure per month 56.13 50.98
MILESPYO Average miles traveled to a Pick-Your-Own
operation 9.90 10.62
MILESFMKT Average miles traveled to a farmers’ market 6.94 6.37
MILESOFMKT Average miles traveled to an on-farm market 8.07 8.02
MILESCSA Average miles traveled to a Community
Supported Agriculture location 2.15 4.63
BILLBOARD_RSAD
V
1 if the respondent learned through billboard
and roadside sign advertisements; 0=otherwise 0.38 0.49
NEWSPAPERADV 1 if the respondent learned through newspaper
advertisements; 0=otherwise 0.53 0.50
NOFVISITS Number of times an agritourism operation was
visited in a year 2.97 2.42
EXPAGRITOURISM Average amount spent at an agritourism site in
a year 33.93 24.12
NOFLOCATIONS Number of agritourism locations visited in a
year 2.18 1.31
MILES
AGRITOURISM
Average miles traveled to an agritourism
location 19.81 16.55
QUALITY
1 if the respondent thought that the quality of
produce was better at direct markets than
supermarkets; 0=otherwise 0.90 0.30
VARIETY
1 if the respondent thought that the variety of
produce was better at direct markets than
supermarkets; 0=otherwise 0.58 0.49
PRICE
1 if the respondent thought that the price of
produce was better at direct markets than
supermarkets; 0=otherwise 0.61 0.49
WTBLOCAL 1 if the respondent was willing to buy locally
grown produce at direct markets; 0=otherwise 0.97 0.18
WTBORGANIC 1 if the respondent was willing to buy organic 0.67 0.47

130
produce at direct markets; 0=otherwise
WTBGM
1 if the respondent was willing to buy
genetically modified produce at direct markets;
0=otherwise 0.16 0.37
SAMEDAY 1 if the respondent made agritourism visitation
decisions on the day of the event; 0=otherwise 0.15 0.35
SAMELOCATION 1 if the respondent visited the same agritourism
locations every year; 0=otherwise 0.83 0.38
10YEARSLIVE 1 if the respondent lived in their current
location for more than 10 years; 0=otherwise 0.47 0.50
GARDEN 1 if the respondent had a vegetable garden at
home; 0=otherwise 0.48 0.50
WTPPRESERVE
1 if the respondent was willing to pay more to
attend agritourism events to preserve farmland;
0=otherwise 0.67 0.47
URABN 1 if the respondent lived in an urban location;
0=otherwise 0.11 0.31
SUBURBAN 1 if the respondent lived in a suburban
location; 0=otherwise 0.69 0.46
NOFPEOPLE Number of people in the household 2.86 1.38
MALE 1 if the respondent was a male; 0=otherwise 0.25 0.43
50YEARSOLD 1 if the respondent was more than 50 years old;
0=otherwise 0.40 0.49
HIGHSCHOOL 1 if the respondent is a high school graduate;
0=otherwise 0.27 0.44
2YEARCOLLGE 1 if the respondent had a two-year college
education; 0=otherwise 0.27 0.44
4YEARCOLLEGE 1 if the respondent had a four-year college
education; 0=otherwise 0.29 0.46
GRADUATE 1 if the respondent had a graduate degree;
0=otherwise 0.16 0.37
SELFEMPLOY 1 if the respondent was self-employed;
0=otherwise 0.08 0.27
HOMEMAKER 1 if the respondent was a homemaker;
0=otherwise 0.18 0.38
CAUCASIAN 1 if the respondent was Caucasian;
0=otherwise 0.89 0.31
INC100KPLUS 1 if the respondent made more than 100K per
year; 0=otherwise 0.19 0.39

131
The logistic regression model results are presented in Table 4 and 5. In the process of model
prediction, the explanatory variables were subsequently dropped or added in an attempt to
increase the number of significant variables and the goodness of fit. At the same time, to
minimize error relating to omission of relevant variables, although some variables were not
significant, they were left in the model. The maximum likelihood results as well as prediction
success rates are presented in Table 4 and the coefficients, t-ratio and change in marginal
probabilities are shown in Table 5. Except FVEXPMONTH, MILESPYO, MILESFMKT,
MILESOFMKT, MILESCSA, NOFVISITS, EXPAGRITOURISM, NOFLOCATIONS,
MILESAGRITOURISM, and NOFPEOPLE, all other explanatory variables included in the
logit model are binary dummy variables generated from categorical questions of the survey.
Significance of the independent variables were tested at 1 percent, 5 percent, and 10 percent
levels and are marked with stars, as noted in Table 5. The goodness of fit for the model is
shown by McFadden’s R2 of 0.06. R2 Values are not high for cross sectional data (Kennedy,
1992; Nayga and Capps, 1994; Kementa, 1971). Approximately 66 percent of survey
respondents were correctly classified as respondents who participated in wine tasting, an
agritourism activity.

132
Table 4: Logit Model Predictive Accuracy
Actual
Value
Predicted Correct
Total
0 1
0 552(57%) 58 (6%) 610 (63%)
1 276 (28%) 86 (9%) 362 (37%)
Total 828(85%) 144 (15%) 972 (100.00%)
Number of correct predictions: 638
Percentage of correct predictions: 77%
McFadden R2: 0.06
Chi squared: 75.28
Degrees of freedom: 35
Overall Model Significance: 0.00

133
Table 5: Respondents Agritourism Participation in Wine Tasting: Logit Model Estimates
Variable Coefficient Standard
Error
t-ratio Probability Marginal
Change
Constant -0.9394 0.4686 -2.0050 0.0450
FVEXPMONTH 0.0009 0.0007 1.3390 0.1807
MILESPYO .32D-04 0.0004 0.0930 0.9261
MILESFMKT 0.0004 0.0004 1.0080 0.3136
MILESOFMKT* -0.0005 0.0003 -1.6340 0.1022 -0.0001
MILESCSA 0.0002 0.0003 0.6510 0.5148
BILLBOARD_RSADV* -0.2132 0.1159 -1.8390 0.0659 -0.0517
NEWSPAPERADV* 0.2133 0.1159 1.8400 0.0658 0.0517
NOFVISITS -0.0003 0.0004 -0.6960 0.4866
EXPAGRITOURISM -0.0004 0.0004 -1.0460 0.2956
NOFLOCATIONS* -0.0007 0.0004 -1.7770 0.0755 -0.0002
MILESAGRITOURISM* 0.0009 0.0005 1.8060 0.0710 0.0002
QUALITY 0.3907 0.2698 1.4480 0.1476
VARIETY* 0.2668 0.1530 1.7440 0.0812 0.0646
PRICE** 0.3022 0.1530 1.9750 0.0483 0.0732
WTBLOCAL -0.3098 0.3944 -0.7850 0.4322
WTBORGANIC -0.0010 0.0008 -1.3190 0.1870
WTBGM 0.0001 0.0008 0.1300 0.8966
SAMEDAY 0.0006 0.0010 0.6050 0.5449
SAMELOCATION -0.0002 0.0011 -0.1580 0.8742
10YEARSLIVE .37D-04 0.0010 0.0380 0.9693
GARDEN -0.0013 0.0009 -1.3980 0.1622
WTPPRESERVE 0.0400 0.1543 0.2590 0.7953
URABN** -0.5575 0.2790 -1.9980 0.0457 -0.1351
SUBURBAN -0.2155 0.1773 -1.2150 0.2243
NOFPEOPLE 0.0033 0.0049 0.6820 0.4951
MALE 0.0002 0.0004 0.4810 0.6307
50YEARSOLD** 0.3452 0.1455 2.3730 0.0177 0.0839
HIGHSCHOOL** -0.2318 0.1230 -1.8850 0.0594 -0.0562
2YEARCOLLGE** -0.2397 0.1208 -1.9840 0.0472 -0.0581
4YEARCOLLEGE 0.1656 0.1164 1.4220 0.1550
GRADUATE** 0.3057 0.1430 2.1380 0.0325 0.0741
SELFEMPLOY** 0.3143 0.1478 2.1270 0.0334 0.0762
HOMEMAKER** -0.3142 0.1478 -2.1260 0.0335 -0.0761
CAUCASIAN 0.0007 0.0006 1.2380 0.2158
INC100KPLUS 0.0010 0.0012 0.8630 0.3884
*** Significant at 1%; **Significant at 5%; * Significant at 10%

134
As can be seen in Table 5, of the 35 explanatory variables used in the logit model, 14 were
significant. Among significant variables, seven positively contribute towards on-farm wine
tasting activity and seven negatively impact wine tasting activities. Explanatory variables can
be broadly classified under three categories, namely, behavioral attributes, preference attributes
and demographic attributes.
Behavioral Attributes
Eleven explanatory variables can be grouped under behavioral attributes classification. They
are fruit and vegetable expenditure per month (FVEXPMONTH), average miles traveled to a
Pick_Your_Own operation (MILESPYO), average miles traveled to a farmers’ market
(MILESFMKT), average miles traveled to an on-farm market (MILESOFMKT), average miles
traveled to a community supported agriculture location (MILESCSA), those who learn about
agritourism through billboards and roadside sign advertisements (BILLBOARD_RSADV),
those who learn about agritourism through newspaper advertisement (NEWSPAPERADV),
number of visits to an agritourism location per year (NOFVISITS), average amount spent at an
agritourism location per year (EXPAGRITOURISM), number of agritourism locations visited
in a year (NOFLOCATIONS), and average miles traveled to an agritourism location
(MILESAGRITOURISM).
Among these 11variables, five significantly contributed towards willingness to participate in
on-farm wine tasting activities. Those who learn about agritourism events through newspapers
and the number of miles traveled to an agritourism location positively contributed towards
likelihood of participating in on-farm wine tasting event. Miles traveled to on-farm market,
learning about agritourism thorough billboards and roadside signs, and number of agritourism

135
locations visited in a year negatively contributed towards likelihood of participating in a wine
tasting agritourism event. Although the variables miles traveled to on-farm market, number of
agritourism locations visited per year and miles traveled to an agritourism location significantly
influenced likelihood of participating in a wine tasting event, the magnitude of marginal change
was small. Those who learned about agritourism through billboards and roadside signs were 5
percent less likely to participate in a wine tasting agritourism event compared to those who
learned through other advertisements.
Preference Attributes
Explanatory variables that come under preference attributes were those who thought that the
quality of the produce was better at direct markets than supermarkets (QUALITY), those who
thought that the variety of produce was better at direct markets than at supermarkets
(VARIETY), those who thought that the price of produce was better at direct markets than at
supermarkets (PRICE), those who were willing to buy locally grown produce at direct markets
(WTBLOCAL), those who were willing to buy organic produce at direct markets
(WTBORGANIC), those who were willing to buy genetically modified produce at direct
markets (WTBGM), those who made agritourism visitation decisions on the day of the event
(SAMEDAY), those who visited the same agritourism location every year
(SAMELOCATION), those who lived in their current location for more than 10 years
(10YEARSLIVE), those who had a garden at home (GARDEN), and those who were willing to
pay more for agritourism events to preserve farmland (WTPPRESERVE).
Among the 11 explanatory variables that come under preference attributes, two significantly
influenced willingness to participate in a wine tasting agritourism event. Those who thought

136
that the variety of produce was better at direct markets than at supermarkets were 6.5 percent
more likely to participate in a wine tasting agritourism event compared to those who thought
otherwise. Similarly, those who thought that the price of produce at direct markets was better
than at supermarkets were 7.3 percent more likely to participate in a wine tasting agritourism
event compare to those who thought otherwise.
Demographic Attributes
Thirteen explanatory variables, namely, those who lived in an urban location (URBAN), were
male (MALE), were more than 50 years old (50YEARSOLD), had a high school education
(HIGHSCHOOL), those with a two-year college education (2YEARCOLLEGE), a four-year
college education (4YEARCOLLEGE), had a graduate degree (GRADUATE), were self-
employed (SELFEMPLOY), those who are homemakers (HOMEMAKERS), Caucasians
(CAUCASIAN), and those who earned more than S100,000 per year (INC100KPLUS) were
classified under demographic attributes.
Among these 13 variables, seven significantly influenced willingness to participate in a wine
tasting agritourism event. Three variables: 50YEARSOLD, GRADUATE, and SELFEMPLOY
positively influenced participation. On the other hand, four variables: URBAN,
HIGHSCHOOL, 2YEARCOLLEGE, and HOMEMAKER negatively contributed towards
willingness to participate in a wine tasting event. In particular, those who lived in urban areas
were 13.5 percent less likely to participate in on-farm wine tasting events compared to those
who lived in rural areas.
On the other hand, variables 50YEARSOLD, GRADUATE, and SELFEMPLOY positively
contributed towards participation in a wine tasting agritourism event. Specifically, those who

137
were older than 50 years were 8.4 percent more likely to participate in a wine tasting event.
Older consumers may have the money to spend at an agritourism event as well as the time
available to attend, compared to younger generations. Similarly, college graduates were 7.4
percent more likely to participate in a wine tasting event compared to those who have an
elementary or no education. Self-employed persons were also 7.6 percent more likely to
participate in a wine tasting event compared to retired participants, students and those who were
employed by others.
CONCLUSIONS
According to The Lang Research Inc. (2001) survey index, 12.9 percent of adult Canadians and
17.9 percent of adult Americans had a high level of interest in wine and cuisine related travel,
while an additional 17.2 percent of Canadians and 17.2 percent of Americans had moderate
interest. As the percentage of consumers who consume wine increases so might the percentage
of those who have an interest in participating in an on-farm wine tasting activity. Therefore, it
is imperative to investigate consumer behaviors and attitudes pertaining to this agritourism
activity to help farmers understand if they should and how they could incorporate this activity
into their business model.
This study was conducted to explore consumer participation in wine tasting activity based on
participants’ behavioral and demographic characteristics. Survey results indicated that 38.4
percent of respondents participated in on-farm wine tasting activities. Based on the logit model,
farmers, marketers, and others involved in planning on-farm wine tasting events and activities
should further investigate what appeals to and could attract individuals who were more likely to
participate in this activity: those who learn about agritourism events through newspapers, those

138
who travel more miles to visit an agritourism activity, those who think that the variety of
produce is better at direct markets than supermarkets, those who think that the price of produce
at direct markets is better than supermarkets, consumers older than 50 years, college graduates,
and self-employed individuals.
Quite a bit can be learned from both what positively and negatively influences likelihood to
participate in an on-farm wine tasting activity. How consumers learn about or become aware of
wine tastings and the wineries location, hours of the event, or related leisure activities is
important. Based on this study, participants who learned about a wine tasting event through
billboards and roadside stands were likes likely to participate. While billboards are often
positioned along interstate roads it may be possible that due to speed limits or traffic that survey
participants took less notice of these advertisements. Pertaining to roadside signs, these signs
are typically located at the farm and therefore only seen by those who drive by the actual farm.
On the other hand, those who learned about the agritourism through newspapers were 5 percent
more likely to participate in an agritourism event.
In a densely populated state, like New Jersey, many consumers commute hours to work which
reduces time to participate in leisure activities. As a result, participants who lived in urban
areas, who may consider time as being a scarce commodity, were less likely to participate
possibly due to being required to travel distances to attend.
Participants who had a high school education and those who had a two-year college education
were less likely to have participated in wine tasting agritourism event compared to those who
had less than high school education. College educated consumers may have an income level
that allows them to spend money on agritourism activities compared to those who have less than

139
high school education, if these individuals have a lower level of income. Their counterparts,
who might be more price conscious consumers, often look for less expensive entertainment and
on-farm wine tasting activities, where a price is charged for samples, may not offer such
opportunities.
While participants who were older than 50 years of age and were self-employed were more
likely to participate. Perhaps participants older than 50 years are more established in their
careers, than their younger counter parts, and could quite possibly have a higher level of
income. Those who are self-employed may have flexible schedules that can be rearranged to
attend leisure activities. While retirees may also have flexibility in scheduling time
commitments, if they are on a fixed income they may not have the income that allows them to
participate in an on-farm wine tasting.
Results can help local winery tasting facilities and agritourism operators enhance their on farm
profitability and offer programs and activities that best appeal to these audiences. There are;
however, a few limitations to data presented: 1) whether profiles and behaviors of winery
tasting room visitors in other regions of the U.S. mimics what was discovered in this study and
2) the use of an Internet survey might result in some selection bias. According to the Pew
Internet & American Life Project (2013); however, 81% of U.S. consumers age 18 and older
have Internet access.
Further research into the demographic profiles and consumer behavioral characteristics and
their perceptions towards the complete wine tasting experience will benefit the entire
agritourism industry and provide farmers with ideas on how to enhance marketing efforts and
develop profitable on-farm agricultural activities. As with research conducted by Tassiopoulos

140
et al. (2004) who studied attitudes and behaviors of survey participants who visited wine
regions in South Africa, this study also “provides critical information” in that little, if any,
information is available that describes the wine tourist in Delaware, New Jersey, and
Pennsylvania.
Additional studies should be conducted to continue investigating what promotions, including
social media or efforts initiated by the winery itself, appeal to wine tourists and what specific
wine tasting activities and complementary activities should be offered to encourage wine
consumers to travel to the farm for this activity. Other possible research studies could
investigate likelihood to participate in an event at eastern U.S. wineries based on wine
knowledge, as has been reported by researchers mentioned in the literature review. As data
collection pertaining to understanding needs and wants of wine consumers who reside in
Delaware, New Jersey, and Pennsylvania, as well as surrounding states, is in its infancy there is
a great deal of information to collect, analyze, and disseminate to stakeholders.
REFERENCES
Bernardo, D., L. Valentin, and Leatherman, J. (2004), “Agritourism: If we build it, will they
come?,” paper presented at the 2004 Risk and Profit Conference, 19-20 Augusts,
Manhattan, KS, pp. 16.
Brieser Stout, C. (2007), “A chance to deal with rural disconnect.” Prairie Farmer, available at:
www.magissues.farmprogress.com/PRA/PF08Aug07/pra013.pdf (accessed 28 February 2013).
Brown, D. M. and Reeder, R. J. (2007), “Farm based recreation: A statistical profile.” Economic
Research Service, United States Department of Agriculture, No. 53.
Bussewitz, C. (2012), Sonoma County tourism officials unveil new wine-themed ad campaign.
McClatchy-Tribune Business News, available at:
http://search.proquest.com/docview/1033630192?accountid=13158 (accessed 28 March 2013).

141
Carpio, C.E., Wohlgenant, M.K., and Boonsaeng, T. (2008), “The demand for agritourism in the
United States.” Journal of Agricultural and Resource Economics, Vol. 33 No. 2, pp. 254-269.
Charters, S. and Ali-Knight, J. (2002), “Who is the wine tourist?,” Tourism Management, Vol.
23 No. 3, pp. 311-319.
Che, D., Veeck, G., Veeck, A., and Lemberg, D. (n.d.), “Michigan agritourism: Strengthening
Michigan’s agriculture and tourism industries,” available at:
www.ams.usda.gov/AMSv1.0/getfile?dDocName=STELPRD3248005 (accessed 28
February 2013).
Cohen, E. and Ben-nun, L. (2009), “The important dimensions of wine tourism experience from
potential visitors' perception.” Tourism and Hospitality Research, Vol. 9 No. 1, pp. 20-31.
Collins, R. (2006), “NY wine trails are pathways to dollars.” Wines & Vines, pp. 49-51
http://www.winesandvines.com/template.cfm?section=features&content=49226&ftitle=N
Y%20Wine%20Trails%20Are%20Pathways%20To%20Dollars Sept 2006.
Dodd, T. (1995), “Opportunities and pitfalls of tourism in a developing wine industry.”
International Journal of Wine Marketing, Vol. 7 No. 1, pp. 5-16.
Dombrosky, J. and Gajanan., S. (2013), “Pennsylvania wine Industry – An assessment.” The Center
for Rural Pennsylvania, available at:
http://www.rural.palegislature.us/documents/reports/pa_wine_industry_2013.pdf (accessed 28
March 2013).
Fisher, D. (2011), “U.S. wineries grow 9% to 6,785.” Wine Business Monthly, Vol. 18 No. 2, pp. 70-37.
Gold, M. and Thompson, R.S. (2011), “List of alternative crops and enterprises for small farm
diversification.” Alternative Farming Systems Information Center, available at:
www.nal.usda.gov/afsic/pubs/altlist.pdf (accessed 28 February 2013).
Govindasamy, R., Italia, J. and Adelaja, A. (2002), “Farmers’ markets: Consumer trends,
preferences, and characteristics.” Journal of Extension, Vol. 40, available at:
www.joe.org/joe/2002february/rb6.php (accessed 2 March 2011).
Govindasamy, R., Hossain F., and Adelaja, A. (1999), “Income of farmers who use direct
marketing.” Agricultural and Resource Economics Review, Vol. 28, pp. 76-83.
Gujarati, D. N. (1992), Essentials of Econometrics. 2nd ed. McGraw Hill, New York, NY.

142
Hall, D., Mitchell, M. and Roberts, L. (2003), “Tourism and the Countryside: Dynamic
Relationships,” in D. Hall, Roberts, L. and Mitchell, M. (Eds.), New Directions in Rural
Tourism, Ashgate Publishing Company, Burlington, VT, pp. 3-15.
Hall, C. M., Sharples, L., Cambourne, B., and Macionis, N. (Eds.) (2000), Wine Tourism Around
the World: Development, Management and Markets. 1st ed. Elsevier, Ltd, Oxford, United
Kingdom.
Hall, C. M., and Mitchell, R. (2000), “Wine tourism in the Mediterranean: A tool for restructuring
and development.” Thunderbird International Business Review, Vol. 42 No. 4, pp. 445-465.
Tubene, S. and Hanson, J. (2002), The wholesale produce auction: An alternative marketing
strategy for small farms.” American Journal of Alternative Agriculture, Vol. 17 No. 1,
pp. 18-23.
Henderson, P.L. and Linstrom, H.R. (1982), “Farmer to consumer direct marketing: Selected
States, 1979-80.” Statistical Bulletin No. 681, ERS-USDA, February.
Hodgen, D.A. (2011), “U.S. wine industry – 2011.” U.S. Department of Commerce, available at:
www.ita.doc.gov/td/ocg/wine2011.pdf (accessed 12 January 2012).
Hoppe, R.A. and Banker, D.E. (2010), “Structure and Finances of U.S. Famers: Family Farm
Report, 2010 Edition.” U.S. Department of Agriculture Economic Resource Service,
EIB-66, available at: www.ers.usda.gov/media/184479/eib66_1_.pdf (accessed 28
February 2013).
Houghton, M. (2008), “Classifying wine festival customers.” International Journal of Culture,
Tourism and Hospitality Research, Vol. 2 No. 1, pp. 67-76.
Insel, B. (2009), “Understanding wine demographics in a down market.” Wine Business Monthly, Vol. 16
No. 3, available at: http://www.winebusiness.com/wbm/?go=getArticle&dataId=62896 (accessed
28 February 2013).
Kneafsey, M. (2000), “Tourism, place identities and social relations in the European rural
periphery.” European Urban and Regional Studies, Vol. 7 No. 1, pp. 35-50.
Kmenta, J. (1971), Elements of Econometrics. Macmillian Pub. Co., New York, NY.
Kennedy, P. (1998), A Guide to Econometrics, 4th ed., The MIT Press. Cambridge, MA.

143
Lang Research Inc. (2001), “Travel Activities and Motivation Survey: wine and culinary.”
Ontario Ministry of Tourism, Culture, and Sport, Toronto, Canada, available at:
www.tourism.gov.on.ca/english/tourdiv/tams (accessed 2 March 2011).
Linstrom, H.R. (1978), “Farmer to consumer marketing.” Economics, Statistics, and Cooperative
Service, U.S. Department of Agriculture, ESCS-01, February.
Mackun, P. and Wilson, S. (2011), “2010 Census Briefs. Population distribution and change:
2000 to 2010.” U.S. Department of Commerce, Economics and Statistics Administration,
available at: http://www.census.gov/prod/cen2010/briefs/c2010br-01.pdf (retrieved 11
January 2012).
Marzo‐Navarro, M. and Pedraja‐Iglesias, M. (2009), “Profile of a wine tourist and the
correspondence between destination and preferred wine: A study in Aragon, Spain,”
Journal of Travel & Tourism Marketing, Vol. 26 No. 7, pp. 670-687.
MKF Research LLC (2007). The impact of wine, grapes and grape products on the American
economy 2007: Family business building value. MKF Research LLC., available at:
http://www.wineinstitute.org/files/mfk_us_econ_report07.pdf (accessed 29 March 2013).
Nayga, Jr., R.M. and Capps, Jr., O. (1994), “Tests of weak separability in disaggregated meat
products,” American Journal of Agricultural Economics, Vol. 76, pp. 800-808.
National Agricultural Statistical Service. (2004), “Vermont agri-tourism 2002.” New England
Agricultural Statistics Service, United States Department of Agriculture (USDA), pp. 1.
National Agricultural Statistical Service. (2007), “2007 Census of Agriculture,” United States Department
of Agriculture (USDA), available at: http://www.agcensus.usda.gov/Publications/2007
/Online_Highlights/Fact_Sheets/agricultur al_diversification.pdf (accessed 2 March 2011).
National Agricultural Statistical Service. (2012), “Table 8. Farms, land in farms, value of land
buildings, and land use: 2007 and 2002,” United States Department of Agriculture
(USDA), available at: http://www.agcensus.usda.gov/Publications/2007
/Full_Report/Volume _1,_Chapter_2_US_State_Level/st99_2_008_008.pdf (accessed 28
February 2013).
National Survey on Recreation and the Environment (NSRE). (2000-2002), “The Interagency
National Survey Consortium, Coordinated by the USDA Forest Service, Recreation,
Wilderness, and Demographics Trends Research Group during 2000-2002,” Athens,

144
Georgia, and the Human Dimensions Research Laboratory, University of Tennessee,
Knoxville, Tennessee.
Peters, G. (1997), American Winescapes: The Cultural Landscapes of America’s Wine Country.
Westview Press. Boulder, CO.
Pew Internet & American Life Project. (2013). “Demographics of internet users,” Pew Research
Center, available at: www.pewinternet.org/Static-Pages/Trend-Data-(Adults)/Whos-
Online.aspx (accessed 1 March 2013).
Pindyck, R. and Rubinfeld, D. (1991), Econometric Models and Economic Forecasts. 3rd ed.,
McGraw- Hill Inc. New York, NY.
Ryan, S., DeBord, K., and McClellan, K. (2006), “Agritourism in Pennsylvania: An industry
assessment,” The Center for Rural Pennsylvania, available at:
http://www.rural.palegislature.us/agritourism2006.pdf (accessed 2 March 2011).
Schilling, B., Sullivan, K. P., and Marxen, L. J. (2006), “The economic impact of agritourism in
New Jersey: A 2006 Assessment,” New Jersey Agricultural Experiment Station, available
at: http://www.foodpolicyinstitute.org/docs/pubs/Econ_Impact_AT_NJ_2006.pdf
(accessed 2 March 2011).
Small Farm Center, (1999), “Agritourism and Nature Tourism in California,” University of
California, Davis, CA, pp. 339.
Skinner, A. (2000), “Napa Valley, California: A model of wine region development,” in Hall,
M., Sharples, L., Cambourne, B., and Macionis, N. (Eds.), Wine tourism around the
world (pp.283–296). Oxford: Butterworth-Heinemann.
Tavernier, E.M., Adelaja, A. O., and Harley, M. P. (1996), “Agritourism as an income based
strategy for farm operators.” Journal of American Society for Farm Managers and Rural
Appraiser, Vol. 60 No. 1, pp. 52-59.
Thessen, G. (2007), “Measuring the economic impact of agritourism on farms,” National
Agricultural Statistics Service, United States Department of Agriculture (USDA),
available at: www.agmrc.org/media/cms/Agritourism_Thessen_A812A9AE31310.pdf
(accessed 2 March 2011).
Tubene, S. and Hanson, J. (2002), “The wholesale produce auction: An alternative marketing
strategy for small farms,” American Journal of Alternative Agriculture, Vol. 17 No. 1,

145
available at: http://faculty.arec.umd.edu/jhanson/Wholesale%20produce%20auction,
%20small%20farms.pdf (accessed 2 March 2011).
U.S. Census Bureau. (n.d.), “Percent urban and rural in 2010 by state.” U.S. Department of
Commerce, available at: www.census.gov/geo/reference/urban-rural-2010.html (accessed
28 February 2013).
U.S. Census Bureau. (2005), “Table 1: Interim projections: Ranking of Census 2000 and
projected 2030 state population and change: 2000 to 2030.” U.S. Department of
Commerce, available at: www.census.gov/population/projections/data/state/
projectionsagesex.thml (accessed 11 January 2012).
Wicks, B.E. and Merrett, C.D. (2003), “Agritourism; An economic opportunities for Illinois.”
Illinois Institute for Rural Affairs, Vol. 14 No. 9, pp. 1-8.
Wine Intelligence LTD. (2011), “Introducing the global wine market evaluation model,” Wine
Intelligence LTD, available at: http://www.wineintelligence.com/wp-
content/uploads/White-Paper-Global-wine-market-evaluation-model.pdf (accessed 12
January 2012).
Wine Market Council. (n.d.), “Wine Market Council’s 2010 consumer tracking study: Consumer
research data slide set,” available at: http://www.winemarketcouncil.com/research_
slideview.asp?position=1 (accessed 11 January 2012).

146
Appendix-4
FSMIP Direct Marketing and Agritourism Consumer Survey
1. Did you purchase any fruits and/or vegetables at any of the following locations
(Please select all that apply)?
1. Pick your own 2. Community Farmers Markets
3. On Farm Market 4. Community Supported Agriculture (CSA)
Farmers Market Definition: Farmers' markets are common facilities or areas where
several farmers gather on a regular basis to sell various fresh, fruit, vegetables,
meat and other on farm products directly to consumers.
Community Support Agriculture: Consists of a community of individuals who pledge
support to a farm operation where the growers and consumers share the risks and
benefits of food production. CSAs usually consist of a system of weekly delivery or
pick-up of vegetables and fruit in a vegetable box scheme, sometimes including dairy
products and meat.
On-Farm Market: A market or a retail outlet on the farm.
2. Please indicate the following reasons for not participating at any of the above types of direct markets.
Reasons
1. Did not know about them 2. Too far away/ inconvenient
3. Too expensive 4. Not of interest
5. Activities not appropriate for me and or those who accompany me.
6. Other _______________________
Agritourism: Any agriculturally-based operation or educational experience such as
pick-your own, farm animals, hay rides, farm touring, on-farm camping, wine tasting,
agricultural fairs/festivals, school field trip etc. that brings visitors to a farm or
ranch.
3. Please indicate if you have been to or participated in any of the following agritourism activities.
a) Bed and Breakfast 1.Yes 2.No
b) On-farm camping 1.Yes 2.No
c) Nature Retreat 1.Yes 2.No
d) Hay rides 1.Yes 2.No
e) Corn maze 1.Yes 2.No
f) Nature walk 1.Yes 2.No
g) Horseback riding 1.Yes 2.No
h) Pick-your-own 1.Yes 2.No
i) Fishing 1.Yes 2.No
j) On-farm concerts 1.Yes 2.No
k) Wine tasting 1.Yes 2.No
l) Farm produce tasting 1.Yes 2.No
m) Farm tour 1.Yes 2.No
n) School field trip 1.Yes 2.No
o) Farm Animals 1.Yes 2.No
p) Halloween activities 1.Yes 2.No
q) On farm market 1.Yes 2.No
r) Agricultural fairs/festivals 1.Yes 2.No
s) Visiting Nursery for Ornamental plants 1.Yes 2.No
t) Other (please list)________________________________

147
4. Please indicate if you have any reasons for not participating in agritourism activities/farm visits.(please check all that apply)
1. Did not know about them 2. Too far away/ inconvenient
3. Too expensive 4. Not of interest
5. Activities not appropriate for me and or those who accompany me.
6. Other _______________________
Direct Marketing
5. In general, in the past five years (2005 to 2009), has your family consumption of fresh fruits and/or vegetables in your household:
A. Fresh fruits B. Fresh Vegetables 1. Increased 1.Increased
2. Decreased 2.Decreased
3. Stayed the same 3.Stayed the same
6. In the past five years (2005 to 2009) has your household been consuming a wider variety of:
a) Fresh Fruits Yes No
b) Fresh Vegetables Yes No
7. Usually, how many times per month do you go to direct markets (e.g. pick-your-own, farmer’s markets, etc.)?
1. Pick your own ________ times per month
2. Community Farmers Market ________ times per month
3. On Farm Market ________ times per month
4. Community Supported Agriculture (CSA ________ times per month
1. How much did you spend on average per visit at direct market?
2. Pick your own $ ________ Amount per visit
3. Community Farmers Market $ ________ Amount per visit
4. On Farm Markets $ ________ Amount per visit
5. Community Supported Agriculture (CSA) $ ________ Amount per visit
8. On average, how many miles do you travel to the Direct Market outlet? ___________miles(Example: Community Farmers Market, On Farm Market and CSA).
9. Thinking about the direct markets, do you believe the quality, variety and price
of the produce at direct markets is different from typical American grocery stores
where you primarily shop for fruits and vegetables?
a. Quality 1 .________ better 2.______worse 3._______same b. Variety 1 .________ better 2.______worse 3._______same c. Price 1 .________ better 2.______worse 3._______same
10. What percentage of fruits and vegetables have you bought from the following outlets?
1. Pick your own ___________% 2. Farmers Markets ___________%
3. Direct Farm Markets ___________%
4. Roadside Stand ___________%
5. Community Supported Agriculture (CSA) ___________%
6. Super Markets ___________%
7. Friend’s garden ___________%
8. Own Garden ___________%
9. Other_______________ ___________% Total percentage 100%

148
11. How much do you spend on fruits and vegetables on average per month? $___________
12. How much do you spend on value added products such as bakery items, jams, honey etc. on average per month? $___________
13. Are you planning to visit local direct markets in 2010? Yes No Not
Sure
1. Pick your own ____ ____ _____ 2. Farmers Markets ____ ____ _____
3. Direct Farm Markets ____ ____ _____
4. Roadside Stand ____ ____ _____
5. Community Supported Agriculture (CSA) ____ ____ _____
6. Other ____ ____ _____
14. How did you find the information about directs markets?(Check all that apply) 1. Roadside sign 2. Newspaper 3. Passing by
4. Magazine 5. Friends/Word of mouth 6. Television
7. Radio 8. Farm advertisement (sent to home)
9. Website 9. Email 10. Blogs
11. Social media (e.g. Facebook, twitter) 12. Other: __________ please
specify
15. How would you rate the following characteristics about direct markets? Please write the appropriate number in the blanks for each characteristic and each type
of direct market. Please use following rating.
4= very good 3=good 2=fair 1=poor
PYO=Pick your own CFM=Community Farmers Markets OFM=On Farm
Market
CSA=Community Supported Agriculture
Characteristics PYO CFM OFM CSA
a. Quality of Products ____ ____ ____ ____ b. Quantity of products ____ ____ ____ ____
c. Variety of products ____ ____ ____ ____ d. Appearance of establishment ____ ____ ____ ____ e. Cleanliness of establishment ____ ____ ____ ____ f. Convenience of establishment ____ ____ ____ ____ g. Convenience of location ____ ____ ____ ____ h. Employee attitude ____ ____ ____ ____ i. Prices ____ ____ ____ ____ j. Other (Specify)__________ ____ ____ ____ ____
16. Please indicate the commodities you buy most from direct markets in a 1, 2, 3 . . . order (with 1 being bought most frequently).
Fruits: _______ Apples Vegetables: _____ Tomato _______ Squash
________Strawberries _____ Pepper _______ Cucumber
________Peaches ______Sweet Corn ________Other
________Blueberries ______Snap Beans
________Melons ______Broccoli
________Watermelon _____ Onion
________Other _____ Potato
17. Are you willing to pay more for products from direct market outlets than the comparable supermarket or conventional grocery store, and if so, what percent
more?__________percent

149
18. If made available to you, would you be “willing to buy” fruits and vegetables from direct market outlet that are: (please indicate “Yes” or “No” or “Unsure”).
Yes No Unsure
a) Locally Grown 1 2 3
b) Certified Organic 1 2 3
c) New/unfamiliar Products 1 2 3
d) Genetically Modified 1 2 3
Genetically Modified: Any possible alteration of genetic material, in agriculture
products to make them capable of producing new products or performing new functions or
increasing production.
Agritourism:
19. Please indicate if you had ever heard of any of the following terms.
a) Agritourism 1.Yes 2.No
b) Ecotourism 1.Yes 2.No
c) Green Tourism 1.Yes 2.No
20. Please indicate any purchases you have made during an agritourism activity.
a) Fresh fruits and vegetables 1.Yes 2.No
b) Processed or canned foods 1.Yes 2.No
c) Agricultural decorations/crafts 1.Yes 2.No
d) Locally produced wine 1.Yes 2.No
e) Honey products 1.Yes 2.No
f) Fresh-cut flowers 1.Yes 2.No
g) Firewood 1.Yes 2.No
h) Ornamentals 1.Yes 2.No
i) Vegetable transplants 1.Yes 2.No
j) Seasonal decorations 1.Yes 2.No
k) Pumpkins/corn stalks 1.Yes 2.No
l) Christmas Trees 1.Yes 2.No
m) Locally made value added products 1.Yes 2.No
n) Farm festival 1.Yes 2.No
21. Please indicate how many visits you made in the past year to the agritourism
locations for Agricultural entertainment/educational purpose: __________
times/year
22. If you have visited an agritourism site/farm in the past year, how much do you
typically spend each trip? $___________ /trip.
23. How many different sites/farms did you visit in the past year? _________
24. Please indicate the season in which you mostly visit a farm or agritourism site
(please check all that apply).
1. Spring (March – May) 2. Summer (June-August)
3. Fall (September-November) 4. Winter (December-February)
25. How far in advance do you typically plan an activity?
1. That day 2.One day before
3. That week 4.In advance (7 days or more)
26. Please rank the following reasons why you have or would visit an agritourism
site or farm. (1= most important, 7 = least important).
1) _____To purchase fresh fruit and vegetables.

150
2) _____To purchase value added products 3) ____ To support local farmers. 4) ____ To enjoy the rural scenery/nature. 5) ____ To spend time with family and friends. 6) ____ To learn or be taught how food is produced/grown. 7) ____ To know where my food is produced/grown. 8) ____ It is convenient and located near my home. 9) ____ Experience of a farm visit
27. On average, how many miles do you travel to participate in an agritourism
activity ________miles (one way)?
28. Do you in general return to the same agritourism/farm site to purchase products
repeatedly during the year? 1.Yes 2.No
29. I am willing to pay a higher price for products and events if it helps to
preserve farmland and local agricultural producers. 1.True 2.False 3.I
do not know
30. If you have or would consider visiting an agricultural tourism destination, how
important are the following factors:
Very Somewhat Not
Important Important Important
a) Facilities (rest rooms, picnic tables etc.) 1 2 3
b) Shops/markets 1 2 3
c) Educational experience 1 2 3
d) Scenery 1 2 3
e) Animals or petting zoo 1 2 3
f) Convenience. 1 2 3
g) Events (demonstrations, concerts etc.) 1 2 3
h) Activities (hay rides, farm tours etc.) 1 2 3
i) Restaurant 1 2 3
31. If you have visited an agritourism site or farm, how did you learn about it?
(please check all that apply).
1.Friends/word of mouth 2.School activity 3.Farm sign
4.Farm advertisement (mailed home) 5.Billboard or Road sign
6.Tourism/guide book
7.Agritourism map 8.Websites 9.E-mail
9.TV 10.Magazine 11.Newspaper
12.Radio 13.Promotional flyer 14.Blogs
15.Social media(ex.Facebook and Twitter)16.other: ____________________
Demographics:
32. Please select the best description of the community you live in.
1. Urban 2.Suburban 3.Small town 4.Rural
33. How many years have you been living at current place or residence? _____years
34. Do you believe that agriculture will help maintain open space/greenery in the
state?
1. Yes 2. No
35. Do you have a garden at your home where you grow fruits and vegetables for your
household to
consume? 1. Yes 2. No
36. Number of persons, including yourself in your household __________
151
37. Number of persons who are age 17 and younger in your household __________
38. Please indicate your gender 1. Male 2. Female
39. Please indicate your age category
1. Under 20 2. 21-35 3. 36-50 4. 51-65 5. Over 65
40. Please indicate the highest level of education you have completed.
1. No Formal Schooling 2. Elementary school 3. Up to High
school
4. 2 year college degree 5. 4 year college degree 6. Graduate
degree
41. Which of the following best describes your current occupation?
1. Retired 2. Self-employed 3. Employed by others
4. Homemaker 5. Others
42. Please indicate your ethnicity.
1. White 2. African American 3.Hispanic or Latino
4. American Indian and Alaska Native 5.Asian
6. Native Hawaiian and other Pacific 7.Others___________
43. Please indicate Annual-Income category of your household before taxes.
1. $ Less than 20,000 2. $ 20,000 - 39,999 3. $ 40,000 – 59,999
4. $ 60,000 - 79,999 5. $ 80,000 – 99,999 6. $ 100,000 or more