a decision support system for strategic …eprints.lincoln.ac.uk/28896/7/28896 a decision...
TRANSCRIPT

1
A Decision Support System for Strategic Maintenance Planning in Offshore Wind Farms
1Xiaodong Li*, 1Djamila Ouelhadj*, 1Xiang Song*, 1Dylan Jones, 1Graham Wall, 2Kerry E. Howell, 2Paul Igwe, 3Simon Martin, 4Dongping Song, 5Emmanuel Pertin
1 Centre for Operational Research and Logistics (CORL), Department of Mathematics,
University of Portsmouth, UK 2 Plymouth Business School, University of Plymouth, UK
3 Computational Heuristics Operational Research Decision Support Group, Stirling University, UK 4 Management School, Liverpool University, UK
5 Institut Superieur D’etudes Logistiques (ISEL), Le Havre University, France
This paper presents a Decision Support System (DSS) for maintenance cost optimisation at an Offshore Wind Farm (OWF). The DSS is designed for use by multiple stakeholders in the OWF sector with the overall goal of informing maintenance strategy and hence reducing overall lifecycle maintenance costs at the OWF. Two optimisation models underpin the DSS. The first is a deterministic model that is intended for use by stakeholders with access to accurate failure rate data. The second is a stochastic model that is intended for use by stakeholders who have less certainty about failure rates. Solutions of both models are presented using a UK OWF that is in construction as an example. Conclusions as to the value of failure rate data are drawn by comparing the results of the two models. Sensitivity analysis is undertaken with respect to the turbine failure rate frequency and number of turbines at the site, with near linear trends observed for both factors. Finally, overall conclusions are drawn in the context of maintenance planning in the OWF sector.
Key words: offshore wind, renewable energy, Operations and Maintenance (O&M), decision support, stochastic optimisation
* Corresponding author. Tel.: +44 (0)23 9284 6355
E-mail addresses:
[email protected] (X. Li),
[email protected] (D. Ouelhadj)
[email protected] (X. Song)

2
1. Introduction
The EU aims to achieve 20% of energy consumption from renewable sources in order to reduce carbon emissions by 2020 (Bilgili et al., 2011; Laura and Vicente, 2014). The UK government has also set the figure of 15% as the target for 2020 (O’Keeffea and Hagett, 2012; Higgins and Foley, 2014). Over the past decade, wind energy has been a significantly developing renewable energy source (Ding and Tian, 2012). According to the interviews conducted by Ochieng et al (2014), wind power is one of the few renewable technologies that demonstrate a rapid development in the past decades. It will therefore provide a major proportion of electricity production out of all the renewable sources (Freris and Infield, 2009) and make a great single contribution to the 2020 target (O’Keeffea and Hagett, 2012; Appiott et al., 2014). There are five distinct phases during the life cycle of an offshore wind farm: development and consenting, production and acquisition, installation and commissioning, operation and maintenance (O&M) and decommissioning (Myhr et al., 2014). The O&M starts when the OWF begins operating and continues until the final decommissioning stage. Although the cost of the O&M phase is generally not as large as the construction phase, it is still significant due to the length of the long-term operation during the life cycle. O&M costs are of the order of £25-40 million for a typical 500MW OWF (The Crown Estate, 2010). These kinds of cost accounts for 18% of the total offshore wind system (Carbon Trust, 2008). Hence the expenditure on O&M may be seen as a key element of the energy production costs in OWFs.
One of the challenges of performing maintenance operations in OWFs is the transport of personnel, spare parts and large components to individual wind turbines by vessels or helicopters (Halvorsen-Weare et al., 2013). Due to the expensive purchase price or charter-in rate, the use of specialised vessels or helicopters can account for a high percentage of the O&M costs. The maintenance activities for an offshore wind project need a fleet of vessels, such as component transport vessels, crew transfer vessels, crane vessels, and vessels for specialised tasks such as cable-laying (Halvorsen-Weare et al., 2013). The type of vessel or helicopter used for maintenance depends significantly on the distance from the port to the OWF (Laura and Vicente, 2014). Vessel efficiency is becoming a key factor in determining overall vessel demand, which is defined in terms of working time required for recovering different faults, taking into account weather delays.
O&M costs are not only caused by repair and replacement of components, but also by production loss due to downtime (Scheu et al., 2012). Maintenance management aims at improving the availability of the production systems and reducing the overall maintenance cost (Ding and Tian, 2012). The revenue loss can be presented by calculating the required time of planned and unplanned service and the productivity level. Minimisation of downtime strongly depends on the accessibility of the installed facilities. Maintenance of any offshore system is not an easy job because of restricted logistics and accessibility.
In order to minimise the expected costs in the lifetime of an OWF, an optimal plan for O&M should be developed in order to handle the component failure risk (Nielsen and Sorensen, 2011). The central question in developing the optimal plan is the decision of when and how to organise maintenance activities. The existing industry experiences imply that production loss might result from the lack of inspection/repair prior to component failure. A survey of offshore wind energy companies was conducted by the work of Pahlke (2007), with 70% of the respondents expressing the need for decision support tools whereas only a few of them had such models available for use (Scheu et al., 2012; Hofmann and Sperstad, 2013). The literature review presented in this paper shows that the developed decision support tools to date use mainly simulation techniques, whilst the use of mathematical optimisation modelling is limited.
The maintenance frequency affects activity demand and costs associated in the operation time of vessels and technicians, especially the corrective maintenance for component

3
breakdown. The unplanned events for repairs/replacement of failed OWF components account for a high percentage of the maintenance tasks, typically between 50-70% (Van Bussel, 1997). The maintenance practices of OWFs can be optimised with respect to the failure rates and service costs of wind turbines in the marine environment. The development of an optimised maintenance schedule for OWFs could potentially minimise the maintenance expedition costs, through the use of statistical data on offshore wind turbine failure rates (Kooijman et al., 2004).
In this paper, a Decision Support System (DSS) is developed to give multiple stakeholders in offshore wind farms a tool to assist them in making decisions to conduct cost effective maintenance in OWFs. The maintenance operations include selection of maintenance strategies for project developers, identification of the annual number of required technicians for HR managers, and the required chartered vessels for O&M planners, in order to achieve a minimum cost. Deterministic and stochastic optimisation models are proposed to optimise personnel, transport, and breakdown costs of O&M. The deterministic model is used when the failure rate is known, whilst the stochastic model is utilised in case the failure data is unknown from operational practices. The optimisation models and the solution method are integrated into the DSS to build an efficient decision tool for optimising and analysing maintenance activities. The DSS has been developed part of the 2OM (Offshore Operations & Maintenance Mutualisation) project, financed by the EU Interreg IVA France (Channel) – England programme.
The rest of the paper is organised as follows: In Section 2, an overview of existing decision support on offshore wind maintenance is presented. Sections 3 and 4 describe the DSS and the optimisation models for the strategic planning of offshore wind farm maintenance. Experimentation results and sensitivity analysis of the system are demonstrated in Section 5. Finally, some concluding remarks and suggestions for further research are provided in Section 6.
2. An overview of decision support tools for offshore wind maintenance
Computational decision tools are able to support complex decision making in the energy sector, such as the recent tools developed by Hunt et al. (2013) and Chang (2014) for the planning and coordination of renewable energy systems. A performance analysis of a renewable energy system usually underpins this kind of tool to aid decision making. Most of the developed decision support systems in the wind energy sector are specific to onshore developments and only a small number of those are suitable for offshore projects (Pahlke, 2007). The tools are more likely applicable offshore in a limited geographical area rather than a large extent such as the North Sea, which contains a large number of current and proposed wind farms from several countries (Wanderer, 2009). As O&M costs account for around one third of the life cycle cost of an offshore wind farm, there is a need to develop cost-effective O&M strategies to achieve a significant saving in the cost of energy during the life of OWFs. A number of researchers over recent years have created decision support tools for different purposes in offshore wind production, such as to forecast the operations of a wind farm (Scheu et al., 2012), to estimate the O&M costs including revenue loss (Dinwoodie et al., 2013), to assess offshore wind energy potential (Schillings et al., 2012), and to simulate the operational phase of an offshore wind farm with all maintenance activities and costs (Hofmann and Sperstad, 2013). A common objective of these tools is to find the optimal maintenance strategy/planning for a particular offshore wind farm, rather than a global strategy for multiple farms. The decision tools may calculate the maintenance cost on the basis of levelised production cost (LPC), which is seen as an efficient way for analysis and evaluation of risk and total cost during the life span of offshore turbines (Myhr et al, 2014), Dinwoodie et al. (2015) investigated the performance amongst

4
the existing simulation models of operation and maintenance for offshore wind farms; they also identified key model assumptions that impact model results. The Norwegian offshore wind cost and benefit model – NOWIcob (Hofmann and Sperstad, 2013) can simulate the operational phase of an offshore wind farm with all maintenance activities and costs. Several input parameters, both controllable options and the uncontrollable external factors, can be changed in the model to assess their impact on performance parameters such as the O&M costs and availability. Controllable options are all strategic choices that the wind farm operator can directly decide upon. Uncontrollable external factors include all parameters that are outside the direct influence of the wind farm operator such as the market environment and weather conditions. Most of the tools concentrate on the modelling of failures and repair, although these two parameters are often assumed to be deterministic. Nevertheless stochastic modelling is suggested to simulate the variability of the failure rates of wind turbine components, since a deterministic approach would not give realistic results. Discrete-event simulation is a powerful computational technique, which has been to solve problems with stochastic data (Willis and Jones, 2008). Operational research (OR) has a long tradition in improving operations and especially in reducing costs (Dekker et al., 2012). In therenewable energy sector, a range of OR approaches have been applied in production scheduling, transportation routing and maintenance supply planning. For example, Zhang et al. (2013) presented an optimisation model for scheduling power generation in a wind farm. Similar works in scheduling and capacity planning of renewable energy have been reviewed by Connolly et al. (2010) and Beerbuhl et al. (2015). OR techniques have also been used on the optimisation of offshore wind O&M. A mixed integer programming model with binary variables is usually applied to aid decision making in vessel fleet composition problems (Halvorsen-Weare et al., 2013; Hvattum and Nonas, 2013). Vessel properties and contracts should be taken into account to configure the vessel fleet with crews for execution of maintenance operations in OWFs. The most common objective function is to minimise the fixed costs of vessels and ports, variable costs using the vessels, expected downtime costs of delayed correct maintenance activities and penalty and/or transportation costs. The optimal solutions are constrained typically by a limited number of vessels, necessary time spent on a maintenance task, the locations of maintenance resources, and the sea state suitable for carrying out O&M activities.
When modelling O&M practices for OWFs, the reliability of the wind turbines is a key parameter that will affect the output of the project, i.e. energy output and cost per unit of energy produced. However, a lack of publically available offshore wind turbine failure data is a challenge in the decision making of corrective maintenance operations. A number of models have been developed to predict the revenue (Krokoszinski, 2003), or to estimate the O&M costs (Van Bussel and Bierbooms, 2003; Obdam et al., 2007) by considering the wind turbine reliability. Reliability models can be utilised to quantify the failure rates of offshore wind turbines and identify the repair time for each type of failure. The energy losses due to wind turbine failures, downtime and maintenance tasks are viewed as an element of maintenance cost. Nevertheless, a significant proportion of failure rates used in previous studies are extracted from onshore wind farm data, and the effect of the marine environment on the offshore wind turbine reliability has not been considered.
From the review of the existing decision support and optimisation models for maintenance in OWFs, there is little research on the integration of optimisation models within the decision support systems. An efficient DSS with user interface for multiple purposes is proposed in this paper, by an integration of decision aiding and optimisation models. The two versions of

5
the optimisation models, associated with deterministic and stochastic reliability parameters, are formulated on the basis of offshore wind farm O&M practices.
3. Description of the DSS for offshore wind O&M
The Decision Support System (DSS) proposed is designed to assist multiple offshore wind stakeholders for determining cost effective maintenance resources for an offshore wind farm. The system can also be used to understand sensitivities of the operation and maintenance costs due to changes in the maintenance and logistics strategy, and to provide an estimate of the maintenance cost. As shown in Figure 1, the DSS requests system and user input data. The tool then identifies the minimum cost to meet the maintenance demand on the basis of the input data. The DSS embeds two optimisation models in order to generate optimal maintenance costs on the resources required to conduct the maintenance. Finally the requirement of maintenance resources, facilities in port and training courses are given as outputs of the system.
Figure 1: Decision Support System framework
3.1 System inputs
SYSTEM INPUTS
Turbine tech spec
O&M category
Vessel compatibility
HR compatibility
USER INPUTS
Turbines in OWF
Balance of plant
OWF location
Sea state
MINIMISE O&M COSTS
Vessels Personnel Offshore base Revenue loss
OPTIMISED RESOURCES
Vessel requirement
HR requirement
EXPECTED RESOURCES
Port facilities
Training courses
6
System input data is entered into the DSS prior to users providing the information of a particular project, including the technical specification of existing wind turbines in the current market, characteristics of the pre-defined maintenance categories, and compatibility of vessels and technicians on different maintenance categories. The wind turbine specification is imported from the 4cOffshore website (http://4cOffshore.com). Categorisation of maintenance activities and compatibility of vessels and technicians are underpinned by the practical data collected from a wide range of experts in the offshore wind sector.
Categorisation of maintenance
In order to design the DSS, expert opinions about O&M in the industry were collected from different stakeholders in the offshore wind sector, such as O&M managers, O&M consultants, technicians, and port managers, by the use of an online survey, interviews and working groups. Further details are available at the 2OM project WP 4: communication (Li et al., 2015). According to the responses from the industry experts, offshore wind maintenance activities are classified into nine categories (see Table 1) in the DSS, four preventive and five corrective categories. The number of vessels and technicians should be identified in order to undertake the different maintenance tasks.
Preventive maintenance (PM): Corrective maintenance (CM):
Cat. C1: PM on wind turbines Cat. P1: CM for wind turbine repair
Cat. C2: PM on foundations Cat. P2: CM for wind turbine minor replacement
Cat. C3: PM on substations Cat. P3: CM for wind turbine major replacement
Cat. C4: PM on cables Cat. P4: CM for substation repair / replacement
Cat. P5: CM for cable repair / replacement
Table 1: Preventive and corrective maintenance categories
For each category, the length of time required for preparation, repair and logistics are determined. The preparation time is the duration of mobilisation of all necessary resources. Repair time covers the time that the technicians use during repair or replacement. Logistics time typically incurs when a turbine component is ordered from the manufacturer. In addition, the size of maintenance crew is also determined depending on the workload of each maintenance category. The main activities in both preventive and corrective maintenance are the transport of the maintenance crew and components and the execution of repair or replacement. The most suitable vessel and the crew with the necessary skills should be selected to execute an inspection or correct a failure according to the compatibility of each vessel and personnel type.
Compatibility of vessels and technicians (HR)
A range of vessels can be chartered, on a short-term or/and long-term lease, to carry out maintenance tasks during the planning horizon. Crew transfer vessels are utilised widely in the offshore energy field, such as oil and gas. Crane vessels and jack-up vessels are used to replace wind turbine components, depending on the size of the work. Helicopters can support the transportation of personnel and equipment in emergencies and can reduce the length of downtime. Daughter ships must work with a mother ship offshore; they can offer preventive inspection and corrective repairs on wind turbines. In practice, at most one mother ship may undertake maintenance works for a particular offshore wind farm. The

7
compatibility of each vessel type varies with the maintenance categories. The length of lease of each type of vessel should cover its requirement for different maintenance categories. Each type of vessel has a given service speed, restricted use due to weather conditions and lease cost.
Currently no single standardisation of maintenance technicians exists in the offshore wind industry. With respect to the personnel data from survey responses, technicians involved in the DSS are classified into four groups in terms of job function and base location.
Onshore-based turbine technicians are responsible for maintaining the condition of the turbines.
Offshore-based turbine technicians are considered only if an offshore platform is utilised, such as a mother ship with daughter ships.
Foundation technicians are in charge of the maintenance work on the turbine foundation.
Electrical technicians undertake the repair and/or replacement in both substations and cables.
When the personnel are scheduled for offshore maintenance works, the shift length may impact on the efficiency of the activities. In practice, the length of an on-duty shift is seen as a hard constraint to restrict the daily workload.
3.2 User inputs
A graphical friendly user interface provides users with an easy way to use the system, by inputting a series of input variables about OWF(s) and outputting the corresponding O&M resource requirements. The user input variables include data on the turbines, balance of plant, location and sea state, which therefore focus on the technical, structural and environmental information of an offshore wind farm. The input variables for a particular offshore wind project are fed through the system in order to produce for the user a series of O&M resource requirements.
3.3 Cost optimisation
The bulk of the system is comprised of a series of key assumptions, objective functions and constraints that use the data inputs to generate the required maintenance resources at a minimum cost, in particular vessels and technicians. The optimal costs are acquired by the deterministic or stochastic models which are described in detail in Section 4. The objective of the models is to minimise the O&M costs, including the costs of personnel, vessel, and production loss due to downtime. The major constraints considered are the available working time of personnel, capacity, compatibility and weather restriction of each vessel type. The deterministic model is used for the case with known technical failure rates of wind turbine components. Otherwise, the failure frequency is assumed as a probabilistic parameter in the stochastic model.
3.4 System outputs
According to the cost estimation from the DSS, the OWF management team will decide on the most suitable maintenance strategy with respect to some operational issues in practice, e.g. available space and support workers in the maintenance base port. There are three optional maintenance strategies that are defined in the DSS in terms of vessel and personnel resources required; namely port based, port with helicopters and offshore based.

8
The three optional strategies have distinct requirements for vessels/helicopters, human resources (HR), port facilities, and personnel training courses. The optimised vessels and human resources are determined by the proposed optimisation models to meet the maintenance requirements. Essential port facilities and personnel training courses are suggested by the DSS, such as sufficient storage space and parking space as port facilities; project management and under-water work skills as training programmes.
For a port based strategy, different types of vessels are used to carry out maintenance, which is usual for most of the existing offshore wind farms as the distance to port is not great. In order to minimise the rescue time, helicopters may be considered to assist urgent repairs with a quick response. However, additional facilities are required in the base port, such as a heli-pad and fuel pumps. With such strategies, with or without a helicopter, the majority of the O&M resources are located at the onshore maintenance port, and all vessels and helicopters are assumed to return by the end of each day. With the increased distance between the wind farm and the shore in the new generation offshore wind farms, operators may tend to use offshore based maintenance. In this way, a mother ship with daughter ships may stay offshore for a period of time to reduce the travel distance, compared to other types of vessels. Additional training courses are needed for these offshore based technicians. Such an offshore based platform does not only offer a quicker response for unforeseeable failures, but can also be used in preventive inspections.
4. Optimisation models
To reduce the costs of maintenance activities in an OWF, we propose deterministic and stochastic optimisation models to minimise personnel, vessel, and breakdown costs. These two optimisation models are integrated into the DSS. The deterministic model is intended for use by stakeholders with access to accurate failure rate data. The stochastic model is intended for use by stakeholders who have less certainty about failure rates.
4.1 Notation and assumptions
Index k denotes the category of maintenance. 𝑘 = 1. . .4, indicate the preventive maintenance
activities; 𝑘 = 5. . .9, indicate corrective maintenance. Four kinds of maintenance technicians are considered in the model 𝑖 = 1 … 4 represent onshore based turbine technician, foundation technician including underwater maintenance, electrical technician for maintenance of cables and substations, and offshore based turbine technician respectively. A variety of vessels are used to transfer the crew to execute different maintenance tasks, type 𝑗 = 1 … 5 denote crew transfer vessel, crane vessel, jack-up, helicopter and daughter ship (working with a mother ship respectively).
𝑖 ∈ 𝐼: Set of technician types 𝑖 = 1: 𝑡𝑢𝑟𝑏𝑖𝑛𝑒 𝑡𝑒𝑐ℎ𝑛𝑖𝑐𝑖𝑎𝑛𝑠 (𝑜𝑛𝑠ℎ𝑜𝑟𝑒 𝑏𝑎𝑠𝑒𝑑) 𝑖 = 2: 𝑓𝑜𝑢𝑛𝑑𝑎𝑡𝑖𝑜𝑛 𝑡𝑒𝑐ℎ𝑛𝑖𝑐𝑖𝑎𝑛𝑠
𝑖 = 3: 𝑒𝑙𝑒𝑐𝑡𝑟𝑖𝑐𝑎𝑙 𝑡𝑒𝑐ℎ𝑛𝑖𝑐𝑖𝑎𝑛𝑠 𝑖 = 4: 𝑡𝑢𝑟𝑏𝑖𝑛𝑒 𝑡𝑒𝑐ℎ𝑛𝑖𝑐𝑖𝑎𝑛𝑠 (𝑜𝑓𝑓𝑠ℎ𝑜𝑟𝑒 𝑏𝑎𝑠𝑒𝑑) 𝑗 ∈ 𝐽: Set of vessel types
𝑗 = 1: 𝑐𝑟𝑒𝑤 𝑡𝑟𝑎𝑛𝑠𝑓𝑒𝑟 𝑣𝑒𝑠𝑠𝑒𝑙𝑠 𝑗 = 2: 𝑐𝑟𝑎𝑛𝑒 𝑣𝑒𝑠𝑠𝑒𝑙𝑠 𝑗 = 3: 𝑗𝑎𝑐𝑘𝑢𝑝𝑠 𝑗 = 4: ℎ𝑒𝑙𝑖𝑐𝑜𝑝𝑡𝑒𝑟𝑠 𝑗 = 5: 𝑑𝑎𝑢𝑔ℎ𝑡𝑒𝑟 𝑠ℎ𝑖𝑝𝑠

9
𝑘 ∈ 𝐾: Set of maintenance categories 𝑘 = 1: 𝑝𝑟𝑒𝑣𝑒𝑛𝑡𝑖𝑣𝑒 𝑚𝑎𝑖𝑛𝑡𝑒𝑛𝑎𝑛𝑐𝑒 𝑜𝑓 𝑤𝑖𝑛𝑑 𝑡𝑢𝑟𝑏𝑖𝑛𝑒𝑠 𝑘 = 2: 𝑝𝑟𝑒𝑣𝑒𝑛𝑡𝑖𝑣𝑒 𝑚𝑎𝑖𝑛𝑡𝑒𝑛𝑎𝑛𝑐𝑒 𝑜𝑓 𝑠𝑢𝑏𝑠𝑡𝑎𝑡𝑖𝑜𝑛𝑠 𝑘 = 3: 𝑝𝑟𝑒𝑣𝑒𝑛𝑡𝑖𝑣𝑒 𝑚𝑎𝑖𝑛𝑡𝑒𝑛𝑎𝑛𝑐𝑒 𝑜𝑓𝑓𝑜𝑢𝑛𝑑𝑎𝑡𝑖𝑜𝑛𝑠 𝑘 = 4: 𝑝𝑟𝑒𝑣𝑒𝑛𝑡𝑖𝑣𝑒 𝑚𝑎𝑖𝑛𝑡𝑒𝑛𝑎𝑛𝑐𝑒 𝑜𝑓𝑐𝑎𝑏𝑙𝑒𝑠 𝑘 = 5: 𝑐𝑜𝑟𝑟𝑒𝑐𝑡𝑖𝑣𝑒 𝑚𝑎𝑖𝑛𝑡𝑒𝑛𝑎𝑛𝑐𝑒 𝑓𝑜𝑟 𝑤𝑖𝑛𝑑 𝑡𝑢𝑟𝑏𝑖𝑛𝑒 𝑟𝑒𝑝𝑎𝑖𝑟 𝑘 = 6: 𝑐𝑜𝑟𝑟𝑒𝑐𝑡𝑖𝑣𝑒 𝑚𝑎𝑖𝑛𝑡𝑒𝑛𝑎𝑛𝑐𝑒 𝑓𝑜𝑟 𝑤𝑖𝑛𝑑 𝑡𝑢𝑟𝑏𝑖𝑛𝑒 𝑚𝑖𝑛𝑜𝑟 𝑟𝑒𝑝𝑙𝑎𝑐𝑒𝑚𝑒𝑛𝑡 𝑘 = 7: 𝑐𝑜𝑟𝑟𝑒𝑐𝑡𝑖𝑣𝑒 𝑚𝑎𝑖𝑛𝑡𝑒𝑛𝑎𝑛𝑐𝑒 𝑓𝑜𝑟 𝑤𝑖𝑛𝑑 𝑡𝑢𝑟𝑏𝑖𝑛𝑒 𝑚𝑎𝑗𝑜𝑟 𝑟𝑒𝑝𝑙𝑎𝑐𝑒𝑚𝑒𝑛𝑡
𝑘 = 8: 𝑐𝑜𝑟𝑟𝑒𝑐𝑡𝑖𝑣𝑒 𝑚𝑎𝑖𝑛𝑡𝑒𝑛𝑎𝑛𝑐𝑒 𝑓𝑜𝑟 𝑠𝑢𝑏𝑠𝑡𝑎𝑡𝑖𝑜𝑛 𝑟𝑒𝑝𝑎𝑖𝑟/𝑟𝑒𝑝𝑙𝑎𝑐𝑒𝑚𝑒𝑛𝑡 𝑘 = 9: 𝑐𝑜𝑟𝑟𝑒𝑐𝑡𝑖𝑣𝑒 𝑚𝑎𝑖𝑛𝑡𝑒𝑛𝑎𝑛𝑐𝑒 𝑓𝑜𝑟 𝑐𝑎𝑏𝑙𝑒 𝑟𝑒𝑝𝑎𝑖𝑟/𝑟𝑒𝑝𝑙𝑎𝑐𝑒𝑚𝑒𝑛𝑡
𝐶𝑖𝑃: 𝑎𝑛𝑛𝑢𝑎𝑙 𝑠𝑎𝑙𝑎𝑟𝑦 𝑜𝑓 𝑡𝑒𝑐ℎ𝑛𝑖𝑐𝑖𝑎𝑛 𝑡𝑦𝑝𝑒 𝑖
𝐶𝑗𝐹: 𝑎𝑛𝑛𝑢𝑎𝑙 𝑓𝑖𝑥𝑒𝑑 𝑐𝑜𝑠𝑡 𝑜𝑓 𝑣𝑒𝑠𝑠𝑒𝑙 𝑡𝑦𝑝𝑒 𝑗
𝐶𝑗𝑉: 𝑣𝑎𝑟𝑖𝑎𝑏𝑙𝑒 𝑐𝑜𝑠𝑡 𝑝𝑒𝑟 ℎ𝑜𝑢𝑟 𝑜𝑓 𝑣𝑒𝑠𝑠𝑒𝑙 𝑡𝑦𝑝𝑒 𝑗
𝐶𝑀: 𝑎𝑛𝑛𝑢𝑎𝑙 𝑐ℎ𝑎𝑟𝑡𝑒𝑟 𝑐𝑜𝑠𝑡 𝑓𝑜𝑟 𝑚𝑜𝑡ℎ𝑒𝑟𝑠ℎ𝑖𝑝
𝑅𝐿: 𝑟𝑒𝑣𝑒𝑛𝑢𝑒 𝑙𝑜𝑠𝑠 𝑝𝑒𝑟 ℎ𝑜𝑢𝑟 𝑑𝑗: 𝑑𝑖𝑠𝑡𝑎𝑛𝑐𝑒 𝑡𝑜 𝑠ℎ𝑜𝑟𝑒 𝑓𝑜𝑟 𝑣𝑒𝑠𝑠𝑒𝑙 𝑗
𝑠𝑗𝑉: 𝑎𝑣𝑒𝑟𝑎𝑔𝑒 𝑠𝑝𝑒𝑒𝑑 𝑜𝑓 𝑣𝑒𝑠𝑠𝑒𝑙 𝑡𝑦𝑝𝑒 𝑗
𝐹𝑘: 𝑎𝑛𝑛𝑢𝑎𝑙 𝑚𝑎𝑖𝑛𝑡𝑒𝑛𝑎𝑛𝑐𝑒 𝑓𝑟𝑒𝑞𝑢𝑒𝑛𝑐𝑦 𝑜𝑓 𝑐𝑎𝑡𝑒𝑔𝑜𝑟𝑦 𝑘 𝐻𝑖
𝑃: 𝑛𝑢𝑚𝑏𝑒𝑟 𝑜𝑓 𝑤𝑜𝑟𝑘𝑖𝑛𝑔 ℎ𝑜𝑢𝑟𝑠 𝑓𝑜𝑟 𝑡𝑒𝑐ℎ𝑛𝑖𝑐𝑖𝑎𝑛 𝑡𝑦𝑝𝑒 𝑖 𝑖𝑛 𝑜𝑛𝑒 𝑑𝑎𝑦
𝐻𝑗𝑉: 𝑛𝑢𝑚𝑏𝑒𝑟 𝑜𝑓 𝑤𝑜𝑟𝑘𝑖𝑛𝑔 ℎ𝑜𝑢𝑟𝑠 𝑓𝑜𝑟 𝑣𝑒𝑠𝑠𝑒𝑙 𝑡𝑦𝑝𝑒 𝑗 𝑖𝑛 𝑜𝑛𝑒 𝑑𝑎𝑦
𝐿𝑖𝑃: 𝑎𝑛𝑛𝑢𝑎𝑙 𝑛𝑢𝑚𝑏𝑒𝑟 𝑜𝑓 𝑎𝑣𝑎𝑖𝑙𝑎𝑏𝑙𝑒 𝑤𝑜𝑟𝑘𝑖𝑛𝑔 𝑑𝑎𝑦𝑠 𝑓𝑜𝑟 𝑡𝑒𝑐ℎ𝑛𝑖𝑐𝑖𝑎𝑛 𝑖
𝐿𝑗𝑉: 𝑎𝑛𝑛𝑢𝑎𝑙 𝑛𝑢𝑚𝑏𝑒𝑟 𝑜𝑓 𝑎𝑣𝑎𝑖𝑙𝑎𝑏𝑙𝑒 𝑤𝑜𝑟𝑘𝑖𝑛𝑔 𝑑𝑎𝑦𝑠 𝑓𝑜𝑟 𝑣𝑒𝑠𝑠𝑒𝑙 𝑗
𝐿𝑘𝑅𝑒𝑝𝑎𝑖𝑟
: 𝑙𝑒𝑛𝑔𝑡ℎ 𝑜𝑓 𝑚𝑎𝑖𝑛𝑡𝑒𝑛𝑎𝑛𝑐𝑒 (𝑟𝑒𝑝𝑎𝑖𝑟) 𝑡𝑖𝑚𝑒 𝑓𝑜𝑟 𝑐𝑎𝑡𝑒𝑔𝑜𝑟𝑦 𝑘
𝐿𝑘𝑙𝑜𝑔𝑖𝑠𝑡𝑖𝑐𝑠
: 𝑙𝑒𝑛𝑔𝑡ℎ 𝑜𝑓 𝑙𝑜𝑔𝑖𝑠𝑡𝑖𝑐𝑠 𝑡𝑖𝑚𝑒 𝑓𝑜𝑟 𝑐𝑎𝑡𝑒𝑔𝑜𝑟𝑦 𝑘
𝐿𝑗𝑃𝑟𝑒𝑝𝑎𝑟𝑒
: 𝑙𝑒𝑛𝑔𝑡ℎ 𝑜𝑓 𝑝𝑟𝑒𝑝𝑎𝑟𝑎𝑡𝑖𝑜𝑛 𝑡𝑖𝑚𝑒 𝑓𝑜𝑟 𝑣𝑒𝑠𝑠𝑒𝑙 𝑗
𝐿𝑗𝑇𝑟𝑎𝑣𝑒𝑙: 𝑙𝑒𝑛𝑔𝑡ℎ 𝑜𝑓 𝑡𝑟𝑎𝑣𝑒𝑙 𝑡𝑖𝑚𝑒 𝑓𝑟𝑜𝑚 𝑠ℎ𝑜𝑟𝑒 𝑡𝑜 𝑜𝑓𝑓𝑠ℎ𝑜𝑟𝑒 𝑤𝑖𝑛𝑑 𝑓𝑎𝑟𝑚 𝑓𝑜𝑟 𝑣𝑒𝑠𝑠𝑒𝑙 𝑗
𝑞𝑘: 𝑛𝑢𝑚𝑏𝑒𝑟 𝑜𝑓 𝑡𝑒𝑐ℎ𝑖𝑛𝑐𝑖𝑎𝑛𝑠 𝑟𝑒𝑞𝑢𝑖𝑟𝑒𝑑 𝑓𝑜𝑟 𝑚𝑎𝑖𝑛𝑡𝑒𝑛𝑎𝑛𝑐𝑒 𝑐𝑎𝑡𝑒𝑔𝑜𝑟𝑦 𝑘
𝑄𝑗: 𝑡ℎ𝑒 𝑐𝑎𝑝𝑎𝑐𝑖𝑡𝑦 𝑜𝑓 𝑣𝑒𝑠𝑠𝑒𝑙 𝑗 𝑡𝑜 𝑐𝑎𝑟𝑟𝑦 𝑡𝑒𝑐ℎ𝑛𝑖𝑐𝑖𝑎𝑛𝑠
𝑈𝑘: 𝑡ℎ𝑒 𝑛𝑢𝑚𝑏𝑒𝑟 𝑜𝑓 𝑚𝑎𝑖𝑛𝑡𝑒𝑛𝑎𝑛𝑐𝑒 𝑢𝑛𝑖𝑡 𝑓𝑜𝑟 𝑘
𝑁: 𝑡ℎ𝑒 𝑛𝑢𝑚𝑏𝑒𝑟 𝑜𝑓 𝑡𝑢𝑟𝑏𝑖𝑛𝑒𝑠
𝑉𝑑𝑎𝑢𝑔ℎ𝑡𝑒𝑟: 𝑚𝑎𝑥𝑖𝑚𝑢𝑚 𝑛𝑢𝑚𝑏𝑒𝑟 𝑜𝑓 𝑑𝑎𝑢𝑔ℎ𝑡𝑒𝑟 𝑠ℎ𝑖𝑝𝑠 𝑐𝑎𝑟𝑟𝑖𝑒𝑑 𝑏𝑦 𝑎 𝑚𝑜𝑡ℎ𝑒𝑟 𝑠ℎ𝑖𝑝 𝑟𝐴𝑟𝑟𝑎𝑦: 𝑡ℎ𝑒 𝑎𝑣𝑒𝑟𝑎𝑔𝑒 𝑙𝑒𝑛𝑔𝑡ℎ 𝑜𝑓 𝑎𝑟𝑟𝑎𝑦 𝑐𝑎𝑏𝑙𝑒 𝑟𝑒𝑞𝑢𝑖𝑟𝑒𝑑 𝑓𝑜𝑟 𝑎 𝑤𝑖𝑛𝑑 𝑡𝑢𝑟𝑏𝑖𝑛𝑒
𝑟𝑆𝑢𝑏: 𝑡ℎ𝑒 𝑎𝑣𝑒𝑟𝑎𝑔𝑒 𝑛𝑢𝑚𝑏𝑒𝑟 𝑜𝑓 𝑤𝑖𝑛𝑑 𝑡𝑢𝑟𝑏𝑖𝑛𝑒𝑠 𝑐𝑜𝑛𝑛𝑒𝑐𝑡𝑒𝑑 𝑏𝑦 𝑎 𝑠𝑢𝑏𝑠𝑡𝑎𝑡𝑖𝑜𝑛
𝑍𝑖𝑘𝑃 {
1: 𝑡𝑒𝑐ℎ𝑛𝑖𝑐𝑖𝑎𝑛 𝑖 𝑖𝑠 𝑐𝑜𝑚𝑝𝑎𝑡𝑖𝑏𝑙𝑒 𝑡𝑜 𝑒𝑥𝑒𝑐𝑢𝑡𝑒 𝑚𝑎𝑖𝑛𝑡𝑒𝑛𝑎𝑛𝑐𝑒 𝑘 0: 𝑡𝑒𝑐ℎ𝑛𝑖𝑐𝑖𝑎𝑛 𝑖 𝑖𝑠 𝑛𝑜𝑡 𝑐𝑜𝑚𝑝𝑎𝑡𝑖𝑏𝑙𝑒 𝑡𝑜 𝑒𝑥𝑒𝑐𝑢𝑡𝑒 𝑚𝑎𝑖𝑛𝑡𝑒𝑛𝑎𝑛𝑐𝑒 𝑘
𝑍𝑗𝑘𝑉 {
1: 𝑣𝑒𝑠𝑠𝑒𝑙 𝑗 𝑖𝑠 𝑐𝑜𝑚𝑝𝑎𝑡𝑖𝑏𝑙𝑒 𝑡𝑜 𝑒𝑥𝑒𝑐𝑢𝑡𝑒 𝑚𝑎𝑖𝑛𝑡𝑒𝑛𝑎𝑛𝑐𝑒 𝑘 0: 𝑣𝑒𝑠𝑠𝑒𝑙 𝑗 𝑖𝑠 𝑛𝑜𝑡 𝑐𝑜𝑚𝑝𝑎𝑡𝑖𝑏𝑙𝑒 𝑡𝑜 𝑒𝑥𝑒𝑐𝑢𝑡𝑒 𝑚𝑎𝑖𝑛𝑡𝑒𝑛𝑎𝑛𝑐𝑒 𝑘
Decision variables: 𝑥𝑖𝑘: 𝑛𝑢𝑚𝑏𝑒𝑟 𝑜𝑓 𝑟𝑒𝑞𝑢𝑖𝑟𝑒𝑑 𝑡𝑒𝑐ℎ𝑛𝑖𝑐𝑖𝑎𝑛𝑠 𝑡𝑦𝑝𝑒 𝑖 𝑓𝑜𝑟 𝑚𝑎𝑖𝑛𝑡𝑒𝑛𝑎𝑛𝑐𝑒 𝑘 𝑋𝑖: 𝑎𝑛𝑛𝑢𝑎𝑙 𝑛𝑢𝑚𝑏𝑒𝑟 𝑜𝑓 𝑡𝑒𝑐ℎ𝑛𝑖𝑐𝑖𝑎𝑛𝑠 𝑡𝑦𝑝𝑒 𝑖 𝑦𝑗𝑘: 𝑛𝑢𝑚𝑏𝑒𝑟 𝑜𝑓 𝑟𝑒𝑞𝑢𝑖𝑟𝑒𝑑 𝑣𝑒𝑠𝑠𝑒𝑙 𝑡𝑦𝑝𝑒 𝑗 𝑢𝑠𝑒𝑑 𝑓𝑜𝑟 𝑚𝑎𝑖𝑛𝑡𝑒𝑛𝑎𝑛𝑐𝑒 𝑘
𝑌𝑗: 𝑎𝑛𝑛𝑢𝑎𝑙 𝑛𝑢𝑚𝑏𝑒𝑟 𝑜𝑓 𝑣𝑒𝑠𝑠𝑒𝑙 𝑗
𝑏𝑖𝑘𝑃 {
1: 𝑖𝑓 𝑡𝑒𝑐ℎ𝑛𝑖𝑐𝑖𝑎𝑛 𝑡𝑦𝑝𝑒 𝑖 𝑖𝑠 𝑢𝑠𝑒𝑑 𝑡𝑜 𝑒𝑥𝑒𝑐𝑢𝑡𝑒 𝑚𝑎𝑖𝑛𝑡𝑒𝑛𝑎𝑛𝑐𝑒 𝑘 0: 𝑜𝑡ℎ𝑒𝑟𝑤𝑖𝑠𝑒

10
𝑏𝑗𝑘𝑉 {
1: 𝑖𝑓 𝑣𝑒𝑠𝑠𝑒𝑙 𝑡𝑦𝑝𝑒 𝑗 𝑖𝑠 𝑢𝑠𝑒𝑑 𝑡𝑜 𝑒𝑥𝑒𝑐𝑢𝑡𝑒 𝑚𝑎𝑖𝑛𝑡𝑒𝑛𝑎𝑛𝑐𝑒 𝑘 0: 𝑜𝑡ℎ𝑒𝑟𝑤𝑖𝑠𝑒
𝑏𝑀 {1: 𝑎 𝑚𝑜𝑡ℎ𝑒𝑟 𝑠ℎ𝑖𝑝 𝑖𝑠 𝑢𝑠𝑒𝑑 0: 𝑜𝑡ℎ𝑒𝑟𝑤𝑖𝑠𝑒
As personnel in the model are assumed to be full-time workers, the personnel cost is
estimated using the annual salary (𝐶𝑖𝑃 ) of each technician type i. There are two costs
considered for vessels: fixed cost of charter (𝐶𝑗𝐹) per vessel of type j and a variable cost (𝐶𝑗
𝑉)
in respect to the hours that a vessel is used in maintenance. The fixed cost is a charge incurred at the beginning of an annual or monthly lease. A mother ship is usually required when daughter ships stay offshore for maintenance activities, so a separate cost is
considered for the charter of a mother ship (𝐶𝑀). Downtime due to maintenance service execution also contributes a significant portion of the maintenance cost. It is referred as
revenue loss in terms of the hourly rate of production income (𝑅𝐿) and length of downtime. All turbines in a given offshore wind farm are assumed homogenous with respect to manufacture model and production capacity.
Travel time (𝐿𝑗𝑇𝑟𝑎𝑣𝑒𝑙) for vessel type j is calculated by the distance (𝑑𝑗) and its speed (𝑠𝑗
𝑉).
The preparation time of a vessel ( 𝐿𝑗𝑃𝑟𝑒𝑝𝑎𝑟𝑒
) depends on the vessel type j, while the
repair/replacement time (𝐿𝑘𝑅𝑒𝑝𝑎𝑖𝑟
) and logistics time (𝐿𝑘𝐿𝑜𝑔𝑖𝑠𝑡𝑖𝑐𝑠
) are pre-determined by the
category of maintenance k. All the above timing data are constants in the model.
Weather conditions give a safety restriction at which a vessel type can operate at wind turbines, in terms of wave height and wind speed. If the weather conditions reach one of the operational limits of the vessel, the maintenance activities will be postponed. As DSS supports strategic decisions on optimal maintenance resources, it is not a tool that determines the daily maintenance activities with respect to weather conditions. The
parameter (𝐿𝑗𝑉) is used to represent the number of available days that vessel type j can
undertake maintenance tasks. Another parameter, the number of available days for
technicians i (𝐿𝑖𝑃), would be restricted by the use of vessels. The number of working hours in
each day for vessels (𝐻𝑗𝑉) and technicians (𝐻𝑖
𝑃) are equal, which should be a key operation
constraint to restrict the daily workload.
A maintenance team is usually sent to execute an inspection or repair; the number of technicians (𝑞𝑘) in such a team depends on the work size of maintenance category k. Each maintenance category requires compatible technicians and vessels in action. For instance, a major replacement of large turbine components must be executed by a jack-up vessel, rather than small or medium size vessels. The compatibility of each technician and vessel
type is represented by the binary data 𝑍𝑖𝑘𝑃 and 𝑍𝑗𝑘
𝑉 . The binary data taking the value 1
indicates that the given type of technician or vessel is compatible to work for the specific maintenance categories, otherwise it takes the value 0. According to the data acquired from O&M specialists in the sector, the two binary data sets, compatibility of technicians i and vessels j for maintenance category k, are clarified in Tables 2 and 3.
𝑍𝑖𝑘 1 2 3 4 5 6 7 8 9
1 1 0 0 0 1 1 1 0 0
2 0 0 1 0 0 0 0 0 0
3 0 1 0 1 0 0 0 1 1
4 1 0 0 0 1 1 1 0 0
Table 2: Compatibility of each technician type
11
𝑍𝑗𝑘 1 2 3 4 5 6 7 8 9
1 1 1 1 1 1 0 0 1 1
2 0 0 0 0 0 1 0 0 0
3 0 0 0 0 0 0 1 0 0
4 0 0 0 0 1 0 0 1 0
5 1 0 0 0 1 0 0 0 0
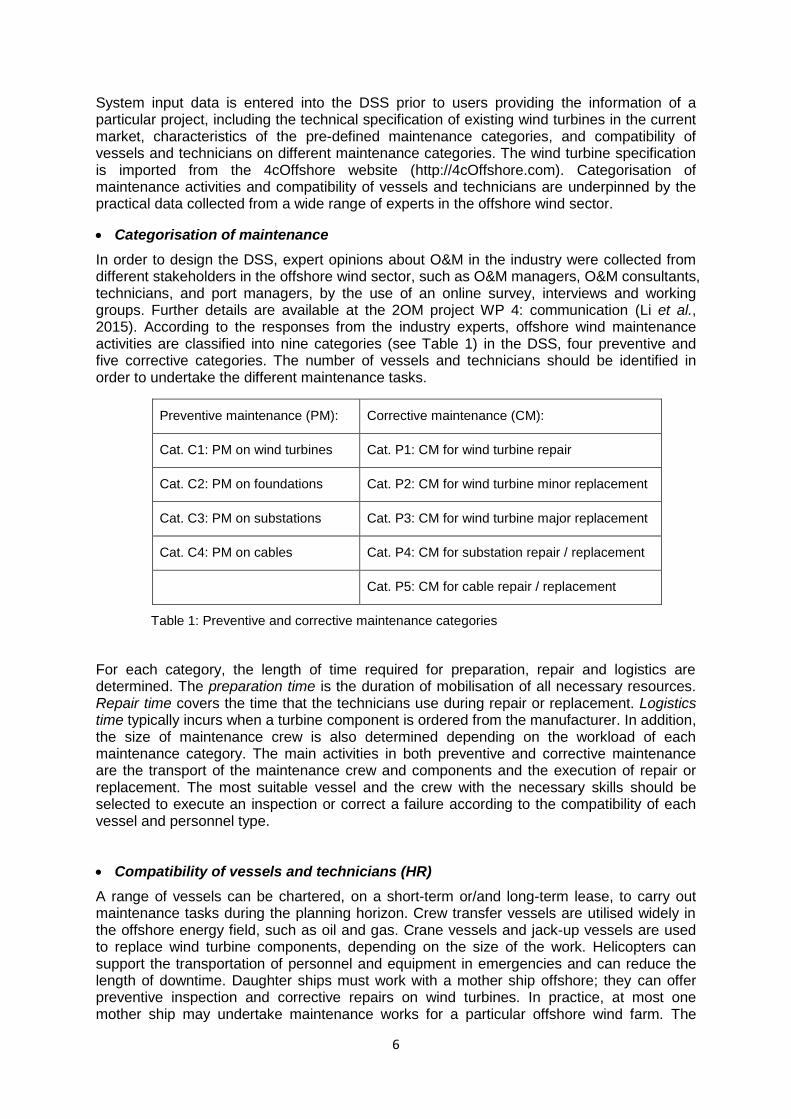
Table 3: Compatibility of each vessel type
A daughter ship (𝑗 = 5) travels for a short distance and time at sea. All other types of vessels
(𝑗 = 1 … 4) must depart from the onshore maintenance port. The optimisation model takes
into account the maintenance operations of one offshore wind farm. The model does not
consider the vessel routes for implementing the maintenance activities. The travel distance
of a vessel departing from an onshore port or a mother ship will take the average level value,
to all wind turbines in an offshore wind farm.
4.2 Deterministic optimisation model
The deterministic optimisation model is formulated and used for the case with known technical failure rate of wind turbine components. This model is designed, as an option, in the DSS for users who know the failure rates of OWF components; so the frequency of each maintenance category is recognised to be deterministic input data.
4.2.1 Objective function
The objective function consists of minimising the total amount of the five different costs that occur when executing all the maintenance activities at an OWF during a given period (e.g. one year). The total cost contains personnel cost, fixed and variable costs of vessels, mother ship cost and downtime cost that is the revenue loss while a wind turbine is failed or under inspection.
𝑇𝑜𝑡𝑎𝑙 𝑂&𝑀 𝑐𝑜𝑠𝑡= 𝑃𝑒𝑟𝑠𝑜𝑛𝑛𝑒𝑙 𝑐𝑜𝑠𝑡 + 𝑉𝑒𝑠𝑠𝑒𝑙 𝑓𝑖𝑥𝑒𝑑 𝑐𝑜𝑠𝑡 + 𝑉𝑒𝑠𝑠𝑒𝑙 𝑣𝑎𝑟𝑖𝑎𝑏𝑙𝑒 𝑐𝑜𝑠𝑡+ 𝑀𝑜𝑡ℎ𝑒𝑟𝑠ℎ𝑖𝑝 𝑐𝑜𝑠𝑡 + 𝐷𝑜𝑤𝑛𝑡𝑖𝑚𝑒 𝑐𝑜𝑠𝑡
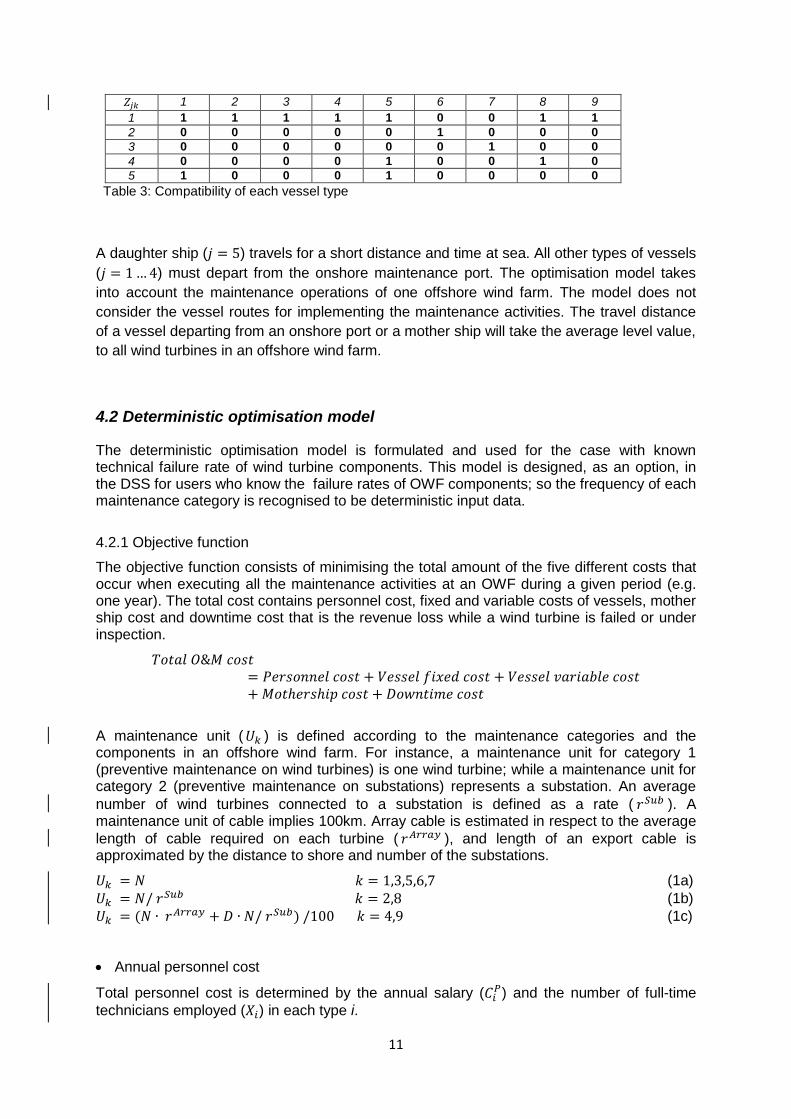
A maintenance unit ( 𝑈𝑘 ) is defined according to the maintenance categories and the components in an offshore wind farm. For instance, a maintenance unit for category 1 (preventive maintenance on wind turbines) is one wind turbine; while a maintenance unit for category 2 (preventive maintenance on substations) represents a substation. An average
number of wind turbines connected to a substation is defined as a rate ( 𝑟𝑆𝑢𝑏 ). A maintenance unit of cable implies 100km. Array cable is estimated in respect to the average
length of cable required on each turbine ( 𝑟𝐴𝑟𝑟𝑎𝑦 ), and length of an export cable is approximated by the distance to shore and number of the substations.
𝑈𝑘 = 𝑁 𝑘 = 1,3,5,6,7 (1a)
𝑈𝑘 = 𝑁/ 𝑟𝑆𝑢𝑏 𝑘 = 2,8 (1b)
𝑈𝑘 = (𝑁 ∙ 𝑟𝐴𝑟𝑟𝑎𝑦 + 𝐷 ∙ 𝑁/ 𝑟𝑆𝑢𝑏) /100 𝑘 = 4,9 (1c)
Annual personnel cost
Total personnel cost is determined by the annual salary (𝐶𝑖𝑃) and the number of full-time
technicians employed (𝑋𝑖) in each type i.

12
𝑃𝑒𝑟𝑠𝑜𝑛𝑛𝑒𝑙 𝑐𝑜𝑠𝑡 = ∑ 𝐶𝑖𝑃 ∙ 𝑋𝑖
𝑖∈𝐼
∀𝑖 ∈ 𝐼
(2a)
Vessel fixed cost
The fixed cost of vessel of type j is determined in terms of the charter rate (𝐶𝑗𝐹) per lease
period (e.g. a year or a repair event). Crew transfer vessels, helicopters and daughter ships are assumed to chartered annually, so the number of such vessel types (𝑌𝑗) are critical to
estimate the total fixed cost. Crane vessels and jack-up vessels are usually chartered monthly at events that a major repair or a replacement is required.
𝑣𝑒𝑠𝑠𝑒𝑙 𝑓𝑖𝑥𝑒𝑑 𝑐𝑜𝑠𝑡 = ∑ 𝐶𝑗𝐹 ∙ 𝑌𝑗
𝑗∈𝐽
∀𝑗 ∈ 𝐽
(2b)
Vessel variable cost
The variable cost rate is hourly (𝐶𝑗𝑉) for each type of vessels. The travel time of vessel j from
maintenance port to offshore wind farm is defined (𝐿𝑗𝑇𝑟𝑎𝑣𝑒𝑙 =
𝑑𝑗
𝑠𝑗𝑉) by the travel distance over
the vessel speed. The actual length of travel time for each maintenance task is usually made
up by a returned trip ( 2𝐿𝑗𝑇𝑟𝑎𝑣𝑒𝑙 ). The travel time and the length of time required for
repair/replacement on the maintenance category (𝐿𝑘𝑅𝑒𝑝𝑎𝑖𝑟
) are the two major elements to
determine the length of required time of vessel j.
𝑉𝑒𝑠𝑠𝑒𝑙 𝑣𝑎𝑟𝑖𝑎𝑏𝑙𝑒 𝑐𝑜𝑠𝑡 = ∑ ∑ 𝐶𝑗𝑉 ∙ 𝑏𝑗𝑘
𝑉 ∙
𝑘∈𝐾𝑗∈𝐽
(𝐿𝑘𝑅𝑒𝑝𝑎𝑖𝑟
+ 2𝐿𝑗𝑇𝑟𝑎𝑣𝑒𝑙) ∙ 𝑈𝑘 ∙ 𝐹𝑘
(2c)
𝑤ℎ𝑒𝑟𝑒 𝑏𝑗𝑘𝑉 𝑖𝑠 𝑎 𝑏𝑖𝑛𝑎𝑟𝑦 𝑣𝑎𝑟𝑖𝑎𝑏𝑙𝑒 𝑖𝑛𝑑𝑖𝑐𝑎𝑡𝑖𝑛𝑔 𝑤ℎ𝑒𝑡ℎ𝑒𝑟 𝑣𝑒𝑠𝑠𝑒𝑙 𝑡𝑦𝑝𝑒 𝑗 𝑖𝑠 𝑠𝑒𝑙𝑒𝑐𝑡𝑒𝑑
𝑓𝑜𝑟 𝑚𝑎𝑖𝑛𝑡𝑒𝑛𝑎𝑛𝑐𝑒 𝑘 𝑜𝑟 𝑛𝑜𝑡.
Mother ship cost
The charter expenditure (𝐶𝑀) of a mother ship must be accounted in the O&M cost when a daughter ship is used to undertake maintenance works. So the cost of leasing a mother ship
relies on whether or not offshore based maintenance is executed (𝑏𝑀 = 0 𝑜𝑟1).
𝑀𝑜𝑡ℎ𝑒𝑟 𝑠ℎ𝑖𝑝 𝑐𝑜𝑠𝑡 = 𝐶𝑀 ∙ 𝑏𝑀 (2d)
Downtime cost
Any revenue loss due to breakdown of turbines or balance of plant is identified as downtime
cost, which is constructed by the hourly rate of potential production income (𝑅𝐿) and length
of downtime for each period (𝑙𝑡𝐷). The length of downtime contains preparation time (𝐿𝑗
𝑃𝑟𝑒𝑝𝑎𝑟𝑒)
and a single trip travel time (𝐿𝑗𝑇𝑟𝑎𝑣𝑒𝑙) of the vessel j selected, and repair time (𝐿𝑘
𝑅𝑒𝑝𝑎𝑖𝑟) and
logistics time (𝐿𝑘𝐿𝑜𝑔𝑖𝑠𝑡𝑖𝑐𝑠
) of each maintenance category k.
o Vessel preparation time (𝐿𝑗𝑃𝑟𝑒𝑝𝑎𝑟𝑒
) is a constant, which depends on the vessel type.

13
o The length of repair/replacement time ( 𝐿𝑘𝑅𝑒𝑝𝑎𝑖𝑟
) is given as a constant of the
maintenance category k. It is not related to the type of vessels or technicians used.
o Similar as the repair time, logistics time (𝐿𝑘𝐿𝑜𝑔𝑖𝑠𝑡𝑖𝑐𝑠
) is another constant parameter
associated with each maintenance category.
Hence, the total downtime cost is evaluated by:
𝐷𝑜𝑤𝑛𝑡𝑖𝑚𝑒 𝑐𝑜𝑠𝑡 = 𝑅𝐿 ∙ 𝑙𝐷𝑜𝑤𝑛𝑡𝑖𝑚𝑒 (2e)
Where
𝑙𝐷𝑜𝑤𝑛𝑡𝑖𝑚𝑒 = ∑ (∑(𝐿𝑗𝑇𝑟𝑎𝑣𝑒𝑙 + 𝐿𝑗
𝑃𝑟𝑒𝑝𝑎𝑟𝑒) ∙ 𝑏𝑗𝑘
𝑉 + 𝐿𝑘𝑅𝑒𝑝𝑎𝑖𝑟
+ 𝐿𝑘𝐿𝑜𝑔𝑖𝑠𝑡𝑖𝑐𝑠
𝑗∈𝐽
)
𝑘∈𝐾
∙ 𝑈𝑘 ∙ 𝐹𝑘
(2f) The objective of the deterministic model is to minimise the sum of the five costs (𝑧𝑑).
𝑀𝑖𝑛 𝑧𝑑 = ∑ 𝐶𝑖𝑃 ∙ 𝑋𝑖
𝑖∈𝐼
+ ∑ 𝐶𝑗𝐹 ∙ 𝑌𝑗
𝑗∈𝐽
+ ∑ ∑ 𝐶𝑗𝑉 ∙ 𝑏𝑗𝑘
𝑉 ∙
𝑘∈𝐾𝑗∈𝐽
(𝐿𝑘𝑅𝑒𝑝𝑎𝑖𝑟
+ 2𝐿𝑗𝑇𝑟𝑎𝑣𝑒𝑙) ∙ 𝑈𝑘 ∙ 𝐹𝑘
+𝐶𝑀 ∙ 𝑏𝑀 + 𝑅𝐿 ∙ ∑ (∑(𝐿𝑗𝑇𝑟𝑎𝑣𝑒𝑙 + 𝐿𝑗
𝑃𝑟𝑒𝑝𝑎𝑟𝑒) ∙ 𝑏𝑗𝑘
𝑉 + 𝐿𝑘𝑅𝑒𝑝𝑎𝑖𝑟
+ 𝐿𝑘𝐿𝑜𝑔𝑖𝑠𝑡𝑖𝑐𝑠
𝑗∈𝐽
)
𝑘∈𝐾
∙ 𝑈𝑘 ∙ 𝐹𝑘 (3)
4.2.2 Constraints
A variety of constraints for the use of vessels and technicians are taken into account in the strategic maintenance planning.
Constraint set 1: The working time of compatible technicians should cover the related repair/replacement of a maintenance category k.
𝑥𝑖𝑘 ∙ 𝐻𝑖𝑃 ∙ 𝐿𝑖
𝑃 ≥ 𝑞𝑘 ∙ 𝐿𝑘𝑅𝑒𝑝𝑎𝑖𝑟
∙ 𝐹𝑘 ∙ 𝑈𝑘 ∙ 𝑏𝑖𝑘𝑃 ∀ 𝑖 ∈ 𝐼, 𝑘 ∈ 𝐾
(4) Constraint set 2: The total working time of each technician type must be larger than the length of time required to undertake all related maintenance.
𝑋𝑖 ∙ 𝐻𝑖𝑃 ∙ 𝐿𝑖
𝑃 ≥ ∑ 𝑞𝑘 ∙ 𝐿𝑘𝑅𝑒𝑝𝑎𝑖𝑟
∙ 𝐹𝑘 ∙ 𝑈𝑘 ∙ 𝑏𝑖𝑘𝑃
𝑘∈𝐾
∀ 𝑖 ∈ 𝐼, 𝑘 ∈ 𝐾
(5) Constraint set 3: As vessels are used to transport technician team(s), and may stay in the offshore wind farm during the maintenance execution for reasons of personnel safety and security, the available time of the selected vessel(s) should cover the time of a 2-way travel and the related repair/replacement of maintenance category k.
𝑦𝑗𝑘 ∙ (𝐻𝑗𝑉 − 2𝐿𝑗
𝑇𝑟𝑎𝑣𝑒𝑙) ∙ 𝐿𝑗𝑉 ≥ 𝐿𝑘
𝑅𝑒𝑝𝑎𝑖𝑟∙ 𝐹𝑘 ∙ 𝑈𝑘 ∙ 𝑏𝑗𝑘
𝑉 ∀ 𝑗 ∈ 𝐽, 𝑘 ∈ 𝐾
(6) Constraint set 4: The total available time of each vessel type must be larger than the length of time required for undertaking all related maintenance.

14
𝑌𝑗 ∙ (𝐻𝑗𝑉 − 2𝐿𝑗
𝑇𝑟𝑎𝑣𝑒𝑙) ∙ 𝐿𝑗𝑉 ≥ ∑ 𝐿𝑘
𝑅𝑒𝑝𝑎𝑖𝑟∙ 𝐹𝑘 ∙ 𝑈𝑘 ∙ 𝑏𝑗𝑘
𝑉
𝑘∈𝐾
∀ 𝑗 ∈ 𝐽
(7) Constraint set 5: The number of technicians transported by all vessels used for maintenance k is restricted by the overall maximum capacity of the vessels.
∑ 𝑥𝑖𝑘𝑖∈𝐼
≤ ∑ 𝑦𝑗𝑘 ∙ 𝑄𝑗𝑗∈𝐽
∀ 𝑘 ∈ 𝐾
(8) Constraint set 6: The number of technicians of type i used for all maintenance categories k must be less than the number of technicians of type i recruited.
𝑥𝑖𝑘 ≤ 𝑋𝑖 ∀ 𝑖 ∈ 𝐼, 𝑘 ∈ 𝐾 (9) Constraint set 7: The number of vessels of type j used for all maintenance categories k must be less than the number of vessels of type j chartered.
𝑦𝑗𝑘 ≤ 𝑌𝑗 ∀ 𝑗 ∈ 𝐽, 𝑘 ∈ 𝐾
(10) Constraint set 8: Technician type i can be used for maintenance category k only if the vessel is compatible with the maintenance category.
𝑥𝑖𝑘 ≤ 𝑀 ∙ 𝑍𝑖𝑘𝑃 ∀ 𝑖 ∈ 𝐼, 𝑘 ∈ 𝐾
(11) where M is an arbitrarily large positive number Constraint set 9: Vessel type j can be used to execute maintenance category k only if the vessel type is compatible to the maintenance category
𝑦𝑗𝑘 ≤ 𝑀 ∙ 𝑍𝑗𝑘𝑉 ∀ 𝑗 ∈ 𝐽, 𝑘 ∈ 𝐾
(12) where M is an arbitrarily large positive number Constraint set 10: A binary decision variable is defined to indicate whether technician type i is selected to execute maintenance category k.
𝑥𝑖𝑘 ≤ 𝑀 ∙ 𝑏𝑖𝑘𝑃 𝑎𝑛𝑑 𝑥𝑖𝑘 ≥ 𝑏𝑖𝑘
𝑃 ∀ 𝑖 ∈ 𝐼, 𝑘 ∈ 𝐾 (13) Constraint set 11: Each maintenance category k must be served by at least one type of technician.
∑ 𝑏𝑖𝑘𝑃
𝑖∈𝐼
≥ 1 ∀𝑘 ∈ 𝐾
(14) Constraint set 12: A binary decision variable is defined to indicate whether vessel type j is selected to execute maintenance category k.

15
𝑦𝑗𝑘 ≤ 𝑀 ∙ 𝑏𝑗𝑘𝑉 𝑎𝑛𝑑 𝑦𝑗𝑘 ≥ 𝑏𝑗𝑘
𝑉 ∀ 𝑗 ∈ 𝐽, 𝑘 ∈ 𝐾
(15) Constraint set 13: Each maintenance category k must be served by at least one type of vessel.
∑ 𝑏𝑗𝑘𝑉
𝑗∈𝐽
≥ 1 ∀𝑘 ∈ 𝐾
(16) Constraint set 14: The number of each type of technicians must be at least the number required to carry the associated maintenance works.
𝑥𝑖𝑘 ≥ 𝑞𝑘 ∙ 𝑏𝑖𝑘𝑃 ∀ 𝑖 ∈ 𝐼, 𝑘 ∈ 𝐾
(17)
𝑋𝑖 ≥ 𝑞𝑘 ∙ 𝑏𝑖𝑘𝑃 ∀ 𝑖 ∈ 𝐼, 𝑘 ∈ 𝐾
(18)
Constraint set 15: A mother ship will be used (𝑏𝑀 = 1) if any daughter ship (𝑗 = 5) is organised to undertake maintenance jobs.
𝑏𝑀 ≥ 𝑏𝑗𝑘𝑉 𝑗 = 5, ∀ 𝑘 ∈ 𝐾
(19) Constraint set 16: Offshore based turbine technicians (i=4) must be transported by the daughter ships (j=5) with use of a mother ship for maintenance k.
𝑏𝑖𝑘𝑃 = 𝑏𝑗𝑘
𝑉 𝑖 = 4, 𝑗 = 5, ∀ 𝑘 ∈ 𝐾
(20)
Constraint set 17: The number of daughter ships used is restricted by the maximum parking space of a mother ship.
𝑌𝑗 ≤ 𝑉𝑑𝑎𝑢𝑔ℎ𝑡𝑒𝑟 𝑗 = 5
(21)
4.3 Stochastic optimisation model
The second optimisation model in the DSS treats the failure rates of OWF components as a stochastic parameter. This stochastic programming model is integrated into the system for users who provide frequency of each maintenance category as probabilistic scenarios. The advantage of stochastic programming is that it attempts to identify a solution to an optimisation problem while directly addressing uncertainty.
There are three major approaches to stochastic programming, namely probabilistic or chance constraint, modelling future response or resource, and scenario-based analysis (Novak and Ragsdale, 2003). To avoid non-convex constraints and calculation of the resource function with multi-dimensional integration, a range of scenarios of the failure rate for corrective maintenance will be implemented as an effective way to achieve the cost optimisation. A number of additional parameters and decision variables are defined for the failure rate with probability in a set of scenarios.

16
𝑤 ∈ 𝑊: Set of scenarios (1…243 in the model) 𝐹𝑘𝑠: 𝑓𝑎𝑖𝑙𝑢𝑟𝑒 𝑟𝑎𝑡𝑒 𝑜𝑓 𝑐𝑎𝑡𝑒𝑔𝑜𝑟𝑦 𝑘 𝑖𝑛 𝑠𝑐𝑒𝑛𝑎𝑟𝑖𝑜 𝑠
𝑃𝑟𝑜𝑘𝑠: 𝑝𝑟𝑜𝑏𝑎𝑏𝑖𝑙𝑖𝑡𝑦 𝑜𝑓 𝑓𝑎𝑖𝑙𝑢𝑟𝑒 𝑟𝑎𝑡𝑒 𝑜𝑓 𝑐𝑎𝑡𝑒𝑔𝑜𝑟𝑦 𝑘 𝑖𝑛 𝑠𝑐𝑒𝑛𝑎𝑟𝑖𝑜 𝑠
𝐽𝐹𝑘𝑤: 𝑓𝑎𝑖𝑙𝑢𝑟𝑒 𝑟𝑎𝑡𝑒𝑠 𝑓𝑜𝑟 𝑐𝑎𝑡𝑒𝑔𝑜𝑟𝑦 𝑘 𝑖𝑛 𝑗𝑜𝑖𝑛𝑡 𝑠𝑐𝑒𝑛𝑎𝑟𝑖𝑜 𝑤
𝐽𝑃𝑟𝑜𝑘𝑤: 𝑝𝑟𝑜𝑏𝑎𝑏𝑖𝑙𝑖𝑡𝑦 𝑜𝑓 𝑓𝑎𝑖𝑙𝑢𝑟𝑒 𝑟𝑎𝑡𝑒 𝑜𝑓 𝑐𝑎𝑡𝑒𝑔𝑜𝑟𝑦 𝑘 𝑖𝑛 𝑗𝑜𝑖𝑛𝑡 𝑠𝑐𝑒𝑛𝑎𝑟𝑖𝑜 𝑤
𝑇𝑃𝑟𝑜𝑤: 𝑡𝑜𝑡𝑎𝑙 𝑝𝑟𝑜𝑏𝑎𝑏𝑖𝑙𝑖𝑡𝑦 𝑜𝑓 𝑗𝑜𝑖𝑛𝑡 𝑠𝑐𝑒𝑛𝑎𝑟𝑖𝑜 𝑤
𝑇𝑃𝑟𝑜𝑤 = 𝐽𝑃𝑟𝑜1𝑤 ∗ 𝐽𝑃𝑟𝑜2𝑤 ∗ … ∗ 𝐽𝑃𝑟𝑜𝑘𝑤
To simulate the variance of corrective maintenance frequency in the stochastic model, failure rates of all OWF components are provided by a set of scenarios of probabilistic data. As shown by Table 4, each of the five categories is given by three optional levels of failure rate: low, mid and high. A corresponding probability of occurrence is associated with each single scenario. The mean values of failure rates used in the stochastic model are the same as the ones used in the deterministic model.
k 𝐹𝑘𝑠 𝑃𝑟𝑜𝑘𝑠
Low Mid High Low Mid High
1 1.920 4.275 7.125 0.25 0.50 0.25
2 0.020 0.040 0.120 0.15 0.70 0.15
3 0.030 0.080 0.240 0.15 0.70 0.15
4 1.008 2.250 3.750 0.25 0.50 0.25
5 0.110 0.320 0.960 0.25 0.50 0.25 Table 4: Probability distribution of maintenance frequency for category k in scenarios
In respect to the five corrective maintenance categories in Table 4, 243 joint scenarios (35) would be considered to predict the maintenance requirements. For instance, the failure rates of the maintenance categories k in joint scenarios 1 (𝐽𝐹𝑘1) is (1.092, 0.020, 0.030, 1.008,
0.110). The associated joint probability in joint scenarios 1 (𝐽𝑃𝑟𝑜𝑘1) is (0.25, 0.15, 0.15, 0.25, 0.25). Then by using the equation the total probability (𝑇𝑃𝑟𝑜1) is 0.25 * 0.15 * 0.15 * 0.25 * 0.25 = 0.0003515625.
The total personnel cost and fixed vessel cost are expressed in the same way as in the deterministic model, which consists of optimising the number of each type of technician and each type of vessel. Vessel variable cost, mother ship cost and downtime cost are determined in terms of the joint scenarios associated with the stochastic combination of failure rates in the five corrective maintenance categories. The objective function considers the mean cost of vessel variable cost, mother ship cost and downtime cost are considered in the objective function, with respect to the different failure rates.
𝑀𝑖𝑛 𝑧𝑠 = ∑ 𝐶𝑖𝑃 ∙ 𝑋𝑖
𝑖∈𝐼
+ ∑ 𝐶𝑗𝐹 ∙ 𝑌𝑗
𝑗∈𝐽
+ ∑ ∑ ∑ 𝐶𝑗𝑉 ∙ 𝑏𝑗𝑘
𝑉 ∙
𝑤∈𝑊𝑘∈𝐾
(𝐿𝑘𝑅𝑒𝑝𝑎𝑖𝑟
+ 2𝐿𝑗𝑇𝑟𝑎𝑣𝑒𝑙) ∙ 𝑈𝑘 ∙ 𝐽𝐹𝑘𝑤 ∙ 𝑇𝑃𝑟𝑜𝑤
𝑗∈𝐽
+ ∑ 𝐶𝑀 ∙ 𝑏𝑤𝑀
𝑤∈𝑊
∙ 𝑇𝑃𝑟𝑜𝑤
+ ∑ ∑ 𝑅𝐿 ∙ (∑(𝐿𝑗𝑇𝑟𝑎𝑣𝑒𝑙 + 𝐿𝑗
𝑃𝑟𝑒𝑝𝑎𝑟𝑒) ∙ 𝑏𝑗𝑘𝑤
𝑉 + 𝐿𝑘𝑅𝑒𝑝𝑎𝑖𝑟
+ 𝐿𝑘𝐿𝑜𝑔𝑖𝑠𝑡𝑖𝑐𝑠
𝑗∈𝐽
)
𝑤∈𝑊
∙ 𝑈𝑘 ∙ 𝐽𝐹𝑘𝑤 ∙ 𝑇𝑃𝑟𝑜𝑤
𝑘∈𝐾
(22) Subject to

17
𝑥𝑖𝑘𝑤 ∙ 𝐻𝑖𝑃 ∙ 𝐿𝑖
𝑃 ≥ 𝑞𝑘 ∙ 𝐿𝑘𝑅𝑒𝑝𝑎𝑖𝑟
∙ 𝐹𝑘𝑤 ∙ 𝑈𝑘 ∙ 𝑏𝑖𝑘𝑤𝑃 ∀ 𝑖 ∈ 𝐼, 𝑘 ∈ 𝐾, 𝑤 ∈ 𝑊
(23)
𝑋𝑖𝑤 ∙ 𝐻𝑖𝑃 ∙ 𝐿𝑖
𝑃 ≥ ∑ 𝑞𝑘 ∙ 𝐿𝑘𝑅𝑒𝑝𝑎𝑖𝑟
∙ 𝐹𝑘𝑤 ∙ 𝑈𝑘 ∙ 𝑏𝑖𝑘𝑤𝑃
𝑘∈𝐾
∀ 𝑖 ∈ 𝐼, 𝑤 ∈ 𝑊 (24)
𝑦𝑗𝑘𝑤 ∙ (𝐻𝑗𝑉 − 2𝐿𝑗
𝑇𝑟𝑎𝑣𝑒𝑙) ∙ 𝐿𝑗𝑉 ≥ 𝐿𝑘
𝑅𝑒𝑝𝑎𝑖𝑟∙ 𝐹𝑘𝑤 ∙ 𝑈𝑘 ∙ 𝑏𝑗𝑘𝑤
𝑉 ∀ 𝑗 ∈ 𝐽, 𝑘 ∈ 𝐾, 𝑤 ∈ 𝑊
(25)
𝑌𝑗𝑤 ∙ (𝐻𝑗𝑉 − 2𝐿𝑗
𝑇𝑟𝑎𝑣𝑒𝑙) ∙ 𝐿𝑗𝑉 ≥ ∑ 𝐿𝑘
𝑅𝑒𝑝𝑎𝑖𝑟∙ 𝐹𝑘𝑤 ∙ 𝑈𝑘 ∙ 𝑏𝑗𝑘𝑤
𝑉
𝑘∈𝐾
∀ 𝑗 ∈ 𝐽 𝑤 ∈ 𝑊 (26)
∑ 𝑥𝑖𝑘𝑤𝑖∈𝐼
≤ ∑ 𝑦𝑗𝑘𝑤 ∙ 𝑄𝑗𝑗∈𝐽
∀ 𝑘 ∈ 𝐾, 𝑤 ∈ 𝑊 (27)
𝑥𝑖𝑘𝑤 ≤ 𝑋𝑖𝑤 , 𝑋𝑖 = 𝑋𝑖𝑤 ∙ 𝑇𝑃𝑟𝑜𝑤 ∀ 𝑖 ∈ 𝐼, 𝑘 ∈ 𝐾, 𝑤 ∈ 𝑊
(28)
𝑦𝑗𝑘𝑤 ≤ 𝑌𝑗𝑤 , 𝑌𝑖 = 𝑌𝑗𝑤 ∙ 𝑇𝑃𝑟𝑜𝑤 ∀ 𝑗 ∈ 𝐽, 𝑘 ∈ 𝐾, 𝑤 ∈ 𝑊
(29)
𝑥𝑖𝑘𝑤 ≤ 𝑀 ∙ 𝑍𝑖𝑘𝑃 ∀ 𝑖 ∈ 𝐼, 𝑘 ∈ 𝐾, 𝑤 ∈ 𝑊
(30)
𝑦𝑗𝑘𝑤 ≤ 𝑀 ∙ 𝑍𝑗𝑘𝑉 ∀ 𝑗 ∈ 𝐽, 𝑘 ∈ 𝐾, 𝑤 ∈ 𝑊
(31)
𝑥𝑖𝑘𝑤 ≤ 𝑀 ∙ 𝑏𝑖𝑘𝑤𝑃 𝑎𝑛𝑑 𝑥𝑖𝑘𝑤 ≥ 𝑏𝑖𝑘𝑤
𝑃 ∀ 𝑖 ∈ 𝐼, 𝑘 ∈ 𝐾, 𝑤 ∈ 𝑊
(32)
∑ 𝑏𝑖𝑘𝑤𝑃
𝑖∈𝐼
≥ 1 𝑘 ∈ 𝐾, 𝑤 ∈ 𝑊 (33)
𝑦𝑗𝑘𝑤 ≤ 𝑀 ∙ 𝑏𝑗𝑘𝑤𝑉 𝑎𝑛𝑑 𝑦𝑗𝑘𝑤 ≥ 𝑏𝑗𝑘𝑤
𝑉 ∀ 𝑗 ∈ 𝐽, 𝑘 ∈ 𝐾, 𝑤 ∈ 𝑊
(34)
∑ 𝑏𝑗𝑘𝑤𝑉
𝑗∈𝐽
≥ 1 𝑘 ∈ 𝐾, 𝑤 ∈ 𝑊 (35)
𝑥𝑖𝑘𝑤 ≥ 𝑞𝑘 ∙ 𝑏𝑖𝑘𝑤𝑃 ∀ 𝑖 ∈ 𝐼, 𝑘 ∈ 𝐾, 𝑤 ∈ 𝑊
(36)
𝑋𝑖𝑤 ≥ 𝑞𝑘 ∙ 𝑏𝑖𝑘𝑤𝑃 ∀ 𝑖 ∈ 𝐼, 𝑘 ∈ 𝐾, 𝑤 ∈ 𝑊
(37)
𝑏𝑤𝑀 ≥ 𝑏𝑗𝑘𝑤
𝑉 𝑗 = 5, ∀ 𝑘 ∈ 𝐾, 𝑤 ∈ 𝑊
(38)
𝑏𝑖𝑘𝑤𝑃 = 𝑏𝑗𝑘𝑤
𝑉 𝑖 = 4, 𝑗 = 5, ∀𝑘 ∈ 𝐾, 𝑤 ∈ 𝑊
(39)
𝑌𝑗𝑤 ≤ 𝑉𝑑𝑎𝑢𝑔ℎ𝑡𝑒𝑟 𝑗 = 5 ∀ 𝑤 ∈ 𝑊
(40)
Sufficient technicians and vessels should be used to meet the maintenance requirement (𝐹𝑘𝑤 ∙ 𝑈𝑘) in each joint scenario w (Eq.23 - Eq.26). Vessel capacity to carry technicians (𝑄𝑗)
is still a key constraint here (Eq.27). The number of all technicians for maintenance k in joint scenario w (∑ 𝑥𝑖𝑘𝑤𝑖∈𝐼 ) who are transported by a compatible vessel j is restricted by the vessel’s maximum capacity (∑ 𝑦𝑗𝑘𝑤 ∙ 𝑄𝑗𝑗∈𝐽 ) . Vessel j or technician i can be selected to
execute maintenance k in joint scenario w only if the vessel or technician is compatible to the maintenance category (Eq.30 and Eq.31). The mother ship contributes a separate vessel
cost (Eq.38), which is incurred (𝑏4𝑘𝑤𝑃 = 𝑏5𝑘𝑤
𝑉 = 1) if at least one daughter ship (𝑦5𝑘𝑤𝑉 ) is used
with offshore based technicians (𝑥4𝑘𝑤𝑃 ) in a joint scenario w.

18
5. Implementation and experimental results
The DSS is implemented on Visual Basic for Application (VBA) as a user interface. The optimisation models, deterministic and stochastic, have been implemented in Xpress, and integrated in the DSS. VBA provides a platform with a high degree of flexibility and control, for constructing the user interface. It also gives the ability to simply import/export data from/to an external database (Agilent Technologies, 2007). Xpress is used to search the optimal solution(s) based on the input data for a particular offshore wind farm. An execution of the DSS using a sample case is described in this section, which will detail the input data and output results. The sensitivity of the DSS is also tested by changing the failure rates and size of OWF.
5.1 System input data collection
The essential system input data of the DSS was collected using an online survey, which was completed by different offshore wind stakeholders. Twenty-nine experts in the sector gave responses to the online survey, including O&M managers, O&M consultants, engineering technicians, and port managers. Further details of the online survey and responses are available on the 2OM project WP1: Maintenance Decision Support Tool (Li et al, 2015a). Following on from the survey, a number of interviews to key experts in the industry (including O&M managers and port managers), were arranged in order to acquire further practical information of O&M and to validate the DSS and receive constructive feedback on how the DSS could be improved. In addition, working groups with specialists from the sector was another efficient way to understand the operational issues in offshore wind maintenance. All collected data has been filtered and aggregated, and then entered into the DSS as the system inputs.
Characteristics of the nine maintenance categories are pre-defined in the system, including preparation time, repair/replacement time, logistics time and number of technicians required for each maintenance category. The categorisation of preventive (scheduled) and corrective (unscheduled) maintenance is described in section 3. For the technical specification of wind turbines, such as rated capacity and rated wind speed, they are available from the 4cOffshore website (http:// 4cOffshore.com). The VBA-based user interface allows users to modify the parameters and save the settings in the system input data. The saved information can be loaded to the memory for running the system. The user-defined settings are transferred to the software to make decisions for the particular wind farm.
5.2 Sample case
In order to evaluate the proficiency of DSS an implementation with sample data has been carried out. A user input data form has been created with a series of questions to ask the user for the technical, structural and environmental information for an offshore wind farm. The input information is comprised of wind turbines, balance of plant, location and sea state (see Figure 2). The data of Rampion offshore wind farm is used for the user inputs as a
sample. Rampion wind farm was a case study for the 2OM (Offshore Operations & Maintenance Mutualisation) project, financed by the EU Interreg IVA France (Channel) – England programme, so the proposed models have been tested on estimated data from the Rampion wind farm since the site (in common with other similar round 3 UK sites) has not yet been built. Rampion offshore wind farm is off the South Coast of the UK, and it is one of

19
the new ‘round 3’ sites designated by the UK government. 116 wind turbines are currently planned to be installed at the farm, which are specified technically by the rated capacity of 3.45MW and the rated wind speed of 12.5m/s. The average distance from onshore to the farm is 16.9km and the water depth range is between 19 and 39m. Monopile foundations are used to give each wind turbine a total height of 140m. Two 23-km export cables and 140km array cables will be installed. The mean wind speed over the last 10 years is 10m/s.
Figure 2: User input data form
Figure 3 shows the information about costs and capacity of each vessel type. The cost and working time of maintenance technicians are also presented in the same data input form of the DSS. All types of vessels except the helicopters are selected in the case study, by clicking the selection boxes, to undertake maintenance works. All personnel types are selected to take part in the maintenance planning.
Figure 3: System input data form of vessels and technicians

20
Maintenance frequency for both preventive and corrective activities, as the critical parameters to identify the workloads, must be supplied at the next stage (see Figure 4). For preventive maintenance, the frequency indicates how often the user plans to conduct an inspection / repair on each OWF component. Similar data for the corrective maintenance depends significantly on the component failure rates. Two options of mathematical models, namely deterministic or stochastic, are implemented in the DSS to generate solutions with minimum cost. In case users can just supply the mean value of maintenance frequency, they need to give the data in the ‘mean frequency’ column and choose deterministic optimisation. The users who have probabilistic maintenance frequencies for each corrective category can input multiple level frequency data with the incurrence probabilities. The user can then select the stochastic optimisation model in order for the DSS to take into account the various levels of frequencies and provide more realistic solutions. Figure 4 illustrates the frequency of both preventive and corrective maintenance. The stochastic model is used to optimise the maintenance planning by giving the probabilistic data at low, mean and high levels.
Figure 4: Maintenance frequency inputs
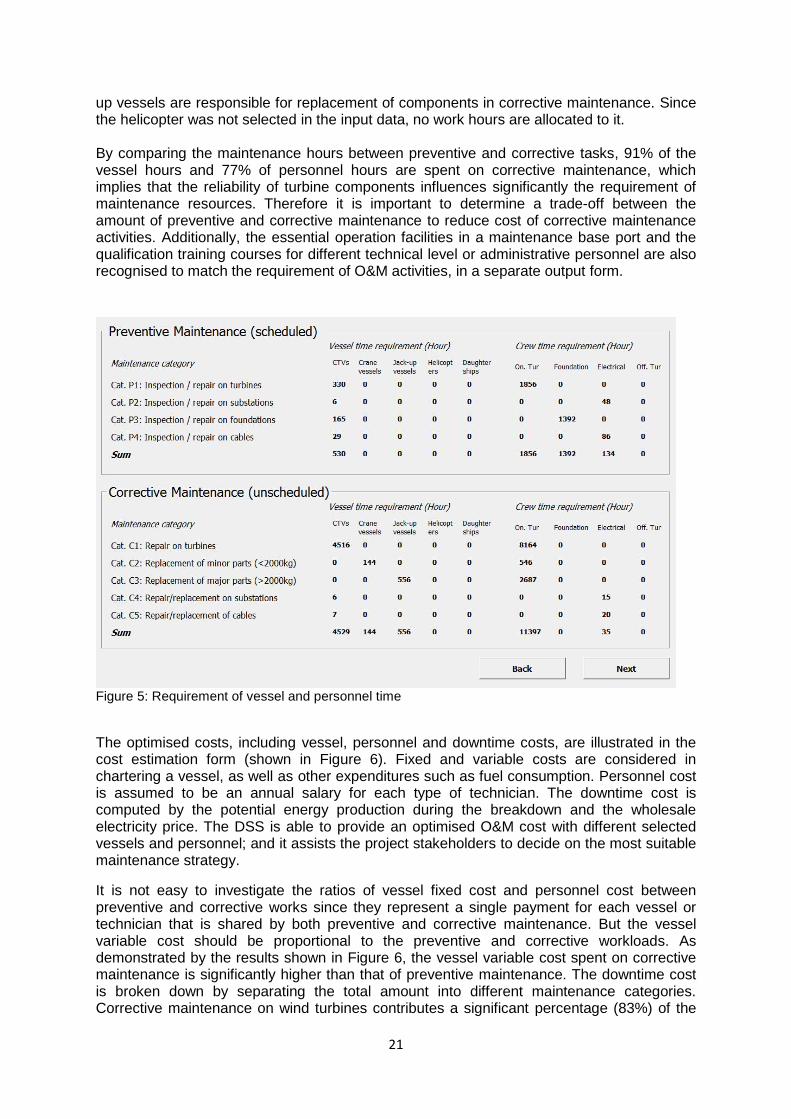
In this study, the deterministic and stochastic models were coded and solved using Xpress IVE software on a work laptop with Corei5 2.8gigahertz and 4gigbytes RAM. All optimal solutions in respect to different input data were acquired within a reasonable range of implementation time. With regards to the expected maintenance workload, the DSS computes the number of hours of use of each vessel type and technicians in different maintenance categories. All the results are determined by the optimisation models in order to meet the demand. As the results show in Figure 5, no offshore-based vessel and technician, including mother ships, daughter ships and offshore-based turbine technicians, are used in this plan although they are clicked as available maintenance resources. The offshore based maintenance strategy does not give an obvious advantage at a relatively short distance (16.9km) from the OWF to shore. The majority of the personnel working hours on both preventive and corrective maintenance are also found in the onshore-based turbine technician teams, which is consistent with the usage of maintenance vessels. Figure 5 shows that crew transfer vessels (CTVs) are assigned to all of the preventive maintenance (530 hours) and most of the corrective maintenance (4529 hours). Crane vessels and jack-
21
up vessels are responsible for replacement of components in corrective maintenance. Since the helicopter was not selected in the input data, no work hours are allocated to it. By comparing the maintenance hours between preventive and corrective tasks, 91% of the vessel hours and 77% of personnel hours are spent on corrective maintenance, which implies that the reliability of turbine components influences significantly the requirement of maintenance resources. Therefore it is important to determine a trade-off between the amount of preventive and corrective maintenance to reduce cost of corrective maintenance activities. Additionally, the essential operation facilities in a maintenance base port and the qualification training courses for different technical level or administrative personnel are also recognised to match the requirement of O&M activities, in a separate output form.
Figure 5: Requirement of vessel and personnel time
The optimised costs, including vessel, personnel and downtime costs, are illustrated in the cost estimation form (shown in Figure 6). Fixed and variable costs are considered in chartering a vessel, as well as other expenditures such as fuel consumption. Personnel cost is assumed to be an annual salary for each type of technician. The downtime cost is computed by the potential energy production during the breakdown and the wholesale electricity price. The DSS is able to provide an optimised O&M cost with different selected vessels and personnel; and it assists the project stakeholders to decide on the most suitable maintenance strategy.
It is not easy to investigate the ratios of vessel fixed cost and personnel cost between preventive and corrective works since they represent a single payment for each vessel or technician that is shared by both preventive and corrective maintenance. But the vessel variable cost should be proportional to the preventive and corrective workloads. As demonstrated by the results shown in Figure 6, the vessel variable cost spent on corrective maintenance is significantly higher than that of preventive maintenance. The downtime cost is broken down by separating the total amount into different maintenance categories. Corrective maintenance on wind turbines contributes a significant percentage (83%) of the

22
cost due to turbine breakdown. Such a high percentage could result from the higher frequency of corrective activities, and the longer replacement and logistics times.
Figure 6: Maintenance cost estimation
In addition, the deterministic model has been implemented to find the optimal solution in the sample case. A comparison of the results between the deterministic and stochastic models is given on Table 4. The stochastic model suggests hiring one additional turbine technician than the deterministic model as it considers potentially higher wind turbine failure rates. For the same reason, one additional lease period of crew transfer vessel and jack-up vessel are required to meet the higher maintenance demand. As a corresponding result of greater amount of maintenance resources, all of the optimised costs from the stochastic model are higher than those for the deterministic model. With the larger number of turbine technicians, the personnel cost presents 8% higher than deterministic model. The vessel fixed and variable costs from the stochastic model demonstrate 51% and 19% increase, respectively. Taking into account the relatively minor difference of 8% in the downtime costs, there is a 15% aggregate gap between the total costs from the deterministic and stochastic optimisation models. The more accurate technical data of breakdown rates, the more correct requirement of maintenance resources can be determined. Table 4: Comparison of results between the deterministic and stochastic models
Deterministic model Stochastic model
Technicians
Turbine technician (onshore) 7 8
Foundation technician 3 3
Electrical Technician 3 3
Turbine technician (offshore) 0 0
Vessels
Crew transfer vessel 2 3
Crane vessel 1 1
Jack-up vessel 1 2
Helicopter 0 0
Daughter ship 0 0
Costs
Personnel cost (£1,000,000) 0.615 0.663
Vessel fixed cost (£1,000,000) 0.557 0.842
Vessel variable cost (£1,000,000) 1.122 1.330
Mother ship cost (£1,000,000) 0 0
Downtime cost (£1,000,000) 2.833 3.050
Total cost (£1,000,000) 5.127 5.885

23
5.3 Sensitivity analysis
A sensitivity analysis has been conducted to evaluate the impact of an increase in the number of wind turbines installed in an OWF on the number of vessels and technicians needed to meet the maintenance demand, and the corresponding total costs. Although economies of scale may suggest that a lower cost per turbine may be achievable. The failure rates of different components in an OWF are another key parameter to determine the maintenance workload and the related costs. Therefore, the solutions from the DSS were investigated by changing value of the component failure rates and the number of wind turbines, in order to investigate its sensitivity in different situations.
The effect of failure rates
An investigation with respect to failure rates was implemented with a variety of changes in failure rates, increasing and decreasing by 25% and 50%, in order to test the sensitivity of required maintenance resources. The numbers of technicians and vessels required to carry maintenance works illustrate the corresponding changes (see Table 5). One additional turbine technician is needed to meet the maintenance requirement with every 25% increase in the failure rates. The numbers of foundation technicians and electrical technicians are stable regardless of the increased or decreased failure rates. The effects on electrical and foundation technicians are not that significant because of the relatively lower breakdown frequency in foundations, substations and cables. No mother ship and offshore-based technicians are considered to take the maintenance tasks, with the changing failure rates. Such a result could be resulted from the nature of failures on offshore wind turbines; and relatively higher cost of mother ship might be another reason. The number of crew transfer vessels demonstrates an increase pattern; and longer charter lease of crane vessel and jack-up vessel are also requested to satisfy the growing maintenance demands. No helicopter is scheduled to provide service in maintenance plan, although it was assumed as available maintenance resource. This could result from the relatively higher costs and restricted compatibility to maintenance categories on this transportation mode.
Table 5: The effect of the varying failure rates on personnel, vessel and costs
Decreased by 50%
Decreased by 25%
Base rate Increased by 25%
Increased by 50%
Technicians
Turbine technician (onshore) 6 7 8 10 11
Foundation technician 3 3 3 3 3
Electrical Technician 3 3 3 3 3
Turbine technician (offshore) 0 0 0 0 0
Vessels
Crew transfer vessel 2 2 3 3 4
Crane vessel 1 1 1 1 2
Jack-up vessel 1 2 2 2 2
Helicopter 0 0 0 0 0
Daughter ship 0 0 0 0 0
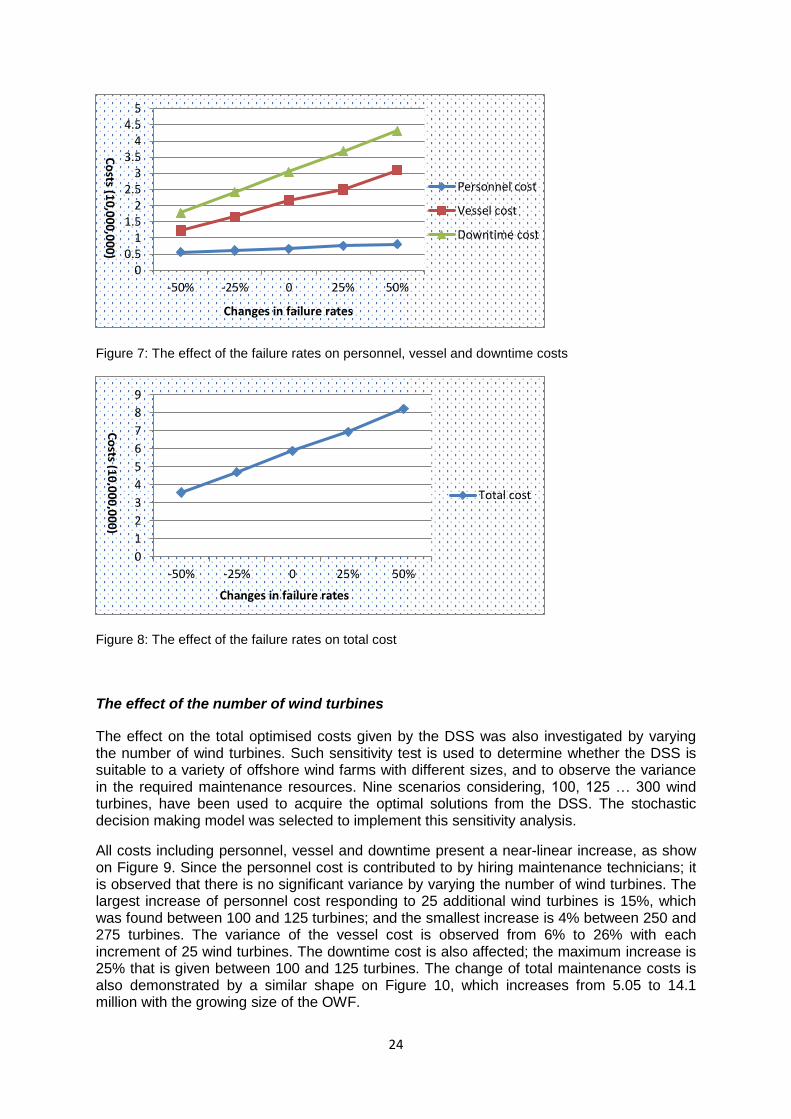
As show on Figure 7, with the increased failure frequency by 25%, the personnel cost increases by 8-14% and vessel costs increase by 15-35%. The increase in downtime cost is more significant, 20-35%, compared to the investment on vessel and personnel. The downtime costs contribute more than 50% of the total costs in all the scenarios. In addition, the increase results in 18-31% aggregate growth in overall maintenance cost, as show by Figure 8.
24
Figure 7: The effect of the failure rates on personnel, vessel and downtime costs
Figure 8: The effect of the failure rates on total cost
The effect of the number of wind turbines
The effect on the total optimised costs given by the DSS was also investigated by varying the number of wind turbines. Such sensitivity test is used to determine whether the DSS is suitable to a variety of offshore wind farms with different sizes, and to observe the variance in the required maintenance resources. Nine scenarios considering, 100, 125 … 300 wind turbines, have been used to acquire the optimal solutions from the DSS. The stochastic decision making model was selected to implement this sensitivity analysis.
All costs including personnel, vessel and downtime present a near-linear increase, as show on Figure 9. Since the personnel cost is contributed to by hiring maintenance technicians; it is observed that there is no significant variance by varying the number of wind turbines. The largest increase of personnel cost responding to 25 additional wind turbines is 15%, which was found between 100 and 125 turbines; and the smallest increase is 4% between 250 and 275 turbines. The variance of the vessel cost is observed from 6% to 26% with each increment of 25 wind turbines. The downtime cost is also affected; the maximum increase is 25% that is given between 100 and 125 turbines. The change of total maintenance costs is also demonstrated by a similar shape on Figure 10, which increases from 5.05 to 14.1 million with the growing size of the OWF.
00.5
11.5
22.5
33.5
44.5
5
-50% -25% 0 25% 50%
Personnel cost
Vessel cost
Downtime cost
Changes in failure rates
Co
sts(1
0,0
00
,00
0)
0
1
2
3
4
5
6
7
8
9
-50% -25% 0 25% 50%
Total cost
Co
sts (10
,00
0,0
00
)
Changes in failure rates

25
Figure 9: The effect of the number of wind turbines on personnel, vessel and downtime costs
Figure 10: The effect of the number of wind turbines on total cost
5.4 Comparison and validation of the performance of the proposed model
using the case study of Dinwoodie et al. (2015)
This section evaluates and compares the performance of the proposed model to the results
of the models published by Dinwoodie et al. (2015) using their case studies. As the
deterministic model supplies more accurate results, which is more comparable with other
model results. In the paper, a set of reference cases have been used to verify four decision
support or simulation models: Strathclyde analysis tool, NOWIcob decision support tool,
University of Stavanger (UiS) Simulation model and ECUME model. A base case consists of
80 wind turbines with the rated capacity of 3.0 MW, which is located 50km from an onshore
maintenance base. Cables, substations and foundations in the wind farm were not
considered for O&M operations in the offshore wind farm. Three vessel types were
considered to carry out the annual services and five categories of corrective maintenance,
0
0.1
0.2
0.3
0.4
0.5
0.6
0.7
0.8
0.9
100 125 150 175 200 225 250 275 300
Co
sts
(£1
0,0
00
,00
0)
Number of wind turbines
Personnelcost
Vessel cost
Downtimecost
0
0.2
0.4
0.6
0.8
1
1.2
1.4
1.6
100 125 150 175 200 225 250 275 300
Co
sts
(£1
0,0
00
,00
0)
Number of wind turbines
Total cost

26
including manual resets, minor repair, medium repair, major repair and major replacement.
There are three crew transfer vessels (CTV), one field support vessel (FSV), and one heavy-
lift vessel (HLV) available in the base case. As no offshore based platform is involved in the
maintenance strategy, onshore-based turbine technicians only are considered to take part in
all the O&M activities. In addition, spare parts logistics are neglected for simplicity in order to
carry out the comparison with the different models.
A comparison of results of the proposed deterministic model and the models in the literature
is presented in Table 6. In the base case, all the cost results with the particular number of
CTVs and technicians from the proposed model in the DSS are allocated within the result
ranges published in the paper. The DSS model provided the maximal annual loss of
production £21.54 million against other models, with an assumption of keeping 100%
productivity under a desirable environment. Vessel cost is lower than other model results but
repair cost stays at the highest level. In aggregate, therefore, direct O&M cost of the DSS
model (£16.83 million) is just higher than the ECUME model but below three models.
Table 6: Results for the base case
DSS Model
Strathclyde CDT
NOWIcob
UiS Sim Model
ECUME model
Average
Annual loss of production £21.54 m £17.28 m
£16.63 m
£15.48 m
£18.64 m
£17.91 m
Annual direct O&M cost £16.83 m £22.44 m
£25.17 m
£17.93 m
£14.48 m
£19.37 m
Annual vessel cost £10.73 m £17.84 m
£19.18 m
£12.24 m
£9.30 m
£13.86 m
Annual repair cost £4.50 m £3.00 m
£4.39 m
£4.08 m
£3.58 m
£3.91 m
Annual technician cost £1.60 m £1.60 m
£1.60 m
£1.60 m
£1.60 m
£1.60 m
The base case is implemented first, and then a number of other cases are generated from
the base case for investigating the quantitative sensitivity, such as more (5) CTVs and fewer
(1) CTVs, more (30) and fewer (10) technicians, failure rates down (50%) and up (200%).
Figure 11 shows direct O&M costs for the base case and other cases. By comparing with the
results of the other four models presented on the paper (Dinwoodie et al., 2015), the
quantitative trend is relatively consistent across the reference cases. The DSS results
provide relative lower direct O&M costs in most of the reference cases, especially the almost
minimal O&M cost in the case of more CTVs. Only the case of failure rates up affects the
direct O&M cost on the DSS model more significantly than the other models.

27
Figure 11: Annual direct O&M cost of the models for the reference cases
In addition, it is investigated to compare the annual direct O&M costs between optimal
number of CTVs from DSS and other models applied in the related reference cases. The
optimal solution to achieve the minimised total cost suggests that five CTVs, one FSV and
one HLV are used to cover the maintenance requirement within the base case. It gives the
same number of CTVs as the reference case of more CTVs, but the overall cost in the DSS
optimal solution almost reaches the lowest boundary of result range of other four models. A
similar investigation was carried out to compare the cost performance of the optimal number
of technicians with other models. The DSS solution suggests that eleven technicians should
be involved in maintenance activities and the corresponding annual O&M cost is located
nearby the mid-point of the result range in the case of fewer technicians.
6. Conclusion and future work 6.1 Conclusion As offshore wind is a relatively new technology, and there are a limited number of tools available to support O&M planning activities, a decision support system has been designed in this paper to assist multiple stakeholders in designing cost effective O&M decisions. The system proposed includes two optimisation models to minimise the total cost of O&M activities, including personnel cost, fixed vessel cost, variable vessel cost, mother ship cost and revenue loss, in offshore wind maintenance during a given period of time. According to the results obtained from the DSS, offshore wind project developers can prepare O&M resources and organise works in advance to meet the requirement of necessary maintenance activities. All required maintenance resources will be used in a cost effective way in order to optimise the costing performance; and the revenue loss is seen as
£10
£15
£20
£25
£30
£35A
nn
ual
dir
ect
O&
M c
ost
s (M
illio
ns)
DSS model
Strathclyde
NOWIcob
UiS Sim model
ECUME
28
another key element in O&M cost. Additionally, the costs are significantly affected by the reliability of offshore wind turbines and the size of the farm. The implementation results imply that the reliability of OWF components has an immediate effect on the maintenance costs, as the majority of the costs are generated by corrective maintenance. Hence, the stochastic programming model (described in Section 4.2) is able to supply more realistic solutions if failure rates parameters are not known with certainty, since it takes into account a probabilistic failure rates for each OWF component. Such probabilistic data is critical to determine the unforeseen requirement of vessels and technicians for corrective maintenance, in order to maximise the availability of energy production. The stochastic model is thus aimed at OWF stakeholders who do not have significant certainty about turbine failure rates due to lack of knowledge. On the other hand, the deterministic model could be used by OWF stakeholders who are in the position to make more accurate conclusions about the failure rates due to their industrial knowledge. Thus the 15% gap in total costs between the deterministic and stochastic models can be seen as a proxy to the value of information regarding turbine failure rates The DSS also gives an opportunity to understand the sensitivities of the O&M costs due to changes in failure probability and OWF size. The sensitivity results illustrate near-linear changes in O&M costs by varying the failure rates and the number of turbines. Hence, the DSS is able to help offshore wind stakeholders to understand the strategic resource requirements associated with the maintenance of an offshore wind farm. Utilisation of vessels and technicians could potentially be included as further objectives in the optimisation models. In addition, the correlation between preventive maintenance and component failures could be an extra parameter to consider in the further research.
6.2 Future work on the incorporation of weather conditions The effect of weather is one of the most significant factors causing uncertainty in the planning of offshore wind farms. Currently, weather is only accurately predictable on a timescale far shorter than the strategic planning periods considered by the models developed in this paper. The usage examples given in Sections 4 and 5 have been populated by using long-term average weather data from the United Kingdom. However, it is recognised that weather conditions different from the average will result in a performance significantly different from that predicted by the model. The suggested course of action for stakeholders that are concerned by the variance is therefore to execute the model for multiple weather scenarios with different input data in each scenario. The optimal course(s) of action could then be determined by a technique such as discrete news-vendor analysis, which allows for either probabilistic or non-probabilistic analysis, dependent on whether the stakeholder wishes to assign probabilities to the chances of a weather scenario occurring or not. Calculation of the effects of a given weather scenario on the input data of the models presented in Section 4 requires a significant level of understanding of offshore wind operations. As well as the obvious restrictions on accessibility of platforms, the weather will have an effect on the vessel travel times and potentially the vessel availability and charter costs as a poor weather season may induce increased demand for vessels in the smaller time periods of adequate weather conditions. There may also be some effect on the failure rates as harsher than average weather may cause a larger number of failures. The effect on personnel should also not be neglected as seasickness and more challenging working conditions could reduce the number of working hours, number of available technicians in each category and the number of available working days per technician per year. The above paragraph states the considerations in the negative “worse weather than average” scenarios; however the same reasoning also applies in reverse to the positive “better weather than

29
average” scenarios. It is recognised that accurate compilation of the above data for multiple weather scenarios will only be possible for stakeholders with knowledge of and access to wind farm operations data. Therefore it is suggested that, similar to the failure rate case detailed in Section 4, two options for usage of the models are available. Stakeholders without access to detailed weather effect data may use the models as presented with solely the average case to gain an estimate of costs and resources, with the caveat that weather conditions significantly different to the average will results in significantly different resource and cost levels. Stakeholders with access to detailed operational data are recommended to use the approach outlined in the above paragraphs, forming multiple weather data effect scenarios and making decisions, possibly with use of a further analysis technique, based on the model results from across the set of weather data effect scenarios.
Acknowledgement This paper arises from the 2OM (Offshore Operations & Maintenance Mutualisation) project, financed by the EU Interreg IVA France (Channel) – England programme. We would like to thank also all participants who have been involved in the online surveys, interviews and working groups for the project.

30
References Agilent Technologies (2007). VBA Programmer’s Guild, 4th Edition. Appiott J, Dhanju A and Cicin- Sain B (2014). Encouraging renewable energy in the offshore environment. Ocean & Coastal Management 90: 58-64.
Beerbuhl SS, Frohling M and Schultmann (2015). Combined scheduling and capacity planning of electricity-based ammonia production to integrate renewable energies. European Journal of Operational Research 241: 851-862.
Besnard F, Fischer K and Tjernberg L B (2013). A model for the optimisation of the maintenance support organisation for offshore wind farms. IEEE Transportations on Sustainable Energy 4(2): 443-450
Bilgili M, Yasar A and Simsek E (2011). Offshore wind power development in Europe and its comparison with onshore counterpart. Renewable and Sustainable Energy Reviews 15(2): 905-915.
Breton S and Moe G (2009). Status, plans and technologies for offshore wind turbines in Europe and North America. Renewable Energy 34(3): 646-654.
Bussel G J W V and Schontag C (1997). Operation and maintenance aspects of large offshore wind farms.
Carbon Trust (2008). Offshore wind power: big challenge, big opportunity. Online http://www.carbontrust.com/media/42162/ctc743-offshore-wind-power.pdf
Chang K H (2014). A decision support system for planning and coordination of hybrid renewable energy systems. Decision Support Systems 64: 4-13.
Connolly D, Lund H, Mathiesen B and Leahy M (2010). A review of computer tools for analysing the integration of renewable energy into various energy systems. Applied Energy 874: 1059-1082.
Dai L, Ehlers S, Rausand M and Utne IB (2013). Risk of collision between service vessels and offshore wind turbines. Reliability Engineering and System Safety 109: 18-31.
Dalgic Y Lazakis I and Turan O (2013). Vessel charter rate estimation for offshore wind O&M activities. Developments in Maritime Transportation and Exploitation of Sea Resources, Print ISBN: 978-1-138-00124-4, Chapter 99: 899-907.
Dekker R, Bloemhof J and Mallidis I (2012). Operations research for green logistics – An overview of aspects, issues, contributions and challenges. European Journal of Operational Research 219: 671-679.
Ding F and Tian Z (2012). Opportunistic maintenance for wind farms considering multi-level imperfect maintenance thresholds. Renewable Energy 45: 175-182.
Dinwoodie I, McMillan D, Revie M, Lazakis I, Dalgic Y (2013). Development of a combined operational and strategic decision support model for offshore wind. Energy Procedia 35: 157-166.

31
Dinwoodie I, Endrerud OE V, Hofmann M, Martin R, Sperstad I B (2015). Reference cases for verification of offshore O&M simulation models for offshore wind farms. Wind Engineering 39: 1-14.
European Wind Energy Association (2009). Wind energy – the fact: a guide to the technology, economics and future of wind power. London, UK. Online http://www.goodreads.com/book/show/6381844-wind-energy---the-facts
Friris L and Infield D (2009). Renewable energy: in power systems. Chichester: John Wiley and Son Limited, Print ISBN: 978-0-470-01749-4.
Gao X, Yang H and Lu L (2014). Study on offshore wind power potential and wind farm optimisation in Hong Kong. Applied Energy 130: 519-531.
Hameed Z, Vatn J and Heggset J (2011). Challenges in the reliability and maintainability data collection for offshore wind turbines. Renewable Energy 36: 2154-2165.
Halvorsen-Weare E E, Gundegjerde C, Halvoesen IB, Hvattum LM and Nonas L M (2013). Vessel fleet analysis for maintenance operations at offshore wind farms. Energy Procedia 35: 167-176.
Higgins P and Foley A (2014). The evolution of offshore wind power in the United Kingdom. Renewable and Sustainable Energy Reviews 37: 599-612.
Hunt J D, Banares-Alcantara R and Hanbury D (2013). A new integrated tool for complex decision making: Application to the UK energy sector. Decision Support Systems 54: 1427-1441.
Krokoszinski HJ (2003). Efficiency and effectiveness of wind farms – keys to cost optimised operation and maintenance. Renewable Energy 28: 2165-2178.
Laura C S and Vicente D C (2014). Life-cycle cost analysis of floating offshore wind farms. Renewable Energy 66: 41-48.
Li X, Ouelhadj D, Song X, Jones D, Wall G, Howell K E, Igwe P, Martin S, Song D and Pertin E (2015a). WP1report: Maintenance Decision Support Tool, 2OM Project. Li X, Ouelhadj D, Song X, Jones D, Wall G, Howell K E, Igwe P, Martin S, Song D and Pertin E (2015b). WP4 report: Communication, 2OM Project.
Michler-Cieluch T, Krause G and Buck BH (2009). Reflections on integrating operation and maintenance activities of offshore wind farms and mariculture. Ocean & Coastal Management 52: 57-68.
Minguez R, Martinez M, Castellanos OF and Guanche R (2011). Component failure simulation tool for optimal electrical configuration and repair strategy of offshore wind farms. In: OCEANS, 2011 IEEE, Spain: 1-10.
Mirzapour Al-e-hashem S M J, Baboli A and Sazvar Z (2013). A stochastic aggregate production planning model in a green supply chain: considering flexible lead times, nonlinear purchase and shortage cost functions. European Journal of Operational Research 230: 26-41.
Most D and Keles D (2010). A survey of stochastic modelling approaches for liberalised electricity markets. European Journal of Operational Research 207: 543-556.

32
Mostafaeipour A (2010). Feasibility study of offshore wind turbine installation in Iran compared with world. Renewable and Sustainable Energy Reviews 14(7): 1722-1743.
Myhr A, Bjerkseter C, Agotnes A and Nygaard TA (2014). Levelised cost of energy for offshore floating wind turbines in a life cycle perspective. Renewable Energy 66: 714-728.
Nielsen JJ and Sorensen JD (2011). On risk-based operation and maintenance of offshore wind turbine components. Reliability Engineering and System Safety 96: 218-229.
Ochieng EG, Melaine Y, Potts SJ, Zuofa T, Egbu CO, Price ADF and Ruan X (2014). Future for offshore wind energy in the United Kingdom: The way forward. Renewable and Sustainable Energy Reviews 39: 655-666.
O’Keeffe A and Haggett C (2012). An investigation into the potential barriers facing the development of offshore wind energy in Scotland: Case study – Firth of Forth offshore wind farm. Renewable and Sustainable Energy Reviews 16: 3711-3721.
Pahlke T (2007). Software & Decision Support Systems for Offshore Wind Energy Exploitation in North Sea Region. In: Pushing Offshore Wind Energy Regions EU: 1-10. Online http://pcoe.nl/@api/deki/files/1900/=12wp1_executivesummary_sdss-studie_2007-06-05.pdf
Perez B, Minguez R and Guanche (2013). Offshore wind farm layout optimisation using mathematical programming techniques. Renewable Energy 53: 389-399.
Prassler T and Schaechtele J (2012). Comparison of the financial attractiveness among prospective offshore wind parks in selected European countries. Energy Policy 45(6): 86-101.
Rademakers LWMM, Braam H, Zaaijer MB and Van Bussel GJW (2003). Assessment and optimisation of operation and maintenance of offshore wind turbines. In: Proceedings of the European Wind Energy Conference (EWEC), Madrid, Spain.
Scheu M, Matha D, Hofmann M and Muskulus M (2012). Maintenance strategies for large offshore wind farms. Energy Procedia 24: 281-288.
The Crown Estate (2010). A guide to an offshore wind farm. Online http://www.thecrownestate.co.uk/media/5408/ei-km-in-sc-supply-012010-a-guide-to-an-offshore-wind-farm.pdf
Wagner HJ, Baack C, Eickelkamp T, Epe A, Lohmann J and Troy S (2011). Life cycle assessment of the offshore wind farm Alpha Ventus. Energy 36: 2459-2464.
Wanderer T (2009). Development of a GIS Based Decision Support System for Offshore Wind Energy use in the North Sea. Diploma Thesis. Ludwig-Maximilians-University, Munich.
Wang Z, Jiang C, Qian A and Wang C (2009). The key technology of offshore wind farm and its new development in China. Renewable and Sustainable Energy Reviews 13(1): 216-222.
Willis K O and Jones D F (2008). Multi-objective simulation optimisation through search heuristics and relational database analysis. Decision Support Systems 48: 277-286.
Van de Pieterman RP, Braam H, Obdam TS, Rademakers LWMM, Van der Zee TJJ (2011). Optimisation of maintenance strategies for offshore wind farms: A case study performed with the OMCE-Calculator. Present at: The offshore 2011 conference, Amsterdam, The Netherlands.
Zhang Z, Kusiak A and Song Z (2013). Scheduling electric power production at a wind farm.
European Journal of Operational Research 224: 227-238.