a decade of reef check monitoring · (jaringan kerja reef check indonesia). ... analysis of the...
TRANSCRIPT

A Decade of Reef Check Monitoring: Indonesian Coral Reefs, Condition and Trends
Edited by: Abdullah Habibi Naneng Setiasih Jensi Sartin The Indonesian Reef Check Network © 2007

A Decade of Reef Check Monitoring: Indonesian Coral Reefs, Condition and Trends
Edited by: Abdullah Habibi Naneng Setiasih Jensi Sartin Contributors: Reef Check in North Bali and Padang, by Hery Yusamandra - Yayasan Reef Check Indonesia MPA scientist Reef Check in Central Sulawesi, by Abigail Moore - Yayasan Palu Hijau Marine Consultant Design and Layout: Abdullah Habibi Cover Photograph: Sudarsono Distribution of this publication was made possible through support from the Yayasan Reef Check Indonesia and the members of the Indonesian Reef Check Network (Jaringan Kerja Reef Check Indonesia). This report may be quoted or reproduced as long as proper reference is made to the source. This publication may be obtained by downloading it from www.jkri.or.id The Indonesian Reef Check Network (Jaringan Kerja Reef Check Indonesia, JKRI) is a network to enable communication between Reef Check organisers, supporters and volunteers in Indonesia. Information regarding the Indonesian Reef Check Network activities can be obtained from www.jkriindonesia.blogspot.com, and the Reef Check method is available from www.reefcheck.or.id. Please become part of the coral reef conservation movement through joining us via the JKRI mailing list: [email protected].
ii

Executive Summary Reef Check is a coral reef monitoring method which has now been used for a decade in Indonesia. From this first decade of RC surveys in Indonesia from 1997-2006, we can say that overall the hard coral cover (Hard Coral) which is used as an indicator of coral reef health is in the Average category (26-50%), with a downwards trend. The percentage live cover varies from 40.90% to 56.96% with the highest percentage recorded in 2000 and the lowest in 1999. Conversely, the non-living (abiotic) cover was lowest in 2000 and highest in 1999. Butterfly fish are one of the indicators used to assess the pressure from collection for the marine aquarium trade, and there is a slight downward trend in the annual average abundance. Whereas for fish used as indicators of the live reef fish trade and overfishing the figures indicate very heavy fishing pressure, indeed for Barramundi Cod and Humphead Wrasse the figures per transect per year vary from none to one. Invertebrate data are used to describe four aspects; collection for the marine aquarium trade, overfishing, over harvesting and coral predator population explosions. The abundance of organisms used as indicators of the marine aquarium trade tended to increase, whereas the abundance of organisms used as indicators of overfishing and over harvesting show a significant downward trend. The crow of thorns starfish (COTS) Acanthaster plancii which is an indicator of coral predation was recorded at minimal population levels. Overall, the impacts which cause mechanical damage to coral reefs and the level of trash didn't show any clear increasing or decreasing trend. The majority of coral damage was not very serious (level 1) and on average the highest level of damage was caused by anchoring and other boating activities, whereas trash was also at the same level (level 1) and the majority of impacts were classified as "other". In conclusion, we are aware that the pressure on our coral reefs is increasing in line with development and resource use across Indonesia. If we are to preserve our coral reefs and their resources which should benefit us all, now and in the future, it is imperative that we build partnerships and each play our part in the wise management of this valuable ecosystem. Best regards, Abdullah Habibi Data Officer, Indonesian Reef Check Network (JKRI)
iii

Contents Executive Summary iv1. Introduction 12. Methods 33. Survey Results - Survey Locations
7
- Fish
10
- Invertebrates
13
- Substrate
16
- Impacts
19
- Protected Areas vs. non-Protected Areas
21
4. Lessons learned and success stories 225. Recommendations 26Acknowledgements 28References 29Indonesian Reef Check Network (JKRI) Membership List 30
iv

1 Introduction
Indonesia is situated in the centre of coral diversity (Veron, 2000), which is often referred to as the
Coral Triangle. Indonesian coral reefs are estimated to cover around 51.000 km² or around 18% of
the global coral reef area, and around 60% of coral species are found in this country. Sadly,
environmentally damaging fishing practices (such as the use of cyanide and explosives), overfishing,
sedimentation, waste disposal (Burke et al.., 2002), and coral bleaching (Hughes et al., 2003) have been
identified as the major threats to this ecosystem.
Over 80% of the Indonesian population lives in the coastal zone, so that the degradation does not
only impact the coral reefs themselves but also has a significant impact on the coastal communities
who rely on this ecosystem for their livelihoods (Burke et al.., 2002). The Reefs at Risk in Southeast
Asia report (Burke et al.., 2002) stated that during the past 50 years, the proportion of coral reefs in
declining condition has increased from 10% to 50%. If this destruction is allowed to continue, it is
estimated that the economic losses will be around 2.6 billion US $ over a period of 20 years. This is a
very low value if compared to the estimated value of over 1.6 billion US $ per year if the coral reef
ecosystem is maintained in a healthy condition (Cesar et al.. 1997).
Coral reef management in Indonesia to date has been hindered by a lack of data. In the past, coral
reef data has tended to focus on a particular area, and relatively comprehensive data have tended to
come from one-off surveys with no further or ongoing data collection. Comprehensive and on-going
data collection is very much needed in order to identify trends in the coral reef ecosystem so that best
management practices can be developed to ensure it's long-term conservation.
Reef Check is based on coral reef education, research and conservation, and is one practical solution
which can be applied in Indonesia. This method was made known world-wide in 1997 by Gregor
Hodgson, and was applied for the first time in Indonesia in the Karimunjawa National Park in the
same year1. Since then, Reef Check has expanded substantially, in terms of the number of volunteers,
organisations involved, Provinces covered and data collection sites. The Indonesian Reef Check
Network, Jaringan Kerja Reef Check Indonesia (JKRI) was founded in 2001 in order to facilitate
communication between the Reef Check survey organisers in different districts. In addition, ever
since it's founding year JKRI as developed as a forum making a worthwhile contribution to awareness
raising, monitoring and management activities for Indonesian coral reefs.
1

In a decade of Reef Check coral reef monitoring in Indonesia, 72 km of transect lines have
been surveyed. This is almost twice the total length of West Java Province!
2

2 Method Survey
Reef Check surveys are carried out at 2 depths, a shallow transect (2–6 m depth) and a medium depth
transect (over 6 m and up to 12 m) taking into account the tidal range. At each depth, 4 segments
each 20 m in length are placed and surveyed as 1 transect. All segments must follow the depth
contour, and each segment must be separated from the next by a gap of 5 m at least, this is to enable
statistical analysis as each segment can be considered to be an independent sample. The minimum
distance between the start and end of the transect is 20 + 5 + 20 + 5 + 20 + 5 + 20 = 95 m.
There are 4 types of data which are recorded on the Reef Check data sheets, from 3 types of survey
which are all carried out along the same transect line.
1. Site description
Legends, observations, history and other data should be recorded on the Site Description Sheet.
This data is important for the interpretation of field data. The Site Description Definitions and
Field Guide contains a list of specific criteria for guidance in filling out the Site Description Sheet
correctly.
2. Fish Belt Transect
A segment 5 m wide (centres on the transect line) and 20 m wide is used to survey fish species
which are targeted by fishermen, the marine aquarium trade, and others. This survey must be
carried out first, and there are 9 survey target species.
Table 1. Indicator fish names and ecosystem functions
Common name Latin name Indicators Butterflyfish (All species) Chaetodontidae Overfishing
Aquarium Trade Kerapu (> 30 cm) Serranidae Overfishing
Aquarium Trade Grunts/Sweetlips/Margates Haemulidae Overfishing Moray Eel (All species) Muraenidae Overfishing Parrotfish(> 20 cm) Scaridae Overfishing Snapper Lutjanidae Overfishing Barramundi Cod
Cromileptes altivelis Overfishing Live Reef Fish Food Trade Spearfishing
Bumphead Parrotfish Bolbometopon muricatum Overfishing Humphead (Napolean) Wrasse Cheilinus undulatus Overfishing
Live Reef Fish Food Trade
3

3. Invertebrate Belt Transect
As for the fish transect, a segment 20 m long and 5 m wide is used to survey invertebrates which
are targeted for consumption or the marine aquarium trade.
Table 2. Name and indicator function of invertebrates
Common name Latin name Indicator Banded Coral Shrimp Stenopus hispidus Aquarium Trade Lobster (All species) Malacostraca Overfishing Long spine Sea Urchin Diadema spp. Overfishing
Pencil Urchin Eucidaris spp. Curio Sales Sea Egg/Collector Urchin Tripneustes spp. Overfishing Triton Charonia spp. Curio sales Crown-of-thorns Starfish Acanthaster plancii Population explosion Teripang (2 spesies)
> Prickly Redfish > Greenfish
> Thelenota ananas > Stichopus hloronotus
Beche-de-mer fishery
Kima raksasa (provide size/species) Tridacna spp Over-harvesting
4. Substrate Line Transect
Using the same transect line as for the fish and invertebrate transects, the reef substrate category
is recorded at intervals of 0.5 m.
Table 3. Line transect codes and their meaning
Code Meaning HC Hard coral
HCB Hard Coral bleaching SC Soft coral
RKC Recently killed coral NIA Nutrient Indicator Algae SP Sponge RC Rock RB Rubble SD Sand SI Silt/clay
OT Other
Data Analysis
Reef Check data was supplied by local Reef Check survey teams, however 1997 data and some data
not recorded in the JKRI database was obtained from Reef Check Headquarters in the USA. Reef
Check surveying was only carried out at one site in Indonesia in 1998 so that 1998 data has not been
used.
4

The percentages are calculated for Reef Check survey data from each site. These percentages are then
used to calculate means and the national averages using all data from each site for a given year. In
order to ensure the accuracy of the percentage data at national level, data are examined to determine
key sites as references based on the continuity of data from these sites. This is done because not all
Reef Check organisers carry out repeat surveys (monitoring) on a regular basis at the same sites. The
criteria for data selection are at least 5 repeats of data collection at the same site for the line transect
and 3 repeats at the same site for belt transect data. If national data results differ significantly from
key site data, then comparisons will be drawn between the national data and the data from key sites.
In order to make the coral reef condition data easier to understand, the percentage of live hard coral
cover (HC) from the substrate line transect is used as the key indicator. The coral condition
categories used are Poor (0-25%), Average (26-50%), Good (51-75%) and Very Good (76-100%).
Analysis of the fish and invertebrate data is somewhat different from substrate data analysis. Data
from individual sites are amalgamated at the provincial level, to obtain an average per transect value.
The resulting data are used to calculate average per transect densities, resulting in a figure for number
of individuals/transect at the national level, after comparison with data from the key sites.
The estimated severity of impacts on coral reefs and levels of trash are divided into the following
categories: None, Low, Medium and High. The mean category per transect is calculated and the
average value taken to evaluate the overall level or threat category of pressures on the coral reef
ecosystem over the decade.
5
The first use of Reef Check in Indonesia was in 1997 at 12 site with 7 volunteers taking part.
By late 2006 Reef Check monitoring had been carried out at 61 sites in 19 provinces with 1,442 volunteers and 100 organisations taking part
6

3 Survey Results
A decade (1997-2006) of Reef Check data collection gives a clear picture of the condition of
Indonesian coral reefs. A brief summary is given below, with national scale information
being presented for each type of data collected.
Survey Sites
Site selection is an important factor in determining the success of Reef Check. One of the
Reef Check goals is to find out the level of human impact on coral reefs. To achieve this
goal, teams which only able to undertake surveys at one site should select the best site
available, in terms of having the minimum possible level of impact from human activities,
fishing, pollution and so-on. The site should have a high level of coral cover, with dense fish
and invertebrate populations. Over the decade, Reef Check surveying was carried out in 19
provinces spread out across Indonesia (Figure 1). Data collection was not continuously
undertaken at given sites; out of a total of 61 survey sites, only 21 sites were selected as key
sites with ongoing monitoring data, where data had been collected on at least 3 occasions.
These key sites are spread out across all regions of Indonesia; Bali (Garden Eel), Central Java
(Menjangan Besar, Menjangan Kecil, Geleang, Burung, Menyawakan, Cemara Besar, Tanjung
Gelam and Cemara Kecil), Riau (Barracuda point, Lagoi Berakit, Mayangsari Bay and
Sumpat), South Sulawesi (Lekuan 3), Central Sulawesi (Pasoso 1, Pasoso 2, Pasoso 3 and
Tawaeli Talise) as well as Southeast Sulawesi (Hoga Island Buoy 2, Hoga Island Buoy 4 and
Kaledupa Spur).
7

8
Figure 1. Reef Check data collection sites in Indonesia (symbol Δ)
TTTT TTTTTTTT
TTTTTTTT
TTTTTTTT TTTTTTTTTTTTTTTTTTTT TTTTTTTT
TTTTTTTTTTTTTTTTTTTTTTTTTTTT TTTTTTTTTTTTTTTT TTTTTTTTTTTTTTTT TTTTTTTT
TTTTTTTTTTTTTTTTTTTTTTTT
TTTTTTTT
TTTTTTTTTTTTTTTTTTTTTTTTTTTTTTTTTTTTTTTTTTTTTT TTTTTTTTTTTTTTTTTTTTTTTTTTTTTTTTTTTTTTTTTTTTTTTTTTTTTTTTTTTTTTTTTTTTTTTT TTTTTTTTTTTTTTTTTTTTTTTTTTTTTTTTTTTTTTTTTTTTTTTTTTTT TTTTTTTT
TTTTTTTTTTTTTTTT TTTTTTTT TTTTTTTTTTTTTTTT TTTTTTTTTTTTTTTTTTTTTTTTTTTTTTTTTTTTTTTT
TTTTTTTTTTTTTTTTTTTTTTTTTTTTTTTTTTTTTT TTTTTTTTTTTTTTTTTTTTTTTTTTT TTTTTTTTTTTTTTTTTTTTTTTTTTTTTTTT TTTTTTTTTTTTTTTTTTTTTTTTTTTTTTTTTTTTTTTT
TTTTTTTTTTTTTTTT TTTTTTTTTTTTTTTTTTTTTT TTTTTTTTTTTTTTTT
TTTTTTTTTTTTTTTT TTTTTTTT TTTTTTTT TTTTTTTTTTTTTTTTTTTTTTTTTTTTTTTT TTTTTTTTTTTTTTTTTTTTTTTTTTTTTTTTTTTTTTTTTTTTTTTTTTTTTTTTTTTT TTTTTTTTTTTTTTTTTTTTTTTTTTTTTT
TTTTTTTTTTTTTTTT TTTTTTTTTTTTTTT
TTTTTTTT TTTTTTTTTTTTTTTTTTTTTTTTTTTTTTTTTTTTTT TTTTTTTTTTTTTTTT TTTTTTTTTTTTTTTTTTTTTTTTTTTTTTTTTTTTTTTT
TTTTTTTT TTTTTTTT
TTTTTTTTTTTTTTTT TTTTTTTT TTTTTTTTTTTTTTTT TTTTTTTTTTTTTTTT TTTTTTTTTTTTTTTTTTTTTTTT TTTTTTTT TTTTTTTTTTTT TTTTTTTTTTTTTTTTTTTTTTTT TTTT TTTTTTTTTTTT TTTT TTTTTTTTTTTT TTTTTTTTTTTTTT TTTTTTTTTTTTTTTTTTTTTTTT TTTTTTTTTTTTTTTTTTTTTTTTTTTTTTT TTTTTTTTTTTTTTTTTTTTTTTT TTTTTTTTTTTTTTTT TTTTTTTTTT TTTTTTTTTTTT TTTTTTTTTTTTTTTTTTTTTTTTTTTTTT TTTTTTTTTTTTTTTTTTTTTTTTTTTTTTTTTTTT TTTTTTTT TTTTTTTTTTTTTTTTTTTTTTTTTTTT TTTTTTTTTTTTTTTT TTTT TTTTTTTTTTTTTTTT TTTTTTTTTTTTTTTTTTTTTTTTTTTTTTTTTTTTTTTTTTTTTTTTTTTTTTTTTTTT TTTTTTTTTTTTTTTT TTTTTTTTTTTTTTTTTTTT
TTTTTTTTTTTTTTTTTTTTTTTTTTTTTTTT TTTTTTTTTTTTTTTTTTTT
TTTTTTTT TTTTTTTT
TTTTTTTT TTTTTTTTTTTTTTTT
TTTTTTTTTTTTTTTT
TTTTTTTT TTTTTTTTTTTTTTTT TTTTTTTTTTTTTTTT TTTTTTTTTTTTTTTT
TTTTTTTT
TTTTTTTTTTTTTTTT
TTTTTTTT TTTTTTTTTTTTTTTT TTTTTTTTTTTTTTTT TTTTTTT TTTTTTTTTTTT
TTTT
TTTTTTTTTTTTTT TTTT
TTTT
TTTTTTTTTTTTTTTT
TTTTTTTTTTTTTTTTTTTT
TTTTTTTT
TTTTTTTT
TTTTTTTTTTTTTTTT
TTTTTTTTTTTTTTTTTTTTTTTTTTTTTTTT TTTTTTTTTTTTTTTTTTTTTTTTTTTTTTTTTTTTTTTTTTTTTTTTTTTTTTTTTTTTTTTTTTTTTTTTTTTTTTTTTTTTTTTTTTTTTTTTTTTTTTTTTTTTTTTTTTTTTTTTTTTTTTTTTTTTTTTTTTTTTTTT
TTTTTTTT TTTTTTTTTTTTTTTTTTTTTTTTTTTT TTTTTTTTTTTTTTTTTTTTTTTT
TTTTTTTTTTTTTTTTTTTTTTTTTTTTTTTTTTTTTTTT
TTTTTTTTTTTTTTTT TTTTTTTTTTTTTTTT TTTT
TTTTTTTT TTTTTTTTTTTTTTTTTTTTTTTTTTTTTTTTTTTTTTTTTTTTTTTTTTTTTTTTTTTTTTTTTTT TTTTTTTTTTTTTTTTTTTTTTTTTTTTTTTTTTTTTTTTTTTTTTTTTTTTTTTT

Table 4. Number of Reef Check monitoring sites per province per year Province
1997
1998
19
99
2000
20
01
2002
20
03
2004
20
05
2006
T
otal
Bali 8 0 24 0 38 48 26 0 0 4 148DKI Jakarta 8 0 27 8 24 32 0 0 0 0 99West Java 0 0 0 0 4 0 24 0 0 0 28Central Java 48 0 42 40 72 96 48 32 40 40 458East Java 0 0 0 0 8 32 0 0 40 20 100East Kalimantan 32 0 0 0 16 0 0 0 0 0 48Kepulauan Riau 24 8 0 0 16 16 31 32 15 0 142Lampung 8 0 0 0 0 16 0 0 0 0 24Maluku 16 0 0 0 0 0 0 0 0 0 16Nanggroe Aceh Darussalam 0 0 0 0 4 0 16 24 97 0 141West Nusa Tenggara 0 0 0 13 0 0 86 0 0 0 99East Nusa Tenggara 16 0 0 15 0 0 0 0 0 0 31Papua 24 0 0 0 0 0 0 0 0 0 24South Sulawesi 16 0 12 28 46 0 24 0 28 4 158Central Sulawesi 0 0 32 0 56 196 118 24 0 8 434Southeast Sulawesi 8 0 0 88 157 0 212 140 144 0 749North Sulawesi 0 0 0 4 8 36 0 0 0 0 48West Sumatra 0 0 0 8 8 8 0 0 12 0 36North Sumatra 0 0 0 0 4 8 12 48 0 0 72Total 208 8 137 204 461 488 597 300 376 76 2855
Reef Check survey sites in these 19 Indonesian provinces include sites within and outside of
Marine Protected Areas. For the purposes of this report, Marine Protected Areas are defined
as coastal and marine areas which are managed by government authorities or by local
communities. The following Table gives the total number and the percentage of Reef Check
surveys which were carried out within Marine Protected Areas.
Table 5. Number and percentage of marine protected areas surveyed using Reef Check
Marine Protected Area Year
Number Percentage 1997 120 57.7 1998 0 0.0 1999 98 71.5 2000 72 35.3 2001 230 49.9 2002 288 59.0 2003 290 48.6 2004 116 38.7 2005 127 33.8 2006 40 52.6
9
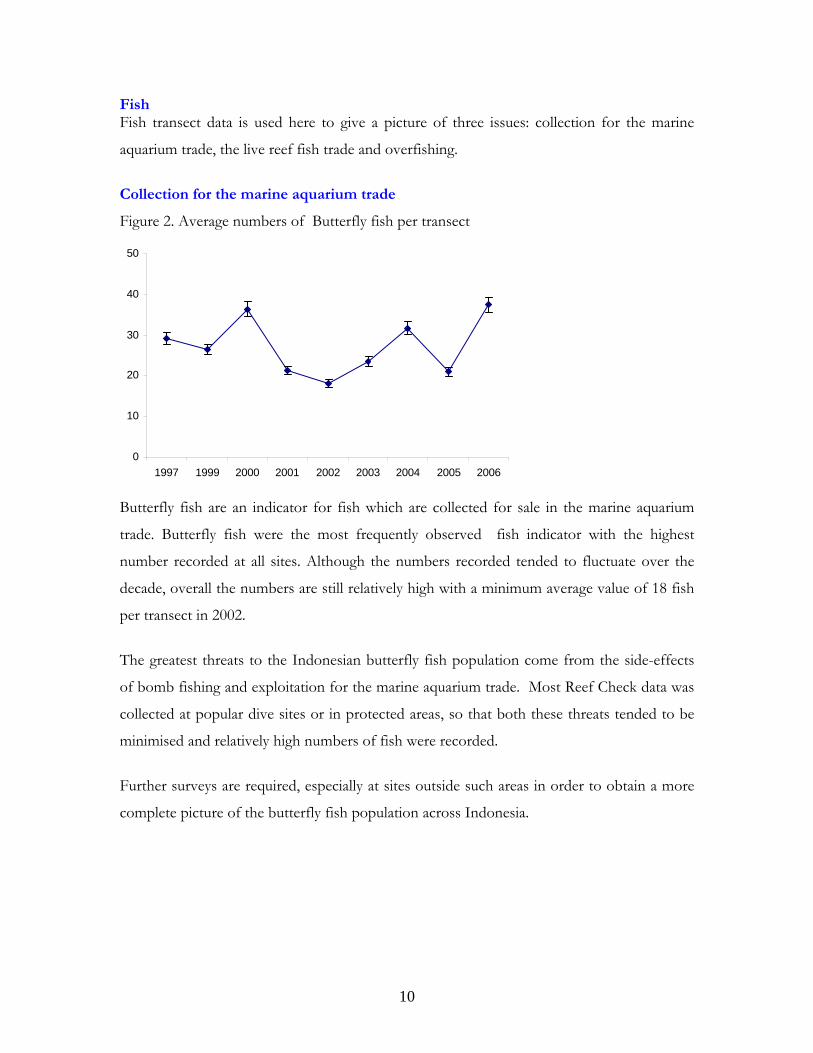
Fish Fish transect data is used here to give a picture of three issues: collection for the marine
aquarium trade, the live reef fish trade and overfishing.
Collection for the marine aquarium trade
Figure 2. Average numbers of Butterfly fish per transect
0
10
20
30
40
50
1997 1999 2000 2001 2002 2003 2004 2005 2006
Butterfly fish are an indicator for fish which are collected for sale in the marine aquarium
trade. Butterfly fish were the most frequently observed fish indicator with the highest
number recorded at all sites. Although the numbers recorded tended to fluctuate over the
decade, overall the numbers are still relatively high with a minimum average value of 18 fish
per transect in 2002.
The greatest threats to the Indonesian butterfly fish population come from the side-effects
of bomb fishing and exploitation for the marine aquarium trade. Most Reef Check data was
collected at popular dive sites or in protected areas, so that both these threats tended to be
minimised and relatively high numbers of fish were recorded.
Further surveys are required, especially at sites outside such areas in order to obtain a more
complete picture of the butterfly fish population across Indonesia.
10

Some of the Butterfly fish recorded during Reef Check surveys (reefcheck.or.id and reefcheck.org)
The Live Reef Fish Trade
0
2
4
6
8
10
1997 1999 2000 2001 2002 2003 2004 2005 2006
Barramundi cod
Humphead w rasse
KerapuGrouper
Figure 3. Average numbers per transect of Barramundi cod, Humphead wrasse and Grouper
Live reef fish species (Barramundi Cod/mouse grouper, Humphead Wrasse and Grouper)
are examples of indicator fish with high economic value which are traded alive. Grouper are
caught to fulfil demand from the export market with prices ranging 7-14 US $/kg in 2003
(Pet-Soede et al., 2004). The high demand for live reef fish and the profitable prices paid
have led may fishermen to use capture methods which are environmentally damaging
(Johannes and Riepen 1995).
The numbers recorded for these three fish species were low with a downward trend. During
the past 10 years, the average number of Grouper recorded has been below 6. The condition
of the Humphead Wrasse (listed in Appendix II of CITES, the Convention on International
Trade in Endangered Species) and Barramundi Cod is more extreme with average values of
zero to one fish per transect per year.
11

Overfishing
The majority of Overfishing indicator fish also exhibit a downwards trend in average
numbers/transect, although Snappers seem to be somewhat more abundant than the other
species. The graphic representations of data for Haemulidae (sweetlips), Parrotfish and
Bumphead parrotfish show a steep decline. Average numbers of Parrotfish fell from 13
fish/transect in 2000 to only 3 fish. There was a drastic decline in Bumphead parrot
numbers with zero fish sighted in 2006, whereas the maximum number recorded was in
2000 with 6 fish/transect.
0
5
10
15
20
1997 1999 2000 2001 2002 2003 2004 2005 2006
Haemulidae
Snapper
Bumphead parrot
Parrotf ish
Figure 4. Average per transect numbers of Haemulidae, Snapper, Bumphead parrotfish and
Parrotfish . Moray Eels, Manta Rays and Sharks are rare animals which must be recorded whenever
sighted during the survey. However, during this decade no individuals of these species were
encountered within the transect boundaries by Reef Check volunteers.
Facts about overfishing
Three quarters of world fisheries are already overfished or are already experiencing reduced catches (FAO Fisheries Department, 2002).
Most Indonesian waters are already overfished. Nearly half of the Fisheries Management Areas (Wilayah Pengelolaan Perikanan, WPP) in Indonesia are severely overfished in terms of the reef fish and lobster fisheries, whereas Penaeid shrimp have been overfished in over half of the Indonesian WPP (PRPT-BRKP and PPPO-LIPI, 2002). This condition is further worsened by the continued use of the catch per unit effort (CPUE) and Maximum Sustainable Yield (MSY) models which pose a high risk to the sustainability and long-term profitability of Indonesian fisheries (Mous et al.., 2005).
Efforts to reduce or mitigate overfishing include the use of the ecosystem management approach, where marine protected areas play an important role in fisheries sustainability (Mous et al.., 2005).
12

Invertebrates
Invertebrate data is used here to give a picture of the conditions related to four issues:
collection for the marine aquarium trade, overfishing, over-harvesting and coral predator
population explosions.
Collection for the aquarium trade
0
1
2
3
4
5
1997 1999 2000 2001 2002 2003 2004 2005 2006
Banded coral shrimp
Pencil urchin
Triton
Figure 5. Average per transect numbers of Banded Coral Shrimp, Pencil Urchin and Triton Numbers of Banded coral shrimp and Pencil urchins which are much sought after for the
marine aquarium trade are very low (0-2 /transect) but exhibit a slight increasing trend
whereas Triton were only found in extremely low numbers (0-1 /transect).
Invertebrates collected for the marine aquarium trade: Banded Coral Shrimp, Pencil Urchin and Triton (reefcheck.org)
13

Overfishing
0
10
20
30
40
50
60
1997 1999 2000 2001 2002 2003 2004 2005 2006
Figure 6. Average numbers of Diadema urchin per transect
The numbers of Diadema urchins recorded fell from 1997-2001 then increased again up to
2004, however in 2005 fell once more to around 24.9 urchins/transect.
0
1
2
3
1997 1999 2000 2001 2002 2003 2004 2005 2006
Lobster
Collector urchin
Figure 7. Average numbers of Lobster and Collector urchin per transect
The average number of lobster per transect exhibited an overall downward trend, with
values ranging from 1.5-0.2 lobster/transect, whereas Collector urchins were only recorded
in the past two years and average numbers were below one urchin/transect. The fall in the
number of lobsters reflects the growing pressure on these species, with significant levels of
overfishing especially since the year 2000.
14

Over-harvesting
0
5
10
1997 1999 2000 2001 2002 2003 2004 2005 2006
Kima Raksasa
Sea cucumber
Giant Clams
Figure 8. Average numbers of Giant clams and Sea cucumbers per transect
The average number of Giant clams as an indicator of over-harvesting declined from 7.7
clams/transect in 1997 to only 0.3 clams/transect in 2006. Whereas the number of Sea
cucumbers (Teripang) per transect fell sharply (6.3 to 0.0 per transect) in the past 10 years,
showing that the pressure on these animals is increasingly severe.
Population explosions
0
1
2
3
4
5
1997 1999 2000 2001 2002 2003 2004 2005 2006
Figure 9. Average numbers of CoTS per transect
In the past 10 years, the average number of CoTs per transect has been quite low (1.2-0.2
CoTs/transect). This is below the number constituting a population explosion which can
cause severe damage to coral reefs (AIMS 1997).
15

Substrate
During this monitoring period, the dominant substrate category has been HC (Hard Coral).
This was followed by RB, RC and RKC. Whereas HCB is a substrate category which was
never recorded. This is probably because the HCB indicator was only introduced in 2004,
and there have been no significant mass bleaching events recorded in Indonesia since 1998.
During the period 1998-2006 only three relatively mild bleaching events were recorded in
Indonesia: slight bleaching in TNBB (only for the coral species Seriotopora hystrix) during
2003, localised bleaching on the reefs around the Ngurah Rai Airport in Bali (April 2005),
and medium-severity bleaching at several spots in the Kepulauan Karimunjawa in December
2006.
30
40
50
60
70
1997 1999 2000 2001 2002 2003 2004 2005 2006
30
40
50
60
70
1997 1999 2000 2001 2002 2003 2004 2005 2006 Figure 10. Percentages of Live cover (above) and Non-living (abiotic) cover (below)
The percentage of live cover or living reef organisms (FS/NIA+HC+OT+SC+SP) at the
national level declined over this decade, with percentages varying from 40.90% to 56.96%,
figures which were recorded in 1999 and 2000 respectively. Because the non-living cover or
dead/abiotic reef cover (RB+RC+RKC+SD+SI+HCB) forms the remainder of the reef
cover, when the live cover percentage falls then the non-living cover automatically increases.
16
The overall national trend of declining live cover was reversed for the key sites, where there
was a rising trend in live cover. This increase in live cover at the key sites was probably due
to the fact that most of these key survey sites were within Protected Areas, so that they were
better protected from threats which can cause degradation of the coral reef ecosystem. This
was supported by data showing declining trends in unprotected areas. (continuation of the
comparison between protected and unprotected areas).
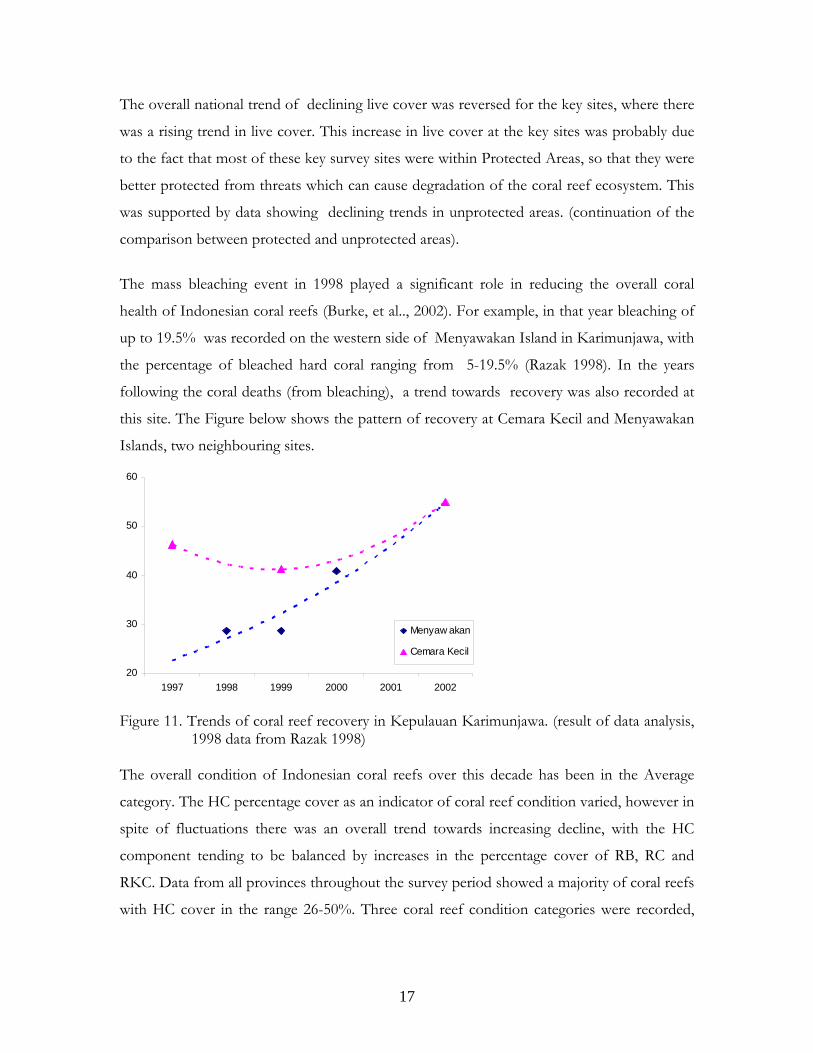
The mass bleaching event in 1998 played a significant role in reducing the overall coral
health of Indonesian coral reefs (Burke, et al.., 2002). For example, in that year bleaching of
up to 19.5% was recorded on the western side of Menyawakan Island in Karimunjawa, with
the percentage of bleached hard coral ranging from 5-19.5% (Razak 1998). In the years
following the coral deaths (from bleaching), a trend towards recovery was also recorded at
this site. The Figure below shows the pattern of recovery at Cemara Kecil and Menyawakan
Islands, two neighbouring sites.
20
30
40
50
60
1997 1998 1999 2000 2001 2002
Menyaw akan
Cemara Kecil
Figure 11. Trends of coral reef recovery in Kepulauan Karimunjawa. (result of data analysis,
1998 data from Razak 1998) The overall condition of Indonesian coral reefs over this decade has been in the Average
category. The HC percentage cover as an indicator of coral reef condition varied, however in
spite of fluctuations there was an overall trend towards increasing decline, with the HC
component tending to be balanced by increases in the percentage cover of RB, RC and
RKC. Data from all provinces throughout the survey period showed a majority of coral reefs
with HC cover in the range 26-50%. Three coral reef condition categories were recorded,
17
which were Good, Average and Poor, for 8.1%; 73.3% and 18.6% respectively of the sites
surveyed.
0
1
2
3
4
5
1997 1999 2000 2001 2002 2003 2004 2005 2006
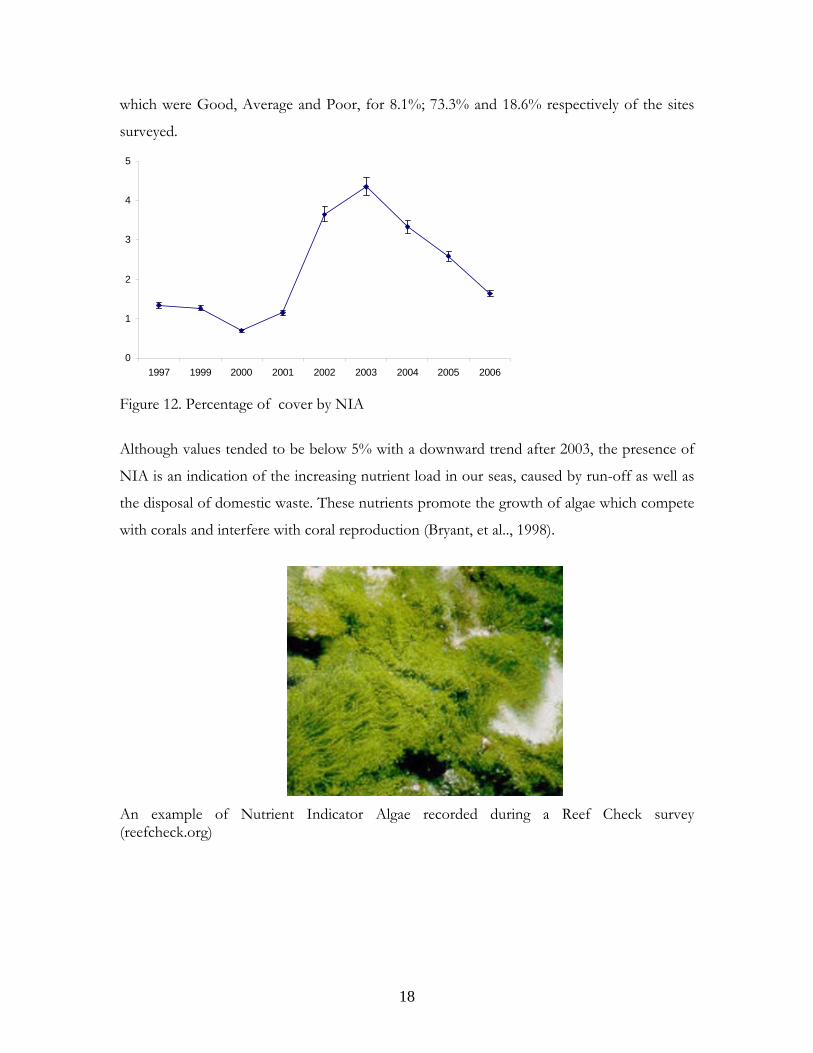
Figure 12. Percentage of cover by NIA
Although values tended to be below 5% with a downward trend after 2003, the presence of
NIA is an indication of the increasing nutrient load in our seas, caused by run-off as well as
the disposal of domestic waste. These nutrients promote the growth of algae which compete
with corals and interfere with coral reproduction (Bryant, et al.., 1998).
An example of Nutrient Indicator Algae recorded during a Reef Check survey (reefcheck.org)
18

Impacts
Overall, the coral damage and Trash indicators did not show any significant upwards or
downwards trends.
The majority of observed recent damage was relatively slight (level 1) and on average the
most frequently encountered source of damage was anchoring and activities related to the
use of boats, followed by "other" causes of damage. Out of the total damage, the greatest
contribution came from damage caused by "other" sources (storms, destructive fishing
practices such as the use of fish traps and hookah diving).
Table 5. Average level of recent coral damage per transect per year
Cause of Coral Damage Year
Boats/Anchoring Dynamite/Bomb Fishing Others
Level 0 1 2 3 0 1 2 3 0 1 2 3 1997 0,0 1,2 0,4 0,2 0,0 0,0 0,1 0,9 0,0 0,0 0,0 0,0 1999 0,0 0,5 0,3 0,1 0,0 0,5 0,8 0,4 0,0 0,4 0,3 0,4 2000 0,0 0,6 0,4 0,1 0,0 0,5 0,3 0,5 0,0 1,2 0,5 0,5 2001 0,0 0,5 0,2 0,0 0,0 0,3 0,1 0,1 0,0 0,1 0,2 0,2 2002 0,0 0,3 0,3 0,2 0,0 0,2 0,2 0,2 0,0 0,4 0,5 0,3 2003 0,0 0,6 0,3 0,2 0,0 0,3 0,1 0,1 0,0 0,7 0,2 0,2 2004 0,0 0,7 0,4 0,0 0,0 0,5 0,4 0,0 0,0 0,5 0,4 0,1 2005 0,0 0,5 0,2 0,2 0,0 0,4 0,2 0,1 0,0 0,7 0,5 0,7 2006 0,0 0,6 0,5 0,3 0,0 1,2 0,1 0,1 0,0 1,0 0,7 0,1
Average 0,0 0,6 0,3 0,1 0,0 0,4 0,3 0,3 0,0 0,5 0,4 0,3
Indiscriminate anchoring can damage coral reefs (reefcheck.org)
19
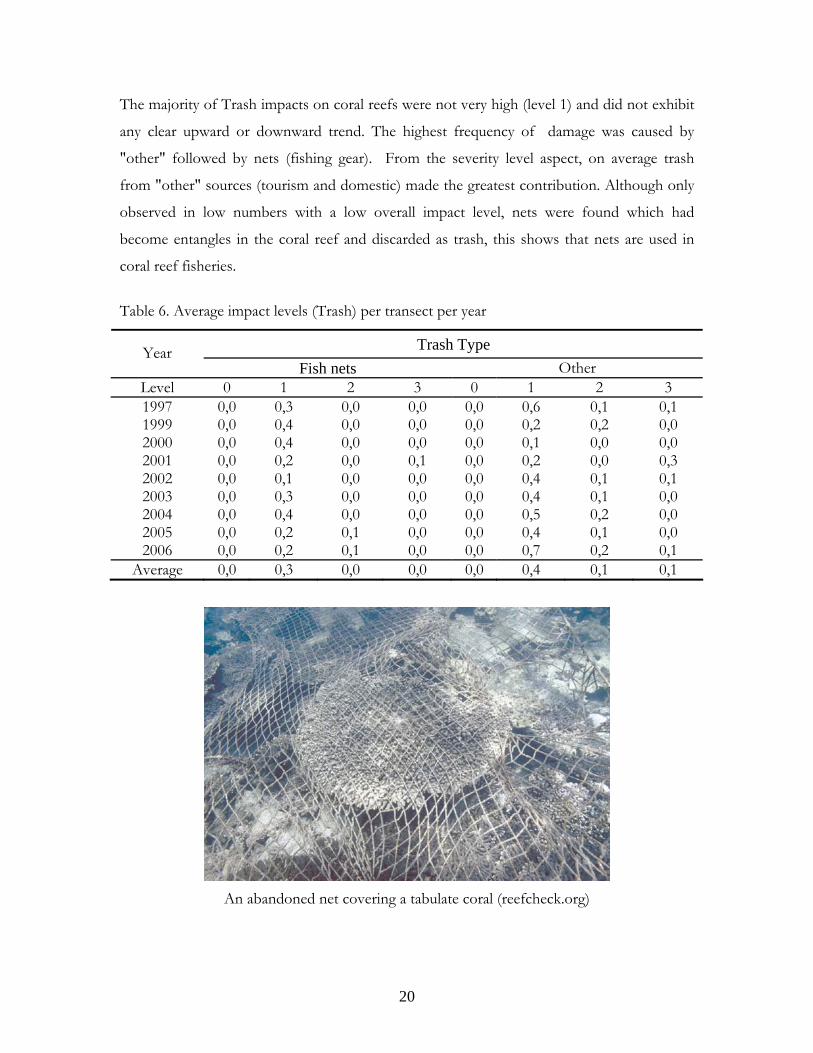
The majority of Trash impacts on coral reefs were not very high (level 1) and did not exhibit
any clear upward or downward trend. The highest frequency of damage was caused by
"other" followed by nets (fishing gear). From the severity level aspect, on average trash
from "other" sources (tourism and domestic) made the greatest contribution. Although only
observed in low numbers with a low overall impact level, nets were found which had
become entangles in the coral reef and discarded as trash, this shows that nets are used in
coral reef fisheries.
Table 6. Average impact levels (Trash) per transect per year
Trash Type Year Fish nets Other
Level 0 1 2 3 0 1 2 3 1997 0,0 0,3 0,0 0,0 0,0 0,6 0,1 0,1 1999 0,0 0,4 0,0 0,0 0,0 0,2 0,2 0,0 2000 0,0 0,4 0,0 0,0 0,0 0,1 0,0 0,0 2001 0,0 0,2 0,0 0,1 0,0 0,2 0,0 0,3 2002 0,0 0,1 0,0 0,0 0,0 0,4 0,1 0,1 2003 0,0 0,3 0,0 0,0 0,0 0,4 0,1 0,0 2004 0,0 0,4 0,0 0,0 0,0 0,5 0,2 0,0 2005 0,0 0,2 0,1 0,0 0,0 0,4 0,1 0,0 2006 0,0 0,2 0,1 0,0 0,0 0,7 0,2 0,1
Average 0,0 0,3 0,0 0,0 0,0 0,4 0,1 0,1
An abandoned net covering a tabulate coral (reefcheck.org)
20

Protected vs. Unprotected Areas
Reef Check data over this decade indicates a trend of relative increase in hard coral cover
within Protected Areas as compared to unprotected areas.
30
40
50
60
70
80
1997 1999 2000 2001 2002 2003 2004 2005 2006
Kaw asan Perlindungan
Kaw asan non-Perlindungan
Protected Areas Unprotected Areas
Figure 13. Comparison between the trends in HC cover in protected and un-protected areas
Although in some cases use or extraction from Protected Areas still occurs, the levels of HC
observed are a proof that Protected Areas can indeed improve the quality of the ecosystem
within them.
Reef Check by MSDC UNHAS at Barang Lompo Island, Makassar in December 2005
21

4 Lessons Learned and Success Stories
Reef Check in Central Sulawesi
The story of Reef Check in Central Sulawesi began in 1999 with a survey at 4 sites in the
Togean Islands by local NGO Yayasan Toloka with support from the Reef Check
Foundation. Reef Check was subsequently adopted as one of the survey methods in the
training and coral reef survey programme run by local NGO Yayasan Adi Citra Lestari
(YACL) from 2001-2004, with support from the UNEP EAS RCU (United Nations
Environment Program East Asian Seas Regional Coordinating Unit), the David & Lucille
Packard Foundation, NOAA and PADI Project Aware. From 2005 up until now, training
and survey with Reef Check methods has been continued by local NGO Yayasan Palu Hijau
(YPH) in partnership with the Fisheries and Marine Higher Education Institute (Sekolah
Tinggi Perikanan dan Kelautan Palu, STPL) with some support from the national and
provincial Sea Partnership (Mitra Bahari) Program.
As far as indicator organisms are concerned, the data from all survey sites strongly indicates
overfishing, with all economically indicators recorded in low numbers or absent. Both Reef
Check and manta tow surveys identified population explosions of Acanthaster plancii in
several areas, from North to South/East: Buol District(Sulawesi Sea), Tolitoli & Donggala
Districts (Makassar Straits), Palu City (Palu Bay), and Banggai Kepulauan District (Gulf of
Tolo). The most obvious causes of coral reef degradation were coral mining; bomb and
poison fishing; breaking apart of corals in the search for invertebrates such as clams
(Tridacnidae) and abalone; trampling, especially during the use of nets and gleaning for
invertebrates at low tide; anchor damage; and sedimentation.
Because of the importance of Reef Check in evaluating the condition of the coral reef
ecosystem, the method was used as the basis of Aquatic Ecology (Ekologi Perairan) field
activities for undergraduate fisheries students from 3 institutions (STPL, UNISA, UNTAD).
The goals of using Reef Check in this context are to provide an introduction to the coral
reef ecosystem and develop an understanding of the basic principles and practical
requirements for meaningful data collection and analysis.
22

Socialisation regarding Reef Check and the coral reefs ecosystem in Central Sulawesi reached
the international level, through a presentation at the 10th
ICRS (International Coral Reef
Symposium), held in Okinawa in 2004. Reef Check activities were also included in the
UNEP EAS/RCU report in 2004, as well as the Jurnal Mitra Bahari (Sea Partnership
Journal) in 2006. Reef Check was a major component of the Dive in to Earth Day 2006
activities with the theme " The Oceans are our Front Yard - Lingkungan Laut, Halaman
Depan Rumah Kita". We intend to make this an annual event, with varied activities, of
which Reef Check survey or monitoring will continue to be an integral part.
Reef Check in Central Java The Karimunjawa National Park was the first place in Indonesia where a Reef Check survey
was carried out, in the year 1997. In 1999, this survey was followed up by students from the
Marine Science Department of Diponegoro University who were members of the Marine
Diving Club. Reef Check was used as a tool to raise awareness regarding the importance of
coral reef ecosystems not only among the local communities in Kepulauan Karimunjawa,
but also at the Provincial level. Efforts did not stop there, and volunteers from provinces
outside Java were also invited to take part in Reef Check surveys in Karimunjawa. Based on
records from Karimunjawa alone, the number of Reef Check volunteers, originally only a
handful, had risen to 300 by the year 2006. Awareness raising was assisted by the mass
media, including the Central Java regional television station (Borobudur TV), National TV
(INDOSIAR), Semarang regional radio stations (Sonora FM, Radio Corpora FM, Radio
Smart FM), and newspapers (KOMPAS, Suara Merdeka and Kedaulatan Rakyat). Indeed in
2006, MURI (Museum of Indonesian Records) recorded the first Underwater Chess
Tournament, held in conjunction with Reef Check activities.
Reef Check outputs were not limited to raising awareness of the general public, but were
further presented at Provincial and National scientific events. Records show that Reef Check
was used to support coral reef conservation through a Regional Seminar in Semarang in
2003, and presentations at the Vth National Coasts and Small Islands Conference held in
Batam in 2006, with recent presentation at the National Seminar "Coral Reefs: from Ecology
to Industry” held in Semarang in 2007.
23
During a decade of monitoring in Karimunjawa, Reef Check have been supported not only
by the Jepara District Government, but also by the Provincial Government and private
sector. In addition support from UNEP EAS RCU (United Nations Environment Program
East Asian Seas Regional Coordinating Unit) and USAID (United States AID) are a clear
indication that the international community cares about the Reef Check activities in the
Karimunjawa National Park.
Reef Check in North Bali and Padang
RC in these two areas has been implemented by the MAMTI (Marine Aquarium Market
Transformation Initiative) programme, which is partnership between three non-
organisations (NGO): the Marine Aquarium Council (MAC), the Conservation and
Community Investment Forum (CCIF), and Reef Check (RC), who have established a team
and mutually beneficial cooperation and are working together with the International Finance
Corporation (IFC) under an integrated strategy. This Programme has 3 (three) main targets
which are: 1) certification of the marine ornamental trade to international standards, 2)
improvement of the business and financial skills of fishers, and 3) establishment of resource
monitoring and management. With support from the Global Environment Facility (GEF),
the strengths of this team will be channelled to re-direct the marine aquarium industry
towards more environmentally friendly practices and to ensure wiser management of
resources by fishers so that their livelihoods can become sustainable.
The MAMTI Programme has now been running in Indonesia for 2.5 years out of the 5 year
programme action plan (from 2005–2009) with implementation in 2 (two) countries which
are Indonesia and the Philippines. Since 2005, Yayasan Reef Check Indonesia as a member
of the Global Coral Reef Monitoring Network has taken an active part and demonstrated it's
concern through the MAMTI Programme, in particular in regards to coral reef conservation.
In MAMTI, Reef Check has 2 (two) main roles which are:
1. Providing the initial scientific basis and designing a method for the monitoring of
fishing grounds
2. Strengthening of community marine protected area (DPL) management and the
improvement or rehabilitation of coral reef condition to ensure resources
sustainability
24

Together with local communities, MAMTI develops local coral reef survey teams in order to
evaluate the "health" condition of coral reefs within the DPL area, and compare this with the
condition of reef areas outside the DPL. The results of these surveys show that in general
the condition of the coral reefs and associated organisms are higher within the area which is
protected (inside the DPL) compared with unprotected areas (outside the DPL). This
phenomena proves how important it is to establish protected areas. With comprehensive
data and information such as this it is hoped that in Reef Check can bring the general public
to understand and realise the importance of Marine Protected Areas (MPA).
Table 7. MAMTI Reef Check monitoring results
Indicators Inside the DPL (MPA)
Outside the DPL (MPA)
Live coral cover 48,8 38,7 Average density of indicator fish / 500 m2 48,3 49,1
Average density of indicator invertebrates / 100 m2 35 6,2
Average density of ornamental fish / 500 m2 1444,7 1140,2 Average ornamental fish species diversity / 500 m2 22 42,9 Average density of ornamental invertebrates / 100 m2 17,3 7,9
Average diversity of ornamental invertebrates / 100 m2 5,9 1,4
During the capacity building process, the programme approach is not limited to the level of
the village communities but also includes relevant government institutions such as the
Fisheries and Marine Service, National Park Rangers, Traditional and Administrative Village
Heads, the Tourism Service, and the local Planning Agency (BAPPEDA). This approach is
followed in order that the activities and plans made at the community level obtain a positive
response from and are in line with the policy of local governments.
25

5 Recommendations
There has been a documented ongoing decline in the condition of coral reefs and the
organisms living in this ecosystem. For a decade Reef Check has been run with very limited
operational resources. However, thanks to the co-operation of many parties, the JKRI has
succeeded in developing the most extensive non-government monitoring programme in
Indonesia. With all the limitations faced by Indonesia in the development of coral reef
conservation, this cooperation is extremely important. Coordination and the enthusiastic
togetherness are the keys to success in developing and managing coral reef conservation.
Based on the results of data analysis and the process of learning within the network
throughout this decade, we underline several important points that we need to address
together:
• developing public awareness regarding coral reef conservation through active
stakeholder involvement.
• developing active coordination and communications between the parties involved in
implementing coral reef conservation which is cross-sectoral in nature (including
NGOs, government, industry, universities, etc).
• developing the active involvement of non-specialist groups in reef management
through providing opportunities to take part in activities such as Reef Check surveys,
etc.
Do your part:
There are many opportunities for us to help the management and conservation of coral reefs
in our daily activities. Here are a few examples:
1. Be a responsible diver. Follow the code of conduct of your dive association and
local, codes of conduct at places where you dive.
2. Be a good diver. Make sure you have good diving skills, especially good buoyancy
control. Make sure also that each time you go diving all your equipment is properly
attached and will not get caught in or damage the corals.
3. Be a blue diver. Become an environmentally responsible diver by taking part in
voluntary conservation activities. And select dive operators and resorts which hold a
26

reputation for environmental friendliness. Your friends in the network are ready to
help you.
4. Be a blue agent. Ours is the blue planet. Whatever we do in our homes and daily
lives on the land will have an impact on the sea.
a. Reduce electricity consumption. Electricity generation in Indonesia is still
largely dependent on fossil fuels (oil and coal) which produce greenhouse
gasses. These gasses are responsible for the global warming which can cause
coral bleaching. This bleaching is usually followed by mass mortality,
requiring many long years for recovery to take place.
b. Reduce, reuse, recycle. Everything we use comes from nature and requires
processing plus transportation before it reaches us. Paper for example, trees
must be felled, processes and sent to the shops before we can buy and use it.
The more paper we use, the more trees that have to be felled (meaning
increased sedimentation of rivers, and eventually the sea), and more
greenhouse gases produced during processing and transport.
c. Do not dispose of waste improperly. Waste which we throw away in the
town will reach the rivers and be carried to the sea. Many marine animals
have been reported dead as a result of entanglement in waste, or through
eating plastic (which tends to resemble jellyfish, a common food source for
many marine animals)
d. Inform: spread the word, ask your friends, family and other people around
you to join in and do what they can in their every day lives
27
Acknowledgments
During this decade, many activities of the Indonesian Reef Check Network (JKRI) has been
supported by partners, stakeholders and funding agencies. We wish to take this opportunity
to say thank you for all the help and support from WWF Indonesia, United Nations
Environmental Programme, USAID, the David & Lucille Packard Foundation, NOAA,
PADI Project Aware, Reef Check International and Yayasan Reef Check Indonesia as well
as the Sea Partnership (Mitra Bahari) Programme.
Of no less importance is the tireless support of the JKRI members in promoting
conservation, knowledge and awareness for our coral reef ecosystems.
28

References
AIMS. 1997. Crown of Thorns starfish: Outbreaks. Download 15 May 2007 from
http://www.aims.gov.au/pages/reflib/cot-starfish/pages/cot-q10.html Bryant, D., L. Burke, J. McManus and M. Spalding. 1998. Reefs at Risk: A Map-Based
Indicator of Threats to the World's Coral Reefs. Washington, D.C.: World Resources Institute.
Burke, L., E. Selig and M. Spalding. 2002. Reefs at Risk in Southeast Asia. World Resources Institute. USA.
Cesar, H., Lundin, CG., Bettencourt, S., and Dixon, J. 1997. Indonesian coral reefs-- An Economic analysis of a precious but threatened resource. Ambio 26 (6): 345-350
FAO Fisheries Department. 2002. The State of World Fisheries and Aquaculture 2002. Rome: FAO, 150 pp.
Hodgson, G., Kiene, W., Mihaly, J., Liebeler, J., Shuman, C., and Maun, L. 2004. Manual Instruksi Reef Check: Petunjuk teknis pemantauan terumbu karang dengan metoda Reef Check. Reef Check, Institute of the Environment, University of California at Los Angeles.
Hodgson, Gregor and J. Liebeler. 2002. The Global Coral Reef Crisis: Trends and Solutions. Reef Check, Institute of the Environment, University of California at Los Angeles.
Hughes, T.P., A.H. Baird, D.R. Bellwood, M. Card, S.R. Connolly, C. Folke, R. Grosberg, O. Hoegh-Guldberg, J.B.C. Jackson, J. Kleypas, J.M. Lough, P. Marshall, M. Nyström, S.R. Palumbi, J.M. Pandolfi, B. Rosen and J. Roughgarden. 2003. Climate Change, Human Impacts, and the Resilience of Coral Reefs. Science 301 : 929-933
Johannes, R.E. and M. Riepen. 1995. Environmental, Economic, and Social Implications of the Live Reef Fish Trade in Asia and the Western Pacific. Unpublished;
Mous, PJ., Pet, JS., Arifin, Z., Djohani, R., Erdmann, MV., Halim, A., Knight, M., Pet-Soede, L., Wiadnya, G. 2005. Policy needs to improve marine capture fisheries management and to define a role for marine protected areas in Indonesia. Fisheries Management and Ecology 12: 259–268
Pet-Soede, Lida., Hirason Horuodono and Sudarsono. 2004. SARS and the live food fish trade in Indonesia: Some anecdotes. SPC Live Reef Fish Information Bulletin #12 – February 2004.
PRPT-BRKP and PPPO-LIPI. 2002. Pengkajian Stok Ikan di Perairan Indonesia 2001. Badan Riset Kelautan dan Perikanan - DKP bersama Pusat Penelitian Oseanografi LIPI, Jakarta
Razak, T.B. 1998. Struktur Komunitas Karang Berdasarkan Method Transect Garis dan Transect Kuadrat di Pulau Menyawakan, Taman National Karimunjawa, Jawa Tengah. Skripsi Sarjana. Institut Pertanian Bogor. Bogor
Veron, JEN. 2000. Corals of the world. Australian Institute of Marine Science, Australia.
29

Membership List of the Indonesian Reef Check Network (JKRI)
Organization Sekolah Tinggi Perikanan dan Kelautan Palu
Address Jl. Soekarno-Hatta, Tondo 94118 Palu, Sul-Teng
Telp/faks 0451-4709936 Email Contact
[email protected]. Samliok Ndobe, M.Si
Organization Yayasan Palu Hijau Address Jl. Setia Budi Lrg. Siswa No. 16 Palu 94111
Sul-Teng Telp/faks 0451-422811 Email Contact
[email protected] Moore, MSc
Organization Fisheries Diving Club, Faculty of Fisheries
Brawijaya University Address Jl Veteran FPIK Unibraw-Malang Telp/faks - Email Contact
[email protected] Setyanto SPi, MAppSc.
Organization Yayasan Reef Check Indonesia Address Jl. Tukad Balian 113 Renon, Bali Telp/faks 0361-3071358
[email protected] Contact Naneng Setiasih
Organization Marine Diving Club, Marine Science
Department- Diponegoro University Address Jl. Jatimulyo 10 Semarang 50269 Telp/faks 024-70263198 Email Contact
[email protected]. Wisnu Widjatmoko, MSc
Organization Yayasan Taka Address - Telp/faks -
[email protected] Contact Abdullah Habibi
Organization Unit Selam, Gadjah Mada University Address Gelanggang Mahasiswa UGM Sayap Utara
Bulaksumur, Jogjakarta 55281 Telp/faks 0274-902585 Email [email protected] Contact Kurnia
30

Organization Minang Bahari Foundation/SANARI Address - Telp/faks 0751-7057912 Email
Contact [email protected] / Yasser Arafat
Organization Marine Science Diving Club, Hasanuddin
University Address Lt. II Jasper Gedung Pertanian UNHAS Telp/faks 081342665826, 085282559867 Email Contact
[email protected] Risalah Sikar
Organization Yayasan Konservasi Laut Indonesia Address Jl. Racing Center, Kompleks Mutiara Indah
Blok A No 6A Makassar 90234 Telp/faks 0411- 420359
[email protected] Contact Yusran
Organization Mitra Bentala Foundation Address Jl. KH Ahmad Dahlan no33 Pahoman-
Bandar Lampung 35123 Telp/faks 0721 – 262839
Contact Herza Yulianto
Organization Bahari Foundation Address Jl. Malik IV No. 12 Kel. Korungba Kota
Kendari Sultra 93111 Telp/faks 0401 – 325983 Email [email protected]
Contact Risfandi
Organization JARI Foundation ( Juang Laut Lestari ) Address JL. Banteng No. 9 Mataram 83121 Telp/faks 0370 – 636040 / 0370 - 633972 Email
Contact
[email protected] [email protected] Hizbul Haq
Organization Diving Club, Atmajaya University of
Jogjakarta Address Universitas Atamajaya Jogyakarta Telp/faks -
Contact Alloysius Riko
Organization Fisheries Diving Club, Bogor Agricultural Institute
Address
Telp/faks FPIK IPB Building Dramaga-Bogor -
31

Email [email protected] Yanuar Muhammad Organization MPA Zooxhantellae FPIK Sam Ratulangi
University Address Jl.Kampus Baku Manado Telp/faks -
Contact Ellen Manoppo
Organization Ocean Diving Club, Syiah Kuala University Address Jl Tengku Syeik Abdul Rauf, Gedung
Fakultas MIPA, UNSYIAH- NAD Telp/faks -
Contact Muliari
Organization FinDC, Mulawarman University Address Gedung Kelautan FPIK Universitas
Mulawarman-Kalimantan Timur Telp/faks -
Contact M.Yasser
Organization RS2C Universitas Negeri Papua Address Jl Gunung Salju Amban Manokwari Telp/faks - Email [email protected]
Rustam Patahuddin
32