a decade in review 2010 – 2019 - pstrust.org
TRANSCRIPT
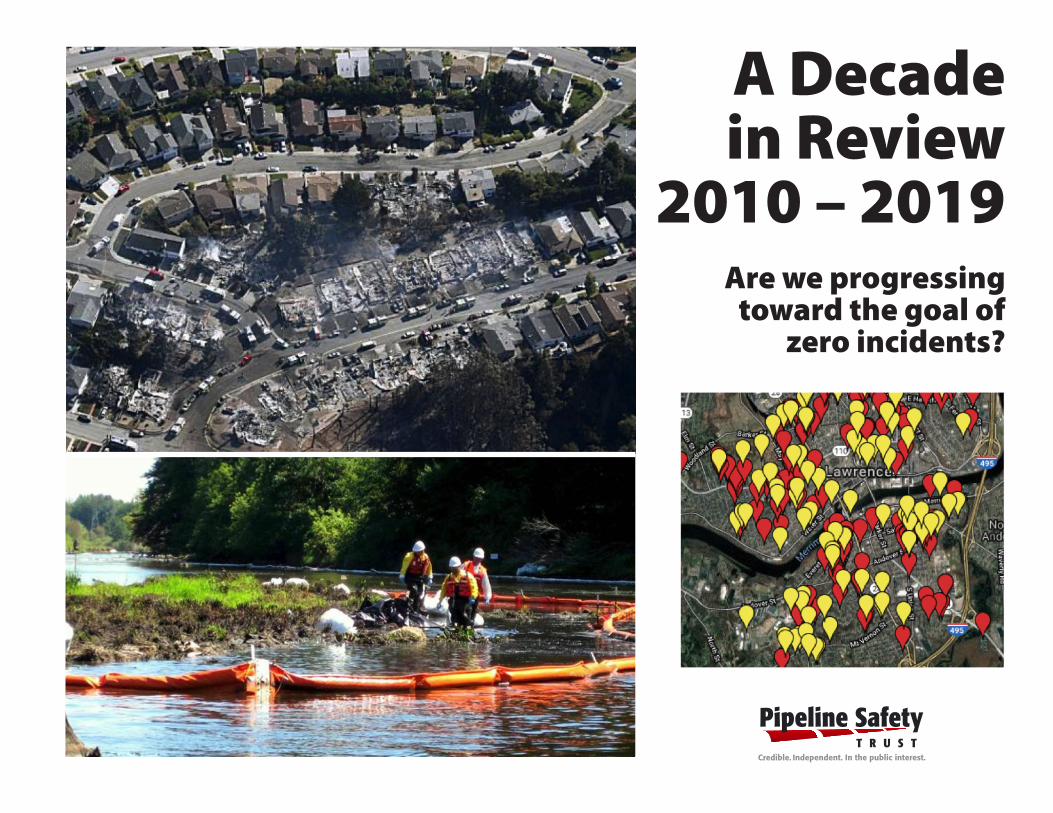
A Decade in Review
2010 – 2019Are we progressing
toward the goal of zero incidents?

A DecADe In RevIew 2010 - 2019
Page 2
The decade that began in January 2010 and ended at the end of 2019 was punctuated with many astounding pipeline failures that captured the attention of the nation. In June 2010 the people of Salt Lake City found crude oil running down Red Butte Creek through backyards and the heart of the City. Only through quick thinking of emergency respond-ers was that oil diverted into a large pond in the City’s iconic Liberty Park to prevent it from reaching the Jordan River and the Great Salt Lake. This spill would normally have been the most newsworthy pipeline failure of the year, but little did we know at the time that a month later an Enbridge pipeline would fail near Marshall, Michigan dumping nearly a million gallons of heavy tar sands crude into Talmadge Creek and the Kalama-zoo River, and unbelievably three months later the Enbridge failure would be eclipsed when a PG&E natural gas pipeline failed in San Bruno, California killing eight people and destroying a large part of a neighborhood. In 2010, these were the most egregious pipeline failures in recent memory, but the decade was only getting started and these two crude oil failures would be all too soon followed by descriptions of crude oil flow-ing between homes and down driveways from a failed Exxon pipeline in Mayflower, Arkansas, and two different pipelines failing under high water conditions within four years of each other dumping crude oil into the Yellowstone River. And the San Bruno natural gas tragedy of 2010 would be joined by other high profile natural gas pipeline failures in Allentown, PA; New York City; Silver Spring, MD; and rural Kentucky. To put an exclamation mark toward the end of what appears to be a terrible decade for pipeline safety, on September 13th, 2018 a failure by Columbia Gas of Massachusetts to prop-erly hookup a replaced pipeline caused between 40-80 separate explosions and fires in homes throughout the Merrimack Valley in Massachusetts, killing one person, injuring 25 others, forcing over 30,000 people from their homes (some for weeks), and causing over a billion dollars of property damage. From a pipeline safety viewpoint this was a decade we would like to be able to forget.
In response to these horrific tragedies, and the other 6,300+ reportable pipeline fail-ures that occurred during this period, both the pipeline industry and regulators set out to improve safety through a series of new voluntary and regulatory initiatives. Some of these initiatives are just now getting implemented after nearly a decade of regula-tory dithering, and others such as the voluntary Pipeline Safety Management Systems recommended practices are still probably too new to see much change in the failure data. Since large failures can sometimes skew the way people view pipeline safety we thought the end of the decade would be a good time to take a look at the PHMSA data to see what progress has been made toward the shared goal of Zero Incidents. This brief report shows what we found.
Before we get too far into the different data it is important to know what we looked at and what the different types of incident data really tell us. For all pipelines there are three main types of failure data – Serious Incident, Significant Incidents, and all Report-able incidents. Please see the box below for what each of them includes.
The Pipeline Safety Trust’s Pipeline Incident Maphttp://pstrust.org/about-pipelines/state-by-state-incident-maps/
A DecADe In RevIew 2010 - 2019
Page 3
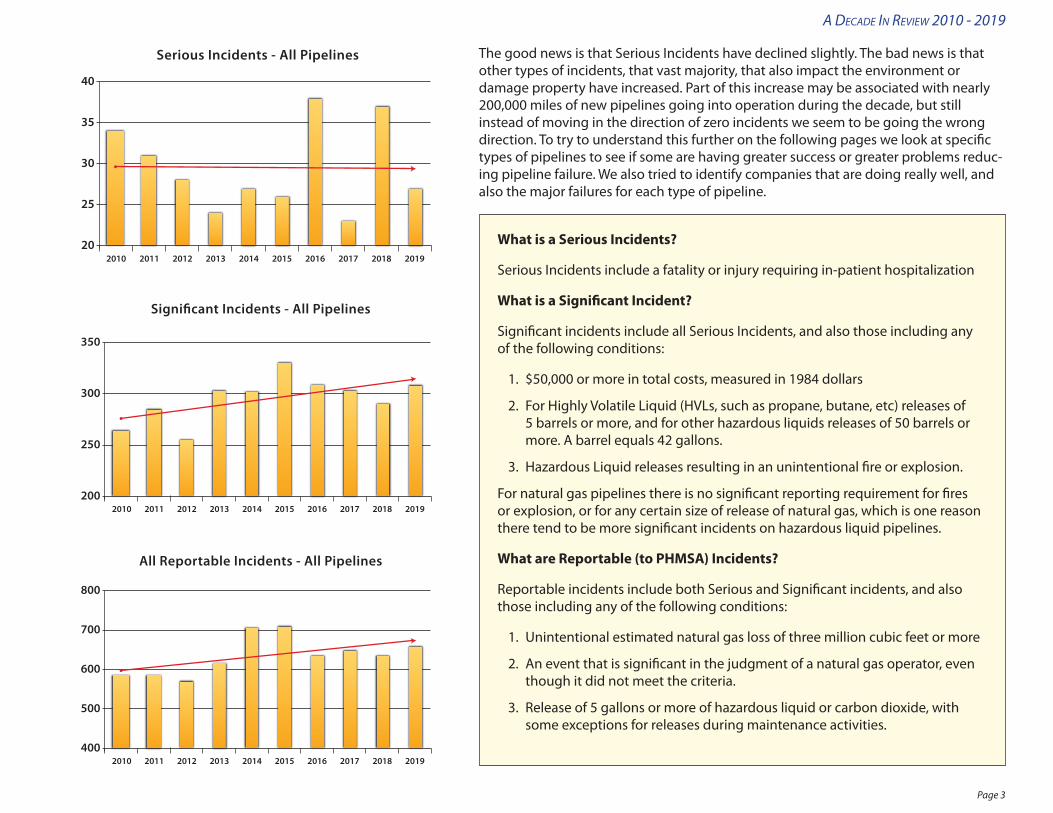
The good news is that Serious Incidents have declined slightly. The bad news is that other types of incidents, that vast majority, that also impact the environment or damage property have increased. Part of this increase may be associated with nearly 200,000 miles of new pipelines going into operation during the decade, but still instead of moving in the direction of zero incidents we seem to be going the wrong direction. To try to understand this further on the following pages we look at specific types of pipelines to see if some are having greater success or greater problems reduc-ing pipeline failure. We also tried to identify companies that are doing really well, and also the major failures for each type of pipeline.
40
35
30
25
202010 2011 2012 2013 2014 2015 2016 2017 2018 2019
Serious Incidents - All Pipelines
350
300
250
2002010 2011 2012 2013 2014 2015 2016 2017 2018 2019
Signi�cant Incidents - All Pipelines
800
600
700
500
4002010 2011 2012 2013 2014 2015 2016 2017 2018 2019
All Reportable Incidents - All Pipelines
What is a Serious Incidents?
Serious Incidents include a fatality or injury requiring in-patient hospitalization
What is a Significant Incident?
Significant incidents include all Serious Incidents, and also those including any of the following conditions:
1. $50,000 or more in total costs, measured in 1984 dollars
2. For Highly Volatile Liquid (HVLs, such as propane, butane, etc) releases of 5 barrels or more, and for other hazardous liquids releases of 50 barrels or more. A barrel equals 42 gallons.
3. Hazardous Liquid releases resulting in an unintentional fire or explosion.
For natural gas pipelines there is no significant reporting requirement for fires or explosion, or for any certain size of release of natural gas, which is one reason there tend to be more significant incidents on hazardous liquid pipelines.
What are Reportable (to PHMSA) Incidents?
Reportable incidents include both Serious and Significant incidents, and also those including any of the following conditions:
1. Unintentional estimated natural gas loss of three million cubic feet or more
2. An event that is significant in the judgment of a natural gas operator, even though it did not meet the criteria.
3. Release of 5 gallons or more of hazardous liquid or carbon dioxide, with some exceptions for releases during maintenance activities.

A DecADe In RevIew 2010 - 2019
Page 4
The Safest Companies of the DecadeLargest Hazardous Liquid Pipeline Systems that had ZERO
reportable failures 2010 - 2019
Operator ID Pipeline Operator 2019 Mileage
31994 Panther Operating Company, Llc 515.25
26103 Texas Eastman Division, Eastman Chemical Co 470.5
32493 Unev Pipeline, Llc 426.52
31875 Merit Energy Company 350.5
7660 Hunt Crude Oil Supply Co 233.04
180200
160140
100120
6080
4020
02010 2011 2012 2013 2014 2015 2016 2017 2018 2019
Signi�cant Incidents - All Hazardous Liquid Pipelines We believe at this point that Significant Incidents provide the best apples to apples comparison of the different types of pipelines safety trends. The chart here shows that for hazardous liquid pipelines the trend over the decade was increasing. Since hazardous liquids include a variety of relatively different products we decided to also look specifically at the main types of hazardous liquid pipelines. The hazardous liquid pipelines we looked at include Crude Oil pipelines, Refined Product (gasoline, jet fuel, diesel, etc.) pipelines, and HVL and Other Toxic Fluid (Butane, Propane, Ammonia, etc.) pipelines.
We also identified the five largest companies based on miles of pipeline that had no reportable failures during the decade, and also the five worst failures based on dif-ferent criteria such as deaths & injuries, property dam-age, quantity released, and environmental remediation or emergency response costs.

A DecADe In RevIew 2010 - 2019
Page 5
90
80
70
50
60
30
40
20
10
02010 2011 2012 2013 2014 2015 2016 2017 2018 2019
Signi�cant Incidents - Crude Oil Pipelines50
45
40
35
25
30
15
20
10
5
02010 2011 2012 2013 2014 2015 2016 2017 2018 2019
Signi�cant Incidents - HVL Pipelines
50
60
30
40
20
10
02010 2011 2012 2013 2014 2015 2016 2017 2018 2019
Signi�cant Incidents - Re�ned Product PipelinesAs you can see from these three charts it appears the type of product in the pipeline may have something to do with the failure rate or it could alternatively be the companies that operate different types of pipelines. While refined product pipelines have a fairly stable trend line, crude oil and HVL lines have increasing numbers of failures.
On the following three pages we have highlighted the five worst failures using four different criteria for what “worst” means for the different types of hazardous liquid pipelines. Defining what is a "worst" failure is difficult because a failure with the largest human harm (deaths and injuries) may have relatively little environmen-tal harm. Or the largest spill may not really equate to the highest environmental harm either. For example, under crude oil pipelines below you will see that the largest spill of the decade did not make the list for human harm or environmental remediation costs.
Different Types of Hazardous Liquid Pipeline

A DecADe In RevIew 2010 - 2019
Page 6
Worst Crude Oil Pipeline Failures
Company Date Gallons Spilled Deaths Injuries Ignite Location
Public/Private Property Damage
Environmental Remediation
CostsTotal Costs Cause
Largest Spills
Tesoro High Plains Pipeline Co 7/29/13 865,200 0 0 No Mountrail County, ND $185,651 $12,190,876 $18,771,427 Natural Force Damage
Enbridge Energy, Lp 7/25/10 843,444 0 0 No Marshall, MI $26,901,060 $742,703,180 $983,088,852 Material/Weld/Equip Failure
Belle Fourche Pipeline Co 12/5/16 529,830 0 0 No Billings County, ND $416,474 $12,365 $12,244,283 Natural Force Damage
Enterprise Crude Pipeline Llc 6/4/11 513,618 0 0 No Chico, TX $0 $726,212 $1,560,045 Material/Weld/Equip Failure
Epic Consolidated Operations, Llc 7/30/19 439,320 0 0 No Edwards County, TX $0 $4,500,000 $5,239,900 Excavation Damage
Worst For Deaths & Hospitalizations
Enbridge Energy, Lp 3/3/12 63,000 2 3 Yes New Lenox, IL $0 $1,048,812 $3,192,509 Other Outside Force Damage
Oiltanking, Houston Lp 6/2/12 0 1 1 No Houston, TX $0 $0 $0 All Other Causes
Sunoco Partners Marketing & Terminals
8/12/16 4 0 4 Yes Nederland, TX $0 $0 $3,720 Incorrect Operation
Exxonmobil Pipeline Co 8/10/13 20 0 3 Yes Longview, TX $0 $1,105 $5,360 Incorrect Operation
Enterprise Crude Pipeline Llc 9/30/13 0 0 2 Yes Jones Creek, TX $0 $0 $5,525 Incorrect Operation
Highest Environmental Remediation Costs
Enbridge Energy, Lp 7/25/10 843,444 0 0 No Marshall, MI $26,901,060 $742,703,180 $983,088,852 Material/Weld/Equip Failure
Tc Oil Pipeline Operations Inc 11/16/17 276,864 0 0 No Marshall County, SD $858,331 $33,021,389 $46,710,521 Material/Weld/Equip Failure
Plains Pipeline, L.P. 5/19/15 123,228 0 0 No Goleta, CA $0 $24,016,031 $153,093,692 Corrosion
Tc Oil Pipeline Operations Inc 10/29/19 189,630 0 0 No Walsh County, ND $1,018,703 $23,008,696 $39,278,447 Material/Weld/Equip Failure
Mobil Pipe Line Company 3/29/13 133,980 0 0 No Mayflower, AR $0 $22,211,842 $100,892,596 Material/Weld/Equip Failure
Highest Property Damage To Public & Private Property
Enbridge Energy, Lp 7/25/10 843,444 0 0 No Marshall, MI $26,901,060 $742,703,180 $983,088,852 Material/Weld/Equip Failure
Enbridge Energy, Lp 9/9/10 316,596 0 0 No Romeoville, IL $14,308,776 $19,344,158 $55,432,051 Other Outside Force Damage
Exxonmobil Pipeline Co 7/1/11 63,378 0 0 No Laurel, MT $8,600,469 $0 $154,808,437 Natural Force Damage
Enbridge Pipelines (Ozark) L.L.C. 1/14/17 18,900 0 0 No Everton, MO $5,629,085 $364,848 $12,060,835 Material/Weld/Equip Failure
Sunoco Pipeline L.P. 5/10/18 630 0 0 No Edmond, OK $3,258,390 $166,386 $4,883,198 Corrosion

A DecADe In RevIew 2010 - 2019
Page 7
Worst Refined Product Pipeline Failures
Company Date Gallons Spilled Deaths Injuries Ignite Location
Public/Private Property Damage
Environmental Remediation
CostsTotal Costs Cause
Largest Spills
Delek Crude Logistics, Llc. 10/3/19 482,748 0 0 No Hopkins County, TX $0 $0 $854,464 Excavation Damage
Sfpp, Lp 12/13/18 458,220 0 0 No Anthony,NM $381,493 $17,243,209 $20,448,365 Corrosion
Marathon Pipe Line Llc 4/13/11 378,000 0 0 No Dansville, MI $0 $23,278,602 $40,971,375 Material/Weld/Equip Failure
Plantation Pipe Line Co 12/8/14 369,600 0 0 No Belton, SC $0 $2,791,547 $4,160,760 Incorrect Operation
Colonial Pipeline Co 9/9/16 309,540 0 0 No Helena, AL $0 $2,122,595 $45,560,861 All Other Causes
Worst For Deaths & Hospitalizations
Colonial Pipeline Co 10/31/16 186,669 2 4 Yes Helena, AL $3,820,671 $185,727 $17,876,807 All Other Causes
Conocophillips 12/15/10 21 0 1 No Eureka, MO $0 $0 $70 Incorrect Operation
Te Products Pipeline Co, Llc 4/13/10 0 0 1 Yes Seymour, IN $0 $0 $41,204 Incorrect Operation
Highest Environmental Remediation Costs
Marathon Pipe Line Llc 4/13/11 378,000 0 0 No Dansville,MI $0 $23,278,602 $40,971,375 Material/Weld/Equip Failure
Chevron Pipe Line Co 3/18/13 20,958 0 0 No Willard, UT $360,987 $19,931,856 $24,112,208 Corrosion
Sfpp, Lp 12/13/18 458,220 0 0 No Anthony, NM $381,493 $17,243,209 $20,448,365 Corrosion
West Shore Pipeline Co 7/17/12 54,684 0 0 No Jackson, WI $0 $7,811,551 $26,135,736 Material/Weld/Equip Failure
Explorer Pipeline Co 5/20/14 10,500 0 0 No La Belle, TX $0 $7,071,558 $8,116,626 Incorrect Operation
Highest Property Damage To Public & Private Property
Colonial Pipeline Co 10/31/16 186,669 2 4 Yes Helena, AL $3,820,671 $185,727 $17,876,807 All Other Causes
Imtt-Bayonne 2/22/16 15,078 0 0 No Bayonn, NJ $2,122,595 $530,649 $2,799,139 Material/Weld/Equip Failure
Amoco Oil Co 8/17/10 38,640 0 0 No Hammond, IN $2,035,124 $5,064,417 $15,420,155 Corrosion
Mipc Llc 11/20/19 4,200 0 0 No Trainer, PA $1,330,000 $0 $1,530,000 Corrosion
Marathon Pipe Line Llc 2/17/15 6,720 0 0 No Louisville, KY $1,328,158 $0 $2,627,397 Other Outside Force Damage
The reason that there are only 3 failures listed under the worst for deaths & hospitalizations above, is because there were only three failures on refined prod-uct pipelines that had deaths and hospitalizations during the decade.

A DecADe In RevIew 2010 - 2019
Page 8
Worst Pipeline Failures Involving HVLs or Other Flammable or Toxic Fluids, which are a gas at ambient conditions
Company Date Gallons Spilled Deaths Injuries Ignite Location
Public/Private Property Damage
Environmental Remediation
CostsTotal Costs Cause
Largest Spills
Dcp Midstream 11/10/18 2,032,800 0 2 Yes Sutton County, TX $306,092 $102,031 $15,508,685 Excavation Damage
Enterprise Products Operating Llc 1/26/15 1,283,730 0 0 Yes Colliers, WV $101,754 $0 $7,401,903 Material/Weld/Equip Failure
Enterprise Products Operating Llc 1/10/15 1,139,166 0 0 No Jackson County, TX $8,033 $0 $837,875 Material/Weld/Equip Failure
Chevron Midstream Pipelines Llc 3/12/13 995,484 1 0 Yes Lafourche County, LA $0 $0 $11,340,360 Other Outside Force Damage
Enterprise Products Operating Llc 8/12/13 772,800 0 0 Yes Erie, IL $55,253 $55,253 $569,109 Material/Weld/Equip Failure
Worst For Deaths & Hospitalizations
Magellan Ammonia Pipeline, L.P. 10/17/16 108,654 1 1 No Burt County, NE $65,160 $0 $2,984,897 Material/Weld/Equip Failure
Phillips 66 Pipeline Llc 2/9/17 565,530 1 1 Yes Paradis, LA $0 $0 $4,694,473 Incorrect Operation
Dixie Pipeline 7/5/10 130,368 1 1 Yes Thomson, GA $0 $0 $613,198 Excavation Damage
Valero Refining-Texas L.P. 6/22/15 40,992 1 0 No Houston, TX $0 $0 $831,977 Other Outside Force Damage
Chevron Midstream Pipelines Llc 3/12/13 995,484 1 0 Yes Lafourche County, LA $0 $0 $11,340,360 Other Outside Force Damage
Highest Environmental Remediation Costs
Ascend Perf. Materials Texas Inc 9/28/17 57,527 0 0 No Brazoria County, TX $0 $4,253,086 $15,949,074 Corrosion
Markwest Liberty Midstream & Resources, Llc
8/13/13 479,010 0 0 No Littleton, WV $0 $2,762,667 $5,434,000 Natural Force Damage
Magellan Ammonia Pipeline, L.P. 1/12/10 18,690 0 0 No Pawnee, OK $79,534 $2,224,150 $2,944,631 Material/Weld/Equip Failure
Oneok Ngl Pipeline, Llc 7/27/17 126,000 0 0 No Mckenzie County, ND $57,333 $312,727 $752,108 Excavation Damage
Chevron Pipe Line Co 11/14/13 182,994 0 0 Yes Milford, TX $552,533 $276,267 $5,070,156 Excavation Damage
Highest Property Damage To Public & Private Property
Chevron Pipe Line Co 11/14/13 182,994 0 0 Yes Milford, TX $552,533 $276,267 $5,070,156 Excavation Damage
Williams Field Services 8/6/15 54,600 0 0 Yes Gill, CO $321,329 $5,355 $669,435 Excavation Damage
Dcp Midstream 11/10/18 2,032,800 0 2 Yes Sutton County, TX $306,092 $102,031 $15,508,685 Excavation Damage
Nustar Logistics, L.P. 6/18/15 336,000 0 0 No Victoria County, TX $128,531 $0 $1,116,560 Corrosion
Enterprise Products Operating Llc 1/26/15 1,283,730 0 0 Yes Colliers, WV $101,754 $0 $7,401,903 Material/Weld/Equip Failure

A DecADe In RevIew 2010 - 2019
Page 9
The Safest Companies of the DecadeLargest Gas Transmission Pipeline Systems that had ZERO
reportable failures 2010 - 2019
Operator ID Pipeline Operator 2019 Mileage
31632 Northwestern Corporation 2,152
844 Kern River Gas Transmission Co 1,417
31199 Alliance Pipeline L.P. 969
12876 Dominion Energy Utah/Wyoming/Idaho 772
13730 Northern Indiana Public Service Co 688
8090
5040
7060
302010
02010 2011 2012 2013 2014 2015 2016 2017 2018 2019
Signi�cant Incidents - Natural Gas TransmissionPipelines
Natural Gas Transmission pipelines provide some good safety trend news for the decade. As you can see from this graph failures on these types of pipelines have been decreasing over the decade, and we did find some fairly large operators who have had no failures at all in the past ten years.
Natural Gas Transmission Pipelines
A DecADe In RevIew 2010 - 2019
Page 10
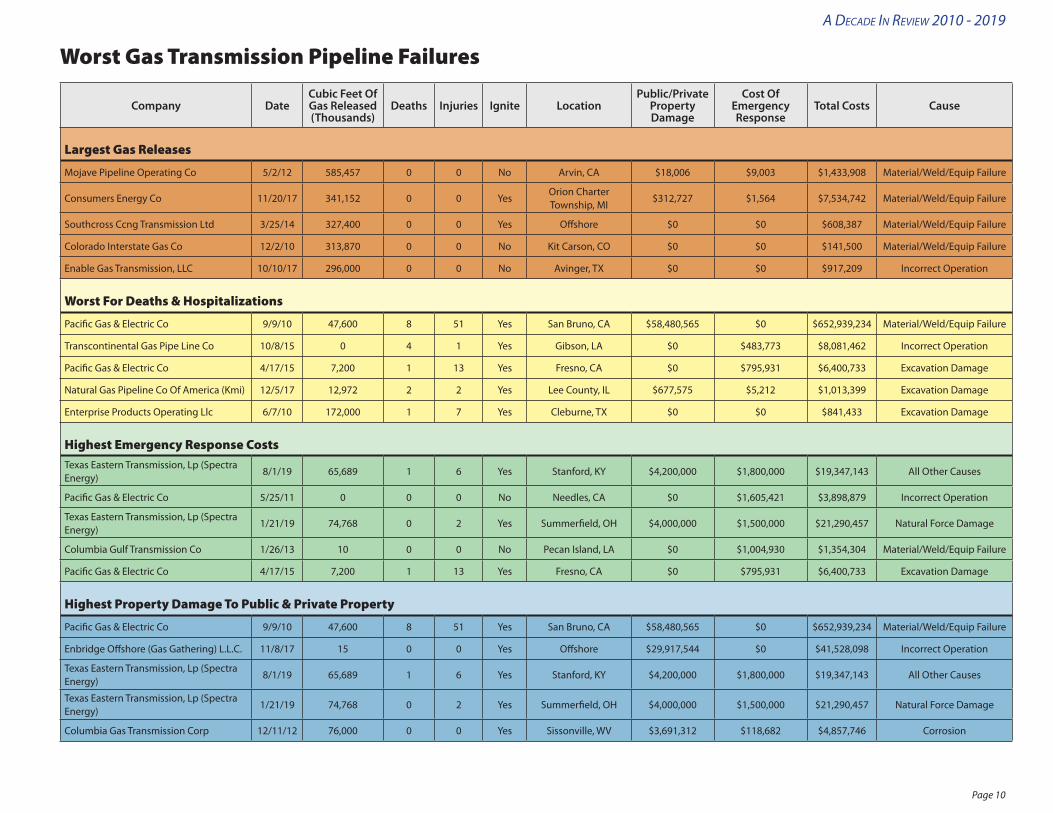
Worst Gas Transmission Pipeline Failures
Company DateCubic Feet Of Gas Released (Thousands)
Deaths Injuries Ignite LocationPublic/Private
Property Damage
Cost Of Emergency Response
Total Costs Cause
Largest Gas Releases
Mojave Pipeline Operating Co 5/2/12 585,457 0 0 No Arvin, CA $18,006 $9,003 $1,433,908 Material/Weld/Equip Failure
Consumers Energy Co 11/20/17 341,152 0 0 YesOrion Charter Township, MI
$312,727 $1,564 $7,534,742 Material/Weld/Equip Failure
Southcross Ccng Transmission Ltd 3/25/14 327,400 0 0 Yes Offshore $0 $0 $608,387 Material/Weld/Equip Failure
Colorado Interstate Gas Co 12/2/10 313,870 0 0 No Kit Carson, CO $0 $0 $141,500 Material/Weld/Equip Failure
Enable Gas Transmission, LLC 10/10/17 296,000 0 0 No Avinger, TX $0 $0 $917,209 Incorrect Operation
Worst For Deaths & Hospitalizations
Pacific Gas & Electric Co 9/9/10 47,600 8 51 Yes San Bruno, CA $58,480,565 $0 $652,939,234 Material/Weld/Equip Failure
Transcontinental Gas Pipe Line Co 10/8/15 0 4 1 Yes Gibson, LA $0 $483,773 $8,081,462 Incorrect Operation
Pacific Gas & Electric Co 4/17/15 7,200 1 13 Yes Fresno, CA $0 $795,931 $6,400,733 Excavation Damage
Natural Gas Pipeline Co Of America (Kmi) 12/5/17 12,972 2 2 Yes Lee County, IL $677,575 $5,212 $1,013,399 Excavation Damage
Enterprise Products Operating Llc 6/7/10 172,000 1 7 Yes Cleburne, TX $0 $0 $841,433 Excavation Damage
Highest Emergency Response CostsTexas Eastern Transmission, Lp (Spectra Energy)
8/1/19 65,689 1 6 Yes Stanford, KY $4,200,000 $1,800,000 $19,347,143 All Other Causes
Pacific Gas & Electric Co 5/25/11 0 0 0 No Needles, CA $0 $1,605,421 $3,898,879 Incorrect Operation
Texas Eastern Transmission, Lp (Spectra Energy)
1/21/19 74,768 0 2 Yes Summerfield, OH $4,000,000 $1,500,000 $21,290,457 Natural Force Damage
Columbia Gulf Transmission Co 1/26/13 10 0 0 No Pecan Island, LA $0 $1,004,930 $1,354,304 Material/Weld/Equip Failure
Pacific Gas & Electric Co 4/17/15 7,200 1 13 Yes Fresno, CA $0 $795,931 $6,400,733 Excavation Damage
Highest Property Damage To Public & Private Property
Pacific Gas & Electric Co 9/9/10 47,600 8 51 Yes San Bruno, CA $58,480,565 $0 $652,939,234 Material/Weld/Equip Failure
Enbridge Offshore (Gas Gathering) L.L.C. 11/8/17 15 0 0 Yes Offshore $29,917,544 $0 $41,528,098 Incorrect Operation
Texas Eastern Transmission, Lp (Spectra Energy)
8/1/19 65,689 1 6 Yes Stanford, KY $4,200,000 $1,800,000 $19,347,143 All Other Causes
Texas Eastern Transmission, Lp (Spectra Energy)
1/21/19 74,768 0 2 Yes Summerfield, OH $4,000,000 $1,500,000 $21,290,457 Natural Force Damage
Columbia Gas Transmission Corp 12/11/12 76,000 0 0 Yes Sissonville, WV $3,691,312 $118,682 $4,857,746 Corrosion

A DecADe In RevIew 2010 - 2019
Page 11
The Safest Companies of the DecadeLargest Gas Distribution Pipeline Systems that had ZERO
reportable failures 2010 - 2019
Operator ID Pipeline Operator 2019 Mileage
22791 Wisconsin Public Service Corp 13,884.28
2392 Citizens Gas & Coke Utility, In 8,243.89
22784 Alliant Energy - Wisconsin Power & Light Co 7,899.31
18508 Southern Indiana Gas & Electric Co 5,237.32
12018 Madison Gas & Electric Co 4,519.31
9080
100
5040
7060
302010
02010 2011 2012 2013 2014 2015 2016 2017 2018 2019
Signi�cant Incidents - Natural Gas DistributionPipelines
Natural gas distribution pipelines provided the biggest surprise in safety trends over the past decade. Over the past 30 years gas distribution pipeline failures having been declining, but for the past decade as you can see in this graph that trend has reversed and failures have been consistently increasing. These types of pipelines also tend to be where the greatest harm to people occur in terms of deaths, injuries, and property damage.
Natural Gas Distribution Pipelines
A DecADe In RevIew 2010 - 2019
Page 12
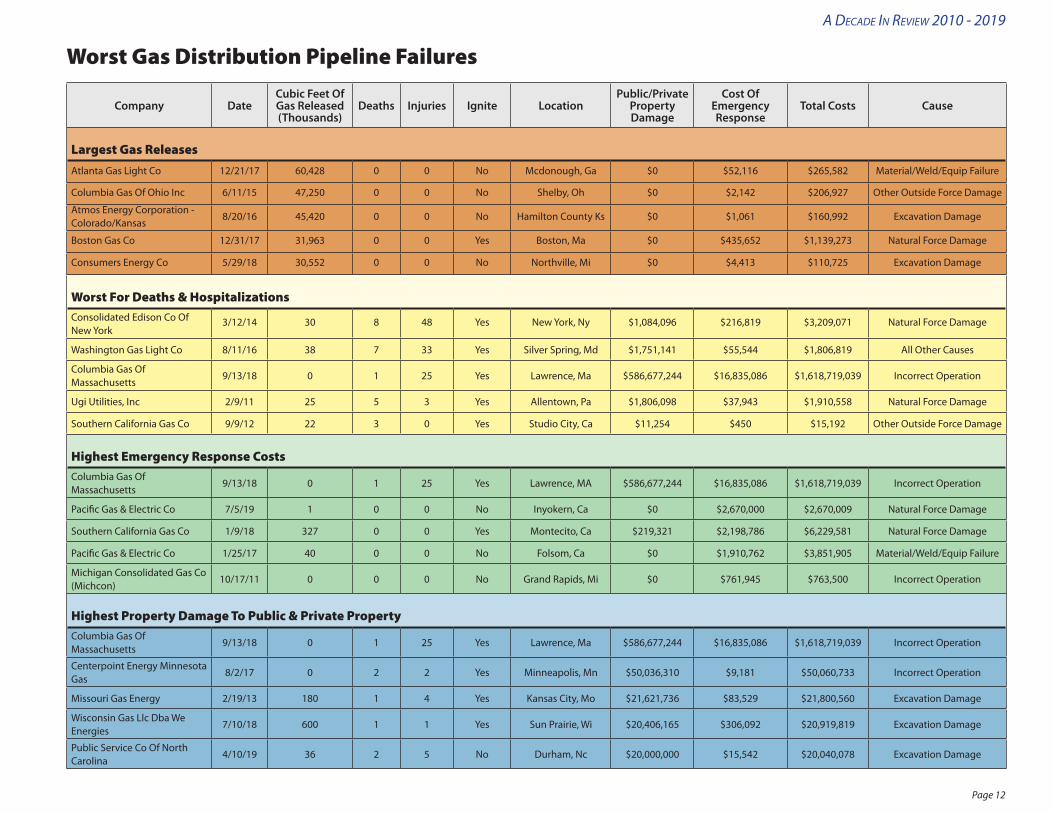
Worst Gas Distribution Pipeline Failures
Company DateCubic Feet Of Gas Released (Thousands)
Deaths Injuries Ignite LocationPublic/Private
Property Damage
Cost Of Emergency Response
Total Costs Cause
Largest Gas ReleasesAtlanta Gas Light Co 12/21/17 60,428 0 0 No Mcdonough, Ga $0 $52,116 $265,582 Material/Weld/Equip Failure
Columbia Gas Of Ohio Inc 6/11/15 47,250 0 0 No Shelby, Oh $0 $2,142 $206,927 Other Outside Force Damage
Atmos Energy Corporation - Colorado/Kansas
8/20/16 45,420 0 0 No Hamilton County Ks $0 $1,061 $160,992 Excavation Damage
Boston Gas Co 12/31/17 31,963 0 0 Yes Boston, Ma $0 $435,652 $1,139,273 Natural Force Damage
Consumers Energy Co 5/29/18 30,552 0 0 No Northville, Mi $0 $4,413 $110,725 Excavation Damage
Worst For Deaths & HospitalizationsConsolidated Edison Co Of New York
3/12/14 30 8 48 Yes New York, Ny $1,084,096 $216,819 $3,209,071 Natural Force Damage
Washington Gas Light Co 8/11/16 38 7 33 Yes Silver Spring, Md $1,751,141 $55,544 $1,806,819 All Other Causes
Columbia Gas Of Massachusetts
9/13/18 0 1 25 Yes Lawrence, Ma $586,677,244 $16,835,086 $1,618,719,039 Incorrect Operation
Ugi Utilities, Inc 2/9/11 25 5 3 Yes Allentown, Pa $1,806,098 $37,943 $1,910,558 Natural Force Damage
Southern California Gas Co 9/9/12 22 3 0 Yes Studio City, Ca $11,254 $450 $15,192 Other Outside Force Damage
Highest Emergency Response CostsColumbia Gas Of Massachusetts
9/13/18 0 1 25 Yes Lawrence, MA $586,677,244 $16,835,086 $1,618,719,039 Incorrect Operation
Pacific Gas & Electric Co 7/5/19 1 0 0 No Inyokern, Ca $0 $2,670,000 $2,670,009 Natural Force Damage
Southern California Gas Co 1/9/18 327 0 0 Yes Montecito, Ca $219,321 $2,198,786 $6,229,581 Natural Force Damage
Pacific Gas & Electric Co 1/25/17 40 0 0 No Folsom, Ca $0 $1,910,762 $3,851,905 Material/Weld/Equip Failure
Michigan Consolidated Gas Co (Michcon)
10/17/11 0 0 0 No Grand Rapids, Mi $0 $761,945 $763,500 Incorrect Operation
Highest Property Damage To Public & Private PropertyColumbia Gas Of Massachusetts
9/13/18 0 1 25 Yes Lawrence, Ma $586,677,244 $16,835,086 $1,618,719,039 Incorrect Operation
Centerpoint Energy Minnesota Gas
8/2/17 0 2 2 Yes Minneapolis, Mn $50,036,310 $9,181 $50,060,733 Incorrect Operation
Missouri Gas Energy 2/19/13 180 1 4 Yes Kansas City, Mo $21,621,736 $83,529 $21,800,560 Excavation Damage
Wisconsin Gas Llc Dba We Energies
7/10/18 600 1 1 Yes Sun Prairie, Wi $20,406,165 $306,092 $20,919,819 Excavation Damage
Public Service Co Of North Carolina
4/10/19 36 2 5 No Durham, Nc $20,000,000 $15,542 $20,040,078 Excavation Damage
A DecADe In RevIew 2010 - 2019
Page 13
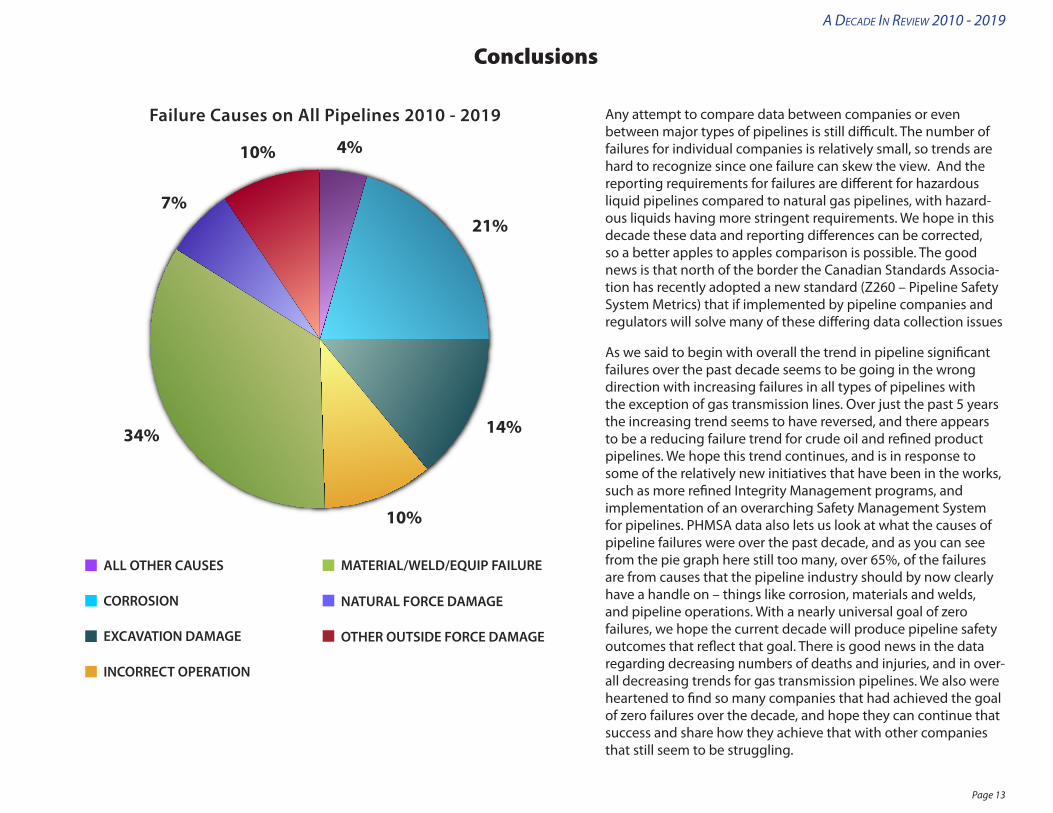
Any attempt to compare data between companies or even between major types of pipelines is still difficult. The number of failures for individual companies is relatively small, so trends are hard to recognize since one failure can skew the view. And the reporting requirements for failures are different for hazardous liquid pipelines compared to natural gas pipelines, with hazard-ous liquids having more stringent requirements. We hope in this decade these data and reporting differences can be corrected, so a better apples to apples comparison is possible. The good news is that north of the border the Canadian Standards Associa-tion has recently adopted a new standard (Z260 – Pipeline Safety System Metrics) that if implemented by pipeline companies and regulators will solve many of these differing data collection issues
As we said to begin with overall the trend in pipeline significant failures over the past decade seems to be going in the wrong direction with increasing failures in all types of pipelines with the exception of gas transmission lines. Over just the past 5 years the increasing trend seems to have reversed, and there appears to be a reducing failure trend for crude oil and refined product pipelines. We hope this trend continues, and is in response to some of the relatively new initiatives that have been in the works, such as more refined Integrity Management programs, and implementation of an overarching Safety Management System for pipelines. PHMSA data also lets us look at what the causes of pipeline failures were over the past decade, and as you can see from the pie graph here still too many, over 65%, of the failures are from causes that the pipeline industry should by now clearly have a handle on – things like corrosion, materials and welds, and pipeline operations. With a nearly universal goal of zero failures, we hope the current decade will produce pipeline safety outcomes that reflect that goal. There is good news in the data regarding decreasing numbers of deaths and injuries, and in over-all decreasing trends for gas transmission pipelines. We also were heartened to find so many companies that had achieved the goal of zero failures over the decade, and hope they can continue that success and share how they achieve that with other companies that still seem to be struggling.
Conclusions
Failure Causes on All Pipelines 2010 - 2019
ALL OTHER CAUSES
CORROSION
EXCAVATION DAMAGE
INCORRECT OPERATION
MATERIAL/WELD/EQUIP FAILURE
NATURAL FORCE DAMAGE
OTHER OUTSIDE FORCE DAMAGE
7%
10% 4%
21%
14%
10%
34%

A DecADe In RevIew 2010 - 2019
Page 14
Addendum – Data Sources, Explanations and Assumptions
Data Sources
All the data used in this review was from publicly available PHMSA data. It should be kept in mind that all of this data is submitted by pipeline operators and that PHMSA for the most part does not verify submissions regarding amounts of property damage, amounts released, etc. The accuracy of some of these numbers is often questioned because there is some incentive for operators to underreport. You can find all of this data if you start at PHMSA’s Data and Statistics Overview page which can be found at: https://www.phmsa.dot.gov/data-and-statistics/pipeline/data-and-statistics-overview In preparing this review we mainly used the following PHMSA datasets:
● PHMSA Incident Flagged Files – which allows you to download the raw incident data since 1986
● PHMSA Annual Reports from Operators – found under “Source Data”
● PHMSA Operator Information Search database which allows you to look at a whole range of information for individual pipeline companies
● PHMSA National Pipeline Performance Measures
● PHMSA Incident 20 Year Trends which allows you to looks at the incident trends for avariety of incident types and pipeline types over the past twenty years
Assumptions used for “worst case” incident determinations
Most of the data used in this review are numbers straight from the PHMSA data. The exception of this is in the way we arrived at the 5 worst incidents in various categories. In some cases this is relatively easy, such as largest spills where we just took the largest volumes unintentionally released. The difficult area here was to determine the worst incidents for deaths and hospitalizations. For those incidents we gave a death 5 points and each hospitalization 1 point, and then added the points, That is why some incidents with fewer deaths but many more hospitalizations may have been higher on the list. Clearly not a perfect system, but that is how we did it.
For property damage we only included the amount that was paid by companies for damage to private or public property, and did not include other types of property damage such as the cost of the lost product, cost of damage to the pipeline, or what companies paid to respond and remediate damage.
For Hazard Liquid pipelines for worst environmental damage we used the costs reported to remediate environmental damage.
For Natural Gas pipelines there is little information to try to weigh the environmental costs of failures, so we used the costs reported for emergency Response.
Use of Significant Incidents
In many of our graphs of incident trends we used PHMSA’s Significant Incident numbers, instead of other types of incidents such as serious incidents, all reportable incidents, or incidents that affect people or the environment. We did this because it allows an apples to apples comparison between pipeline types, and includes most of the types of incidents that the public finds troubling.
Assumptions to identify the “Safest Companies of the Decade"
To identify these companies we searched for companies that had no reportable failures during the decade, and then found the five companies with the most mileage of pipeline. We also made sure that they had actually been in operation for at least 7 of the 10 years.