a day in the life of a smart building - c398624.r24.cf1 ...c398624.r24.cf1.rackcdn.com/day in the...
TRANSCRIPT
Copyright 2012 – Johnson Controls1
A Day in the Life of a Smart Building
Clay NeslerVice President, Global Energy and Sustainability
Johnson Controls
Copyright 2012 – Johnson Controls
0
9
18
0
2
4
6
8:00 PM 12:00 AM 4:00 AM 8:00 AM 12:00 PM 4:00 PM
Typical Profile Smart Building Profile Electricity Price (¢/kWh)Building Power Demand (W/sf)
PowerPrice
(¢/kWh)
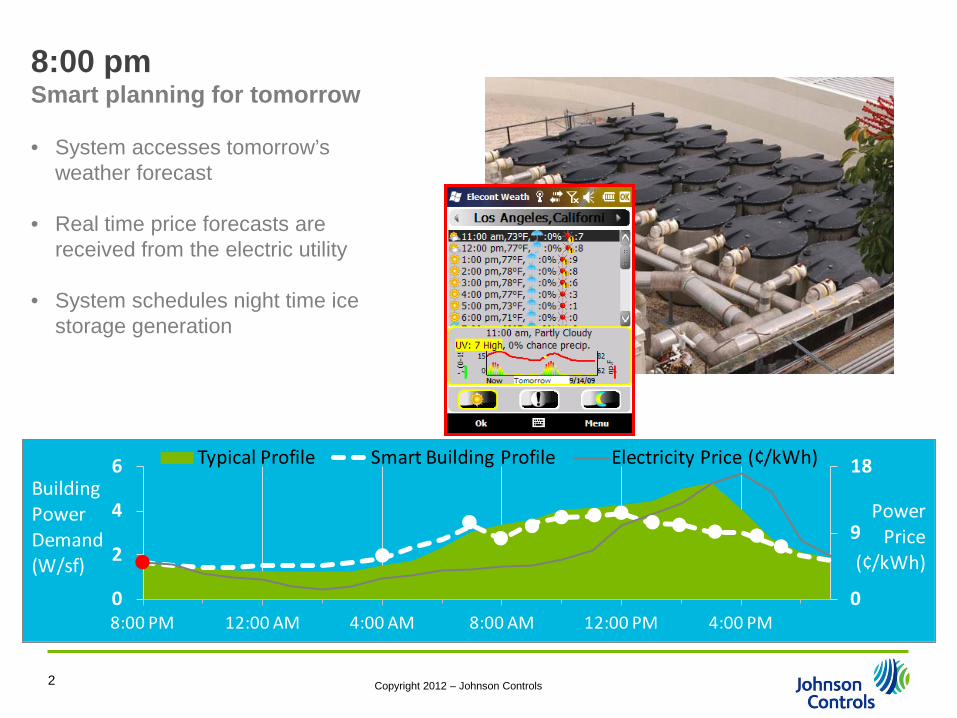
8:00 pmSmart planning for tomorrow
• System accesses tomorrow’s weather forecast
• Real time price forecasts are received from the electric utility
• System schedules night time ice storage generation
93°F94°F
97°F98°F98°F98°F98°F98°F
2
Copyright 2012 – Johnson Controls
0
9
18
0
2
4
6
8:00 PM 12:00 AM 4:00 AM 8:00 AM 12:00 PM 4:00 PM
Typical Profile Smart Building Profile Electricity Price (¢/kWh)Building Power Demand (W/sf)
PowerPrice
(¢/kWh)
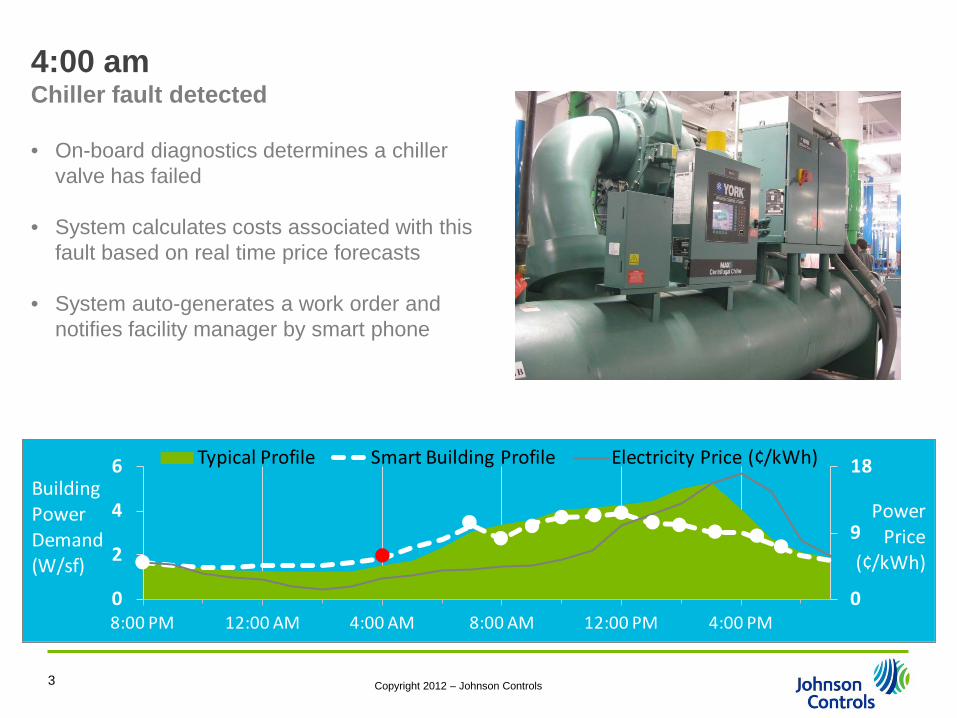
4:00 amChiller fault detected
• On-board diagnostics determines a chiller valve has failed
• System calculates costs associated with this fault based on real time price forecasts
• System auto-generates a work order and notifies facility manager by smart phone
3
Copyright 2012 – Johnson Controls
0
9
18
0
2
4
6
8:00 PM 12:00 AM 4:00 AM 8:00 AM 12:00 PM 4:00 PM
Typical Profile Smart Building Profile Electricity Price (¢/kWh)Building Power Demand (W/sf)
PowerPrice
(¢/kWh)
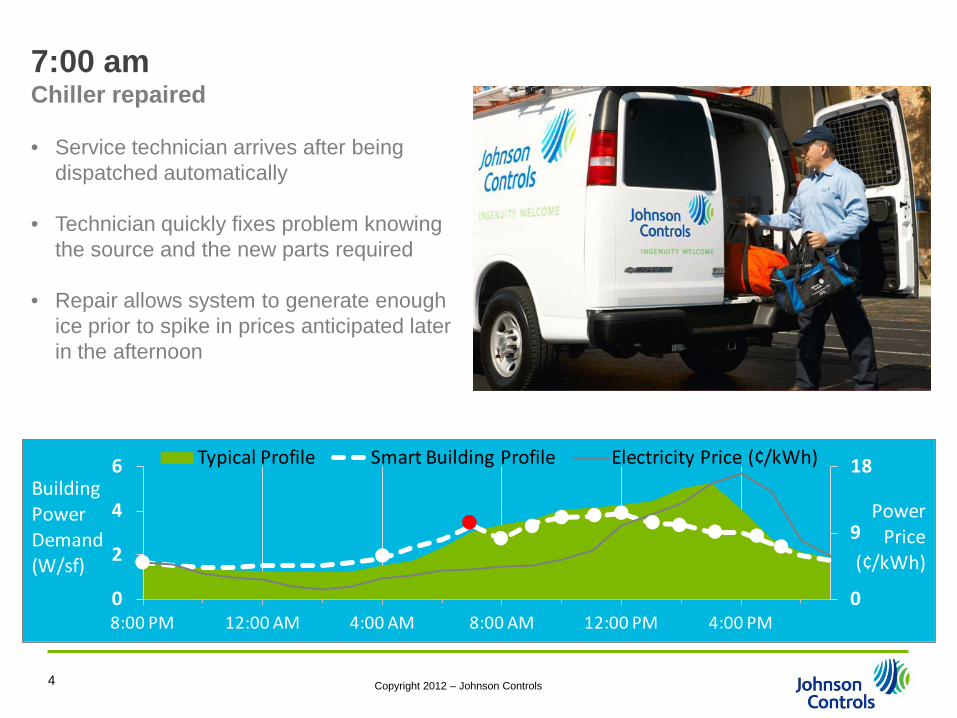
7:00 amChiller repaired
• Service technician arrives after being dispatched automatically
• Technician quickly fixes problem knowing the source and the new parts required
• Repair allows system to generate enough ice prior to spike in prices anticipated later in the afternoon
4
Copyright 2012 – Johnson Controls
0
9
18
0
2
4
6
8:00 PM 12:00 AM 4:00 AM 8:00 AM 12:00 PM 4:00 PM
Typical Profile Smart Building Profile Electricity Price (¢/kWh)Building Power Demand (W/sf)
PowerPrice
(¢/kWh)
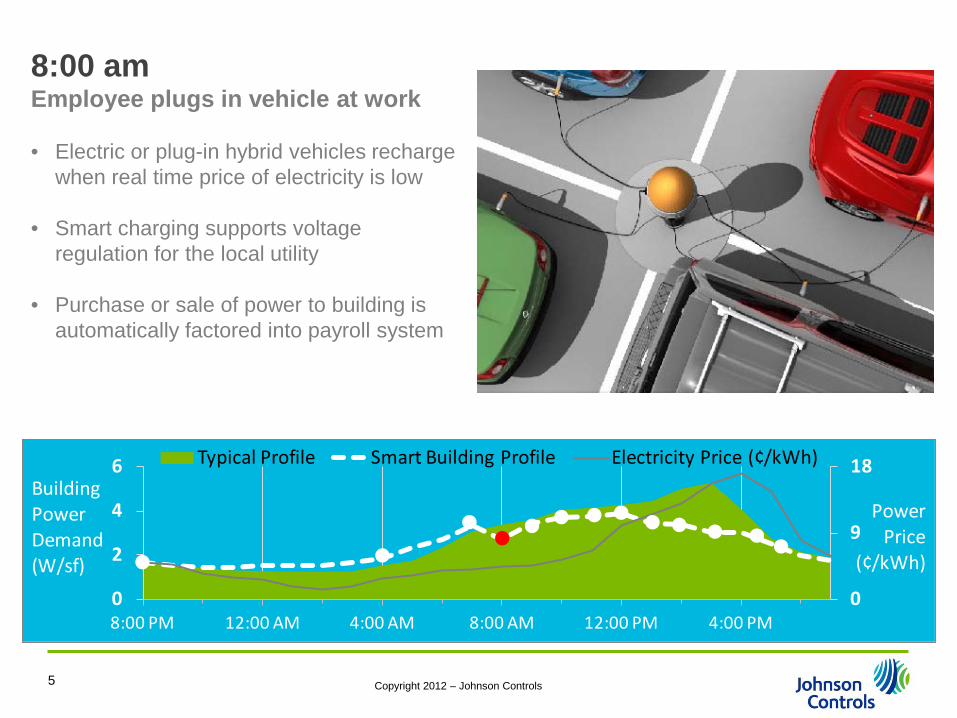
8:00 amEmployee plugs in vehicle at work
• Electric or plug-in hybrid vehicles recharge when real time price of electricity is low
• Smart charging supports voltage regulation for the local utility
• Purchase or sale of power to building is automatically factored into payroll system
5
Copyright 2012 – Johnson Controls
0
9
18
0
2
4
6
8:00 PM 12:00 AM 4:00 AM 8:00 AM 12:00 PM 4:00 PM
Typical Profile Smart Building Profile Electricity Price (¢/kWh)Building Power Demand (W/sf)
PowerPrice
(¢/kWh)
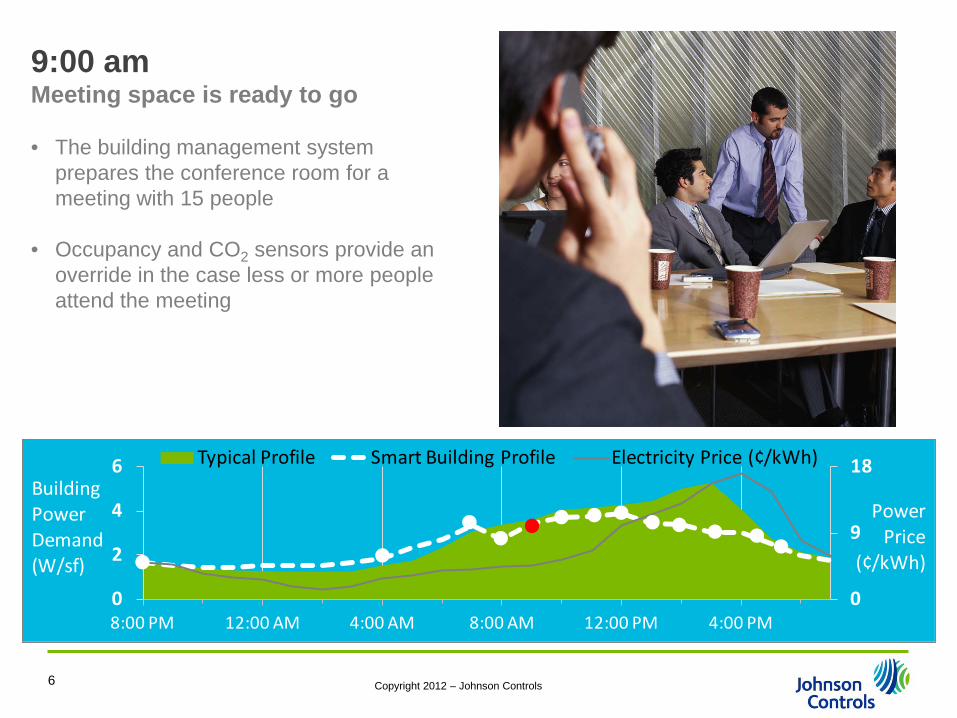
9:00 amMeeting space is ready to go
• The building management system prepares the conference room for a meeting with 15 people
• Occupancy and CO2 sensors provide an override in the case less or more people attend the meeting
6
Copyright 2012 – Johnson Controls
0
9
18
0
2
4
6
8:00 PM 12:00 AM 4:00 AM 8:00 AM 12:00 PM 4:00 PM
Typical Profile Smart Building Profile Electricity Price (¢/kWh)Building Power Demand (W/sf)
PowerPrice
(¢/kWh)
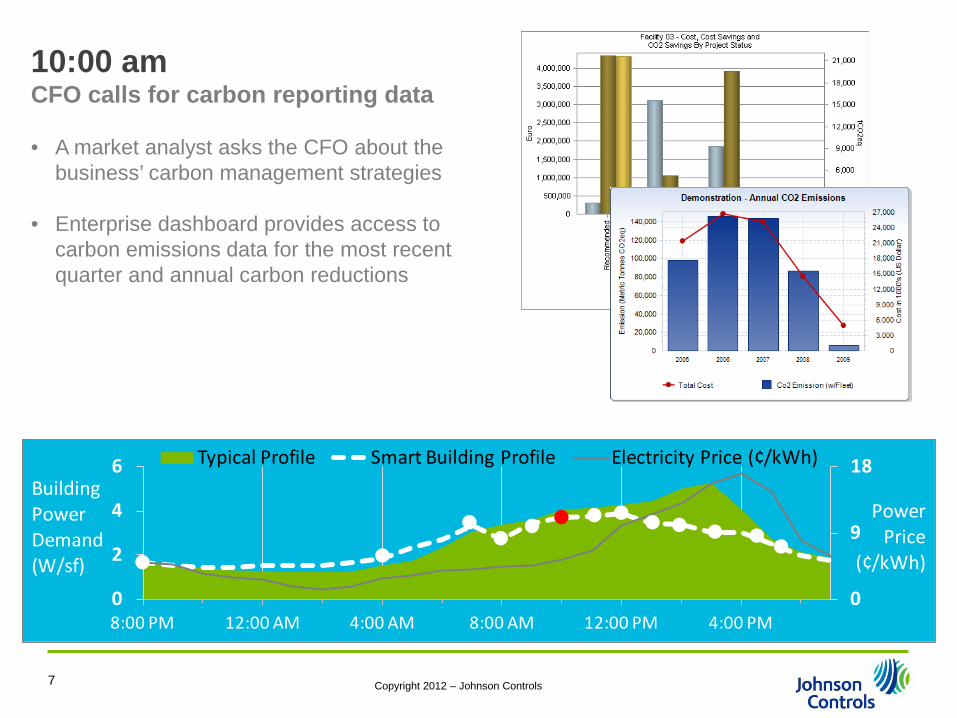
10:00 amCFO calls for carbon reporting data
• A market analyst asks the CFO about the business’ carbon management strategies
• Enterprise dashboard provides access to carbon emissions data for the most recent quarter and annual carbon reductions
7
Copyright 2012 – Johnson Controls
0
9
18
0
2
4
6
8:00 PM 12:00 AM 4:00 AM 8:00 AM 12:00 PM 4:00 PM
Typical Profile Smart Building Profile Electricity Price (¢/kWh)Building Power Demand (W/sf)
PowerPrice
(¢/kWh)
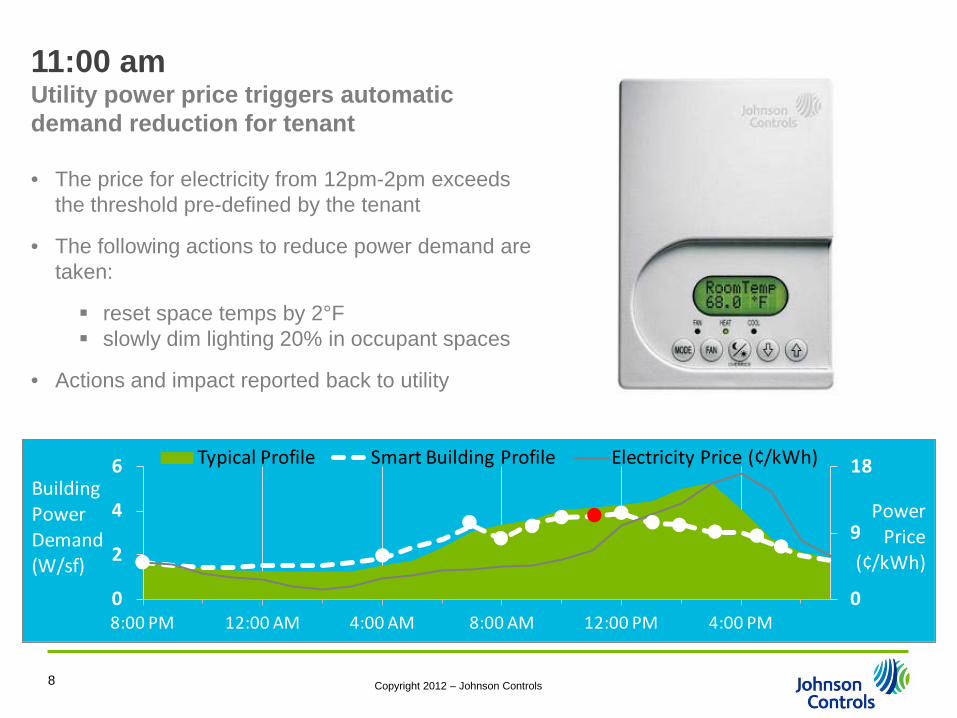
11:00 amUtility power price triggers automatic demand reduction for tenant
• The price for electricity from 12pm-2pm exceeds the threshold pre-defined by the tenant
• The following actions to reduce power demand are taken:
reset space temps by 2°F slowly dim lighting 20% in occupant spaces
• Actions and impact reported back to utility
8

Copyright 2012 – Johnson Controls
0
9
18
0
2
4
6
8:00 PM 12:00 AM 4:00 AM 8:00 AM 12:00 PM 4:00 PM
Typical Profile Smart Building Profile Electricity Price (¢/kWh)Building Power Demand (W/sf)
PowerPrice
(¢/kWh)
12:00 pmPower price triggers automated demand reduction for building owner
• The building management system also takes action in common areas: dispatch ice storage cooling increase chilled water set point dim lighting in common areas by 20%
• Actions and impact are reported back to utility
9
Copyright 2012 – Johnson Controls
0
9
18
0
2
4
6
8:00 PM 12:00 AM 4:00 AM 8:00 AM 12:00 PM 4:00 PM
Typical Profile Smart Building Profile Electricity Price (¢/kWh)Building Power Demand (W/sf)
PowerPrice
(¢/kWh)
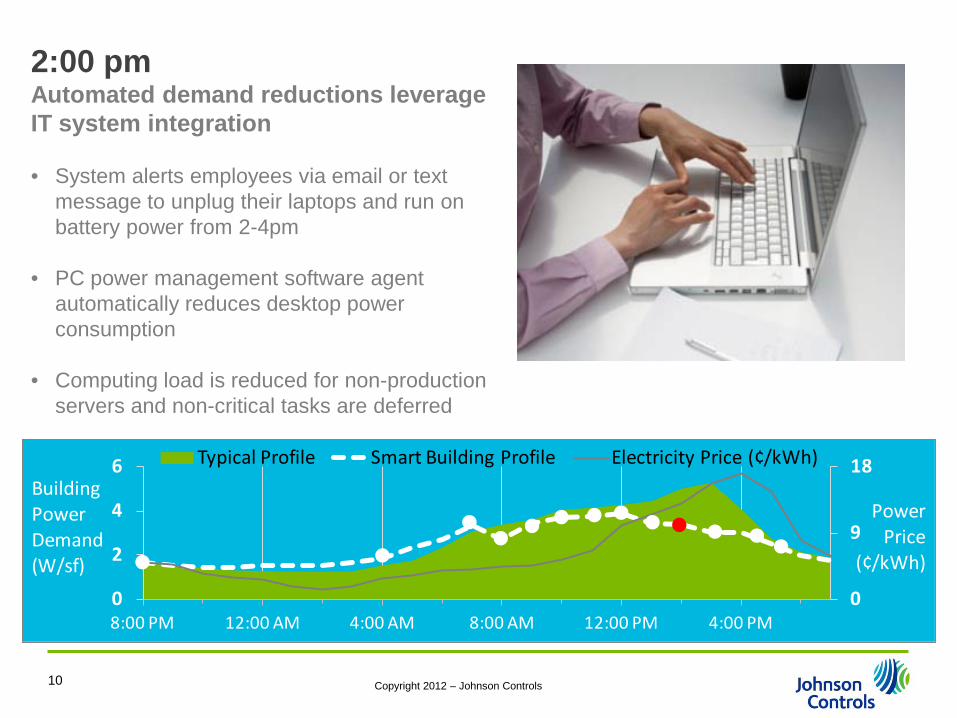
2:00 pmAutomated demand reductions leverage IT system integration
• System alerts employees via email or text message to unplug their laptops and run on battery power from 2-4pm
• PC power management software agent automatically reduces desktop power consumption
• Computing load is reduced for non-production servers and non-critical tasks are deferred
10
Copyright 2012 – Johnson Controls
0
9
18
0
2
4
6
8:00 PM 12:00 AM 4:00 AM 8:00 AM 12:00 PM 4:00 PM
Typical Profile Smart Building Profile Electricity Price (¢/kWh)Building Power Demand (W/sf)
PowerPrice
(¢/kWh)
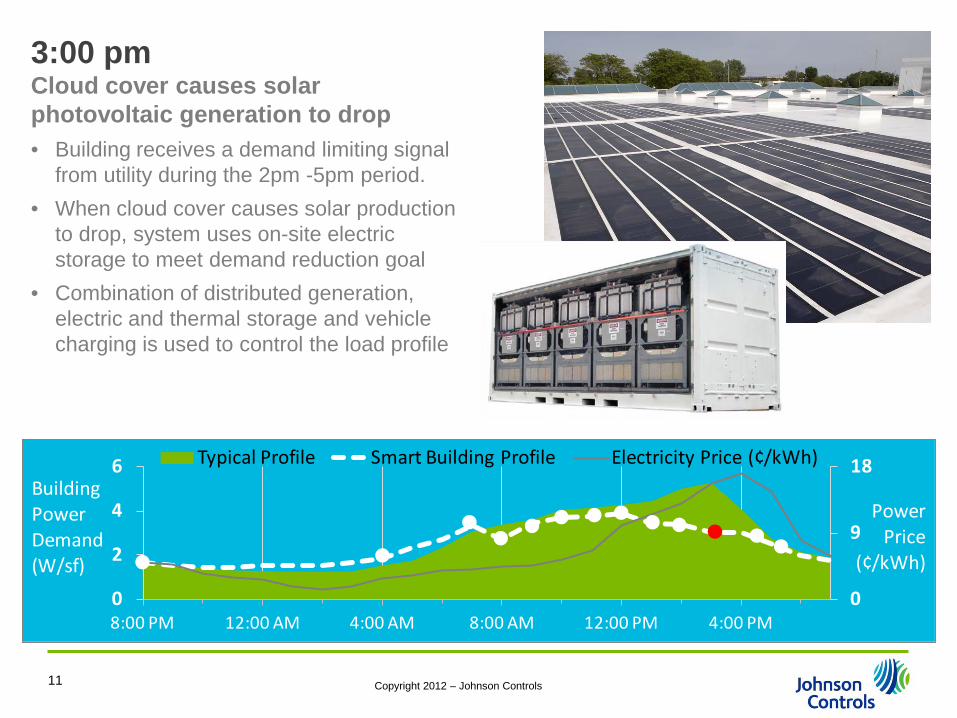
3:00 pmCloud cover causes solar photovoltaic generation to drop• Building receives a demand limiting signal
from utility during the 2pm -5pm period. • When cloud cover causes solar production
to drop, system uses on-site electric storage to meet demand reduction goal
• Combination of distributed generation, electric and thermal storage and vehicle charging is used to control the load profile
11
Copyright 2012 – Johnson Controls
0
9
18
0
2
4
6
8:00 PM 12:00 AM 4:00 AM 8:00 AM 12:00 PM 4:00 PM
Typical Profile Smart Building Profile Electricity Price (¢/kWh)Building Power Demand (W/sf)
PowerPrice
(¢/kWh)
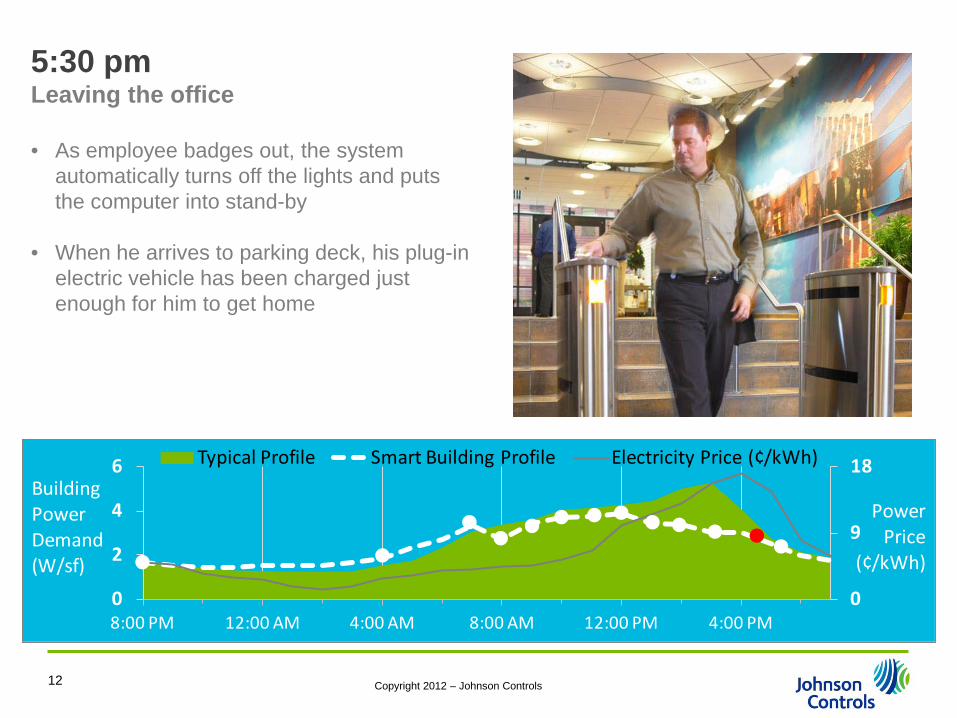
5:30 pmLeaving the office
• As employee badges out, the system automatically turns off the lights and puts the computer into stand-by
• When he arrives to parking deck, his plug-in electric vehicle has been charged just enough for him to get home
12
Copyright 2012 – Johnson Controls
0
9
18
0
2
4
6
8:00 PM 12:00 AM 4:00 AM 8:00 AM 12:00 PM 4:00 PM
Typical Profile Smart Building Profile Electricity Price (¢/kWh)Building Power Demand (W/sf)
PowerPrice
(¢/kWh)
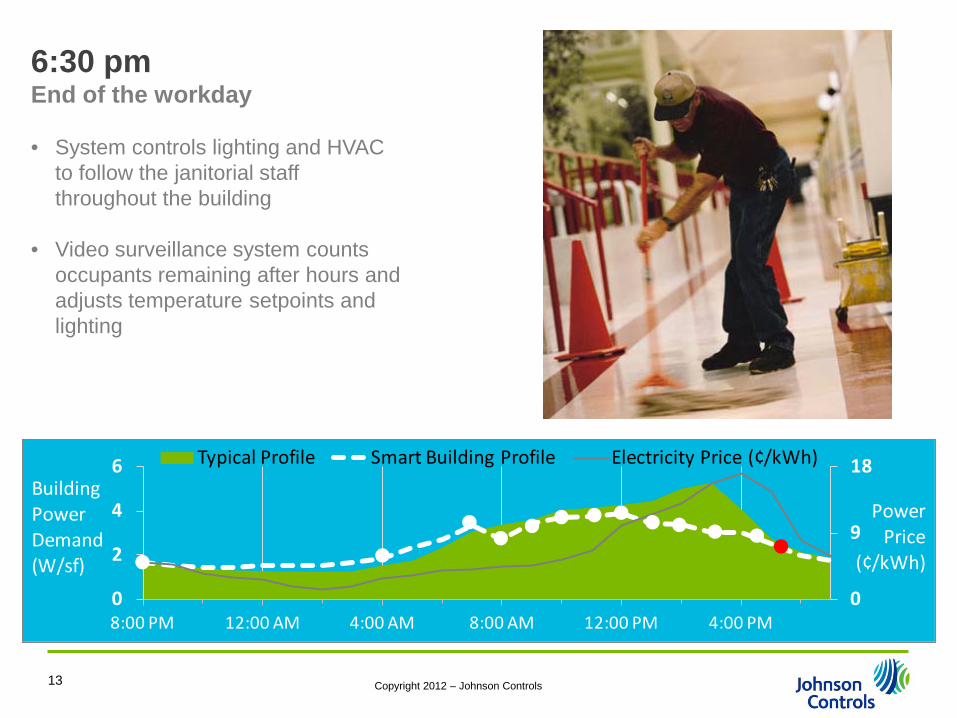
6:30 pmEnd of the workday
• System controls lighting and HVAC to follow the janitorial staff throughout the building
• Video surveillance system counts occupants remaining after hours and adjusts temperature setpoints and lighting
13
Copyright 2012 – Johnson Controls
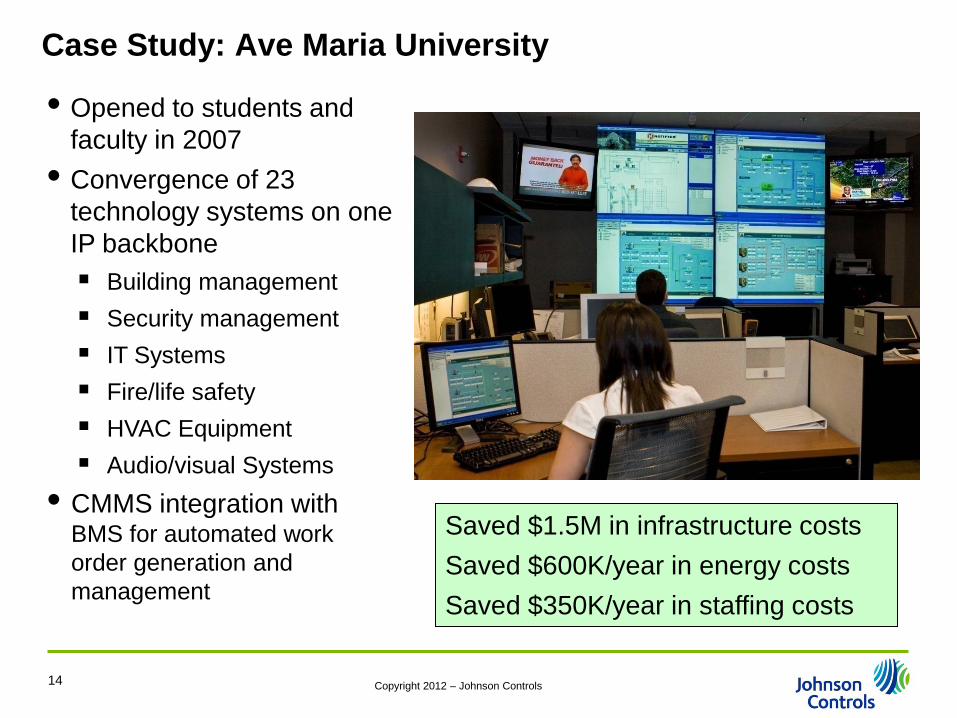
Case Study: Ave Maria University
14
• Opened to students and faculty in 2007
• Convergence of 23 technology systems on one IP backbone Building management Security management IT Systems Fire/life safety HVAC Equipment Audio/visual Systems
• CMMS integration with BMS for automated work order generation and management
Saved $1.5M in infrastructure costsSaved $600K/year in energy costsSaved $350K/year in staffing costs
Copyright 2012 – Johnson Controls
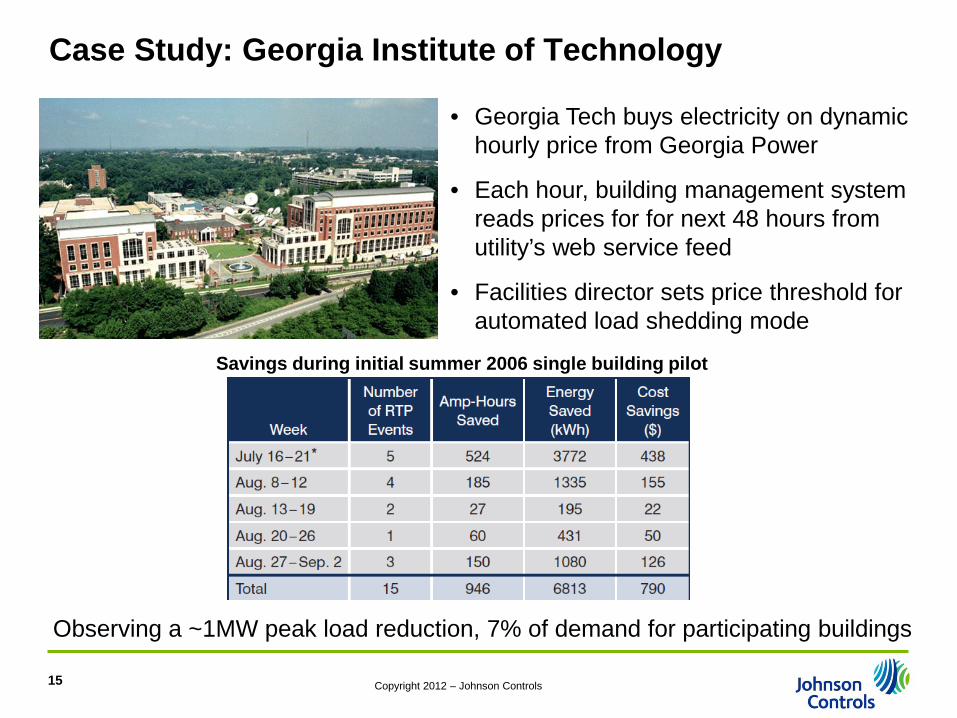
Case Study: Georgia Institute of Technology
15
• Georgia Tech buys electricity on dynamic hourly price from Georgia Power
• Each hour, building management system reads prices for for next 48 hours from utility’s web service feed
• Facilities director sets price threshold for automated load shedding mode
Observing a ~1MW peak load reduction, 7% of demand for participating buildings
Savings during initial summer 2006 single building pilot
Copyright 2012 – Johnson Controls
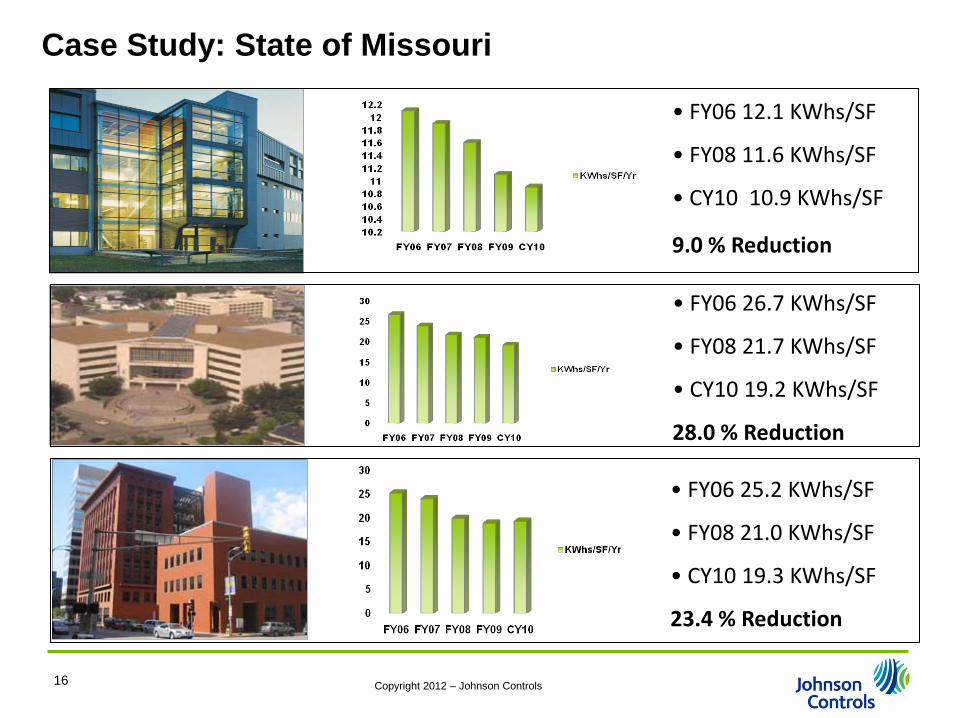
Case Study: State of Missouri
16
• FY06 12.1 KWhs/SF
• FY08 11.6 KWhs/SF
• CY10 10.9 KWhs/SF
9.0 % Reduction
• FY06 26.7 KWhs/SF
• FY08 21.7 KWhs/SF
• CY10 19.2 KWhs/SF
28.0 % Reduction
• FY06 25.2 KWhs/SF
• FY08 21.0 KWhs/SF
• CY10 19.3 KWhs/SF
23.4 % Reduction
Copyright 2012 – Johnson Controls
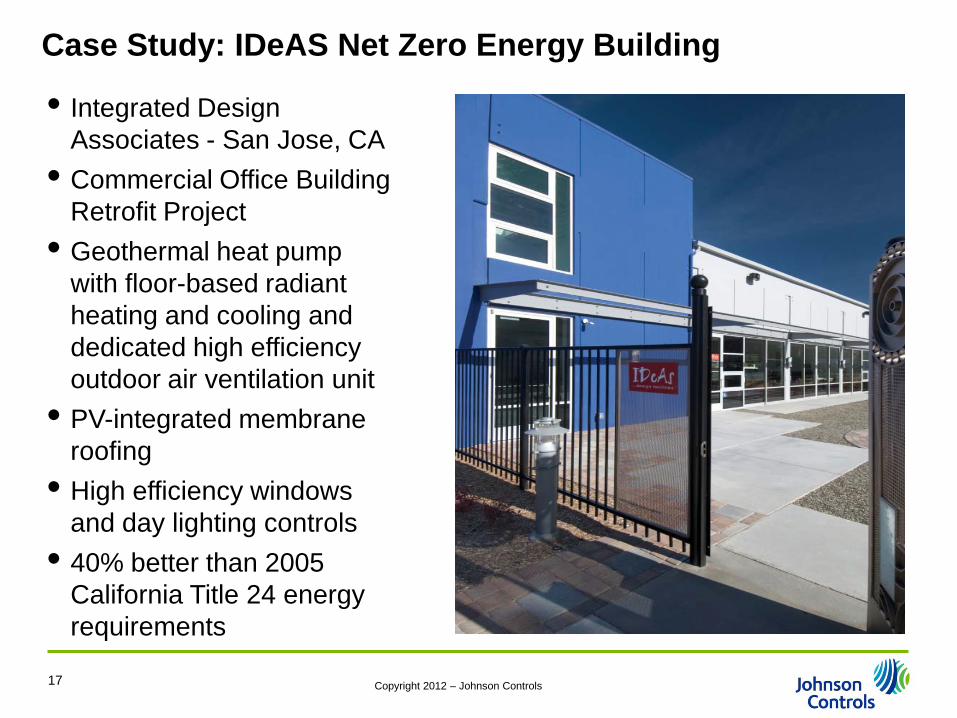
Case Study: IDeAS Net Zero Energy Building
17
• Integrated Design Associates - San Jose, CA
• Commercial Office Building Retrofit Project
• Geothermal heat pump with floor-based radiant heating and cooling and dedicated high efficiency outdoor air ventilation unit
• PV-integrated membrane roofing
• High efficiency windows and day lighting controls
• 40% better than 2005 California Title 24 energy requirements
Copyright 2012 – Johnson Controls
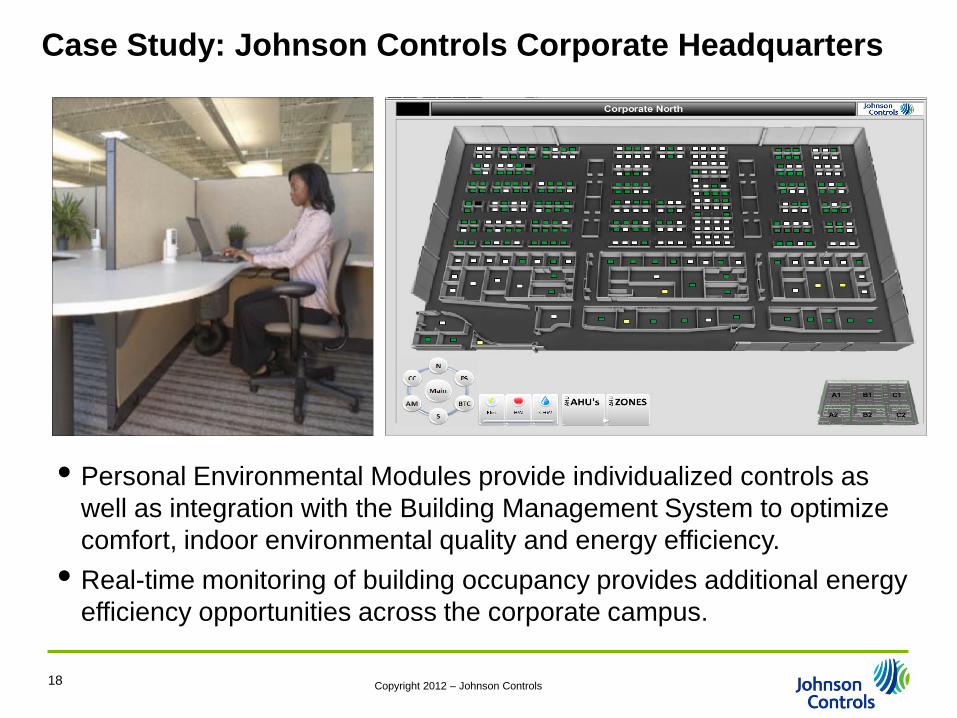
Case Study: Johnson Controls Corporate Headquarters
18
• Personal Environmental Modules provide individualized controls as well as integration with the Building Management System to optimize comfort, indoor environmental quality and energy efficiency.
• Real-time monitoring of building occupancy provides additional energy efficiency opportunities across the corporate campus.
Copyright 2012 – Johnson Controls
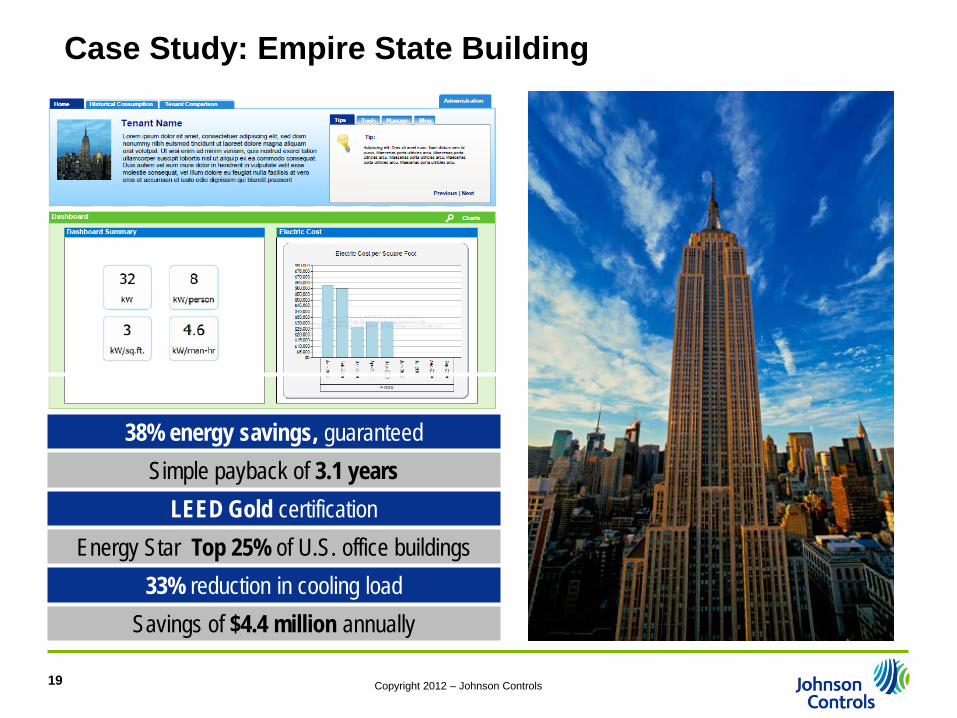
Case Study: Empire State Building
19
38% energy savings, guaranteedSimple payback of 3.1 years
LEED Gold certificationEnergy Star Top 25% of U.S. office buildings
33% reduction in cooling loadSavings of $4.4 million annually
Copyright 2012 – Johnson Controls
For more information about smart buildings and smart grid integration is available at:
www.InstituteBE.com
20