a database design for cvs pharmacy's patterson, california
TRANSCRIPT
A DATABASE DESIGN FOR CVS
PHARMACY’S PATTERSON, CALIFORNIA
DISTRIBUTION CENTER
BY
JASON KENNETH OKAJIMA
A Senior Project submitted in partial
fulfillment of the requirements for the
degree of Bachelor of Science in Industrial
Engineering
California Polytechnic State University
San Luis Obispo
Graded by: ______________________________ Date of Submission: ______________________________
Checked by: ______________________________ Approved by: ______________________________

1
Executive Summary
CVS Pharmacy’s Patterson, California Distribution Center did not have an
efficient and cost effective method for auditing shipped out products. The purpose
of this project was to create a new system and procedure for the Patterson
Distribution Center to audit shipped out container totes. The distribution center’s
original method was slow, inefficient, and involved paper waste, considerable travel
time, and several manual procedures. This project was meant to develop a new
process and database system to provide a solution to their problem.
The end goal of this project was to implement the designed method and
system of auditing for daily use in the distribution center.

2
Table of Content Executive Summary ................................................................................................................ 1 Table of Content ....................................................................................................................... 2 Introduction .............................................................................................................................. 3 Background ............................................................................................................................... 4 Literature Review .................................................................................................................... 6 Database Design ................................................................................................................................ 6 Tables ................................................................................................................................................................... 8 Queries ................................................................................................................................................................. 9 Forms .................................................................................................................................................................... 9 Reports .............................................................................................................................................................. 10 Macros ............................................................................................................................................................... 10
Human Factors Engineering ....................................................................................................... 10 Engineering Economics ................................................................................................................ 12 Summary ........................................................................................................................................... 14
Design ....................................................................................................................................... 15 Requirements .................................................................................................................................. 15 Auditing Purpose ............................................................................................................................ 15 Current Process .............................................................................................................................. 16 Microsoft Access vs. Microsoft Excel ........................................................................................ 17 UPC Scanner ..................................................................................................................................... 19 Database Design ............................................................................................................................. 20 Constraints ....................................................................................................................................... 20 Economic Analysis ......................................................................................................................... 20 Summary ........................................................................................................................................... 21
Methods ................................................................................................................................... 22 Database Design ............................................................................................................................. 22 Human Factors Engineering ....................................................................................................... 23 Economic Analysis ......................................................................................................................... 23
Results ...................................................................................................................................... 25 Database ............................................................................................................................................ 25 Final Auditing Process .................................................................................................................. 28 Economic Analysis ......................................................................................................................... 31
Conclusion ............................................................................................................................... 33 Bibliography ........................................................................................................................... 34 Appendix A – Original Method Time Studies ............................................................... 36 Appendix B – Proposed Method Time Studies ............................................................ 37 Appendix C – Economic Analysis Calculations ............................................................ 38 Appendix D – Database User Manual ............................................................................. 39 Appendix E – Report Examples ........................................................................................ 47

3
Introduction
The objective of this project was to design and implement an efficient and
time effective method of auditing shipped out products from CVS Pharmacy’s
Patterson, California Distribution Center. The main aspect of the final method
includes a Microsoft Access database. The database was designed to help the
auditing process of split-‐case picks. Currently the distribution center prints out pick
lists with products and their quantities and manually audits several totes per day.
Each supervisor is required to audit between twenty-‐five and fifty totes per shift.
The process of manually auditing these totes is very inefficient and time consuming.
In addition to improving the entire auditing process, this project implemented
a human factors analysis of computer interface designs. Several layouts were
designed and tested to determine the most accessible and easy to use final product.
Cost analysis and estimation were implemented to determine if the
investment was beneficial for CVS. Payback period was calculated to find the time
frame of the initial investment. Time studies of the original process versus the new
process were conducted to determine how much time and money would be saved in
the future.

4
Background
CVS Caremark is the forty-‐fourth largest company is the world and the
largest pharmaceutical company. They currently have twenty-‐one distribution
centers throughout the United States. These distribution centers are responsible for
delivering and stocking products for anywhere between 300 to 1,000 stores in their
respective region.
The northern California distribution center, located in Patterson, is
responsible for supplying approximately 750 CVS stores, including those operating
in Hawaii. The warehouse is around 850,000 square feet in size and stocks
approximately 20,000 different products.
Each distribution center is fully responsible for the auditing of shipments to
guarantee accuracy in those shipments. CVS’ split-‐case picking system makes this
process difficult.
The split-‐case picking system is a method of replenishing each store with the
exact products and quantities that were sold the previous day. This system was
adopted by Wal-‐Mart, the worlds largest company. This allows each store to
maintain a constant inventory for all products carried. To ensure shipments are
correct, several totes sent out daily must be audited to make sure products and
quantities are correct. As one can see, this can be a very tedious and time-‐
consuming process.
CVS Pharmacy’s Patterson, California Distribution Center is currently looking
for the most effective and time sensitive method to complete this process. Different
ideas such as databases, Microsoft Excel Workbooks, and others have been

5
discussed but have yet to be implemented. Microsoft Excel workbooks and Access
databases allow users to fully store data. Once audits are complete, the distribution
center desires a computer-‐based program that can generate accuracy percentages
and produce feedback. With the correct implementation of one or both of these
programs, CVS can develop a program to provide this.

6
Literature Review
This chapter of the report will show research that was conducted with the
use of scholarly journal articles, Internet sources, and text references. This was
done prior to the project to help familiarize myself with background information on
the incorporated methods used in the project.
Database design, human factors engineering, and engineering economics
were among the topics researched in this chapter. This section was developed with
the intent to familiarize readers with the methods used throughout this project.
Database Design
Before computers, a popular way to store data was on index cards. Each card
contained relevant data such as a product’s name or location, unique identifier,
category, price, description, and the supplier’s name and phone number. To find
particular product information or locations, you either needed to keep track of the
products on a separate sheet of paper or go through the index cards to pull every
one representing a product made by that supplier (Frye, 2010).
With today’s computer capabilities, storing the same data on a computer will
make locating products much easier. For example, if a company has a Microsoft
Word or Excel table with a column for each type of data they want to store, they can
change the order of the table rows to group all the products of a specific category or
supplier to be grouped together.
However, using Microsoft Word or Excel to store data is not the most
efficient solution. There are many limitations when forming tables within these
programs. Designing a table can become very repetitive and time consuming as the

7
user would have to enter numerous pieces of data every time an addition or change
is desired (Frye, 2010).
A much more efficient way to store data would be with the use of a database.
By definition, a database management system is a collection of programs that
enables users to store, modify, and extract information from a database. There are
several types of database management systems (DBMS), ranging from small systems
that run on personal computers to large systems that are ran on mainframes or
large servers (Database Management Systems, 2011).
Databases are designed to combine data from several sources into a single
table. Once the data is entered into a table, it can be merged with other tables
within the database to provide very useful information for the user (Frye, 2010).
Databases have become a huge part of efficiently maintaining information for an
entire company’s inventory. This allows several users across an entire server to
access data about products and inventory status.
Access is Microsoft’s database management program. It is part of the
Microsoft Office suite. Access has become a reliable database software application
used to maintain excessive amounts of information. The program enables users to
maintain collections of data arranged according to a fixed structure. Its structure
makes the information easy to select, sort, display, and print (Barrows, Simpson,
Young, 2007).
Access is a general-‐purpose program that works with almost any type of
information. A database can be as simple as a list of products to replace your index
card file, as previously mentioned above. It can be as complex as an entire library’s
8
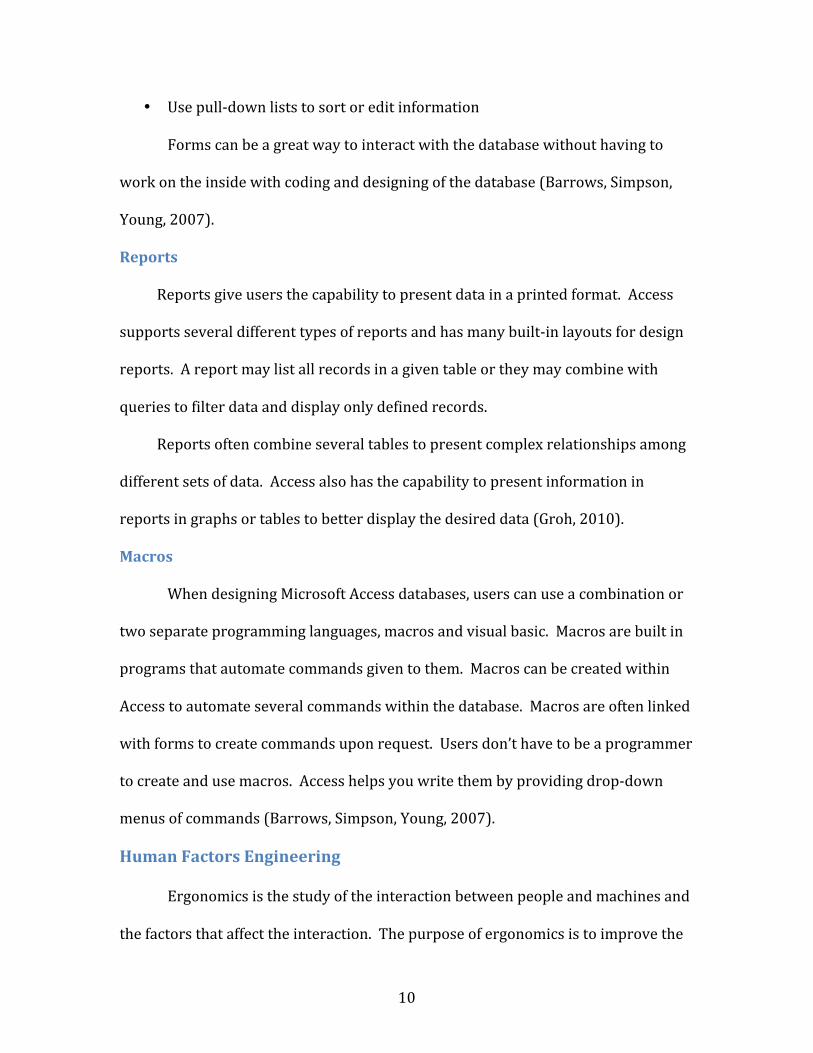
book collection and check out process. Microsoft Access can also handle complex
databases that contain lots of types of information and lots of customized
programming (Barrows, Simpson, Young, 2007).
Access databases contain six types of objects, which consist of the data and
tools needed to use Access. The six types of objects are:
• Tables
• Queries
• Forms
• Reports
• Macros
• Modules
(Groh, 2010)
In this project, I will use the functions of tables, queries, forms, reports, and macros.
Tables
Tables are where data is stored. A table is an Access object that is made up of
a series of records. Tables are essentially the electronic version of index cards.
Tables contain several records that contain information in the same format. For
example, in a product list, each record might contain product description, SKU, UPC,
and more relevant information obtaining to the product. Each individual piece of
information — such as product name or SKU Number is called a field (Barrows,
Simpson, Young, 2007).
A single database can contain many tables. A hardware stores database
might contain tables for products, vendors, and customers. Much more complex

9
databases might contain tens or hundreds of tables that are all interlinked (Barrows,
Simpson, Young, 2007).
Queries
Queries are the objects that extract information from the database. A query
selects and defines a particular group of records that fulfill a certain requirement or
condition. Queries have the ability to combine data from tables then filter, sort, or
display desired information. Queries are also often used when changing, adding,
and deleting records is desired (Groh, 2010).
“Queries are the primary mechanism for retrieving information from a
database and consist of questions presented to the database in a predefined format.
Many database management systems use the Structured Query Language (SQL)
standard query format.” (Chapple, 2011)
Forms
A form is a standard database object that displays information from one or
more tables on the computer screen. Forms provide Access users an easy way to
enter data. They are especially useful when the users want to enter data into
multiple tables all at once. Form provide users with many capabilities; for example,
users can
• Edit records
• Enter new records
• Format table’s information layout
• Specify order in which information appears
• Group items together
10
• Use pull-‐down lists to sort or edit information
Forms can be a great way to interact with the database without having to
work on the inside with coding and designing of the database (Barrows, Simpson,
Young, 2007).
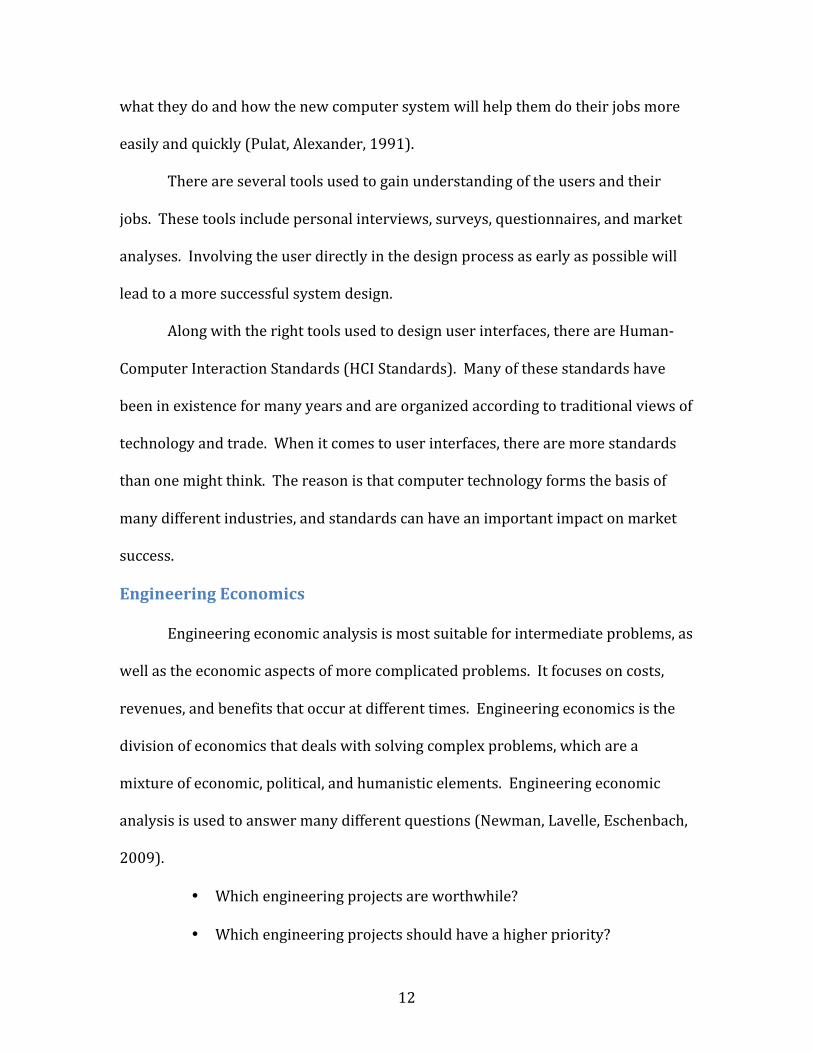
Reports
Reports give users the capability to present data in a printed format. Access
supports several different types of reports and has many built-‐in layouts for design
reports. A report may list all records in a given table or they may combine with
queries to filter data and display only defined records.
Reports often combine several tables to present complex relationships among
different sets of data. Access also has the capability to present information in
reports in graphs or tables to better display the desired data (Groh, 2010).
Macros
When designing Microsoft Access databases, users can use a combination or
two separate programming languages, macros and visual basic. Macros are built in
programs that automate commands given to them. Macros can be created within
Access to automate several commands within the database. Macros are often linked
with forms to create commands upon request. Users don’t have to be a programmer
to create and use macros. Access helps you write them by providing drop-‐down
menus of commands (Barrows, Simpson, Young, 2007).
Human Factors Engineering
Ergonomics is the study of the interaction between people and machines and
the factors that affect the interaction. The purpose of ergonomics is to improve the

11
performance of systems by improving human machine interaction. One main way
systems can be improved is by designing the user interface to make it more
compatible with the task and the user. This makes it easier to use and more
resistant to errors (Bridger, 2009).
The user interface consists of input devices, output devices, the information
input by users, and the information output by the computer. Programmers, system
analysts, user interface specialists, or even the users can design user interfaces, but
most are designed and developed by computer programmers and system designers.
A study suggests that programmers, with limited or no training and experience in
user interface design, make as many as 90 percent of the user interface decisions
(Bailey, 1996).
Often, computer-‐based system designers are experts in the hardware and
software aspects, but know little about the capabilities, limitations, skills, tasks, and
needs of the end users. This results in systems that fail to adequately support the
users’ tasks, and require more effort and training to learn than users or their
employees are willing to invest in. These types of systems and programs may place
new demands on users, making tasks more difficult and time consuming than easier
and more efficient (Pulat, Alexander, 1991).
Designing a useful and useable computer system involves people with skill
and experience in user interface design. User interface experts are usually human
factors engineers or industrial engineers who specialize in this field. To design a
useful and useable interface requires knowledge of the end users. This includes
12
what they do and how the new computer system will help them do their jobs more
easily and quickly (Pulat, Alexander, 1991).
There are several tools used to gain understanding of the users and their
jobs. These tools include personal interviews, surveys, questionnaires, and market
analyses. Involving the user directly in the design process as early as possible will
lead to a more successful system design.
Along with the right tools used to design user interfaces, there are Human-‐
Computer Interaction Standards (HCI Standards). Many of these standards have
been in existence for many years and are organized according to traditional views of
technology and trade. When it comes to user interfaces, there are more standards
than one might think. The reason is that computer technology forms the basis of
many different industries, and standards can have an important impact on market
success.
Engineering Economics
Engineering economic analysis is most suitable for intermediate problems, as
well as the economic aspects of more complicated problems. It focuses on costs,
revenues, and benefits that occur at different times. Engineering economics is the
division of economics that deals with solving complex problems, which are a
mixture of economic, political, and humanistic elements. Engineering economic
analysis is used to answer many different questions (Newman, Lavelle, Eschenbach,
2009).
• Which engineering projects are worthwhile?
• Which engineering projects should have a higher priority?

13
• How should a specific engineering project be designed?
• How to achieve long-‐term financial goals?
• How to compare different ways to finance projects?
• How to make short and long-‐term investment decisions?
Before beginning analyzing costs of a project, one must differentiate between
fixed expenses and variable expenses (or costs). Fixed expenses are those costs that
are independent of change in volume. Variable expenses are those expenses that
increase or decrease proportionally with increases or decreases in volume (Riggs,
2004). This project aims to reduce the average cost by ultimately seeking out the
lowest possible variable cost while still meeting the customer’s demand.
In this project there are three aspects of engineering economic analysis that
will be analyzed. These include payback period, rate of return, and net present
value.
Payback period is simply the period of time required for profit or other
benefits from an investment to equal the cost of the investment. Some definitions
consider depreciation of the investment, interest, and income taxes (Newman,
Lavelle, Eschenbach, 2009).
Rate of return analysis is the most commonly used analysis technique in
industry. There are sometimes problems that occur when computing the rate of
return, but its major advantage is that it is a single figure of merit that is readily
understood. There is another big advantage to rate of return analysis. Selecting an
interest rate for present worth and annual cash flow calculations may be difficult. In
rate of return analysis, no interest rate is needed to compute the calculations.

14
Instead, an internal rate of return is calculated from the cash flow (Newman, Lavelle,
Eschenbach, 2009).
To calculate a rate of return on investment, one must convert the various
consequences of the investment into a cash flow. From there, the cash flow is solved
for the unknown value of the internal rate of return.
Net present value is the difference between the present value of cash inflows
and the present value of cash outflows. It analyzes the profitability of an investment
or project. NPV analysis is sometimes sensitive to the reliability of future cash
inflows that an investment or project will yield.
Net present value compares the value of a dollar today to the value of that
same dollar in the future, taking inflation and returns into account. Using net
present value when deciding to do a project or not, if the NPV is positive, the project
should most likely be accepted. However, if the NPV is negative, the project should
be denied because this means the cash flows will also be negative (Net Present
Value (NPV) Definition, 2011)
Summary
The three subjects discussed in the literature review were incorporated
throughout the project’s design and implementation. In order to give readers the
proper background knowledge of the subjects, many hours of research was
conducted.

15
Design
The design chapter of the report will cover the project’s requirements,
purpose, current process, and deciding factors that arose during the design stages of
the project. It will touch on method’s and computer programs considered and the
reasons for final decisions.
Requirements
CVS Pharmacy’s Patterson, California Distribution Center is looking for a
more efficient way to audit product totes that are shipped out daily. The
distribution center must be able to audit a certain percentage of totes shipped out
daily and calculate an error percentage. Additionally, management would like to be
able to track error percentages for all products
as well as employees that are picking and
packing the totes. This will allow them to
determine any quality issues within the picking
isles or any problems with employees.
Auditing Purpose
The distribution center is required to
audit between 4 and 5% of the totes that are shipped out daily. CVS has adopted a
replenishment process called split-‐case picking. This means that as products are
purchased from stores, the exact product and quantity is replenished the very next
day. Ideally, totes are sent to stores daily with 100% accuracy. With anywhere from
2,500 to 4,000 totes being shipped out daily, 100 to 200 of these totes must be
audited for incorrect items or inaccurate quantities. An error percentage is
Figure 1: Totes Used for Picking

16
calculated for upper management and corporate to analyze and take action if
necessary.
This percentage is calculated for many purposes. The main reason is to give
each store some leniency. The distribution center’s monthly error percentage
becomes each stores monthly error percentage. All stores are given the same error
percentage when it comes to product shortage. This method was implemented after
management realized having each store manager audit the totes as they came in was
too time consuming. Each store is allowed the same monthly error percentage.
Anything greater leads to the belief that the store may have theft or other issues.
Current Process
The current process being used is very repetitive and not very time efficient.
It requires a lot of manual work and travel and could be vastly improved. The
workday is broken down into two shifts, daytime and graveyard. Each shift has two
isle managers and anywhere from 50 to 100 pickers. Each isle managers is required
to audit twenty-‐five to fifty totes per shift. The current process takes between three
and five minutes per tote. Therefore, each isle manager is spending between one
and two hours of their shift auditing. Time studies of the original process can be
found in Appendix A.
The steps of the current auditing process is as follows:
1. Select 3-‐5 totes off the line to audit
2. Write down tote identification numbers
3. Travel to the managers office (50-‐500 feet depending on location)
4. Enter container id numbers into CVS website
17
5. Print pick lists
6. Walk back to the location where the totes were selected from
7. Manually audit each tote
8. Walk back to the office
9. Manually enter data into a Microsoft Excel spreadsheet
10. Calculate desired accuracy statistics and percentages
The Excel workbook used in steps 9 and 10 is where upper management can
view error percentages. Although the workbook is thorough and gives management
necessary data, the process of obtaining this data is extremely slow and inefficient.
To determine desired percentages, sorting and calculations must be done.
The isle managers repeat this tedious process several times per day. There
are other important tasks that the managers must take care of throughout the day.
Analyzing of the entire process, including data entry and calculations, was done to
help finalize a more efficient method for each step. If the process time of auditing
totes was reduced, the isle managers will have time to work on other important
tasks.
Microsoft Access vs. Microsoft Excel
When brainstorming a way to improve this process, Microsoft Access or
Microsoft Excel seemed like good options. There were many reasons these two
programs were considered but the most important was that CVS already had the
software for each. Therefore, no extra computer software expenses would be
necessary to design the new process.

18
When deciding between the two programs, features that each software
package was capable of providing were considered. The main benefit of using
Microsoft Excel was that the isle managers and upper management were already
very familiar with the program and the current workbook could be built on with the
addition of some VBA code. They had been using the program with the previous
auditing method and it is an easier program to use and understand. The major
drawback of using Excel is that it lacks the ability to store and link data tables like
Access. Therefore printing reports and pick-‐lists, auditing, and entering the data
would still be a manual process.
Microsoft Access is a much more sophisticated software and has the ability to
form relationships between data tables. This would prove to be a key factor in
deciding between the two programs. Microsoft Access also has the capability of
importing and linking tables from the Internet, other Access databases, and
Microsoft Excel files. This made transferring data from the current workbook and
the CVS website very easy. The main drawback of using Access is its ease of use.
Many people are not familiar with Access and have never used it. Also, any future
problems would require the right person to fix or debug the database.
Upon analysis of the pros and cons of Access and Excel, my manager, Marilou
Felstead, and I decided that with my knowledge of Microsoft Access and its great
capabilities, we should use it. Therefore, Microsoft Access was decided upon and I
could begin designing the new tote auditing database and process.

19
UPC Scanner
In order to make the tote auditing process more time efficient, a new method
was necessary. This new method needed to be some form of auditing that would
allow the isle managers to verify and count the products faster, reduce travel time
and paper wasted on printing, and develop a method to more efficiently enter and
track the data.
The first step was to brainstorm ideas that
would be easy enough to implement and teach the
isle managers to use very quickly. It would have to
mimic the current process pretty precisely. Several
different options were considered but the usage of
a UPC scanner proved to be the best.
UPC scanners are fairly easy to use and are
commonly used in warehouse environments.
Tennis Warehouse uses UPC scanners to ship, pick,
and audit products. Their company wide database
allows employees to scan products to find
locations, ship them out, or enter them into the system.
This seemed like a great idea for the CVS auditing process. If the isle
managers were able to scan the items in the totes and the database could produce
an error rate and let them know which items were extra or missing, the process
could be done much faster than their current process. The next step involved
Figure 2: Symbol 2208 UPC Scanner
20
writing and designing a Microsoft Access Database that implemented this feature to
allow faster auditing times.
Database Design
Designing a database with a short learning curve was the main focus.
Throughout the process, many different designs were tested and revised. The main
method of finalizing the database came from feedback from the end users. Each isle
manager was given a new design and asked to test it and provide feedback about
what they liked and disliked. From here, changes were made to accommodate their
feedback.
Constraints
Since Microsoft Access is the program of choice, and CVS already has Access
on their computers, purchase of new computer software was not necessary.
Another constraint was implementing CVS’ company-‐wide website information into
the database. The information from the website that needed to be put into the
database included; product descriptions, SKU’s and UPC number’s, and employee
information. Also, every time a new tote was audited, the pick-‐list containing the
products and their quantities, the store information, and the picker’s information
needed to be transferred into the database to accurately calculate error rates and
other relevant data.
Economic Analysis
In order to determine how much money a new auditing process would save
the distribution center, an estimated current cost was necessary. Determining how
much money was wasted on time and paper alone was outrageous. Each isle

21
manager’s hourly wage is $22. With the results from time studies of the original
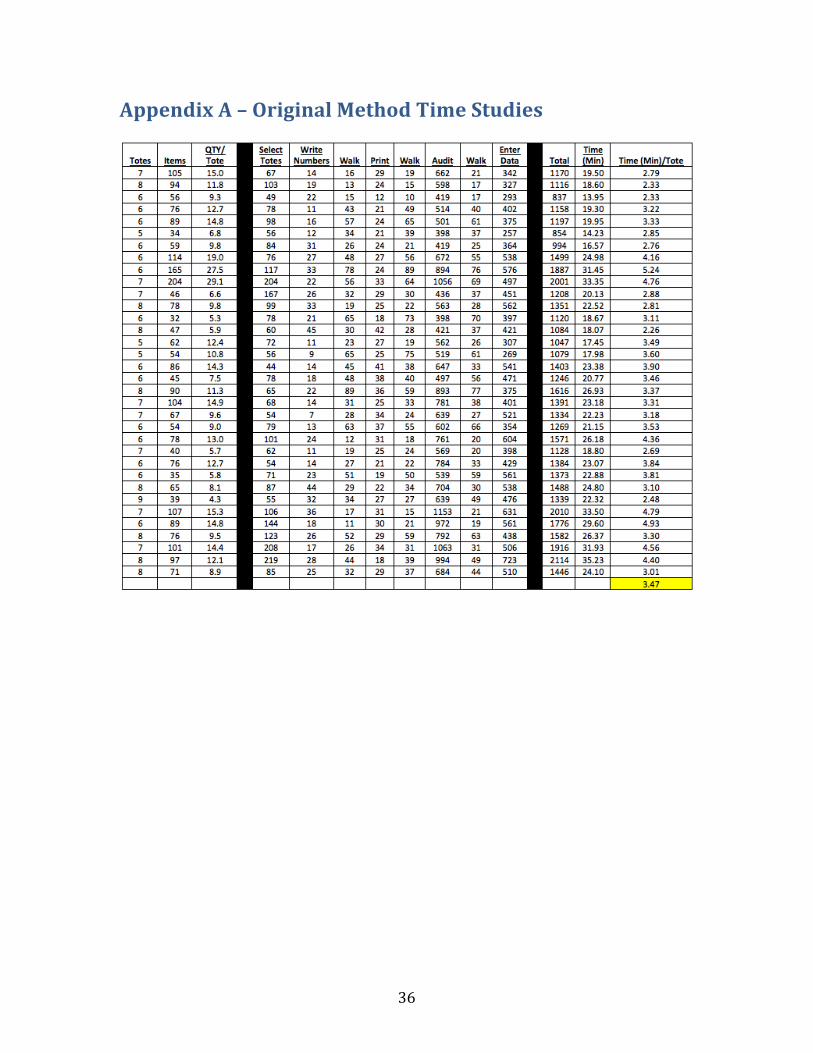
process, it was determined that it took on average 3.47 minutes to audit one tote.
With each isle manager auditing 25-‐50 totes per day and working 250 days per year,
each would audit between 6,250 and 12,500 totes per year. With this average time,
each isle manager would spend roughly 360 to 720 hours per year auditing. At their
hourly wage, this would cost CVS roughly $32,000-‐$64,000 per year.
Each tote audit requires the printing of one page. With today’s cost of paper,
this could cost $350-‐$700 per year. The current process is costing CVS
approximately $32,350-‐$64,700 per year. A table of payback calculations can be
found in Appendix C.
Additionally, a net present value analysis was conducted to determine if
investing in the new process and database was a good decision. Finally, a return on
investment was calculated to finalize the amount of money gained or lost by the
investment.
Summary
The greatest challenge when designing the new tote auditing process was
determining what was relevant to the project. Microsoft Access allows users a wide
variety of options when designing a database. Constant communication with the
end users, isle managers and upper front office management was key in determining
exactly what the database needed to feature.

22
Methods
In order to know exactly how the current method worked, auditing a few
totes seemed necessary. This experience provided information about the longest
steps of the current process. The most tedious part of the process was manually
defining products and counting them. For example, one or two large bottles of wine
are easy to define and count but fifty to one hundred slightly different toothbrushes
can become confusing. When a tote contains many similar products, manually
counting and defining them can lead to errors. Eliminating this part would not only
decrease time, it would decrease the amount of human error.
Database Design
In order to test the database, many versions were given to the isle managers.
No explanation was given except for the user manual that was written for each
design. The features of each version were the same but the interface layout and how
certain functions worked varied. The isle managers were told to test the different
versions and provide feedback with what one was easiest to use. Also, input from
them on what features of each design they liked and disliked would prove the help
in the design of the final database.
Many meetings with the isle managers and upper management were
conducted to determine which features would best suit the company. Once the final
design was complete, the isle managers were given a copy of the database to test.
Any input they had was taken into consideration and subtle changes were made to
finalize the program.

23
The ultimate goal when creating the final design was to have it as simple as
possible. This would ensure the time to audit would be minimized as much as
possible and it would be very easy to use for anyone. One of the main goals was to
design a database with a very small learning curve. This way if new isle managers
are hired or upper management decides to have other positions conduct the audits,
these employees will be able to learn how to use to database very quickly.
Human Factors Engineering
Ease of use was the main concern for upper management. Since none of the
isle managers had ever used Microsoft Access, the learning curve needed to be very
simple. Many versions of the database were released for testing by each of the isle
managers. When they were comfortable with using the current version, feedback
was a key asset. Each manager was able to provide information on what he or she
liked and disliked most about the version. From there, additions, removal, or
adjustments to that particular feature were made.
This process was used about ten times until the exact features, colors, and
button layouts were easiest to use for them were known. Although no statistical
analysis was conducted, the end product is suitable for all end users.
Economic Analysis
The economic analysis was fairly simple for the process and database. First,
to determine the payback period, hourly rates of the isle managers were defined.
Then time spent by each isle manager auditing was calculated. Upon completion of
the new database, time studies were conducted. The time differences were
calculated. The amount of time per year that would be saved was then calculated.

24
With the isle managers’ hourly rate, the total time saved per year, and the cost of
designing and implementing the database, payback period and approximately how
much time and money would be saved yearly was calculated. Simple calculations in
Microsoft Excel were used to determine the return on investment and net present
value.

25
Results
This chapter discusses and shows the final database design, the final auditing
process, and the final economic analysis.
Database
The final database design incorporates all user defined requests and
requirements. The main auditing menu allows users to import the desired pick list
into the database from CVS’ website. From there, users can select a particular tote
to audit. A screen shot of the main form can be seen below.
Figure 3: Main Auditing Form

26
The purpose of the main form is to eliminate the steps of manually printing
out pick lists. With the elimination of this step, time, travel distance, and paper are
saved. The UPC scanner also eliminates having to identify each product via its
description or UPC number. The scanner also reduces human error as it eliminates
the step of counting each product. In Figure 4, below, one can see that the database
has the ability to automatically count and update the audit percentage and accuracy
rate as products are scanned in.
Figure 4: Main Form with Imported Pick List
27
This form allows the user to see all products that were requested. As the
user scans in product UPC’s, the “Qty” of the particular product is updated. All boxes
at the bottom of the form are also updated with each scan.
“Billed SKU’s” is the number of different products that were billed to this
particular tote. “Billed Unit Qty” is the number of items billed to the tote. “Picked
SKU’s” is the number of different products that have been scanned into the system.
“Picked Qty” is the total number of scans thus far. “Error Rate” is a simple
calculation of (Items Short + Items Over + Mispicks)/Billed SKU’s. Likewise the
“Accuracy” Rate is 100% minus the Error Rate. “Short,” “Over,” and “Mispicks” are
all directly related to too many or few products or products that are not billed to the
particular tote.
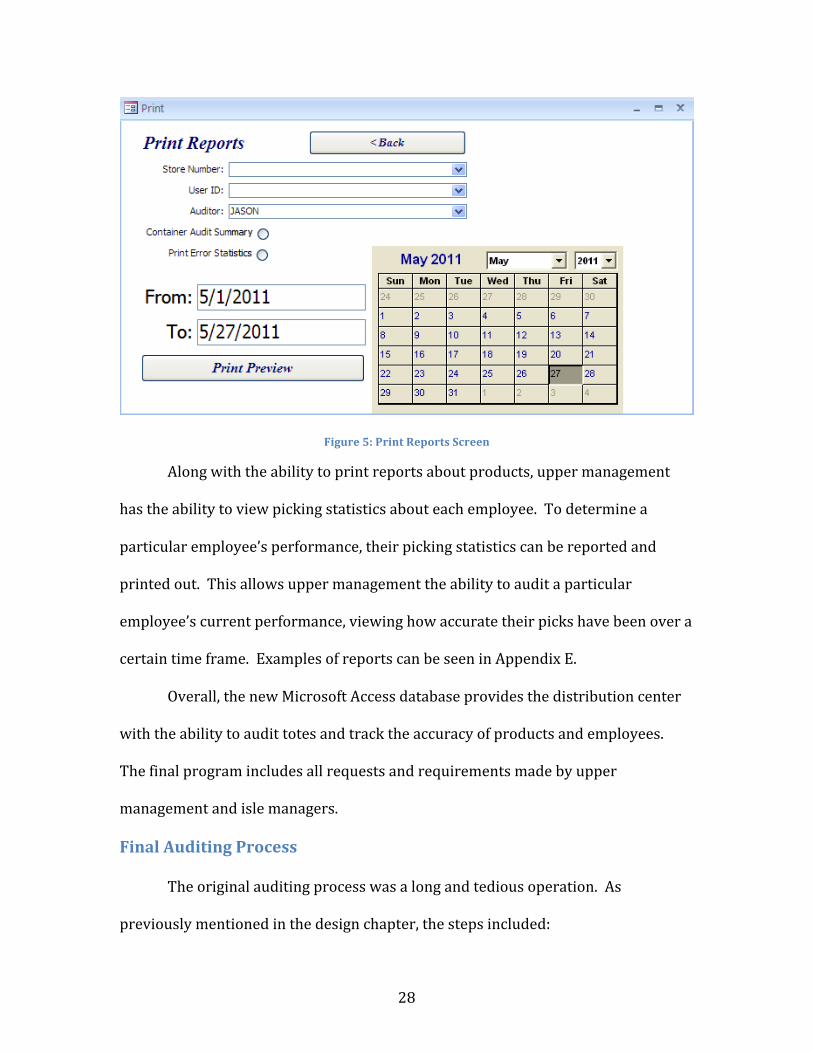
Another main function of the database is its ability to report out information.
This section was requested and helped designed by industrial engineer, Marilou
Felstead. The main purpose of this section is to view accuracy statistics. Users may
select any date range and the database will produce reports with information on
picking accuracy, products most frequently incorrectly picked, employees most
frequently making errors, and much more. Figure 5 shows the main screen to
perform printing options.
28
Figure 5: Print Reports Screen
Along with the ability to print reports about products, upper management
has the ability to view picking statistics about each employee. To determine a
particular employee’s performance, their picking statistics can be reported and
printed out. This allows upper management the ability to audit a particular
employee’s current performance, viewing how accurate their picks have been over a
certain time frame. Examples of reports can be seen in Appendix E.
Overall, the new Microsoft Access database provides the distribution center
with the ability to audit totes and track the accuracy of products and employees.
The final program includes all requests and requirements made by upper
management and isle managers.
Final Auditing Process
The original auditing process was a long and tedious operation. As
previously mentioned in the design chapter, the steps included:

29
1. Select 3-‐5 totes off the line to audit
2. Write down tote identification numbers
3. Travel to the managers office (50-‐500 feet depending on location)
4. Enter container id numbers into CVS website
5. Print pick lists
6. Walk back to the location where the totes were selected from
7. Manually audit each tote
8. Walk back to the office
9. Manually enter data into a Microsoft Excel spreadsheet
With the implementation of the new database and process, steps 2, 3, 5, 6, and 8, are
eliminated. The UPC scanner reads each product’s information, reducing the time of
step 9 significantly. The new process is much faster and efficient, cutting down
average auditing time from 3.47 to 1.70 minutes, for a total of 1.77 minutes/tote
saved. To see time studies of the original and old process refer to Appendices A and
B.
The new process steps include:
1. Select a tote to audit
2. Open the Microsoft Access Database
3. Enter the container ID into the database
4. Import pick list corresponding to that container ID
5. Scan all products included in the tote
6. Remove excess items and/or pick missing items

30
The new process is much faster and easier to use. The two tables below show a
comparison of the time improvements per tote for each step.
Table 1: Average time per step (Original Method)
Step Ave. Time/Tote
(Min) Select Totes 0.23
Write Numbers 0.05 Walk 0.09 Print 0.07 Walk 0.10 Audit 1.66 Walk 0.10
Enter Data 1.13
Table 2: Average time per step (New Method)
Step Ave. Time/Tote
(Min) Select Tote 0.21
Enter Info into Database 0.40 Scan Items 0.91 Print Report 0.17
When talking with the isle managers who audit on a daily basis, they
mentioned that the new process saved them an hour or so each day. Along with the
database, an instruction manual was created for future users. The instruction
manual includes where to locate the database on the CVS server, how to import
information, how to use the database, and the different features in reporting that the
database offers. A copy of this user manual can be seen in Appendix D.

31
Economic Analysis
Payback period was the first economic calculation. The database took
roughly 150 total hours to design, write, test, and implement. At an hourly rate of
$18, the entire process cost CVS $2,700. With a calculated savings of $16,575 to
$33,150 per year ($66 -‐ $132 / day), depending on number of totes audited in a
particular year, the payback period was calculated to be between 20 and 42 days.
For such savings, this investment was very small and yielded a very quick payback
period. All payback period calculations can be seen in Appendix C.
Net present value is calculated to determine if going through with a
particular project is a good idea. When calculating net present value, one must use a
constant interest rate. When forecasting the net present value for this project, three
different interest rates were considered. Over a five-‐year period, calculations with
interest rates of 5%, 7%, and 10% were calculated. With a 5% interest rate, the net
present value was calculated to be between $70,000 and $140,000. At a 7% interest
rate, $65,000 – $133,000 was the calculated NPV. Finally, using the highest interest
rate of 10%, the NPV was $60,000 -‐ $123,000. As one can see, when calculating the
NPV with any of the three interest rates, the project has a very high NPV. This
means that the project is good and should be implemented.
Return on investment provides a payback percentage over a particular time
period. For this project, a return on investment was calculated over the next five
years. Depending on the amount of totes that are audited each year, the return on
investment was calculated to be between 600% and 1200%. This is a great ROI,

32
showing that with the small investment of $2,700, CVS will profit greatly over the
next five years.

33
Conclusion
The main purpose of this project was to design a more efficient auditing
process that implemented a computer based program to replace the existing
process of auditing totes at CVS Pharmacy’s Patterson, California Distribution
Center. The issue with the existing process was its length and inefficiency. There
was an extensive amount of travel time wasted during the process. Traveling from
the auditing location to the office occurred four times. This process was taking up
about a quarter of an isle manager’s shift, 2 hours/day. The new process takes
between 45 minutes and an hour and a half to audit the desired amount of totes.
The objectives of this project, to design and implement a new tote auditing
process for CVS, were met and exceeded. The feedback from upper management
and the isle managers was what made this possible. This was a good experience as
it directly reflected what a customer relationship would be like.
A great deal of experience was gained through this project. My knowledge of
Microsoft Access was increased substantially. The database has been fully
incorporated into daily operations at CVS’s Patterson location. They have been
using the process and program problem free for about 9 months now. Talking with
upper management occasionally, they are very happy with its functions, results, and
time it has saved them.

34
Bibliography Bailey, Robert W. Human Performance Engineering: Designing High Quality,
Professional User Interfaces for Computer Products, Applications, and Systems.
3rd ed. Upper Saddle River, NJ: Prentice Hall PTR, 1996. Print.
Bridger, R. S. Introduction to Ergonomics. 3rd ed. Boca Raton: Taylor & Francis
Group, LLC, 2009. Print.
Chapple, Mike. "Query Definition." About Databases: Microsoft Access, SQL Server,
Oracle and More! 2011. Web. 1 May 2011.
<http://databases.about.com/cs/administration/g/query.htm>.
"Database Management System." Webopedia: Online Computer Dictionary for
Computer and Internet Terms and Definitions. Web. 1 May 2011.
<http://www.webopedia.com/TERM/D/database_management_system_DB
MS.html>.
Frye, Curtis D. Access 2010 Plain & Simple. O'Reilly Media, 2010. Print.
Groh, Michael. Access 2010 Bible. Indianapolis, IN: Wiley, 2010. Print.
"Net Present Value (NPV) Definition." Investopedia.com -‐ Your Source For Investing
Education. 2011. Web. 3 May 2011.
<http://www.investopedia.com/terms/n/npv.asp>.
Newnan, Donald G., Ted Eschenbach, and Jerome P. Lavelle. Engineering Economic
Analysis. 10th ed. New York: Oxford UP, 2009. Print.
Pulat, Babur Mustafa. Industrial Ergonomics: Case Studies. Vol. 1. Norcross, GA:
Industrial Engineering and Management, 1991. Print.

35
Riggs, Henry E. Financial & Economic Analysis for Engineering and Technology
Management. 2nd ed. Vol. 1. New Jersey: John Wiley & Sons, 2004. Print.
Simpson, Alan, Marguret Young, and Alison Barrows. Access 2007 for Dummies.
Indianapolis, IN: Wiley, 2007. Print.
36
Appendix A – Original Method Time Studies

37
Appendix B – Proposed Method Time Studies

38
Appendix C – Economic Analysis Calculations
39
Appendix D – Database User Manual
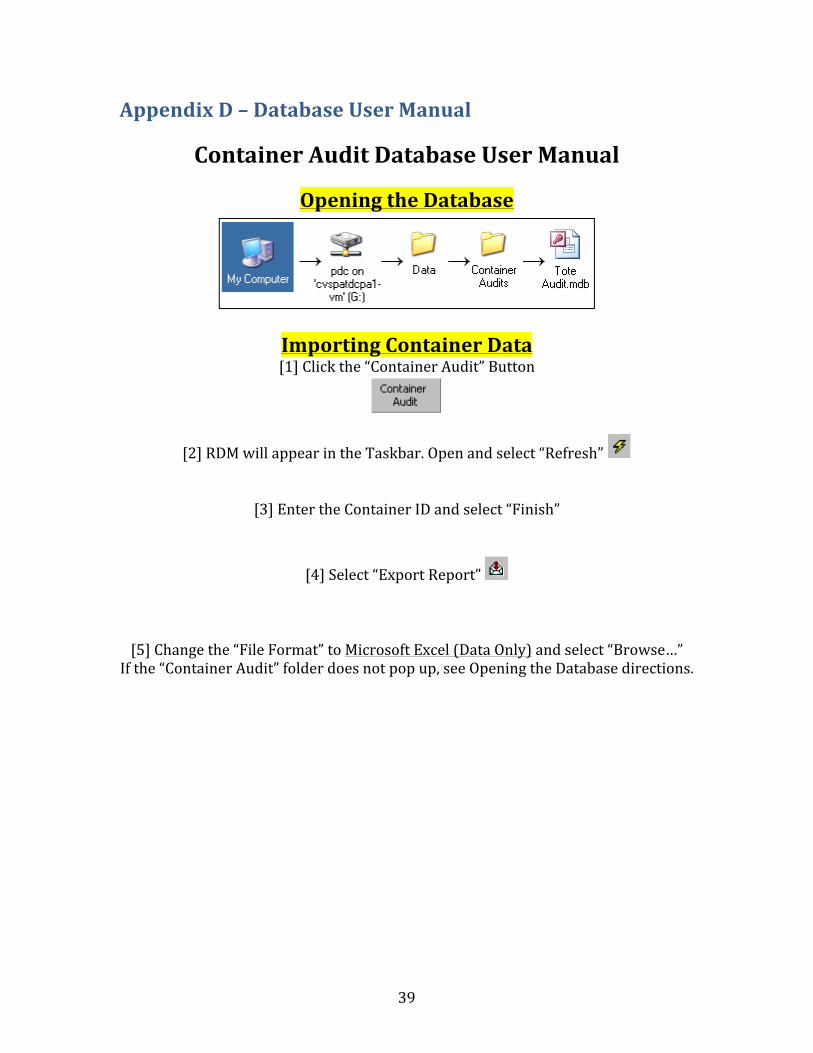
Container Audit Database User Manual
Opening the Database
Importing Container Data [1] Click the “Container Audit” Button
[2] RDM will appear in the Taskbar. Open and select “Refresh”
[3] Enter the Container ID and select “Finish”
[4] Select “Export Report”
[5] Change the “File Format” to Microsoft Excel (Data Only) and select “Browse…” If the “Container Audit” folder does not pop up, see Opening the Database directions.
40
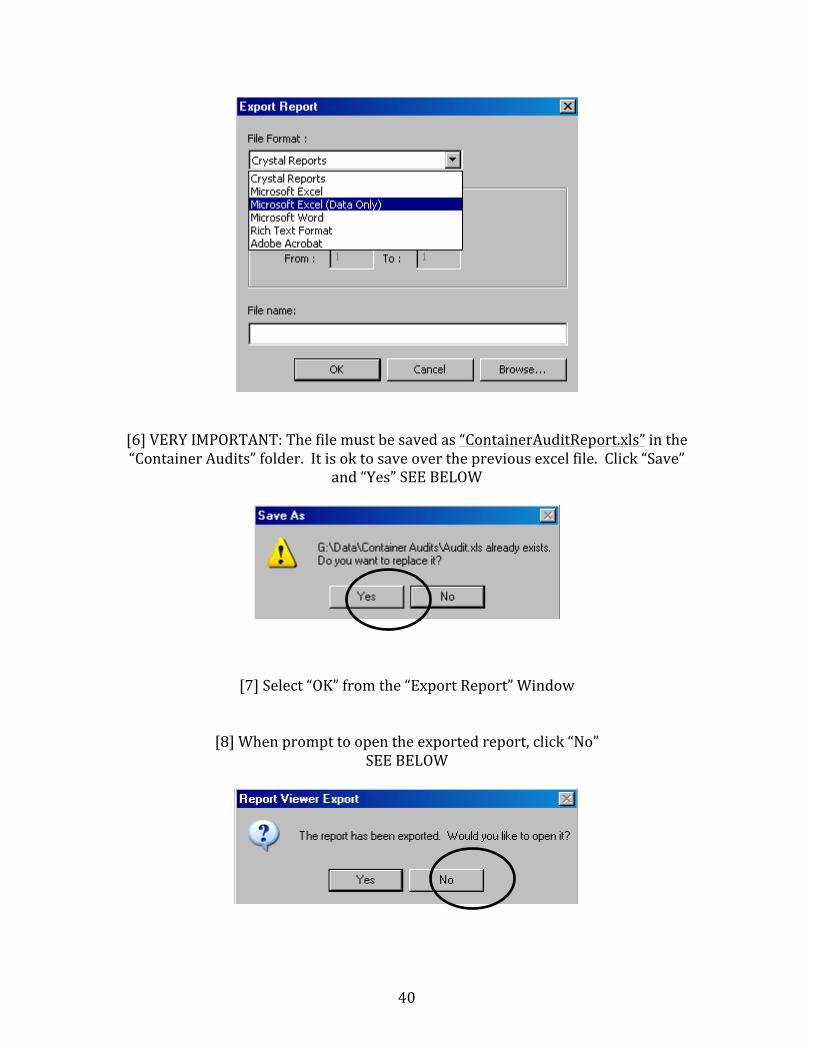
[6] VERY IMPORTANT: The file must be saved as “ContainerAuditReport.xls” in the “Container Audits” folder. It is ok to save over the previous excel file. Click “Save”
and “Yes” SEE BELOW
[7] Select “OK” from the “Export Report” Window
[8] When prompt to open the exported report, click “No” SEE BELOW

41
[9] Close Crystal Report Viewer and go back to the database. Click “Pallet / Tote
Audit”
[10] RDM will appear in the Taskbar. Open and select “Refresh”
[11] Enter the Container ID and select “Finish”
[12] Select “Export Report”
[13] VERY IMPORTANT: Change the “File Format” to Microsoft Excel and select “Browse…”
If the “Container Audit” folder does not pop up, see Opening the Database directions.
[14] VERY IMPORTANT: The file must be saved as “PalletToteAuditReport.xls” in the “Container Audits” folder. It is ok to save over the previous excel file. Click “Save”
and “Yes” SEE BELOW

42
[15] Select “OK” from the “Export Report” Window
[16] When prompt to open the exported report, click “No”
SEE BELOW
[17] Close Crystal Report Viewer and go back to the database. Click the “Import
Button”
[18] The Container ID should be viewable on the dropdown menu. Select the correct
ID and proceed to auditing.
Auditing Process
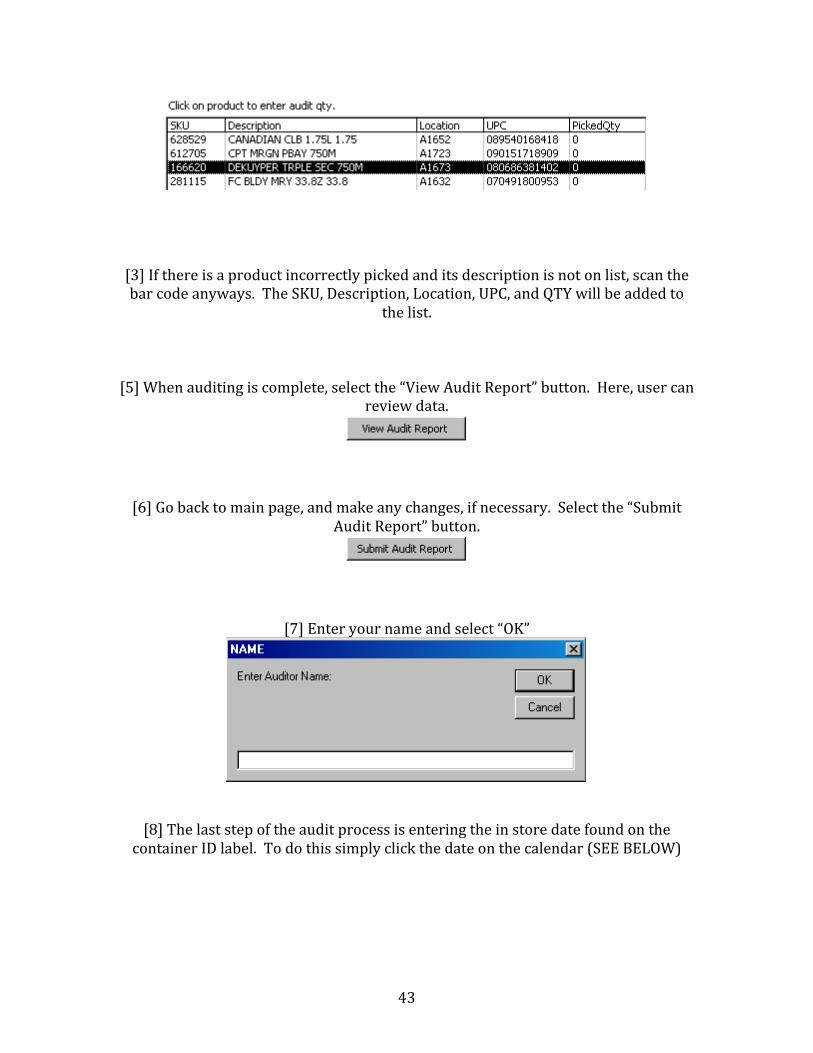
[1] Scan Product Bar Codes (PickedQty will automatically update as you go):
43
[3] If there is a product incorrectly picked and its description is not on list, scan the bar code anyways. The SKU, Description, Location, UPC, and QTY will be added to
the list. [5] When auditing is complete, select the “View Audit Report” button. Here, user can
review data.
[6] Go back to main page, and make any changes, if necessary. Select the “Submit Audit Report” button.
[7] Enter your name and select “OK”
[8] The last step of the audit process is entering the in store date found on the container ID label. To do this simply click the date on the calendar (SEE BELOW)

44
[9] Select “OK” Button. Audit report has been submitted.
[10] Print Report and close “Print Preview” page.
Audit is complete. Information should clear and you can begin another.
Printing Reports
To access the print page, select the “Print a Report” button on the bottom right corner of the main form.

45
SEE ABOVE FORM 1. To print a report by store, select the “Store Number” drop-‐down list.
2. To print a report by USER (Picker), select the “User ID” drop-‐down list.
3. To print a report by Auditor, select the “Auditor” drop down-‐list.
4. To print an overall summary, select the “Container Audit Summary” option
circle
5. To print an error report, select the “Print Error Statistics” option circle.
After selection has been made, a calendar will be visible (SEE BELOW)
Select the date duration you would like to print data from.

46
Click the “Print Preview” button or press “Enter” on the keyboard to view a Print Preview of you selected data and date range.
Once the Print Preview has appeared, select the “Print” button on the top left corner to print.
Other Options Include: Selecting File → Print
Pressing Ctrl and P on the keyboard
Saving Data
To save the data, in print preview select the “Analyze it with Microsoft Excel” or “Publish it with Microsoft Word” buttons at the top of the screen (SEE BELOW).
The report will be saved to your desktop and automatically open.

47
Appendix E – Report Examples