a customer .. based quality of .. service...
TRANSCRIPT

NRR197-05
A CUSTOMER .. BASED QUALITY ... OF .. SERVICE APPROACH FOR REGULATING WATER UTILITIES
Raymond W. Lawton, Ph.D. Associate Director
The National Regulatory R~search Institute The Ohio State University
1080 Carmack Road Columbus, Ohio 43210-1002
(614) 292-9404 www.nrri.ohio-state.edu
January 1997
This report was prepared by The National Regulatory Research Institute (NRRI) with funding provided by participating member commissions of the National Association of Regulatory Utility Commissioners (NARUC). The views and opinions of the author do not necessarily state or reflect the views, opinions, or policies of the NRRI, NARUC, or NARUC member commissions.


NRR/97-05
EXECUTIVE SUMMARY
The regulatory system provides a number of direct and indirect incentives to
jurisdictional water utilities that are designed to produce desired outcomes that support
important regulatory or social goals. State commissions have devoted a large portion of
their oversight efforts to developing and enforcing quality-of-service standards in order
to ensure that all customers receive pure water. Commissioners and their staff,
however, have often worried
Do the official service quality standards reflect the true preferences of a
utility's customers?
Are individual complaints received in hearings, or through 800 number
consumer complaint lines, representative of all customers?
Are commission surveillance and reporting procedures sufficient to detect
quality-of-service problems?
This report presents a method--a quality-of-service telephone survey--that can
be used to develop customer-based service quality standards. The survey approach
allows commissioners and their staffs to identify the preferences of customers, track
the representativeness of complaints, and to independently monitor compliance in a
cost-efficient manner.
This report uses several surveys conducted by state commissions, investor
owned water utilities, and municipal water utilities to demonstrate the usefulness of the
survey approach.
A CUSTOMER-BASED QUALITY-OF-SERVICE ApPROACH FOR REGULATING WATER UTILITIES- iii


NRR/97-05
TABLE OF CONTENTS
Chapter Page
1 DIFFERENT QUALITY-OF-SERVICE APPROACHES ................ 1 Introduction ............................................ " 1 Authoritative Approaches . . . . . . . . . . . . . . . . . . . . . . . . . . . . . . . . . .. 2 Market Approaches ................ ,"',.,................ 3 Customer-Based Quality-of-Service Approach ................. " 4
2 SOME RECENT STATE COMMISSION EXPERIENCE WITH SURVEYS ............................................ 11
Introduction. . . . . . . . . . . . . . . . . . . . . . . . . . . . . . . . . . . . . . . . . . . .. 11 Arizona ................................................ 12 Alaska ................................................. 12 Wisconsin . . . . . . . . . . . . . . . . . . . . . . . . . . . . . . . . . . . . . . . . . . . . .. 14
Madison Water Utility and Madison Sewer Utility Billing Survey. 14 Madison Water Utility and Madison Sewer Utility Customer
Satisfaction Survey. . . . . . . . . . . . . . . . . . . . . . . . . . . . . . . .. 16 Green Bay Water Utility Customer Satisfaction Survey ....... 18
New Hampshire ......................................... 20 Consumers Water Company Survey ..................... 20 New Hampshire Public Utilities Commission Interlakes Survey . 24 New Hampshire Public Utilities Commission Hampton
Water Works Survey ............................... 26 Schanda Farms Survey ............................... 26
Nevada ................................................ 28 South Carolina .......................................... 28
Blue Ribbon Survey .................................. 28 Pennsylvania ........................................... 29
Pennsylvania Public Utility Commission Survey . . . . . . . . . . . .. 29 Chilton Water Customer Satisfaction Measurement Survey ... 30
3 SERVICE QUALITY BENCHMARK SURVEY ...................... 31 Survey Results as Inputs .................................. 31 Survey-Driven Incentive Regulation ........................ " 33 Conclusion ............................................. 35
A CUSTOMER-BASED QUALITY-OF-SERVICE ApPROACH FOR REGULATING WATER UTILITIES - V

NRR/97-05
LIST OF TABLES
2-1 Results of Anchorage Water and Wastewater 1993 Survey ........... 13
2-2 Billing Frequency Preferences .................................. 15
2-3 Billing Frequency Preference by Age of Respondent . . . . . . . . . . . . . . . .. 18
2-4 Survey Used for Each Customer Type . . . . . . . . . . . . . . . . . . . . . . . . . . .. 19
2-5 Changes in Customer Perceptions of How Quickly Utility Resolves Problems . . . . . . . . . . . . . . . . . . . . . . . . . . . . . . . . . . . . .. 22
2-6 Programs Initialed by Utility to Address Concerns Found in 1993 and 1995 Surveys ., . . . . . . . . . . . . . . . . . . . . . . . . . . . . . . . . . . . .. 24
2-7 A Six-State Comparison of Satisfaction Scores from 1993 to 1995 . . . . .. 25
2-8 Summary of Major Results from Schanda Farms Survey. . . . . . . . . . . . .. 27
vi - A CUSTOMER-BASED QUALITY-OF-SERVICE ApPROACH FOR REGULA T1NG WATER UTILITIES

NRR/97-05
ACKNOWLEDGMENTS
Todd Simpson of the NRRI staff contacted all state regulatory commissions and
obtained the basic survey data. His assistance and insights are appreciated and
significantly improved the usefulness of the report. I especially wish to thank Linda
Schmidt, who typed the report and prepared the tables with her usual cheerful
competence. John Borrows and Dr. Douglas Jones reviewed the report and provided
helpful comments.
A CUSTOMER-BASED QUALITY-OF-SERVICE ApPROACH FOR REGULA TING WATER UTILITIES - vii


NRRI 97-05 - CHAPTER 1
1
The regulatory environment in a state provides a complex set of direct and
indirect incentives that in varying ways influence the structure, conduct, and
performance of the investor-owned water utility sector. Pricing policies, cost recovery
mechanisms, and environmental regulations all influence how investor-owned water
utilities are able to deliver water to their customers. Traditionally, one important way
that state regulatory commissions sought to affect utility behavior was through the use
of commission-mandated quality-of-service (OOS) standards. 1 While there is a
tendency to think of OOS standards as exclusively technical in nature, somewhat
overwhelming, and perhaps even arcane, in actuality these standards can have as
much impact on utility operation as price or environmental regulation.
This chapter briefly examines two different approaches to service quality and
advances a customer-based OOS approach that can be used effectively by state
commissions. Armed with the information produced by the customer-based approach,
state commissions can design specific aos incentives for its jurisdictional water
utilities.
1 See Vivian Witkind Davis, Larry Blank, David Landsbergen, Nancy Zearfoss, Raymond W. Lawton, and John Hoag, Telecommunications SelVice Quality (Columbus, Ohio: The National Regulatory Research Institute, March 1996); Raymond W. Lawton, "Water Quality-of-Service Survey Approach" in Biennial Regulatory Information Conference Proceedings, Volume III (Columbus, Ohio: The National Regulatory Research Institute, 1996); and Raymond W. Lawton, "Network Utilization Principles and Pricing Strategies for Network Reliability" in Quality and Reliability of Telecommunications Infrastructure, ed. William Lehr (Mahwah, NJ: Lawrence Erlbaum Associates, 1995).
A CUSTOMER-BASED QUALITY-OF-SERVICE ApPROACH FOR REGULA TING WA TER UTILITIES - 1

NRR/97-05- CHAPTER 1
One way
Standards are <::HTI=r-,-n,=
is on the standards concept.
have some to
the standard. Otherwise, as it ignored,
absent any enforcement mechanism. In the approaches briefly identified below the
commission, water utility industry, individual water utility, and the customer are
all examined as n ..... 'E'l"llnie. sources
The traditional approach to
standard setting is to have a formal, Because governrnental agencies and commissions can compel compliance, they have often been seen as the most expedient way to institute standards.
entity establish and enforce
standards. Because governmental
agencies and commissions can compel
compliance, they have often been seen as the most expedient way to institute
standards. State commissions, because they are regulatory agencies charged by their
state legislatures (or state constitution) to advance state goals, have had little difficulty
in becoming a standard-setting body. They can and have established QOS standards
and required utiiities to follow the
In addition to
the water utility industry has
as an authoritative source
water utilities
The water utility industry has functioned as an authoritative source of water QOS
a reasons.
that it is n:::,.::-,nr, ..
2 - A CUSTOMER-BASED QUALITY-OF-SERV/CE ApPROACH FOR REGULA TING WA TER UTILITIES
in
drinking
voluntarily to water
enforcement """"'D'''''''Il'''IOIII'I"\
NRR/97-05- CHAPTER 1
customers is
standards, even
individual utility, if it is enough, can establish standards that can prevail
In this situation exists only for the water holding
companies and certain large municipal utilities that, because of their size, can enforce
standards through the strength of their purchasing power. Generally, the large water
utilities follow industry with only rnarginal differences.
These distinctions aside, state commissions have relied heavily upon the aos standards developed the American Water Works Association, as well as standards
followed the National Association of Regulatory Utility Commissioners. Further, the
largest municipal and investor-owned utilities have not only followed industry aos standards, but also complied with the specific aos standards in force in each
state. common feature, however, is the authoritative way the standards have been
set; that is, the standard-setting body is widely recognized as legitimate,
and authoritative by all parties.
Market
Fairly or not, authoritative
approaches been criticized as being
"command-and-control" "top-down"
are
in
a
consumers
In a perfectly competitive market consumers effectively set QOS standards through their purchase choices.
with coming
for, or
'11",..,,,.,"",.... .... are available that can
do not
A CUSTOMER-BASED QUALITY-OF-SERVICE ApPROACH FOR REGULA TING WA TER UTILITIES - 3

NRRI 97-05 - CHAPTER 1
rely on "arbitrary" standards set by governmental agencies or industry bodies.
are disciplined or
are
various
with consumer
forces; firms only prosper when
However, less .......... ,,...,,...,"' ... the market, the likely is it that market forces alone
would be sufficient ensure that the quality of service desires of customers would be
met. To the extent that a monopoly exists in a given market, for example, the natural
incentive structure would be such that the monopoly could unilaterally decide; in the
absence of commission regulation, its own QOS standards. Only in markets with
multiple providers would unorganized customers have sufficient market power to
enforce their QOS preferences. However, for the foreseeable future, because of the
cost/price dynamics of the water sector and the apparent need for (and efficiencies
resulting from) centralized provisioning of water, it seems unlikely that a pure market
approach would be in the public interest.
-1:),1516!0I Quality-of-Service Standards Approach
Neither of the two approaches necessarily demonstrates an
overwhelmingly compelling or definitive way to establish the optimal set of QOS
standards appropriate for the water industry. It is proposed here that the key features
of both of these approaches can be recombined in a way that produces accurate and
The new approach uses survey research and expert opinion to develop quality-oF-service standards.
reliable information about the QOS needs
of residential and business customers.
This new approach uses survey research
and expert opinion develop QOS
a
that identified customer '''''',.". design a
demographics, customer characteristics, vU':JlUI experience, and
Using a scientifically a professional
4 - A CUSTOMER-BASED QUALITY-OF-SERVICE ApPROACH FOR REGULA TING WATER UTILITIES

NRRI 97-05 - CHAPTER 1
survey research firm, the commission would administer a aos survey.
upon the resources available, separate could be residential and
business customers.
Unfortunately, to date, state
commission experience with surveys has
generally been unsatisfactory. This has
largely been because the surveys came
To date state commission with surveys has generally been generally unsatisfactory.
from interested parties, thus causing the prudent reguiator to have iess confidence
about the survey results than would have otherwise been the case if the survey had
come from a more objective source. Further, when a commission is not involved in the
design of a survey, it increases the odds that the survey will not focus on key pieces of
information regulators feel they need to know in order make a decision.
By using a scientific surveying approach, a state commission can effectively
emulate many of the same processes that auditors follow, thus allowing regulators to
produce near audit-quality data about the OOS preferences of consumers. Audits have
achieved their widespread acceptance and legitimacy (in part) because of the
consensus the auditing profession has achieved regarding both "generally accepted
accounting practices" (GAAP) and the best methods to discover if these practices have
been followed. Two key steps in the audit process are deciding what kind of a sample
to use, and what questions (or standards) will be asked (or applied to) each item in
the sample. A scientifically conducted survey follows the same process focuses on
the representativeness of the sample and the questions to be asked of each survey
respondent. The key difference between the two is the high credibility given to audits
and low
standard
uses a survey determine uses a a the preferences and experiences
customers. of a utility's \JU .. JlLVI
A CUSTOMER-BASED QUALITY-OF-SERVICE ApPROACH FOR REGULATING WA TER UTILITIES - 5

NRRI 97-05 - CHAPTER 1
Data gathered in the OOS survey on
characteristics and 1"'1....,. • ."..,..., .........
preferences or For
have higher aos expectations than
growth rate will occur in the suburbs,
the inlrtl'"1I0«:,,'Ir rIIot"n .... l'"\rII
include customer characteristics
homeowners.
Expertise and judgement play an important
would necessarily
items sufficient identify
in selecting items
in the survey and in deciding what with OOS In'l· .... 'l'"i""I"'II .... 'I"ur\n gathered. the
example above, a commission is apparently making a distinction between suburban
and nonsuburban residential customers; standards are meant to applied
uniformly. It may be, however, that because the commission's water staff
inspection of utility expansion plans, that in five years suburban customers will grow
from 40 percent to 60 percent of the customer base, that the commission has VI ..................... ""
that the OOS preferences of suburban households will ones they should use as
a baseline in developing the aos standards that are applied to customers.
It could also be the case that a survey would that the water purity needs of
large industrial customers are greater than average purity needs for residential
customers. It would be a judgment call on part of commission determine
whether to go with higher standards "pull-up" residential
customers and increase the prices charged I or preferences
residential customers. In both these <C'>'V ..... ,.,..... ....... ,=,.,..
commission staff will necessary in
or
a
6 - A CUSTOMER-BASED QUA LlTY-OF-SER VICE ApPROACH FOR REGULA TING WA TER UTILITIES

NRR/97-05- CHAPTER 1
it is important to recognize a as one source
in
using this new source not commission
hearings, consumer complaint BOO-number lines, utility filings, engineering licensing
procedures, industry standards, and more than indicate
correct QOS standards should be?
These traditional sources of problems that can be
overcome by a scientifically conducted survey. The is that, however
articulate and forceful QOS preferences are, when received in a hearing, or from an
BOO-number, or a utility filing, the preferences are not necessarily representative of all
customers or a particular class of customers. professionally conducted survey can
reveal the preferences of residential or business customers within, say, plus or minus
(±) 3 percent. That is, it can be shown that there is a percent probability that the
responses in the survey accurately reflect the opinions of all of the utility's customers
within ± 3 percent.
Auditors rely on these same
sampling principles when examining the
financial records of a firm or agency.
Auditors know it is inefficient to examine
all of the financial transactions and
accounting records of a firm and have
that are all
regulatory this means
a scientifically drawn that it avoids the problem
in hearings, hot filings where the
most attention.
sampling 2 a
are important
a it
2 David Wirick, Raymond Lawton, Robert Burns, Information Risk in Emerging Utility Markets: The Role of Commission-Sponsored Audits Ohio: The National Research Institute, 1996).
A CUSTOMER-BASED QUALITY-OF-SERVICE ApPROACH FOR REGULA TING WA TER UTILITIES - 7

NRRI 97-05 - CHAPTER 1
problem frequently encountered in hearings, hot lines, and utility filings where the
loudest voices get the most attention. While it is reasonable to assume that some of
the loud voices are or indicators potential OOS problems, it can
never be known how representative the OOS complaints are.
One way to gain perspective on the representativeness problem is to go back to
the auditing approach. No firm has 100 percent of its financial transactions or
accounting records in absolutely perfect order or compliance. If auditors used a
nonsampiing approach (anaiogous to iistening to one compiaint) and focused on one
bad transaction, they could draw conclusions about a utility's entire financial system
that were not valid. Scientific sampling has proven successful for auditors (and in other
professions) and can be equally successful in obtaining representative OOS data from
a water utility's customers.
The other problem that a aos survey approach can help overcome is the
relative inability of commission or industry aos standards to certify that the standards
definitely represent the wishes of consumers. The overwhelming majority of modern
quality improvement literature has a good deal of unsubstantiated rhetoric about the
need to get away from authoritative standards set by governmental agencies, or
industry, and instead to rely upon customer preferences. The "quality-improvement"
critique says the authoritative bodies move too slowly! impose "yesterdays" standards,
and incorporate institutional constraints (such as the reliance on evidentiary hearings)
that mute, hide, or distort consumer quality preferences.
Rhetoric aside, this critique does By using a QOS survey a commission can certify that QOS standards not seem entirely fair or descriptive of the
reflect the wishes of consumers. processes, procedures, or intent
..... nr"1l"'i!i"I"HC"c·nnl"'\C" or the industry in their
(and one here) is that
using a
that its
(or an industry standard-setting body) can certify
wishes consumers.
8 - A CUSTOMER-BASED QUALITY-OF-SERVICE ApPROACH FOR REGULA TlNG WA TER UTILITIES

There will always be a layer of
expert judgment, applied to the aos survey data as "data do not speak for
themselves." For instance, a survey
NRR/97-05- CHAPTER 1
A QOS survey can serve as quantitative input to a commission's standard-setting process.
might indicate dissatisfaction with cloudy water, but this piece of information would be
insufficient as a quantitative standard could not be directly derived. Equally, there may
be standards that are transparent to consumers--say the need to file a capacity
expansion plan. ,11, aos survey can only serJe as quantitative input to a commission's
standard-setting process. Commission water experts then can analyze the aos survey
data in terms of professional standards, their experience, and other available
information. The improvement in the process is that the commission has direct access
to scientifically reliable and representative information about the aos needs of
customers.
A CUSTOMER-BASED QUALITY-OF-SERVICE ApPROACH FOR REGULA TING WA TER UTILITIES - 9


CHAPTER 2
SOME RECENT STATE COMMISSION EXPERIENCE WITH SURVEYS
Introduction
NRRI 97-05 - CHAPTER 2
State commissions have conducted and received surveys on various aspects of
water utility regulation and operation. The National Association of Water Companies
(NAWC) has, for example, periodically conducted surveys of its member companies'
customers and has shared this information with state commissions, federal agencies,
its member companies, water industry's professional associations, consultants, and
researchers. The NAWC surveys have been particularly well received and have
focused on consumer expectations and preferences.
In winter 1996, NRRI researchers contacted all state commissions that regulate
water utilities and asked them to submit any surveys conducted by or received by the
commissions. This chapter briefly analyzes the information received from the
perspective of showing commission familiarity with surveys. As appropriate, each
survey is examined in terms of its suitability as a scientific aos survey. Since these
surveys were not intended to be formal aos surveys, the critique is only intended to
educate the reader about some of the characteristics of a scientifically valid aos survey.
A CUSTOMER-BASED QUALITY-OF-SERVICE ApPROACH FOR REGULA TING WA TER UTILITIES - 11

NRRI 97-05 - CHAPTER 2
The Willow Valley Water Company sent out a focused survey its customers in
spring of 1995. It was a one-page survey focusing on whether magnesium contaminant
levels had visibly changed as a result of a new sequestering technique. 71.9 percent of
the respondents reported no improvement. The survey was mailed to 999 customers,
with 18.6 percent responding. This information supplemented data from water
sampling conducted by commission staff. This survey focused on one OOS item and
was mailed to its customers. One problem with this type of survey is that it is often
difficult to know how representative a mail survey is, even when mailed to all
customers, because the most educated, higher income, and most concerned
households tend to complete and mail in surveys more than other types of households.
Alaska
The Anchorage Water and Wastewater Utility administered a one-page survey of
its customers in 1993. Of the 40,016 customers surveyed, 21.4 percent of the survey
questionnaires were returned. The six-question survey covered customer
characteristics, experience, and satisfaction. As can be seen in Table , 98.4 percent
feel they always or usually have good water service. 92.1 percent felt their water
pressure to be adequate. Interestingly, when asked if their water is cloudy or
discolored, 64.3 percent said, "never." 85.6 percent of the 2,352 responding to the
question indicated that they had had a personal contact with utility personnel in the past
year, with 78.8 percent reporting prompt action on their request.
This survey has a limitation due to the response rate, which is on the low side
mail surveys. A survey sent to a scientifically selected sample costly as
only 1,000 questionnaires might need to be mailed.
Customer satisfaction questions can be difficult to interpret.
12 - A CUSTOMER-BASED QUALITY-OF-SERVICE ApPROACH FOR REGULA TING WA TER UTILITIES

NRR/97-05- CHAPTER 2
Count Percent Total Res onse
1. What kind of service do you have? Water only 203 2.4 Sewer only 550 6.4 Both 7820 91.2 8573
2. Do you think you have good water service? Always 5600 69.9 Usually 2285 28.5 Never 128 1.6 8013
3. How is your water pressure? Too high 65 .8 Too low 572 7.1 Adequate 7427 92.1 8064
4. Is your water cloudy or discolored? Always 88 1.1 Usually 158 2.0 Occasionally 2591 32.6 Never 5117 64.3 7954
5. If you had personal contact with A'MNU personnel during the past year, were you treated courteously and professionally by our utility personnel? 2014 85.6
Yes 117 5.0 No 221 9.4 2352 Not sure
Did you receive prompt action on your 1702 78.8 request? 190 8.8
Yes 269 12.4 2161 No Not sure
6. Do you fee! the water sewer rates are reasonable for the service you receive?
Yes 3584 44.5 No 2211 27.5 Not sure 2251 28.0 8045
Source: Anchorage Water and Wastewater Utility Survey, 1993.
A CUSTOMER-BASED QUALITY-OF-SERVICE ApPROACH FOR REGULATING WA TER UTILITIES - 13

NRR/97-05 - CHAPTER 2
While overall satisfaction in this survey is 98.4 percent, somewhat lower numbers report
positive experience with water pressure (92.1 percent), or with the cloudy or discolored
water (64.3 percent). Mail surveys typically have a response pattern that may influence
the interpretation of the survey. Response patterns are important because of the
issues raised by having a representative or nonrepresentative sample. Because
demographic questions such as sex, age, race, size of household, neighborhood, or
income were not asked, it is not possible to objectively determine how representative
the sample of returned questionnaires VJas of the 40,016 customers surJeyed.
Reporting the number of responses for each question is important and one
hallmark of a well-done survey. The Anchorage survey reports responses by each
question, something that aids in the interpretation, for example, of the "personal
contact" question.
The Anchorage questionnaire allowed respondents to make additional
comments. Two thousand, six hundred and ninety-two made some kind of written
comment.
Wisconsin
Three water quality surveys were received by the Wisconsin Public Service
Commission: two for the City of Madison, and one from the Green Bay Water
Department.
Madison Water Utility and Madison Sewer Utility Billing Survey
In the summer of 1995, Madison's water and sewer utilities developed a
customer "preference of billing frequency" questionnaire, following the Wisconsin Public
Service Commission's Order in Docket No. 3280-WR-103 (point No.4). The five
question survey was sent to a random sample of 1,100 residential and business
customers. The response rate was 72 percent, which is good for a mailed survey.
14 - A CUSTOMER-BASED QUALITY-OF-SERVICE ApPROACH FOR REGULA TING WA TER UTILITIES
NRR/97-05- CHAPTER 2
As noted above, it is important to know how representative your survey sample is of all
utility customers. In addition to asking customer-demographic questions that can
subsequently be checked, say, against census data or utility records, the first step is to
have the survey questionnaire sent to a randomly selected group of customers. A
computer-generated random sample, as was done in Madison, is the best way to
ensure that a representative sample has been drawn. In the Madison survey, statistical
techniques indicate a 95 percent probability that the responses accurately reflect the
population of utility customers within ± 4 percent. This rate is very good and means that
95 times out of a hundred survey answers given will be within ± 4 percent of the
answers the entire population of utility customers would have given.
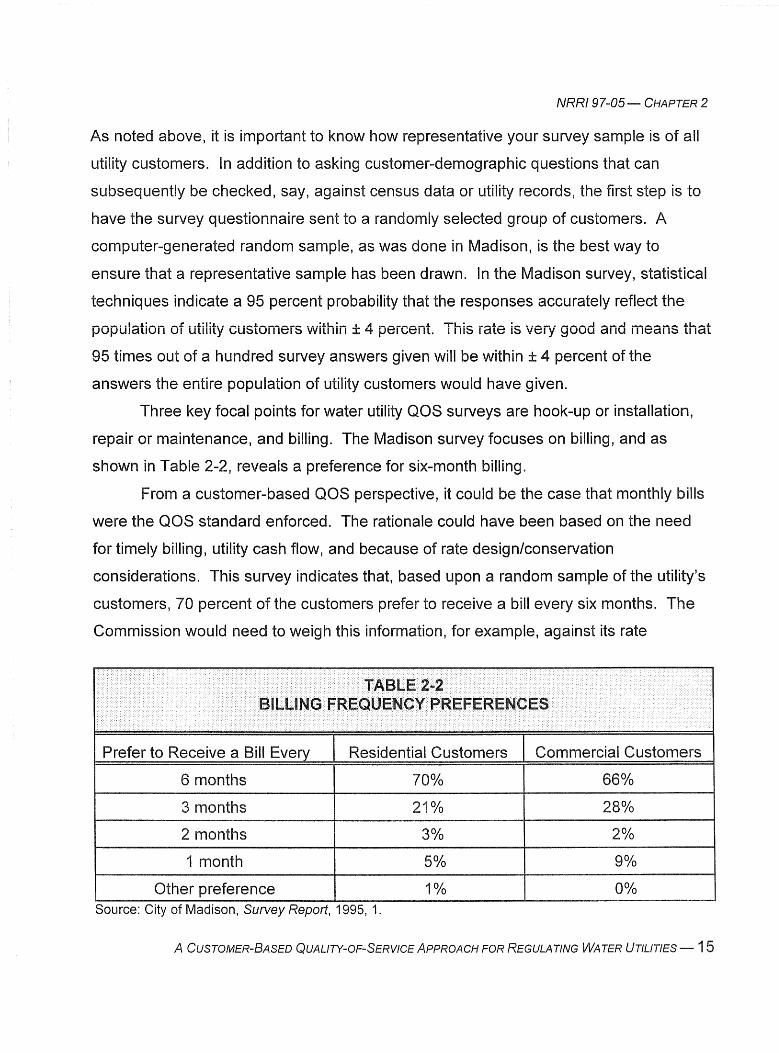
Three key focal points for water utility QOS surveys are hook-up or installation,
repair or maintenance, and billing. The Madison survey focuses on billing, and as
shown in Table 2-2, reveals a preference for six-month billing.
From a customer-based QOS perspective, it could be the case that monthly bills
were the QOS standard enforced. The rationale could have been based on the need
for timely billing, utility cash flow, and because of rate design/conservation
considerations. This survey indicates that, based upon a random sample of the utility's
customers, 70 percent of the customers prefer to receive a bill every six months. The
Commission would need to weigh this information, for example, against its rate
Prefer to Receive a Bill Eve Residential Customers Commercial Customers
6 months
3 months 210/0
2 months
1 month
Other preference Source: City of Madison, Survey Report, 1995, 1.
A CUSTOMER-BASED QUALITY-OF-SERVICE ApPROACH FOR REGULA TING WA TER UTILITIES - 15

NRR/97-05- CHAPTER 2
design objectives. If the utility had a winter and summer rate, each being six months
long, then the six-month billing cycle could be adopted as the new aDS billing
standard. If, on the other hand, the utility had a poor cash flow, then the six-month
cycle might not be preferred.
This survey also allowed for respondents to make written comments. A
complete set of the responses was provided by the City of Madison in its analysis.
Written, or "open-ended," comments give the analyst a good feel for the richness and
complexity of the issues being examined, but typically resist easy categorization or
quantitative analysis.
Madison Water Utility and Madison Sewer Utility Customer Satisfaction Survey
In 1995 the City of Madison mailed a 3D-question survey to a random sample of
its customers in order to determine overall levels of customer satisfaction. The
response rate was 63 percent, indicating both a well-designed survey and a high level
of consumer interest in the subject. The survey had ten water and sewer questions,
eight water-only, six sewer-only, and six customer demographic questions. Some
findings included3
• 98 percent thought utility's employees courteous, knowledgeable (95 percent), and that the work was well done (95 percent).
• 87 percent found the billing statement easy to read, 79 percent preferred billing every six months, and 84 percent said they never used the rate insert to calculate the accuracy of their bill.
• 28 percent reported sewer backups, one fourth of these occurring in the previous year.
• 86 percent of those who used city services, as opposed to private contractors to resolve sewer backup problems, were satisfied with the work.
3 City of Madison, Quality and Improvement Project Report, 1995, 1-2.
16 - A CUSTOMER-BASED Q UALITY-OF-SER VICE ApPROACH FOR REGULA TING WA TER UTILITIES

In the first Madison
I n the second satisfaction
billing. Based on this
The City felt, based
switch to a six-month billing
commissions may want to
demographic group. In the
tabulated with the age of
uniformity across age groups,
the 55 or older age group.
special attention to the
month bill is the size of
that senior citizens support
Alternately, a commission
billing, the constraints of
the utility, a change to a
4 Ibid., 2.
A CUSTOMER-BASED
it
i'-"Yy' .... was
NRRI 97-05- CHAPTER 2
billing.
....... " .................. information to
some
were cross
results indicate
six-month billing being in
a six
citizens, finding
information.
delinquencies, levelized
financial impact on
ApPROACH FOR REGULA TlNG WATER UTILITIES - 17

NRR/97-05- CHAPTER 2
Billing Age Preference Res onse 55 or over
Every Month 4 6 4 4
EVery Tvvo '1 '1 -1 ') tt:. tt:. I &..
Months
Every Three 14 14 18 7 Months
Every Six 79 78 77 87 Months
No Answer 1 Source: City of Madison, Quality and Improvement Project Report, 1995.
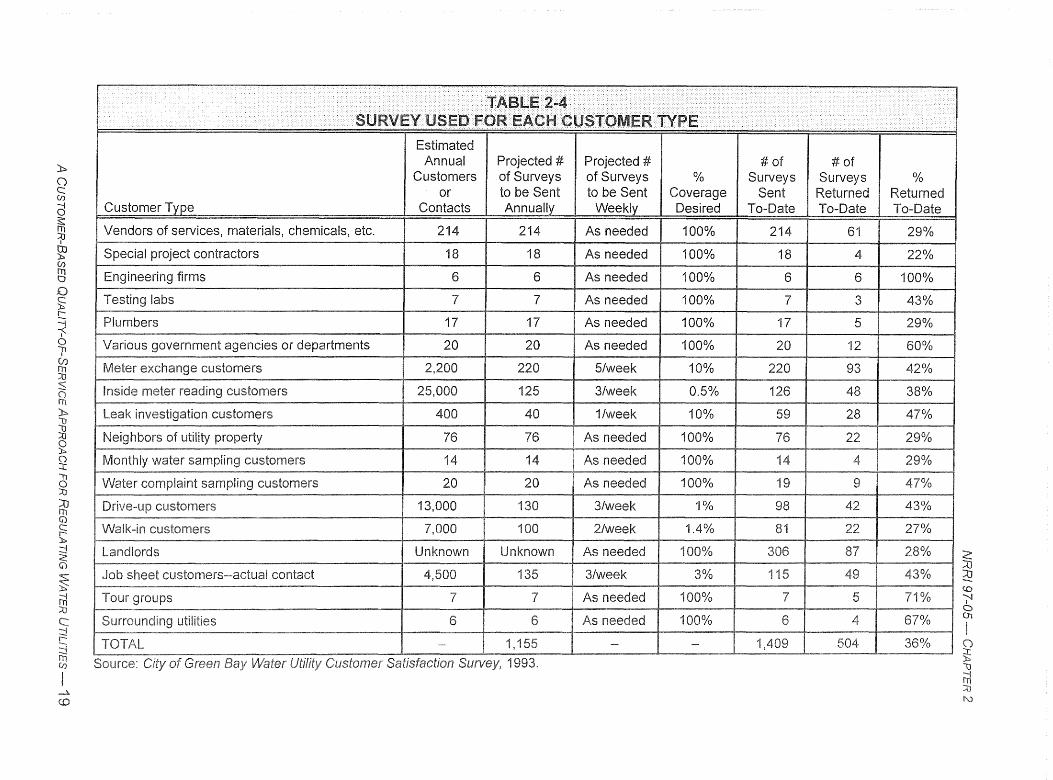
Green Bay Water Utility Customer Satisfaction Survey
In 1995 the City of Green Bay divided its customers into 18 specific types and
designed questionnaires appropriate to each type of customer. Four of these
questionnaires were available for the NRRI survey. The 18 customer types are shown
below in Table 2-4 and reflect the "upstream-downstream" customer satisfaction
concept extensively relied upon in contemporary service quality literature. The
underlying notion is that customers or stakeholders are not one undifferentiated mass
and that a utility has several types customers that it deals with at different points in
the production, distribution,
customer
its relationships with more
Also it recognizes that the utility is a
that are as important as
residential and business customers.
18 - A CUSTOMER-BASED QUALITY-OF-SERVICE ApPROACH FOR REGULA TING WA TER UTILITIES
)::,.
() c: (J)
(j ~ :tJ
~ (J) 111 tJ
D § r-==i ~ o l1 (f.) 111 :tJ :s o 111 )::,. lJ lJ :tJ §2 o :r.: 11 o :u ::0 III G) c: r):,.
:j <: G)
~ ni ::0 c:: :j r-:3 III (J)
I ->-
...... . ....... ...... .. ......... •.•• . .•.• . .••••..•...•••••••••.••••.••... >. TAB 11 :>?
-~ :~I"'"I» .. ~ su.." ..... ~:. ':':':':·::::;':·2 ~.kr.1 ! 6IJStQ~" .. ~~tYPE ....... 'KV mYlIpl:...l.Il-,.)R· . . .....
Estimated Annual Projected # Projected #
Customers of Surveys of Surveys % or to be Sent to be Sent Coverage
Customer Type Contacts Annually Weekly Desired
Vendors of services, materials, chemicals, etc. 214 214 As needed 100%
Special project contractors 18 18 As needed 100%
Engineering firms 6 6 As needed 100%
labs 7 7 As needed 100%
Plumbers 17 17 As needed 100%
Various government agencies or departments 20 20 As needed 100%
Meter t::}\\ .. ,,j Idll~t:: customers 2,200 220 5/week 10%
Inside meter reading customers 25,000 125 3/week 0.5%
leak illv ...., i customers 400 40 1/week 10%
1\at::1~IlIJU!::::' of jJl UjJt":lly 76 76 As needed 100%
water sampling customers 14 14 As needed 100%
Water t.;UllljJldl Ipi Ig customers 20 20 As needed 100%
customers 13,000 130 3/week 1%
Walk-in customers 7,000 100 2/week 1.4% - -landlords Unknown Unknown As needed 100%
Job sheet customers--actual contact 135 3/week 3% -,--Tour groups 7 7 As needed 100%
-Ig utilities 6 As needed 100%
.. -
TOTAL - 1,155 - -~
. ..... ..
••••••
# of # of Surveys Surveys
Sent Returned To-Date To-Date
214 61
18 4
6 6
7 3
17 5
20 12
220 93
126 48
59 28
76 22
14 4
19
98 42
81 22
306 87
115 49
7 5
6
1, 504
. ..
% Returned To-Date
29%
22%
100%
43%
29%
60%
42%
38%
47%
29%
29%
47%
43%
27%
28%
43%
71%
67%
36%
2: :::0 ~ (,Q
'";'J a (.,"1
I ()
~ lJ
ni ::0 I'\J

NRRI 97-05 - CHAPTER 2
1
areas
is
resources are
ambitious may not be sustainable unless
available. Said another way, it is likely to be
analyze results, and use information for
IJV,,;; ...... v when crises, staff turnovers, and normal workload interfere.
to receive attention of analysts and decision
more statistically valid than this approach.
questionnaires examined exhibited some variety, the core
customer's recent experience with the utility and their relative
main advantage of the Green Bay approach is that
the survey/analysis/decision-making processes
it can provide a unique "real-time" source of information on customer
quality being provided.
New Hampshire
Consumers Water Company Survey
1 1995 Consumers Water Company hired a survey research firm to
report was provided to the New Hampshire Public Service
and includes data from Consumer's service territories in New Hampshire,
Jersey, Illinois, and Maine. This data set allows comparisons
Hampshire and states, (2) specific service territories in
the the state, (3) changes in the 1993
made and
against
extent one survey
TOl"'t·D'Y' .... I·roc- within a state, or over time,
had in However, data need
- A CUSTOMER-BASED QUA LfTY-OF-SER VICE ApPROACH FOR REGULA TING WA TER UTILITIES

NRRI97-05- CHAPTER 2
be analyzed carefully when comparing service
with naturally crystal clear water scores higher in V ...... .P~'VI
that is rich in magnesium and iron deposits.
The Consumers survey was conducted a
It
While it is always tempting to conduct a survey using commission or
to save money, this approach has a lot of risk. These risks
one
a
questionnaire design, improper sampling procedures, analytical problems,
sometimes a lack of trust in the final product because it is seen as a
Additionally, it is difficult to keep staff on a
arise.
when other demands
A scientifically valid 20-minute telephone survey 1
service territory can be done for $35,000 to $50,000 (in 1996 dollars).
include design, preliminary analysis, and would provide the commission with a
A survey firm, like any other consulting firm a commission may hire, needs strong
guidance in order to ensure that the survey meets the decision-making
commission.
or
In the 1995 New Hampshire survey, frequency counts were presented
questions. In order to compare service territories, a percent change was calculated
all territories and New Hampshire (see Table 2-5). Between 1993 1995,
Hampshire as a whole had a 6.19 percent improvement in how quickly
perceived to be resolved. However, the range in individual
a 24.3 percent improvement to a 44.36 percent decrease. Comparative
pinpoint problem areas and give more meaning the data.
be easy to imagine one consultant arguing that
improvement is "outstanding," while an
Armed with the territory data, we can see a
New Hampshire's aggregate score shows a 1"'\'"',.'11",... ... than
speed problems are resolved.
are
from
A CUSTOMER-BASED QUALITY-OF-SERVICE ApPROACH FOR REGULA TING WA TER UTILITIES - 21

97-05- CHAPTER 2
1
7.06 5.68 24.30%
5.22
7.20
8.720/0
4.52 6.19%
6.00
6.38 -15.67%
8.31 -15.760/0
6.73 -20.36%
7.79 -27.60%
7.36 -36.01 %
8.38 -36.75%
7.71 -44.360/0 Source: Consumers Water Company, Consumers New Hampshire Water Company Docket No. OR 95-
Date November 15, 1 1.
- CUSTOMER-BASED QUALITY-OF-SERVICE ApPROACH FOR REGULA TING WA TER UTILITIES

NRRI 97-05 - CHAPTER 2
In response to a Commission data request, the Company identified five
programs that had been undertaken address problems found in the 1993 and 1995
surveys (see Table 2-6). Here, rather than have commission develop a QOS
standard, the company is being asked to specify it has taken. The Commission
still retains the option of taking further action if needed.
Table 2-7 has some interesting numbers for trend lines and in understanding
aos survey data. First, note that on average satisfaction declined (using only the top
satisfaction category) from 32.7 percent in 1993 to 30.5 percent. This suggests a trend
line that a commission would want to monitor. Second, note the 13 percentage point
increase in New Hampshire from 1993 to 1995 in the top category. Even with this
increase, this is the lowest score of all states and is 12 percentage points below the
average top-score percentage. Third, while a survey having 1,400 valid responses
probably has a ± 3 percent margin of error, this only refers to the entire sample. In New
Hampshire the 1 DO-person sample may have an error margin in excess of ± 30 percent,
making it extremely difficult to draw valid conclusions about preferences. The point of
these three observations is simply that a comparative survey produces a lot of valuable
aos information.
A CUSTOMER-BASED QUALITY-OF-SERVICE ApPROACH FOR REGULATING WATER UTILITIES - 23

NRR/97-05- CHAPTER 2
1,
2.
3.
4.
5.
KASET Customer Customer Skills intends to do refresher courses loose their Customer skills.
Total Quality Management IIJlf"r"it"'iIf"''::lIr'n
programs, Quality employees received at implementing Quality programs
Cross Company Quality Customer Information, Contacts, improve Customer
A Customer officials in which we nn'::::l.r"-::llitc
and concerns directly to the mechanism to interact directly serve them.
A 'oJ L.he:! Il L8 I
have received training in 1994 and 1995. The company
in 1996 so the employees do not
taught through two Advantage courses. All
It is believed that by ic'I'f'\i"n,Ci"C will be better served.
address such items as, Adjustments, Customers
these teams worked to worked on.
input from the NHPUC and Town is able to bring Customer input
Advisory Council provides a develop programs to better
a8\/81C)OE!O to communicate the water industry in
a more satisfied Customer. Source: Consumers Water Company, Consumers New '-/!:l,rnno:::rnr.o Water Company, Inc. Docket No. DR 95-124 Data Requests -1), November 15,1 1-2.
- A CUSTOMER-BASED QUALlTY-OF-SERVICE ApPROACH FOR REGULA TING WA TER UTILITIES

» o c: (I)
d ~ :0
~ (I)
~ D §; r-~ 1 o /1
~ s fri » :g :0
~ o ::t ." o ::0
~ G)
~ :::j ~ G)
~ ~ :0 c:: :::j 1-
:3 rn (I)
I
Satisfaction
Extremely satisfied
Extremely dissatisfied
Average
1995 1993
10 30.5% I 32.7%
9 I 9.2 12.9
8 I 21.5 22.3
7 I 10.1 9.9
6 i 6.0 3.9
5 I 11.5 9.7
4 I 3.1 2.2
3 I 2.5 2.0
2 I 1.8 1.4
0.9 1.0
o I 2.1 1.5
(unweighted) I 1,400 1,500
Ohio
1995 1993
33.1% 34.2%
10.3 13.2
23.0 25.8
10.8 7.9
3.8 3.6
9.9 9.0
2.5 2.1
2.8 1.9
1.9 0.7
0.4 0.5
1.0 0.8
400 500
Pennsylvania New Jersey
1995 1993 1995 1993
34.0% 38.4% 32.6% 36.5%
8.0 10.2 13.5 15.3
20.3 19.3 23.7 21.9
10.3 8.9 7.2 10.0
5.7 5.0 4.9 3.4
9.4 9.8 10.3 8.1
3.8 1.9 1.5 1.0
2.8 1.8 1.3 0.3
1.8 0.0 2.2 1.0
1.4 1.9 1.1 0.8
2.3 2.2 1.3 0.4
300 300 300 300
Illinois
1995 1993
26.3% 28.1%
6.0 14.4
20.7 19.5
9.3 11.5
10.3 3.1
15.1 10.6
3.7 3.0
2.3 3.8
1.3 2.5
1.0 0.7
2.7 1.5
200 200
- --
New Hampshire
1995 1993
18.0% 5.0%
13.0 6.0
19.0 16.0
14.0 16.0
5.0 6.0
16.0 20.0
5.0 7.0
3.0 1.0
1.0 6.0
4.0 3.0
2.0 14.0
100 100
Maine
1995 1993
24.0% 34.0%
7.0 10.0
17.0 28.0
13.0 13.0
7.0 5.0
14.0 7.0
5.0 0.0
3.0 0.0
2.0 2.0
0.0 1.0
8.0 0.0
100 100
Source: Consumers Water Company, Consumers New Hampshire Water Company, Inc. Docket No. DR 95-124 Data Requests (CA-1-1), November 15, 1995,3.
~ 3! <0 (I o 01
I o ?; "tl ~ :0 I\.)

NRRI 97-05 - CHAPTER 2
In
a
in
- A CUSTOMER-BASED
consumer awareness
a
determine
of the
sewer complaints.
randomly
concerns, overall
Hampshire Commission.
were given the choice of
can use
or mail.
submitted
were returned.
survey
or
a
quality
ApPROACH FOR REGULATING WA TER UTILITIES

NRRI 97-05 - CHAPTER 2
Number of Occurrences Within 12 Months Preceding Survey
0* 1-5** 6-10 11-20 > 20 Frequent! A B Numerous
Dirty water 5 20 13 6 6 3 91 53
Milky water 44 6 1 1 1 17 6
Laundry 26 20 3 4 51 13 staining
Bad taste 39 4 2 3 5 26 19
Bad odor 42 4 3 2 2 21 13
Low pressure 13 7 2 30 1 75 62
Water outages 14 36 3 74 6
Calls to 20 4 2 49 11 Company
* Includes no "unsure." ** Includes responses of "off and on," "yes," "too many."
- Percent respondents experiencing least one occurrence in previous 12 months. B- or occurrences in 12 months. Source: Schanda Farms Water DR-94-1 DWB-3.
A CUSTOMER-BASED QUALITY-OF-SERVICE ApPROACH FOR REGULA TING WA TER UTILITIES -

NRRI 97-05 - CHAPTER 2
Nevada
The Nevada Commission has developed a standard water quality questionnaire
that they use for small water utilities. Nevada Administration Code 704.627 says that
utilities applying for rate increases or when being reviewed periodically must be in
compliance with commission QOS standards. The ten-item questionnaire is designed
to be a cost-effective way to obtain direct information from customers regarding the
quality of the water they receive. The utility is required to provide the Commission with
mailing labels which the Commission then uses to mail the questionnaire to all
customers of the utility. The responses come directly to the Commission and are used
by staff in their analysis of compliance and/or a rate increase request.
This mode of decision-making, in effect, relies at least partially upon the direct
service quality experiences of customers. Demographic questions are not asked and
the responses are not necessarily representative of all of a utility's customers.
However, in the case of very small utilities having 100 or fewer customers, sampling
considerations may not ultimately be important.
South Carolina
Blue Ribbon Survey
In 1995 the Blue Ribbon Water Corporation surveyed Blue Ribbon Water
Company and Crest Water Company customers. The survey was mailed to 75
randomly selected Blue Ribbon and 25 Crest customers. Forty-three responses were
received; a respectable response rate. It was interesting to see that six respondents
said they had registered a complaint with the Company and five of these said they did
not receive an appropriate response to their complaint. The results of the survey were
submitted by Blue Ribbon to the Commission in Docket No. 93-836-W/S.
28 - A CUSTOMER-BASED QUALITY-OF-SERVICE ApPROACH FOR REGULA TING WATER UTILITIES

NRRI 97-05 - CHAPTER 2
80th Blue Ribbon and Crest serve a number of subdivisions. Because of the
small sample size and the random selection process, several subdivisions had either
one or no questionnaires sent. This means that while the 43 respondents may be
representative of all of Blue Ribbon or Crest customers, no valid conclusions can
necessarily be drawn about specific subdivisions. If there are significant differences
between the subdivisions in terms of income, home size or age, type of distribution or
treatment system, or purity of the original untreated water supply, then a simple random
sample may not be adequately representative of individual subdivisions. VVhen
significant differences exist for sizeable subpopulations, a random sampling scheme
must be modified to ensure that the sample is sufficiently representative (but not
necessarily identical) to the population of all Blue Ribbon and Crest customers. For
example, 19 of the 43 responding said water quality was poor or very poor, and 15 of
these said it was because of low pressure. If an adequate sampling frame had been
used, it might have been possible through the survey alone to determine if the problem
was specific to a particular subdivision or to the entire water system.
Pennsylvania
Pennsylvania Public Utility Commission Survey
While not a typical aDS survey, the Pennsylvania Commission prepared a
survey focusing on how well the Commission responded to complaints. The survey was
an eleven-question customer-response type survey administered by the Bureau of
Consumer Services. Two lessons can be extracted from the survey. The first is that
the questions asked about the Commission apply equally to jurisdictional water utilities.
The second is that if a commission develops aDS standards that cover courtesy,
promptness of response, or ease of making a complaint, then it may be prudent to
ensure that these same customer-oriented aDS standards are also being met by the
Commission.
A CUSTOMER-BASED QUALITY-OF-SERVICE ApPROACH FOR REGULA TING WATER UTILITIES - 29

NRR! 97-05 - CHAPTER 2
Chilton Water Customer Satisfaction Measurement Survey
In 1993 a survey was conducted and a report prepared Chilton Research
Services about customer satisfaction with a jurisdictional water utility. The survey was
focus group that allow a preliminary identification of
issues of concern to customers. In the Chilton survey, the intent was to determine what
factors were important to the utility's customers. The survey questionnaire
subsequently incorporated questions about these factors.
A pretest the questionnaire was undertaken. is one of the most important
parts of the survey process and generally is one indicator a good survey.
Unfortunately most surveys skip the pretest stage in the interest of saving money or
getting into the field faster with the survey. A pretest offers a unique opportunity to see
if the wording, logic, flow, and response options in a questionnaire work properly.
Without a pretest, the analyst is invariably in the position of wishing that some the
survey questions had been worded differently.
The Chilton survey was a telephone survey administered to a stratified sample of
400 customers. One hundred customers were interviewed in each of the four regions
served. This method of sampling does not allow a calculation of a response rate, as
the goal is to keep interviewing until 100 surveys are completed for each region. The
results were then weighted statistically to reflect the actual proportion of customers in
each region. Some findings regarding customers satisfaction included
• 93 percent reported they were "extremely," "very," or "somewhat" satisfied, although a significant variation existing in the four regions. If satisfaction is limited to the "extremely" or "very" satisfied, then the level of satisfaction drops to 73 percent.
• Customer satisfaction scores increased with the length had the utility. The survey firm
43 percent visits.
some or
- A CUSTOMER-BASED QUALITY-OF-SERVICE ApPROACH FOR REGULA TING WA TER UTILITIES

The surveys
information.
commission
utilities. However, they
use surveys as a
preferences and experiences
Fortunately, established
can be conducted that
customer-based quality
firms are available
survey firms
It is nl'"l'·\I""\r .. C'~.ri
telephone
survey
this
a
a
in excess
5 Raymond W. and
3
areas.
Preferences and of the Customers of Ohio Local The National Regulatory Research
NRRI 97-05 - CHAPTER 3
, can
a
water
establish
A CUSTOMER-BASED QUALfTY-OF-SERVICE ApPROACH FOR REGULATING WA TER UTILITIES-

NRRI 97-05 - CHAPTER 3
the important advantage of being able to explain portions of the questionnaire to the
respondent and to modify the
indicates a problem.
survey information will be best used as reliable confirmation that a problem exists.
if early field experience with the survey
commission would or should
uncritically accept survey results as the
definitive and complete word on the
service quality needs of utility customers.
In most instances OOS surJey information \vill be best used as reliable confirmation
that a problem exists. A commission can then use this information as a benchmark
from which to develop new, or modify existing, OOS standards regarding pressure,
clarity, taste, billing, and repair.
Depending upon its own interests, resources, and procedures, a commission can
use a survey to document or discover problems, or to derive standards. Most of the
surveys in Chapter Two have been used to provide independent information about what
customers thought. A rate case or other proceeding or process could then be used to
decide how to best use the information gathered. A survey may reveal that 5, or 25, or
55 percent of the customers had billing complaints (or cloudy water). It is up to
commissions to decide whether remedial action is needed, if 5 percent of the customers
complain about billing. It could be that a 25 or percent complaint level would be
necessary for an official commission response.
survey initiated solely by a commission, or cooperatively with a utility,
necessarily has more credibility then other surveys. commission can easily develop
minimum survey research standards or criteria that can assist utilities or consumer
groups that wish to submit a survey_ criteria could cover how the sample was
obtained, response rate, question bias, data analysis procedures, and availability of the
data for commission Developing these
standards is relatively straightforward will helpful utilities, consumer groups,
and commission.
- A CUSTOMER-BASED QUALITY-OF-SERVICE ApPROACH FOR REGULA TING WA TER UTILITIES

NRRI 97-05 - CHAPTER 3
Survey-Driven Incentive Regulation
Five illustrative ways are identified below that directly use benchmark OOS
information obtained from customer surveys. Each requires different levels of
commission resources and may be more or less appropriate depending upon the
circumstances and need of the commission.
1. Knowing that independent QOS information will be gathered about the
OOS needs and experiences of customers can be an important incentive to
a utility. 800-number complaint lines, commission staff expertise, customer
testimony, and utility testimony and reports are typical sources of aos information, but each can be criticized as being unrepresentative of actual
customer experience. Once benchmark OOS surveys are accepted as
valid, reliable, and independent sources of information, a utility will have a
clear incentive to monitor, anticipate, and respond to revealed aos concerns. Importantly, because the survey data base is accepted as being
scientifically representative, the focus of any debate or action automatically
shifts from determining whether a problem exists to what can (or has) the
utility done to resolve the problem.
2. A number of states do not have official written water aos standards.
These states, however, are concerned about and do monitor quality of
service, but do so with a complaint-driven process. Here consumers,
consumer groups, or commission staff can initiate a complaint. The
commission then decides whether an investigation or inquiry is warranted.
A benchmark OOS survey can be especially helpful in determining the
extent of an alleged aos problem.
A CUSTOMER-BASED QUALITY-OF-SERVICE ApPROACH FOR REGULA TING WA TER UTILITIES - 33

NRR/97-05 - CHAPTER 3
3. a
should
utility
can be invaluable for
inexpensive, even when
main exception, of course, is with
where the unit cost of the survey may be
customer base. The existence of an
or biannual benchmark aos survey
an important set of information that will guide
The incentive structure is naturai
and stems ............................ intent of jurisdictional water utilities to be seen
in the best !;JV' .... ' .......... ""
problems
positive U"H"'on'rn
directly monitor ............ L"-"
a regulatory commission. Solving aos a reliable and accepted benchmark survey is one very
possible when a commission or utility are able to
concerns.
4. As noted Oe:lI"'UOI'" information in a benchmark aos survey can be used to
begin to or quality-of-service standards and
It could be that a benchmark survey reveals
that no complaints regarding low water pressure and that no water
pressure
actions are
made for a decade. Several commission
stop monitoring that
this information, one of which may be to
water pressure. Equally, it could be that a
benchmark
cycle
in a
34 - A CUSTOMER-BASED
that low water pressure is a common
f'nr"ll"ln"'l,uC'C'!nn eQuid, in responding to this information, order a
by an engineering firm or by
Vvisconsin survey, a six-month billing
customer preferences revealed
}F- . ...,;FR\flr~FAppROACH FOR REGULATING WATER UTILITIES

NRRI 97-05 - CHAPTER 3
5. A formal incentive system incorporating economic rewards can also be
developed using a benchmark ODS survey. Professor Sanford Berg, for
example, has developed a weighted quality-of-service index that has been
used by the Florida Public Service Commission for telephone utilities. 6 The
basic underlying concept, however, is readily applicable to designing an
incentive system for jurisdictional water utilities. In Professor Berg's
approach, the utility, its vendors, customers, and commission staff develop
a list of key quality attributes. Each attribute is weighted in terms of
importance and placed in an index. Subsequently, based upon benchmark
survey results, a utility could be rewarded or punished depending upon its
performance. The Berg approach is not necessarily automatic as it
recognizes that a commission may need to judge whether an apparent
increase (or decrease) in the overall aDS index for a utility was sufficient in
and of itself to merit an increase or decrease of some kind in a rate case
setting.
Conclusion
To date, commissions have had limited experience with water ODS surveys. On
the other hand, commissions have had extensive experience with quality of service. A
QOS benchmark survey offers an economical, efficient, and scientifically valid way to
determine directly the service quality preferences and needs of water consumers. All
other surrogate customer service measures have systematic biases that may limit the
usefulness and validity of any service quality information produced.
6 Sanford V. Berg, "A New Index of Telephone Service Quality: An Academic and Regulatory Review" in Quality and Reliability of Telecommunications Infrastructure, ed. William Lehr (Mahwah, New Jersey: Lawrence Erlbaum Associates, 1995).
A CUSTOMER-BASED QUALITY-OF-SERVICE ApPROACH FOR REGULA TING WA TER UTILITIES - 35

NRR/97-05- CHAPTER 3
An incentive system directly based upon customer preferences is intuitively
appealing, especially when monopoly provisioning of water is likely to be an enduring
and pervasive feature of the water sector for the foreseeable future. The large investor
owned water utilities have historically been regarded as being well-run, efficiently
managed, and as reliable providers of high-quality service. Many medium-sized and
small water utilities are not so well-positioned. An incentive system, based on customer
quality demands, should improve the efficiency and effectiveness of investor-owned
water utilities to the advantage of all residential and business custOtllers.
36 - A CUSTOMER-BASED QUALITY-OF-SERVICE ApPROACH FOR REGULA TING WA TER UTILITIES


