a curse or a blessing? natural resources in a multiple growth regimes analysis
TRANSCRIPT

This article was downloaded by: [University of Waterloo]On: 06 November 2014, At: 14:13Publisher: RoutledgeInforma Ltd Registered in England and Wales Registered Number: 1072954 Registered office: Mortimer House,37-41 Mortimer Street, London W1T 3JH, UK
Applied EconomicsPublication details, including instructions for authors and subscription information:http://www.tandfonline.com/loi/raec20
A curse or a blessing? Natural resources in a multiplegrowth regimes analysisMaty Konte aa Aix-Marseille School of Economics, Aix-Marseille University, CNRS, and EHESS, Centre de lavieille charité 2 , rue de la charité 13236 Marseille, cedex 02 , FrancePublished online: 02 Nov 2012.
To cite this article: Maty Konte (2013) A curse or a blessing? Natural resources in a multiple growth regimes analysis, AppliedEconomics, 45:26, 3760-3769, DOI: 10.1080/00036846.2012.730137
To link to this article: http://dx.doi.org/10.1080/00036846.2012.730137
PLEASE SCROLL DOWN FOR ARTICLE
Taylor & Francis makes every effort to ensure the accuracy of all the information (the “Content”) containedin the publications on our platform. However, Taylor & Francis, our agents, and our licensors make norepresentations or warranties whatsoever as to the accuracy, completeness, or suitability for any purpose of theContent. Any opinions and views expressed in this publication are the opinions and views of the authors, andare not the views of or endorsed by Taylor & Francis. The accuracy of the Content should not be relied upon andshould be independently verified with primary sources of information. Taylor and Francis shall not be liable forany losses, actions, claims, proceedings, demands, costs, expenses, damages, and other liabilities whatsoeveror howsoever caused arising directly or indirectly in connection with, in relation to or arising out of the use ofthe Content.
This article may be used for research, teaching, and private study purposes. Any substantial or systematicreproduction, redistribution, reselling, loan, sub-licensing, systematic supply, or distribution in anyform to anyone is expressly forbidden. Terms & Conditions of access and use can be found at http://www.tandfonline.com/page/terms-and-conditions

Applied Economics, 2013, 45, 3760–3769
A curse or a blessing? Natural resources
in a multiple growth regimes analysis
Maty Konte
Aix-Marseille School of Economics, Aix-Marseille University, CNRS, and
EHESS, Centre de la vieille charite 2, rue de la charite 13236 Marseille,
cedex 02, France
E-mail: [email protected]
The literature on the impact of an abundance of natural resources on economic
performance remains inconclusive. In this article we consider the possibility that countries
may follow different growth regimes, and test the hypothesis that whether natural
resources are a curse or a blessing depends on the growth regime to which an economy
belongs. We follow recent work that has used a mixture-of-regressions method to identify
different growth regimes, and find two regimes such that in one regime resources have a
positive impact on growth, while in the other they have a negative impact or at best have
no impact on growth. Our analysis of the determinants of whether a country belongs or
not to the blessed resources regime indicates that the level of democracy plays an
important role while education and economic institutions have no effect.
Keywords: natural resources; mixture-of-regressions; multiple equilibria
JEL Classification: O13; O47
I. Introduction
During the last decade, the question of the impact of an
abundance of natural resources on growth and its transmission
channels has received substantial attention. Despite the exten-
sive literature on the topic, no consensus has emerged on
whether natural resources are a curse or a blessing. On the one
hand, there is evidence of a negative impact of natural
resources on economic performance (see Sachs and Warner,
1999, 2001; Gylfason, 2001; Leite and Weidmann, 2002,
among others). Different channels of transmission have been
proposed to explain the curse, starting with the Dutch Disease
(Corden, 1984). It has also been suggested that the curse can be
due to rent-seeking behaviour that increases tariffs and/or
corruption, which in turn reduces the growth (Bardhan, 1997;
Leite and Weidmann, 2002), and that natural resources crowd-
out education (Gylfason, 2001) and high-quality institutions
(Sachs and Warner, 1999). On the other hand, more recent
evidence questions the existence of a curse. For instance,
Manzano and Rigobon (2007) find no evidence of the resource
curse once they add country fixed-effects, while the results in
Alexeev and Conrand (2009) support a robust positive impact
of natural resources on the Gross Domestic Product (GDP).
Moreover, the success of countries such as Botswana,1 rich in
natural resources and with high growth rates, challenges the
notion of such a curse.Recent empirical work has thus attempted to determine the
conditions under which the curse can be turned into a blessing
by allowing for heterogeneity in the coefficients on natural
resources (Mehlum et al., 2006; Bravo-Ortega and de
Gregorio, 2007; Andersen and Aslaksen, 2008; Collier and
Hoeffler, 2009). The common approach in those papers is to
interact natural resources with variables such as education or
institutions, to determine whether, for instance, an increase of
the level of education decreases the magnitude of the curse and
at some level turns it into a blessing. This approach allows for
heterogeneity in the impact of some variables, yet imposed,
without testing, common coefficients on most of the regressors
1Also, Norway, Canada and the United States are examples of countries which are rich in natural resources but do not suffer from theresource curse.
Applied Economics ISSN 0003–6846 print/ISSN 1466–4283 online � 2013 Taylor & Francis 3760http://www.tandfonline.com
http://dx.doi.org/10.1080/00036846.2012.730137
Dow
nloa
ded
by [
Uni
vers
ity o
f W
ater
loo]
at 1
4:13
06
Nov
embe
r 20
14

included in the models, thus neglecting heterogeneity on other
regressors that may have an impact on the coefficient of our
variable of interest, natural resources.This article contributes to the literature addressing the
heterogeneity in the resource curse by considering the fact that
countries are heterogeneous and may follow different growth
regimes or processes, and asks the question of whether the sign
of the impact of natural resources depends on the growth
regime that a given country belongs to. We suggest that there
may be multiple growth regimes such that the marginal impact
of explanatory variables on growth differs across regimes,
enabling us to test whether an abundance of natural resources
has a negative impact on growth in some regimes and a
positive impact in others. To shed light on the role of
education and institutions, we employ a different strategy
compared to previous work and test whether education and/or
institutions affect the probability of a given country belonging
to the blessed growth regime. We estimate a finite-mixture-of-
regressions model, a semi-parametric method for modelling
unobserved heterogeneity in the data in which countries are
sorted into regimes depending on the similarity of the
conditional distribution of their growth rates given all the
explanatory variables. This approach presents two main
advantages. First, we relax the hypothesis of a single growth
regime and allow the data to detect the number of regimes,
which gives more flexibility and a better fit compared to the
literature in which one growth regime is imposed. Second,
instead of imposing a priori groups of countries (for instance,
some studies divide samples into high- and low-income
countries, democracies and autocracies), we sort countries
into blessed and cursed regimes in terms of their estimated
posterior probability of being in one or another regime, which
we endogenize and suppose to be a function of education,
institutions and geographic features.Our results indicate that the data is best fitted by a model of
two regimes, one in which an abundance of natural resources
has a positive impact on growth and one in which it has a
neutral or negative impact. We also find that more democracy
increases the probability of a given country belonging to the
blessed regime, while economic institutions, education and
regional dummies have no effect on that probability. In the
first regime, the average annual growth rate is 2.55% and 42%
of countries belong to this group, while the annual growth rate
in the second group is 1.24% with 58% of countries belonging
to it. There is substantial heterogeneity within each group,
both in terms of GDP levels and geographical location,
indicating that democracy is not acting as a proxy for these
features. For example, African countries such as Botswana,
Senegal and South Africa are in the blessed regime, while
Ireland and Portugal find themselves in the other one.This article is related to three strands of literature on the
empirics of growth. First, it contributes to the literature on the
relationship between natural resources and economic perfor-
mance.2 In their seminal work, Sachs and Warner (1999, 2001)
provide evidence of a negative impact of natural resources on
growth and find no support for the idea that geographic features
or climate explain the resource curse. Further evidence on the
resource curse has been provided by Gylfason (2001), Leite and
Weidmann (2002), Papyrakis and Gerlagh (2004, 2007),
who analyse both the direct impact of natural resources on
growth rates and the indirect one, operating through the effect
of resources on physical and human capital investments.Our analysis follows closely the literature focusing on the
conditions under which a resource curse can be turned into a
blessing, thus accounting for heterogeneity. Mehlum et al.
(2006) interact natural resources with an index of the rule of
law, ranging from 0 to 1, and find that the resource curse
disappears when the index of rule of law is at least 0.93. This
value decreases to 0.6 when they replace the export of primary
goods in total GDP (also known as Sachs and Warner measure
of natural resources) by the share of mineral production in
national income. Bravo-Ortega and de Gregorio (2007) show
how natural resources interact with education and find that a
high level of education helps reduce the resource curse. Collier
and Hoeffler (2009) investigate whether democracy can offset
the resource curse, and their results indicate that a combina-
tion of high-resource rents and democracy is growth-reducing
but this negative effect can be offset by setting checks and
balances in resource-rich countries. Andersen and Aslaksen
(2008) examine whether features of constitutions determine
how an abundance of natural resources affects economic
growth. They find that the curse is present in democratic
presidential countries but not in parliamentary democracies,
and that being parliamentary or presidential is more important
than being a democracy or an autocracy. All these papers
assume that all countries follow the same growth process and
allow for parameter heterogeneity only in some chosen
variables. We propose a more flexible approach that considers
parameter heterogeneity for all the variables of the model.
We then examine whether the impact of natural resources on
growth differs across regimes. Furthermore, rather than
imposing the interaction between resources and a particular
variable, we consider several potential determinants of growth-
regime membership and test whether they help a given country
to belong to the resource-blessed regime.Our article is also related to the literature that tests for the
existence of multiple growth processes.3 Recent work has
applied the mixture-of-regressions method to address the
multiple regimes hypothesis, an approach that presents a
number of advantages over previously used methods
(see ‘Section Finite-mixture-of-regressions models’). Owen
et al. (2009) apply the mixture-of-regressions method to
answer the question Do all countries follow the same growth
process?, and find that the panel data is best fitted by two
different growth processes. Using the same methodology,
Flachaire et al. (2011) examine the direct and indirect roles of
economic and political institutions in the process of develop-
ment, and the results indicate that political institutions are the
2For a survey of the existing hypotheses and empirical analyses, see Ploeg (2011).3Starting with the Classification Analysis and Regression Tree (CART) proposed by Durlauf and Johnson (1995), the question of multiplegrowth regimes has been addressed by a large literature. Although the CART method is an endogenous grouping method based onthresholds of splitting variables selected a priori, its disadvantage is the lack of available asymptotic properties that would be useful fordrawing inference on threshold variable choices and threshold values estimations. More sophisticated clustering methods have beenproposed in order to make the classification as flexible as possible (see Kourtellos et al., 2011).
Natural resources in a multiple growth regimes analysis 3761
Dow
nloa
ded
by [
Uni
vers
ity o
f W
ater
loo]
at 1
4:13
06
Nov
embe
r 20
14

main determinant of which growth regime a country belongs
to, while economic institutions have an direct impact on
growth rates within each of the two regimes.4 Neither of these
papers considers the role of natural resources, yet the
framework is obviously suited to examine the question.
This article proceeds as follows. Section II presents the
econometric methodology. Section III describes the data
while Section IV presents the main results. The next section
checks the robustness of the results, and some concluding
comments are provided in Section VI.
II. Econometric Specifications
Standard specification
The standard parametric specification used to examine the
effect of natural resources is of the following form:
growthi,t ¼ �0 þ �1 logðgdp0,i,tÞ þ �2 logðpopi,t þ 0:05Þ
þ �3 logðinvi,tÞ þ �4 logðeduc0,i,tÞ
þ �5NR0,i,t þ �6ecoi,t þ �7demi,t þ "i,t ð1Þ
The dependent variable is the annual growth of real GDP per
capita (growthi,t) while the independent variables are initial
GDP per capita (gdp0,i,t), the population growth rate (popi,t)
plus a term 0.05 capturing depreciation and technological
change, the investment rate (invi,t), the initial level of education
(educ0,i,t) and the initial endowment in natural resources
(NR0,i,t). It is also possible to include measures of the quality of
institutions such as the level of economic institutions (ecoi,t)
and the level of democracy (demi,t).
We assume that the error terms, "it, are identically and
independently distributed and follow a normal distribution
with mean zero and variance �2. Our parameter of interest is
the coefficient on the natural resources variable, �5. A negative
�5 confirms the resource curse hypothesis while a positive �5implies that resources are a blessing. Economic institutions
have been found to be robust determinants of growth rates in
many studies,5 but there is only weak evidence that political
institutions (here measured by democracy) are robust regres-
sors of growth rates. Political institutions have been found to
have a weak-direct impact on growth but a strong-indirect
impact through the effect that economic institutions and
policies have on growth or through their impact on the choice
of policies and economic institutions in a country.6 We expect
the coefficient, �6, on economic institutions to be positive and
significant and that on democracy, �7, to be insignificant.The specification in Equation 1 assumes that there is a single
growth model which explains the process of development for
all countries. If the observations of our dataset are not
generated by a single growth regime, the estimation of
Equation 1 will produce biased results. A biased estimate of
the coefficient �5 could thus lead to the wrong conclusion on
whether or not there is a resource curse. For instance, if for
some countries �5 is positive and for others �5 is negative, in
a single regression it may turn out to be insignificant.
To overcome this problem, we propose to use the mixture-
of-regressions method.
Finite-mixture-of-regressions models
Finite-mixture-of-regressions models, also known as
Generalized Mixture Regression models, are semi-parametric
methods for modelling unobserved heterogeneity of the
population in the estimation of a regression model. We relax
the hypothesis of one growth regime and assume K different
homogeneous growth regimes such that the growth determi-
nants have different marginal impacts across regimes. Thus, we
are able to test whether the marginal impact of an abundance
of natural resources on growth differs across regimes.7
Let us consider ðY,XÞ ¼ ð yi, xiÞni¼1, a pair formed by
random variable yi and a set of explanatory variables xi.
By definition, the mixture-of-regressions based on the density
of Y conditional on X is expressed as follows:
f ð yjx,�Þ ¼XK
k¼1
�kfkð yjx;�k, �kÞ ð2Þ
whereK is the number of groups or regimes, �k is the probabilityof belonging to group k and fk(yjx;�k, �k) is a conditional
probability distribution characterized by a set of parameters
(�k, �k) and of covariates x. Both �k and �k are unknown and
hence estimated. We suppose fk is a Gaussian distribution with
conditional expectations equal to E(yjx) ¼ x�k.To illustrate, if K ¼ 1, then all observations are generated
by the same data-generating process given by
y ¼ x�þ ", " � Nð0, �2Þ ð3Þ
In this case, the standard specification in Equation 1 is
sufficient to study the impact of natural resources on the
growth rate. If K ¼ 2, then a mixture of linear regressions
assumes that an observation belonging to the first group and
the one belonging to the second group would not be generated
by the same data-generating process. The mixture model with
two components reduces to
Group 1: y ¼ x�1 þ "1, "1 � Nð0, �21Þ
Group 2: y ¼ x�2 þ "2, "2 � Nð0, �22Þð4Þ
where "1 and "2 are independent and identical normally
distributed error terms within each group, with variances of �21and �22 , respectively. In this setting the impact of natural
resources on growth could be different in the two regimes
because the environment in which growth occurs is different
across regimes.Since we are also interested in testing whether institutions
and/or education help to classify countries into growth
regimes, we extend the model in Equation 2 by adding a set
of additional variables !, also known as concomitant variables,
4Mixture regressions have also been used by Bos et al. (2010) and Vaio and Enflo (2011) to examine, respectively, growth in the very long-run (using historical data) and the possibility of countries’ switching regimes.5See Glaeser et al. (2004) and Flachaire et al. (2011) among others.6See Acemoglu et al. (2005), Eicher and Leukert (2009) and Flachaire et al. (2011).7Since this approach has been used before to analyse growth regimes we do not give all the steps of the functional form of the mixture ofregressions methods for panel data. For more details the reader is invited to refer to Owen et al. (2009).
3762 M. Konte
Dow
nloa
ded
by [
Uni
vers
ity o
f W
ater
loo]
at 1
4:13
06
Nov
embe
r 20
14

that explain group membership. Concomitant variables play
the same role as covariates in a multinomial regression model
designed to explain the group membership. They directly affect
the probability of a given country being in one or another
growth regime, implying that the parameter �k(�) becomes
endogenous. The roles of standard covariates x and of
concomitant variables ! are different: standard covariates
help to explain variations within groups, whereas concomitant
variables explain variations between groups. Equation 2 with
concomitant variables becomes
f ð yjx,!,�Þ ¼XK
k¼1
�kð!,�kÞ fkð yjx;�k, �kÞ ð5Þ
where �k is a vector of parameters on concomitant variables !
and its sign helps to determine how a variation of ! impacts
the probabilities of countries being in one or another regime.For a given number of components K we estimate the finite
mixture model by maximum likelihood with the Expectation
Maximization (EM) algorithm of Dempster et al. (1977),
which is the most common approach for the maximum
likelihood estimation of finite mixture models. To avoid a
singularity problem, we ensure that the estimated parameter of
�k is different from zero.The number of groups K is a priori unknown and the
selection of the optimal value is crucial since it gives the true
number of growth regimes generated by the data. We choose
the optimal value of K by minimizing the Bayesian
Information Criterion (BIC) developed by Schwarz (1978),
and the Corrected Information Criterion (CAIC) (Burnham
and Anderson, 2002). Once parameters are estimated, we can
use the Bayes rule to compute the probability that a given
country is allocated to a given group k. The equation is written
as follows:
�ik ¼�kðwi, �kÞ fkð yijxi ; �k, �kÞPKk¼1 �kð!i, �kÞ fkð yijxi ; �k, �kÞ
ð6Þ
For classification purposes, a given country i will be allocated
in group k rather than group l if and only if �ik 4 �il.We will apply the mixture-of-regression method to
Equation 1, using as concomitant variables the average levels
of economic institutions, eco, and of democracy, dem, and the
initial level of education, educ70 in logs, as well dummies for
Sub-Saharan African and Latin-American countries to control
for geographical location.
The use of the mixture-of-regressions model has at least three
advantages. First, it allows to treat endogenously unobserved
heterogeneity by considering simultaneously all the covariates
and allowing them to have different marginal impacts across
regimes. Second, countries are sorted into regimes in terms of
probabilities which are a function of concomitant variables,
thus we can compare the role of education, geography and
institutions in allocating countries into regimes. Finally, the
number of homogeneous growth regimes is a priori unknown
and is selected optimally with respect to some information
criterion. This means that if there are more than two ways
in which resources affect growth, we should be able to
identify them. It is important to note that our approach
does not consider the indirect impact of natural resources
through variables such as investment or education, a question
that has received substantial attention in the literature
(Gylfason, 2001). In addition, our model constrains coun-
tries not to be in different regimes at different periods since
the concomitant variables are constant.8
III. Data
We build a 5-year panel of developed and developing countries
for 1970–2005, which yields seven periods. All the variables
used, except education, the measures of natural resources and
institutions are from the Penn World Tables (version 6.3).
Education comes from Barro and Lee (2010) and is measured
by the average years of schooling in the population aged over
25. Our main measure of natural resources abundance is the
share of exports of primary goods in total GDP (xgdp), which
includes fuel and nonfuel goods. This measure, first proposed
by Sachs and Warner (1999), has been extensively used in the
literature. The data are provided by the World Development
Indicators (WDI). Nonfuel goods comprise metals and ores,
agricultural raw materials and food. We will mainly use the
aggregate measure of natural resources (xgdp) although we will
check the robustness of our findings by employing alternatives
measures. Sachs and Warner (2001) argue that the natural
resources effect should be linked to the magnitude of economic
rents they generate and it is possible that different types of
resources yield higher or lower rents,9 therefore we will
distinguish minerals from agricultural goods since minerals
yield, in general, higher rents. We will hence disaggregate xgdp
into its three components10: metal and ores (Metal – Ores),
agricultural raw materials and food (Agri – food ) and fuel
(Fuel). Some authors (for instance, Gylfason, 2001) define the
8The question of regime migration is a complex one and has been recently addressed by Bos et al. (2010).9The different types of natural resources may have a difference in terms of factor intensity, ownership and cost of extraction, which mayimply different quantities of extracted rents (Leite and Weidmann, 2002).10As documented in the World Bank data, agricultural raw materials’ exports correspond to the Standard International Trade Classification(SITC) section 2 excluding divisions 22, 27 (crude fertilizers and minerals excluding coal, petroleum, and precious stones) and 28(metalliferous ores and scrap); Food exports, food comprises the commodities in SITC sections 0 (food and live animals), 1 (beverages andtobacco), 4 (animal and vegetable oils and fats) and SITC division 22 (oil seeds, oil nuts and oil kernels); ores and metals comprise thecommodities in SITC sections 27 (crude fertilizer, minerals nes), 28 (metalliferous ores, scrap), and 68 (nonferrous metals) and fuel exportscomprise SITC section 3 (mineral fuels).
Natural resources in a multiple growth regimes analysis 3763
Dow
nloa
ded
by [
Uni
vers
ity o
f W
ater
loo]
at 1
4:13
06
Nov
embe
r 20
14

share of primary exports as natural resources intensity rather
than natural resources abundance,11 so we will also use the
rent per capita,12 as a measure for natural resources abundance
in the robustness section.Turning to the measures of institutions, we distinguish
political institutions from economic institutions. Political
institutions refer to how political choices are made, while
economic institutions refer to the consistency of those choices
with voluntary exchange and the protection of property rights.
We measure political institutions by the index of democracy
from Polity IV, and economic institutions by the index of the
Economic Freedom in the world from the Fraser Institute
compilation.13 The democracy index takes into account the
competitiveness of executive recruitment, the openness of
executive recruitment, the constraints on the executive and the
competitiveness of political participation. It ranges between 0
and 10, with a value of 0 denoting an autocratic government
and a value of 10 denoting the full democracy. Economic
freedom measures the extent to which property rights are
protected and the freedom that individuals have to engage in
voluntary transactions. This measure takes into account the
respect of personal choices, the voluntary exchanges coordi-
nated by markets, freedom to enter and compete in markets
and protection of persons and their property from aggression
by others.14
IV. Results and Discussion
Standard model results
We start by reproducing some of the results found in the
literature when we suppose that all countries follow the samegrowth process. Results are displayed in Table 1. In this and
all subsequent tables NR always denotes natural resources,
Table 1. Standard estimations
Cross-section Panel data
Variable OlS (1) OlS (2) FE (3) RE (4) OlS-IV (5) RE-IV (6)
log(gdp) �1.150*** �1.469*** �5.130*** �2.298*** �1.454*** �2.483***(0.311) (0.219) (0.509) (0.276) (0.263) (0.334)
log(popþ 0.05) �0.911 �5.151*** �5.858*** �6.305*** �5.592*** �6.364***(1.652) (1.035) (1.669) (1.276) (1.157) (1.448)
log(inv) 1.420*** 1.402*** 2.109*** 1.590*** 1.526*** 1.918***(0.432) (0.280) (0.520) (0.360) (0.340) (0.423)
log(educ) 0.619 0.637** 0.252 0.972*** 0.515 1.182**(0.314) (0.285) (0.628) (0.373) (0.381) (0.496)
NR �0.044*** �0.006 0.019 �0.002 �0.032 �0.009(0.012) (0.009) (0.019) (0.013) (0.019) (0.013)
eco 0.606** 0.991*** 1.409*** 1.363*** 0.815*** 1.064***(0.266) (0.142) (0.216) (0.175) (0.176) (0.239)
dem �0.005 0.092** �0.131** �0.069 �0.085 �0.032(0.081) (0.040) (0.054) (0.046) (0.0565) (0.078)
Constant 4.899 13.34*** 18.97*** 19.84*** 15.03*** 21.48***(4.721) (2.864) (3.485) (3.565) (3.209) (3.866)
Time dummies .. .. .. .. ..Number of observations 71 498 498 498 388 388Number of countries 71 91 91 91 83 83R-squared 0.44 0.23 0.36 0.32 0.25 0.22
Notes: We use the aggregate measure of exports of primary goods xgdp for the natural resources variable. Time dummies are included forpanel data estimations. For IV estimation, first lags of log(educ), NR, eco and dem are used as instruments. SEs are in parentheses.*** and ** denote significance at the 1 and 5% levles, respectively.
Table 2. Panel data: selection of the mixture models
BIC CAIC
K¼ 1 2353.8 2368.8K¼ 2 2280.3 2316.3
K¼ 3 2299.4 2356.4K¼ 4 2304.3 2382.3
Notes: BIC and CAIC criterion are reported. K is the number ofregimes. We use the aggregate measure of natural resources xgdpto measure NR. Selected model in bold.
11The idea behind is that a country like Norway, has a low share of exports of primary products in total GDP because it has also developedother sectors of the economy.12Rent is defined as total revenue from natural resources divided by the population. The rent is provided by the WDI and it includes rentfrom energy, minerals and forest. Energy refers to crude oil, natural gas and coal, and mineral refers to bauxite, copper, iron, lead, nickel,tin, zinc, gold and silver. The rent of a unit of resource is defined as the gap between its world price and its country-specific extraction costsboth expressed in US dollars, the resulting measure is then multiplied by the total quantity of resources extracted.13These two measures are used in Flachaire et al. (2011), where we explain how political and economic institutions enhance differently theeconomic development of countries.14For space constraint the descriptive statistics are not presented; (Konte, 2012).
3764 M. Konte
Dow
nloa
ded
by [
Uni
vers
ity o
f W
ater
loo]
at 1
4:13
06
Nov
embe
r 20
14
which can be measured in different ways. We first present
some of the results in cross-section analysis, reported in
column (1). The dependent variable, the growth rate and the
explanatory variables (except for initial GDP, education and
natural resources) are averaged for the entire 35-year period.
We measure initial GDP, education and natural resources at
the starting year, 1970. The coefficient on natural resources
is negative and significant at the conventional level 1%,
suggesting that an abundance of natural resources reduces
growth. The coefficient on NR (�0.044) is roughly compa-
rable to that in Sachs and Warner (2001), Table 2 columns
(2) and (3), where the resource curse hypothesis is analysed
for the period 1970–1989. We report in columns (2)–(4) of
Table 1, respectively, the pooled, the fixed effects and the
random effects estimations when using panel data.
The coefficient on natural resources is negative in almost
all columns, but it is never significant. This confirms the
results in Manzano and Rigobon (2007), who find that the
resource curse hypothesis disappears once panel data with
fixed-effects are used.
It is well-known that both institutional quality and educa-tional attainment may be determined by the economic perfor-
mance, and the literature on natural resources has alsodiscussed the problem of causality between natural resources
and economic performance, due to the fact that the denom-
inator of our measure for NR is GDP per capita. If twocountries export the same amount of natural resources, the
country with a lower level of GDP will be resource-rich whilethat with a higher level will be considered as resource-poor. To
deal with this possible endogeneity, we perform Instrumental
Variable (IV) estimations using the first lags of education, NRand both institutions as instruments (columns (5) and (6)). In
all specifications the coefficient of the variable of interest,natural resources, remains insignificant.
These results support neither a resource curse nor aresource blessing when using standard models on panel data.
One possible cause for the absence of significant coefficients on
natural resources is that there exists unobserved heterogeneityin the data. In fact, the assumption that all countries follow the
same growth regime may be too constraining, raising doubtson the estimates. Consequently, we test whether our data is
generated by multiple growth regimes, and if an abundance ofnatural resources has different marginal impacts across
regimes.
Mixture-of-regressions results
Next, we estimate the mixture model with concomitantvariables and allow the number of groups K to vary between
1 and 4, estimating four models. As in the previous panel
data estimations, our dependent variable is the annual rateof growth averaged over 5 years and the standard covariates
are initial GDP per capita, population growth averaged over5 years, initial level of education, initial quantity of natural
resources, and the 5-year average of investment, economic
institutions and democracy. We use democracy andeconomic institutions as concomitant variables averaged
over the entire 35-year period, the level of education in1970, a Sub-Saharan African dummy and a Latin-American
dummy. We report the values of the BIC and CAIC inTable 2. Both the information criteria are minimized for
K¼ 2, allowing us to select the model with two growth
regimes as the one that best fits the data. According to thetwo test statistics, the two-regime model presents a substan-
tial improvement over estimating a single-regime model(BIC¼ 2282.6 for K¼ 2 versus BIC¼ 1353.8 for K¼ 1).
Recall that the estimation of the model where K¼ 1 is
reported in column (1) of Table 1, where we find no impactof natural resources on the growth rate.
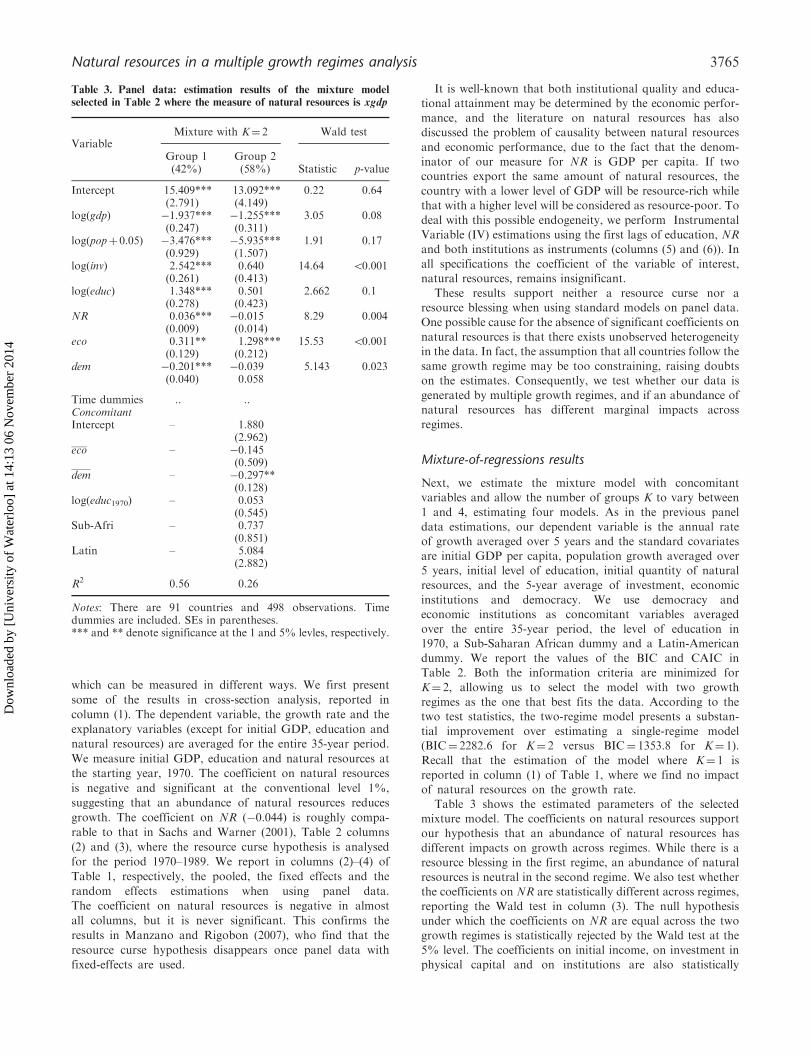
Table 3 shows the estimated parameters of the selectedmixture model. The coefficients on natural resources support
our hypothesis that an abundance of natural resources hasdifferent impacts on growth across regimes. While there is a
resource blessing in the first regime, an abundance of natural
resources is neutral in the second regime. We also test whetherthe coefficients on NR are statistically different across regimes,
reporting the Wald test in column (3). The null hypothesisunder which the coefficients on NR are equal across the two
growth regimes is statistically rejected by the Wald test at the5% level. The coefficients on initial income, on investment in
physical capital and on institutions are also statistically
Table 3. Panel data: estimation results of the mixture model
selected in Table 2 where the measure of natural resources is xgdp
VariableMixture with K¼ 2 Wald test
Group 1(42%)
Group 2(58%) Statistic p-value
Intercept 15.409*** 13.092*** 0.22 0.64(2.791) (4.149)
log(gdp) �1.937*** �1.255*** 3.05 0.08(0.247) (0.311)
log(popþ 0.05) �3.476*** �5.935*** 1.91 0.17(0.929) (1.507)
log(inv) 2.542*** 0.640 14.64 50.001(0.261) (0.413)
log(educ) 1.348*** 0.501 2.662 0.1(0.278) (0.423)
NR 0.036*** �0.015 8.29 0.004(0.009) (0.014)
eco 0.311** 1.298*** 15.53 50.001(0.129) (0.212)
dem �0.201*** �0.039 5.143 0.023(0.040) 0.058
Time dummies .. ..ConcomitantIntercept – 1.880
(2.962)eco – �0.145
(0.509)dem – �0.297**
(0.128)log(educ1970) – 0.053
(0.545)Sub-Afri – 0.737
(0.851)Latin – 5.084
(2.882)
R2 0.56 0.26
Notes: There are 91 countries and 498 observations. Timedummies are included. SEs in parentheses.*** and ** denote significance at the 1 and 5% levles, respectively.
Natural resources in a multiple growth regimes analysis 3765
Dow
nloa
ded
by [
Uni
vers
ity o
f W
ater
loo]
at 1
4:13
06
Nov
embe
r 20
14

different across regimes. Investments in physical and human
capital have a positive and significant impact on growth for the
first group, but education does not affect growth for the
second one. Economic institutions are beneficial for growth in
both regimes while political institutions do not matter for the
second regime but negatively affect the growth rate in the first
group. Recent literature has tried to explain why it has been so
difficult to find a robust positive effect of political institutions
on growth and suggests that, contrary to economic institu-
tions, their impact on growth may be indirect. Acemoglu et al.
(2005) propose the hierarchy of institutions hypothesis, which
indicates that political institutions set the stage in which
Table 4. Classification obtained from the selected mixture model with xgdp as the measure of natural resources
Group 1 Group 2 Group 2 (cont.)
Country Probability Country Probability Country Probability
Australia 0.99 Algeria 1 Paraguay 1Austria 0.99 Argentina 1 Peru 1Bangladesh 0.84 Bahrain 1 Philippines 1Belgium 0.94 Bolivia 1 Portugal 0.95Benin 0.52 Brazil 0.99 Sierra Leone 0.67Botswana 0.75 Cameroon 0.99 Syria 1Canada 0.99 Central African Rep, 1 Tanzania 0.74China 0.97 Chile 1 Thailand 0.99Congo. Rep, 0.96 Colombia 0.85 Togo 1Cyprus 0.99 Costa Rica 0.98 Trinidad Tobago 1Denmark 0.99 Cote d’Ivoire 0.97 Uganda 0.58Finland 0.98 Dominican Rep, 0.99 Uruguay 1France 0.99 Ecuador 1 Venezuela 0.99Germany 0.99 Egypt 0.99 Zambia 1Greece 0.97 El Salvador 1 Zimbabwe 1India 0.99 Fiji 0.99Israel 0.99 Ghana 1Italy 0.99 Guatemala 1Japan 0.99 Guyana 1Korea. Rep, 0.99 Haiti 0.99Malaysia 0.95 Honduras 1Mali 0.87 Hungary 0.99The Netherlands 0.99 Indonesia 0.99New Zealand 0.91 Iran 1Norway 0.99 Ireland 0.96Pakistan 0.99 Jamaica 1Poland 0.93 Jordan 1Senegal 0.74 Kenya 1Singapore 0.99 Lesotho 0.93South Africa 0.91 Malawi 1Spain 0.99 Mauritius 0.99Sri Lanka 0.89 Mexico 1Sweden 0.99 Mozambique 1Switzerland 0.99 Nepal 0.94Tunisia 0.99 Nicaragua 1Turkey 0.99 Niger 0.99UK 0.99 Panama 1US 0.99 Papua New Guinea 1
Means of key variables by group
Group 1 Group 2
growth 2.55 1.24(1.87) (3.17)
NR 8.78 16.21(11.36) (12.27)
log(educ) 1.79 1.42(0.71) (0.61)
eco 6.37 5.72(1.08) (0.98)
dem 7.57 4.44(3.51) (3.82)
Note: The numbers are the group membership posterior probabilities
3766 M. Konte
Dow
nloa
ded
by [
Uni
vers
ity o
f W
ater
loo]
at 1
4:13
06
Nov
embe
r 20
14

economic institutions and policies operate. The results in
Flachaire et al. (2011) find support for the hierarchy of
institutions hypothesis when using the mixture-of-regressions
approach in a panel of developed and developing countries
covering.
We now turn to the coefficients on the concomitant
variables. Recall that the concomitant variables play the
same role as covariates in the multinomial logit estimations, so
that only the signs of the coefficients have an interpretation.
Our group of reference here is the first one, the one for which
resources have a positive impact on growth. The results show a
negative and highly significant coefficient on democracy,
indicating that an increase in the level of democracy decreases
the probability for a given country to be in the second regime
rather than in the first regime. Economic institutions, educa-
tion and geographical location do not affect the regime
membership probability.We find that 42% of countries are in the first group against
58% in the second one. Table 4 shows the classification of
countries into growth regimes with their respective probabil-
ities. Countries from different regions and countries with
different levels of development follow the same growth
process. For instance, Bangladesh, Botswanna, the Republic
of Congo and Mali are in the same group as most of the
Western countries, while Ireland and Portugal are in the same
group as most of the poor countries.
The bottom panel of Table 4 reports the average values ofthe dependent and main independent variables for the two
groups, as well as the within group SDs in parentheses. Theaverage growth rate is equal to 2.32% for the first group
against 1.50% for the second group. The SD is much lower inthe first group than in the second, which could be explained by
the high diversity of countries in the latter group. The averagevalue of exports of primary goods is twice as low in the first
group as in the second although the variances are similar.Regarding institutions, there is only a small difference on the
average values of economic institutions but the level ofdemocracy is much higher in the resource-blessing group
than in the second one.As already discussed in Section IV, finding good instru-
ments for natural resources and, in particular, for institutions
remains difficult. Moreover, we are not aware of a procedurethat allows to estimate mixture models using instrumental
variables. To consider the endogeneity problem we proceed intwo steps, and after having divided countries according to our
earlier estimation we perform standard IV estimations for eachof the groups. We use one-period lags of education, natural
resources and institutions as instruments. The results arereported in Table 5 and show that coefficients are very close to
those reported in Table 3.
V. Disaggregating Natural Resources
It is important to understand on how the different components
of xgdp affect growth as the different components of xgdp mayhave different impacts on growth across regimes. For example,
the mineral sectors yield, in general, higher rents than theagricultural and fuel sectors (Sachs and Warner, 2001).
Furthermore, Leite and Weidmann (2002) mention thatalthough those components are different in terms of factor
intensity, they also have differences in terms of ownership andin terms of time of extraction, implying different costs and
different processes, and thus different rents.Table 6 reports the estimation of the K¼ 2 mixture models
for different measures of resources.15 For Metal – Ores, the
results support the existence of a resource blessing in the firstregime and a resource curse in the second one. The level of
democracy helps to split countries into regimes, with moredemocracy increasing the probability for a given country to be
in the resource-blessed regime. The Wald test, which is notreported, rejects the hypothesis of the equality of the coeffi-
cients on natural resources across regimes. Similarly, when weconsider agricultural raw materials and food (Agri-food), we
find again a resource blessing in the first regime and a resourcecurse in the second one. For fuel we obtain no effect of natural
resources on growth in the second regime and a positive one inthe first. In all cases the level of democracy is an important
determinant of the probability for countries to be classifiedinto regimes, while education and regional dummies tend to
play no role. Only in the case of fuel the Latin Americandummy decreases the probability to be in the resource-blessed
regime. Note that the magnitude of the coefficient on naturalresources in absolute value is higher for Metal – Ores than for
Table 5. Panel data: IV estimations by groups, from the classifica-
tion obtained in Table 4
Group 1 Group 2
Intercept 18.20*** 14.51***(2.858) (4.575)
log(popþ 0.05) �4.345*** �6.273***(0.995) (1.655)
log(gdp) �2.102*** �1.055***(0.267) (0.358)
log(inv) 2.513*** 0.636(0.280) (0.452)
log(educ) 1.490*** 0.271(0.309) (0.548)
NR 0.027** �0.028(0.012) (0.018)
dem �0.232*** �0.012(0.057) (0.077)
eco 0.378** 0.965***(0.149) (0.278)
Observations 183 224R-squared 0.56 0.27Under test. 50.001 50.001Weak instr. 51.5 86.0
Notes: SEs are in parentheses. Time dummies are included. Forunderidentification test, the p-value is reported. For weakinstruments tests, the value of the first-stage F-statistic is reported.Standard errors in parentheses.*** and ** denote significance at the 1 and 5% levles, respectively.
15The information criterion selection always gives two growth regimes. For space constraints the information criterion are not presented(Konte, 2012).
Natural resources in a multiple growth regimes analysis 3767
Dow
nloa
ded
by [
Uni
vers
ity o
f W
ater
loo]
at 1
4:13
06
Nov
embe
r 20
14

Agri – food and Fuel. One possible explanation is that mineral
sectors yield, in general, higher rents than agricultural sectorsand fuel sectors due to the difference in terms of costs and in
terms of capital intensity as already mentioned in the previousparagraph.
Considering rent per capita as our measure of resources, we
find a positive and significant impact in the first group but noimpact in the second one. As before, the level of democracy
helps the classification of countries into regimes, while theSub-African dummy is now significant and indicates that being
a Sub-Saharan African country reduces the probabilitybelonging to the blessed resources group.16
VI. Conclusion
This article has tested a new hypothesis not yet addressed bythe literature that has tried to understand the conditions under
which natural resources can be a blessing. We go beyondexisting studies and test whether the impact of natural
resources depends on the growth regime to which an economy
belongs. To do so, we allow countries to follow different
growth processes or regimes such that the marginal impact of
explanatory variables on growth differs across regimes,
enabling us to test whether natural resources are a curse or a
blessing within each regime.Our results indicate that for the period 1970–2005 the data
is best fitted by a model of two regimes. In one regime, an
abundance of natural resources has a significant and positive
impact on growth, while in the other regime, an abundance of
natural resources does not enhance growth. The analysis of the
determinants of whether a country belongs or not to the
blessed-resources regime indicates that the level of democracy
plays a crucial role, while education and economic institutions
have no effect. Moreover, once we control for the degree of
democracy, being a Sub-Saharan African or a Latin-American
tends not to be relevant for whether a country belongs to the
blessed regime.The policy implication of our analysis is that resource-rich
countries that have suffered from their endowment in natural
Table 6. Panel data: estimations of the models selected for alternative measures of natural resources. Time dummies are included
Metal-Ores Agri-Food Fuel Rent
Group1(�1¼ 41%)
Group2(�2¼ 59%)
Group1(�1¼ 36%)
Group2(�2¼ 64%)
Group1(�1¼ 40%)
Group2(�2¼ 60%)
Group1(�1¼ 36%)
Group2(�2¼ 64%)
Intercept 12.556*** 16.182*** 17.444*** 15.824*** 8.745*** 17.439*** 14.081*** �1.465(4.216) (2.574) (3.321) (4.054) (2.709) (4.186) (2.639) (2.624)
log(gdp) �2.194*** �1.144*** �2.282*** �1.562*** �1.636*** �1.638*** �1.942*** �1.005***(0.237) (0.309) (0.294) (0.319) (0.253) (0.322) (0.227) (0.345)
log(popþ 0.05) �3.624*** �5.813*** �3.679*** �5.953*** �1.586 �8.109*** �3.295*** �0.073(0.869) (1.518) (0.876) (1.462) (0.873) (1.595) (0.915) (0.607)
log(inv) 2.971*** 0.337 2.582*** 0.502 2.604*** 0.979** 2.966*** 0.580(0.286) (0.396) (0.445) (0.377) (0.319) (0.409) (0.313) (0.344)
log(educ) 1.302*** 0.427 1.811*** 0.588 0.479 0.958** 1.304*** 0.769(0.259) (0.443) (0.372) (0.405) (0.314) (0.429) (0.303) (0.400)
NR 0.279*** �0.062*** 0.072*** �0.048** 0.075*** 0.032 0.091** 0.025(0.079) (0.023) (0.020) (0.022) (0.016) (0.018) (0.041) (0.091)
eco 0.405*** 1.371*** 0.391*** 1.315*** 0.439*** 1.531*** 0.248 1.429***(0.126) (0.212) (0.131) (0.205) (0.139) (0.206) (0.143) (0.223)
dem �0.128** �0.197*** �0.193*** �0.015 �0.059 �0.128** �0.178*** 0.038(0.059) (0.038) (0.041) (0.059) (0.044) (0.059) (0.040) (0.06)
Time dummies .. .. .. .. .. .. .. ..ConcomitantIntercept – 3.051 – 4.144 – �5.617 – �1.116
(4.538) (3.562) (3.872) (3.593)eco – �0.334 – �0.512 – 1.414 – 0.518
(0.526) (0.589) (0.726) (0.664)dem – �0.312** – �0.315** – �0.587*** – �0.362**
(0.129) (0.130) (0.199) (0.158)log(educ1970) – 0.142 – 0.432 – �0.392 – �0.537
(0.559) (0.569) (0.677) (0.659)Sub-Afri – 0.972 – 1.485 – 0.648 – 2.374**
(0.914) (1.028) (0.985) (1.193)Latin – 5.582 – 4.911 – 4.651*** – 4.951
(2.938) (2.896) (1.489) (3.205)
R2 0.59 0.26 0.61 0.24 0.38 0.33 0.57 0.22
Notes: SEs are in parentheses. Data for fuel for Honduras and Malawi are not available, which reduces the number of countries to 89 for theestimation of the model with fuel.*** and ** denote significance at the 1 and 5% levles, respectively.
16We have also run a number of further estimations using alternatives measures of political institutions (Konte, 2012).
3768 M. Konte
Dow
nloa
ded
by [
Uni
vers
ity o
f W
ater
loo]
at 1
4:13
06
Nov
embe
r 20
14

resources should try to move to the resource-blessed regime bychanging the environment in which growth occurs. Externalaid aimed at improving education (although it has benefits in
itself) will not help countries to use their natural resourceendowments in a growth-enhancing manner, but promotingdemocracy would increase the probability that the resource-
rich countries are in the environment in which naturalresources could be beneficial for their development. This lastpoint supports the ‘neocon agenda’ defined by Selden (2004)that emphasizes the importance of encouraging democratic
institutions in resource-rich economies.Our analysis has only examined the direct impact of natural
resources. Future work on the link between natural resources
and economic development should consider the indirectmechanisms through which resource curse may operate in amultiple-growth-regimes framework. For example, regime
membership may be crucial for whether or not resourcescrowd-out human capital investment. Such a question could beaddressed using a simultaneous equations model within themixture of regressions approach proposed by this article.
Acknowledgements
I am grateful to Emmanuel Flachaire and Cecilia GarciaGarcıa-Penalosa for helpful suggestions and comments.
I would also like to thank Theo Eicher, Fabian Gouret andMichel Lubrano, as well as the participants at the EuropeanDoctoral Group in Economics, Bocconi, 2011, the Association
of Southern European Economic Theorists, Evora, 2011 andthe Royal Economic Society Conference, Cambridge, 2012.This work was partly supported by the French National
Research Agency Grant ANR-08-BLAN-0245-01.
References
Acemoglu, D., Johnson, S. and Robinson, J. A. (2005) Institutionsas the fundamental cause of long-run economic growth,in Handbook of Economic Growth (Eds) P. Aghion andS. Durlauf, North Holland, Amsterdam, pp. 385–472.
Alexeev, M. and Conrand, R. (2009) The elusive curse of oil, TheReview of Economics and Statistics, 91, 586–98.
Andersen, J. and Aslaksen, S. (2008) Constitutions and theresource curse, Journal of Development Economics, 87,227–46.
Bardhan, P. (1997) Corruption and development: a review of theissues, Journal of Economic Literature, 35, 1320–46.
Barro, R. and Lee, J.-W. (2010) A new data set of educationalattainment in the world, 1950–2010, NBER Working PaperNo. 15902.
Bos, J., Economidou, C., Koetter, M. and Kolari, J. (2010) Do allcountries growth alike?, Journal of Development Economics,91, 113–27.
Bravo-Ortega, C. and de Gregorio, J. (2007) The relative richnessof the poor? Natural resources, human capital and economicgrowth, in Natural Resources: Neither Curse nor Destiny(Eds) D. Lederman and W. F. Maloney, The World Bankand Stanford University Press, Washington, pp. 71–99.
Burnham, K. and Anderson, D. (2002) Model Selection andMultimodel Inference: A Practical Information-theoreticApproach, 2nd edn, Springer-Verlag, Colorado, USA.
Collier, P. and Hoeffler, A. (2009) Testing the neocon agenda:democracy in resource-rich societies, European EconomicReview, 53, 293–308.
Corden, W. M. (1984) Booming sector and Dutch diseaseeconomics: survey and consolidation, Oxford EconomicsPapers, 36, 359–80.
Dempster, A. P., Laird, N. M. and Rubin, D. B. (1977) Maximumlikelihood from incomplete data via EM algorithm (withdiscussion), Journal of the Royal Statistical Society B, 39,1–38.
Durlauf, S. and Johnson, P. A. (1995) Multiple regimes and cross-country behavior, Journal of Applied Econometrics, 10,365–84.
Eicher, T. and Leukert, A. (2009) Institutions and economicperformance: endogeneity and parameter heterogeneity,Journal of Money, Credit and Banking, 41, 197–219.
Flachaire, E., Garcia-Penalosa, C. and Konte, M. (2011). Politicalversus economic institutions in the growth process, CESifoWorking Paper No. 3432.
Glaeser, E., La Porta, R., Lopez-de-Silanes, F. and Shleifer, A.(2004) Do institutions cause growth?, Journal of EconomicGrowth, 9, 271–303.
Gylfason, T. (2001) Natural resources, education, and economicdevelopment, European Economic Review, 45, 847–59.
Konte, M. (2012) A curse or a blessing? Natural resources in amultiple growth regimes analysis, AMSE Working PaperNo. 18.
Kourtellos, A., Stengos, T. and Tan, C. M. (2011) Structuralthreshold regression, The Rimini Centre for EconomicAnalyses Working Paper No. WP 11-49.
Leite, C. and Weidmann, J. (2002) Does mother nature corrupt?Natural resources, corruption, and economic growth,in Governance, Corruption and Economic Performane (Eds)G. T. Abed and S. Gupta, International Monetary Fund,Washington, DC, pp. 71–99.
Manzano, O. and Rigobon, R. (2007) Resource curse ordebt overhang?, in Natural Resources: Neither Curse norDestiny (Eds) D. Lederman and W. F. Maloney, TheWorld Bank and Stanford University Press, Washington,pp. 41–70.
Mehlum, H., Moene, K. and Torvik, R. (2006) Institutions andresource curse, The Economic Journal, 116, 1–20.
Owen, A., Videras, J. and Davis, L. (2009) Do all countries followthe same growth process?, Journal of Economic Growth, 14,265–86.
Papyrakis, E. and Gerlagh, R. (2004) The resource cursehypothesis and its transmission channels, Journal ofComparative Economics, 32, 181–93.
Papyrakis, E. and Gerlagh, R. (2007) Resource abundance andeconomic growth in the United States, European EconomicReview, 51, 1011–39.
Ploeg, F. V. D. (2011) Natural resources: curse or blessing?,Journal of Economic Literature, 49, 366–420.
Sachs, J. and Warner, A. (1999) The big push, natural resourcebooms and growth, Journal of Development Economics, 59,43–76.
Sachs, J. and Warner, A. (2001) The curse of natural resources,European Economic Review, 45, 827–38.
Schwarz, G. (1978) Estimating the dimension of a model, Annalsof Statistics, 6, 461–4.
Selden, Z. (2004) Neoconservatives and American mainstream,Hoover Institution Policy Review, 124.
Vaio, G. D. and Enflo, K. (2001) Did globalizationdrive convergence? Identifying cross-country growthregimes in the long-run, European Economic Review,55, 832–44.
Natural resources in a multiple growth regimes analysis 3769
Dow
nloa
ded
by [
Uni
vers
ity o
f W
ater
loo]
at 1
4:13
06
Nov
embe
r 20
14