a. cruise narrative: p08s - national oceanographic data ... · a. cruise narrative: p08s a.1. ......
TRANSCRIPT

A. Cruise Narrative: P08S
A.1. HighlightsWHP Cruise Summary Information
WOCE section designation P08SExpedition designation (EXPOCODE) 49XK9605
Chief Scientist(s) and their affiliation Noriya Yoshioka*; Djoko Hartoyo**Dates 1996.06.17 - 1996.07.02
Ship R/V KaiyoPorts of call Yokosuka, Japan-Korol, Palau
Number of stations 27
Geographic boundaries of the stations10° 0.04' N
129° 56.6' E 130° 5.81' E45' N
Floats and drifters deployed noneMoorings deployed or recovered none
Contributing Authors Y.Kashino, S.Ishida, N.Yoshioka, H.Yoritaka, H.Yamamoto,M.Hayashi, K.Katayama, S.Kanda, A.Ito, M.Aoki, T.Shiribiki,M.Fujisaki, Y.Nogiwa, K.Nakao, N.Komai, C.Saito, K.Shitashima,D.Tsumune, S.Kraines, N.Harada, R.Key
*Chief ScientistJapan Marine Science and Technology Center
(JAMSTEC)2-15, Natsushima-cho, Yokosuka, 237 Japan
Tel: +81-468-66-3811Fax: +81-468-65-3202
**Co-Chief ScientistBadan Pengajian Dan Penerapan Teknologi (BPPT)BPPT Main Building 18F, Jl. MH. Thamrin 8,Jakarta, 10340 IndonesiaTel: +62-21-3169706 Fax: +62-21-3169720E-mail: [email protected]

WHP Cruise and Data Information
Instructions: Click on any item to locate primary reference(s) or usenavigation tools above.
Cruise Summary Information Hydrographic Measurements
Description of scientific program CTD - generalCTD - pressure
Geographic boundaries of the survey CTD - temperatureCruise track (figure) CTD - conductivity/salinityDescription of stations CTD - dissolved oxygenDescription of parameters sampledBottle depth distributions (figure) SalinityFloats and drifters deployed OxygenMoorings deployed or recovered Nutrients
CFCsPrincipal Investigators for all measurements HeliumCruise Participants Tritium
RadiocarbonProblems and goals not achieved CO2 system parametersOther incidents of note Other parameters
Underway Data Information Acknowledgments
Navigation ReferencesBathymetryAcoustic Doppler Current Profiler (ADCP) DQE ReportsThermosalinograph and related measurements C XBT and/or XCTD 14CMeteorological observations CO2Atmospheric chemistry data CFCs
14C
Data Processing Notes

100˚E
100˚E
110˚E
110˚E
120˚E
120˚E
130˚E
130˚E
140˚E
140˚E
150˚E
150˚E
160˚E
160˚E
10˚S 10˚S
0˚ 0˚
10˚N 10˚N
20˚N 20˚N
30˚N 30˚N
.10
.20
Station locations for P08S
Produced from .sum file by WHPO-SIO
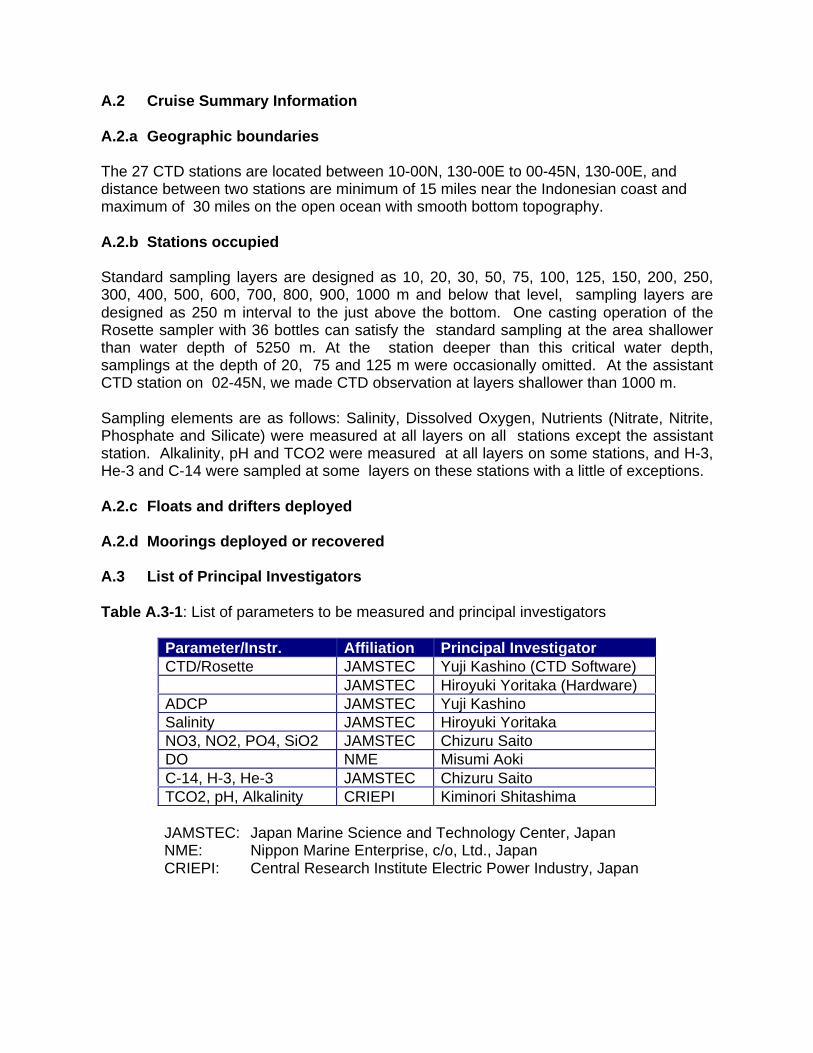
A.2 Cruise Summary Information
A.2.a Geographic boundaries
The 27 CTD stations are located between 10-00N, 130-00E to 00-45N, 130-00E, anddistance between two stations are minimum of 15 miles near the Indonesian coast andmaximum of 30 miles on the open ocean with smooth bottom topography.
A.2.b Stations occupied
Standard sampling layers are designed as 10, 20, 30, 50, 75, 100, 125, 150, 200, 250,300, 400, 500, 600, 700, 800, 900, 1000 m and below that level, sampling layers aredesigned as 250 m interval to the just above the bottom. One casting operation of theRosette sampler with 36 bottles can satisfy the standard sampling at the area shallowerthan water depth of 5250 m. At the station deeper than this critical water depth,samplings at the depth of 20, 75 and 125 m were occasionally omitted. At the assistantCTD station on 02-45N, we made CTD observation at layers shallower than 1000 m.
Sampling elements are as follows: Salinity, Dissolved Oxygen, Nutrients (Nitrate, Nitrite,Phosphate and Silicate) were measured at all layers on all stations except the assistantstation. Alkalinity, pH and TCO2 were measured at all layers on some stations, and H-3,He-3 and C-14 were sampled at some layers on these stations with a little of exceptions.
A.2.c Floats and drifters deployed
A.2.d Moorings deployed or recovered
A.3 List of Principal Investigators
Table A.3-1: List of parameters to be measured and principal investigators
Parameter/Instr. Affiliation Principal InvestigatorCTD/Rosette JAMSTEC Yuji Kashino (CTD Software)
JAMSTEC Hiroyuki Yoritaka (Hardware)ADCP JAMSTEC Yuji KashinoSalinity JAMSTEC Hiroyuki YoritakaNO3, NO2, PO4, SiO2 JAMSTEC Chizuru SaitoDO NME Misumi AokiC-14, H-3, He-3 JAMSTEC Chizuru SaitoTCO2, pH, Alkalinity CRIEPI Kiminori Shitashima
JAMSTEC: Japan Marine Science and Technology Center, JapanNME: Nippon Marine Enterprise, c/o, Ltd., JapanCRIEPI: Central Research Institute Electric Power Industry, Japan

A.4 Scientific Program and Methods
The principal objectives of the cruise were:
• To submit a data set to the WHPO, and contribute the global measurement of theWOCE program.
• To investigate southward intrusion of low salinity water (<34.5 pss-78), which may beadvected from the North Pacific ocean to a layer below the high salinity Tropical Pacificwater. CTD point at 02-45N, 130-00E was added for this sake.
A.5 Major Problems and Goals not Achieved
At Stn.12 (05-30N,130-00E) on June 26, we encountered a trouble with damage on afiber of armored-wire of the CTD cable. After this accident, irregular winding of the CTDcable over 5000 m long on the winch wheel was occurred. But there was no influence onthe CTD signal, we could carried out all of the originally planned CTD observations onschedule.
A.6 Other Incidents of NoteA.7 List of Cruise Participants
Table A.7-2. Cruise Participants
Name Affiliation ParameterNoriya Yoshioka JAMSTEC CTDHiroyuki Yoritaka JAMSTEC Salinity/CTD HardwareYuji Kashino JAMSTEC CTD Software /ADCPHirofumi Yamamoto JAMSTEC CTDChizuru Saito JAMSTEC Nutrients/C-14/H-3/He-3Naomi Harada JAMSTEC C-14/H-3/He-3Misumi Aoki NME DOHiroshi Yamamoto NME CTDAtsuo Ito NME SalinityMitsuru Hayashi NME SalinityMasayuki Fujisaki NME DONobuharu Komai NME NutrientsTakeshi Katayama NME CTDSatoru Kanda NME CTDTakehiko Shiribiki STM DOYasuko Nogiwa KEEC NutrientsKiyotaka Nakao KEEC NutrientsKiminori Shitashima CRIEPI TCO2/pH/AlkalinityDaisuke Tsumune CRIEPI TCO2/pH/AlkalinitySteven B. Kraines CRIEPI TCO2/pH/AlkalinityDjoko Hartoyo BPPT CTDR.Trimanadi BPPT CTDVictoriano C.Buquir c/o NAMRIA (Philippine) CTD

JAMSTEC: Japan Marine Science and Technology Center, JapanNME: Nippon Marine Enterprises, c/o Ltd., JapanSTM: Sanyo Techno Marine, Inc., JapanKEEC: Kansai Environmental Engineering Center, c/o Ltd., JapanCRIEPI: Central Research Institute of Electric Power Industry, JapanBPPT: Badan Pengkajian dan Penerapan Teknologi, Indonesia
B. Underway Measurement
B.1 Navigation and bathymetry (Echosounding)(Y.Kashino)19 November 1996
The water depth obtained by the multi-narrow beam echo-sounder (General Instrument)and corrected depth are summarized in Table B.1-1. The corrected depth are derived fromCTD depth plus altimeter value. This result shows tendency of decrease of its difference.After Stn.18, the depth measured from echosounding is larger than corrected depth.
Except at few stations, the differences are less than +/- 1.0 %.
Table B.1-1: The differences between corrected water depth and uncorrectedechosounding depth. The values of the corrected depths are derived fromCTD depth plus altimeter value.
StationNumber
CorrectedDepth(meter)
Echosounding(uncorrected)
(meter)
Diff.(meter)
01 5939 5913 2602 5751 5761 -1003 6005 5942 6304 5924 5865 5905 5963 5978 -1506 6002 5827 17507 5662 5612 5008 5537 5520 1709 5549 5520 2910 5549 5526 2311 5488 5476 1212 5466 5450 1613 5039 5038 1
StationNumber
CorrectedDepth(meter)
Echosounding(uncorrected)
(meter)
Diff.(meter)
14 4856 4845 1115 4693 4709 -1616 3703 3615 8817 3885 3886 -118 3005 3016 -1119 ---- 3032 ----20 4000 4023 -2321 4308 4317 -922 4394 4396 -223 3862 3890 -2824 4121 4113 825 ---- 3299 ----26 3003 3022 -1927 1451 1514 -53

B.2 Acoustic Doppler Current Profiler (ADCP)(Y.Kashino)2 September 1996
a. SystemThe RD narrow band Acoustic Doppler Current Profiler (ADCP) by RD Instruments wasused to observe current structure along the cruise track from Yokosuka to Palau includingsouth of P8 line. This ADCP transmits 75KHz acoustic pluses from the transducer along 4beams angled of 30 degree.
The ADCP was controlled by the software "TRANSECT" developed by RD Instruments onIBM PS/V model 2408.
b. Data processingRaw data was acquired every a minute at 51 layers from 30m to 830m every 16m. Wereport averaged data every 10 km for all layers. Data processing was done as follows:
1) Convert binary data to ASCII processed data outputted every one minute usingTRANSECT.
2) Remove noise from processed data. The noise is defined as follows:• Data during the period of ship velocity of < 5 knot with 10 minutes before and after.• Data with vertical averaged velocity (from 30m depth to the depth where data is
available) of > 1.0 m/s, which is probably derived from GPS error.• Data with percent good of < 50.• Data with its difference from 24 samples average of > 3 sigma.
3) Calculate average velocity every 10 km segment.
The format of averaged data is shown in Table B.2-1. Unit of velocity is (m/sec).
We did not correct the gyrocompass error because it was less than 0.2 degree when wecheck it in Palau. We did not also correct the error from beam angle setting error becausewe could not find systematic error when we checked the data obtained during the cruiseconducted in January, 1996.
c. Primary resultThe meridional and zonal velocity section plot along P8 line and vector plot at 50m and350m level are shown in Fig. F.1-10, F.1-11, F.2-1 and F.2-7 using averaged data. Wecan see anticyclonic Halmahera eddy clearly. We can also see the low salinity water fromthe North Pacific advected by southward flow below the South Pacific Tropical Watercomparing meridional velocity section and salinity section along P8 line.

Table B.2-1 Format of averaged data in 10km segments.
Line Field DescriptionFollowing five lines are header of this file.
A 1 Expocode and cruise dateB 1 Place where observation was started and endedC 1 Length of the segment for averaging and the number of segmentsD 1 Number, range, and thickness of layerE 1 Separator
Following are written each 10 km segments. -9.0 is assigned for "bad data" or "nodata". The first five lines contain the information of segment (e.g., number ofsegment, location of center of segments). Starting line 6, information in columnsbased on the bin depth is written.
1 1 Serial number of segment.2 Number of samples used for averaging location.
2 1 Mean time (UT) - Month2 - Day3 - Year4 - Hour5 - Minute
3 1 Location - Latitude2 - Longitude
4 1 Name of fields written below line 65 1 Unit of fields written below line 66 1 Depth (m)
2 Velocity magnitude (m/sec)3 Velocity direction (degree)4 East velocity component (m/sec) - east(+)/west(-)5 North velocity component (m/sec) - north(+)/south(-)6 Number of samples used for averaging value in this layer
B.3 Thermosalinograph and underway dissolved oxygen, fluorometer, etc.
B.4 XBT and XCTD
B.5 Meteorological observations(S.Ishida, Captain of R/V KAIYO and N.Yoshioka)September 1996
Routine weather observation with 24 hours intervals are carried out on our cruise.Aneroid barometer (Yanagi INSTRUMENT,TYPE 8A,S/N 6869) at the 13.7 m height fromsea surface was used. Wind vane and anemometer (Ogasawara keiki, PR350) is at theheight of 27.2 m and wind force is estimated by handy calcurater. Sea water pumped upfrom the depth of 4.8 m is measured its temperature, and air temperature was measured

with a ventilated psychrometer (Ohta keiki,S/N 221705). These instruments were notcalibrated except the barometer which was calibrated on July.4,1994.
YYMMDD/HH(UST)
DEGMIN (N)
DEG MIN(E)
DIR FOR WEA. BAR. AR.T SST
960623/03 10.06 N 130.03 E ENE 1 C 1008.6 25.5 29.0960624/03 08.59 N 129.59 E CLM - BC 1009.8 32.4 29.0960625/03 07.30 N 130.00 E SSW 2 BC 1009.3 29.8 29.0960626/03 06.00 N 130.00 E NW 2 BC 1012.8 31.8 29.0960627/03 04.10 N 130.00 E SSE 2 BC 1010.6 31.2 29.0960628/03 02.45 N 130.00 E SE 4 R 1013.8 26.0 29.0960629/03 01.56 N 130.00 E ESE 2 BC 1010.5 31.1 28.0960630/03 01.00 N 130.00 E NE 4 Q 1011.2 28.0 28.0960701/03 03.42 N 131.17 E E 1 C 1011.0 30.5 28.0
B.6 Atmospheric chemistry
C. Hydrographic Measurements - Descriptions, Techniques and Calibrations
C.1 Sampling/measurements equipments(H.Yoritaka)September 1996
Small-Volume Sampling 36-place rosettes with 12-liter bottles.CTD System SBE-911plus CTD System with altimeter and O2 sensor.Winch and Cable Tsurumi Seiki TS-10PVCTD winches having 8000 meters
cable of 10.6 mm diameter. The maximum rolling load is3800 kg x 47 m/minute. ADCP shipboard RD narrow bandADCP at 75 kHz.
Salinometer Guildline Autosal 8400B with HP 2804A quarts thermometer.Oxygen Analysis Carpenter method. Automated potentiometric and
photometric titration. Two lags of Metrohm 716 DMS Titrino.Nutrient Analysis Bran Luebbe Traacs 800 4 channels systems.TCO2 UIC Carbon choulometer System 140pH RC PHM93 reference pH meterAlkalinity RC VIT90 Video Titrator, ABU91 Autoburette and SAM90
Sample Station

C.2 CTD/Rosette hardware(H.Yoritaka, Y.Kashino, H.Yamamoto, M.Hayashi, K.Katayama and S.Kanda)September 1996
1. Instruments
SBE9plus CTD for 10,500 meters with the 12-liters 36-positions intelligent GO rosettewater sampler (GO1016) was used during the cruise. CTD system was constructed withfollowing sensors ;
Sensor Model Primary SecondaryTemperature SBE3 S/N 1462 S/N 1465Conductivity SBE4 S/N 1045 S/N 1174Oxygen SBE13 S/N 0311Pressure Digiquarts S/N 41223Pump SBE5 S/N 0846 S/N 0847Altimeter Bentos 2110-1 DATASONIC PSA-900A
Temperature and Conductivity sensors were rinsed with fresh water and pure water aftereach casts, and were rinsed with Triton-X detergent after each two casts.
In each thermometer frames attached on the Niskin bottles for odd number (18 bottles),two SIS digital reversing thermometers and SIS digital reversing pressure meter wasfitted. The wire was a single conductor 10.6 mm armored cable manufactured byRochester Corporation, and the winch was built by Tsurumi Seiki Japan.
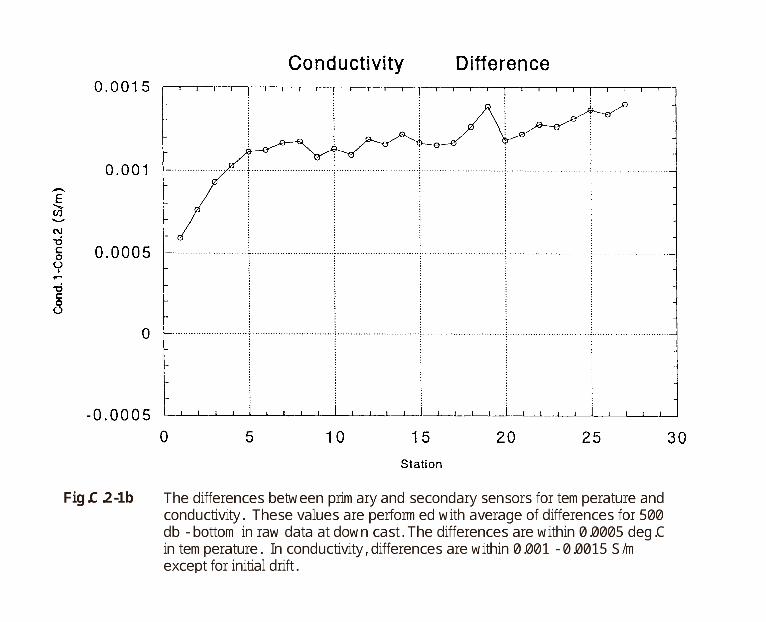
2. CTD Sensors Performance
The differences between primary and secondary sensors for temperature andconductivity are shown in Fig.C.2-1. These values are performed with average ofdifferences for 500 db - bottom in raw data at down cast. The differences are within0.0005 deg.C in temperature. In conductivity, differences are within 0.001 - 0.0015 S/mexcept for initial drift.
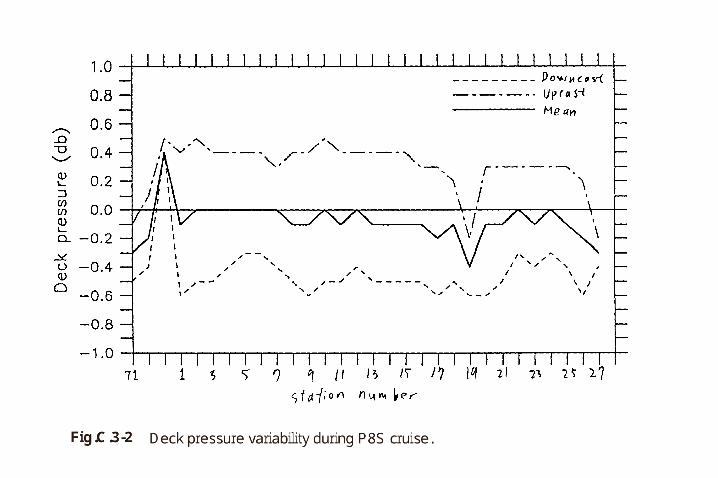
The change of the deck pressure is shown in Fig.C.2-2. While the deck pressure at pre-cast varies within -0.6 - -0.3, it varies within +0.2 - +0.5 at post-cast except for the shallowcasts (St.19: 1000db, St. 27: 1500db). The deck pressure had a hysteresis within 0.6 -1.0 db at the deep casts.
3. CTD Sensor Calibration
The calibrations of the temperature and conductivity sensors were conducted byNorthwest Regional Calibration Center, USA on April 1996 (pre-cruise calibration) and onAugust 1996 (post-cruise calibration). The drift of temperature relative to the pre-cruisecalibration during these 4 months was reported to be -1.01 mdeg.C for the primarytemperature sensor. This tendency was consistent with previous calibrations. According

to this result, the drift for the primary temperature sensor during the cruise was estimatedto be -0.5 mdeg.C.
The calibration of the pressure sensor was carried out by ourselves on June 1996 (pre-cruise calibration) and on October 1996 (post-cruise calibration) with dead-weight testermanufactured by Bundenberg Co. Ltd.. Fig.C.2-3 shows difference in pressure betweendead-weight tester and CTD calculated with initial coefficients at the factory. Differencebetween pre-cruise and post- cruise calibration was less than 0.37 db. And hysteresis ineach pressure was less than 0.14 db. So the linear coefficient 0.99900 derived from thepost- cruise calibration was adopted for correction.
C.3 CTD data processingY.Kashino2 September 1996
Introduction
The CTD data was acquired by SBE 911 plus system with frequency of 24 Hz. This datawas processed using SEASOFT Ver 4.207 provided by Sea-Bird Electronics Inc. andsome programs developed in JAMSTEC coded in FORTRAN (Microsoft FORTRANcompiler was used).
We report temperature and salinity value from primary sensors, pressure value frompressure sensor in WOCE-CTD-file, although we used twin temperature and conductivitysensors, pressure sensor, and DO sensor. We used the result from secondary sensors tocheck up one from primary sensors. We don't report the result from DO sensor becausewe haven't established calibration method of DO-sensor.
We don't also report the data when CTD was near surface (upper than 15 db) because thepump of CTD was not active then.
CTD-file are created using downcast CTD data. We used upcast CTD data for data checkand calculation of CTD T/S/P value in WOCE-SEA-file.
Pre-cruise and post-cruise calibration for temperature and conductivity sensors werecarried out at NRCC (Northwest Regional Calibration Center) in USA on 23 April 1996 and31 August 1996. Pre-cruise and Post-cruise calibration for pressure sensor by deadweight tester was carried out at JAMSTEC on 6 June 1996 and 4 October 1996. Wecheck up and calibrated CTD data considering these result.
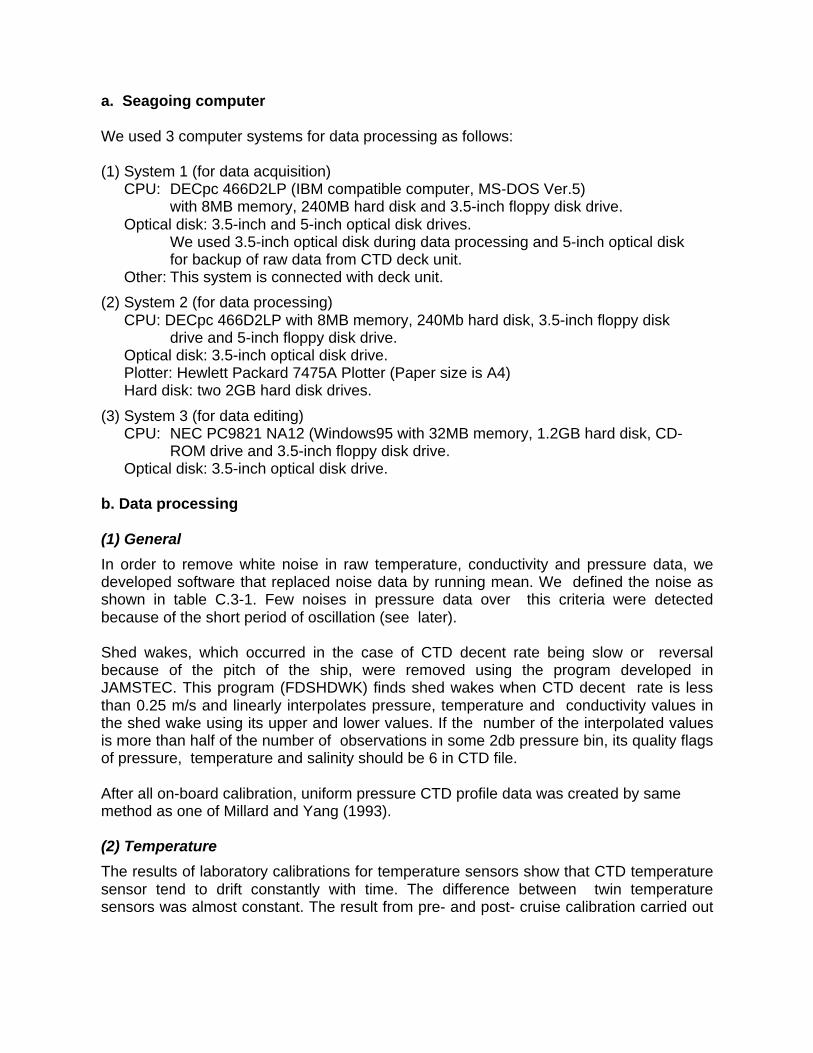
a. Seagoing computer
We used 3 computer systems for data processing as follows:
(1) System 1 (for data acquisition)CPU: DECpc 466D2LP (IBM compatible computer, MS-DOS Ver.5)
with 8MB memory, 240MB hard disk and 3.5-inch floppy disk drive.Optical disk: 3.5-inch and 5-inch optical disk drives.
We used 3.5-inch optical disk during data processing and 5-inch optical diskfor backup of raw data from CTD deck unit.
Other: This system is connected with deck unit.
(2) System 2 (for data processing)CPU: DECpc 466D2LP with 8MB memory, 240Mb hard disk, 3.5-inch floppy disk
drive and 5-inch floppy disk drive.Optical disk: 3.5-inch optical disk drive.Plotter: Hewlett Packard 7475A Plotter (Paper size is A4)Hard disk: two 2GB hard disk drives.
(3) System 3 (for data editing)CPU: NEC PC9821 NA12 (Windows95 with 32MB memory, 1.2GB hard disk, CD-
ROM drive and 3.5-inch floppy disk drive.Optical disk: 3.5-inch optical disk drive.
b. Data processing
(1) General
In order to remove white noise in raw temperature, conductivity and pressure data, wedeveloped software that replaced noise data by running mean. We defined the noise asshown in table C.3-1. Few noises in pressure data over this criteria were detectedbecause of the short period of oscillation (see later).
Shed wakes, which occurred in the case of CTD decent rate being slow or reversalbecause of the pitch of the ship, were removed using the program developed inJAMSTEC. This program (FDSHDWK) finds shed wakes when CTD decent rate is lessthan 0.25 m/s and linearly interpolates pressure, temperature and conductivity values inthe shed wake using its upper and lower values. If the number of the interpolated valuesis more than half of the number of observations in some 2db pressure bin, its quality flagsof pressure, temperature and salinity should be 6 in CTD file.
After all on-board calibration, uniform pressure CTD profile data was created by samemethod as one of Millard and Yang (1993).
(2) Temperature
The results of laboratory calibrations for temperature sensors show that CTD temperaturesensor tend to drift constantly with time. The difference between twin temperaturesensors was almost constant. The result from pre- and post- cruise calibration carried out

on 23 April and 31 August shows that the drift of the primary temperature sensor was -0.0010 (deg C). Considering these result, we could estimate that offset correction addedto the value of primary temperature sensor was +0.0005 (deg C) during this cruise.
Laboratory calibration carried out on IPTS-68 unit, we converted raw temperature valueon IPTS-68 to ITS-90 unit using formula (3) of Millard and Yang (1992) after the offsetcorrection.
(3) Conductivity (salinity) value was corrected as follows:
Step 1. Sensor response correction.
According to Millard and Yang (1993), salinity spikes are caused by sensor responselag between temperature and conductivity. We checked this time lag between T and Csensors for SBE 911 plus system and determined it when total salinity spike area (S)defined as follows was minimum.
S = (PLi − PUi)Hi.i =1
N
∑
N is the number of spike, P is pressure, H is height of spike and suffix U and L meanupper and lower boundary of spike. Fig.C.3-1 is result at the test cast conductedbefore 8S-01. The results show that time lag should be 0.4 steps, that is, 0.0167seconds. We used ALIGNCTD of SEASOFT for this correction throughout this cruise.
Even if sensor response correction is done, the salinity spikes still remain. When wefind a salinity spike lager than 0.01 PSU in some 2db pressure bin,quality flag ofsalinity should be 3 in CTD file.
Step 2. Cell thermal mass correction.
Sea-Bird Electronics Inc. recommend that conductivity cell thermal mass effect shouldbe removed. We used CELLTM of SEASOFT to remove this effect.
This utility uses recursive filter described in Lueck (1990).
Step 3. Cell factor correction.
We used Autosal to calibrate CTD conductivity sensor. We determined cell factor bylinear regression between CTD conductivity when bottle was fired and conductivity ofsampled water measured by Autosal for every casts. CTD conductivity was correctedusing the equation as follows:
Ccalibrated = A x Craw + B.
A and B are slope and offset, respectively.

(4) Pressure
The result of pre-cruise calibration conducted on 4 June by dead weight tester isshown in Fig.C.3-2 . It indicates that the difference between CTD and dead weighttester values was linearly increased. This difference is corrected by regression line withslope and offset of 0.99899 and 5.15870. The error from the approximation using thisregression is lower than 0.2 db. The slope and offset shifted to 0.99901 and 4.88735 at2 October. The estimation of shift of pressure value using these result is 0.3 dbbetween pre-cruise and post-cruise. We do not correct this shift.
The pre- and post-cruise calibration result also showed that hysteresis is 0.1 db. Thiserror is not also corrected.
Raw data from pressure sensor has short period (<0.2 seconds) oscillation. We usedFILTER of SEASOFT and filtered this oscillation by low pass filter that time constantwas 0.15 seconds.
The variability of deck pressure was shown in Fig.C.3-3. The deck pressure isincreased up 0.4 - 1.0 db after cast. CTD pressure value is subtracted by the averageof the deck pressure before and after cast.
c. Data flow (See Fig.C.3-4)
(1) SEASAVE (SEASOFT)Acquires, displays and saves raw data from deck unit to disk.
(2) DATCNV (SEASOFT)Converts raw, binary data output by SEASAVE to ASCII format data written onphysical unit. When water is sampled, this program can output data to .ROS filefrom that time after a few seconds. (On this cruise, this interval was 10 seconds.)
(3) ROSSUM (SEASOFT)Edits .ROS file output by DATCNV and writes out a summary file to .BTL file.
(4) BT2FILE (Made in JAMSTEC)Changes the format of .BTL data to another format for convenience.
(5) SPLDEP (Made in JAMSTEC)Splits ASCII format data by DATCNV into up- and downcast data, and calculatesdeck pressure and corrected depth values.
(6) TCCOMP (Made in JAMSTEC)Compares values of primary and secondary sensors, and plots histograms to checksensor's performance.
(7) NOISE (Made in JAMSTEC)Finds noise data and replaces it by running mean. This program can removeunnecessary surface data.
(8) ALIGNCTD (SEASOFT)Corrects time lag between temperature sensor and conductivity sensor forminimizing salinity spiking error.
(9) FILTER (SEASOFT)Uses low pass filter to remove short period oscillation in pressure data.

(10) CELLTM (SEASOFT)Corrects conductivity cell thermal effect using a recursive filter.
(11) FDSHDWK (Made in JAMSTEC)Finds shed wake and interpolates data using the values of its upper and lowerboundary.
(12) FSPIKE (Made in JAMSTEC)Finds salinity spike.
(13) CALBC (Made in JAMSTEC)Calibrates conductivity data by cell factor correction. This program also corrects thetemperature sensor drift and deck pressure of the CTD data reported in WOCE-SEA file.
(14) AVGDAT (Made in JAMSTEC)Calculates 2db pressure averaged data. After averaging, this program corrects thetemperature sensor drift and deck pressure of the CTD data.
(15) MKCTD (Made in JAMSTEC)Creates WOCE-CTD file.
d. Conclusion
We could acquire high quality CTD data satisfying WOCE requirement except for the binwhere salinity spikes and shed wakes were. Estimated accuracy of CTD pressure,temperature and salinity is as follows:
(1) PressureConsiderable error of CTD pressure value is 1) 0.2 db from regression, 2) 0.3 db from theshift from pre-cruise to post-cruise, 3) 0.1 db from hysteresis, and 4) 0.4 db from deckpressure variability. Therefore, accuracy of CTD pressure value is 1 db during P8Scruise.
(2) TemperatureAccuracy of temperature value should be 0.001 K because the drift of temperature sensorshown by pre- and post-cruise calibration is 0.0010 K, and twin sensor check shows thatprimary temperature sensor performed satisfactorily.
(3) SalinityComparison between CTD salinity and sampled water salinity is shown in Table C.3-2.This result implies that the accuracy of CTD salinity is higher than 0.001 PSU below 500db.
References
1) Millard,R., and K.Yang: CTD calibration and processing methods used at Woods HoleOceanographic, Institution, WHOI Tech. Rep. 93-44, 1993.
2) Lueck,R.,: Thermal Inertia of conductivity cell: Theory, J.Atoms.Oceanic Technol., 7,741-755, 1990.

Table C.3-1. Definition of noisePressure Temperature Conductivity
(db) (deg C) (S/m)1. Range 0.5 < or 8000 > 0 < or 32 > 2 < or 8 >2. Difference from value in
a previous step value1.0 > 0.5 > 0.05 >
3. Difference from running mean(a) 0 - 400m 0.5 > 1.0 > 0.1 >(b) 400 - 1000m 0.5 > 0.2 > 0.02 >(c) 1000 - 2000m 0.5 > 0.1 > 0.01 >(d) 2000 - bottom 0.5 > 0.05 > 0.005 >
Table C.3-2. Average, root mean squire and maximum of absolute value of the differencebetween CTD salinity and Autosal salinity
depth average RMS maximum No. of sample(db) (PSU) (PSU) (PSU)
0 - 500 -0.00582 0.02771 0.1802 307500 - 2000 -0.00020 0.00081 0.0046 247
2000 - bottom 0.00014 0.00057 0.0018 325
C.4 Sample water salinity measurements(H.Yoritaka, A.Ito and M.Hayashi)September 1996
1. Salinity Sample CollectionThe bottles in which the salinity samples are collected and stored are 250ml Phoenixbrown glass bottles with screw caps. Each bottles were rinsed three times and filled withsample water. Salinity samples were stored for about 24 hours in the same laboratory asthe salinity measurement was made.
2. Instruments and MethodThe salinity analysis was carried out by a Guildline Autosal Salinometer model 8400B,which was modified by addition of an Ocean Science International peristaltic-type sampleintake pump and Hewlett Packard quartz thermometer model 2804A with two 18111Aquartz probes. One probes measured an ambient temperature and another probemeasured a bath temperature. The resolution of the quartz thermometer was set to0.001 deg C. Data of both the salinometer and the thermometer was collectedsimultaneously by a personal computer. A double conductivity ratio was defined as amedian of 31 readings of the salinometer. Data collection was started after 5 secondsand it took about 10 seconds to collect 31 readings by a personal computer.

The salinometer was operated in the airconditioned ship's laboratory at a bathtemperature of 27 deg C. An ambient temperature varied from approximately 25 to 26deg C, while a variation of a bath temperature was almost within +/- 0.004 deg C.
3. Standard Sea WaterAutosal model 8400B was standardized only before sequence of measurements by use ofIAPSO Standard Seawater batch P128 whose conductivity ratio was 0.99986. After thestandardization, 8400B was monitored by 1-4 SSW ampules before and after themeasurements for samples of one station. Total 61 ampules of SSW were measured formonitoring, whose standard deviation was 0.0005 psu. There was slight drift for 8 days(from June 24 to July 1) in monitoring of SSW, so correction was carried out for samplemeasurements as follows;
• Station 01-15: Corrected Value = Measured Value -0.0000 psu (0 digit)• Station 16-20: Corrected Value = Measured Value -0.0002 psu (1 digit)• Station 21-27: Corrected Value = Measured Value -0.0004 psu (2 digits)
After correction, standard deviation for SSW was slightly improved as 0.0004 psu.
4. Duplicate and Replicate SamplesDuplicate samples were drawn from Niskin bottles #1 and #2 which were tripped at thebottom, and also drawn from different Niskin bottles which were tripped at 1000 db incase of shallower water depth than 5000 m. Replicate samples were drawn from Niskinbottles #2. Standard deviation in the measurements of duplicate and replicate sampleswere as follows ;
Duplicate Bottom 0.0002 psu 26 pairs1000 db 0.0002 psu 4 pairs
Replicate Bottom 0.0001 psu 25 pairs.
C.5 Dissolved Oxygen determination(M.Aoki , T.Shiribiki and M.Fujisaki)19, August, 1996
Methods:Oxygen samples were collected from Niskin bottles to calibrated dry glass bottles , andsample water were overflowed by three times of the bottle volume. The subsamplingbottle consists of the ordinary BOD flask (ca. 200 ml) and glass stopper with long nipple,modified from the nipple presented in Green and Carritt (1966).
Dissolved oxygen in seawater samples were fixed immediately following the watertemperature at the time of collection was measured for correction of the sample density.Samples were analyzed about 2 hours later. The end point was determined by thepotentiometric method using whole bottle titration. We used 2 sets of Metrohm titratorswith automatic burettes and Pt electrode (titrator #1 and #2) for DO. measurements. The

average water temperature in the laboratory was 22.8 degC, while room temperaturevaried in several minutes between 20 to 27 degC.
The standardization was done for each stations and whenever the batch of reagents werechanged. An analytical method was fundamentally done according to the WHPOperations and Methods (Culberson,1991). The endpoint was evaluated by the second-derivative curve method with computerization.
Instrument:Dispenser: Eppendorf Comforpette 4800 / 1000 ul
OPTIFIX / 2 mlMetrohm Model 725 Multi Dosimat / 20 ml
Titrator: Metrohm Model 716 DMS Titrino / 10ml of titration vesselPt Electrode / 6.0403.100 (NC)
Software: Data acquisition / Metrohm, METRODATA / 606013.000Endpoint evaluation / written by N88BASIC / MS-DOS(NEC / P9821ne, PC9821na)
Thiosulfate Standardization:We used 3 batches of KIO3 standard solutions (JM960612, JM960613 and CSKKCP8418: see note below Table C.5-1). Standardization was carried out at each stationexcept for stns. 6, 11, 19 and 26. The results using JM960612 KIO3 solution were thatthe average of 1.4016 ml (titrator #1) and 1.4038 ml (titrator #2) and standard deviation of0.0025 ml (#1) and 0.0016 ml (#2) (Fig. C.5-1).
Pure water blanks:The pure water blanks were determined in deionized water (by Milli-RX12, Millipore). Theresults of the pure water blanks were that the average of -0.0092 ml (#1) and -0 .0 09 3 m l( #2 ), an d sta nd a rd d e vi ati on o f 0 .0 0 14 m l ( #1 ) a nd 0.00 1 5 ml (# 2) (Fig . C .5 - 2) .
Dissolved Oxygen in the reagents:DO. in the reagent was reported 0.0017 ml at 25.5 ° C (Murray et. al., 1968). Last cruise,in 1995, we estimated the amount of dissolved oxygen in the reagents that was 0.0027 mlat 21 deg C. In this cruise, we used 0.0027 ml DOrea value for calculation.
Seawater blank:In this cruise, we analyzed 69 samples for determination of seawater blanks. Most ofsamples were taken from the layer of 10m, oxygen minimum and bottom at each station.The result shows wide range of blank value and they are not depended on the depth.
Average of seawater blank was 0.08 µmol/Kg and standard deviation (2sigma) was 0.58µmol/Kg (cf. Fig. C.5-6b). Dissolved oxygen concentrations for the SEA file were notcorrected by water blank.
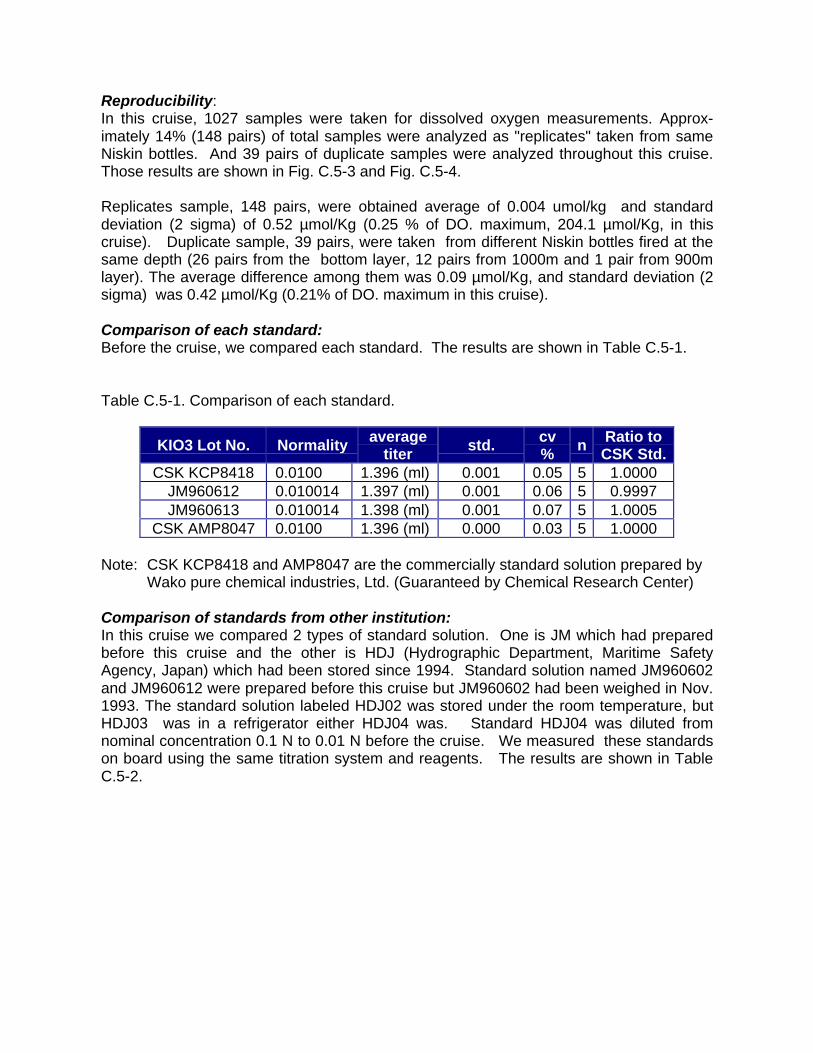
Reproducibility:In this cruise, 1027 samples were taken for dissolved oxygen measurements. Approx-imately 14% (148 pairs) of total samples were analyzed as "replicates" taken from sameNiskin bottles. And 39 pairs of duplicate samples were analyzed throughout this cruise.Those results are shown in Fig. C.5-3 and Fig. C.5-4.
Replicates sample, 148 pairs, were obtained average of 0.004 umol/kg and standarddeviation (2 sigma) of 0.52 µmol/Kg (0.25 % of DO. maximum, 204.1 µmol/Kg, in thiscruise). Duplicate sample, 39 pairs, were taken from different Niskin bottles fired at thesame depth (26 pairs from the bottom layer, 12 pairs from 1000m and 1 pair from 900mlayer). The average difference among them was 0.09 µmol/Kg, and standard deviation (2sigma) was 0.42 µmol/Kg (0.21% of DO. maximum in this cruise).
Comparison of each standard:Before the cruise, we compared each standard. The results are shown in Table C.5-1.
Table C.5-1. Comparison of each standard.
KIO3 Lot No. Normalityaverage
titerstd.
cv%
nRatio toCSK Std.
CSK KCP8418 0.0100 1.396 (ml) 0.001 0.05 5 1.0000JM960612 0.010014 1.397 (ml) 0.001 0.06 5 0.9997JM960613 0.010014 1.398 (ml) 0.001 0.07 5 1.0005
CSK AMP8047 0.0100 1.396 (ml) 0.000 0.03 5 1.0000
Note: CSK KCP8418 and AMP8047 are the commercially standard solution prepared byWako pure chemical industries, Ltd. (Guaranteed by Chemical Research Center)
Comparison of standards from other institution:In this cruise we compared 2 types of standard solution. One is JM which had preparedbefore this cruise and the other is HDJ (Hydrographic Department, Maritime SafetyAgency, Japan) which had been stored since 1994. Standard solution named JM960602and JM960612 were prepared before this cruise but JM960602 had been weighed in Nov.1993. The standard solution labeled HDJ02 was stored under the room temperature, butHDJ03 was in a refrigerator either HDJ04 was. Standard HDJ04 was diluted fromnominal concentration 0.1 N to 0.01 N before the cruise. We measured these standardson board using the same titration system and reagents. The results are shown in TableC.5-2.

Table C.5-2. Comparison of standards between JAMSTEC and HDJ.
KIO3 LotNo.
Normalityaverage
titerstd. cv% n
Ratio toJM960612
JM960602 0.010034 1.402 0.0026 0.19 6 1.0008HDJ02 0.0100 1.392 0.0009 0.07 5 0.9967HDJ03 0.0100 1.392 0.0008 0.05 5 0.9970HDJ04 0.00998 1.405 0.0005 0.04 5 1.0078
JM960612 0.010014 1.398 0.0008 0.06 5 1.0000
Comparison with historical data:This P8S cruise line and PR1S cruise line which carried out in 1994 were lined alonglongitude 130E. There were 14 stations in the same latitude on this line. Dispensers,except for the Eppendorf, and electrodes were changed between these 2 cruises.
DO. concentrationTable C.5-3 shows the differences of dissolved oxygen concentration between P8S andPR-1S every 1000m below 3000m. The difference between them are obtained to 0.2 -0.5% of DO.
Table C.5-3. Comparison of DO. concentration between PR-1S and P8S.
Range PR-1S,1994 P8S, 1996 Ratio of difference(m) µmol/kg std. µmol/kg std. to DO. in 1994(%)
3000 - 4000 148.3 3.23 147.5 3.40 -0.54000 – 5000 151.7 0.87 152.0 0.82 0.2
5000 - 151.7 0.88 152.5 0.40 0.5
Note: DO. concentrations are the average within a range. of Those data are not correctedby seawater blank.
For example, Fig. C.5-5a and C.5-5b show the differences of profile at the same latitude.DO. concentrations above 1000m may show the replace of the water mass.
Seawater blankWe measured seawater blanks from some layers at each station both in 1994 and 1996cruises. The results are shown in Table C.5-4. In both cruise, the values of seawaterblank varied independently of their sampling depth. The methods of analyses werealmost the same as for seawater samples but no fixation.

Table C.5-4. Comparison of seawater blank calculated to DO. concentration.
Line nameseawater blank
umol/kgstd. n
PR-1S, 1994 1.09 0.64 55P8, 1996 0.08 0.29 69
References:
Culberson, C.H. (1991) Dissolved Oxygen, in WHP Operations and Methods, WoodsHole., pp1-15.
Culberson, C.H., G.Knapp, R.T.Williams and F. Zemlyak (1991) A comparison of methodsfor the determination of dissolved oxygen in seawater (WHPO 91-2), Woods Hole.
Dickson, A.G. (1994) Determination of dissolved oxygen in sea water by Winkler titration ,in WHP Operations and Methods, Woods Hole., pp1-14.
Green, E.J. and D.E.Carritt (1966) An Improved Iodine Determination Flask for Whole -bottle Titrations, Analyst, 91, 207-208.
Murray, N., J.P. Riley and T.R.S. Wilson (1968) The solubility of oxygen in Winklerreagents used for the determination of dissolved oxygen, Deep-Sea Res., 15, 237-238.
C.6 Nutrients measurements(Y.Nogiwa, K.Nakao, N.Komai and C.Saito)July, 1996
a. Equipment and techniquesThe nutrients analyses were performed on BRAN+LUEBBE continuous flow analyticalsystem Model TRAACS 800 (4 channels). The manifolds for the analysis are shown inFig. C.6-1, -2, -3 and -4 for the nitrate+nitrite, nitrite, silicate and phosphate, respectively.TRAACS 800 was located in the container laboratory on deck the R/V Kaiyo.
The methods used were as follows:
1st channelNitrate+Nitrite: Nitrate in seawater is reduced to nitrite when a sample is run through acadmium tube (1 mm diameter, 10 cm length) inside of which is coated with metalliccopper. The nitrite produced is determined by diazitizing with sulfanilamide and couplingwith N-1-naphthyl-ethylenediamine (NED) to form a colored azo dye which is measuredspectrophotometrically at 550 nm using 3 cm length cell. Nitrite initially present in thesample is corrected. Since the reduction rate was varied from 92 to 97 %.The reductionrate was measured for each analysis and the concentration of nitrate was corrected byreduction rate.

2nd channelNitrite: The nitrite is determined by diazitizing with sulfanilamide and coupling with N-1-naphthyl- ethylenediamine (NED) to form a colored azo dye which is measuredspectrophotometrically at 550 nm using 5 cm length cell.
3rd channelSilicate: The standard AAII molybdate-ascorbic acid method with the addition of a 46 degC heating bath to reduce the reproducibility problems encountered when analyzingsamples at different temperatures. The silicomolybdate produced is measuredspectrophotometrically at 630 nm using 3 cm length cell.
4th channelPhosphate: The method of Murphy and Riley (1962) was used, but separate additions ofascorbic acid and mixed molybdate-sulfuric acid-tartrate and addition of a 46 deg Cheating bath. The phosphomolybdate produced is measured spectrophotometrically at880 nm using 5 cm length cell.
The analytical results were corrected for base drift, carry over effect and gain drift. Theconcentrations of nitrate+nitrite,nitrite, silicate and phosphate were calculated by 2ndorder polynomial curve fitting. The temperature of all sample seawater at the analyseswas measured and recorded. The temperature of the sample seawater during this cruiseranged from 16 deg C to 26 deg C depending on duration of analysis and ambienttemperature.
b. Sampling Procedures
Sampling for nutrients followed that for oxygen. Samples were drawn into polyethylene100 ml narrow mouth,screw-capped bottles. These were rinsed two to three times beforefilling. Most of the samples were analyzed within 4 hours after collection. Glass 7 mlsample cups were used .Glass cups were washed in the hot detergents, they were rinsedby deionized water, and kept in deionized water before packing. These were rinsed twotimes before filling with analyze.
c. Calibration
The calibration of all the volumetric flasks used on the cruise were checked beforepacking. Calibration of the 3 Eppendorf micropippettes used during the cruise werechecked before packing. The temperature during the calibration ranged from 21 to 23deg C.
d. Nutrient standard
We prepared nutrient standards by following an suggested protocol for continuous flowautomated analysis of seawater nutrients by Gordon et.al (1992). Nutrient primarystandards of nitrate, nitrite and phosphate were prepared from salts dried inoven/microwave oven and cooled over silica gel in a desiccator before weighing. The dry

powder for the primary standard was packed in the nitrogen gas atmosphere. Theprecision of the weighing was ca. 0.1 %.
Silica standard (one gram of SiO2 in plastic ampule, comm No. 4790) prepared by J.T.Baker Chemical Co. was used to prepare the standard solution of silicate analysis duringthis cruise.
The concentration of A standard are 2500 µM for phosphate, 37500 µM for nitrate and3800 µM for nitrite, and 33286.6 µM for silicate. The concentration of B standard are 50µM for phosphate, 750 µM for nitrate and 38 µM for nitrite,and 2662.9 µM for silicate. Aand B uniform set of six mixed working standards were prepared in low nutrients seawater (LNSW). Concentrations (umol/l) were: nitrate 45.0, 37.5, 30.0, 15.0, 7.5 and 0 ;nitrite 1.2, 1.0, 0.8, 0.4, 0.2, and 0; silicate 162, 135 ,108, 54, 2.7 and 0 ; phosphate 3.0,2.5, 2.0, 1.0, 0.5 and 0 thereafter.
e. The traceability of the standard
Two sets of A standards were prepared at the beginning of the cruise. One of two wasused for 15 of working standard during the cruise. The other was stocked as reference Astandard to be checked the working standard. The results of this check are shown inTable C6-1.
f. The comparison between working standard solution and CSK standard solutionat full scale.
The comparison between working standard solution and CSK standard solution at fullscale were made three times before the cruise and once after cruise onborad.
g. Low nutrient sea water
More than 200 liter of surface seawater was collected in JUNE1995 near Palau Is. as lownutrient seawater (LNSW). Collected seawater was stored in the 20 liter container andfiltered with 0.45 µm pore size membrane filter (Millipore HA) and subjected to preparethe working standard solution. The concentration of nutrients in each batch of LNSWwere determined carefully.
h. Experiment for preparation of Control sample
Control samples were prepared to confirm traceability in the nutrients measurementsduring the cruise and examined the availability of it.
Method of control samples were:
Sea water (31°N, 133°E, 2500 m) was sterilized heating at 120 deg C for 30 minuets twiceafter it had been filtered with 0.45µm (Millipore HA) and 0.22µm (MILLIPACK 40) poresize membrane filter. Then the sea water was drawn into sterilized 100ml polypropylene

bottles under aseptic condition over filtering with 0.22µm pore size membrane filter again.We confirmed that the control samples condition were free from bacteria and fungi. The37 control samples were measured. One each analysis,one more bottle control sampleswere analyzed five times a bottle. The measurement results are in table C.6-4
i. Precision check at each station
On each analysis, one of the deep water sample and one of the shallow water samplewere analyzed five times to get the precision, respectively. The precision at full scale ateach station were shown in Table C.6-5.
j. Replicate and Duplicate Samples
There were 27 pairs of replicate and duplicate samples drawn. We drawn 2 samples fromthe Niskin bottles tripped at the bottom for a replicate and 1 sample from another Niskinbottle tripped at the bottom for a duplicate.
The standard deviation of 27 pairs of replicate and duplicate samples were 0.0005 PSU.
Table C.6-1. The concentration ratio of working standard solutions referenced to stockedA standard solution.
Date Nitrate Nitrite Silicate Phosphate19 June '96 1.008 1.008 1.006 0.9951 July '96 0.997 1.017 1.006 1.009
Table C.6-2.The comparison between working standard solution and CSK standardsolution at full scale.
Date Nitrate Nitrite Silicate Phosphate19 June '96 1.004 0.981 1.025 1.07121 June '96 1.007 1.004 1.018 1.03922 June '96 0.994 0.918 1.030 1.0271 July '96 1.002 0.920 1.018 0.995
The puerility of the nitrite standard solution prepared in this cruise is determined to be96.6% .

Table C.6-3 The nutrients concentration of LNSW.
Batch No. Station No. Nitrate Nitrite Silicate Phosphate (µM/l)3 1-4 0.000 0.000 1.125 0.0046 5-9 0.000 0.000 1.151 0.0004 12,13, 0.000 0.006 1.285 0.018
18-227 10,11 0.000 0.003 1.133 0.000
14-178 23-27 0.000 0.008 1.142 0.028
Table C.6-4 Results of control samples measurement.
Nitrate Nitrite Silicate PhosphateMean (µM/Kg) 26.91 0.54 140.63 2.05STD 0.15 0.01 0.75 0.04CV(%) 0.55 1.31 0.53 1.81N 185 185 180 180

Table C.6-5 Precision at full scale at each analysis.
StationNo.
NitrateCV(%)
SilicateCV(%)
PhosphateCV(%)
1 0.28 0.17 0.602 0.41 0.10 0.213 0.19 0.26 0.264 0.18 0.12 0.325 0.19 0.27 0.706 0.24 0.18 0.297 0.07 0.30 0.538 0.18 0.18 0.519 0.20 0.22 0.4510 0.11 0.17 0.4611 0.13 0.23 0.3512 0.42 0.21 1.2213 0.08 0.10 0.26
StationNo.
NitrateCV(%)
SilicateCV(%)
PhosphateCV(%)
14 0.12 0.50 0.2115 0.20 0.11 0.4016 0.32 0.15 0.2117 0.26 0.16 0.2818 0.22 0.17 0.7119 - - -20 0.28 0.27 0.2421 0.16 0.36 0.9622 0.18 0.18 0.9223 0.18 0.19 0.6324 0.15 0.25 0.3825 0.21 0.09 0.6126 0.28 0.34 0.2727 0.21 0.10 0.49
References
Gordon, L.I., Jennings, Jr. J.C., Ross, A.A. and Krest, J.M., 1992, An suggested protocolfor Continuous Flow Automated Analysis of seawater nutrients (Phosphate, Nitrate,Nitrite and Silicic Acid) in the WOCE Hydrographic Program and the Joint GlobalOcean Fluxes Study. OSU Coll. of Oc. Descr. Chem. Oc. Grp. Tech. Rpt. 92-1.
Murphy, J., and Riley, J. P., 1962, A modofied single solution method for determination ofphosphate in natural water. Analytica Chimica Acta, 27, 31-36.
C.7 Distribution of oceanic CO2, pH and TA(K.Shitashima, D.Tsumune and S.Kraines)September 1996
1. DESCRIPTION OF METHODS
pHSea water samples were collected in 100ml polyethylene bottles with inner caps fromNiskin-type water samplers, The sample bottles were capped after an overflow of about100ml sea water. All samples were stored at room temperature after sampling andanalyzed within a few hours. Samples were transferred into a closed and jacketed glassmeasurement cell with a volume of ~30ml. The cell temperature was maintained at aconstant temperature of 25C+/-0.1C. The electric potential and temperature of the samplewere measured for 10 minutes with a Ag/AgCl combined electrode (Radiometer

Analytical A/S, GK2401C) and a temperature sensor (Radiometer Analytical A/S, T901)connected to a high precision pH meter (Radiometer Analytical A/S, model PHM93). Trisand 2-Aminopyridine Buffers (Dickson and Goyet, 1994) were employed to calibrate pHelectrodes. Calibrations were made at the beginning, middle and end of set ofmeasurements for every station.
Total AlkalinityTotal Alkalinity samples were collected in 250ml polyethylene bottles with inner caps fromNiskin-type water samplers, and capped after an overflow of about 150ml of the seawater. All samples were stored at room temperature after sampling and analyzed within afew hours. Samples were transferred into a glass titration cell using a 50ml transfer pipetteand titrated at 25C+/-0.1C with 0.1 M HCl containing 0.6M NaCl within 10 min. Theelectric potential and temperature of the sample were followed with a Ag/AgCl combinedelectrode (Radiometer Analytical A/S, GK2401C) and a temperature sensor (RadiometerAnalytical A/S, T901) connected to a TitraLabTM (Radiometer Analytical A/S) system.The titration was controlled automatically and the titration curve was analyzed with theinflection point titration method by the system. The precision of the method wasdetermined to be 0.0043mmol/kg (n=17) from replicate analysis of the CertifiedReference Solutions (CRMs (batch 32) supplied by Dr. Andrew Dickson of ScrippsInstitution of Oceanography (SIO)). Standardization of the titrant (0.1 M HCl) wasaccomplished with Na2CO3 (99.99% pure; Asahi Grass) standards.
Total dissolved inorganic carbon (T-CO2)The T-CO2 concentration in seawater samples were determined by using the coulometrictitration system (UIC Inc., Carbon Coulometer model 5011) described by Jhonson et al.(1985) with the modified CO2 extraction system described by Shitashima et al. (1996). Aschematic diagram of our system is shown in Fig.C.7-1. Samples for T-CO2 analysiswere drawn from the Niskin samplers into 125ml glass vial bottles after an overflow ofabout 100ml of the sea water. The samples were immediately poisoned with 50ul of 50%saturated HgCl2 in order to restrict biological alteration prior to sealing the bottles. Allsamples were stored in a refrigerator before measurement, and were analyzed within 12hours of collection.
Seawater was introduced manually into the thermostated (25C+/-0.1C) measuring pipettewith a volume of ~30ml by a pressurized headspace CO2-free air that had been passedthrough the KOH scrubber. The measured volume was then transferred to the extractionvessel. The seawater sample in the extraction vessel was acidified with 1.5 ml of 3.8%phosphoric acid and the CO2 was extracted from the sample for 10 minutes by bubblingwith the CO2-free air. After passing through the Ag2SO4 scrubber and polywool toremove sea salts and water vapor, the evolved CO2 gas was continuously induced to thecoulometric titration cell by the stream of the CO2-free air. All reagents were renewedevery day.
The T-CO2 concentration in seawater was calculated using a calibration carveconstructed by measuring five to six different concentration of dissolved Na2CO3(99.99% pure; Asahi Grass) used as a standard solution (Dickson and Goyet, 1994). The

precision of the T-CO2 measurements was tested by analyzing CRMs (batch 32) at thestart of the measurement of samples every day. Fig.C.7-2 shows a comparison betweenthe results of our shipboard measurements of these CRMs during the cruise and certifiedvalues provided by Dr. Andrew Dickson. Our shipboard measurements yielded a meanvalue of 1995.6+/-2.8 umol/kg (n=40), which compares with 1997.6+/-1.4 umol/kg (n=9)certified by SIO. We also prepared and analyzed sub-standards that were bottled into125ml glass vial bottles from a 201 bottle of filtered and poisoned offshore surface waterin order to check the condition of the system and the stability of measurements everyday. The resulting standard deviation form replicate analysis of 19 sub-standards was +/-1.8 umol/kg.
2. PRELIMINARY RESULTS
Fig.C.7-3 shows the vertical distributions of pH, Total-Alkalinity and T-CO2 concentrationat 1 degree intervals between 10N and 1N along 130E. The fluctuation of the verticaldistributions of Total-Alkalinity at some of the stations was caused by electrical problemswith the onboard measurement. The T-CO2 maximum layer at each station graduallydeepened towards the north. This trend suggests that this layer represents the northwardflowing of the Philippine Sea bottom water.
3. REFERENCES
Dickson, A. G. and C. Goyet. 1994. Handbook of methods for the analysis of the variousparameters of the carbon dioxide system in sea water. Ver. 2 ORNL/CDIAC-74. A. G.Dickson and C. Goyet (eds.). Carbon Dioxide Information Analysis Center, OakRidge National Laboratory, Oak Ridge, Tenn.
Jhonson, K. M., A. E. King, and J. M. Sieburth. 1985. Coulometric TCO2 analysis formarine studies: An introduction. Mar. Chem. 16, 61-82pp
Shitashima, K., K. B. Steven, D. Tsumune, I. Asamuma, and T. Ono. 1996. Themeasurement of total carbonate in seawater.: In abstract of the 1996 spring meetingof the Oceanographic Society of Japan. 269pp (in Japanese)
C.8 Tracers(C.Saito and N.Harada)6 September 1996
C-14All samples were drawn from 12 liter Niskin bottles followed that for oxygen or TCO2.Samples were drawn into glass vials of ca. 200 ml. These were rinsed before filling andoverflowed by two to three times of the vial volume. Then 50 mg of saturated HgCl2solution was added and subsequently rubber cap and aluminum cap were clamped tovials.
Duplicate samples were drawn from the same rosette bottle at all sampling depths.Sampling stations were 1, 4, 7, 9, 11, 13, 15, 18, 22 and 26. The sampling depths ofradiocarbon samples shallower than 1000 meters were 30, 50, 100, 200, 300, 400, 500,800, 1000. Below 1000 meters the sampling interval was 500 meters.
HeliumSamples were transferred the first from Niskin bottle to the copper tube using a gravityfeed technique through lengths of plastic tubing. We followed helium sampling procedureby WOCE manual (Jenkins et al., 1991). The seal was made by crimped to form apressure welded seal. Helium sampling stations were same as radiocarbon sampling sitebut those layers were very few.
TritiumSampling bottles for tritium were baked for a few hours at about 180 C. The inside of thisbottle was sealed with argon gas. Sea water sample was introduced into the bottle with aplastic tubing. The bottle was filled within a few centimeters of the top and head spacewas retained. The cap of ground joint glass bottle was immediately replaced and taped.Tritium sampling stations and depths were same as radiocarbon sampling.
References
Jenkins, W. J., D. E. Lott, M. W. Davis, S. P. Birdwhistell and M. O. Matthewson 1991.Measuring helium isotopes and tritium in seawater samples. WHP Office ReportWHPO 91-1, Woods Hole, Mass., USA.
C.9 Weather and sea condition(S.Ishida, Captain of R/V KAIYO and Nyoshioka)September 1996
Weather condition was very good through our cruise, as it was covered by the NorthPacific high pressure, Any typhoon nor developing low pressure were not appearedaround eastern part of the tropical Pacific area on the duration of our cruise. Accordingly,any strong swell nor waves did not disturb our CTD and Rosetta casting operations.
C.10 Problems(Y.Kashino)2 December, 1996
As described in A.5, the damage on a fiber of armored-wire of CTD cable occurred duringthis cruise. Because of this accident, we must slow CTD decent rate at irregular windingafter st.12. This effected not only the time schedule but also the quality of CTD databecause of increase of shed wakes. The rate of bad data detected changed from 8.8% to11.1 % before and after this accident.

D. Acknowledgements(N.Yoshioka)September 1996
We would like to great acknowledge for contribution of many scientist and technicians,who joined to this cruise from their institution or company. We also would like to greatlythanks for helpful supports by the captain Ishida and the crew on R/V KAIYO. Technicsfor water sampling, chemical analysis and CTD data processing were totally taken overfrom previous KAIYO cruises (WOCE-PR1S and PR24 in 1994, PR23 and PR24N in1995). We would like to great thanks to Mr.Michio Aoyama and Mr.Takeshi Kawano whodeveloped these techniques and constructed the accuracy control system on R/V KAIYO.
The WOCE cruise and publication of this data report were all supported by TropicalOcean Climate Study (TOCS) conducted by the JAMSTEC, which has been funded bythe Science and Technology Agency (STA), JAPAN.
E. References (see each section)
F. Appendices
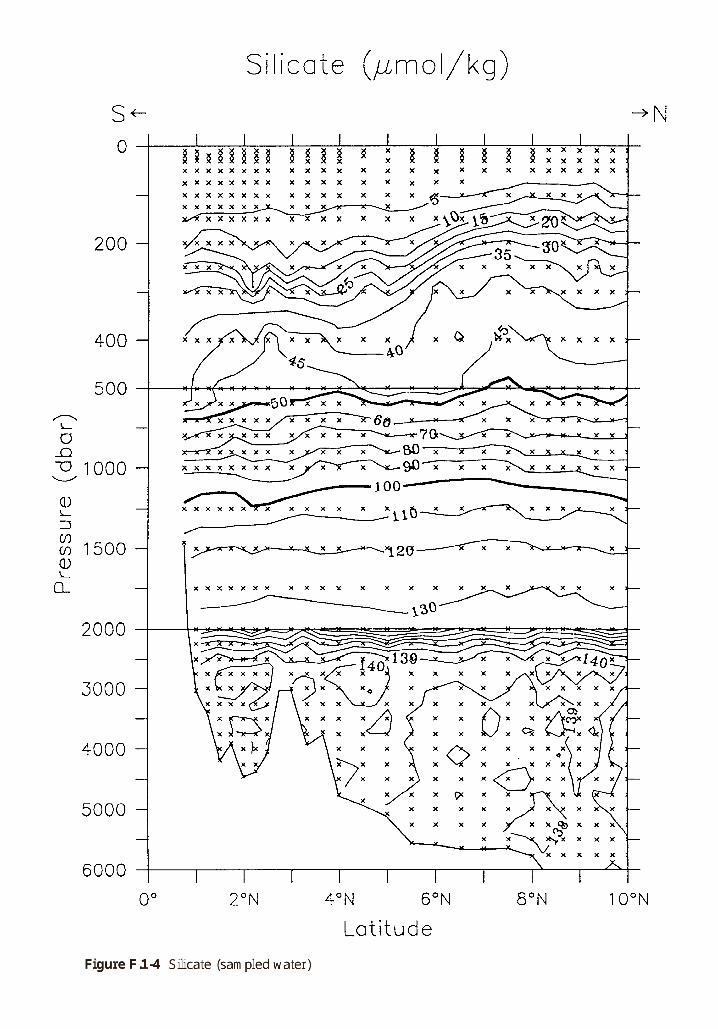
Figure F.1 Section plot along P8S.Figure F.1-1 Temperature (CTD)Figure F.1-2 Salinity (CTD)Figure F.1-3 Dissolved oxygen (sampled water)Figure F.1-4 Silicate (sampled water)Figure F.1-5 Nitrate (sampled water)Figure F.1-6 Phosphate (sampled water)Figure F.1-7 Total Carbon (sampled water)Figure F.1-8 pH (sampled water)Figure F.1-9 Zonal velocity in m/sec (ADCP).
Solid contour denote eastward flow.Figure F.1-10 Meridional velocity in m/sec (ADCP).
Solid contour denote northward flow.
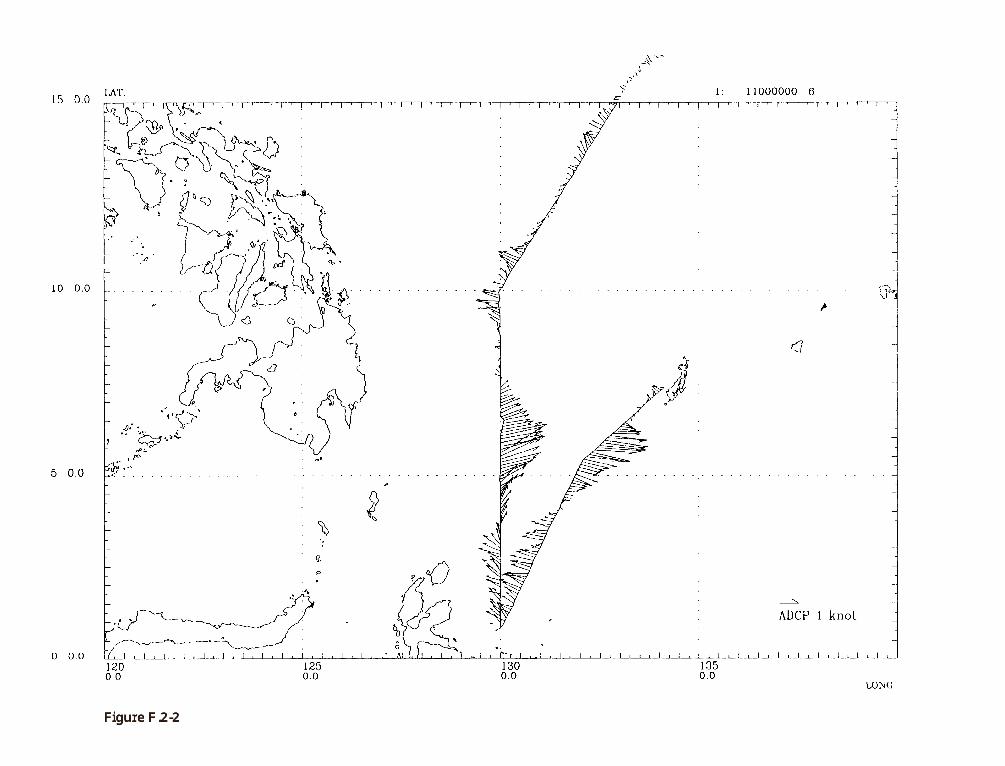
F.2 Velocity vectors measured by ADCP.
Figure F.2-1 On the depth of 50mFigure F.2-2 On the depth of 100mFigure F.2-3 On the depth of 150mFigure F.2-4 On the depth of 200mFigure F.2-5 On the depth of 250mFigure F.2-6 On the depth of 300mFigure F.2-7 On the depth of 350mFigure F.2-8 On the depth of 400mFigure F.2-9 On the depth of 450mFigure F.2-10 On the depth of 500m


G. Data Quality Evaluation
G.1 Data Quality Evaluation for P08S C14 Data(Robert Key)12 Jun 2001
On 4/5/2001 the WOCE Hydrographic Program Office supplied me with a copy of the C-14 results for WOCE P08S which I had agreed to QC check. After merging with thehydrodata and subjecting to my regular checking procedure, I found the data to be of goodquality although limited quantity. The quality is significantly better than it was for P9.
Only 2 data points fell outside the "envelop". These data show significantly less scatterthan data from neighboring P9 (also Japanese). There appears to be no systematic biasin the data set. I would recommend flagging the following 2 points as questionable(c14f==3):
sta-cast-bottle comment4-1-16 lo vs P marked 318-1-8 hi vs P marked 3
Both were "off" relative to neighboring samples from this cruise only. I know of no existingC14 data this far west against which a "crossover" analysis could be made. Additionally,the rigor I apply when QCing is dependent upon the overall quality of the entire cruise.That is, the above 2 points would not have been flagged 3 had they been part of P9. Withgood data smaller deviations can be discerned.
Even if the data is low quality, the c13 values which were used to collect the c14measurement for fractionation during analysis should be included in the data set. A c13datum can be "good enough" for this correction without being of sufficient precision forother oceanographic application.
Even though sparse, these are important data since they will allow mapping C-14 furtherwestward in the N. Pacific. My congratulations to the PIs involved.

G.2 Data Quality Evaluation for P08S Carbon Data(Robert Key)04 Apr 2001
Based on the final quality control analysis (JGOFS/NOAA grant work) the data quality forthis cruise is not the best. Recommended additive adjustments for TCO2 and Alk are +2and +6 micromoles respectively.
I have attached a copy of the correction table for pacific cruises that included carbonmeasurements. Most of the time, these recommended corrections are so small that Idoubt the change will be visible in graphic sections. The changes might make a smalldifference in maps on deep surfaces.
Cruise TCO2 TA TAcalc Nit Pho Si Oxycgc91.1 NA NA N NA NA NA NAp2 -4 +14 N NA 1.0171 NA NAp6 -0.6 NA Y NA 0.9813 NA NAp8s +2 +6 N NA 1.0391 1.0229 NAp9 +1.1 NA N 0.9831 NA NA NAp10 NA NA N NA 1.0260 NA NAp13n NA NA* N 1.0327# NA 0.9804# NAp14n NA NA Y% 1.0115 1.0174 0.9800 NAp14s15s NA NA Y% NA NA NA NAp15n NA NA N NA 0.9821 NA NAp16s17s +1.4 NA Y NA 0.9803 NA NAp16c NA NA N NA NA NA NAp16n +4& NA Y NA NA NA NAp16a17a +1.3 NA Y NA NA NA NAp17c NA -9 N 1.0195 NA NA NAp17n -7 -12 N NA NA NA NAp17e19s +1.4 NA Y NA 0.9790 0.9814 NAp18S NA NA Y@ 1.0130 0.9722 NA NAp18N NA NA Y@ 1.0185 NA NA NAp19c -0.2 NA Y NA 0.9767 0.9860 NAp21E NA NA N NA NA NA 1.0136p21W NA NA N NA NA NA 0.9703p31 NA -6 Y% 1.0150 NA NA NAs4p -0.9 NA Y 1.0241 0.9715 0.9810 NAsr3s4 NA NA N NA NA NA NAP1 NA NA N NA NA NA NAEQS92 NA NA N NO3/16 NA NA NAMeteor 11/5$ NA NA Y NA NA NA NA
* alk data adjusted by -23.6 to agree with CRM in individual cruise file# only adjusted leg 2 (stations >55)% alk calculated only for bottles that had TCO2 and ph, but no alk& 3-umol/kg CRM correction already in individual cruise file@ alk calculated only for bottles that had TCO2 and fco2, but no alk$ WOCE designation A21 plus parts of S04A and SR02

WHPO Data Processing Notes:
Date Contact Data Type Data Status Summary11/06/97 Kashino CTD/BTL/SUM Submitted for DQE03/10/98 Kashino HE/TR, C14 Measured but not ready to submit03/10/98 Kashino DOC Data Update08/16/98 Mizuno CTD/BTL* Data are Public (*S/O, NUTs)01/19/01 Kappa DOC Doc Update txt version updated01/22/01 Huynh DOC Website Updated Updated txt version online03/02/01 Saito He/Tr/C14 Data Update He/Tr not measured, C14 will
be submitted to WHPO. You meant about P8S, I see. In P8S cruise, we tookradiocarbon, tritium and helium samples. Radiocarbon data set will be sent to WHPOby Dr.Kumamoto in the near future, but tritium has not yet analyzed cause of the lackof foundation. Besides helium samples were failed to preserve. Then the onlyradiocarbon data set could be sent the WHPO.
03/06/01 Yuichioro DELC14 Submitted Data to be merged intoonline file.The Bottle File has the following parameters: DELC14, C14ERR; The BottleFile contains: CastNumber StationNumber BottleNumber SampleNumber.KUMAMOTO, YUICHIORO would like the data PUBLIC.
I have just submitted the P8S radiocarbon data through the WHPO ftp datasubmission site. The file name is "p08shy.txt (ascii file)" including the radiocarbondata, errors, and flags. I should inform you of the replicate measurements ofradiocarbon. We have 9 replicates as listed below:
STNNBR SAMPNO Number of replicates (original data +- error)01 20 2 (-211.4+-6.1, -202.0+-7.2)07 21 2 (-170.6-+6.2, -163.8+-6.3)07 34 2 (112.7+-6.0, 107.9+-6.0)15 01 3 (-221.2+-7.0, -216.2+-5.8, -208.1+-3.7)15 15 2 (-212.7+-7.1, -206.9+-3.7)15 20 2 (-151.2+-7.8, -146.3+-3.9)15 27 2 (74.1+-9.5, 81.1+-4.5)18 01 2 (-220.5+-3.6, -216.9+-3.6)18 26 2 (102.0+-6.2, 92.2+-6.2)
03/15/01 Saito TRITUM Not Measured Not measured due to lack offunding. Oh, yes. I meant lack of funding for the tritium. Anyway I heard that Dr.Kumamoto are going to deposit C14 data to WHPO within a few weeks.
04/05/01 Kappa DELC14 DQE Begun Sent data to Bob Key to QCFor P8S the notes/updates at whp imply that c14 has been run (in Japan) and shouldbe released, but the whp data file contains no C14 data (or C13). This is not one of thecruises which we have included in discussions with NSF regarding "analysis ofunfunded samples". If I can get the data, I can certainly do a very quick QC. - Bob Key
06/22/01 Uribe CTD/BTL Website Updated CSV File AddedCTD and Bottle files in exchange format have been put online.

10/26/01 Yoritaka Cruise ID Data Update Cruise Info UpdatedDate: June 17-July 02, 1996PI: N. Yoshioka and D. Hartoyo
(Badan Pengajian Dan Penerapan Teknologi, Indonesia)CTD/S/O2: Y. Kashino and H. Yoritaka/H. Yoritaka/M. Aoki
(Nippon Marine Enterprise, Japan)Nuts: C. SaitoCFC: no samplingHe/Tr,14C: C. SaitoAlk/TCO2: K. Shitashima
(Central Research Institute Electric Power Industry,Japan)01/10/02 Kappa DOC Cruise Report Updated
Compiled PDF cruise report with all figures, C14 and CO2 DQE reports and WHPOData Processing Notes. Added C14 and CO2 DQE reports and WHPO DataProcessing Notes to text version of doc file.