a cross-sectional study of mental health and well-being ... · thesis submitted in accordance with...
TRANSCRIPT

A cross-sectional study of mental health and well-being and
their associations in the UK veterinary profession
Thesis submitted in accordance with the requirements of
the Royal College of Veterinary Surgeons for the Diploma of Fellowship by
DAVID JAMES BARTRAM
May 2009
i
ABSTRACT
A cross-sectional study of mental health and well-being and their associations in the UK veterinary profession
David James Bartram
Introduction: Veterinary surgeons are at elevated risk of suicide, with a proportional mortality ratio around four times that of the general population and approximately twice that of other healthcare professions. There has been much speculation regarding possible mechanisms underlying increased suicide risk in the profession but little empirical research. This cross-sectional study aims to assess the contribution of mental health and well-being to the elevated risk, through a postal questionnaire survey of a large stratified random sample of veterinary surgeons practising in the UK. Method: A questionnaire was mailed twice to 3200 veterinary surgeons (approximately 20% of the membership of the Royal College of Veterinary Surgeons, excluding those practising overseas or retired). Anxiety and depressive symptoms, alcohol consumption, suicidal ideation, positive mental well-being, perceptions of psychosocial work characteristics, and work-home interaction were assessed using valid and reliable existing instruments. Potential veterinary work-related stressors were assessed using a series of bespoke items developed through focus group input and refined following pre- and pilot- testing. Results: Evaluable questionnaires were returned by 1796 participants, a response rate of 56.1%. The demographic and occupational profile of respondents was fairly representative of the UK veterinary profession. The prevalence of anxiety, depression, and co-morbid anxiety and depression ‘probable cases’ (i.e. HADS sub-scale score ≥ 11) was 26.3% (95% CI: 24.3 to 28.4%), 5.8% (95% CI: 4.8 to 7.0%) and 4.5% (95% CI: 3.6 to 5.6%) respectively. The 12-month prevalence of suicidal thoughts was 21.3% (95% CI: 21.0 to 23.6%). Number of hours worked; making professional mistakes; and the possibility of client complaints or litigation were the main reported contributors to stress. Good clinical outcomes; relationships with colleagues; and intellectual challenge/learning were the greatest sources of satisfaction. Mental health and well-being are associated with a variety of demographic and occupational variables including age, gender, type of work, and employment status. Conclusions: Compared to the general population, veterinary surgeons are estimated to report higher levels of anxiety and depressive symptoms; higher 12-month prevalence of suicidal thoughts; less favourable psychosocial working conditions in relation to demands and managerial support; lower levels of positive mental well-being; and higher levels of negative work-home interaction. They drink more frequently than the general population, but consume less on a typical drinking day and a have a prevalence of daily and weekly binge-drinking that is similar to the general population. The levels of psychological distress reported suggest ready access to and knowledge of lethal means is probably not operating in isolation to increase suicide risk within the profession. The level of alcohol consumption does not appear to be a negative influence on mental health within the profession as a whole. The results are used to propose a portfolio of interventions, for both organisations and individuals, which have the potential to improve mental health and well-being in the veterinary profession.
ii
DECLARATION
I do hereby declare that,
A cross-sectional study of mental health and well-being and
their associations in the UK veterinary profession
submitted in part fulfilment of the requirements for the RCVS Diploma of Fellowship
by
David James Bartram
May 2009
has not been submitted for any other degree or comparable qualification and is the
result mainly of my own original observations and research and I have not been
awarded a degree or diploma by any university or other body in respect of the major
part of the work incorporated into this thesis.
Candidate’s signature:
Date:

iii
PUBLICATIONS AND CONFERENCE PRESENTATIONS
The following publications and conference presentations are based on work
incorporated into this thesis:
2008
BARTRAM, D.J. & BALDWIN, D.S. (2008) A cross-sectional study of mental heath and well-being
and their associations in the UK veterinary profession. [Oral presentation and abstract, British Cattle
Veterinary Association Congress, 14-16 November, 2008. Killarney, Ireland] Cattle Practice [Journal
of British Cattle Veterinary Association] 16 (2), 93-94
BARTRAM, D.J. & BALDWIN, D.S. (2008) Mental health and wellbeing survey [Letter]. Veterinary
Record 161, 360
BARTRAM, D.J. & BALDWIN, D.S. (2008) Mental health and wellbeing survey [Letter]. Veterinary
Record 162, 868
BARTRAM, D.J. & BALDWIN, D.S. (2008) Suicide among veterinary surgeons. [eLetter, 13 Jul 2008]
British Journal of Psychiatry. Available at http://bjp.rcpsych.org/cgi/eletters/193/1/73
BARTRAM, D.J. & BALDWIN, D.S. (2008) Veterinary surgeons and suicide: a hypothetical model to
explain risk. [Oral presentation and abstract] Proceedings of 12th European Symposium on Suicide and
Suicidal Behaviour, 27-30 August, 2008. Glasgow, UK. pp 57-58
BARTRAM, D.J. & BALDWIN, D.S. (2008) Veterinary surgeons and suicide: influences,
opportunities and research directions. Veterinary Record 162, 36-40
BARTRAM, D.J., YADEGARFAR, G. & BALDWIN, D.S. (2008) A cross-sectional study of mental
heath and well-being and their associations in the UK veterinary profession. [Oral presentation and
abstract] Proceedings of ‘Primed and Ready to Go! Developing Mental Health Services through
increasing Research Activity’, Hampshire NHS Partnership Trust/ University of Southampton
Conference, 1 October, 2008. Eastleigh, UK. p 14
BARTRAM, D.J., YADEGARFAR, G. & BALDWIN, D.S. (2008) Reported alcohol consumption,
depressive and anxiety symptoms, and mental well-being among UK veterinary surgeons: cross-
sectional questionnaire survey. [Poster presentation at the Summer Meeting of the British Association
for Psychopharmacology, 20-23 July, 2008. Harrogate, UK] Journal of Psychopharmacology 22 (5
Abstract Suppl.), A30
iv
2009
BARTRAM, D.J. (2009) A cross-sectional study of mental health and well-being in the UK veterinary
profession. [Oral presentation and abstract] University of Southampton MHLS Faculty Postgraduate
Conference, 2-3 June, 2009. Southampton, UK. p 19
BARTRAM, D.J. (2009) It shouldn’t happen to a vet. Suicide and mental health in the veterinary
profession – do we have a problem? [Oral presentation] British Veterinary Association Congress, 24-
26 September, 2009. Cardiff, UK.
BARTRAM, D.J. (2009) The mental health of the UK veterinary profession – how do equine
practitioners fare? [Oral presentation and abstract] Handbook of Presentations, 48th British Equine
Veterinary Association Congress, 9-12 September, 2009. Birmingham, UK. pp 235-236
BARTRAM, D.J. & BALDWIN, D.S. (in press) Veterinary surgeons and suicide: a structured review
of possible influences on increased risk. Veterinary Record
BARTRAM, D.J., SINCLAIR, J.M.A. & BALDWIN, D.S. (2009) Alcohol consumption among
veterinary surgeons in the UK. Occupational Medicine 59, 323-326
BARTRAM, D.J., SINCLAIR, J.M.A. & BALDWIN, D.S. (in press) Towards improving the mental
health and well-being of UK veterinary surgeons. Veterinary Record
BARTRAM, D.J., YADEGARFAR, G. & BALDWIN, D.S. (2009) A cross-sectional study of mental
heath and well-being and their associations in the UK veterinary profession. Social Psychiatry and
Psychiatric Epidemiology, E-pub ahead of print: 18 Mar 2009. doi: 10.1007/s00127-009-0030-8
BARTRAM, D.J., YADEGARFAR, G. & BALDWIN, D.S. (2009) A cross-sectional study of mental
heath and well-being in the UK veterinary profession. [Oral presentation and abstract] Proceedings of
British Small Animal Veterinary Association 52nd Annual Congress, 2-5 April, 2009. Birmingham,
UK. p 372
BARTRAM, D.J., YADEGARFAR, G. SINCLAIR, J.M.A. & BALDWIN, D.S. (2009) Associations
between alcohol consumption and psychosocial working conditions among UK veterinary surgeons:
cross-sectional questionnaire survey. [Poster presentation at the Summer Meeting of the British
Association for Psychopharmacology, 26-29 July, 2009. Oxford, UK] Journal of Psychopharmacology
23 (6 Abstract Suppl.), A36
BARTRAM, D.J., YADEGARFAR, G. & BALDWIN, D.S. (2009) Psychosocial working conditions
and work-related stressors among UK veterinary surgeons. Occupational Medicine 59, 334-341

v
ACKNOWLEDGEMENTS
I gratefully thank and acknowledge Dr David S. Baldwin1 for his enthusiastic and
supportive academic supervision and generosity with his time throughout this
initiative and Dr Ghasem Yadegarfar2 for his initial guidance and coaching with some
of the statistical analyses.
Veterinary Business Development Ltd., publisher of Veterinary Times, provided use
of the Vetfile® database as the sampling frame, printed and posted the questionnaires
and covering letters, and supplied reply-paid envelopes free of charge. BUPA Giving
provided financial support for the project.
The study would not have been possible without the support of the participating
veterinary surgeons throughout the UK who collectively invested over 600 hours of
their time in completing and returning the questionnaires. I offer the assurance of my
best efforts to ensure their contributions become a catalyst for endeavours to improve
the psychological health of the profession.
I also thank Professor Stephen Platt (University of Edinburgh) and Colin Stead for
their constructive comments on a previous version of the manuscript.
Preparation of a thesis can be a selfish indulgence which comes at considerable cost to
one’s family. I especially thank Ann-Marie for proof-reading the document and for
her forbearance in the face of unremitting competition from the keyboard for my
attention, and my daughter Charlotte for her unfailing love.
1 Dr David S. Baldwin, MB, BS, DM, FRCPsych
Reader in Psychiatry and Honorary Consultant Psychiatrist, Clinical Neuroscience Division, School of
Medicine, University of Southampton, UK
2 Dr Ghasem Yadegarfar, BSc, MSc, PhD
Assistant Professor, Epidemiology and Biostatistics Department, School of Public Health, Isfahan
University of Medical Sciences, Iran (formerly Medical Statistician, Research and Development
Support Unit, School of Medicine, University of Southampton)

vi
To each one of you the practice of medicine will be very much as you make
it – to one a worry, a care, a perpetual annoyance; to another, a daily joy and
a life of as much happiness and usefulness as can well fall to the lot of man.
Osler ([1905] 1984, p. 423)
Osler, W. ([1905] 1984) The Student Life. In Aequanimitas: With Other Addresses to
Medical Students, Nurses and Practitioners of Medicine. 3rd edn. London, McGraw-Hill

vii
TABLE OF CONTENTS
ABSTRACT ..............................................................................................................................................i
DECLARATION......................................................................................................................................ii
PUBLICATIONS AND CONFERENCE PRESENTATIONS...............................................................iii
ACKNOWLEDGEMENTS......................................................................................................................v
LIST OF ABBREVIATIONS AND GLOSSARY OF TERMS............................................................xvi
LIST OF TABLES ..................................................................................................................................xi
LIST OF FIGURES...............................................................................................................................xiv
CHAPTER 1: INTRODUCTION.............................................................................................................1
1.0 Context...........................................................................................................................................1
1.1 Aims and objectives.......................................................................................................................2
1.2 Hypotheses.....................................................................................................................................2
1.3 Approach .......................................................................................................................................3
1.4 Contributions .................................................................................................................................4
1.5 Scope .............................................................................................................................................4
1.6 Document structure........................................................................................................................5
CHAPTER 2: UNDERSTANDING SUICIDAL BEHAVIOUR.............................................................6
2.0 Introduction ...................................................................................................................................6
2.1 Literature search methodology ......................................................................................................7
2.2 Suicide statistics.............................................................................................................................7
2.2.1 United Kingdom.....................................................................................................................7
2.2.1.1 General population .........................................................................................................7
2.2.1.2 Veterinary surgeons and other high risk occupations.....................................................8
2.2.2 Rest of the world..................................................................................................................14
2.3 Risk factors for suicide and suicidal behaviour ...........................................................................16
2.4 Protective factors against suicide and suicidal behaviour............................................................19
2.5 Towards a hypothetical model to explain suicide risk in veterinary surgeons.............................19
2.5.1 Possible influences on suicide risk among veterinary surgeons...........................................23
2.5.1.1 Access to means of suicide...........................................................................................23
2.5.1.2 Attitudes to death and euthanasia .................................................................................24
2.5.1.3 Suicide ‘contagion’ ......................................................................................................25
2.5.1.4 Cognitive and personality factors.................................................................................26
2.5.1.5 Work-related stressors..................................................................................................29
2.5.1.6 Effects of gender ..........................................................................................................35
2.5.1.7 Perceived stigma ..........................................................................................................37
2.5.1.8 Psychiatric illness.........................................................................................................38
2.5.2 Schematic representation .....................................................................................................40
2.6 Summary of shortfalls in existing published work ......................................................................42
2.7 Existing initiatives to support mental health in the UK veterinary profession.............................42
viii
CHAPTER 3: QUESTIONNAIRE RESEARCH...................................................................................45
3.0 Introduction .................................................................................................................................45
3.1 Modes of administration ..............................................................................................................45
3.2 Criteria for selecting existing survey instruments........................................................................46
3.3 Elements of mental health and well-being for investigation in the study ....................................48
3.4 Review and selection of existing instruments..............................................................................48
3.4.1 Depression ...........................................................................................................................49
3.4.2 Mental well-being ................................................................................................................50
3.4.3 Alcohol use ..........................................................................................................................52
3.4.4 Suicidal ideation...................................................................................................................53
3.4.5 Work-related stress and working conditions........................................................................54
3.4.6 Work-home interaction ........................................................................................................56
3.5 Maximising response rates to postal questionnaires ....................................................................57
3.6 Checklist for developing a questionnaire.....................................................................................60
3.7 Sampling frame............................................................................................................................61
3.7.1 Profile of the veterinary profession......................................................................................61
3.7.2 Possible sources of sampling frame .....................................................................................63
3.7.3 Selection of sampling frame ................................................................................................63
CHAPTER 4: MATERIALS AND METHODS ....................................................................................65
4.0 Introduction .................................................................................................................................65
4.1 Self-administered questionnaire...................................................................................................67
4.1.2 Development of questions on veterinary work-related stressors..........................................74
4.2 Study logo....................................................................................................................................75
4.3 Covering letters............................................................................................................................76
4.4 Design of questionnaire ...............................................................................................................76
4.5 Research ethics approval of study................................................................................................77
4.6 Sample size ..................................................................................................................................78
4.7 Selecting a stratified random sample of veterinary surgeons.......................................................78
4.8 Generation of pre-study awareness..............................................................................................80
4.9 Creation of study-specific website and e-mail address ................................................................81
4.10 Distribution of questionnaires....................................................................................................81
4.11 Reminder editorials in the veterinary press................................................................................82
4.12 Receipt and preparation of returned questionnaires prior to data entry .....................................82
4.13 Automated data entry.................................................................................................................84
4.14 Scoring of scales and treatment of missing data in study questionnaire ....................................84
4.15 Statistical analysis......................................................................................................................91
CHAPTER 5: RESULTS .......................................................................................................................93
5.0 Introduction .................................................................................................................................93
5.1 Returned questionnaires...............................................................................................................93
5.1.1 Response rate .......................................................................................................................93
ix
5.1.2 Respondent demographic and occupational profile .............................................................94
5.1.2.1 Age and year of qualification .......................................................................................94
5.1.2.2 Veterinary school of qualification................................................................................97
5.1.2.3 Type of work ................................................................................................................97
5.1.2.4 Employment status .......................................................................................................99
5.1.2.5 Position in practice .....................................................................................................100
5.1.2.6 Ownership of practice ................................................................................................100
5.1.2.7 RCVS Certificate or Diploma holder .........................................................................101
5.1.2.8 Hours worked and on-call in a typical week ..............................................................101
5.1.3 Frequency and distribution of missing data .......................................................................104
5.1.4 Summary............................................................................................................................106
5.2 Hospital Anxiety and Depression Scale (HADS) ......................................................................107
5.2.1 Summary............................................................................................................................120
5.3 AUDIT Alcohol Consumption Questions (AUDIT-C)..............................................................122
5.3.1 Summary............................................................................................................................134
5.4 Suicidal ideation ........................................................................................................................135
5.4.1 Summary............................................................................................................................141
5.5 Warwick-Edinburgh Mental Well-being Scale (WEMWBS)....................................................143
5.5.1 Summary............................................................................................................................151
5.6 HSE Management Standards Indicator Tool: Working conditions............................................152
5.6.1 Summary............................................................................................................................163
5.7 Work-home interaction ..............................................................................................................164
5.7.1 Negative work-home interaction (WHI_N) .......................................................................164
5.7.1.1 Summary ....................................................................................................................168
5.7.2 Positive work-home interaction (WHI_P)..........................................................................169
5.7.2.1 Summary ....................................................................................................................172
5.8 Contributors to stress .................................................................................................................173
5.8.1 Personal and general work-related .....................................................................................173
5.8.2 Clinical work-related..........................................................................................................175
5.8.3 Summary............................................................................................................................177
5.9 Sources of satisfaction and/or pleasure......................................................................................178
5.10 Estimation of non-response bias ..............................................................................................179
5.10.1 Summary..........................................................................................................................181
CHAPTER 6: DISCUSSION ...............................................................................................................182
6.0 Introduction ...............................................................................................................................182
6.1 Assessment of study population parameters ..............................................................................182
6.1.1 Generalisability of results ..................................................................................................182
6.1.2 Precision of population parameter estimates......................................................................184
6.2 Differences across the study population ....................................................................................184
6.2.1 Demographic factors ..........................................................................................................184

x
6.2.2 Occupational factors ..........................................................................................................186
6.3 Comparison with normative groups...........................................................................................187
6.3.1 Anxiety and depressive symptoms.....................................................................................188
6.3.2 Alcohol consumption .........................................................................................................188
6.3.3 Suicidal thoughts................................................................................................................190
6.3.4 Mental well-being ..............................................................................................................191
6.3.5 Psychosocial working conditions.......................................................................................191
6.3.6 Work-home interaction ......................................................................................................194
6.4 Critique of study instruments in the context of study aims and hypotheses ..............................194
6.5 Strengths and limitations of the study........................................................................................197
6.5.1 Strengths ............................................................................................................................197
6.5.2 Limitations .........................................................................................................................199
6.6 Implications for research ...........................................................................................................202
6.7 Implications for the profession ..................................................................................................204
6.7.1 Mental health promotion....................................................................................................207
6.7.2 Monitoring of trends ..........................................................................................................207
6.7.3 Accessible and appropriate support services......................................................................208
6.7.4 Working conditions............................................................................................................208
6.7.5 Other personal and work-related stressors .........................................................................211
6.7.6 Work-home interaction ......................................................................................................213
6.7.7 Crisis intervention and return to work ...............................................................................213
CHAPTER 7: CONCLUSIONS...........................................................................................................217
REFERENCES.....................................................................................................................................220
APPENDICES......................................................................................................................................248
Appendix I: Questionnaire...............................................................................................................249
Appendix II: Covering letters mailed with questionnaires ..............................................................254
Appendix III: Pre-study awareness editorials ..................................................................................257
Appendix IV: Reminder editorials...................................................................................................261
Appendix V: Coding frame for sources of satisfaction....................................................................265
Appendix VI: Selected study-related publications...........................................................................269

xi
LIST OF TABLES
Table 2.1: High risk occupational groups for suicide (suicide and open verdicts), men aged 16 to 64
years 1979-1990, men aged 20 to 64 years 1982-1987, 1991-1996 and 2001-2005, England and Wales
................................................................................................................................................................10
Table 2.2: Suicide and undetermined intent deaths for men aged 16 to 45 years and 46 to 64 years in
Scotland in 1981-1999............................................................................................................................11
Table 2.3: Mortality from suicide in male veterinarians, medical practitioners and dental practitioners,
and in female veterinarians and medical practitioners, aged 20 to 74 years, in England and Wales in
1979-1990 (excluding 1981) and 1991-2000 .........................................................................................12
Table 2.4: Relative risk (RR) of suicide in high risk occupational groups for men aged 16 to 44 years
and 45 to 64 years and females aged 16 to 64 years, in England and Wales in 1990-1992, compared
with reference groups .............................................................................................................................13
Table 2.5: Percentage distribution of suicides by method for veterinarians and combined suicides for
all occupations, for males aged 20 to 64 years and for females aged 20 to 59 years, in England and
Wales, 1982 to 1996...............................................................................................................................14
Table 2.6: Suicide rates for men aged over 20 years per 100,000 person years in Norway in 1960-2000
................................................................................................................................................................15
Table 2.7: Social and demographic risk factors for suicide and suicidal behaviour ..............................17
Table 2.8: Psychiatric risk factors for suicide and suicidal behaviour...................................................17
Table 2.9: Situational risk factors for suicide and suicidal behaviour ...................................................18
Table 2.10: Biological risk factors for suicide and suicidal behaviour..................................................18
Table 2.11: Psychological risk factors for suicide and suicidal behaviour ............................................18
Table 2.12: Protective factors against suicide and suicidal behaviour...................................................19
Table 2.13: Summary of included studies with findings relevant to mental health in veterinarians......21
Table 3.1: Evaluation of depression instruments against selection criteria ...........................................49
Table 3.2: Evaluation of mental well-being instruments against selection criteria................................51
Table 3.3: Evaluation of alcohol use instruments against selection criteria ..........................................52
Table 3.4: Evaluation of suicidal ideation instruments against selection criteria ..................................54
Table 3.5: Evaluation of work-related stress and working conditions instruments against selection
criteria.....................................................................................................................................................55
Table 3.6: Evaluation of work-home interaction instruments against selection criteria ........................57
Table 3.7: Checklist for developing a questionnaire .............................................................................60
Table 3.8: Assessment of suitability of sources of sampling frame against selection criteria ...............64
Table 4.1: Differences between published and Vetfile® database work-type groupings and their
treatment to develop a stratified sample .................................................................................................79
Table 4.2: Use of published sources of the proportions of veterinary surgeons in different types of
work to stratify the random sample selected from the Vetfile® database ...............................................79
Table 5.1: Non-evaluable returns ..........................................................................................................93
Table 5.2: Response rate........................................................................................................................94

xii
Table 5.3: Age and gender distribution of study respondents and RCVS home-practising members ...95
Table 5.4: Year of qualification distribution of study respondents........................................................96
Table 5.5: Veterinary school of qualification distribution of study respondents ...................................97
Table 5.6: Type of work distribution of study respondents and RCVS members .................................98
Table 5.7: Employment status distribution of study respondents and RCVS members.........................99
Table 5.8: Position in practice distribution of study respondents ........................................................100
Table 5.9: Ownership of practice distribution of study respondents ...................................................100
Table 5.10: Respondents holding an RCVS Certificate or Diploma ...................................................101
Table 5.11: HADS sub-scale and total scores, and prevalence of anxiety and depression caseness for
the total sample, by gender and by age group.......................................................................................110
Table 5.12: Estimated odds of HADS-A and HADS-D caseness (score ≥ 8) for gender after adjustment
for age, and for age after adjustment for gender...................................................................................113
Table 5.13: Estimated odds of HADS-A and HADS-D caseness (score ≥ 8) adjusted for gender and
age ........................................................................................................................................................114
Table 5.14: Comparison between HADS results for total sample of veterinary surgeons and normative
data for UK adult general population ...................................................................................................119
Table 5.15: Distribution of responses across each AUDIT-C question ...............................................122
Table 5.16: Proportion of veterinary surgeons in each AUDIT-C drinking category..........................127
Table 5.17: Estimated odds of AUDIT-C at-risk drinking after adjustment for gender and age .........130
Table 5.18: AUDIT-C drinking categories for veterinary surgeons and the general population of Great
Britain...................................................................................................................................................132
Table 5.19: Frequency of drinking, typical quantity consumed and frequency of binge drinking for
veterinary surgeons and the GB general population.............................................................................133
Table 5.20: Twelve-month prevalence of suicidal ideation.................................................................137
Table 5.21: Associations between demographic and occupational factors and 12-month prevalence of
suicidal thoughts...................................................................................................................................138
Table 5.22: Twelve-month prevalence of suicidal thoughts among UK veterinary surgeons, the GB
general population and Norwegian physicians .....................................................................................141
Table 5.23: WEMWBS scores across demographic and occupational factors ....................................146
Table 5.24: The effect of demographic and occupational factors on WEMWBS scores after adjustment
for age and gender ................................................................................................................................148
Table 5.25: WEMWBS scores for veterinary surgeons and the general population of Scotland.........150
Table 5.26: Stressor domain scores for the sample of veterinary surgeons .........................................154
Table 5.27: Percentiles for the mean scores for each stressor domain.................................................155
Table 5.28: Mean stressor domain scores across age groups...............................................................155
Table 5.29: Mean stressor domain scores across veterinary schools ...................................................156
Table 5.30: Mean stressor domain scores across type of work............................................................157
Table 5.31: Mean stressor domain scores across current employment status......................................157
Table 5.32: Mean stressor domain scores across position in the practice............................................158
Table 5.33: Mean stressor domain scores across practice ownership..................................................158

xiii
Table 5.34: Mean stressor domain scores for RCVS Certificate or Diploma holders .........................159
Table 5.35: Mean stressor domain scores across hours worked in a typical week ..............................159
Table 5.36: Mean stressor domain scores across hours on-call in a typical week ...............................160
Table 5.37: Difference between mean stressor domain scores for veterinary surgeons and the general
population.............................................................................................................................................162
Table 5.38: Association between hours worked in a typical week and negative work-home interaction
after adjustment for age and gender .....................................................................................................165
Table 5.39: Association between hours on-call in a typical week and negative work-home interaction
after adjustment for age and gender .....................................................................................................166
Table 5.40: Frequency of reporting each source of satisfaction theme................................................178
Table 5.41: Response rate by gender and for each decade of qualification .........................................179
Table 5.42: Response rate for each type of work.................................................................................180
Table 5.43: Comparative analysis of late responders and earlier responders for HADS-A, HADS-D,
WEMWBS and 12-month prevalence of suicidal thoughts ..................................................................181
Table 6.1: Proposed individual-oriented interventions with potential to help alleviate psychological
distress among veterinary surgeons......................................................................................................215
Table 6.2: Proposed organisation-oriented interventions with potential to help alleviate psychological
distress among veterinary surgeons......................................................................................................216
xiv
LIST OF FIGURES
Figure 2.1: Schematic representation of a hypothetical model to explain the risk of suicide in
veterinary surgeons.................................................................................................................................41
Figure 3.1: Breakdown of veterinary surgeons practising in the UK by employment type...................61
Figure 3.2: Distribution of veterinary surgeons practising in the UK by age and gender .....................62
Figure 3.3: Breakdown of veterinary surgeons in general practice in the UK by type of work ............63
Figure 4.1: Schematic representation of the chronological process of the study...................................66
Figure 4.2: Vet well-being initiative logo .............................................................................................75
Figure 4.3: Home page of www.vetwellbeing.co.uk website ................................................................81
Figure 5.1: Box plots of age distribution of male and female respondents ...........................................96
Figure 5.2: Type of work distribution of study respondents by gender.................................................99
Figure 5.3: Median number of hours worked and on-call in a typical week for each type of work for
study respondents working full-time ....................................................................................................102
Figure 5.4: Number of hours worked in a typical week for male and female study respondents ........103
Figure 5.5: Number of hours on-call in a typical week for male and female study respondents.........104
Figure 5.6: Percentage of missing data for each item prior to imputation...........................................105
Figure 5.7: Prevalence of anxiety, co-morbid depression and anxiety, and depression caseness........111
Figure 5.8: Distribution of HADS-A scores ........................................................................................111
Figure 5.9: Distribution of HADS-T scores ........................................................................................112
Figure 5.10: Distribution of HADS-D scores ......................................................................................112
Figure 5.11: Prevalence of anxiety, co-morbid anxiety and depression, and depression caseness (score
≥ 8) for different types of work ............................................................................................................113
Figure 5.12: Estimated odds of HADS-A caseness (score ≥ 8) and 95% CI adjusted for gender and age
across type of work...............................................................................................................................117
Figure 5.13: Estimated odds of HADS-D caseness (score ≥ 8) and 95% CI adjusted for gender and age
across type of work...............................................................................................................................118
Figure 5.14: Distribution of AUDIT-C total scores among male and female veterinary surgeons .....123
Figure 5.15: Frequency of drinking among veterinary surgeons.........................................................124
Figure 5.16: Typical quantity consumed by veterinary surgeons on days when drinking...................125
Figure 5.17: Frequency of drinking 6 or more units on one occasion .................................................126
Figure 5.18: Prevalence of at-risk drinkers in different 10-year age groups .......................................127
Figure 5.19: Prevalence of at-risk drinkers across number of hours worked or on-call in a typical week
..............................................................................................................................................................129
Figure 5.20: WEMWBS score distribution for sample population of veterinary surgeons .................144
Figure 5.21: Proportion of respondents giving each WEMWBS question response ...........................145
Figure 5.22: Distribution of psychosocial working conditions stressor domain scores.......................153
Figure 5.23: Mean stressor domain scores for veterinary surgeons and normative data for UK general
population and nurses ...........................................................................................................................162
Figure 5.24: Distribution of responses for questions relating to negative work-home interaction......167

xv
Figure 5.25: Negative work-home interaction mean score for veterinary surgeons vs. normative data
..............................................................................................................................................................168
Figure 5.26: Distribution of responses for questions relating to negative work-home interaction......171
Figure 5.27: Positive work-home interaction mean score for veterinary surgeons vs. normative data
............................................................................................................................................................. .172
Figure 5.28: Mean score and SD for personal and work-related stressors ..........................................174
Figure 5.29: Distribution of responses for personal and work-related stressors..................................175
Figure 5.30: Mean score and SD for clinical work-related stressors...................................................176
Figure 5.31: Distribution of responses for clinical work-related stressors ..........................................177

xvi
LIST OF ABBREVIATIONS AND GLOSSARY OF TERMS
ATTRIBUTIONAL
STYLE
An individual's habitual pattern of explanation of
why events happen, i.e. internal or external causes.
AUDIT-C
The alcohol consumption questions of the Alcohol
Use Disorders Identification Test.
CASENESS
A clinically significant level of symptoms which
exceeds a defined threshold and categorises an
individual as possibly having a disorder. It is not a
diagnosis.
CI Confidence interval
HADS
-A
-D
-T
Hospital Anxiety and Depression Scale. A tool for
measuring anxiety and depressive symptoms.
Anxiety sub-scale
Depression sub-scale
Total of anxiety and depression sub-scales
HSE MANAGEMENT
STANDARDS
INDICATOR TOOL
(HSE MSIT)
A tool for measuring psychosocial working
conditions. Comprises seven stressor domains:
demands, control, managerial support, peer support,
relationships, role, and change.
IQR Interquartile range
MENTAL WELL-BEING
A construct comprising both optimal psychological
functioning and the experience of happiness and life
satisfaction.
NEGATIVE
AFFECTIVITY
A personality trait linked to neuroticism and
described as a tendency to perceive negative
emotions.
Continued overleaf

xvii
OR Odds ratio
PMR
Proportional Mortality Ratio. A ratio of how more or
less likely a death in a particular occupation is to be
from suicide as opposed to other causes, than a death
of someone of the same age and gender in the
general population as a whole.
PSYCHOSOCIAL
Psychological processes within the context of a
social environment.
PSYCHOSOCIAL
WORK
CHARACTERISTICS†
Risk factors involved with psychological processes
linked to the social environment of work that may be
important in the causation of illness.
RCVS Royal College of Veterinary Surgeons
SD Standard deviation
SUICIDAL IDEATION
Thoughts about suicide including feelings that life is
not worth living and wishing you were dead.
SWING
Survey Work-home interaction – Nijmegen scale. A
tool for measuring work-home interaction.
WEMWBS
Warwick-Edinburgh Mental Well-being Scale. A
tool for measuring positive mental well-being at a
population level.
WHI
_N
_P
Work-home interaction
Negative work-home interaction
Positive work-home interaction
† The concepts of ‘work characteristics’ and ‘working conditions’ are used
interchangeably in the text and have equivalent meaning

Chapter 1: Introduction 1
CHAPTER 1: INTRODUCTION
1.0 Context
Mortality due to suicide is higher in the veterinary profession than in the general
population, the proportional mortality ratio for suicide being around four times that of
the general population and twice that of other healthcare professions. This pattern of
excess mortality from suicide relative to other causes of death appears to have
remained fairly stable across recent decades. The relative risk of suicide across
occupational groups is often explained by differences in demographic factors but
veterinary surgeons have higher risk of suicide even when these are taken into
account (Charlton 1995).
Little is known regarding the mechanisms of increased suicide risk in the profession.
It is uncertain whether the increased risk derives from the characteristics of
individuals entering the profession, the work environment, or other factors known to
influence suicide. In common with other high risk occupational groups, veterinary
surgeons have ready access to effective means of suicide which may play an
important aetiological role.
Suicide rate is sometimes used as an imperfect proxy indicator of population mental
health status (Bray and Gunnell 2006). The increased suicide risk among veterinary
surgeons may be an indicator of increased psychological morbidity within the
profession. Initiatives to provide mental health support to members of the profession
have been established but there has been no attempt to measure the nature and extent
of psychological morbidity among veterinary surgeons in the UK. Studies of the
profession in other countries are limited in their generalisability to the UK and the
questionnaires employed were mainly self-formulated with limited or no use of
instruments with established psychometric properties.
Research into suicide among veterinary surgeons is important, not only with a view
towards enhancing the well-being of individuals within the profession, but also to
help mitigate the potentially deleterious impact of any mental ill-health among
practitioners on the health and welfare of animals under their care, and the additional

Chapter 1: Introduction 2
insight that research in this professional group might provide into influences on
mental health and well-being in other occupations. Moreover, mental ill-health can
have financial implications for the affected individual, their employer and healthcare
provider.
1.1 Aims and objectives
• To assess psychological symptoms and mental well-being in the UK veterinary
profession, including psychosocial working conditions and work-home
interaction and identify key self-perceived stressors.
• To explore the relationship of mental health and mental well-being with
demographic and occupational factors.
• To compare the estimated population parameters against normative data for the
UK general population (and other professions where possible).
• To use the results to inform proposals for interventions which have the potential
to improve mental health and well-being in the veterinary profession.
1.2 Hypotheses
Null hypothesis 1 (H01). Self-reported measures of mental ill-health, mental well-
being and psychosocial working conditions show no significant associations with
demographic factors (such as age, gender) and occupational factors (such as type of
work, employment status, and hours worked in a typical week).
Study hypothesis 1 (H11). Self-reported measures of mental ill-health, mental well-
being and psychosocial working conditions differ significantly with demographic
factors (such as age, gender) and occupational factors (such as type of work,
employment status, and hours worked in a typical week).

Chapter 1: Introduction 3
Null hypothesis 2 (H02). The veterinary profession does not differ from the general
population on self-reported measures of mental ill-health, mental well-being and
psychosocial working conditions.
Study hypothesis 2 (H12). The veterinary profession has higher levels of mental ill-
health, lower levels of mental well-being and less favourable psychosocial working
conditions, when compared to the general population.
1.3 Approach
Mental health is more than just the absence of mental illness (Parkinson 2006). It also
comprises mental well-being: positive elements of mental health such as life
satisfaction, positive relationships with others and purpose in life. The World Health
Organisation (WHO 2001) describes mental health as:
… a state of well-being in which the individual realises his or her own abilities, can
cope with the normal stresses of life, can work productively and fruitfully, and is
able to make a contribution to his or her community. (p. 1)
In keeping with this broad definition, the current study adopts a comprehensive
approach to the assessment of mental health in the veterinary profession,
complementing indicators of psychological morbidity with measures of mental well-
being and work-home interaction and seeking to identify sources of pleasure in
veterinary work.
A questionnaire was mailed to a stratified random sample of 3200 practising
veterinary surgeons in the UK (approximately 20% of the current Royal College of
Veterinary Surgeons (RCVS) membership [excluding those who are practising
overseas or retired]). A second copy of the questionnaire was mailed to all members
of the sample three weeks later. The paper-based questionnaire was designed to
enable automated data entry using an electronic optical reading system to scan the
returned questionnaires.

Chapter 1: Introduction 4
1.4 Contributions
• Development of a hypothetical model to explain suicide risk in veterinary
surgeons.
• Measurement of the nature and extent of psychological morbidity among
veterinary surgeons in the UK.
• Provides empirical insight into possible mechanisms underlying suicidal
behaviour within the veterinary profession.
• A baseline of measures from which to monitor future change and trends in
mental health and well-being among veterinary surgeons in the UK.
• Informs the development and targeting of evidence-based interventions with
the potential to improve mental health within the veterinary profession.
• Contributes to the general body of knowledge on occupation and suicide and
features of the psychosocial work environment that may influence mental
health and well-being.
1.5 Scope
Inferential statistics are limited to examination of associations between the outcome
measures for a specific scale and demographic or occupational factors such as gender,
age, type of work, employment status and number of hours worked and on-call.
Examination of associations between measures on different scales is outside the scope
of this thesis.
Evaluation of the psychometric properties (validity and reliability) of the scales in the
sample population of veterinary surgeons is limited to Cronbach’s alpha (internal
consistency). Evaluation of other properties is outside the scope of this thesis.
Chapter 1: Introduction 5
1.6 Document structure
Chapter One presents a brief background to the research and its importance for the
veterinary profession. Relevant literature relating to suicidal behaviour and
questionnaire research is reviewed in Chapters Two and Three respectively. Chapter
Four describes the study methodology. The results are presented in Chapter Five.
Chapter Six provides a discussion of the results and makes recommendations for
further research and possible interventions. The study conclusions are described in
Chapter Seven. Supplementary documentation such as copies of the questionnaire and
publications relating to the study are included in the Appendices.
Chapter 2: Understanding suicidal behaviour 6
CHAPTER 2: UNDERSTANDING SUICIDAL BEHAVIOUR
2.0 Introduction
There have been concerns for many years that mortality due to suicide is higher in the
veterinary profession than in the general population (Mellanby 2005).
This chapter reviews the published data on suicide risk in the veterinary profession
and compares it with that in other healthcare professions and the general population.
Published studies across different time periods in the UK consistently report that the
veterinary profession has around four times the proportion of all deaths certified as
suicide than would be expected from the proportion for the general population, and
around twice that for other healthcare professionals. This observation of increased risk
is supported by studies in other countries.
The relative risk of suicide across occupational groups is often explained by
differences in demographic factors but veterinary surgeons have higher risk of suicide
even when these demographic factors are taken into account (Charlton 1995).
There has been much speculation regarding possible mechanisms underlying
increased suicide risk in the profession, but little empirical research.
This chapter presents a narrative synthesis of the central themes reported in the
literature as possible influences on the increased suicide risk. A review of current
knowledge about possible influences on the suicide rate among veterinarians and
factors elevating the risk in other occupations and in the general population is used to
propose a hypothetical model to explain suicide risk in veterinary surgeons. Based on
testable constructs, it attempts to clarify a complex interaction of possible
mechanisms across the career life course and thereby facilitate a more systematic
approach to research in this field.
The chapter ends with a summary of current initiatives to support mental health in the
UK veterinary profession.

Chapter 2: Understanding suicidal behaviour 7
2.1 Literature search methodology
Papers relevant to mental health among veterinary surgeons were identified by
searching PubMed (which includes MEDLINE) and Google Scholar for articles
published after 1970. Search terms included but were not limited to: veterinary and
depression, suicide, stress, burnout, distress, abuse, alcohol drinking, substance-
related disorders, psychosocial working conditions, coping or psychiatry. Additional
articles were identified by scrutinising the reference lists of relevant articles, hand
searching of conference proceedings, examining regular automatic customised e-mail
alerts for relevant new articles in journals (Ovid Autoalert), and by consulting experts.
The search strategy excluded non-English language records. Articles were included as
appropriate to provide a comprehensive structured review of the evidence of increased
suicide risk among veterinary surgeons and possible influences on the increased risk,
including evidence from other occupational groups. Themes were integrated to inform
the development of a hypothetical explanatory model based on testable constructs.
2.2 Suicide statistics
2.2.1 United Kingdom
2.2.1.1 General population
The Office for National Statistics defines ‘suicide’ as deaths given an underlying
cause of intentional self-harm and deaths due to self-injury or poisoning of
undetermined intent. The latter are included as there is evidence that most injuries and
poisonings of undetermined intent (‘open verdicts’) are cases where the harm was
self-inflicted but there was insufficient evidence to prove that the deceased
deliberately intended to kill themselves. Suicide rates based on suicide verdicts alone
are an underestimate of the true rate (Linsley and others 2001, Brock and others 2006).
Suicides represent almost 1 percent of the total of all deaths for ages 15 years and
over in the UK: almost 6000 people killed themselves in 2004, a fall of 7 percent from
the 1991 total (Brock and others 2006). Almost three-quarters of suicides in 2004
were of men and this division between the sexes is broadly similar from 1991
Chapter 2: Understanding suicidal behaviour 8
onwards. Suicide is reported to be the most common cause of death among men aged
15 to 44 years in the general population (Brock and Griffiths 2003, Griffiths and
others 2005, General Register Office for Scotland 2007) and, although suicide rates in
young men have declined markedly and are at their lowest level for almost 30 years
(Biddle and others 2008), suicide remains the most common cause of death among
men in this age range (A. Brock, personal communication).1
2.2.1.2 Veterinary surgeons and other high risk occupations
Several studies from a number of countries have found that members of some
occupational groups are at greatly increased risk of suicide (Agerbo and others 2007),
this elevated risk being seen in healthcare professionals including doctors (Hawton
and others 2001, Schernhammer and Colditz 2004, Torre and others 2005),
pharmacists (Kelly and Bunting 1998), dentists (Alexander 2001) and nurses (Hawton
and Vislisel 1999). Farmers are also at increased risk (Malmberg and others 1999).
In Great Britain the standard method used to make comparisons between the death
rates by suicide in different occupations and the general population is by calculation
of the proportional mortality ratio (PMR). The PMR is a ratio of how more or less
likely a death in a particular occupation is to be from suicide as opposed to other
causes, than a death of someone of the same age and gender in the general population
as a whole. A PMR of 100 indicates that there is no difference in the ratio of suicide
deaths to all deaths in the occupation compared with the general population, while a
PMR for suicide of 200 indicates that twice the expected proportion of suicide deaths
to all deaths was recorded in that occupational group (Kelly and Bunting 1998).
While PMR is a widely used measure, it should be acknowledged that PMR is
affected by the relative frequency of other causes of death. A high PMR can indicate
lower mortality from other causes, as well as higher mortality from the cause being
1 Anita Brock, Senior Research Officer, Mortality Statistics, Office for National Statistics, London. 10 Mar 2008 [E-mail]. Using mortality data for deaths registered in England and Wales in the calendar year of 2006, the most common cause of death among men aged 15 to 44 was suicide and injury or poisoning of undetermined intent (1760 deaths). The second most common cause of death for this group was land transport accidents (1453 deaths).
Chapter 2: Understanding suicidal behaviour 9
examined. Lower mortality from other causes may account for the high PMRs for
suicide identified for some high social class occupational groups, including healthcare
professionals (Kelly and others 1995, Kelly and Bunting 1998, Hawton and others
2001, Meltzer and others 2008). Moreover, lower mortality from other causes may
also explain the apparent paradox between high PMRs for suicide identified for some
high social class occupational groups and robust evidence of an inverse relationship
between occupational social class and risk of suicide; the lower the social class, the
higher the risk (Platt and Hawton 2000). However, Meltzer and others (2008) reported
a high standardised mortality ratio (SMR) for suicide – a population risk statistic
unaffected by the frequency of other causes of mortality – for female veterinarians,
indicating significantly higher suicide mortality than the general population.2
The absolute number of suicides by veterinary surgeons is low due to the small size of
the profession (approximately 16,000 veterinary surgeons practising in the UK), but
there is a substantial literature indicating that the profession is at increased risk
compared to other occupations and the general population. Awareness of the
increased risk has existed for many years. For example, a survey of the causes of
mortality in veterinarians resident in Britain followed up from 1949-1953 to 1975
reported a two-fold increase in mortality from suicide (Kinlen 1983).
On the basis of proportional mortality ratios (PMRs) in England and Wales (Charlton
and others 1993, Kelly and others 1995, Kelly and Bunting 1998, Mellanby 2005,
Meltzer and others 2008) and Scotland (Stark and others 2006a), veterinary surgeons
appear to be at particularly high risk of suicide. In this occupational group the chances
of a death being due to suicide are around four times that of the general population,
and around twice that of other healthcare professionals.
PMRs for the highest risk occupations for men are included in Table 2.1 (England and
Wales) and Table 2.2 (Scotland). The PMR for veterinary surgeons is consistently one
of the highest.
2 SMR=431, 95% CI: 140 to 1005 (England and Wales, 2001-2005)

Chapter 2: Understanding suicidal behaviour 10
Table 2.1: High risk occupational groups for suicide (suicide and open verdicts), men aged 16 to 64
years 1979-1990, men aged 20 to 64 years 1982-1987, 1991-1996 and 2001-2005, England and Wales
PMR 95%
confidence interval 1979-1990 1 Veterinarians 364 NR Pharmacists 217 NR Dentists 204 NR Farmers 187 NR Medical practitioners 184 NR 1982-1987 2 Veterinarians 349 203 to 559 Farmers, horticulturalists, farm managers 202 180 to 226 Librarians, information officers 226 140 to 345 Pharmacists 214 140 to 313 Medical practitioners 175 138 to 218 Dental practitioners 192 117 to 296 1991-1996 2 Dental practitioners 249 161 to 367 Veterinarians 324 148 to 615 Farmers, horticulturalists, farm managers 144 124 to 166 Medical practitioners 147 115 to 185 Garage proprietors 155 112 to 208 Pharmacists 171 111 to 252 2001-2005§, 3 Dental practitioners 292 173 to 461 Farmers 189 157 to 227 Beauticians and related occupations 297 143 to 547 Medical practitioners 165 125 to 214 Artists 171 124 to 229
Within each year range, occupations are listed in descending order of lower confidence interval so that
those most significantly different from the general population appear at the top.
§ Note: The lower 95 percent confidence level of suicide PMR for veterinarians 2001-2005 did not
exceed 100 and is therefore not reported by Meltzer and others (2008).
Sources: 1 Charlton and others (1993); 2 Kelly and Bunting (1998); 3 Meltzer and others (2008)
NR, Not reported

Chapter 2: Understanding suicidal behaviour 11
Table 2.2: Suicide and undetermined intent deaths for men aged 16 to 45 years and 46 to 64 years in
Scotland in 1981-1999
16- to 45-year old men 46- to 64-year old men PMR 95%
confidence interval PMR 95% confidence interval
1981-1999
Veterinarians 293 80 to 749 301 36 to 1088 Medical practitioners 180 118 to 265 205 109 to 351 Dentists 128 26 to 374 235 76 to 548 Pharmacists 43 1 to 238 118 14 to 242
Note: When the 95 percent confidence interval includes 100, the difference between the PMR for an
occupation and the general population is not statistically significant (p<0.05)
Source: Stark and others (2006a)
Mellanby (2005) undertook a detailed analysis using PMRs for deaths by suicide in
England and Wales among veterinarians, medical practitioners and dental
practitioners. The results are summarised in Table 2.3. For both time periods, the
PMR was markedly higher for veterinarians. The PMR for suicide among male
veterinarians remained stable over time. By contrast, the PMR for suicide among
females increased considerably but this must be interpreted with caution due to the
small absolute number of deaths involved. Meltzer and others (2008) also reported a
high PMR for suicide among women veterinarians in 2001-2005 (PMR=609, 95% CI:
198 to 1422).
Mellanby (2005) was unable to complete a detailed analysis of the age, background,
previous health history and type of veterinary work undertaken due to restrictions
imposed to protect individuals’ privacy. However, suicides by veterinary surgeons do
not appear to be confined to a restricted age range (Mellanby 2005, Stark and others
2006a) as the age group distribution of suicides is not substantially different from all
occupations combined (Kelly and others 1995).

Chapter 2: Understanding suicidal behaviour 12
Table 2.3: Mortality from suicide in male veterinarians, medical practitioners and dental practitioners,
and in female veterinarians and medical practitioners, aged 20 to 74 years, in England and Wales in
1979-1990 (excluding 1981)¤ and 1991-2000
PMR 95 percent confidence interval
1979 -1990 (excluding 1981)
Male Veterinarians 361 252 to 503 Medical practitioners 162 106 to 262 Dental practitioners 194 137 to 266 Female Veterinarians 414 166 to 853 Medical practitioners 193 143 to 254 1991- 2000 Male Veterinarians 374 244 to 548 Medical practitioners 175 147 to 206 Dental practitioners 227 162 to 309 Female Veterinarians 1240 446 to 2710 Medical practitioners 462 339 to 614
¤ Excluded because the data were incomplete for that year
Source: Mellanby (2005)
There are many difficulties when comparing the risk of suicide across occupational
groups. These include the effects of different socio-demographic factors both between
occupations and within occupational specialisms. It is important that confounding by
such factors is adequately controlled (Wilhelm and others 2004). While most
differences in suicide risk between occupations are accounted for by differences in
income and employment status, the most striking exceptions are for veterinary
surgeons, doctors, nurses and pharmacists, all having significantly higher rates of
suicide even when demographic factors are taken into account (Charlton 1995, Stack
2001, Agerbo and others 2007). Charlton (1995) linked data from death certificates
and characteristics of the electoral ward of the deceased individuals’ usual residence
to undertake a case-control analysis of suicide risk. Table 2.4 shows the relative risk
of suicide among veterinarians and other high risk occupational groups after
controlling for demographic factors in the reference group. The risk of suicide relative

Chapter 2: Understanding suicidal behaviour 13
to death from other causes, among male veterinarians aged 16 to 44 years and 45 to
64 years and female veterinarians aged 16 to 64 years, is elevated by 4.6, 5.6 and 7.6
times respectively, in comparison with individuals in the general population with
similar demographic characteristics.
Table 2.4: Relative risk (RR)† of suicide in high risk occupational groups for men aged 16 to 44 years
and 45 to 64 years and females aged 16 to 64 years, in England and Wales in 1990-1992, compared
with reference groups§
Men aged 16-44 Men aged 45-64 Women aged 16-64‡
RR 95%
confidence interval
RR 95%
confidence interval
RR 95%
confidence interval
Veterinarians 4.61 1.49 to 14.25* 5.62 1.60 to 19.74* 7.62 1.04 to 55.94* Pharmacists 1.15 0.37 to 3.52 4.15 2.00 to 8.58** 1.21 0.27 to 5.35 Dentists 2.26 0.93 to 5.47 5.19 2.29 to 11.76** - - Farmers 0.88 0.60 to 1.30 1.93 1.48 to 2.51** - - Medical practitioners 1.50 0.90 to 2.50 2.22 1.35 to 3.65* 4.54 2.54 to 8.13**
† Risk is relative to deaths from other causes
§ Reference groups are married; UK-born; corresponding age range; not in the 10 highest occupational
groups; in urban wards with owner occupancy >85%; unemployment <5%; <6.5% of occupants
changing address per year; <9% of adults below pensionable age living alone
‡ No significant model differences for women under and over age 45
* p<0.01; ** p<0.001
Source: Charlton (1995)
Table 2.5 shows for men and women the distribution of suicides by method for
veterinary surgeons and all occupations combined. Deliberate self-poisoning is the
most common method of suicide in male and female veterinarians, accounting for 76
and 89 percent of suicides respectively, compared to 20 and 46 percent respectively of
suicides in the general population of England and Wales (Kelly and Bunting 1998).
Veterinary surgeons and pharmacists have the highest proportions of suicides using
this method for all occupational groups; medical practitioners also have an increased
risk of this specific method of suicide (Kelly and Bunting 1998, Hawton and others
2000, Agerbo and others 2007). There are many reports of the use of medicines for

Chapter 2: Understanding suicidal behaviour 14
veterinary anaesthesia and euthanasia as suicide agents (for example, Clark and Jones
1979, Cordell and others 1986, Smith and Lewis 1989, Stowell 1998, Elliott and Hale
1999, Résière and others 2001, Kintz and others 2002, Romain and others 2003,
Elejalde and others 2003, Sterken and others 2004). Barbiturates are the drugs most
commonly used for suicide by doctors (Hawton and others 2000) and were used by at
least half of male veterinary surgeons who died by suicide by deliberate self-
poisoning between 1982 and 1996 in England and Wales (Kelly and others 1995).
Firearms are the second most common method of suicide by male veterinary surgeons
which is also raised relative to the general population, accounting for 16 percent and 5
percent of suicides respectively (Kelly and Bunting 1998).
Table 2.5: Percentage distribution of suicides by method for veterinarians and combined suicides for
all occupations, for males aged 20 to 64 years and for females aged 20 to 59 years, in England and
Wales, 1982 to 1996
Suicide method Poisoning by solid or liquid
substances
Poisoning by other
gases and vapours
Hanging and
suffocation Drowning
Firearms and
explosives Other
Male Veterinarians 76 3 5 0 16 0 All men 20 27 27 6 5 16 Female Veterinarians 89 11 0 0 - 0 All women 46 10 17 9 - 18
Note: Percentages may not add to 100 due to rounding Source: Kelly and Bunting (1998)
2.2.2 Rest of the world
International comparisons of suicide risk by occupation are hindered by variation
between countries in the classification and recording of suicides (Andriessen 2006)
and the use of a range of different measures of suicide risk across the literature.
A study of mortality patterns among US veterinarians from 1947 to 1977 showed
significantly elevated mortality from suicide relative to death from other causes for

Chapter 2: Understanding suicidal behaviour 15
males (PMR=170), particularly for those in small animal practice (PMR=357), and
with a higher proportion of self-poisonings compared with the general population
(Blair and Hayes 1980, Blair and Hayes 1982). Barbiturates were the drugs most
commonly used for suicide. In a separate study in California, male and female
veterinarians had significantly elevated mortality from suicide of, respectively, 2.5
times and 5.9 times the rate in the general population of that state. Mortality from
suicide was significantly elevated for veterinarians who had worked in the profession
for fewer than 30 years (Miller and Beaumont 1995). Elevated mortality from suicide
relative to death from other causes is also reported for male (PMR=197) and female
(PMR=180) veterinarians in Washington State, from 1950 to 1999 and 1974 to 1999
respectively (Milham and Ossiander 2001).
In a large study in Norway which examined suicide deaths by occupation over a 40-
year period (Hem and others 2005), the highest rate was among male veterinarians
with a suicide rate approaching twice that in the general population. Suicide rates for
different healthcare professions are summarised in Table 2.6.
Table 2.6: Suicide rates for men aged over 20 years per 100,000 person years in Norway in 1960-2000
Suicide rate per 100,000 person years
95% confidence interval
Veterinarians 44 25 to 75 Physicians 43 35 to 53 Dentists 33 23 to 46 Pharmacists 29 13 to 64
General population 23 23 to 24
Source: Hem and others (2005)
Using a similar method, a suicide rate among veterinary surgeons of 45 per 100,000
person years (95% CI: 25 to 82 per 100,000) was reported for two Australian states
combined, approximately four times the rate in the general population for the states
concerned (Fairnie 2005, Jones-Fairnie and others 2008). The principal method of
suicide was self-poisoning by drugs, mainly injectable barbiturates, and the suicides
were not confined to a restricted age range; the age distribution of suicides for

Chapter 2: Understanding suicidal behaviour 16
veterinary surgeons was not substantially different from the Australian general
population.
2.3 Risk factors for suicide and suicidal behaviour
Suicide and suicidal behaviour is thought to result from a complex interplay of risk
and protective factors that are biological, psychological, and social in nature. Mental
health disorders play the strongest role in the aetiology of suicidal behaviour.
Psychological autopsy studies report that around 90 percent of those dying by suicide
or making serious suicide attempts have a mental health disorder, most frequently
depression and/or alcohol misuse (Cavanagh and others 2003). However, while a
mental health disorder is generally a necessary condition for suicide, it is not
sufficient. Most psychiatric patients do not die by suicide (Mann and others 1999).
Additional risk and protective factors are also involved.
An understanding of risk factors for suicide and suicidal behaviour in the general
population provides a foundation for elaborating possible mechanisms to explain
suicidal behaviour within a specific occupational group.
The risk factors for suicide act either distally (‘upstream’), or proximally
(‘downstream’). Distal risk factors affect the threshold for suicide and indirectly
increase an individual’s risk when they experience a proximal risk factor. Proximal or
trigger factors are temporally closer to the suicidal behaviour and often act as
precipitants (Mościcki 1997). The risk factors for suicide and suicidal behaviour can
be broadly categorised into social and demographic, psychiatric, situational,
biological and psychological and are summarised in Tables 2.7 to 2.11 respectively.

Chapter 2: Understanding suicidal behaviour 17
Table 2.7: Social and demographic risk factors for suicide and suicidal behaviour Social and demographic Age The highest suicide rates in the UK are among young men aged 15-44 years.
Among women, the highest rates are for those aged 75 years and over (Brock and others 2006)
Gender Almost three-quarters of suicides in the UK are of men (Brock and others 2006). Women are twice as likely to experience major depression but their greater inclination to consult friends, readiness to accept help and willingness to change their minds helps protect against suicide (Murphy 1998). Women are more likely to make non-fatal suicide attempts (Miller and others 2004)
Marital status
The suicide rate for divorced, widowed or single (never married) men and women is around three times higher than for married men and women (Griffiths and others 2008)
Education
Risks are elevated among individuals who have poor or limited education (Gould and others 1996)
Religion Risks are elevated among those without religious affiliation (Neeleman 1998) Socio-economic status Risks are inversely related to social class (the lower the class, the higher the
rate) (Platt and Hawton 2000) Unemployment Risks are higher among the unemployed (Platt and Hawton 2000) Occupational group
Risk is higher for those working in medical and allied professions, farmers and nurses (Platt and Hawton 2000)
Rural location Greater risk of male suicide in remote rural areas relative to urban areas and lower risk of female suicide in accessible rural areas (Levin and Leyland 2005). Rural location may create geographic, psychological, and socio-cultural barriers to treatment of suicide (Hirsch 2006)
Ethnic origin
Suicide rate varies between countries and between ethnic groups within countries (McKenzie and others 2003)
Table 2.8: Psychiatric risk factors for suicide and suicidal behaviour Psychiatric Mood disorders Mood disorders are the mental health disorders most commonly associated
with suicide. Risk of suicide is increased twenty-fold for those with major depression (Harris and Barraclough 1997)
Substance misuse Alcohol misuse predisposes to suicidal behaviour through its depressogenic and disinhibitory effects and promotion of adverse life events (Brady 2006)
Anxiety disorders Anxiety disorders are an independent risk factor for subsequent onset of suicidal ideation and attempts (Sareen and others 2005). Co-morbid anxiety disorders amplify the risk of suicidal behaviour in persons with mood disorders (Sareen and others 2005, Hawgood and De Leo 2008)
Schizophrenia Risk of suicide is increased thirty- to forty-fold for those with schizophrenia (Harris and Barraclough 1997)
Personality disorders Personality disorders are associated with increased risk of suicide and suicide attempt, independently and co-morbidly with other mental health disorders (Schneider and others 2006)
Co-morbidity Co-existence of multiple mental health disorders is associated with increased suicide risk (Cavanagh and others 2003)
Previous suicidal behaviour
Individuals who make non-fatal suicide attempts are at higher risk of further suicide attempts and completed suicide (Hawton and others 2003)
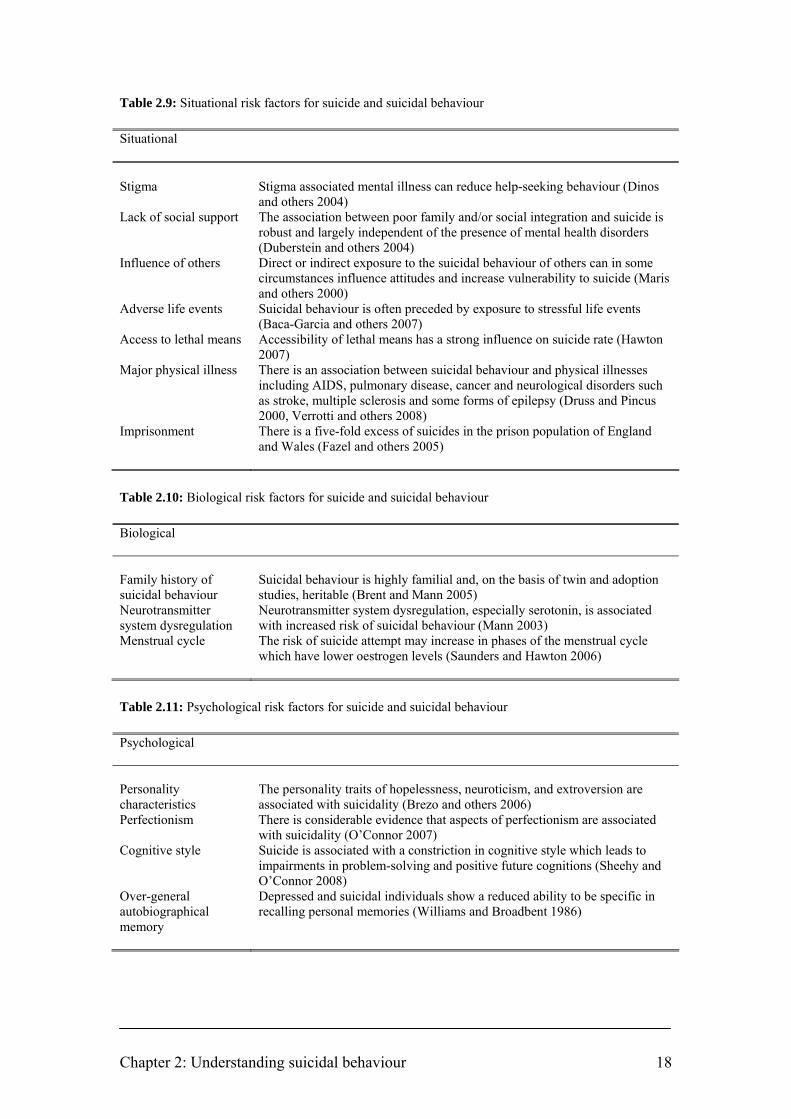
Chapter 2: Understanding suicidal behaviour 18
Table 2.9: Situational risk factors for suicide and suicidal behaviour Situational Stigma Stigma associated mental illness can reduce help-seeking behaviour (Dinos
and others 2004) Lack of social support The association between poor family and/or social integration and suicide is
robust and largely independent of the presence of mental health disorders (Duberstein and others 2004)
Influence of others Direct or indirect exposure to the suicidal behaviour of others can in some circumstances influence attitudes and increase vulnerability to suicide (Maris and others 2000)
Adverse life events Suicidal behaviour is often preceded by exposure to stressful life events (Baca-Garcia and others 2007)
Access to lethal means Accessibility of lethal means has a strong influence on suicide rate (Hawton 2007)
Major physical illness There is an association between suicidal behaviour and physical illnesses including AIDS, pulmonary disease, cancer and neurological disorders such as stroke, multiple sclerosis and some forms of epilepsy (Druss and Pincus 2000, Verrotti and others 2008)
Imprisonment There is a five-fold excess of suicides in the prison population of England and Wales (Fazel and others 2005)
Table 2.10: Biological risk factors for suicide and suicidal behaviour Biological Family history of suicidal behaviour
Suicidal behaviour is highly familial and, on the basis of twin and adoption studies, heritable (Brent and Mann 2005)
Neurotransmitter system dysregulation
Neurotransmitter system dysregulation, especially serotonin, is associated with increased risk of suicidal behaviour (Mann 2003)
Menstrual cycle The risk of suicide attempt may increase in phases of the menstrual cycle which have lower oestrogen levels (Saunders and Hawton 2006)
Table 2.11: Psychological risk factors for suicide and suicidal behaviour Psychological Personality characteristics
The personality traits of hopelessness, neuroticism, and extroversion are associated with suicidality (Brezo and others 2006)
Perfectionism There is considerable evidence that aspects of perfectionism are associated with suicidality (O’Connor 2007)
Cognitive style Suicide is associated with a constriction in cognitive style which leads to impairments in problem-solving and positive future cognitions (Sheehy and O’Connor 2008)
Over-general autobiographical memory
Depressed and suicidal individuals show a reduced ability to be specific in recalling personal memories (Williams and Broadbent 1986)

Chapter 2: Understanding suicidal behaviour 19
2.4 Protective factors against suicide and suicidal behaviour
Protective factors are those which are thought to buffer against suicidal behaviour
during periods of risk such as adverse life events. Empirical evidence on risk factors
for suicide and suicidal behaviour is far more abundant than that on protective factors,
which remain largely at a theoretical level of discussion (Bertolote 2004).
Those protective factors which are not merely positive configurations of the risk
factors outlined above are listed in Table 2.12 below.
Table 2.12: Protective factors against suicide and suicidal behaviour
Protective factors Reasons for living (e.g. parenthood) Good emotional relationship Survival and coping skills and beliefs Family and social connectedness Problem-solving confidence Internal locus of control Fear of social disapproval Moral objections to suicide Religious participation Physical activity and health
Sources: Malone and others (2000), Donald and others (2005), McLean and others (2008)
2.5 Towards a hypothetical model to explain suicide risk in veterinary surgeons
The stress-diathesis model of suicidal behaviour (Mann and others 1999) posits that
suicidal behaviour results from the interaction between stressful life events and
individual predisposition or vulnerability. This vulnerability, itself the product of
psychobiological factors, genetics and past life events, influences how the individual
perceives, interprets and reacts to adverse life events. It is a dynamic system in which
stress and diathesis influence each other (van Heeringen 2002).
The relationship between occupation and suicide can be conceptualised as a model
comprising four components contributing to differential occupational suicide risk:
demographics (the demographic composition of people in the occupation); internal

Chapter 2: Understanding suicidal behaviour 20
occupational stress (stress associated with the nature of the work); pre-existing
psychiatric morbidity (the psychological profile of those attracted to the occupation);
and opportunity factors (opportunities available for access to lethal means of suicide)
(Stack 2001).
A review of current knowledge about possible influences on the suicide risk among
veterinarians and factors elevating the risk in other occupations and in the general
population has been used to develop a comprehensive hypothetical model3 to explain
suicide risk in veterinary surgeons. The model is congruent with the stress-diathesis
and differential occupational risk models of suicide described above.
Based on specific testable constructs, the model attempts to clarify a complex
interaction of possible mechanisms across the career life course and may serve as a
useful heuristic to facilitate a more focused and systematic approach to research.
Research is required to validate or disprove the component hypotheses.
Studies with findings relevant to mental health in veterinary surgeons are summarised
in Table 2.13.
3 Development of the model is reported in the following publications: BARTRAM, D.J. & BALDWIN, D.S. (2008) Veterinary surgeons and suicide: influences, opportunities and research directions. Veterinary Record 162, 36-40 BARTRAM, D.J. & BALDWIN, D.S. (2008) Veterinary surgeons and suicide: a hypothetical model to explain risk. Proceedings of 12th European Symposium on Suicide and Suicidal Behaviour, 27-30 August, 2008. Glasgow, Scotland. pp 57-58
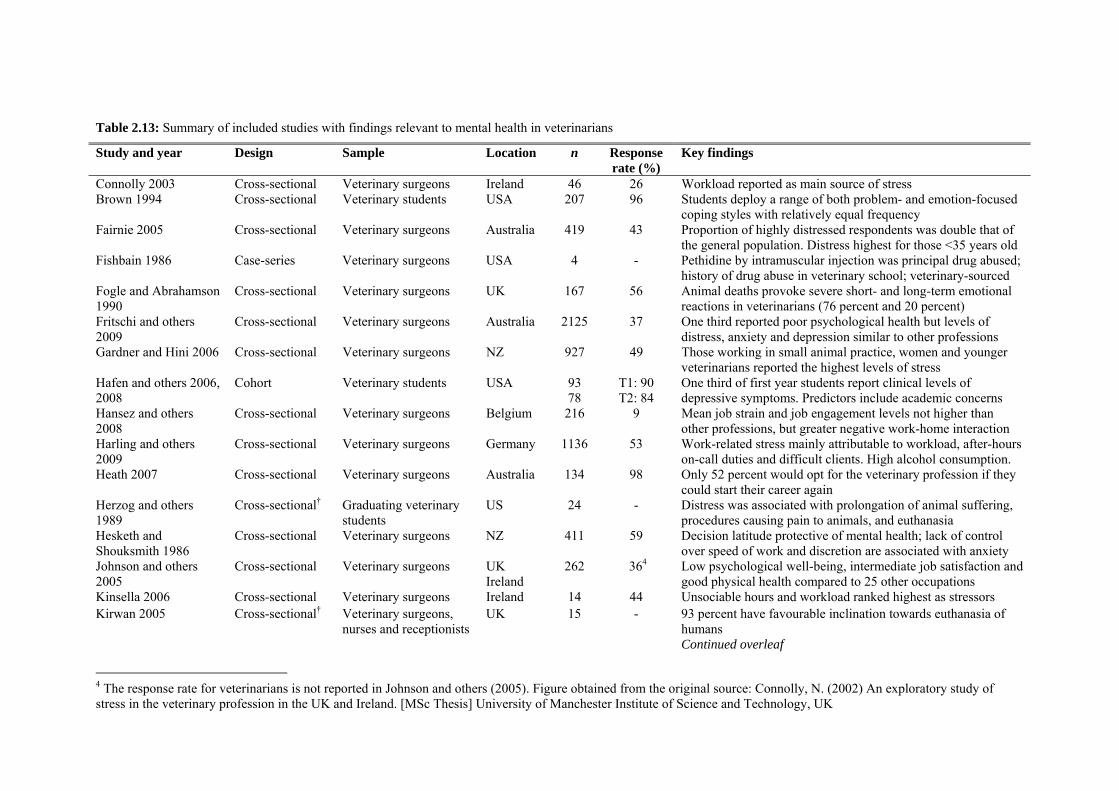
Table 2.13: Summary of included studies with findings relevant to mental health in veterinarians
Study and year Design Sample Location n Response rate (%)
Key findings
Connolly 2003 Cross-sectional Veterinary surgeons Ireland 46 26 Workload reported as main source of stress Brown 1994
Cross-sectional Veterinary students USA 207 96 Students deploy a range of both problem- and emotion-focused coping styles with relatively equal frequency
Fairnie 2005
Cross-sectional Veterinary surgeons
Australia 419 43 Proportion of highly distressed respondents was double that of the general population. Distress highest for those <35 years old
Fishbain 1986 Case-series Veterinary surgeons
USA 4 - Pethidine by intramuscular injection was principal drug abused; history of drug abuse in veterinary school; veterinary-sourced
Fogle and Abrahamson 1990
Cross-sectional Veterinary surgeons
UK 167 56 Animal deaths provoke severe short- and long-term emotional reactions in veterinarians (76 percent and 20 percent)
Fritschi and others 2009
Cross-sectional Veterinary surgeons
Australia 2125 37 One third reported poor psychological health but levels of distress, anxiety and depression similar to other professions
Gardner and Hini 2006 Cross-sectional Veterinary surgeons NZ 927 49 Those working in small animal practice, women and younger veterinarians reported the highest levels of stress
Hafen and others 2006, 2008
Cohort Veterinary students USA 93 78
T1: 90 T2: 84
One third of first year students report clinical levels of depressive symptoms. Predictors include academic concerns
Hansez and others 2008
Cross-sectional Veterinary surgeons Belgium 216 9 Mean job strain and job engagement levels not higher than other professions, but greater negative work-home interaction
Harling and others 2009
Cross-sectional Veterinary surgeons
Germany 1136 53 Work-related stress mainly attributable to workload, after-hours on-call duties and difficult clients. High alcohol consumption.
Heath 2007 Cross-sectional Veterinary surgeons
Australia 134 98 Only 52 percent would opt for the veterinary profession if they could start their career again
Herzog and others 1989
Cross-sectional† Graduating veterinary students
US 24 - Distress was associated with prolongation of animal suffering, procedures causing pain to animals, and euthanasia
Hesketh and Shouksmith 1986
Cross-sectional Veterinary surgeons NZ 411 59 Decision latitude protective of mental health; lack of control over speed of work and discretion are associated with anxiety
Johnson and others 2005
Cross-sectional Veterinary surgeons UK Ireland
262 364 Low psychological well-being, intermediate job satisfaction and good physical health compared to 25 other occupations
Kinsella 2006 Cross-sectional Veterinary surgeons Ireland 14 44 Unsociable hours and workload ranked highest as stressors Kirwan 2005 Cross-sectional† Veterinary surgeons,
nurses and receptionists UK 15 - 93 percent have favourable inclination towards euthanasia of
humans Continued overleaf
4 The response rate for veterinarians is not reported in Johnson and others (2005). Figure obtained from the original source: Connolly, N. (2002) An exploratory study of stress in the veterinary profession in the UK and Ireland. [MSc Thesis] University of Manchester Institute of Science and Technology, UK

Study and year Design Sample Location n Response rate (%)
Key findings
Kogan and others 2005 Cross-sectional Veterinary students USA 233 44 Non-academic stressors include additional employment, relationship concerns and poor self-care habits
Martin and others 2003 Cross-sectional Veterinary students USA 146 NR Human-animal bond influences decisions to become veterinarians, especially for women
Martin and Taunton 2005
Cross-sectional Veterinary surgeons
USA 415 26 81 percent indicated that the human-animal bond was important to their decisions to become veterinarians, especially for women
Mellanby and Herrtage 2004
Cross-sectional Recent graduates
UK 108 27 Poor supervision, minimal support, many mistakes result in distress to veterinarians
Paul and Podberscek 2000
Cross-sectional Veterinary students UK 319 NR Females have higher emotional empathy with animals which is sustained throughout course for females but declines for males
Phillips-Miller and others 2000, 2001
Cross-sectional Veterinary surgeons
USA 305 54 Women report greater effects of marital and family stress and lower spousal support
Ptacek and others 2004 Cross-sectional† Veterinary surgeons
USA 62 - Communicating bad news is stressful and, for some individuals, the feelings of stress are prolonged
Reijula and others 2003
Cross-sectional Veterinary surgeons Finland 785 67 Those working in towns or involved in education and research reported the most stress
Robinson and Hooker 2006
Cross-sectional Veterinary surgeons UK 9671 47 Work is perceived as stressful by 80 percent of profession Only 53 percent would choose veterinary career again
Routly and others 2002
Cross-sectional Recent graduates Senior partners
UK 58 34
54 59
Main difficulties for new graduates are being on call, financial aspects of the role, and lack of surgical competence
Serpell 2005 Cross-sectional Veterinary students USA 302 92 Females have greater concern for animal welfare/rights Interactions with animals influences attitudes and career choice
Trimpop and others 2000a, b
Cross-sectional Veterinary surgeons Support staff
Germany 494 284
NR Stress associated with long working hours was a predictor of traffic accident rates
Unpublished 20025 Cross-sectional Veterinary surgeons Support staff
Australia 313 183
34 20
Euthanasia, specific client behaviours or characteristics, and long working hours were important stressors
Williams and others 2005
Cross-sectional Veterinary students USA 57 41 Narrow range of effective coping strategies
Zenner and others 2005
Cross-sectional Veterinary students USA 61 80 Psychological characteristics similar to other high-achieving populations
5 News. ‘Survey details stress factors that influence Australian vets’. Australian Veterinary Journal 80, 522-524, September 2002. Available at www.ava.com.au/avj/0209/02090513.pdf [Accessed 04 Mar 2008]
NR: Not reported † Interview-based; all other included studies are questionnaire-based

Chapter 2: Understanding suicidal behaviour 23
2.5.1 Possible influences on suicide risk among veterinary surgeons
Risk factors for suicide include depression, alcohol and drug misuse, inherited factors,
certain personality traits, and environmental factors such as chronic major difficulties,
and undesirable life events (Goldney 2005). Several circumstances may elevate risk in
specific occupations and, although the reasons are unclear, an interplay between
various potentially malign influences is suggested for the veterinary profession.
The interrelations of work, personality and mental health are well documented
(Stansfeld 2002) but reports specific to the veterinary profession (such as Halliwell
and Hoskin 2005) have tended to simply present the observations and opinions of
concerned individuals. These commentaries offer prima facie compelling concepts,
but there is a paucity of research to test their veracity. Little is known about the scope
and magnitude of problematic outcomes, possible predisposing factors, or effective
interventions in veterinarians.
2.5.1.1 Access to means of suicide
Suicidal impulses are often brief and, at the point at which a person feels hopeless and
suicidal, ready access to means of suicide may be the key factor that influences
translation of suicidal thoughts into an actual suicide act (Hawton 2007). Access to
potentially lethal means has a strong influence on suicide rate: decreases in rate have
been associated with changes to non-toxic domestic gas from coal gas, installation of
catalytic converters in cars, smaller over-the-counter pack sizes of paracetamol, and
installation of barriers on high bridges (Bennewith and others 2007, Hawton 2007).
Availability and knowledge of medicines is likely to contribute to the suicide risk in
doctors (Hawton and others 2000). Veterinary surgeons also have ready access to
medicines as they are typically stored in practice premises, and knowledge of
medicines for self-poisoning, offering possible contributory factors for the high
suicide risk. Veterinary surgeons are also less supervised in their use of medicines
than are doctors (Fishbain 1986).

Chapter 2: Understanding suicidal behaviour 24
Methods of suicide for occupational groups are described in Section 2.1.1.2 and Table
2.5. Deliberate self-poisoning is the most common method of suicide in both male and
female veterinarians, accounting for 76 and 89 percent of suicides respectively,
compared to 20 and 46 percent respectively of suicides in the general population
(Kelly and Bunting 1998). Veterinary surgeons and pharmacists have the highest
proportions of suicides using this method for all occupational groups; medical
practitioners also have an increased risk of this specific method of suicide (Kelly and
Bunting 1998, Hawton and others 2000, Agerbo and others 2007). Even when deaths
by medicines were excluded, suicide rates in doctors remained slightly elevated
(Agerbo and others 2007), suggesting that ready availability of lethal means is not the
only factor operating to increase their occupational suicide risk (Reichenberg and
MacCabe 2007).
Firearms are the second most common method of suicide by male veterinary surgeons
which is also raised relative to the general population, accounting for 16 percent and 5
percent of suicides respectively (Kelly and Bunting 1998). Veterinary surgeons
working in equine, farm animal and mixed practice have ready access to firearms for
euthanasia of large animals.
Farmers who die by suicide also tend to use methods to which they have easy access,
especially firearms (Hawton and others 1998, Stark and others 2006b).
2.5.1.2 Attitudes to death and euthanasia
Veterinary surgeons are frequently responsible for ending the lives of animals, either
directly in the case of euthanasia, or indirectly in the case of slaughter of meat-
producing livestock. The emotional intensity of the relationships that often develop
between people and their pets is such that it is the veterinary profession’s routine
experience to discuss, justify the legitimacy of, and ultimately administer euthanasia
to animals that are considered by their owners to be virtual persons (Sanders 1995).
Familiarity with death and dying may affect attitudes within the profession in regard
to the expendability of human life (Charlton and others 1993). Ninety-three percent of
veterinary healthcare workers interviewed in a small-scale study indicated a

Chapter 2: Understanding suicidal behaviour 25
favourable inclination towards euthanasia of humans (Kirwan 2005). This is a higher
proportion than reported in the general population (Clery and others 2007) and
contrasts with prevailing medical opinion (Seale 2009), although comparison of these
studies is confounded by dissimilar research methods. Positive associations have been
demonstrated between tolerance of suicide (more permissive attitudes towards
euthanasia, physician-assisted suicide and unassisted suicide) and suicidal thoughts
and behaviour (Neeleman and others 1997, Etzersdorfer and others 1998, Zemaitiene
and Zaborskis 2005, Gibb and others 2006, Joe and others 2007).
The theory of cognitive dissonance (Harmon-Jones and Harmon-Jones 2007) – that
psychological discomfort arising from conflicting thoughts or beliefs motivates the
modification of existing, or the acquisition of new, thoughts and beliefs to reduce the
inconsistency and discomfort – may offer an explanation for any effect of euthanasia
attitudes on suicide risk. Veterinary surgeons may experience uncomfortable tensions
between their desire to preserve life and an inability to treat a case effectively, which
could be ameliorated by modifying attitudes to preserving life to perceive euthanasia
as a positive outcome. This altered attitude to death may then facilitate self-
justification and lower inhibitions towards suicide as a rational solution to their own
problems.
2.5.1.3 Suicide ‘contagion’
Direct or indirect exposure to the suicidal behaviour of others can in some
circumstances influence attitudes and increase vulnerability to suicide (Maris and
others 2000). Knowledge of individual suicides can travel readily through the social
networks of a small profession and awareness of specific members of the profession
who have completed suicide, or of high levels of suicide in professional peers
generally, may normalise suicide and be a contributory risk factor for suicidal
behaviour in veterinary surgeons, creating a suicide ‘contagion’ effect among
vulnerable individuals within this high-risk occupational group.

Chapter 2: Understanding suicidal behaviour 26
2.5.1.4 Cognitive and personality factors
Cognitive and personality factors are relevant in the understanding of psychological
distress and may be important in the prediction of suicide risk (Sheehy and O’Connor
2008). These factors include problem-solving deficits, memory and thinking biases,
negative cognitive style, neuroticism, impulsivity, hopelessness, self-criticism and
rumination (Williams and Pollock 2002, O’Connor 2007, O’Connor and Noyce 2008).
The relationship between personality factors and vocational interest is well
documented (Mount and others 2005). Individuals may have a preference for, or be
preferentially selected into, certain occupations based on their personality or life
experiences, which could render them either more vulnerable or resilient to the work
environment (Kohn and Schooler 1982, Stansfeld 2002, Wilhelm and others 2004).
Personality profiles of medical students (Meit and others 2007) and doctors (Clack
and others 2004) differ from those of the general population and there are associations
between personality factors and choice of medical speciality (Borges and Savickas
2002): for example, mental health workers are more likely to have early experiences
of childhood trauma and family dysfunction than other professions (Elliott and Guy
1993); and women psychiatrists are more likely than women in other medical
specialities to report personal or family histories of psychiatric disorder (Frank and
others 2001). It is possible that such self-selection operates in the veterinary
profession. The choice of a veterinary career may be subconsciously influenced by
factors such as a preference for working with animals rather than people: previous
interactions with animals may play a critical role in guiding veterinary students into
their chosen career (Martin and others 2003, Martin and Taunton 2005, Serpell 2005).
The profession may be particularly vulnerable to suicide because of selection based
on the very high academic entry requirements into veterinary schools (Halliwell and
Hoskin 2005). Admission requirements lead to an undergraduate cohort in which
students with a history of outperforming their peers are grouped with similarly high
academic achievers to create an environment in which some students chronically
question their own abilities and fear that they will be exposed as intellectual frauds
(Zenner and others 2005). Similar sentiments were expressed frequently by US
Chapter 2: Understanding suicidal behaviour 27
veterinary students during counselling (Kogan and others 2005). This situation also
applies in students of other health professions and predisposes to psychological
problems among those who do not adjust and ensure their expectations of their
performance are realistic (Henning and others 1998).
Psychometric evaluations demonstrated that first-year students at a US veterinary
school possessed psychological characteristics consistent with other high-achieving
competitive performance populations such as professional athletes (Zenner and others
2005): students had elevated anxiety levels, placed significant value on positive
comparisons with the competence of peers, and harboured a fear of failure. Certain
dimensions of perfectionism – high personal standards and perception of parental
expectations – were elevated in this student population. There is considerable
evidence that aspects of perfectionism including socially prescribed perfectionism (a
belief that others hold unrealistic and exaggerated expectations of us which must be
met in order to gain acceptance and approval), self-criticism, concern about mistakes,
and doubts about action, are associated with suicidality (O’Connor 2007).
Voracek (2004) reported a positive association of intelligence with suicide, but others
(such as Gunnell and others 2005, Andersson and others 2008) have reported inverse
associations. Cognitive performance in childhood appears to be significantly and
inversely related to morbidity and mortality in adulthood, even at the higher end of
the intelligence continuum and independent of childhood socio-economic status
(Martin and Kubzansky 2005).
Halliwell and Hoskin (2005) conjectured that the highly demanding veterinary
undergraduate course has the potential to stifle the development of communication
skills and emotional maturity, possibly more so than in the medical curriculum. The
considerable volume and pace of learning at veterinary school is a stressor for
students (Gelberg and Gelberg 2005). Rice (2008) speculated that a factor influencing
the elevated suicide risk could be that undergraduate admission criteria based on high
academic achievement might select a greater proportion of students with low
‘emotional intelligence’ (EI), described as the ability to perceive emotions in oneself
and others, integrate emotions into thought processes, understand emotions, and

Chapter 2: Understanding suicidal behaviour 28
moderate emotions in oneself and others (Mayer and Salovey 1997). However, there
is a strong positive correlation between several dimensions of EI and academic
achievement (for example, Parker and others 2004, Petrides and others 2004, Austin
and others 2005) so it seems unlikely that the current admissions procedure inevitably
selects a high proportion of students with low EI. A recent meta-analysis of 44 studies
demonstrated that EI is positively associated with mental health (Schutte and others
2007). Although the methodologies of the meta-analysis and the studies on which it is
based do not provide evidence regarding causality, it may be that the better perception,
understanding, and management of emotion among individuals with higher EI make it
less likely that they will experience mental health problems. Fostering EI may have a
place in veterinary education to improve the veterinary surgeon-client relationship and
act as a buffer against stress in the profession (Gelberg and Gelberg 2005, Timmins
2006). However, Timmins (2006) cautions that the concept of EI is relatively new and
is not without controversy. There are disagreements regarding the definition of the
term and the reliability and validity of available instruments for measuring it and no
direct evidence that improving the EI of students or veterinarians will result in
specific outcomes that have been identified as desirable for the profession.
Personality traits of hopelessness, neuroticism and extraversion may be major
influences on suicide (Brezo and others 2006). A longitudinal study of a large cohort
of UK medical graduates showed that career stress, burnout and satisfaction were
predicted by trait measures of personality assessed five years earlier as medical
students (McManus and others 2004). A six-year longitudinal and nationwide study of
Norwegian medical students demonstrated that the traits of neuroticism and high
conscientiousness are risk factors for stress (Tyssen and others 2007). Tyssen and
others (2001a, 2001b, 2004) have shown that specific personality traits and depression
are common predictors of mental health problems and suicidal ideation and
behaviours among medical students and young doctors, and demonstrated the utility
of screening final year medical students to identify a sub-group suitable for
intervention.
Little is known about the coping strategies used by veterinary surgeons. Brown (1994)
demonstrated that students at a US veterinary school perceived themselves as

Chapter 2: Understanding suicidal behaviour 29
deploying a range of both problem- and emotion-focused coping styles with relatively
equal frequency. By contrast, Australian veterinary students did not consistently
employ a range of effective coping strategies to deal with the stressors they
encountered during their course of study (Williams and others 2005). Veterinary
surgeons in New Zealand have been shown to make good use of their social networks
to seek information and assistance in times of work-related stress, especially from
informal sources such as friends, family and colleagues, rather than from resources
such as health professionals, counsellors and telephone helplines (Gardner and Hini
2006). It is reported anecdotally that veterinary surgeons overuse problem-focused
coping strategies,6 although this has not been investigated empirically. The
importance of deploying both problem- and emotion-focused strategies to cope with
the stresses of veterinary work has been emphasised (Bartram and Gardner 2008).
2.5.1.5 Work-related stressors
The demand-control model (Karasek 1979) and the subsequent demand-control-
support model (Karasek and Theorell 1990) of job strain predict that the combination
of high job demands, low decision latitude and low social support is associated with
mental and physical illness. Decision latitude includes decision authority (or control
over the working environment) and skill discretion (or variety of work and
opportunity for use of skills). High levels of decision latitude have been found to be
protective of mental health in cross-sectional studies of veterinarians (Hesketh and
Shouksmith 1986). The central tenet of a complementary job stress model, the effort-
reward imbalance model (Siegrist 1996), is that the lack of contractual reciprocity in
working conditions characterised by high effort in combination with low reward
(financial and career-related rewards, esteem and job security) has adverse mental and
physical health consequences, especially in individuals characterised by a
motivational pattern of overcommitment to their work.
6 In his address to British Veterinary Association Congress, Belfast, 29 Sep 2007, Dr. Raj Persaud, speaking at a session entitled 'Improving the mental wellbeing of the veterinary profession', described his clinical experience in psychiatry that veterinary surgeons tend to use problem-solving beyond the point at which the problem is solvable and suggested that failing to use emotion-focused coping for unsolvable problems could compromise mental health and may be a possible influence on the high suicide rate in the profession (News and Reports, BVA Congress, ‘Emotionally focused coping’: an alternative approach for stressed vets, Veterinary Record 161, 578-579 (2007)).
Chapter 2: Understanding suicidal behaviour 30
Work factors associated with psychological ill-health in staff are work demands (long
hours worked, work overload and pressure) and the associated effects on personal
lives; lack of control over work; lack of participation in decision-making; low
occupational social support; and unclear management and work role (Michie and
Williams 2003). There is robust, consistent evidence that the combination of high
psychological demands and low decision latitude and the combination of high effort at
work and low reward are prospective risk factors for common mental disorders
(Stansfeld and Candy 2006, Bonde 2008, Netterstrøm and others 2008).
There is an association between work stress and rates of depression and anxiety:
individuals, without any pre-employment history of psychiatric disorders, exposed to
high psychological job demands have a two-fold risk of onset of new depression and
anxiety compared to those with low job demands (Melchior and others 2007). Lack of
support from colleagues and supervisors and deterioration in work characteristics are
also associated with onset of depression (Waldenström and others 2008).
One putative mechanism underlying associations between work characteristics and
mental ill-health is neuroendocrine disturbance, mediated or moderated through
psychological pathways including self-esteem and feelings of mastery over work
(Stansfeld and Candy 2006).
Veterinary graduates typically move abruptly from the university environment to the
relative professional and social isolation of general private practice. Being on-call,
financial aspects of the role, and lack of surgical competence are identified as main
initial difficulties, and staff turnover is high with one in three leaving their first job
within two years (Routly and others 2002). Many work with little supervision, do not
always have access to assistance from colleagues and make professional mistakes
which can have a considerable emotional impact and may be significant in the
development of suicidal thoughts (Mellanby and Herrtage 2004). Reactivation of
latent negative cognitive schemas (unfavourable core beliefs about oneself that are
derived from prior experience and can be activated by specific circumstances),

Chapter 2: Understanding suicidal behaviour 31
established during adverse experiences at veterinary school or in the early stages of an
individual’s career, may play a causative role in later depressive episodes.
Veterinary work is perceived as stressful by over 80 percent of UK veterinary
surgeons (Robinson and Hooker 2006). Using a short validated stress evaluation tool
to measure and compare a number of work-related stressors and stress outcomes
across 26 different occupations in the UK, Johnson and others (2005) have shown that
veterinary surgeons reported lower psychological well-being than workers in most
other occupations. A large cross-sectional survey of work-related stress in the
veterinary profession in New Zealand showed that those working in small animal
practice, female and younger veterinarians reported the highest levels of stress,
primarily associated with long working hours, client expectations and unexpected
clinical outcomes. Respondents were also stressed by the need to keep up their
knowledge and technical skills, and by personal relationships, finances and their
expectations of themselves. At some stage during their lifetime, 2 percent of all
respondents had made a suicide attempt and 16 percent of respondents had seriously
thought about suicide (Gardner and Hini 2006).
A cross-sectional study of veterinary surgeons in Belgium reported only a moderate
level of job strain, no higher than reports using the same method of measurement for
other professional groups, but higher negative work-home interaction, especially for
respondents in bovine or mixed practice (Hansez and others 2008). Veterinarians were
highly engaged in their work which may have buffered against job strain. However,
the results must be interpreted with great care owing to the very low response rate.
Financial debt is a risk factor for mental disorder and suicidal behaviour in the general
population (for example, Hatcher 1994, Hintikka and others 1998, Yip and others
2007, Jenkins and others 2008). Twenty-nine percent of working doctors who died by
suicide in England and Wales had significant financial problems in the year before
death (Hawton and others 2004). There may be an association between rising student
debts and suicide among veterinary surgeons (Williams 2006). The length of the
veterinary course and the requirement for extramural studies means that debt is a
particular issue for veterinary students. In 2008, the average debt faced by a final year

Chapter 2: Understanding suicidal behaviour 32
first-degree veterinary student in the UK was over £20,000 and 35 percent of final
year students reported their financial problems as either difficult or severe (British
Veterinary Association [BVA] and Association of Veterinary Students [AVS] 2008).
Veterinary practice occupies a difficult and complex moral position because it serves
both animal and human interests which may conflict (Tannenbaum 1993, de Graaf
2005). Ethical challenges are commonplace as veterinary surgeons seek to balance
obligations to ensure the welfare of their patients while accommodating the owners’
expectations or demands, often within strict economic constraints, the views of
professional peers, the wider interests of society as a whole, and the commercial
interests of private practice (Rollin 2006). Examples of conflict abound: the sick
animal whose monetary value is less than the cost of treatment; the owner who
presses for continuing and potentially painful intervention for a dying pet; the owner
who demands euthanasia for a healthy animal; the owner who cannot afford the cost
of the most appropriate treatment. The ‘moral stress’ of the caring-killing paradox
experienced by animal-shelter workers involved with the euthanasia of unwanted
animals is associated with increased levels of work-related stress, work-to-family
conflict, poor physical health, substance misuse and lower levels of job satisfaction
(Rollin 1987, Reeve and others 2005, Rogelberg and others 2007). Rohlf and Bennett
(2005) demonstrated that different levels of euthanasia-related stress symptoms are
not associated with the occupational context in which euthanasia occurs; stress
symptoms can be reported regardless of the reasons for euthanasia.
Interviews with US veterinary graduates revealed that the most common upsetting
experiences involved procedures the students felt were unnecessary, such as when an
animal’s suffering was prolonged because its owner did not accept that its disease was
incurable and that death was inevitable (Herzog and others 1989). Procedures causing
pain to animals, such as castration of calves without anaesthesia, were also considered
stressful to the students and 25 per cent found euthanasia of animals personally
distressing.

Chapter 2: Understanding suicidal behaviour 33
A survey of veterinary surgeons in Finland reported high levels of work-related stress,
particularly among those working in urban areas and academia (Reijula and others
2003).
An unpublished survey of stress among Australian veterinarians and their support
staff7 reported that euthanasia, specific client behaviours or characteristics, and long
working hours were important stressors. The strongest predictor of work-related stress
was the extent to which veterinarians felt unappreciated at work.
In a cross-sectional study of the occupational health of veterinary surgeons in
Australia, the proportion of respondents with high levels of psychological distress was
double that of the general population: significant predictors of high levels of distress
included being less than 35 years old and having taken non-prescription drugs in the
past 12 months. Working long hours and being on-call after hours were major
contributory factors for stress. Veterinary surgeons working in general practice were
significantly more stressed than those in other roles (Fairnie 2005).
In a survey of UK veterinary surgeons, animal deaths caused by illness and euthanasia
were reported to provoke significant short- and long-term emotional reactions in a
substantial proportion of veterinarians, which may be relevant to the genesis of
depression (Fogle and Abrahamson 1990). A study of US veterinarians demonstrated
that communicating bad news to clients is stressful and, for some individuals, the
feelings of stress are prolonged (Ptacek and others 2004).
A large cross-sectional study of veterinary surgeons in Germany also recorded high
levels of work-related stress, mainly attributable to workload and after-hours on-call
duties (Harling and others 2009). Small surveys of veterinary surgeons in Ireland have
recorded similar outcomes (Connolly 2003, Kinsella 2006). Trimpop and others
(2000a, b) demonstrated that stress associated with long working hours was a
predictor of traffic accident rates in German veterinary surgeons: those who worked
7 News. ‘Survey details stress factors that influence Australian vets’. Australian Veterinary Journal 80, 522-524, September 2002. www.ava.com.au/avj/0209/02090513.pdf [Accessed 04 Mar 2008]

Chapter 2: Understanding suicidal behaviour 34
over 48 hours per week reported significantly higher levels of work stress and driving
accidents.
Suicide risk is raised in occupations in which those employed are directly dependent
upon clients for their income (Stack 2001). An exploratory study of 36 occupations
found that the suicide rate was over 1.5 times higher for persons in client-dependent
occupations (such as physicians, dentists and retail proprietors) in comparison with
those in non-client-dependent occupations and it was assumed that this increased risk
is mediated by client-dependency being a major source of stress (Labovitz and
Hagedorn 1971). Veterinary surgeons in private practice work in a client-dependent
environment.
Robinson and Hooker (2006) reported that 53 percent of UK veterinary surgeons
would still opt for the veterinary profession if they could start their career again, 20
percent would not, and the remaining 27 percent are unsure. Similar figures are
reported for veterinary surgeons in Australia (52 percent, 32 percent and 17 percent
respectively) (Heath 2007). The apparent disenchantment of a substantial proportion
of veterinary surgeons with their chosen career may have a negative impact on their
mental health.
The concept of ‘compassion fatigue’, a form of secondary traumatic stress due to the
emotional demands experienced by workers in caring professions, has received some
attention in the veterinary literature (Mitchener and Ogilvie 2002, Cohen 2007) but
there are no published reports of any measurements of the concept within the
profession.
Major incidents concerning animal health, such as the 2001 foot-and-mouth disease
outbreak in the UK, can elevate levels of psychological morbidity in affected
communities (Peck 2005), potentially including veterinary surgeons through their
involvement in large-scale slaughter and disposal, provision of emotional support to
farmers, and the economic effects on private practices. Veterinary surgeons were
turned to for emotional support during this outbreak by 40 percent of farmers
surveyed and were the second most-cited source of support after family, friends and
Chapter 2: Understanding suicidal behaviour 35
other farmers (Peck and others 2002, Peck 2005). Calls from the veterinary profession
to Vet Helpline8 increased during the outbreak and decreased to pre-outbreak levels
by mid-2002 (Peck 2005). Nusbaum and others (2007) reported a number of negative
psychological reactions in veterinarians involved with the outbreak and advocated
training in ‘psychologic first aid’ for public health professionals involved in such
incidents to limit emotional distress in the rural community and themselves.
Seventy-one percent of working doctors who died by suicide in England and Wales
between January 1991 and December 1993 had significant problems at work in the
year before death: over one-third of those were facing complaints, which in most
cases appeared to have been a key factor leading to suicide, although most were also
facing other problems at work and at home. Other common occupational problems
included feeling overloaded by the volume of work, working long hours and feeling
unable to cope with the responsibility of the job (Hawton and others 2004).
The number of complaints received by the Royal College of Veterinary Surgeons
from the general public increases steadily each year; the main category being alleged
inadequate care (RCVS 2007).
2.5.1.6 Effects of gender
The PMR for suicide among veterinary surgeons is greater in women than in men
(Mellanby 2005), but this may simply reflect the small absolute number of women
concerned. This parallels the situation in the medical profession in which female
doctors are consistently reported to have higher suicide risk compared to the general
population than their male colleagues (Baldwin and Rudge 1995, Hawton and others
2001, Schernhammer and Colditz 2004, Petersen and Burnett 2008). In marked
contrast to the general population in which the suicide rate for men is around three
times the suicide rate for women (Brock and others 2006), the absolute suicide rate
among doctors is similar for both genders (Lindeman and others 1996, Hawton and
others 2001). This differential increase in risk between the sexes requires particular
8 Vet Helpline is a peer-support telephone helpline providing emotional support and signposting to the veterinary profession (see Section 2.7)

Chapter 2: Understanding suicidal behaviour 36
monitoring in view of the large increase in the number of women entering the
veterinary profession. There are various theories to explain why women in some
professions have an increased risk of suicide including: participation in such
disciplines may compete with some of the personality characteristics that are
proposed as protective for women, or a relative lack of such characteristics might
predispose women to choose careers in these fields; the professions concerned are
action-oriented and recruit similarly oriented women; and women may be less able to
cope with the social isolation inherent in these professions (Murphy 1998, Bhugra
2006). The theory of status integration suggests that persons in statistically infrequent
occupation-based role sets have higher suicide rates than their counterparts (Gibbs
2000) and is supported by studies (such as Evans and Steptoe 2002) which indicate
that when men and women occupy jobs in which they are in the cultural and
numerical minority, there may be adverse psychological and other health effects that
are gender-specific. Accordingly, Hawton and others (2001) suggested that that the
risk among female doctors might be expected to decline as they progressively become
the majority in a traditionally male-dominated occupation. This may also apply within
the veterinary profession.
Women have a greater preference for self-poisoning as a method of suicide than men,
a pattern that is more pronounced in female doctors and veterinarians than in the
general population (Kelly and Bunting 1998), so it is possible that in an occupational
context of ready access and knowledge, as in the medical and veterinary professions,
the risk of suicide may increase more for women than for men. However, male
doctors and veterinarians also use self-poisoning for suicide more often than men in
general (Kelly and Bunting 1998) so this is unlikely to be the sole explanation for the
gender difference. The particular stresses affecting women in these professions are
likely to contribute to the difference (Gross 1997, Hawton and others 2001). By far
the largest and most frequent gender-related source of stress for female junior doctors
is the conflict they feel between their career and their marital and family life and this
is strongly linked to depression (Firth-Cozens 1990). Other sources identified in the
survey included a lack of senior female role models and prejudice from patients.

Chapter 2: Understanding suicidal behaviour 37
Female veterinary students report higher levels of emotional empathy with animals
(Paul and Podberscek 2000), greater concerns for the welfare or rights of animals
(Serpell 2005), and attach greater importance to the human-animal bond (Martin and
others 2003, Martin and Taunton 2005), than their male counterparts, and this is
reflected in gender differences in veterinary surgeons’ reported emotional responses
to treatment failure and carrying out euthanasia (Fogle and Abrahamson 1990), and in
attitudes to pain control in animals (Capner and others 1999, Raekallio and others
2003, Hugonnard and others 2004). It may affect the ability of women to cope with
the emotional stresses and moral conflicts inherent in veterinary practice (Paul and
Podberscek 2000).
Phillips-Miller and others (2000, 2001) surveyed married or partnered US
veterinarians about work satisfaction, work-related stress, marital and family stress,
and perceived level of spousal support for their career. Men and women reported
similar levels of work satisfaction and work-related stress but women reported
significantly greater levels of effect of marital and family stress on career and lower
levels of spousal support than their male counterparts. Areas of greatest work
dissatisfaction for both genders were income and long working hours. Emergency
calls outside office hours and unwillingness of clients to agree to diagnostic or
treatment procedures were also cited as being particularly stressful.
2.5.1.7 Perceived stigma
The stigma associated with mental illness is increasingly recognised as an important
factor influencing the accessing of mental healthcare by the general population
(Sartorius 2007). Mental illness may be particularly stigmatising for those working in
professions where vulnerabilities are not readily tolerated and viewed as a form of
weakness with negative career implications. Stigma is recognised as an important
factor influencing the accessing of mental health care by doctors (White and others
2006, Worley 2008) and suicide risk may be greater in higher income earners who
develop mental illness as they may feel more stigmatised than others with lower
income (Agerbo and others 2001). Similar stigma may apply within the veterinary
profession with a consequent reduction in help-seeking behaviour.

Chapter 2: Understanding suicidal behaviour 38
2.5.1.8 Psychiatric illness
The importance of psychiatric disorders as a risk factor for suicide in the general
population is described in Section 2.2, Table 2.8.
A large, case-controlled study showed that the risk of psychiatric diagnosis with
affective and stress-related disorders is elevated for human service professions
relative to all other occupations, after adjustment for an extensive range of socio-
demographic variables (Wieclaw and others 2005, 2006a). Specific professions
contribute differentially to the magnitude of this increased risk: for example, teaching
and social services display the highest risk of stress-related disorders and health
professionals have an elevated risk of depression. The authors suggested that the
elevated risk in human service professions may be associated with factors including:
job characteristics such as irregular working hours and exposure to distressing events;
high and conflicting job demands; self-selection of individuals into occupations who
are inclined to display a high degree of commitment; and men and women occupying
occupations in which the opposite gender predominates.
Agerbo and others (2007) explored the impact of psychiatric factors on the relative
risk of suicide across 55 occupations. Only modest associations between suicide and
occupation were observed among individuals who had been previously hospitalised
for psychiatric illness. This implies that mental disorder lies on the causal pathway
between occupation and suicide or that occupational differences are less important
once a person suffers from a psychiatric illness. However, doctors were a notable
exception, at almost four-fold greater risk than other occupations of dying by suicide
if they had been previously hospitalised for a psychiatric disorder. Thus the increased
risk of suicide among doctors may be related to both an increased risk of psychiatric
disorder and the increased risk of those with a psychiatric disorder to die by suicide.
Although no cases of suicide among veterinary surgeons were identified in the cohort
of suicides examined by Agerbo and others (2007) it is possible that this dual effect
seen in doctors may apply similarly in the veterinary profession.

Chapter 2: Understanding suicidal behaviour 39
The principal psychological problems experienced by doctors are depression and
alcoholism, and these are more frequent than in the general population (Firth-Cozens
2001). Pre-existing psychiatric disorders were present in over 86 percent of doctors
completing suicide, mainly depressive illness and alcohol or drug dependence
(Hawton and others 2004), and over 90 percent of nurses (Hawton and others 2002).
In a study of UK healthcare professionals referred to a specialist drug and alcohol
treatment service, around one-third had previously received treatment for depression
and about one-fifth had previously taken an overdose (Gossop and others 2001). No
such data are available for veterinary surgeons but it is reasonable to speculate that
psychiatric disorders may be a similar factor in suicides by veterinary surgeons. A
ready opportunity exists in both professions for misuse of prescription medications.
Among UK veterinary surgeons referred to a health support programme, the order of
substance misuse preference is alcohol, ketamine, benzodiazepines, opiates, street
drugs (cannabis, heroin, cocaine and ecstasy) and nitrous oxide, and about half of
those treated admit to having had suicidal thoughts (Veterinary Benevolent Fund
[VBF] 2007). Substance misuse is also reported among Australian veterinarians
(Jeyaretnam and others 2000).
Harling and others (2009) explored the use of psychotropic substances among
German veterinary surgeons. The prevalence of smoking and drug use among
veterinarians was respectively lower than and similar to the general population.
However, alcohol consumption was elevated, and the prevalence of dangerous levels
of alcohol consumption was markedly elevated among female veterinarians.
Hafen and others (2006, 2008) reported that one-third of first-year students at a US
veterinary school had symptoms of depression associated with both academic and
non-academic stressors, but it is not clear to what extent these findings can be
generalised to veterinary undergraduates elsewhere.
Fishbain (1986) compared the characteristics of four US veterinary surgeons with
psychiatric illness with those of published descriptions of psychiatrically impaired
doctors. Similarities included the type of drug selected for misuse (mainly opiates);
the number of drugs used by an individual (multiple); and source of supply (self-

Chapter 2: Understanding suicidal behaviour 40
prescribed rather than street-sourced). The veterinary surgeons misusing drugs
considered that overwork, fatigue, situational stress, and problems with significant
others were precipitating factors. The outcomes must be interpreted very cautiously,
however, due to the small number of veterinarians concerned.
2.5.2 Schematic representation
A hypothetical model to explain suicide risk in veterinary surgeons was developed
(Figure 2.1). The model attempts to clarify the complex interaction of possible
influences, is based on specific testable constructs, and may facilitate a more focused
and systematic approach for suicide research and the development of prevention
strategies within the profession.
The principal component hypotheses within this model are that the following factors
elevate suicide risk in veterinary surgeons:
• Personality characteristics of individuals entering the profession confer a
predisposition or vulnerability
• Psychological morbidity attributable to psychosocial factors during
undergraduate training and in the workplace
• Familiarity with animal euthanasia leads to more permissive attitudes towards
suicide
• Access to and knowledge of means of harm

Figure 2.1: Schematic representation of a hypothetical model to explain the risk of suicide in veterinary surgeons
Source: Bartram and Baldwin (2008) Reproduced with permission of the British Veterinary Association

Chapter 2: Understanding suicidal behaviour 42
2.6 Summary of shortfalls in existing published work
The increased risk of suicide among veterinary surgeons is well established (see
Section 2.1). However, the extant literature that seeks to explain this observation has
many shortfalls. These can be summarised as follows:
• The questionnaire instruments are mainly self-formulated and do not use
measures with established psychometric properties (such as Gardner and Hini
2006)
• A number of reports are based largely on conjecture (such as Halliwell and
Hoskin 2005)
• The generalisability of the results is limited by small sample size and/or low
response rates (such as Connolly 2003, Kirwan 2005, Kinsella 2006, Hansez
and others 2008, Fritschi and others 2009) or the study was completed outside
the UK (such as Reijula and others 2003, Gardner and Hini 2006, Hansez and
others 2008, Fritschi and others 2009)
• The prevalence of any psychological characteristics which might create a
predisposition or vulnerability in individuals entering the profession has not
been evaluated
• There has been little attempt to evaluate the prevalence of psychiatric factors
such as depression or substance misuse among practising veterinary surgeons
• Attitudes to suicide and the potential influence of the acceptability of animal
euthanasia within the profession on those attitudes have not been evaluated
2.7 Existing initiatives to support mental health in the UK veterinary profession
Brief details of existing initiatives to provide mental health support to the veterinary
profession are listed below, classified by the name of the organisation responsible.

Chapter 2: Understanding suicidal behaviour 43
Veterinary Benevolent Fund
• Vet Helpline: a 24-hour peer-support telephone helpline service staffed by
trained volunteers; established in 1992; received 179 calls in 2006, mainly
concerning depression- and employment-related problems (Veterinary
Benevolent Fund [VBF] 2007).
• Veterinary Surgeons’ Health Support Programme: professional help for
addiction disorders; established in 1999; received 39 new referrals in 2006,
mainly for alcohol-, stress- and drugs-related problems (Veterinary
Benevolent Fund [VBF] 2007).
• www.vetlife.org.uk: a dedicated portal website for information related to
mental health support, launched in 2007.
• There are plans for a programme of mental health seminars in veterinary
schools.
British Veterinary Association
• Recent Graduate Support Scheme and Young Vet Network: launched in 2007;
incorporate a range of different elements including regional meetings and an
online forum to support graduates in their first five to eight years in practice.
Royal College of Veterinary Surgeons
• Professional Development Phase (PDP): a compulsory initiative introduced in
2007 to provide support during the development of professional skills in the
first year following graduation.

Chapter 2: Understanding suicidal behaviour 44
• The new modular postgraduate certificate scheme includes a compulsory
module on professional key skills, which incorporates elements on
communication, decision-making and support networks.
University of Exeter
• ‘Practice Imperfect’:9 a touring interactive theatre project developed within the
university’s Department of Drama to promote mental health awareness to the
veterinary profession (Short and Lane 2007, Short and Somers 2007).
Society of Practising Veterinary Surgeons
• A telephone support and advice service for recent graduates, operated by
experienced practitioners.
Veterinary Defence Society
• Graduate Reunion Seminars: facilitate maintenance of relationships formed as
students and provide a structured forum for exchange of professional concerns,
advice and support.
9 ‘Practice Imperfect’ is an interactive theatre programme on stress in the veterinary profession, offered as a means of raising issues which are difficult to discuss in a personal context. The play was written and developed by John Somers and students at the Department of Drama, University of Exeter following extensive research and input from a range of individuals and organisations within the veterinary profession. It was performed by Exstream Theatre Company at the Royal Veterinary College, London and locations in Devon in 2006/2007.
Chapter 3: Questionnaire research 45
CHAPTER 3: QUESTIONNAIRE RESEARCH
3.0 Introduction
Questionnaire surveys are useful and well-established tools in medical research to
collect primary quantitative data about various aspects of health and disease including
the attitudes and behaviour of a defined population. The aim is to gather valid, reliable,
unbiased and discriminatory data from a representative sample of respondents.
However, the information yielded is subject to error and bias from a range of sources.
Close attention to questionnaire design and method of survey administration can
reduce these errors (Aday and Cornelius 2006). According to Boynton and
Greenhalgh (2004):
Anybody can write down a list of questions and photocopy it, but producing
worthwhile and generalisable data from questionnaires needs careful planning
and imaginative design. (p. 1312)
This chapter reviews the approach to the selection of constructs of mental health and
well-being for evaluation, the selection of suitable existing survey instruments to
measure these constructs, and provides an outline of the instruments selected.
A high response rate to a survey maximises the likelihood that the data will be
representative of the entire population (Aday and Cornelius 2006). Techniques to
maximise questionnaire response rates are described.
The chapter concludes with a short review of the demographic and occupational
profile of the veterinary profession in the UK, identifies sources of possible sampling
frames, and outlines the assessment of sampling frame suitability.
3.1 Modes of administration
The two principal modes of administration are self-completion (postal mail surveys
and surveys on the internet) and interviewer administration (face-to-face and
telephone) (McColl and others 2001).

Chapter 3: Questionnaire research 46
In choosing a mode of questionnaire administration, consideration needs to be given
to the availability of an appropriate sampling frame, anticipated response rate, the
potential for bias from sources other than non-response, acceptability to the target
population, the time available, the financial budget, and the availability of other
resources (e.g. skills or equipment) (McColl and others 2001).
3.2 Criteria for selecting existing survey instruments
There are many questionnaires in the public domain that are available for use by
researchers, with a diverse range of intended purpose and content. The popularity of
questionnaire methods of research is founded on the speed with which data can be
obtained, usually without significant capital investment. However, discipline should
be applied to their development and selection (Mandal and others 2000).
Fitzpatrick and others (1998) advocate eight criteria investigators should apply to
evaluate candidate patient-based outcome measures for research: appropriateness;
reliability; validity; responsiveness; precision; interpretability; acceptability; and
feasibility. The authors acknowledge however that there may be ‘clear limitations in
the evidence available’ (p. 45) on which to base selection decisions.
• Appropriateness requires that investigators consider the match of an
instrument to the specific purpose and objectives of a trial.
• Reliability requires that an instrument yields consistent results from repeated
samples and different researchers over time.
• Validity is involved in judging whether an instrument measures what it
purports to measure.
• Responsiveness addresses whether an instrument is sensitive to clinically
important changes over time.
Chapter 3: Questionnaire research 47
• Precision is concerned with the number and accuracy of distinctions made by
an instrument.
• Interpretability is concerned with how meaningful the scores from an
instrument are.
• Acceptability addresses how acceptable an instrument is for respondents to
complete.
• Feasibility is concerned with the extent of effort, burden and disruption arising
from use of an instrument.
The following additional criteria were also considered in the selection of suitable
instruments for incorporation into this study of mental health and well-being in the
UK veterinary profession:
• Availability of normative data for subjects with broad similarity to the study
population (preferably UK healthcare professionals)
• Any requirement to pay a licensing fee for use of an instrument subject to
copyright
• Suitability for self-administration to avoid the requirement for an interviewer
• Contemporary, i.e. used in recently published studies
In the context of this study the priority was to ensure that, where possible, the
instruments selected had previously established psychometric properties (validity and
reliability), were short (in order to minimise the time taken for respondents to
complete a questionnaire comprising multiple instruments) and likely to have minimal
potential to cause distress to respondents.

Chapter 3: Questionnaire research 48
It is generally acceptable in medical research to develop a short series of bespoke
questions for use alongside one or more standard instruments in a questionnaire if
suitable standard instruments cannot be identified to meet all of the study objectives,
but it is important to ensure that such questions are adequately pre-tested and piloted
(Boynton and Greenhalgh 2004).
3.3 Elemements of mental health and well-being for investigation in the study
A key premise of the hypothetical model to explain the elevated risk of suicide in
veterinary surgeons (Figure 2.1) is the mediating role of work-related stressors and
psychological symptoms. Analysing risk factors for suicidal behaviour and ideation
may be a valuable way of clarifying possible reasons for completed suicide and has
methodological advantages over studying factors associated with completed suicide:
for example, suicidal thoughts are more common in the population and the individual
can be asked about them directly. Empirical testing of the study hypotheses (Section
1.2) requires the selection of appropriate features of mental health and well-being
which can be operationalised using suitable survey instruments.
It is not possible to evaluate all aspects of mental health and well-being in a
questionnaire study as the burden on respondents would have ethical implications and
may also reduce response rates. Features of mental health were selected for evaluation
on the basis of existing evidence for association with suicidal behaviour and
completed suicide and the likely prevalence in a population in paid employment.
Key aspects of mental health and well-being known to be associated with suicidal
behaviour and completed suicide include: depressive and anxiety disorders (Harris
and Barraclough 1997, Sareen and others 2005), alcohol misuse (Brady 2006), and
recurrent suicidal thoughts (Bronisch and Wittchen 1994).
3.4 Review and selection of existing instruments
Instrument evaluation and selection was informed through reference to a structured
review which assesses the evidence for different measures (McDowell 2006) and
electronic literature searches. Information was not available on all the selection
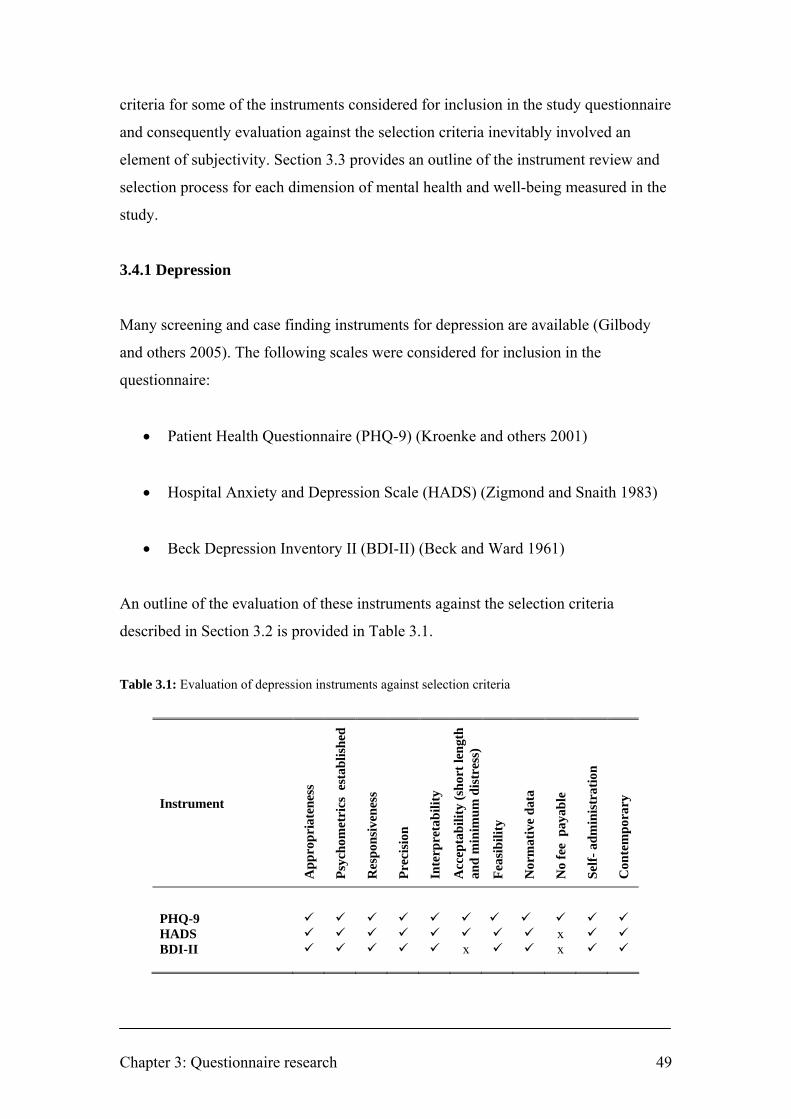
Chapter 3: Questionnaire research 49
criteria for some of the instruments considered for inclusion in the study questionnaire
and consequently evaluation against the selection criteria inevitably involved an
element of subjectivity. Section 3.3 provides an outline of the instrument review and
selection process for each dimension of mental health and well-being measured in the
study.
3.4.1 Depression
Many screening and case finding instruments for depression are available (Gilbody
and others 2005). The following scales were considered for inclusion in the
questionnaire:
• Patient Health Questionnaire (PHQ-9) (Kroenke and others 2001)
• Hospital Anxiety and Depression Scale (HADS) (Zigmond and Snaith 1983)
• Beck Depression Inventory II (BDI-II) (Beck and Ward 1961)
An outline of the evaluation of these instruments against the selection criteria
described in Section 3.2 is provided in Table 3.1.
Table 3.1: Evaluation of depression instruments against selection criteria
Instrument
App
ropr
iate
ness
Psyc
hom
etri
cs e
stab
lishe
d
Res
pons
iven
ess
Prec
isio
n
Inte
rpre
tabi
lity
Acc
epta
bilit
y (s
hort
leng
th
and
min
imum
dis
tres
s)
Feas
ibili
ty
Nor
mat
ive
data
No
fee
pay
able
Self-
adm
inis
trat
ion
Con
tem
pora
ry
PHQ-9 HADS x BDI-II x x

Chapter 3: Questionnaire research 50
HADS is a brief (14-item), self-report measure of anxiety and depression developed
for use in general medical out-patient clinics and now extensively validated and
widely used in clinical practice and research (Zigmond and Snaith 1983, Herrmann
1997, Snaith 2003). Seven items reflect anxiety and seven reflect depression. Each
item is answered on a four point (0-3) response category so the possible scores range
from 0 to 21 for anxiety and 0 to 21 for depression. The two sub-scales, for anxiety
and depression, are separate measures. In an extensive review of the use of HADS,
Bjelland and others (2002) confirmed an optimal balance between sensitivity and
specificity for HADS as a screening instrument at a cut-off score of 8+ for both
HADS-A and HADS-D, giving sensitivities and specificities for both sub-scales of
approximately 0.80, and concluded that HADS:
… was found to perform well in assessing the symptom severity and caseness of
anxiety disorders and depression in both somatic, psychiatric and primary care
patients and in the general population. (p. 69)
There is abundant evidence that the presence of an anxiety disorder is the single
strongest risk factor for development of depression (Baldwin and others 2002).
Current or lifetime co-morbidity is very common, and the implications of this are
significant, with increased social and psychological impairment and poorer clinical
outcomes and prognosis (Baldwin and others 2002). It is therefore appropriate that, by
the selection of HADS for use in the current study, both anxiety and depressive
symptoms can be evaluated.
3.4.2 Mental well-being
Existing instruments for the measurement of mental well-being include the following:
• Positive And Negative Affect Scale (PANAS) (Watson and others 1988)
• Satisfaction With Life Scale (SWLS) (Diener and others 1985)
• Scale of Psychological Well-Being (SPWB) (Ryff and Keyes 1995)

Chapter 3: Questionnaire research 51
• Short Depression-Happiness Scale (SDHS) (Joseph and others 2004)
• WHO Wellbeing Index (WHO-5) (Bech 2004)
• Warwick-Edinburgh Mental Well-being Scale (WEMWBS) (Tennant and
others 2007)
An outline of the evaluation of these instruments against the selection criteria
described in Section 3.2 is provided in Table 3.2.
Table 3.2: Evaluation of mental well-being instruments against selection criteria
Instrument
App
ropr
iate
ness
Psyc
hom
etri
cs e
stab
lishe
d
Res
pons
iven
ess
Prec
isio
n
Inte
rpre
tabi
lity
Acc
epta
bilit
y (s
hort
leng
th
and
min
imum
dis
tres
s)
Feas
ibili
ty
Nor
mat
ive
data
No
fee
pay
able
Self-
adm
inis
trat
ion
Con
tem
pora
ry
PANAS x x x SWLS x x x SPWB x x x x SDHS x x WHO-5 x WEMWBS
WEMWBS is a new and psychometrically robust measure for assessing population
positive mental health. The scale comprises 14 positively phrased items which
measure positive affect (i.e. hedonic aspects of well-being: feelings of optimism,
cheerfulness, relaxation), psychological functioning (i.e. eudaimonic aspects of well-
being: energy, clear thinking, self-acceptance, personal development, competence and
autonomy) and interpersonal relationships (Tennant and others 2007). Unlike other
commonly-used measures which show ‘ceiling effects’ in general population samples,
with most people scoring the optimum level, WEMWBS is better able to distinguish
average from good mental health and may have potential for documenting overall
improvements in population mental well-being (Tennant and others 2007). Each item

Chapter 3: Questionnaire research 52
is scored on a 5-point Likert-style scale from 1-5. The overall score for WEMWBS is
calculated by summating the scores for each item, giving a minimum score of 14 and
a maximum score of 70. A higher score indicates a higher level of mental well-being.
3.4.3 Alcohol use
Several questionnaires have been developed to detect individuals with alcohol
dependence, alcohol misuse or high levels of alcohol consumption (Rumpf and others
2002).
• CAGE questionnaire (Ewing 1984)
• Alcohol Use Disorders Identification Test (AUDIT) (Saunders and others
1993)
• AUDIT Alcohol Consumption Questions (AUDIT-C) (Bush and others 1998)
An outline of the evaluation of these instruments against the selection criteria
described in Section 3.2 is provided in Table 3.3.
Table 3.3: Evaluation of alcohol use instruments against selection criteria
Instrument
App
ropr
iate
ness
Psyc
hom
etri
cs e
stab
lishe
d
Res
pons
iven
ess
Prec
isio
n
Inte
rpre
tabi
lity
Acc
epta
bilit
y (s
hort
leng
th
and
min
imum
dis
tres
s)
Feas
ibili
ty
Nor
mat
ive
data
No
fee
pay
able
Self-
adm
inis
trat
ion
Con
tem
pora
ry
CAGE x AUDIT x x AUDIT-C
The AUDIT-C is a popular short version of the AUDIT consisting solely of its 3
consumption items (measuring frequency of drinking, typical quantity consumed and
frequency of heavy drinking) and is approximately equal in accuracy to the full

Chapter 3: Questionnaire research 53
AUDIT (Reinert and Allen 2007). It performs well in screening for alcohol use
disorders and risk drinking. The use of different cut-off points for men and women
improves its sensitivity and specificity (Dawson and others 2005). The AUDIT-C has
been recommended as a simple and reliable tool for routine assessment of risky
drinking (Wallace 2001). Each question is scored on a 5-point Likert scale (0-4),
resulting in a range of 0-12. AUDIT-C cannot differentiate between at-risk drinkers
and dependent drinkers but several authors consider that it is more important in terms
of public health to consider at-risk drinkers because at this stage most consequences
of alcohol use are still reversible (Bush and others 1998, Bradley and others 2003,
Rumpf and others 2002, Dawson and others 2005).
3.4.4 Suicidal ideation
There are many screening instruments for suicidal ideation and behaviour available
(Hawton 1989). The following scales were considered for inclusion in the
questionnaire:
• Scale for Suicide Ideation (SSI) (Beck and others 1979)
• Modified Scale for Suicidal Ideation (MSSI) (Miller and others 1986)
• Beck Scale for Suicide Ideation (BSS) (Beck and Steer 1991)
• Suicidal ideation questions from the second National Survey of Psychiatric
Morbidity (NSPM) (Singleton and others 2001)
An outline of the evaluation of these instruments against the selection criteria
described in Section 3.2 is provided in Table 3.4.

Chapter 3: Questionnaire research 54
Table 3.4: Evaluation of suicidal ideation instruments against selection criteria
Instrument
App
ropr
iate
ness
Psyc
hom
etri
cs e
stab
lishe
d
Res
pons
iven
ess
Prec
isio
n
Inte
rpre
tabi
lity
Acc
epta
bilit
y (s
hort
leng
th
and
min
imum
dis
tres
s)
Feas
ibili
ty
Nor
mat
ive
data
No
fee
pay
able
Self-
adm
inis
trat
ion
Con
tem
pora
ry
SSI x x x MSSI x x x x BSS x x x NSPM ?
The three suicidal ideation questions from NSPM address a spectrum of suicidality
from ‘tiredness of life’, to ‘death wishes’, through to ‘suicidal thoughts’, during the
previous week, the last year, or at any other time and are sourced from the 5-item
questionnaire developed by Paykel and others (1974). Normative data are available
for Great Britain (Meltzer and others 2002, Dennis and others 2007). The other scales
are unsuitable as they are either interviewer-administered and/or only relate to the day
of interview.
3.4.5 Work-related stress and working conditions
A number of job-specific measures have been developed for assessing occupational
stress or psychosocial factors in the work environment (Tabanelli and others 2008).
The following were considered for inclusion in the questionnaire:
• Job Content Questionnaire (JCQ) (Karasek and others 1998)
• Effort-Reward Imbalance Questionnaire (ERI) (Siegrist and others 2004)
• A Shortened Stress Evaluation Tool (ASSET) (Faragher and others 2004)
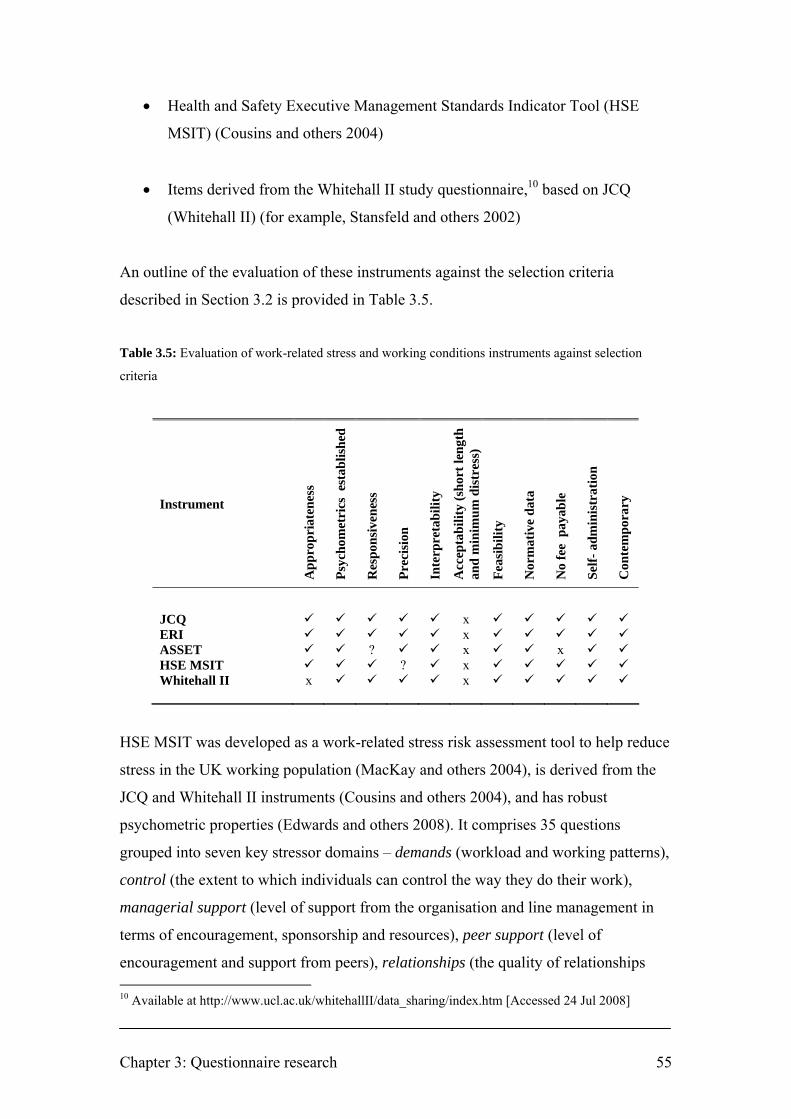
Chapter 3: Questionnaire research 55
• Health and Safety Executive Management Standards Indicator Tool (HSE
MSIT) (Cousins and others 2004)
• Items derived from the Whitehall II study questionnaire,10 based on JCQ
(Whitehall II) (for example, Stansfeld and others 2002)
An outline of the evaluation of these instruments against the selection criteria
described in Section 3.2 is provided in Table 3.5.
Table 3.5: Evaluation of work-related stress and working conditions instruments against selection
criteria
Instrument
App
ropr
iate
ness
Psyc
hom
etri
cs e
stab
lishe
d
Res
pons
iven
ess
Prec
isio
n
Inte
rpre
tabi
lity
Acc
epta
bilit
y (s
hort
leng
th
and
min
imum
dis
tres
s)
Feas
ibili
ty
Nor
mat
ive
data
No
fee
pay
able
Self-
adm
inis
trat
ion
Con
tem
pora
ry
JCQ x ERI x ASSET ? x x HSE MSIT ? x Whitehall II x x
HSE MSIT was developed as a work-related stress risk assessment tool to help reduce
stress in the UK working population (MacKay and others 2004), is derived from the
JCQ and Whitehall II instruments (Cousins and others 2004), and has robust
psychometric properties (Edwards and others 2008). It comprises 35 questions
grouped into seven key stressor domains – demands (workload and working patterns),
control (the extent to which individuals can control the way they do their work),
managerial support (level of support from the organisation and line management in
terms of encouragement, sponsorship and resources), peer support (level of
encouragement and support from peers), relationships (the quality of relationships 10 Available at http://www.ucl.ac.uk/whitehallII/data_sharing/index.htm [Accessed 24 Jul 2008]

Chapter 3: Questionnaire research 56
between colleagues), role (understanding of duties and responsibilities), and change
(management and communication of organisational changes) – which have the
potential to have a negative impact on employee mental health and well-being
(Cousins and others 2004). Recent normative data are available for the UK working
general population (Edwards and others 2008) and the nursing profession (Royal
College of Nursing 2006). Some instruments, such as HSE MSIT and JCQ, capture
features of the work environment whereas others, such as ERI and ASSET, attempt to
capture the consequences of the work environment on the worker. No single
questionnaire is sufficient to assess all the risks associated with psychosocial working
conditions (Rick and others 2001). HSE MSIT was selected as it includes measures
for multiple dimensions of the workplace environment, UK normative data for the
working general population are updated annually (Psychosocial Working Conditions
in Britain survey, e.g. Webster and others 2007), and software for analysing scores is
readily available11 to any employers who might wish to use the tool to assess the
psychosocial characteristics of their workplace for review against the baseline
measurements provided by the current study.
3.4.6 Work-home interaction
Although work-life balance is a more commonly used term, a body of research prefers
the term work-home interaction (WHI) (Loretto and others 2005). Work and home
roles can interact to have both negative and positive effects on mental health
depending on the demands an individual encounters in their work and family situation.
Negative effects can arise through competing demands for time and energy; positive
effects can arise through the provision of a greater number of resources (e.g. social
support, higher self-esteem and financial income) which may buffer against distress in
another role (Voydanoff 2004, Oomens and others 2007).
Many instruments have been developed for the measurement of work-home
interaction (reviewed in Geurts and others 2005). The following were considered for
inclusion in the questionnaire:
11 HSE Management Standards Analysis Tool. Available at http://www.hse.gov.uk/stress/standards/pdfs/analysistool.xls [Accessed 24 Jul 2008]

Chapter 3: Questionnaire research 57
• Work-Family Conflict and Family-Work Conflict Scales (WFC/FWCS)
(Netemeyer and others 1996)
• Survey Work-home Interaction – Nijmegen Scale (SWING) (Geurts and
others 2005)
An outline of the evaluation of these instruments against the selection criteria
described in Section 3.2 is provided in Table 3.6.
Table 3.6: Evaluation of work-home interaction instruments against selection criteria
Instrument
App
ropr
iate
ness
Psyc
hom
etri
cs e
stab
lishe
d
Res
pons
iven
ess
Prec
isio
n
Inte
rpre
tabi
lity
Acc
epta
bilit
y (s
hort
leng
th
and
min
imum
dis
tres
s)
Feas
ibili
ty
Nor
mat
ive
data
No
fee
pay
able
Self-
adm
inis
trat
ion
Con
tem
pora
ry
WFC/FWCS x ? x x SWING ? x
The SWING questionnaire was developed from the item content of 17 existing
instruments and a number of newly developed items to develop a comprehensive, 22-
item scale for the measurement of time-based and strain-based elements of negative
and positive work-home and home-work interaction (Geurts and others 2005). Each of
the four sub-scales may be used separately (S. Geurts, personal communication).12
3.5 Maximising response rates to postal questionnaires
The response rate of a questionnaire survey can be defined as the proportion of people
selected and deemed eligible for a study who actually complete the questionnaire
12 Dr. Sabine Geurts, Associate Professor in Work and Organizational Psychology, Radboud University, Nijmegen, Netherlands. 21 Jun 2007 [E-mail]

Chapter 3: Questionnaire research 58
(Aday and Cornelius 2006). A high response rate from any sample is required to
maximise the likelihood that the data will representative of the entire population.
While a universal standard for response rates has not been established for self-
administered surveys, it is generally accepted that response rates below 50 percent are
inadequate (Reisbig and others 2007). Non-response to postal questionnaires reduces
the effective sample size and can introduce bias. Non-response bias occurs when a
significant number of people in the survey sample fail to respond and have relevant
characteristics that differ from those who do respond.
Because non-response can affect the validity of epidemiological studies, the use of
effective methods to increase response rates is an important dimension of health
research. Recent Cochrane reviews considered many different methods to increase
response rates to postal questionnaires. The reviews identified several factors that
were associated with increased response rates, including monetary incentives; sending
the questionnaire by recorded delivery; short questionnaires; pre-notification; follow-
up contact; a more interesting questionnaire topic; and sending a second copy of the
questionnaire (Edwards and others 2002, Edwards and others 2007). However, the
generalisability of the results of this review into the healthcare setting has been
questioned as the studies reviewed were not restricted to medical surveys and
included any questionnaire topic in any population (Smeeth and Fletcher 2002).
A systematic review to identify effective methods of improving response to postal
questionnaires in patient populations recruited to healthcare research activities
(Nakash and others 2006), concluded that repeat mailing strategies and/or telephone
reminders had most effect on response rates. Making the questionnaire shorter may
also improve response rates but there was no evidence to suggest that incentives are
useful.
In a systematic review of efforts to improve response rates in physician surveys
(VanGeest and others 2007), small financial incentives, postal and telephone rather
than web-based approaches, short questionnaires, and endorsement from legitimising
professional associations were likely to be effective in improving response.
Chapter 3: Questionnaire research 59
There is little in the literature about improving response rates to surveys in the
veterinary profession. A survey of health and occupational factors among female
veterinarians in the US yielded a high response rate (90 percent) using a self-
administered mailed questionnaire followed by telephone interview of those who
failed to respond by mail (Wilkins and others 1997). The authors concluded that
conventional survey techniques may be successfully employed in health studies of
health professionals, particularly if issues of great concern to the target population are
addressed. A longitudinal study of mental health in US veterinary students achieved
high response rates (the two data collection periods yielded 90 percent and 76 percent
response rates respectively with a matching rate of participants between the two
periods of 88 percent) by designing the protocol to ensure anonymity and ensuring the
ability to track students longitudinally through the use of anonymous longitudinal
identifiers (Reisbig and others 2007).
Reviews of response rates and non-response bias reported in published articles for
questionnaires mailed to physicians (Asch and others 1997, Cummings and others
2001) have shown that while response rates for large sample surveys average around
53 percent, the amount of response bias is minimal. These results suggest that for
homogeneous professional groups like physicians, less than optimal response rates
may not necessarily mean excessive levels of response bias (Cull and others 2005).
Levine and others (2003) emphasised the importance of conducting anonymous
assessments of medical students, particularly when assessing sensitive psychological
states, in order to improve response rates and reduce the number of responses omitted
or intentionally misrepresented due to mistrust in assurances of confidentiality and
fear of repercussions.
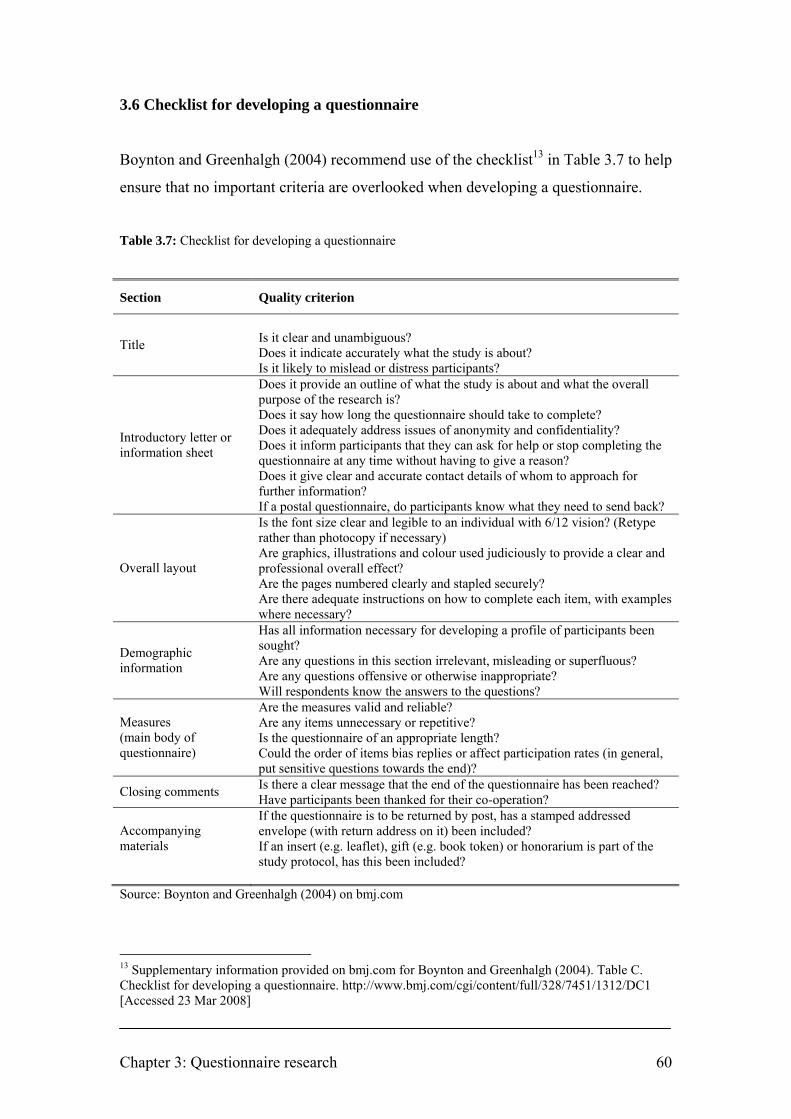
Chapter 3: Questionnaire research 60
3.6 Checklist for developing a questionnaire
Boynton and Greenhalgh (2004) recommend use of the checklist13 in Table 3.7 to help
ensure that no important criteria are overlooked when developing a questionnaire.
Table 3.7: Checklist for developing a questionnaire
Section Quality criterion
Is it clear and unambiguous? Does it indicate accurately what the study is about? Title
Is it likely to mislead or distress participants? Does it provide an outline of what the study is about and what the overall purpose of the research is? Does it say how long the questionnaire should take to complete? Does it adequately address issues of anonymity and confidentiality? Does it inform participants that they can ask for help or stop completing the questionnaire at any time without having to give a reason? Does it give clear and accurate contact details of whom to approach for further information?
Introductory letter or information sheet
If a postal questionnaire, do participants know what they need to send back? Is the font size clear and legible to an individual with 6/12 vision? (Retype rather than photocopy if necessary) Are graphics, illustrations and colour used judiciously to provide a clear and professional overall effect? Are the pages numbered clearly and stapled securely?
Overall layout
Are there adequate instructions on how to complete each item, with examples where necessary? Has all information necessary for developing a profile of participants been sought? Are any questions in this section irrelevant, misleading or superfluous? Are any questions offensive or otherwise inappropriate?
Demographic information
Will respondents know the answers to the questions? Are the measures valid and reliable? Are any items unnecessary or repetitive? Is the questionnaire of an appropriate length?
Measures (main body of questionnaire) Could the order of items bias replies or affect participation rates (in general,
put sensitive questions towards the end)? Is there a clear message that the end of the questionnaire has been reached? Closing comments Have participants been thanked for their co-operation? If the questionnaire is to be returned by post, has a stamped addressed envelope (with return address on it) been included? Accompanying
materials If an insert (e.g. leaflet), gift (e.g. book token) or honorarium is part of the study protocol, has this been included?
Source: Boynton and Greenhalgh (2004) on bmj.com
13 Supplementary information provided on bmj.com for Boynton and Greenhalgh (2004). Table C. Checklist for developing a questionnaire. http://www.bmj.com/cgi/content/full/328/7451/1312/DC1 [Accessed 23 Mar 2008]

Chapter 3: Questionnaire research 61
3.7 Sampling frame
3.7.1 Profile of the veterinary profession
There are 15,671 veterinary surgeons practising in the UK (RCVS 2007). The term
‘practising’ is not limited to those working in general practice or involved in clinical
work, but includes members using their professional qualification in any way.
The breakdown by employment type is illustrated in Figure 3.1.
Figure 3.1: Breakdown of veterinary surgeons practising in the UK by employment type
n=15,671
Source: RCVS (2007, p. 27)
Reproduced with permission of the RCVS
Of the total RCVS membership, over 73 percent have a recognised UK veterinary
qualification; the balance graduated overseas.
There are six veterinary schools in the UK – Bristol, Cambridge, Edinburgh, Glasgow,
Liverpool, London, and Nottingham14 – with a total of around 590 graduates
obtaining a veterinary degree each year.
14 The veterinary school at Nottingham University opened in 2006; the first students graduate in 2011.

Chapter 3: Questionnaire research 62
Fifty-two percent of the veterinary surgeons practising in the UK are male, but the
proportion of females entering the profession is increasing considerably (in 2006, 74
percent of UK veterinary graduates and 78 percent of admissions to the first year of
the veterinary course were female). The distribution of members by age and gender is
illustrated in Figure 3.2.
Figure 3.2: Distribution of veterinary surgeons practising in the UK by age and gender Source: RCVS (2007, p. 31) Reproduced with permission of the RCVS
Only 1 percent of veterinary surgeons are unemployed (Robinson and Hooker 2006).
For the veterinary surgeons working in general practice, the breakdown by type of
work is illustrated in Figure 3.3. There are 3932 veterinary practice premises in the
UK (RCVS 2007).
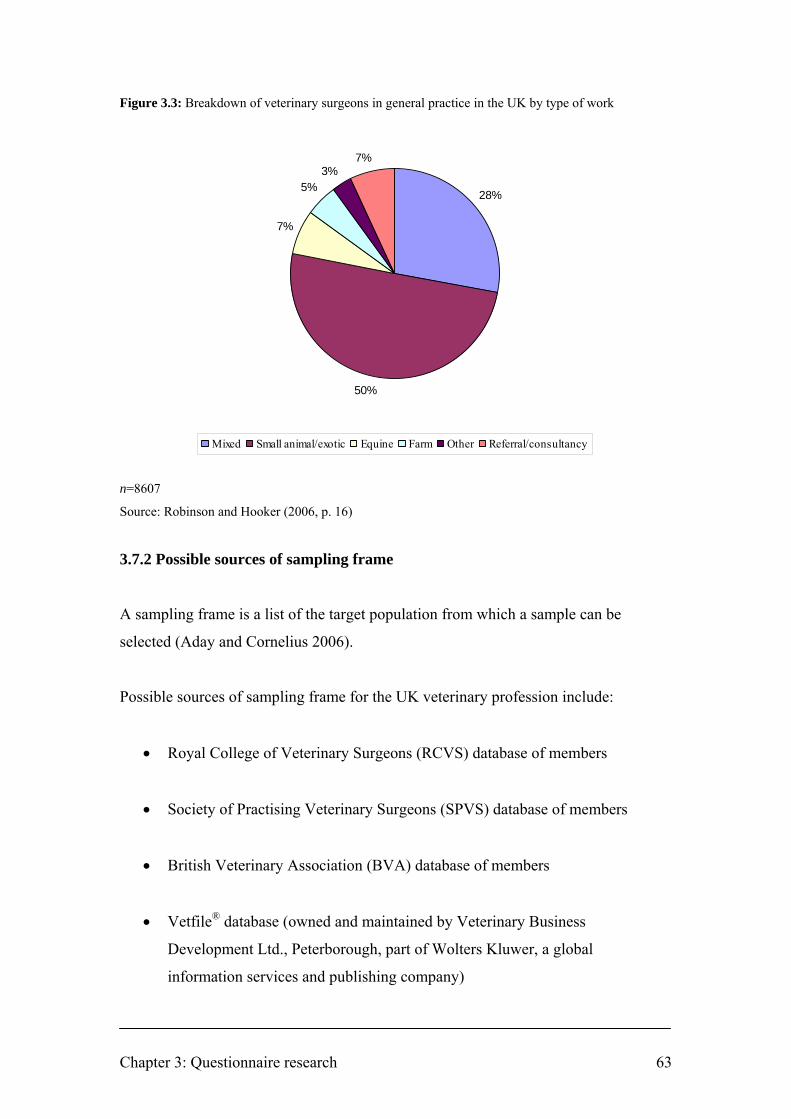
Chapter 3: Questionnaire research 63
Figure 3.3: Breakdown of veterinary surgeons in general practice in the UK by type of work
n=8607
Source: Robinson and Hooker (2006, p. 16)
3.7.2 Possible sources of sampling frame
A sampling frame is a list of the target population from which a sample can be
selected (Aday and Cornelius 2006).
Possible sources of sampling frame for the UK veterinary profession include:
• Royal College of Veterinary Surgeons (RCVS) database of members
• Society of Practising Veterinary Surgeons (SPVS) database of members
• British Veterinary Association (BVA) database of members
• Vetfile® database (owned and maintained by Veterinary Business
Development Ltd., Peterborough, part of Wolters Kluwer, a global
information services and publishing company)
28%
50%
7%
5%3%
7%
Mixed Small animal/exotic Equine Farm Other Referral/consultancy
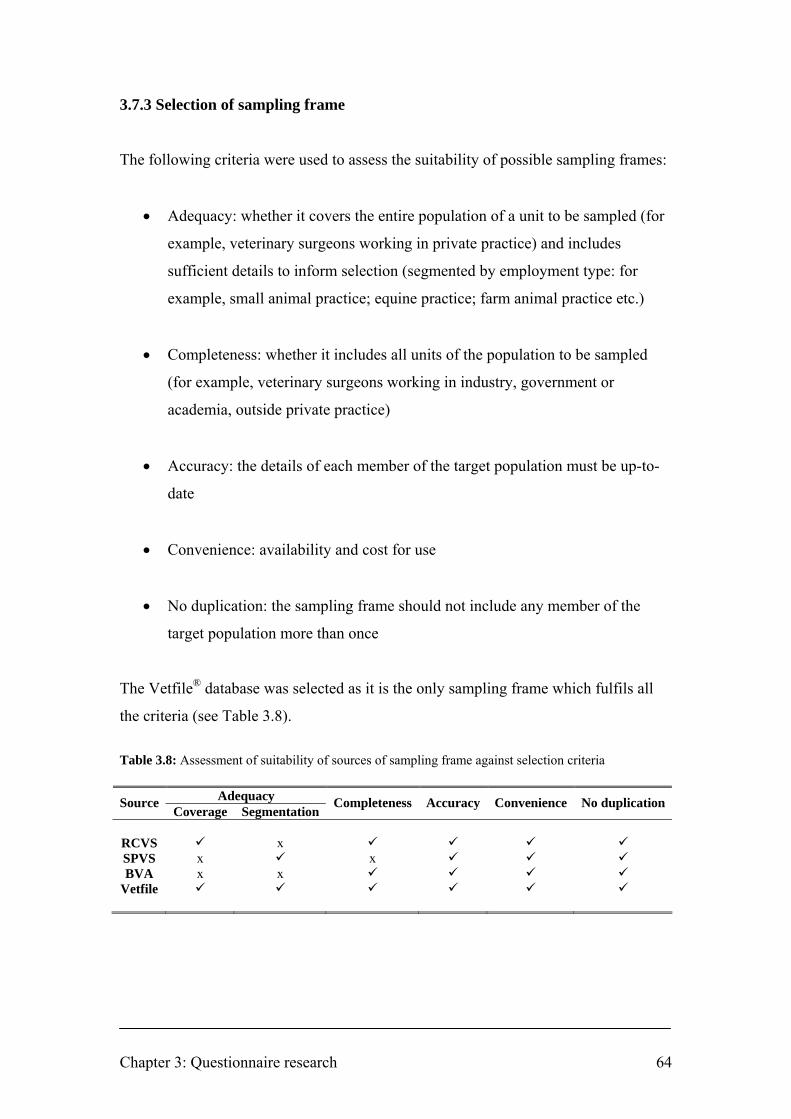
Chapter 3: Questionnaire research 64
3.7.3 Selection of sampling frame
The following criteria were used to assess the suitability of possible sampling frames:
• Adequacy: whether it covers the entire population of a unit to be sampled (for
example, veterinary surgeons working in private practice) and includes
sufficient details to inform selection (segmented by employment type: for
example, small animal practice; equine practice; farm animal practice etc.)
• Completeness: whether it includes all units of the population to be sampled
(for example, veterinary surgeons working in industry, government or
academia, outside private practice)
• Accuracy: the details of each member of the target population must be up-to-
date
• Convenience: availability and cost for use
• No duplication: the sampling frame should not include any member of the
target population more than once
The Vetfile® database was selected as it is the only sampling frame which fulfils all
the criteria (see Table 3.8).
Table 3.8: Assessment of suitability of sources of sampling frame against selection criteria
Adequacy Source Coverage Segmentation
Completeness Accuracy Convenience No duplication
RCVS x SPVS x x BVA x x
Vetfile
Chapter 4: Materials and methods 65
CHAPTER 4: MATERIALS AND METHODS
4.0 Introduction
The structure and development of the questionnaire used in this study is described.
Existing instruments with known psychometric properties were used when possible. A
series of questions relating to work stressors pertinent to the veterinary profession was
formulated with input from an informal focus group and refined following pre- and
pilot-testing.
Steps were taken to help ensure the well-being of those participating in the study,
which included voluntarily submitting details of the study for review by an NHS
Research Ethics Committee and incorporating the recommendations.
A copy of the final questionnaire is included in Appendix I.
Details of the selection of a stratified random sample of veterinary surgeons and
distribution and receipt of questionnaires are supplied.
Initiatives to increase pre-awareness of the study, aid recognition of study-related
materials, and remind potential respondents to complete the questionnaire are also
described.
The data entry process is outlined and the chapter concludes with details of the
methods used for the treatment of missing data and statistical analysis.
The chronological process of the study is illustrated schematically in Figure 4.1.

Chapter 4: Materials and methods 66
Figure 4.1: Schematic representation of the chronological process of the study Initial steps
Literature review – veterinary surgeons and suicide Literature review – questionnaire research and existing instruments
Preparation of instrument and associated documentation
Draft self-administered questionnaire using existing instruments Focus group to formulate questions on veterinary work stressors Pre- and pilot testing and revision of self-formulated questions Draft covering letter Design of questionnaire
Sample selection Selecting stratified random sample of veterinary surgeons from suitable sampling frame
Distribution of questionnaire and receipt of returns First mailing of questionnaire to 3200 veterinary surgeons Second mailing of questionnaire Reminder editorials in veterinary press Preparation of returned questionnaires for data entry: clear marks, number, coding, photocopying
Data entry and analysis Automated data entry by scanner Data validation Statistical analysis and reporting
Research Ethics Committee review of study
Prompting awareness and recognition Study-specific logo Generation of study pre-awareness in veterinary press Creation of study-specific website
Dissemination of results Journal publications and conference presentations

Chapter 4: Materials and methods 67
4.1 Self-administered questionnaire
The questionnaire was divided into eight sections and comprised a total of 120 items.
Sections B to G comprised standardised instruments with known psychometric
properties. The reasons for their selection are outlined in Section 3.4. No
modifications were made to these instruments for the purpose of the study as this
could affect their psychometric properties. Some of the questions in Section A and all
of the questions in Section H were self-formulated.
The checklist created by Boynton and Greenhalgh (2004) for developing a
questionnaire (described in Section 3.6) was used to help ensure that no important
aspects were overlooked in the development of the instrument used in this study.

Chapter 4: Materials and methods 68
Section A: Demographics
• Gender†
• Age†
• Year of qualification†
• Veterinary school
• Main type of work†
• Current employment status†
• Position in the practice†
• Ownership of practice†
• RCVS Certificate or Diploma holder
• Number of hours worked in a typical week†
• Number of hours on call in a typical week†
† Items and item options sourced from RCVS Survey of the Profession 2006 (Robinson
and Hooker 2006)

Chapter 4: Materials and methods 69
Section B: Anxiety and depression
• Hospital Anxiety and Depression Scale (HADS) (Zigmond and Snaith 1983)
HADS copyright © R.P. Snaith and A.S. Zigmond, 1983, 1992, 1994. Record form items originally
published in Acta Psychiatrica Scandinavica, 67, 361–70, copyright © Munksgaard International
Publishers Ltd, Copenhagen, 1983. Published by GL Assessment Limited, The Chiswick Centre, 414
Chiswick High Road, London W4 5TF, UK. All rights reserved. GL Assessment is part of the Granada
Learning Group.

Chapter 4: Materials and methods 70
Section C: Alcohol intake
• AUDIT Alcohol Consumption Questions (AUDIT-C) (Bush and others 1998)
Section D: Negative thoughts about your life
• Suicidal ideation questions from the second National Survey of Psychiatric
Morbidity (NSPM) (Singleton and others 2001)
Section E: Mental well-being
• Warwick-Edinburgh Mental Well-being Scale (WEMWBS) (Tennant and
others 2007)
© NHS Health Scotland, University of Warwick and University of Edinburgh, 2006, all rights reserved.
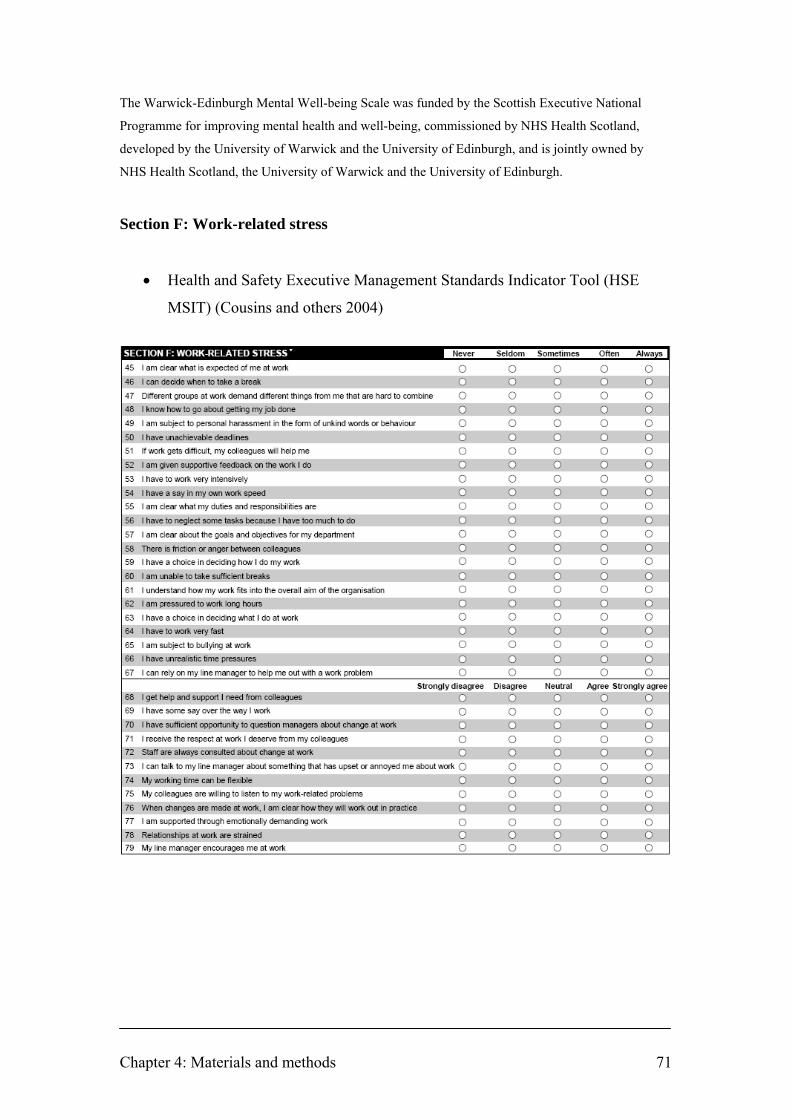
Chapter 4: Materials and methods 71
The Warwick-Edinburgh Mental Well-being Scale was funded by the Scottish Executive National
Programme for improving mental health and well-being, commissioned by NHS Health Scotland,
developed by the University of Warwick and the University of Edinburgh, and is jointly owned by
NHS Health Scotland, the University of Warwick and the University of Edinburgh.
Section F: Work-related stress
• Health and Safety Executive Management Standards Indicator Tool (HSE
MSIT) (Cousins and others 2004)
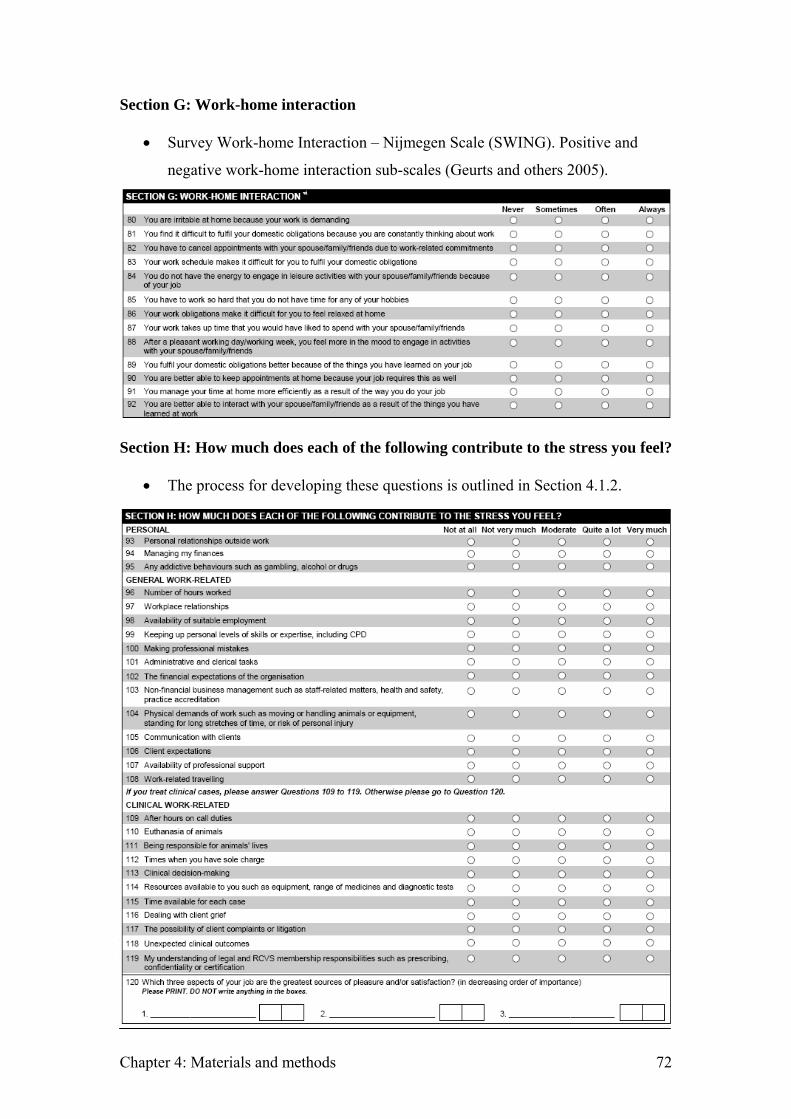
Chapter 4: Materials and methods 72
Section G: Work-home interaction
• Survey Work-home Interaction – Nijmegen Scale (SWING). Positive and
negative work-home interaction sub-scales (Geurts and others 2005).
Section H: How much does each of the following contribute to the stress you feel?
• The process for developing these questions is outlined in Section 4.1.2.
A statement was included at the start of the questionnaire to inform potential respondents that by returning the completed questionnaire, they are giving their consent to the use of the information supplied, together with an assurance that individual data will not be identifiable:

Chapter 4: Materials and methods 73
A statement was included at the start of the questionnaire to inform potential
respondents that by returning the completed questionnaire, they are giving their
consent to the use of the information supplied, together with an assurance that
individual data will not be identifiable:
Respondents were invited to supply their contact details if they were willing in
principle to be considered to participate in a possible subsequent phase of the research,
beyond the scope of the current study:
A minority of participants may become distressed immediately after participation in
psychiatric research but there appear to be no long-term adverse effects; positive
reactions to participation are more common than negative reactions (Jorm and others
2007). The following debriefing statement was included at the end of the
questionnaire inviting respondents whose participation may have raised concerns
about their well-being to contact specified support agencies:

Chapter 4: Materials and methods 74
4.1.2 Development of questions on veterinary work-related stressors
The first draft of the Section H questions was inspired by item options15 from the
questionnaire used in a study to investigate sources of work-related stress in the
veterinary profession in New Zealand (Gardner and Hini 2006). After seeking
approval from the Veterinary Council of New Zealand, a co-sponsor of the study, a
copy of the questionnaire used was obtained from the first author of the publication.16
The questions were used as the basis for discussion in an informal focus group of 5
veterinary surgeons working in general practice in the UK. Additional sources of
work-related stress were identified and the questions were revised and pre-tested
within the same informal focus group. After feedback was incorporated, the draft
version of Section H of the questionnaire was then pilot-tested by e-mail with a
convenience sample of 16 veterinary surgeons who had not participated in the
previous informal focus group.
Veterinary surgeons participating in the pilot-test were asked to consider at least the
following quality control questions for each of the items in the draft version of
Section H:
• Is the question one which can be easily answered based on your experience?
• Is the question simple enough and sufficiently well defined that all
respondents are likely to interpret it in the same way?
• Does the question contain any words or phrases which could bias respondents
to answer one way or another?
• Is the question relevant to you in the context of stressors in veterinary work?
• Do these questions provide comprehensive coverage of the main stressors? 15 Survey of factors affecting stress in veterinarians. Question: 14. The following is a list of personal factors that may contribute to the amount of stress you feel. Please indicate how much each of these factors affect how stressed you feel: Personal/family relationships; My personal health; My family’s health; Family needs; Self-esteem; Debt/Student loans; Disposable income; Managing my finances; Any addictive behaviours (such as gambling, alcohol, drugs etc); Not meeting my own expectations; Unavailability of suitable employment. 16 Dr. Dianne H. Gardner, School of Psychology, Massey University, Auckland, New Zealand

Chapter 4: Materials and methods 75
All suggested amendments were considered, and the content of Section H was revised.
Revisions included the following:
• Standing for long periods was added as an example of a physical demand
• Work-related travelling, non-financial business management, and dealing with
client grief were incorporated as additional possible stressors
• Wording of some questions was amended to reduce possible response bias.
For example: ‘long working hours’ was changed to ‘number of hours worked’;
‘lack of availability of professional support’ was abbreviated to ‘availability of
professional support’
The final version comprised a series of 27 items (a domain of 9 items referred to
clinical work and were only for completion by respondents to whom this domain was
relevant). Respondents scored on a 5-point Likert scale (0-4; from ‘not at all’ to ‘very
much’) how much each item contributed to the stress they experienced.
4.2 Study logo
In order to facilitate recognition of study-related documentation by participating
veterinary surgeons, a logo was designed (Figure 4.2) to be printed on the envelope
for mailing study-related materials to veterinary surgeons in the study sample, the
letterhead of the covering letter and the questionnaire.
Figure 4.2: Vet well-being initiative logo

Chapter 4: Materials and methods 76
4.3 Covering letters
An explanatory letter was drafted for mailing with the questionnaire to veterinary
surgeons selected for participation in the study. The letter included the following
content:
• Outline of study and purpose of research
• How long the questionnaire should take to complete
• Assurances regarding anonymity and confidentiality
• Statement to inform participants that participation is voluntary
• Details of whom to approach for further information
• Deadline for returning the completed questionnaire
• Encouragement to participate regardless of any past or present experience of
stress or mental health problems
A second version of the letter was drafted for the follow-up mailing of the
questionnaire.
Copies of both versions of the letter are included in Appendix II.
4.4 Design of questionnaire
A draft layout of the questionnaire was developed in Microsoft® Word (Version 2002)
and supplied to Data Management, Information and Computing, School of Medicine,
University of Southampton. The draft was used as a template to design the
questionnaire in TeleForm® (Verity Inc., Sunnyvale, CA) software to enable
automated data entry using an electronic optical reading system with related software
to scan the returned questionnaires.
The questionnaire was designed for printing as a double-sided A3-size document to be
single folded to A4-size to create a two-page, four-side, A4 final document.

Chapter 4: Materials and methods 77
4.5 Research ethics approval of study
The principal ethical concerns for this study were the response burden of a 120-item
questionnaire and the potential impact of the sensitive nature of the questions on
respondent mental health and well-being.
The purpose of a Research Ethics Committee in reviewing the proposed study is to
protect the dignity, rights, safety, and well-being of actual or potential research
participants.17
The study had no connection with National Health Service (NHS) patients, premises
or staff and was therefore outside the remit of the Governance Arrangements for NHS
Research Ethics Committees (GAfREC) paragraph 3.1 and did not require ethical
review by an NHS Research Ethics Committee.
However, GAfREC paragraph 3.2 allows applicants to apply for a review of the
research ethics on a voluntary basis.
The study was reviewed on this basis by Southampton and South West Hampshire
Research Ethics Committee (B) in August 2007. The Committee gave a 'favourable
ethical opinion' of the research (REC reference number: 07/H0504/122). A number of
minor amendments to the study documentation were suggested by the Committee and
the study documentation was amended accordingly.
Amendments included: rewording the covering letter to make it less coercive;
removing the researcher’s (DJB) personal telephone number from the covering letter
and questionnaire for his safety; deleting the word ‘entirely’ from a proposed
statement in the Important Notes section of the questionnaire asserting ‘All responses
are entirely anonymous’, as it may have been possible to identify some respondents
from their demographic data; emphasis in the covering letter that participation is
17 Governance Arrangements for NHS Research Ethics Committees, July 2001, paragraph 2.2. London, Department of Health. p. 6

Chapter 4: Materials and methods 78
voluntary; and checking arrangements for insurance to meet the potential legal
liability arising from harm to participants.
4.6 Sample size
The survey was conducted using a sample comprising 3200 practising veterinary
surgeons in the UK. This number represents approximately 20% of the RCVS
membership, excluding those who are practising overseas or retired (RCVS 2007).
Calculation of the required sample size is complicated by a lack of knowledge on
which to base estimates of the prevalence of the multiple parameters to be measured
and the intention to compare multiple sub-populations within the sample.
Assuming an estimated response rate of 50% (1600 completed questionnaires), point
estimates of prevalence ranging from 5 percent to 50 percent would have confidence
intervals (CIs) of ± 1.07 to ± 2.45 respectively at 95 percent confidence level.18 This
level of precision was considered acceptable.
4.7 Selecting a stratified random sample of veterinary surgeons
The Vetfile® database used as the sampling frame (Sections 3.6.2 and 3.6.3) includes
details of the type of work performed for each of the veterinary surgeons listed. It is
therefore possible to identify a sample of veterinary surgeons, stratified by type of
work with proportions of each type of work that are representative of the wider
population of veterinary surgeons practising in the UK. Veterinary surgeons included
in the Vetfile® database were grouped according to type of work. The work-type
groupings within the database differ from those identified in the RCVS Annual Report
2007 (RCVS 2007) and the RCVS Survey of the Veterinary Profession 2006
(Robinson and Hooker 2006). The differences and the treatment of differences in
order to develop the stratified sample are specified in Table 4.1.
18 95% CI width= 1.96 x p)/n-(100 x p n= number of observations, i.e. number of completed questionnaires; p= proportion

Chapter 4: Materials and methods 79
Table 4.1: Differences between published and Vetfile® database work-type groupings and their
treatment to develop a stratified sample
Difference Treatment Database includes an additional category which includes veterinary surgeons working in combined small animal and equine practice
This category was incorporated into the ‘Mixed’ work-type of general practice
Database does not specifically identify individuals working in ‘Referral/consultancy’ or ‘Other’ but includes them in the other categories
The percentage of individuals working in these categories determined from the published sources was allocated across the other groups in proportion to the size of each of the other groups
Database identifies individuals working as a ‘Locum’ but does not include details of the type of work that each performs in general practice
6 percent of the number of individuals in the sample working in general practice were selected from the ‘Locum’ work-type grouping of the database
Details of the structure of the stratified sample are specified in Table 4.2.
Table 4.2: Use of published sources of the proportions of veterinary surgeons in different types of
work to stratify the random sample selected from the Vetfile® database
Type of work Type of work† (%)
Type of general
practice‡ (%)
Number of vets in
random sample
General practice 85 Mixed* 28 795 Small animal/exotic 50 1421 Equine 7 199 Farm 5 142 Referral/consultancy** 7 Other** 3 Locum 6§ 163 Charities/Trusts 2 64 Industry/Commerce 2 64 Universities/Colleges 5 160 Government 6 192 Total 100 3200
† Source: RCVS (2007) ‡ Source: Robinson and Hooker (2006) * Mixed includes the Vetfile® category which contains veterinary surgeons involved with both small
animal and equine work ** These categories are included in the other general practice categories of the Vetfile® database § Locums comprise 6 percent of veterinary surgeons in general practice and work across all the sub-
types of general practice work. Consequently this column does not add to 100 percent

Chapter 4: Materials and methods 80
When the number of individuals required in each work-type (‘stratum’) was
calculated, individuals were selected from the database at random within each work-
type by selecting or rejecting them at appropriate predetermined intervals and then
repeating the process on those remaining within that work-type until the required
number was obtained (systematic random sampling).
The gender and decade of qualification profile of the entire study cohort was
compared with RCVS membership data for veterinary surgeons practising in the UK
(RCVS 2007) to check the degree of representativeness of the sample.
4.8 Generation of pre-study awareness
The following editorials were published in the veterinary press to generate pre-study
awareness among potential respondents as such pre-notification has been
demonstrated to improve response rates (See Section 3.4 Maximising response rates
to postal questionnaires):
• Letter to the Editor, Veterinary Record
(Vol 161, No 10, 8 September 2007, p. 360) (Bartram and Baldwin 2007)
• Editorial in Veterinary Times19
(Vol 37, No 36, 24 September 2007, p. 30)
• Editorial in UK Vet Livestock
(Vol 12, No 6, October 2007, p. 32)
Copies of the above items are included in Appendix III.
19 Veterinary Times is a weekly news journal mailed free-of-charge to all veterinary surgeons practising in the UK, including all those whose names and addresses are in the Vetfile® database. It is published by Veterinary Business Development Ltd., Peterborough, which owns and maintains the Vetfile® database.

Chapter 4: Materials and methods 81
4.9 Creation of study-specific website and e-mail address
The domain name vetwellbeing.co.uk was registered and a 10-page website created
with hosting provided by 123-reg.co.uk.
The purpose of the website was to provide study-related information and updates to
study participants and other interested parties. The website address was included in
pre-study awareness editorials and letterheads.
The home page of the website is illustrated in Figure 4.3.
Figure 4.3: Home page of www.vetwellbeing.co.uk website
A dedicated e-mail address ([email protected]) was established for study-
related correspondence with study participants and any other interested parties.
4.10 Distribution of questionnaires
A questionnaire, covering letter and reply-paid envelope was mailed to the sample of
3200 veterinary surgeons by second-class post in mid-October 2007.

Chapter 4: Materials and methods 82
A second letter with identical enclosures was mailed to the entire sample three weeks
later (in November 2007) as a reminder to those who had not already responded,
inviting them to return the completed questionnaire by the end of November. This
follow-up mailing was sent to all veterinary surgeons in the sample as it was not
possible to identify those who had already responded anonymously.
4.11 Reminder editorials in the veterinary press
The following editorials were published in the veterinary press after the mailing of
questionnaires to remind those who had not already responded to return the completed
questionnaire.
• Letter in Veterinary Times
(Vol 37, No 44, 19 November 2007, p. 35)
• Editorial in UK Vet Companion Animal
(Vol 12, No 8, November 2007, p. 55)
• Letter in Veterinary Times
(Vol 37, No 48, 17 December 2007, p. 26)
Copies of the above items are included in Appendix IV.
4.12 Receipt and preparation of returned questionnaires prior to data entry
Questionnaires were returned in reply-paid envelopes to Veterinary Business
Development Ltd., Peterborough, where they were stored unopened and then
forwarded in batches to the author (DJB) for processing.
The covering letter sent with each of the two mailings of the questionnaire requested
that the completed questionnaire was returned by the end of November 2007. The
deadline was extended to the end of December 2007 in a reminder letter published in

Chapter 4: Materials and methods 83
Veterinary Times in mid-December (see Section 4.11) but all questionnaires returned
by mid-March, before the completion of data entry, were eligible for inclusion.
The returned questionnaires were manually checked for completeness. If the
respondent’s intended response to an item was unambiguous but not recorded
according to the instructions, in a manner suitable for recognition by the optical
scanner during automated data entry, the entry was amended accordingly. For
example: a number of respondents did not complete the questionnaire in blue- or
black-coloured ink; responses were marked with a tick in or next to the circle rather
than shaded; responses were incompletely shaded or merely marked with a dot in the
circle. If there was any doubt whatsoever about a respondent’s intended response then
the entry was not altered.
For the first 300 returned questionnaires received, the free-text responses to question
number 120 – Which three aspects of your job are the greatest sources of pleasure
and/or satisfaction? – were copied verbatim into an Excel® spreadsheet. The content
of the responses was examined and grouped according to themes which were then
used to inform the development of a coding frame to describe the thematic content.
The coding frame was used to allocate to each of the free-text responses a numeric
identification code which was handwritten on the questionnaire in the appropriate
place for automated optical recognition, next to the corresponding free-text entries. A
copy of the coding frame with examples of the free-text responses allocated to each
code is included in Appendix V.
The names and contact details of those respondents who reported their willingness in
principle to be considered for participation in a possible subsequent phase of the
research were entered into a separate Excel spreadsheet. A unique numeric
identification code was allocated to each of these respondents and the code was
handwritten on the questionnaire in the appropriate place for automated optical
recognition, next to the corresponding free-text entry of contact details.
Late respondents can be used as a proxy for non-respondents in estimating non-
response bias in surveys (Groves 2006). Consequently questionnaires received from
mid-December were allocated a code to identify them as originating from late

Chapter 4: Materials and methods 84
respondents in order that statistical assessment could be made of whether the response
profile of this sub-population of respondents was different from earlier respondents.
A unique identification number was handwritten on the top of all returned
questionnaires. Questionnaires were then photocopied. The copies were placed in
archive boxes for safe storage and the originals were supplied to Data Management,
Information and Computing, School of Medicine, University of Southampton for
automated data entry.
Questionnaires received after completion of data entry and closure of the dataset for
earlier responses (mid-March 2008) were not processed (n=3, see Table 5.1).
4.13 Automated data entry
Questionnaires were scanned using a Fujitsu fi-5650c document scanner and
associated TeleForm (Verity Inc., Sunnyvale, CA) software. The system includes an
automated quality control facility which highlights the illegible and invalid entries for
operator attention and verification. The dataset was created in Microsoft Excel®
(Microsoft Corporation) and Statistical Package for the Social Sciences (SPSS®)
version 16.0 for Windows (SPSS Inc.) formats for statistical analysis. The dataset was
validated by checking entries against a random sample of questionnaires and
reviewing descriptive statistics and graphical display of key variables.
4.14 Scoring of scales and treatment of missing data in study questionnaire
The direction of scale varies between questions within Sections B and F (HADS and
HSE MSIT respectively). Direction of scale refers to whether the response options to
a particular question are scored in the direction of, for example, from 0 to 3 or in the
reverse direction, from 3 to 0, as the response options are read from left to right across
the page so that, for all questions within a section of the questionnaire, 0 always
represents the least severe response and 3 always represents the most severe response.
Care was taken to ensure the response options recorded in the dataset were scored in
the appropriate direction for each question.

Chapter 4: Materials and methods 85
Missing data occur in cross-sectional studies when a respondent accidentally or
deliberately omits to respond to an item in a questionnaire (item non-response). In this
study, respondents were advised that participation was voluntary and that they could
choose to omit answers to any questions. Missing data are problematic because
incomplete datasets may lead to results that are different from those that would have
been obtained if the dataset was complete. Missing values can be replaced by
imputation using the technique which best minimises these differences. Alternatively,
cases with missing data can be deleted from the analysis, but this reduces the sample
size. There is a wealth of missing data techniques available to researchers (reviewed
by Abraham and Russell 2004). Hawthorne and Elliott (2005) examined several
procedures for handling missing data in the context of research in psychiatry and
advocated the technique of person mean substitution (whereby the imputed value for a
variable with missing data is derived from the non-missing items for that person)
when data are missing from instrument scales, if at least half the items of a scale are
present.
The ‘randomness’ of missing data was checked to ensure that certain items were not
being systematically missed by respondents or certain demographic groups of
respondents.
Section A: Demographics (Q1-Q10)
These questions were not scored. No missing data were imputed, except for Q10:
How many hours on call in a typical week? A value of zero hours was assigned if the
field was left blank.
Section B: Anxiety and depression (Q11-Q24)
Hospital Anxiety and Depression Scale (HADS) (Zigmond and Snaith 1983)
Each question scores 0 to 3. There are two sub-scales: anxiety (HADS-A) and
depression (HADS-D). The score for each sub-scale is calculated by summation of the
scores of the component questions. There is a maximum score of 21 for each of the
two sub-scales.

Chapter 4: Materials and methods 86
HADS-A comprises 7 questions: 11, 13, 15, 17, 19, 21, 23.
HADS-D comprises 7 questions: 12, 14, 16, 18, 20, 22, 24.
If a score for a single item within a sub-scale was missing then this was substituted by
imputation using the mean of the remaining six items. If more than one item from a
sub-scale was missing then the sub-scale was judged as invalid and the case was not
included in the analysis. This is a more conservative approach to missing data than is
advocated in a number of recent publications where missing values were estimated by
assuming that the missing item(s) had a value equal to the average of those in
existence (person mean substitution), provided that no more than two (Kleppa and
others 2008, Stordal and others 2008) or three items (Jörngården and others 2006) of a
HADS sub-scale were missing. There is less likelihood of a significant p-value with
the more conservative approach because fewer cases are included in the analysis (n is
lower than if cases with >1 missing value were also included) and there is less
attenuation of dispersion (measures of variance, such as SD, are likely to be higher
than if cases with >1 missing value were also included as each of these cases would
have >1 missing value replaced by the mean of the non-missing values).
The score for each sub-scale was interpreted as follows, as recommended by Snaith
(2003): Non-case: score 0 to 7; Possible case: score 8 to 10; Probable case: ≥ 11.
Section C: Alcohol intake (Q25-Q27)
AUDIT alcohol consumption questions (AUDIT-C) (Bush and others 1998)
Each question scores 0 to 4. The scores for each question are summated to give a
single summary score for alcohol intake with a maximum score of 12.
The summary score is interpreted as follows, as recommended by Gual and others
(2002): Non-drinkers: score 0; Low-risk drinkers: score 1 to 3 for women and 1 to 4
for men; At-risk drinkers: score ≥ 4 for women and ≥ 5 for men.
Chapter 4: Materials and methods 87
AUDIT-C screens for hazardous drinking or active alcohol abuse or dependence
(Bush and others 1998). ‘At-risk’ drinkers have an increased risk of: harmful
consequences for their physical and mental health; and dependence. The cut-off
values of AUDIT-C score chosen for the diagnosis of at-risk drinkers in this study
correspond to the optimal operating point in terms of sensitivity and specificity for
men and women (Gual and others 2002, Rumpf and others 2002, Bradley and others
2003).
If Q25 was answered ‘never’ (score 0), a score of 0 was substituted for any missing
response(s) to Q26 and/or Q27. Otherwise, if an item from the scale was missing, the
scale was judged as invalid and the case was excluded from the analysis.
Section D: Negative thoughts about your life (Q28-Q30)
These questions were not scored. No missing data were imputed.
Section E: Mental well-being (Q31-Q44)
Warwick-Edinburgh Mental Well-being Scale (WEMWBS) (Tennant and others 2007)
Each of the 14 questions scores 1 to 5. The scores for each question were summated
to give a single summary score for mental well-being with a maximum score of 70
and a minimum score 14.
For up to 3 missing responses, the missing scores were imputed using the mean of the
remaining items. If more than 3 of the 14 possible responses were missing, the scale
was judged as invalid for that individual and the case was excluded from the analysis.
There was no reference in the literature at the time of data analysis to the handling of
missing data in WEMWBS but the above approach was endorsed by two leading
members of the team that developed the scale (S. Platt, personal communication; S.
Stewart-Brown, personal communication)20, 21 and has become the preferred method
20 Professor Stephen Platt, Research Unit in Health, Behaviour and Change, University of Edinburgh. 04 Jan 2008 [E-mail]

Chapter 4: Materials and methods 88
for the treatment of missing values in WEMWBS (Stewart-Brown and Janmohamed
2008).
Section F: Work-related stress (Q45-Q79)
Health and Safety Executive Management Standards Indicator Tool (Cousins and
others 2004).
The questions are grouped into the following seven stressor domains: demands,
control, managerial support, peer support, relationships, role, and change.
Stressor domain Question number in study questionnaire
Demands 47, 50, 53, 56, 60, 62, 64, 66 Control 46, 54, 59, 63, 69, 74 Managerial support 52, 67, 73, 77, 79 Peer support 51, 68, 71, 75 Relationships 49, 58, 65, 78 Role 45, 48, 55, 57, 61 Change 70, 72, 76
Each question scores 1 to 5. Across all domains, 1 always represents the most
unfavourable working conditions (most risk of stress at work); 5 always represents the
most favourable working conditions (least risk of stress at work).
The overall score for each of the seven stressor domain scales was calculated for each
respondent by adding the item scores for each question answered in that scale and
dividing by the total number of questions answered in that scale. In this way a mean
score standardised to a range between 1 and 5 was derived for each of the seven stress
component domain scales. This has the effect of standardisation of scale scores
regardless of the number of items in the scale and treating missing items as being the
equivalent of the mean of other items in the scale for that individual respondent.
21 Professor Sarah Stewart-Brown, Chair of Public Health, Warwick Medical School, University of Warwick. 04 Jan 2008 [E-mail]

Chapter 4: Materials and methods 89
A domain scale was treated as invalid for an individual if fewer than the following
number of questions was answered in a given domain, i.e. 66 percent of questions per
domain:
Stress domain Minimum number of questions answered for domain scale to be treated as valid
Demands 6 of a possible 8 Control 4 of a possible 6 Managerial support 4 of a possible 5 Peer support 3 of a possible 4 Relationships 3 of a possible 4 Role 4 of a possible 5 Change 2 of a possible 3
That is, a domain was considered invalid for a respondent if two or more responses
were missing from that domain, except for demands and control domains, for which a
domain was considered invalid for a respondent if three or more responses were
missing from the domain concerned. There is no reference in the extant literature to
the handling of missing data in this scale but the above approach was advocated by
the lead author of the report – Webster and others (2007) – which provides normative
data for this instrument for the UK general population (S. Webster, personal
communication).22
Section G: Work-home interaction (Q80-Q92)
The scales are derived from the SWING questionnaire (Geurts and others 2005).
This section comprises two separate scales:
negative work-home interaction (WHI_N) (Q80-Q87) and,
positive work-home interaction (WHI_P) (Q88-Q92).
Each question scores 0 to 3. 22 Simon Webster, Statistician, Health and Safety Executive, Bootle, Merseyside. 17 Jan 2008 [E-mail]

Chapter 4: Materials and methods 90
The overall score for each of the two separate scales was calculated for each
respondent by summating the item scores for each of the questions answered in that
scale and dividing by the total number of questions answered in that scale. In this way
a mean score standardised to a range between 0 and 3 was derived for each of the two
scales. This had the effect of treating missing items as being the equivalent of the
mean of other items in the scale for that individual respondent.
If a respondent answered fewer than 5 out of 8 items in the WHI_N scale, the scale
was considered invalid for that individual; if fewer than 3 out of 5 items were
answered in the WHI_P scale, the scale was considered invalid for that individual.
Cases with scales defined in this way as being invalid were not included in the
analysis. There is no reference in the literature to the handling of missing data in these
scales but the above approach was advocated by the lead author of the paper – Geurts
and others (2005) – in which the scales are first described (S. Geurts, personal
communication).23
Section H: How much does each of the following contribute to the stress you feel?
(Q93-Q119)
Each question scores 0 to 4. No missing data were imputed.
Which three aspects of your job are the greatest sources of pleasure and/or
satisfaction? (Q120)
The free-text responses to this open question were coded from 01 to 19 inclusive
according to theme using a coding frame (Appendix V). Each respondent could
supply up to three responses to this question. No missing data were imputed.
23 Dr. Sabine Geurts, Associate Professor in Work and Organizational Psychology, Radboud University, Nijmegen, Netherlands. 07 Jan 2008 [E-mail]

Chapter 4: Materials and methods 91
4.15 Statistical analysis
Statistical analyses are limited to testing the study hypotheses (Section 1.2) and
involve within-sample comparison of outcome measures across a range of
demographic and occupational factors, and comparison of estimated study population
parameters of mental health and well-being with those for the general population.
Examination of associations between measures on different scales and evaluation of
the psychometric properties (validity and reliability) of the scales (other than
Cronbach’s alpha test of internal consistency) is outside the scope of this thesis.
Descriptive statistics including mean, standard deviation (SD), median, interquartile
range (IQR) and proportions were used to describe the data. Graphical illustration,
cross tabulation and frequency tables were also applied. Histograms were plotted to
estimate the normality of distribution of study variables. Differences among groups
were explored using t-test and one-way analysis of variance (one-way ANOVA) or
the non-parametric equivalents, Mann-Whitney U and Kruskal-Wallis tests. Chi-
square (χ2) test was employed to compare proportions. To investigate the effect of
independent variables on dependent variables, multiple linear regression and logistic
regression were applied to continuous and binary outcome variables respectively.
95% confidence intervals (CIs) were computed for odds ratios (ORs) and regression
coefficients and other key study variables.
Analysis of the study dataset involved multiple analyses of subgroups of respondents
defined by their demographic and occupational characteristics, across several
dependent variables to assess the heterogeneity of the results. This increased the
likelihood of finding statistically significant associations by chance (Type I error).
Over 700 predefined subgroup analyses were planned and consequently over 35
statistically significant interaction tests (p<0.05) would be expected on the basis of
chance alone. No formal statistical adjustments were made to p-values to account for
the multiplicity. In view of the potential magnitude of the problem, statistical
significance was defined as a p-value of <0.01 for interpreting study results, thereby
reducing the number of expected false positive differences or associations to seven.
Statistical observations between p=0.010 and p=0.049 were regarded as marginal to

Chapter 4: Materials and methods 92
avoid missing potential true differences or associations which did not meet the p<0.01
significance threshold. Any such tentative differences or associations identified in this
exploratory study should be interpreted cautiously until their veracity has been tested
by replication in future studies.
Statistical significance was defined as a p-value of <0.05 for comparison of dependent
variables with those for the general population and other normative groups as these
data were not re-used to test multiple hypotheses.
Statistical analysis was performed using Statistical Package for the Social Sciences
(SPSS®) version 16.0 for Windows (SPSS Inc.). Some confidence intervals were
computed using Confidence Interval Analysis (CIA) software version 2.1.2.24
24 BRYANT, T.N. (2000) Computer software for calculating confidence intervals (CIA). In Statistics with confidence. Eds D.G. Altman, D. Machin, T.N. Bryant, M.J. Gardner. 2nd edition. London, BMJ Publishing Group. pp 208-213 [CIA software accompanies the book and is also available at http://som.soton.ac.uk/cia/]

Chapter 5: Results 93
CHAPTER 5: RESULTS
5.0 Introduction
This chapter begins by reporting the response rate for the study and the demographic
and occupational profile of respondents. Reporting of results is structured around the
study aims and hypotheses in the following order: outcome measures for the study
population; tests for differences across demographic and occupational factors (study
hypothesis 1); and comparison with normative data (study hypothesis 2). The chapter
ends with analyses to estimate non-response bias.
5.1 Returned questionnaires
5.1.1 Response rate
A total of 1808 questionnaires were returned from the 3200 veterinary surgeons
mailed. Twelve of the questionnaires were non-evaluable for the reasons listed in
Table 5.1.
Table 5.1: Non-evaluable returns
Reason for exclusion n Defaced 2 Retired - no questions answered 4 Maternity leave - no questions answered 1 Duplicate - respondent returned two questionnaires† 1 ‘Too depressed to complete’ - no questions answered 1 Late - received after scanning was completed 3 Total 12
† This respondent completed and returned the questionnaire for both the original and follow-up
mailings. This was detected because the respondent had provided name and contact details on both
copies in order to be considered to participate in a subsequent phase of the research.
Almost two-thirds of the questionnaires returned were received before the second
mailing, i.e. within 3 weeks of the first mailing (see Table 5.2). An overall response
rate of 56.1% was achieved (the number of usable returns as a proportion of the
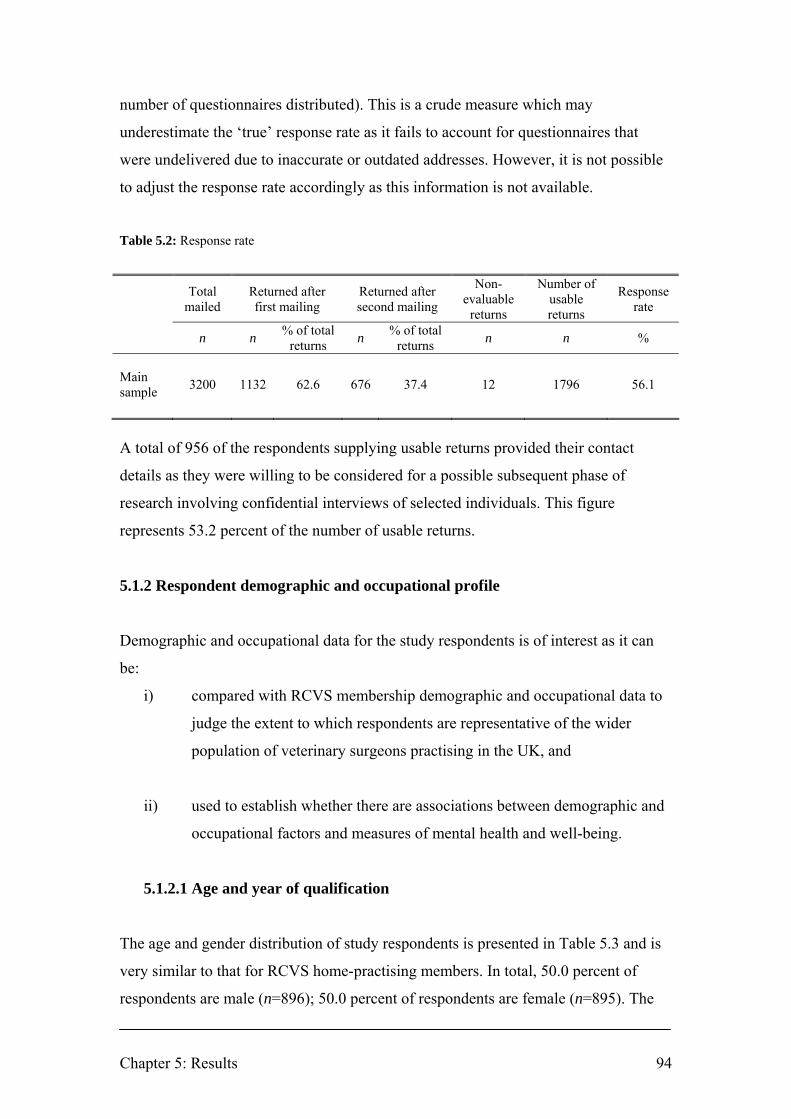
Chapter 5: Results 94
number of questionnaires distributed). This is a crude measure which may
underestimate the ‘true’ response rate as it fails to account for questionnaires that
were undelivered due to inaccurate or outdated addresses. However, it is not possible
to adjust the response rate accordingly as this information is not available.
Table 5.2: Response rate
Total
mailed Returned after first mailing
Returned after second mailing
Non-evaluable
returns
Number of usable returns
Response rate
n n % of total returns n % of total
returns n n %
Main sample 3200 1132 62.6 676 37.4 12 1796 56.1
A total of 956 of the respondents supplying usable returns provided their contact
details as they were willing to be considered for a possible subsequent phase of
research involving confidential interviews of selected individuals. This figure
represents 53.2 percent of the number of usable returns.
5.1.2 Respondent demographic and occupational profile
Demographic and occupational data for the study respondents is of interest as it can
be:
i) compared with RCVS membership demographic and occupational data to
judge the extent to which respondents are representative of the wider
population of veterinary surgeons practising in the UK, and
ii) used to establish whether there are associations between demographic and
occupational factors and measures of mental health and well-being.
5.1.2.1 Age and year of qualification
The age and gender distribution of study respondents is presented in Table 5.3 and is
very similar to that for RCVS home-practising members. In total, 50.0 percent of
respondents are male (n=896); 50.0 percent of respondents are female (n=895). The

Chapter 5: Results 95
age range of respondents is 23 to 90 years (mean=40.9, SD=11.0; median=40,
IQR=32-49) [male respondents (n=890): range=24-90, mean=44.9, SD=11.3,
median=44, IQR=36-53; female respondents (n=887): range=23-65, mean=36.8,
SD=9.1, median=35, IQR=29-44]. The age distribution of respondents is displayed as
box plots in Figure 5.1.
Table 5.3: Age and gender distribution of study respondents and RCVS home-practising members
Male Female Total RCVS§
Age n % n % n % % ≤ 25 18 22.2 63 77.7 81 4.6 2.4 26-30 76 26.0 216 73.9 292 16.4 20.4 31-35 127 39.8 192 60.2 319 18.0 18.8 36-40 103 47.0 116 53.0 219 12.3 13.8 41-45 148 53.8 127 46.2 275 15.5 12.3 46-50 136 59.1 94 40.9 230 12.9 11.0 51-55 106 67.1 52 32.9 158 8.9 8.0 56-60 99 81.1 23 18.9 122 6.9 6.1 61-65 55 93.2 4 6.8 59 3.3 4.0 66-70 8 100.0 0 - 8 0.5 1.7 71-75 9 100.0 0 - 9 0.5 0.8 76-80 3 100.0 0 - 3 0.2 0.4 81-85 1 100.0 0 - 1 0.1 0.3 86-90 1 100.0 0 - 1 0.1 0.1 Total 890 50.1 887 49.9 1777 100 - RCVS§ - 51.6 - 48.4 - - 100
§ Source: RCVS (2007, p. 31), n=15,670

Chapter 5: Results 96
Figure 5.1: Box plots of age distribution of male and female respondents
† t(1775)=16.7, p<0.001
Error bars represent the age range of respondents excluding outliers. Circles (•) represent outliers.
Outliers are defined as data points >1.5 IQR above the third quartile (i.e. >80 years for males). Age
outliers were included in the statistical analysis as RCVS data on the age of home-practising members
(Table 5.3) suggest that their values are possible within the target population.
The year of qualification distribution of study respondents is presented in Table 5.4.
Table 5.4: Year of qualification distribution of study respondents
Male Female Total
Year of qualification n % n % n % 1940-1949 1 100.0 0 - 1 0.1 1950-1959 9 100.0 0 - 9 0.5 1960-1969 56 93.3 4 6.7 60 3.4 1970-1979 194 72.3 74 27.6 268 15.1 1980-1989 273 59.0 190 41.0 463 26.1 1990-1999 221 44.1 280 69.8 501 28.2 2000-2007 130 27.6 340 72.3 470 26.5
p<0.001†
n=890 n=887

Chapter 5: Results 97
5.1.2.2 Veterinary school of qualification
The veterinary school of qualification distribution of study respondents is presented in
Table 5.5. The percentage of overseas graduates for respondents (16.8%) is lower
than that for RCVS membership (34%). However, the figure cited for the latter
includes members practising overseas, a group which was excluded from the original
sample.
Table 5.5: Veterinary school of qualification distribution of study respondents
Veterinary school n % RCVS† Bristol 212 11.8 - Cambridge 193 10.3 - Edinburgh 261 14.6 - Glasgow 248 13.9 - Liverpool 242 13.5 - London 334 18.7 - Overseas (EU or EEA countries) 169 9.4 - Overseas (Non-EU/EEA countries) 131 7.3 - Total overseas 300 16.8 34 Total UK 1490 83.2 66
† Robinson and Hooker (2006, p. 2) Includes overseas-practising, non-practising, and Republic of
Ireland, n=21,619
5.1.2.3 Type of work
The type of work distribution of study respondents is presented in Table 5.6. The
percentage of respondents in general practice (84.0%) and each other type of work is
similar to that for RCVS home-practising members (RCVS 2007). The percentage of
respondents in each type of general practice is similar to that determined in the RCVS
Survey of the Profession 2006 (Robinson and Hooker 2006) except that fewer study
respondents identified their type of work as mixed practice (12.6% of study
respondents vs. 27% of respondents to RCVS Survey of the Profession 2006).
However, study respondents were asked to identify their ‘main type of work’ whereas
respondents to the RCVS Survey of the Profession 2006 were asked about the ‘type of
organisation(s) in which [they] work’. Consequently, study respondents working in
mixed practice may have selected farm animal, equine or small animal as their main
type of work within their mixed practice workload rather than selecting the mixed

Chapter 5: Results 98
practice response option. This would lead to an apparent under-reporting of mixed
practice in comparison with the RCVS Survey of the Profession 2006.
Table 5.6: Type of work distribution of study respondents and RCVS members
Type of work n % RCVS§ RCVS† General practice Small animal practice 1011 56.4 - 49 Farm animal practice 81 4.5 - 4 Equine practice 151 8.4 - 6 Mixed practice 225 12.6 - 27 Other speciality practice 36 2.0 - 3 Total general practice 1504 84.0 85.4 89 Charity 33 1.8 2.3 - Government 113 6.3 5.6 - University – non-clinical 34 1.9 - University – clinical 65 3.6 5.0 - Industry 34 1.9 1.7 - Outside the profession 8 0.4 - -
§ Source: RCVS (2007, p. 27), n=15,671
† Robinson and Hooker (2006, p. 12, p. 16), n=9671. The category ‘Referral practice/consultancy’ (6%)
is distributed across each of the other categories of general practice in direct proportion to their
percentage contribution to the total for general practice
Figure 5.2 illustrates the type of work distribution for male and female respondents.

Chapter 5: Results 99
Figure 5.2: Type of work distribution of study respondents by gender
0 10 20 30 40 50 60 70 80
Outside veterinary profession (n=8)
Industry (n=34)
University - clinical (n=64)
University - non-clinical (n=34)
Government (n=113)
Charity (n=32)
Other speciality practice (n=36)
Mixed practice (n=225)
Equine practice (n=151)
Farm animal practice (n=81)
Small animal practice (n=1008)
Percent
Male (n=893) Female (n=893)
The difference in gender distribution across each type of work is significant (χ2=115.4, df=10, p<0.001)
5.1.2.4 Employment status
The employment status distribution of study respondents is presented in Table 5.7.
The relative proportions of each category of employment status are broadly similar for
study respondents and RCVS membership. The figures cited for the latter include
non-practising members which distort the distribution for RCVS membership in
favour of those partially retired or fully retired or taking a career break.
Table 5.7: Employment status distribution of study respondents and RCVS members
Male Female Total RCVS† Employment status n % n % n % % Full-time 812 90.6 655 73.3 1467 81.6 68 Part-time 60 6.7 223 24.9 283 15.8 14 Unemployed 0 - 1 0.1 1 0.1 1 Taking career break 0 - 9 1.0 9 0.5 2 Partially retired 21 2.3 5 0.6 26 1.5 4 Fully retired 3 0.3 1 0.1 4 0.2 12
† Robinson and Hooker (2006, p. 7), n=9671. Includes overseas-practising, non-practising, and
Republic of Ireland

Chapter 5: Results 100
5.1.2.5 Position in practice
The position in practice distribution of study respondents is presented in Table 5.8.
Table 5.8: Position in practice distribution of study respondents
Position in practice n % RCVS† Sole principal 143 8.0 11 Partner 310 17.4 10 Salaried partner 13 0.7 2 Partner/director (of limited company) 154 8.6 16 Full-time assistant (or employee of limited company) 653 36.6 40 Part-time assistant (or employee of limited company) 180 10.1 11 Consultant 28 1.6 1 Locum 74 4.1 6 Other 77 4.3 2 Not applicable 153 8.6 -
† Robinson and Hooker (2006, p. 16), n=8697. Respondents not working in practice are excluded
5.1.2.6 Ownership of practice
The ownership of practice distribution of study respondents is presented in Table 5.9.
The distribution of respondents is very similar to that for RCVS members.
Table 5.9: Ownership of practice distribution of study respondents
Ownership of practice n % RCVS† Sole principal 418 23.6 29 Partnership 755 42.6 50 Limited company 264 14.9 15 Corporate concern 48 2.7 2 Charity 54 3.0 3 Other 47 2.7 2 Not applicable 187 10.5 -
† Robinson and Hooker (2006, p. 17), n=8697. Respondents not working in practice are excluded

Chapter 5: Results 101
5.1.2.7 RCVS Certificate or Diploma holder
The proportion of study respondents holding an RCVS Certificate or Diploma is
presented in Table 5.10.
Table 5.10: Respondents holding an RCVS Certificate or Diploma
RCVS Certificate or Diploma holder n % RCVS§ Yes 290 16.2 11.5 No 1497 83.8 88.5
§ Source: RCVS (2007, p. 31), n=15,671. Percentage assumes all Certificate or Diploma holders are
home-practising
5.1.2.8 Hours worked and on-call in a typical week
The median number of hours worked and on-call in a typical week for study
respondents working full-time (n=1458) is 48 hours (IQR: 42-50 hours; mean=47.8,
SD=8.8) and 15 hours (IQR: 0-28 hours; mean=20.1, SD=24.9) respectively.
Men working full-time (n=805) report a greater number of hours worked in a typical
week (median=48 hours, IQR: 42-53 hours) than women working full-time (n=649)
(median=45 hours, IQR: 40-50 hours), Mann-Whitney U test: U=227,032.5, Z= -4.32,
p<0.001. Similarly, men working full time (n=802) report a greater number of hours
on-call in a typical week (median=17 hours, IQR: 0-30 hours) than women working
full-time (n=645) (median=14 hours, IQR: 0-26 hours), Mann-Whitney U test:
U=240,816.5, Z= -2.20, p=0.028.
The median number of hours worked and on-call in a typical week for each type of
work for study respondents working full-time is illustrated in Figure 5.3. Respondents
working in farm animal, equine and mixed practice have the longest total working and
on-call hours. This is in keeping with the results of the RCVS Survey of the Profession
2006 (Robinson and Hooker 2006, p. 13).

Chapter 5: Results 102
Figure 5.3: Median number of hours worked and on-call in a typical week for each type of work for
study respondents working full-time
0 10 20 30 40 50 60 70 80 90
All (n=1455)Outside the veterinary profession (n=3)
Industry (n=25)University - clinical (n=62)
University - non-clinical (n=30)Government (n=85)
Charity (n=26)Other speciality practice (n=28)
Mixed practice (n=202)Equine practice (n=137)
Farm animal practice (n=75)Small animal practice (n=782)
Hours
Hours worked Hours on-call
The difference in median number of hours worked across each type of work is significant.
(Kruskal-Wallis test: χ2=126.5, df=10, p<0.001).
The difference in median number of hours on-call across each type of work is significant.
(Kruskal-Wallis test: χ2=449.9, df=10, p<0.001).

Chapter 5: Results 103
Women veterinary surgeons work fewer hours in a typical week (men, median=48,
IQR: 40-52 hours vs. women, median=43, IQR: 34-50 hours; Mann-Whitney U test:
U=286,402.0, Z= -9.75, p<0.001), a reflection of the greater proportion of women
working part-time (24.9% vs. 6.7%, χ2=111.9, df=1, p<0.001). Figure 5.4 illustrates
the number of hours worked in a typical week for male and female study respondents.
The gender difference across number of hours worked in a typical week is statistically
significant (χ2 =125.5, df=8, p<0.001).
Figure 5.4: Number of hours worked in a typical week for male and female study respondents
0
5
10
15
20
25
30
35
40
45
0-9 10-19 20-29 30-39 40-49 50-59 60-69 70-79 80+
Hours
Perc
ent
Male (n=885) Female (n=883)
Note: includes full- and part-time workers
Similarly, women veterinary surgeons have fewer hours on-call in a typical week
(men, median=15, IQR: 0-30 hours vs. women, median=12, IQR: 0-24 hours; Mann-
Whitney U test: U=337,989.5, Z= -4.47, p<0.001). Figure 5.5 illustrates the number of
hours on-call for male and female study respondents. The gender difference across
number of hours on-call in a typical week is statistically significant (χ2 =36.4, df=8,
p<0.001).

Chapter 5: Results 104
Figure 5.5: Number of hours on-call in a typical week for male and female study respondents
0
5
10
15
20
25
30
35
40
45
50
0-9 10-19 20-29 30-39 40-49 50-59 60-69 70-79 80+
Hours
Per
cent
Male (n=881) Female (n=877)
Note: includes full- and part-time workers
5.1.3 Frequency and distribution of missing data
The percentage of missing data for each of the items in the questionnaire prior to
imputation (Figure 5.6), ranged from 0 to 5.6%, with the exception of the following:
items 67, 73 and 79 (three of the items in the managerial support scale for working
conditions, see Section 5.6) which had 14.6% to 18.1% missing data; item 70 (an item
in the change scale for working conditions); and items 109-120 inclusive which did
not require responses from all participants.
The overall level of missing data prior to imputation was 1.5% (2957 from 195,764
items). There were no missing data for 53.6% of respondents (n=963) and ≤ 4 items
of missing data for 90.8% of respondents (n=1630). These figures exclude items 109-
120 inclusive which did not require responses from all participants.

Figure 5.6: Percentage of missing data for each item prior to imputation
0
2
4
6
8
10
12
14
16
18
20
Question number
Perc
enta
ge
Notes:
• Q26 refers to alcohol consumption and was not answered by non-drinkers
• Q67, Q73 and Q79 are three of the items in the managerial support scale for working conditions which refer to a ‘line manager’ (see Section 5.6)
• Q70 is an item in the change scale for working conditions which refers to ‘managers’
• Q109-Q119 refer to clinical work-related stressors and respondents who do not treat clinical cases were requested to omit these questions • Q120a-c is an open question regarding sources of satisfaction. Respondents were invited to cite up to three sources

Chapter 5: Results 106
5.1.4 Summary
• Response rate of 56.1% (1796 usable returns).
• The first mailing yielded almost two-thirds of the total questionnaires returned.
• The demographic and occupational profile of study respondents is generally in
close alignment with that of RCVS membership which suggests that study
respondents are fairly representative of the wider population of veterinary
surgeons practising in the UK. Veterinary surgeons in mixed practice may be
under-represented but this may be associated with differences in question
wording on the classification of the type of work between study respondents
and respondents to the RCVS Survey of the Profession 2006.
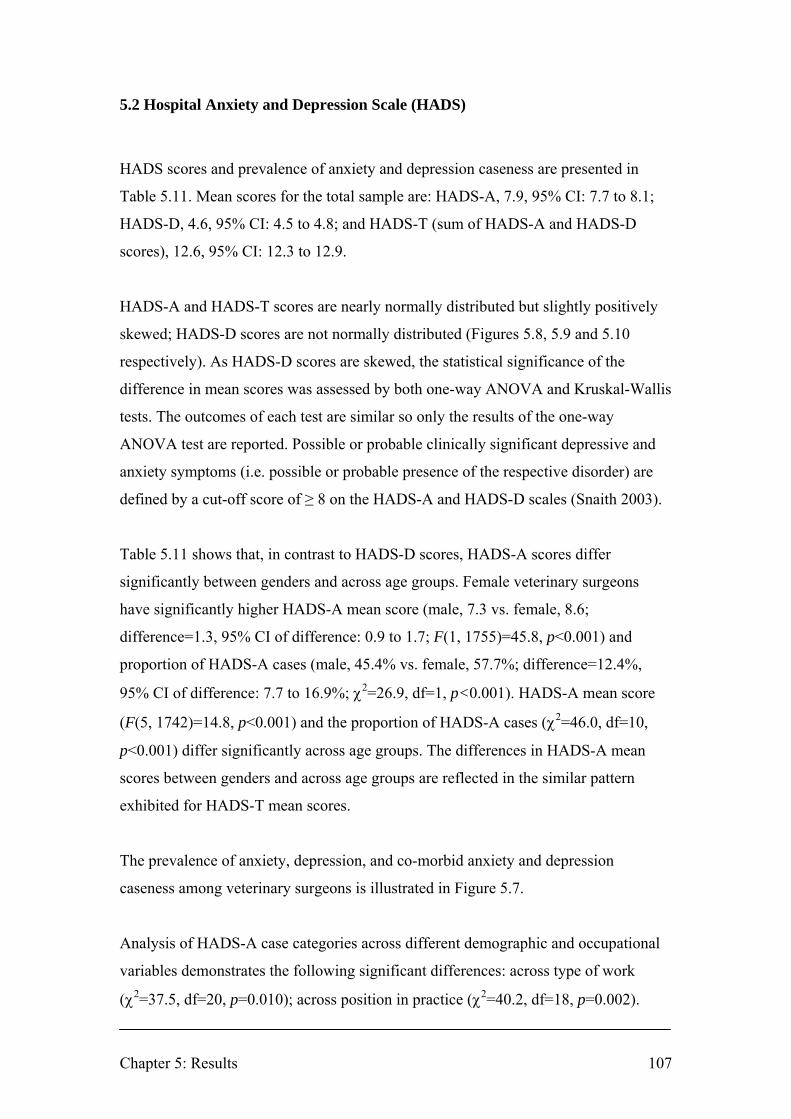
Chapter 5: Results 107
5.2 Hospital Anxiety and Depression Scale (HADS)
HADS scores and prevalence of anxiety and depression caseness are presented in
Table 5.11. Mean scores for the total sample are: HADS-A, 7.9, 95% CI: 7.7 to 8.1;
HADS-D, 4.6, 95% CI: 4.5 to 4.8; and HADS-T (sum of HADS-A and HADS-D
scores), 12.6, 95% CI: 12.3 to 12.9.
HADS-A and HADS-T scores are nearly normally distributed but slightly positively
skewed; HADS-D scores are not normally distributed (Figures 5.8, 5.9 and 5.10
respectively). As HADS-D scores are skewed, the statistical significance of the
difference in mean scores was assessed by both one-way ANOVA and Kruskal-Wallis
tests. The outcomes of each test are similar so only the results of the one-way
ANOVA test are reported. Possible or probable clinically significant depressive and
anxiety symptoms (i.e. possible or probable presence of the respective disorder) are
defined by a cut-off score of ≥ 8 on the HADS-A and HADS-D scales (Snaith 2003).
Table 5.11 shows that, in contrast to HADS-D scores, HADS-A scores differ
significantly between genders and across age groups. Female veterinary surgeons
have significantly higher HADS-A mean score (male, 7.3 vs. female, 8.6;
difference=1.3, 95% CI of difference: 0.9 to 1.7; F(1, 1755)=45.8, p<0.001) and
proportion of HADS-A cases (male, 45.4% vs. female, 57.7%; difference=12.4%,
95% CI of difference: 7.7 to 16.9%; χ2=26.9, df=1, p<0.001). HADS-A mean score
(F(5, 1742)=14.8, p<0.001) and the proportion of HADS-A cases (χ2=46.0, df=10,
p<0.001) differ significantly across age groups. The differences in HADS-A mean
scores between genders and across age groups are reflected in the similar pattern
exhibited for HADS-T mean scores.
The prevalence of anxiety, depression, and co-morbid anxiety and depression
caseness among veterinary surgeons is illustrated in Figure 5.7.
Analysis of HADS-A case categories across different demographic and occupational
variables demonstrates the following significant differences: across type of work
(χ2=37.5, df=20, p=0.010); across position in practice (χ2=40.2, df=18, p=0.002).
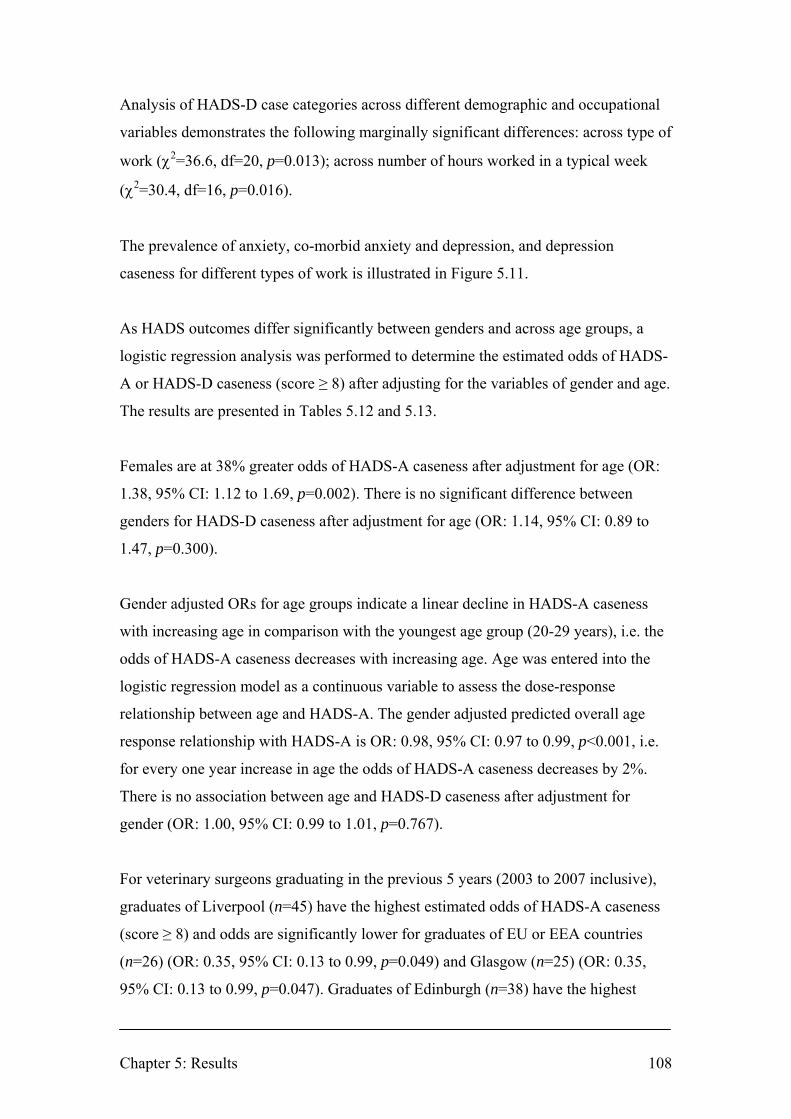
Chapter 5: Results 108
Analysis of HADS-D case categories across different demographic and occupational
variables demonstrates the following marginally significant differences: across type of
work (χ2=36.6, df=20, p=0.013); across number of hours worked in a typical week
(χ2=30.4, df=16, p=0.016).
The prevalence of anxiety, co-morbid anxiety and depression, and depression
caseness for different types of work is illustrated in Figure 5.11.
As HADS outcomes differ significantly between genders and across age groups, a
logistic regression analysis was performed to determine the estimated odds of HADS-
A or HADS-D caseness (score ≥ 8) after adjusting for the variables of gender and age.
The results are presented in Tables 5.12 and 5.13.
Females are at 38% greater odds of HADS-A caseness after adjustment for age (OR:
1.38, 95% CI: 1.12 to 1.69, p=0.002). There is no significant difference between
genders for HADS-D caseness after adjustment for age (OR: 1.14, 95% CI: 0.89 to
1.47, p=0.300).
Gender adjusted ORs for age groups indicate a linear decline in HADS-A caseness
with increasing age in comparison with the youngest age group (20-29 years), i.e. the
odds of HADS-A caseness decreases with increasing age. Age was entered into the
logistic regression model as a continuous variable to assess the dose-response
relationship between age and HADS-A. The gender adjusted predicted overall age
response relationship with HADS-A is OR: 0.98, 95% CI: 0.97 to 0.99, p<0.001, i.e.
for every one year increase in age the odds of HADS-A caseness decreases by 2%.
There is no association between age and HADS-D caseness after adjustment for
gender (OR: 1.00, 95% CI: 0.99 to 1.01, p=0.767).
For veterinary surgeons graduating in the previous 5 years (2003 to 2007 inclusive),
graduates of Liverpool (n=45) have the highest estimated odds of HADS-A caseness
(score ≥ 8) and odds are significantly lower for graduates of EU or EEA countries
(n=26) (OR: 0.35, 95% CI: 0.13 to 0.99, p=0.049) and Glasgow (n=25) (OR: 0.35,
95% CI: 0.13 to 0.99, p=0.047). Graduates of Edinburgh (n=38) have the highest
Chapter 5: Results 109
estimated odds of HADS-D caseness (OR: 2.25, 95% CI: 0.78 to 6.50) compared to
graduates of Liverpool (the reference group) but there is no significant difference in
the odds of HADS-D caseness for recent graduates between veterinary schools.
Veterinary surgeons working in university – non-clinical roles have significantly
lower estimated odds of HADS-A caseness than those in small animal practice (OR:
0.27, 95% CI: 0.12 to 0.63, p=0.003). Those working in government have marginally
significant higher estimated odds of HADS-D caseness than those in small animal
practice (OR: 1.63, 95% CI: 1.04 to 2.55, p=0.033). The odds ratios for HADS-A and
HADS-D caseness across employment types are illustrated in Figures 5.12 and 5.13.
Veterinary surgeons working in non-specified positions in practice (Other) have
marginally significant higher estimated odds of HADS-A caseness than sole
principals (OR: 1.86, 95% CI: 1.03 to 3.37, p=0.039) but otherwise the odds of
HADS-A or HADS-D caseness does not differ significantly across employment status,
position in practice, ownership of practice, RCVS certificate or diploma holders, or
hours worked or on-call in a typical week.
The HADS results for the sample of veterinary surgeons are compared with normative
data for a non-clinical sample of the UK adult general population in Table 5.14. The
HADS-A, HADS-D and HADS-T mean scores for veterinary surgeons are higher than
for the general population (HADS-A: 7.9, 95% CI: 7.7 to 8.1 vs. 6.1; HADS-D: 4.6,
95% CI: 4.5 to 4.8 vs. 3.9; HADS-T: 12.6, 95% CI: 12.3 to 12.9 vs. 9.8) and the
differences are statistically significant (p<0.001). The prevalence of HADS-A and
HADS-D probable cases is also higher among veterinary surgeons (HADS-A: 26.3%,
95% CI: 24.3 to 28.4% vs. 12.6%, χ2=106.3, df=1, p<0.001; HADS-D: 5.8%, 95% CI:
4.8 to 7.0% vs. 3.6%, χ2=9.3, df=1, p=0.002). There is a significant difference
between the distribution of the respective populations across HADS-A (χ2=113.77,
df=2, p<0.001) and HADS-D (χ2=43.6, df=2, p<0.001) case categories.
The two HADS sub-scales demonstrated high internal consistency in the study sample
(HADS-A: Cronbach’s α=0.85; HADS-D: Cronbach’s α=0.79).

Table 5.11: HADS sub-scale and total scores, and prevalence of anxiety and depression caseness for the total sample, by gender and by age group
HADS-A HADS-D Anxiety sub-scale Depression sub-scale
HADS-A HADS-D HADS-T† Non-case
Possible case
Probable case
Non-case
Possible case
Probable case
Co-morbid anxiety
and depression
Characteristic n mean SD median mean SD median mean SD median 0-7 (%)
8-10 (%)
11+ (%)
0-7 (%)
8-10 (%)
11+ (%)
Probable D and
Probable A Total 1757 7.9 4.1 8 4.6 3.4 4 12.6 6.8 12 48.4 25.3 26.3 80.6 13.6 5.8 4.5 Gender Male 881 7.3 4.0 7 4.6 3.4 4 11.8 6.6 11 54.5 24.3 21.1 81.6 13.0 5.5 4.0 Female 876 8.6 4.1 8 4.7 3.5 4 13.3 6.9 13 42.3 26.3 31.4 79.7 14.3 6.1 5.0 Age 20-29 297 8.7 4.0 8 4.5 3.2 4 13.2 6.4 12 40.1 28.3 31.6 81.8 13.1 5.1 4.7 30-39 554 8.4 4.1 8 4.7 3.4 4 13.1 6.8 12 44.5 26.6 28.9 81.7 11.6 6.7 5.2 40-49 501 8.0 4.1 8 5.0 3.6 4 13.0 7.0 13 47.9 25.0 27.1 77.2 16.4 6.4 5.2 50-59 299 7.1 3.9 7 4.5 3.5 4 11.6 6.6 11 57.7 21.5 20.8 80.3 15.4 4.3 2.7 60-69 82 5.5 3.4 5 3.6 2.9 3 9.1 5.8 9 70.7 20.7 8.5 85.4 13.4 1.2 - 70+ 15 4.3 3.4 4 3.0 1.7 3 7.3 4.4 6 73.3 20.0 6.7 100 - - -
† HADS-T is the summated total of the item scores for each of the sub-scales. It may be used as a global measure of psychological distress (Crawford and others 2001, Pallant and Tennant 2007) Significant difference between male and female HADS-A mean scores (one-way ANOVA, F(1, 1755)=45.8, p<0.001; difference=1.30, 95% CI of difference: 0.92 to 1.68) No significant difference between male and female HADS-D mean scores (one-way ANOVA, F(1, 1755)=1.2, p=0.268; difference=0.10, 95% CI of difference: -0.42 to 0.22) Significant difference between male and female HADS-T mean scores (one-way ANOVA, F(1, 1755)=21.2, p<0.001; difference=1.50, 95% CI of difference: 0.87 to 2.13) Significant difference in HADS-A mean scores across age groups (one-way ANOVA, F(5, 1742)=14.8, p<0.001) Significant difference in HADS-D mean scores across age groups (one-way ANOVA, F(5, 1742)=3.3, p=0.005) Significant difference in HADS-T mean scores across age groups (one-way ANOVA, F(5, 1742)=8.9, p<0.001) Significant difference between male and female across HADS-A case categories (χ2=32.0, df=2, p<0.001) No significant difference between male and female across HADS-D case categories (χ2=1.0, df=2, p=0.598) No significant difference between male and female prevalence of co-morbid probable anxiety and depression (χ2=1.13, df=1, p=0.288; difference=1.1, 95% CI of difference: -0.9 to 3.0) Significant difference between HADS-A case categories across age groups (χ2=46.0, df=10, p<0.001) No significant difference between HADS-D case categories across age groups (χ2=15.2, df=10, p=0.125) No significant difference between prevalence of co-morbid probable anxiety and depression across age groups (Fishers exact test, p=0.120)

Chapter 5: Results 111
Figure 5.7: Prevalence of anxiety, co-morbid anxiety and depression, and depression caseness COM: Co-morbid anxiety and depression
Prevalence of HADS-A or HADS-D score ≥ 11 (probable case)
Figures in parentheses represent prevalence of HADS-A or HADS-D score 8-10 (possible case)
95% CIs: HADS-A probable case 24.3 to 28.4%; HADS-A possible case 23.3 to 27.4%; HADS-D
probable case 4.8 to 7.0%; HADS-D possible case 11.8 to 15.0%; COM probable cases 3.6 to 5.6%;
COM possible cases 11.1 to 14.2%
Figure 5.8: Distribution of HADS-A scores
Chapter 5: Results 112
Figure 5.9: Distribution of HADS-T scores Figure 5.10: Distribution of HADS-D scores

Chapter 5: Results 113
Figure 5.11: Prevalence of anxiety, co-morbid anxiety and depression, and depression caseness (score
≥ 8) for different types of work
0 10 20 30 40 50 60 70
Outside veterinary profession (n=8)
Industry (n=34)
University - clinical (n=65)
University - non-clinical (n=34)
Government (n=110)
Charity (n=32)
Other speciality practice (n=35)
Mixed practice (n=218)
Equine practice (n=144)
Farm animal practice (n=79)
Small animal practice (n=997)
Percent
Anxiety Comorbid anxiety and depression Depression
Table 5.12: Estimated odds of HADS-A and HADS-D caseness (score ≥ 8) for gender after adjustment
for age, and for age after adjustment for gender
n=1743 (HADS-A); n=1728 (HADS-D)
Separate multivariable analyses adjusting for age and gender only † Adjusted p-value from multiple logistic regression; significant p-values (p<0.010) are in boldface font
HADS-A HADS-D Score ≥ 8 Score ≥ 8 Independent
variable OR 95% CI p-value† OR 95% CI p-value†
Gender Male 1 - - 1 - - Female 1.38 1.12 to 1.69 0.002 1.14 0.89 to 1.47 0.300 Age 20-29 1 - - 1 - - 30-39 0.88 0.66 to 1.18 0.398 1.03 0.71-1.48 0.889 40-49 0.79 0.59 to 1.07 0.129 1.37 0.95 to 1.99 0.094 50-59 0.57 0.41 to 0.80 0.001 1.16 0.76 to 1.78 0.492 60-69 0.34 0.20 to 0.59 <0.001 0.84 0.42-1.70 0.635 70+ 0.31 0.10 to 1.00 0.05 - - -

Table 5.13: Estimated odds of HADS-A and HADS-D caseness (score ≥ 8) adjusted for gender and age
HADS-A HADS-D Score ≥ 8 Score ≥ 8 Independent
variable OR 95% CI p-value† OR 95% CI p-value†
Veterinary school§ n=278 Liverpool 1 - - 1 - - London 0.75 0.31 to 1.78 0.509 1.14 0.40 to 3.31 0.806 EU or EEA countries 0.35 0.13 to 0.99 0.049 0.67 0.15 to 2.91 0.590 Non-EU/EEA countries 0.33 0.11 to 1.03 0.056 - - - Glasgow 0.35 0.13 to 0.99 0.047 0.90 0.24 to 3.43 0.877 Edinburgh 0.58 0.23 to 1.47 0.247 2.25 0.78 to 6.50 0.133 Cambridge 0.40 0.14 to 1.12 0.080 0.95 0.25 to 3.62 0.940 Bristol 0.70 0.27 to 1.85 0.475 1.46 0.45 to 4.73 0.527 Main type of work n=1738 Small animal practice 1 - - 1 - - Farm animal practice 0.87 0.55 to 1.40 0.577 0.76 0.41 to 1.41 0.385 Equine practice 0.97 0.68 to 1.39 0.870 0.74 0.46 to 1.19 0.207 Mixed practice 0.74 0.55 to 1.00 0.050 0.72 0.49 to 1.07 0.107 Other speciality practice 0.73 0.37 to 1.45 0.368 0.35 0.11 to 1.15 0.083 Charity 1.13 0.54 to 2.39 0.729 0.41 0.12 to 1.36 0.145 Government 1.28 0.85 to 1.93 0.234 1.63 1.04 to 2.55 0.033 University – non-clinical 0.27 0.12 to 0.63 0.003 0.51 0.18 to 1.48 0.219 University – clinical 0.97 0.58 to 1.62 0.907 0.54 0.25 to 1.14 0.105 Industry 0.57 0.28 to 1.18 0.129 0.65 0.25 to 1.70 0.374 Outside the profession 0.31 0.06 to 1.60 0.163 0.53 0.06 to 4.32 0.551 Employment status n=1741 Full-time 1 - - 1 - - Part-time 0.95 0.72 to 1.26 0.740 0.93 0.65 to 1.31 0.667 Unemployed - - - - - - Career break 0.34 0.08 to 1.37 0.128 1.94 0.48 to 7.86 0.352 Partially retired 0.70 0.30 to 1.68 0.428 0.70 0.23 to 2.11 0.529 Fully retired 0.58 0.06 to 5.71 0.637 - - - Continued overleaf

HADS-A HADS-D Score ≥ 8 Score ≥ 8 Independent
variable OR 95% CI p-value† OR 95% CI p-value†
Position in practice n=1732 Sole principal 1 - - 1 - - Partner 1.08 0.71 to 1.63 0.812 0.93 0.54 to 1.57 0.774 Salaried partner 0.87 0.27 to 2.78 0.813 0.38 0.05 to 3.06 0.362 Partner/director 1.55 0.97 to 2.48 0.070 1.49 0.84 to 2.65 0.169 Full-time assistant 1.09 0.72 to 1.65 0.692 1.06 0.62 to 1.80 0.828 Part-time assistant 1.03 0.64 to 1.65 0.916 0.99 0.54 to 1.80 0.960 Consultant 0.83 0.35 to 1.98 0.679 1.24 0.45 to 3.39 0.680 Locum 1.07 0.59 to 1.94 0.812 1.14 0.55 to 2.36 0.726 Other 1.86 1.03 to 3.37 0.039 1.41 0.70 to 2.82 0.338 Not applicable 0.73 0.45 to 1.18 0.197 1.03 0.56 to 1.87 0.936 Ownership of practice n=1721 Sole principal 1 - - 1 - - Partnership 0.86 0.67 to 1.11 0.242 0.88 0.65 to 1.20 0.426 Limited company 0.97 0.71 to 1.33 0.847 0.94 0.64 to 1.39 0.763 Corporate concern 1.18 0.63 to 2.20 0.604 0.90 0.42 to 1.94 0.796 Charity 1.28 0.70 to 2.33 0.423 0.50 0.21 to 1.21 0.126 Other 1.83 0.95 to 3.52 0.070 1.21 0.59 to 2.49 0.603 Not applicable 0.72 0.50 to 1.03 0.071 1.00 0.65 to 1.55 0.985 RCVS certificate or diploma n=1734 Yes 1 - - 1 - - No 0.91 0.70 to 1.19 0.493 1.16 0.83 to 1.63 0.390 Continued overleaf
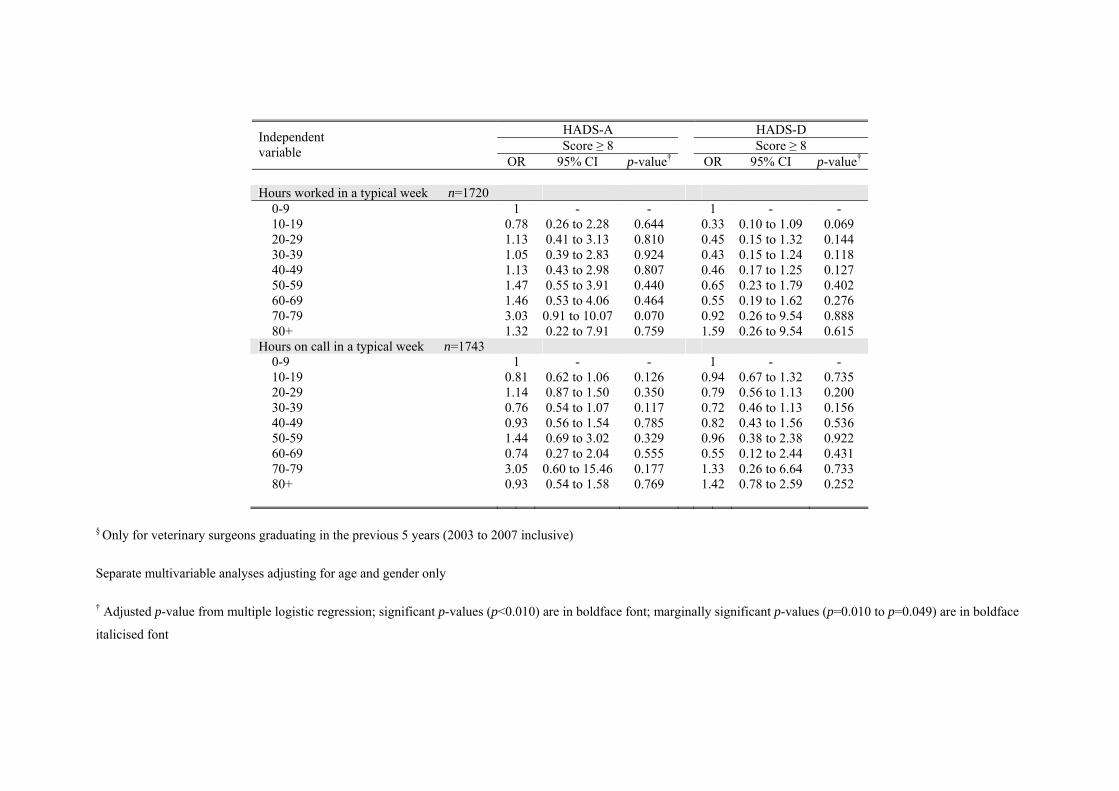
HADS-A HADS-D Score ≥ 8 Score ≥ 8 Independent
variable OR 95% CI p-value† OR 95% CI p-value†
Hours worked in a typical week n=1720 0-9 1 - - 1 - - 10-19 0.78 0.26 to 2.28 0.644 0.33 0.10 to 1.09 0.069 20-29 1.13 0.41 to 3.13 0.810 0.45 0.15 to 1.32 0.144 30-39 1.05 0.39 to 2.83 0.924 0.43 0.15 to 1.24 0.118 40-49 1.13 0.43 to 2.98 0.807 0.46 0.17 to 1.25 0.127 50-59 1.47 0.55 to 3.91 0.440 0.65 0.23 to 1.79 0.402 60-69 1.46 0.53 to 4.06 0.464 0.55 0.19 to 1.62 0.276 70-79 3.03 0.91 to 10.07 0.070 0.92 0.26 to 9.54 0.888 80+ 1.32 0.22 to 7.91 0.759 1.59 0.26 to 9.54 0.615 Hours on call in a typical week n=1743 0-9 1 - - 1 - - 10-19 0.81 0.62 to 1.06 0.126 0.94 0.67 to 1.32 0.735 20-29 1.14 0.87 to 1.50 0.350 0.79 0.56 to 1.13 0.200 30-39 0.76 0.54 to 1.07 0.117 0.72 0.46 to 1.13 0.156 40-49 0.93 0.56 to 1.54 0.785 0.82 0.43 to 1.56 0.536 50-59 1.44 0.69 to 3.02 0.329 0.96 0.38 to 2.38 0.922 60-69 0.74 0.27 to 2.04 0.555 0.55 0.12 to 2.44 0.431 70-79 3.05 0.60 to 15.46 0.177 1.33 0.26 to 6.64 0.733 80+ 0.93 0.54 to 1.58 0.769 1.42 0.78 to 2.59 0.252
§ Only for veterinary surgeons graduating in the previous 5 years (2003 to 2007 inclusive)
Separate multivariable analyses adjusting for age and gender only
† Adjusted p-value from multiple logistic regression; significant p-values (p<0.010) are in boldface font; marginally significant p-values (p=0.010 to p=0.049) are in boldface
italicised font

Chapter 5: Results 117
Figure 5.12: Estimated odds of HADS-A caseness (score ≥ 8) and 95% CI adjusted for gender and age
across type of work
Error bars represent 95% CI
0
0.5
1
1.5
2
2.5
3
Sm
all a
nim
al p
ract
ice
(n=9
97)
Farm
ani
mal
pra
ctic
e (n
=79)
Equ
ine
prac
tice
(n=1
44)
Mix
ed p
ract
ice
(n=2
19)
Oth
er s
peci
ality
pra
ctic
e (n
=35)
Cha
rity
(n=3
2)
Gov
ernm
ent (
n=11
0)
Uni
vers
ity –
non
-clin
ical
(n=3
4)
Uni
vers
ity –
clin
ical
(n=6
5)
Indu
stry
(n=3
4)
Out
side
the
prof
essi
on (n
=8)
Odd
s R
atio
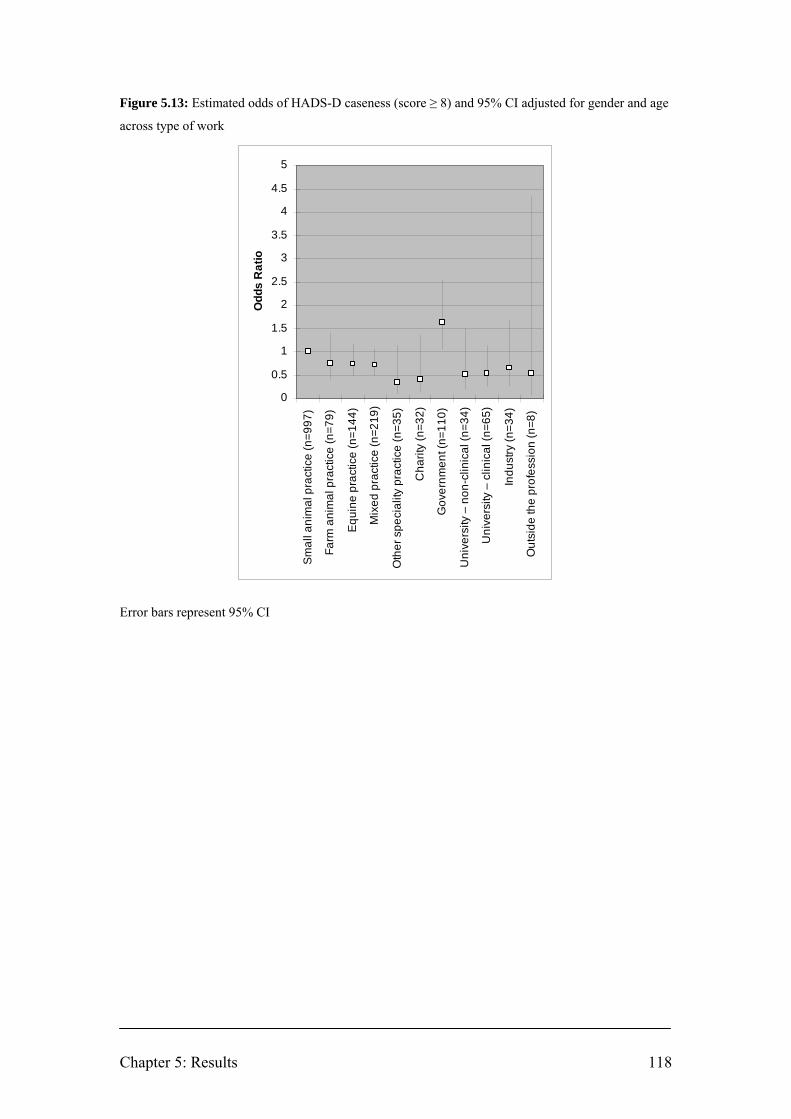
Chapter 5: Results 118
Figure 5.13: Estimated odds of HADS-D caseness (score ≥ 8) and 95% CI adjusted for gender and age
across type of work
Error bars represent 95% CI
0
0.5
1
1.5
2
2.5
3
3.5
4
4.5
5
Smal
l ani
mal
pra
ctic
e (n
=997
)
Farm
ani
mal
pra
ctic
e (n
=79)
Equi
ne p
ract
ice
(n=1
44)
Mix
ed p
ract
ice
(n=2
19)
Oth
er s
peci
ality
pra
ctic
e (n
=35)
Cha
rity
(n=3
2)
Gov
ernm
ent (
n=11
0)
Uni
vers
ity –
non
-clin
ical
(n=3
4)
Uni
vers
ity –
clin
ical
(n=6
5)
Indu
stry
(n=3
4)
Out
side
the
prof
essi
on (n
=8)
Odd
s R
atio
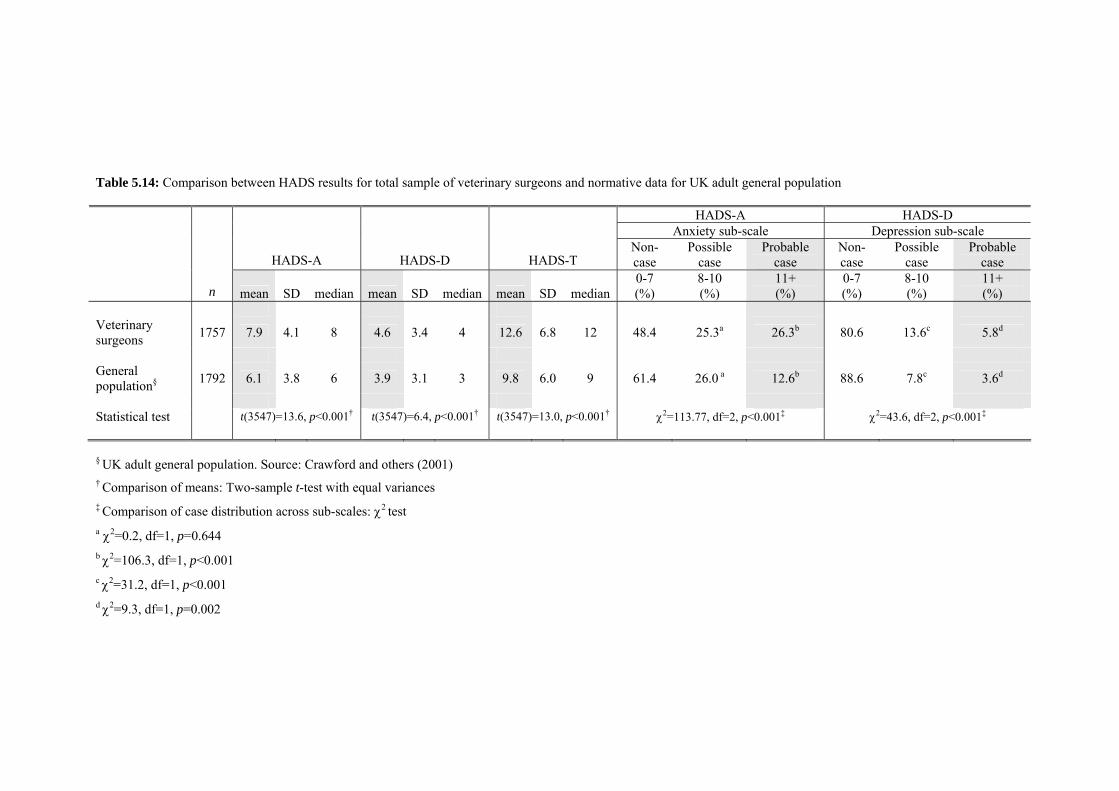
Table 5.14: Comparison between HADS results for total sample of veterinary surgeons and normative data for UK adult general population
HADS-A HADS-D Anxiety sub-scale Depression sub-scale
HADS-A HADS-D HADS-T Non-case
Possible case
Probable case
Non-case
Possible case
Probable case
n mean SD median mean SD median mean SD median 0-7 (%)
8-10 (%)
11+ (%)
0-7 (%)
8-10 (%)
11+ (%)
Veterinary surgeons 1757 7.9 4.1 8 4.6 3.4 4 12.6 6.8 12 48.4 25.3a 26.3b 80.6 13.6c 5.8d
General population§ 1792 6.1 3.8 6 3.9 3.1 3 9.8 6.0 9 61.4 26.0 a 12.6b 88.6 7.8c 3.6d
Statistical test t(3547)=13.6, p<0.001† t(3547)=6.4, p<0.001† t(3547)=13.0, p<0.001† χ2=113.77, df=2, p<0.001‡ χ2=43.6, df=2, p<0.001‡
§ UK adult general population. Source: Crawford and others (2001) † Comparison of means: Two-sample t-test with equal variances ‡ Comparison of case distribution across sub-scales: χ2 test a χ2=0.2, df=1, p=0.644 b χ2=106.3, df=1, p<0.001 c χ2=31.2, df=1, p<0.001 d χ2=9.3, df=1, p=0.002

Chapter 5: Results 120
5.2.1 Summary
• The prevalence of anxiety, co-morbid anxiety and depression, and depression
caseness (HADS sub-scale score ≥ 8) is 51.6% (95% CI: 49.3 to 54.0%);
16.8% (95% CI: 15.1 to 18.6%); and 19.4% (95% CI: 17.6 to 21.3%)
respectively.
• Female veterinary surgeons have significantly higher HADS-A mean score
(male, 7.3 vs. female, 8.6; difference=1.3, 95% CI of difference: 0.9 to 1.7;
F(1, 1755)=45.8, p<0.001) and proportion of HADS-A cases (male, 45.4% vs.
female, 57.7%; difference=12.4%, 95% CI of difference: 7.7 to 16.9%;
χ2=26.9, df=1, p<0.001). Females are at 38% greater odds of HADS-A
caseness after adjustment for age (OR: 1.38, 95% CI: 1.12 to 1.69, p=0.002).
• There is a significant difference between HADS-A mean score (F(5,
1742)=14.8, p<0.001) and HADS-A case categories (χ2=46.0, df=10, p<0.001)
across age groups. After adjustment for gender, for every one year increase in
age the odds of HADS-A caseness decreases by 2% (OR: 0.98, 95% CI: 0.97
to 0.99, p<0.001).
• There is no significant difference between genders for HADS-D caseness after
adjustment for age (OR: 1.14, 95% CI: 0.89 to 1.47, p=0.300) and no
association between age and HADS-D caseness after adjustment for gender
(OR: 1.00, 95% CI: 0.99 to 1.01, p=0.767).
• For veterinary surgeons graduating in the previous 5 years, the estimated odds
of HADS-A caseness is highest among Liverpool graduates and marginally
significantly lower for graduates of EU or EEA countries (OR: 0.35, 95% CI:
0.13 to 0.99, p=0.049) and Glasgow (OR: 0.35, 95% CI: 0.13 to 0.99,
p=0.047).
• Veterinary surgeons working in university – non-clinical roles have
significantly lower estimated odds of HADS-A caseness than those working in

Chapter 5: Results 121
small animal practice (OR: 0.27, 95% CI: 0.12 to 0.63, p=0.003).
• Veterinary surgeons working in government have a marginally significant
higher estimated odds of HADS-D caseness than those working in small
animal practice (OR: 1.63, 95% CI: 1.04 to 2.55, p=0.033).
• The prevalence of anxiety and depressive symptoms is significantly higher
than among a non-clinical sample of the UK general population.
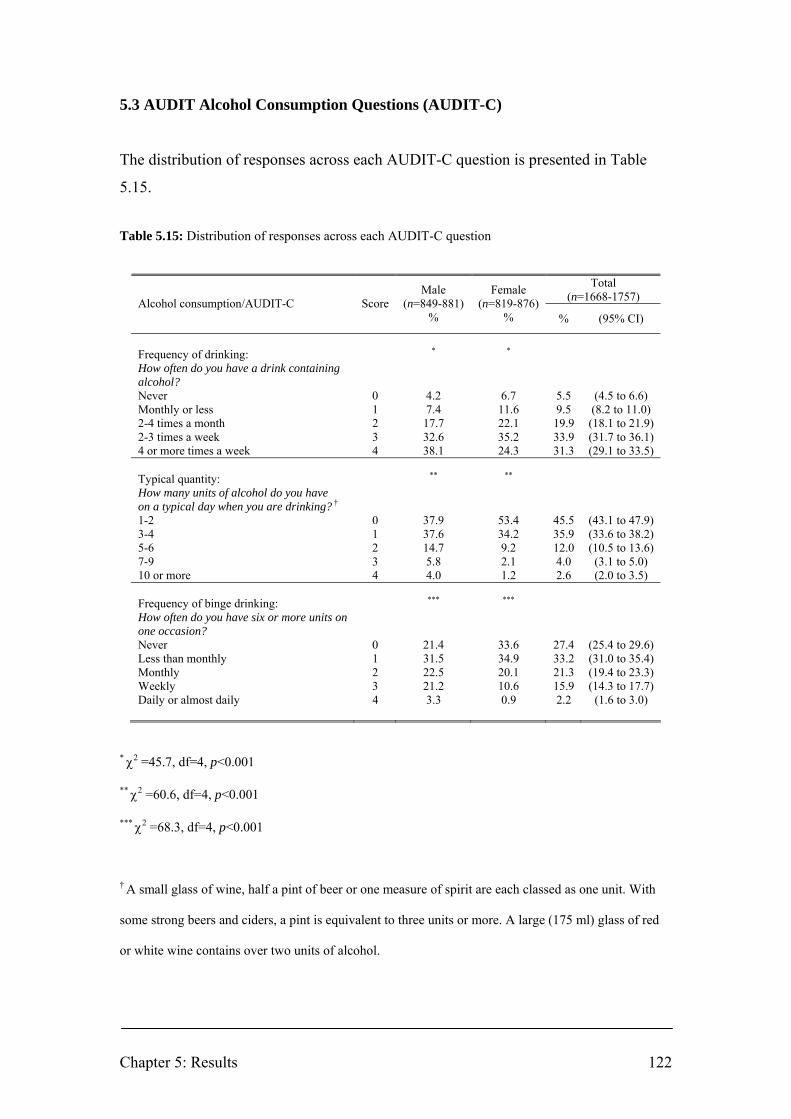
Chapter 5: Results 122
5.3 AUDIT Alcohol Consumption Questions (AUDIT-C)
The distribution of responses across each AUDIT-C question is presented in Table
5.15.
Table 5.15: Distribution of responses across each AUDIT-C question
Total (n=1668-1757) Alcohol consumption/AUDIT-C Score
Male (n=849-881)
%
Female (n=819-876)
% % (95% CI)
Frequency of drinking: How often do you have a drink containing alcohol?
* *
Never 0 4.2 6.7 5.5 (4.5 to 6.6) Monthly or less 1 7.4 11.6 9.5 (8.2 to 11.0) 2-4 times a month 2 17.7 22.1 19.9 (18.1 to 21.9) 2-3 times a week 3 32.6 35.2 33.9 (31.7 to 36.1) 4 or more times a week 4 38.1 24.3 31.3 (29.1 to 33.5) Typical quantity: How many units of alcohol do you have on a typical day when you are drinking? †
** **
1-2 0 37.9 53.4 45.5 (43.1 to 47.9) 3-4 1 37.6 34.2 35.9 (33.6 to 38.2) 5-6 2 14.7 9.2 12.0 (10.5 to 13.6) 7-9 3 5.8 2.1 4.0 (3.1 to 5.0) 10 or more 4 4.0 1.2 2.6 (2.0 to 3.5) Frequency of binge drinking: How often do you have six or more units on one occasion?
*** ***
Never 0 21.4 33.6 27.4 (25.4 to 29.6) Less than monthly 1 31.5 34.9 33.2 (31.0 to 35.4) Monthly 2 22.5 20.1 21.3 (19.4 to 23.3) Weekly 3 21.2 10.6 15.9 (14.3 to 17.7) Daily or almost daily 4 3.3 0.9 2.2 (1.6 to 3.0)
* χ2 =45.7, df=4, p<0.001
** χ2 =60.6, df=4, p<0.001
*** χ2 =68.3, df=4, p<0.001
† A small glass of wine, half a pint of beer or one measure of spirit are each classed as one unit. With
some strong beers and ciders, a pint is equivalent to three units or more. A large (175 ml) glass of red
or white wine contains over two units of alcohol.

Chapter 5: Results 123
Figure 5.14 summarises the distribution of AUDIT-C total scores among male and
female veterinary surgeons. The gender difference across AUDIT-C scores is
significant (χ2=96.3, df=12, p<0.001).
Figure 5.14: Distribution of AUDIT-C total scores among male and female veterinary surgeons
02468
101214161820
0 1 2 3 4 5 6 7 8 9 10 11 12
AUDIT-C score
Per
cent
Male (n=881) Female (n=876)

Chapter 5: Results 124
Figure 5.15 summarises the frequency of drinking among veterinary surgeons. Almost
two-thirds of veterinary surgeons (total, 65.1%, 95% CI: 62.9 to 67.3%; men, 70.7%,
95% CI: 67.6 to 73.6%; women, 59.5%, 95% CI: 56.2 to 62.7%) drink more than
twice a week, and 38.1% (95% CI: 35.0 to 41.4%) of men and 24.3% (95% CI: 21.6
to 27.3%) of women drink four or more times a week. The gender difference across
drinking frequencies is significant (χ2=45.7, df=4, p<0.001).
Figure 5.15: Frequency of drinking among veterinary surgeons
0
5
10
15
20
25
30
35
40
45
Never Monthly or less Two to four timesa month
Two to threetimes a week
Four or moretimes a week
Perc
ent
Male (n=881) Female (n=876)
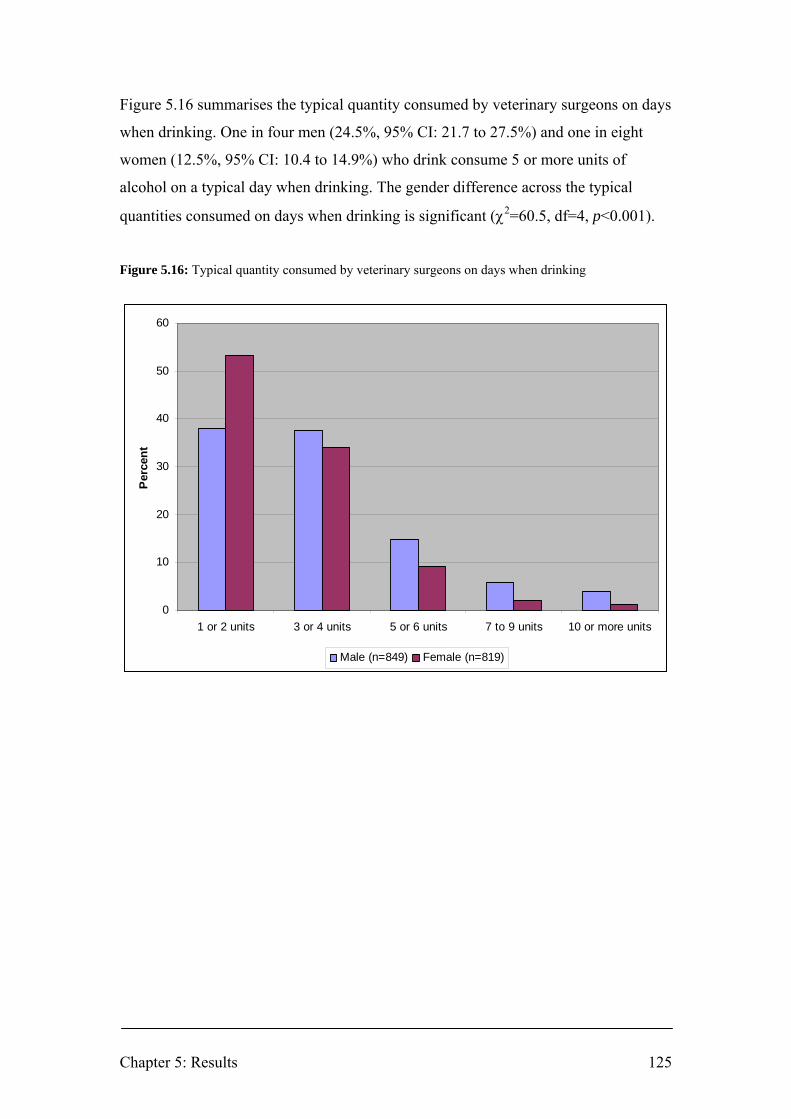
Chapter 5: Results 125
Figure 5.16 summarises the typical quantity consumed by veterinary surgeons on days
when drinking. One in four men (24.5%, 95% CI: 21.7 to 27.5%) and one in eight
women (12.5%, 95% CI: 10.4 to 14.9%) who drink consume 5 or more units of
alcohol on a typical day when drinking. The gender difference across the typical
quantities consumed on days when drinking is significant (χ2=60.5, df=4, p<0.001).
Figure 5.16: Typical quantity consumed by veterinary surgeons on days when drinking
0
10
20
30
40
50
60
1 or 2 units 3 or 4 units 5 or 6 units 7 to 9 units 10 or more units
Per
cent
Male (n=849) Female (n=819)

Chapter 5: Results 126
Figure 5.17 summarises the frequency of drinking 6 or more units on one occasion.
For 2.2% (95% CI: 1.6 to 3.0%) of veterinary surgeons (men 3.4%, 95% CI: 2.4 to
4.8%; women 0.9%, 95% CI: 0.4 to 1.7%) this is a daily or almost daily occurrence
and for 15.9 % (95% CI: 14.2 to 17.7%) (men 21.3%, 95% CI: 18.7 to 24.1%; women
10.6%, 95% CI: 8.7 to 12.8%) it is a weekly occurrence. The gender difference across
the frequencies of drinking 6 or more units on one occasion is significant (χ2=68.3,
df=4, p<0.001).
Figure 5.17: Frequency of drinking 6 or more units on one occasion
0
5
10
15
20
25
30
35
40
Never Less thanmonthly
Monthly Weekly Daily or almostdaily
Perc
ent
Male (n=861) Female (n=852)
The proportion of veterinary surgeons in each AUDIT-C drinking category is
presented in Table 5.16. The difference between males and females is across
categories is marginally significant (χ2=6.9, df=2, p=0.033). Around one in 20
veterinary surgeons (5.4%, 95% CI: 4.4 to 6.6%) report not drinking alcohol. Women
are more likely than men to be non-drinkers (women, 6.7% vs. men, 4.1%,
difference=2.6%, 95% CI of difference: 0.5 to 4.8%, χ2=6.0, df=1, p=0.014). There is
no significant difference in the prevalence of at-risk drinking between men and
women (women 62.7% vs. men 62.4%, difference=0.2%, 95% CI of difference: -4.8
to 4.3%, χ2=0.01, df=1, p=0.916).

Chapter 5: Results 127
Table 5.16: Proportion of veterinary surgeons in each AUDIT-C drinking category
Non-drinkers % (95% CI)
Low-risk drinkers % (95% CI)
At-risk drinkers % (95% CI)
n score 0 score 1 to 4 for men
score 1 to 3 for women score ≥ 5 for men
score ≥ 4 for women Total 1757 5.4 (4.4 to 6.6) 32.0 (29.9 to 34.3) 62.6 (60.3 to 64.8) Male 881 4.1 (3.0 to 5.6) 33.5 (30.4 to 36.7) 62.4 (59.2 to 65.6) Female 876 6.7 (5.3 to 8.6) 30.6 (27.6 to 33.7) 62.7 (59.4 to 65.8)
The prevalence of at-risk drinkers in different 10-year age groups is illustrated in
Figure 5.18. The highest prevalence of at-risk drinkers (73.7%, 95% CI: 68.5 to
78.4%) is in the 20-29 years age group (n=297). The difference in the prevalence of
at-risk drinkers across 10-year age groups is significant (χ2=25.6, df=5, p<0.001).
Figure 5.18: Prevalence of at-risk drinkers in different 10-year age groups
30
35
40
45
50
55
60
65
70
75
80
20-29 (n=297) 30-39 (n=553) 40-49 (n=499) 50-59 (n=297) 60-69 (n=82) 70+ (n=15)
Age
Per
cent

Chapter 5: Results 128
The high prevalence of at-risk drinking in the 20-29 years age group is in keeping
with the results for a cohort of final year veterinary students25 (n=55): non-drinkers
3.6% (95% CI: 0.1 to 12.3%); low-risk drinkers; 29.1% (95% CI: 18.8 to 42.1%); at-
risk drinkers 67.3% (95% CI: 54.1 to 78.2%) (D.J. Bartram, unpublished data).
For veterinary surgeons graduating in the previous 5 years (2003 to 2007 inclusive),
graduates of Bristol (n=35), London (n=57) and Liverpool (n=46) have the highest
prevalence of at-risk drinkers (82.9%, 95% CI: 67.3 to 91.9%; 80.7% 95% CI: 68.7 to
88.9%; and 80.4%, 95% CI: 66.8 to 89.3% respectively) and the lowest prevalence of
non-drinkers (2.9%, 95% CI: 0.5 to 14.5%; 1.8%, 95% CI: 0.3 to 9.3%; and 0.0%,
95% CI: 0.0 to 7.7% respectively). Graduates of EU/EAA countries (n=29) have the
lowest prevalence of at-risk drinkers (27.6%, 95% CI: 14.7 to 45.7%). The differences
across AUDIT-C drinking categories between recent graduates from different
veterinary schools is significant (χ2=55.1, df=14, p<0.001).
The prevalence of at-risk drinkers is highest in equine practice (n=144) (70.8%, 95%
CI: 62.9 to 77.6%) and mixed practice (n=219) (68.5%, 95% CI: 62.1 to 74.3%), and
lowest among veterinary surgeons working outside the profession (n=8) (25.0%, 95%
CI: 7.1 to 59.1%) and government (n=110) (50.0%, 95% CI: 40.8 to 59.2%) but the
difference across AUDIT-C drinking categories between types of work is not
significant (χ2=28.3, df=20, p=0.102).
The prevalence of at-risk drinkers is higher among full-time (n=1435) (64.5%, 95%
CI: 62.0 to 67.0%) and part-time workers (n=281) (55.2%, 95% CI: 49.3 to 60.9%)
than those who are partially retired (n=26) (46.2%, 95% CI: 28.8 to 64.5%), on a
career break (n=9) (44.4%, 95% CI: 18.9 to 73.3%) or fully retired (n=4) (25.0%,
95% CI: 4.6 to 69.9%). The difference across AUDIT-C drinking categories between
types of employment status is marginally significant (χ2=22.3, df=10, p=0.014).
The prevalence of at-risk drinkers for across number of hours worked and on-call in a
typical week is displayed in Figure 5.19. There is a significant difference across
25 Class of final year veterinary students, University of Liverpool, 29 Apr 2008. Response rate: 100% (62.0% of those registered). AUDIT-C: mean=4.7; SD=2.2; n=55; 18 ♂, 37 ♀; age range: 22-31 years.

Chapter 5: Results 129
AUDIT-C drinking categories between different 10-hour groups of number of hours
worked (χ2=34.6, df=16, p=0.005), and a marginally significant difference between
different 10-hour groups of number of hours on-call (χ2=31.7, df=16, p=0.011).
Figure 5.19: Prevalence of at-risk drinkers across number of hours worked or on-call in a typical week
0
10
20
30
40
50
60
70
80
0-9 10-19 20-29 30-39 40-49 50-59 60-69 70-79 80+
Hours
Perc
ent
Hours worked Hours on call
As some AUDIT-C outcomes differ significantly between genders and across age
groups, a multiple logistic regression analysis was performed to determine the
estimated odds of at-risk drinking after adjusting for the variables of gender and age.
The results are presented in Table 5.17. For veterinary surgeons graduating in the
previous 5 years, compared to Liverpool graduates (the reference group), the
estimated odds of at-risk drinking is significantly lower for graduates of EU/EEA
countries (OR: 0.12, 95% CI: 0.04 to 0.37, p<0.001) and marginally significantly
lower for graduates of non-EU/EEA countries (OR: 0.29, 95% CI: 0.09 to 0.91,
p=0.034). Part-time assistants have a marginally significant lower estimated odds of
at-risk drinking than sole principals (OR: 0.56, 95% CI: 0.35 to 0.91, p=0.019).
Respondents of practices owned by a charity have a marginally lower odds of at-risk
drinking than those owned by a sole principal (OR: 0.53, 95% CI: 0.30 to 0.96,
p=0.035).

Chapter 5: Results 130
Table 5.17: Estimated odds of AUDIT-C at-risk drinking after adjustment for gender and age
At-risk drinkers
score ≥ 5 for men score ≥ 4 for women
Independent variable
OR 95% CI p-value† Veterinary school§ n=278 Liverpool 1 - - London 1.03 0.38 to 2.78 0.950 EU or EEA countries 0.12 0.04 to 0.37 <0.001 Non-EU/EEA countries 0.29 0.09 to 0.91 0.034 Glasgow 0.89 0.28 to 2.89 0.849 Edinburgh 0.95 0.33 to 2.74 0.933 Cambridge 0.88 0.27 to 2.84 0.833 Bristol 1.17 0.37 to 3.72 0.791 Main type of work n=1738 Small animal practice 1 - - Farm animal practice 0.86 0.53 to 1.38 0.527 Equine practice 1.35 0.92 to 1.99 0.129 Mixed practice 1.22 0.89 to 1.69 0.205 Other speciality practice 0.75 0.38 to 1.49 0.416 Charity 0.70 0.34 to 1.44 0.330 Government 0.67 0.44 to 1.00 0.050 University – non-clinical 0.88 0.43 to 1.79 0.724 University – clinical 1.00 0.59 to 1.69 0.991 Industry 0.21 0.04 to 1.07 0.060 Outside the profession 1.20 0.58 to 2.48 0.619 Employment status n=1741 Full-time 1 - - Part-time 0.77 0.58 to 1.01 0.067 Unemployed 0.42 0.11 to 1.58 0.198 Career break - - - Partially retired 0.67 0.30 to 1.49 0.280 Fully retired 0.28 0.03 to 2.78 0.476 Position in practice n=1732 Sole principal 1 - - Partner 1.22 0.80 to 1.87 0.360 Salaried partner 1.07 0.31 to 3.73 0.911 Partner/director 1.18 0.72 to 1.93 0.510 Full-time assistant 0.76 0.50 to 1.17 0.212 Part-time assistant 0.56 0.35 to 0.91 0.019 Consultant 1.19 0.50 to 2.81 0.699 Locum 0.63 0.34 to 1.14 0.124 Other 0.63 0.35 to 1.13 0.121 Not applicable 0.69 0.43 to 1.11 0.126 Ownership of practice n=1721 Sole principal 1 - - Partnership 1.06 0.82 to 1.37 0.680 Limited company 0.82 0.59 to 1.14 0.233 Corporate concern 0.78 0.42 to 1.45 0.426 Charity 0.53 0.30 to 0.96 0.035 Other 0.93 0.49 to 1.76 0.827 Not applicable 0.66 0.46 to 0.95 0.024 RCVS certificate or diploma n=1734 Yes 1 - - No 1.02 0.78 to 1.33 0.887 Continued overleaf

Chapter 5: Results 131
At-risk drinkers score ≥ 5 for men
score ≥ 4 for women Independent variable
OR 95% CI p-value† Hours worked in a typical week n=1720 0-9 1 - - 10-19 1.00 0.35 to 2.86 0.996 20-29 0.98 0.36 to 2.65 0.970 30-39 1.78 0.67 to 4.72 0.245 40-49 1.39 0.53 to 3.59 0.495 50-59 1.82 0.70 to 4.75 0.219 60-69 2.08 0.76 to 5.69 0.154 70-79 0.75 0.24 to 2.37 0.621 80+ 2.10 0.32 to 13.89 0.441 Hours on call in a typical week n=1743 0-9 1 - - 10-19 1.14 0.86 to 1.51 0.353 20-29 1.26 0.95 to 1.67 0.114 30-39 1.64 1.14 to 2.37 0.008 40-49 1.02 0.61 to 1.70 0.939 50-59 0.53 0.26 to 1.10 0.088 60-69 1.52 0.52 to 4.45 0.449 70-79 0.63 0.16 to 2.55 0.518 80+ 0.74 0.44 to 1.26 0.269
§ Only for veterinary surgeons graduating in the previous 5 years (2003 to 2007 inclusive)
Separate multivariable analyses adjusting for age and gender only † Adjusted p-value from multiple logistic regression; significant p-values (p<0.010) are in boldface font;
marginally significant p-values (p=0.010 to p=0.049) are in boldface italicised font
There is no significant difference in the estimated odds of at-risk drinking for males
and females after adjusting for age (OR: 0.89, 95% CI: 0.70 to 1.13, p=0.346).
However, at-risk drinking is significantly associated with age after adjustment for
gender: a one year increase in age is associated with a 2% reduction in the risk of at-
risk drinking (OR: 0.98, 95% CI: 0.97 to 0.99, p=0.001).
The proportion of veterinary surgeons in each AUDIT-C category and normative data
for the general population of Great Britain is presented in Table 5.18. There is a
significant difference between the distribution of veterinary surgeons and the general
population across drinking categories (χ2=150.4, df=2, p<0.001). The proportion of
veterinary surgeons who are non-drinkers is lower than among the general population
(5.4%, 95% CI: 4.4 to 6.6% vs. 12.3%; χ2=70.1, df=1, p<0.001) and the proportion of
veterinary surgeons who are at-risk drinkers is higher than for the general population
(62.6%, 95% CI: 60.3 to 64.8% vs. 47.7%; χ2=128.7, df=1, p<0.001).

Chapter 5: Results 132
Table 5.18: AUDIT-C drinking categories for veterinary surgeons and normative data for the general
population in Great Britain
Non-drinkers % (95% CI)
Low-risk drinkers % (95% CI)
At-risk drinkers % (95% CI)
n score 0 score 1 to 4 for men
score 1 to 3 for women score ≥ 5 for men
score ≥ 4 for women Veterinary surgeons Total 1757 5.4 (0.4 to 6.6) 32.0 (29.9 to 34.3) 62.6 (60.3 to 64.8) Male 881 4.1 (3.0 to 5.6) 33.5 (30.4 to 36.7) 62.4 (59.2 to 65.6) Female 876 6.7 (5.3 to 8.6) 30.6 (27.6 to 33.7) 62.7 (59.4 to 65.8) General population† Total 8575 12.3 (11.6 to 13.0) 39.9 (38.9 to 40.9) 47.7 (46.6 to 48.8) Male 3849 9.3 (8.4 to 10.3) 37.0 (35.5 to 38.5) 53.6 (52.0 to 55.2) Female 4726 14.8 (13.8 to 15.9) 42.3 (40.9 to 43.7) 42.9 (41.5 to 44.3)
† Figures are derived from the Psychiatric Morbidity among Adults living in Private Households, 2000
survey (Singleton and others 2001), a cross-sectional study of a nationally representative sample of
adults in households in Great Britain. The dataset used to make these calculations was sourced from:
Office for National Statistics, Psychiatric Morbidity among Adults Living in Private Households, 2000
[computer file]. Colchester, Essex: UK Data Archive [distributor], May 2003. SN: 4653. The age range
of the sample was 16-74 with a mean age of 45.4 years (SD=15.6) and 55.1% were female.
Frequency of drinking, typical quantity consumed and frequency of binge drinking for
veterinary surgeons is compared with normative data for the general population of
Great Britain in Table 5.19. In comparison with the corresponding gender in the
general population, male and female veterinary surgeons drink more frequently,
consume fewer units of alcohol on a typical drinking day and have a similar frequency
of binge drinking.
The AUDIT-C scale demonstrated moderate internal consistency in the study sample
(Cronbach’s α=0.70).

Table 5.19: Frequency of drinking, typical quantity consumed and frequency of binge drinking for veterinary surgeons and the GB general population
Alcohol consumption/AUDIT-C
Male veterinary surgeons
%
Male general population†
% χ2
Female veterinary surgeons
%
Female general population†
% χ2 n=881 n=3852 n=876 n=4728 Frequency of drinking Never 4.2 9 χ2=22.2, df=1, p<0.001 6.7 14 χ2=34.8, df=1, p<0.001 > 2 times a week 70.7 57 χ2=55.9, df=1, p<0.001 59.5 38 χ2=140.4, df=1, p<0.001 ≥ 4 times a week 38.1 21 χ2=114.8, df=1, p<0.001 24.3 12 χ2=93.7, df=1, p<0.001 n=849 n=3492 n=819 n=4028 Quantity on typical drinking day ≥ 5 units 24.5 39 χ2=62.0, df=1, p<0.001 12.5 18 χ2=14.8, df=1, p<0.001 n=861 n=3852 n=852 n=4728 Frequency of binge drinking (≥ 6 units on one occasion)
Weekly 21.3 24 χ2=3.0, df=1, p=0.084 10.6 9 χ2=2.1, df=1, p=0.150 Daily or almost daily 3.4 3 χ2=0.3, df=1, p=0.584 0.9 1 χ2=0.02, df=1, p=0.881
† Source: Coulthard and others 2002 (findings from the Psychiatric Morbidity among Adults living in Private Households, 2000 survey)

Chapter 5: Results 134
5.3.1 Summary
• 5.4% (95% CI: 0.4 to 6.6%) of veterinary surgeons are non-drinkers, 32.0%
(95% CI: 29.9 to 34.3%) are low-risk drinkers and 62.6% (95% CI: 60.3 to
64.8%) are at-risk drinkers.
• Male veterinary surgeons are more likely to drink, to drink more often, and to
drink more heavily on each occasion than female veterinary surgeons
(p<0.001).
• 65.1% (95% CI: 62.9 to 67.3%) of veterinary surgeons drink at least twice a
week; 45.5% (95% CI: 43.1 to 47.9%) consume only one or two drinks when
drinking; 15.9% (95% CI: 14.2 to 17.7%) drink 6 or more units on one
occasion on a weekly basis and 2.2% (95% CI: 1.6 to 3.0%) on a daily basis.
• There is no significant difference between the estimated odds of at-risk
drinking for males and females after adjustment for age (OR: 0.89, 95% CI:
0.70 to 1.13, p=0.346).
• At-risk drinking is significantly associated with age after adjustment for
gender: a one year increase in age is associated with a 2% reduction in the risk
of at-risk drinking (OR: 0.98, 95% CI: 0.97 to 0.99, p=0.001).
• For veterinary surgeons graduating in the previous 5 years, the estimated odds
of at-risk drinking is highest among Bristol and Liverpool graduates and
significantly lower than Liverpool graduates for graduates of EU or EEA
countries (OR: 0.12, 95% CI: 0.04 to 0.37, p<0.001)
• The estimated odds of at-risk drinking does not differ significantly across
RCVS certificate or diploma holders, or hours worked or on-call in a typical
week.

Chapter 5: Results 135
5.4 Suicidal ideation
The proportion of veterinary surgeons giving a positive response to each of the three
questions regarding negative thoughts about their life in the previous 12 months is
presented in Table 5.20. The 12-month prevalence of any suicidal ideation is 29.4%
(95% CI: 27.3 to 31.5%) (life was not worth living: 23.0%, 95% CI: 21.1 to 25.0%;
death wishes: 15.0%, 95% CI: 13.4 to 16.8%; suicidal thoughts: 21.3%, 95% CI: 19.5
to 23.3%). Women are more likely than men to think that life is not worth living
(20.6% vs. 25.4%, difference=4.8%, 95% CI of difference: 0.9 to 8.7%, χ2= 5.7, df=1,
p=0.017) but there is otherwise no statistically significant difference between genders
or the age groups examined.
The associations between the 12-month prevalence of suicidal thoughts (a positive
response to the question: ‘Have you thought of taking your life, even if you would not
really do it?’) was examined. The results are presented in Table 5.21. Veterinary
surgeons in mixed practice (OR: 0.48, 95% CI: 0.31 to 0.72, p<0.001) and university
– clinical (OR: 0.32, 95% CI: 0.13 to 0.74, p=0.008) roles have significantly lower
odds of reporting suicidal thoughts in comparison with veterinary surgeons in small
animal practice (the reference group). There are few significant differences for any
other demographic or occupational variables. After adjustment for age and gender,
veterinary surgeons in mixed practice (OR: 0.50, 95% CI: 0.31 to 0.80, p=0.004) have
significantly lower odds of reporting suicidal thoughts in comparison with veterinary
surgeons in small animal practice; and full-time assistants (OR: 2.35, 95% CI: 1.27 to
4.35, p=0.007) have significantly higher odds of reporting suicidal thoughts in
comparison with sole principals. There is no significant difference between males and
females in the estimated odds of reporting having experienced suicidal thoughts in the
previous 12 months after adjustment for age (OR: 0.98, 95% CI: 0.73 to 1.31,
p=0.891).
Hours worked and hours on-call in a typical week were subsequently entered into the
logistic regression model as continuous variables to assess the dose-response
relationship between hours worked or on-call and reporting having experienced
suicidal thoughts in the previous 12 months. A 1-hour increase in hours worked in a

Chapter 5: Results 136
typical week increases the odds of suicidal thoughts by 1.8% (OR: 1.02, 95% CI: 1.00
to 1.03, p=0.013). By contrast, odds are unaffected by an increase in the number of
hours on-call in a typical week (OR: 1.00, 95% CI: 1.00 to 1.01, p=0.455).
Results for the current study are compared to published normative data for the general
population in Great Britain and Norwegian physicians in Table 5.22. The estimated
12-month prevalence of suicidal thoughts (21.3%, 95% CI: 19.5 to 23.3%) among
veterinary surgeons is significantly higher than among the general population (95%
CI of difference: 15.5 to 19.4%, χ2=691.6, df=1, p<0.001) and Norwegian physicians
(95% CI of difference: 7.4 to 12.9%, χ2=45.9, df=1, p<0.001).
The three items regarding suicidal ideation demonstrated high internal consistency in
the study sample (Cronbach’s α=0.85).
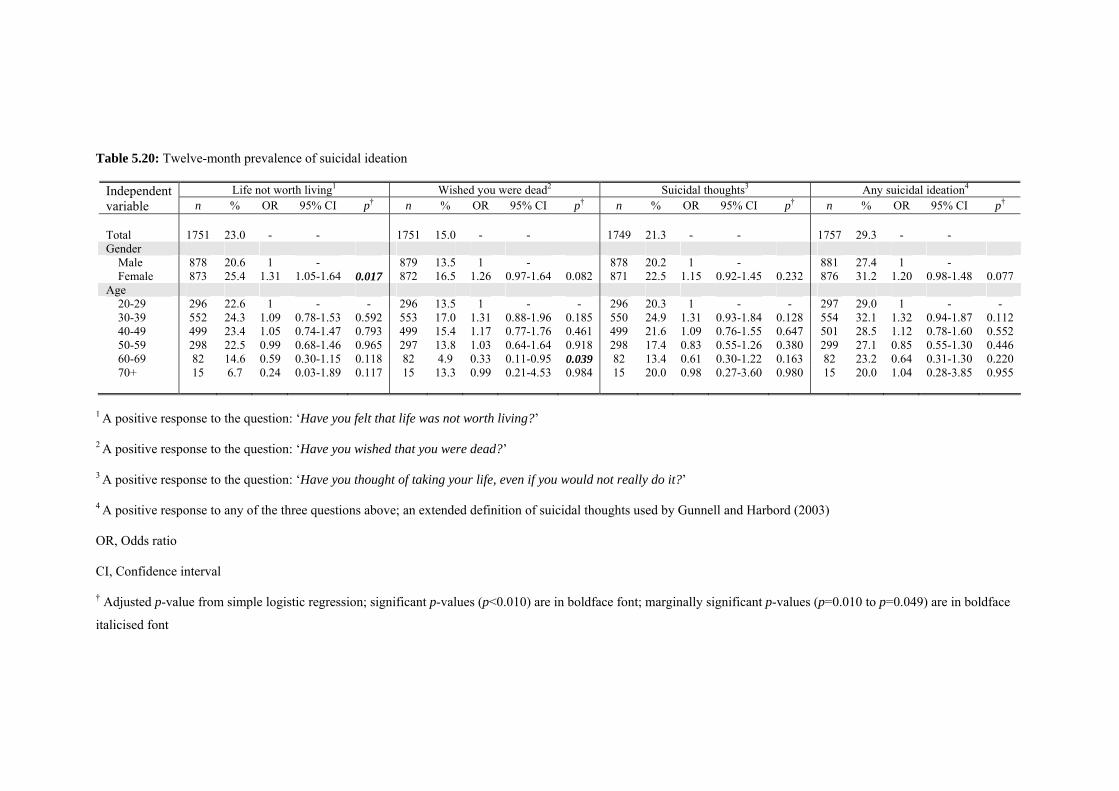
Table 5.20: Twelve-month prevalence of suicidal ideation
Life not worth living1 Wished you were dead2 Suicidal thoughts3 Any suicidal ideation4 Independent variable n % OR 95% CI p† n % OR 95% CI p† n % OR 95% CI p† n % OR 95% CI p† Total 1751 23.0 - - 1751 15.0 - - 1749 21.3 - - 1757 29.3 - - Gender Male 878 20.6 1 - 879 13.5 1 - 878 20.2 1 - 881 27.4 1 - Female 873 25.4 1.31 1.05-1.64 0.017 872 16.5 1.26 0.97-1.64 0.082 871 22.5 1.15 0.92-1.45 0.232 876 31.2 1.20 0.98-1.48 0.077 Age 20-29 296 22.6 1 - - 296 13.5 1 - - 296 20.3 1 - - 297 29.0 1 - - 30-39 552 24.3 1.09 0.78-1.53 0.592 553 17.0 1.31 0.88-1.96 0.185 550 24.9 1.31 0.93-1.84 0.128 554 32.1 1.32 0.94-1.87 0.112 40-49 499 23.4 1.05 0.74-1.47 0.793 499 15.4 1.17 0.77-1.76 0.461 499 21.6 1.09 0.76-1.55 0.647 501 28.5 1.12 0.78-1.60 0.552 50-59 298 22.5 0.99 0.68-1.46 0.965 297 13.8 1.03 0.64-1.64 0.918 298 17.4 0.83 0.55-1.26 0.380 299 27.1 0.85 0.55-1.30 0.446 60-69 82 14.6 0.59 0.30-1.15 0.118 82 4.9 0.33 0.11-0.95 0.039 82 13.4 0.61 0.30-1.22 0.163 82 23.2 0.64 0.31-1.30 0.220 70+ 15 6.7 0.24 0.03-1.89 0.117 15 13.3 0.99 0.21-4.53 0.984 15 20.0 0.98 0.27-3.60 0.980 15 20.0 1.04 0.28-3.85 0.955
1 A positive response to the question: ‘Have you felt that life was not worth living?’ 2 A positive response to the question: ‘Have you wished that you were dead?’ 3 A positive response to the question: ‘Have you thought of taking your life, even if you would not really do it?’ 4 A positive response to any of the three questions above; an extended definition of suicidal thoughts used by Gunnell and Harbord (2003) OR, Odds ratio CI, Confidence interval † Adjusted p-value from simple logistic regression; significant p-values (p<0.010) are in boldface font; marginally significant p-values (p=0.010 to p=0.049) are in boldface
italicised font

Table 5.21: Associations between demographic and occupational factors and 12-month prevalence of suicidal thoughts
Suicidal thoughts1 Crude Adjusted
Independent variable n % OR 95% CI p-value† OR 95% CI p-value† Veterinary school§ Liverpool 44 25.0 1 - - 1 - - London 55 12.7 0.39 0.14 to 1.08 0.069 0.70 0.41 to 1.19 0.186 EU or EEA countries 26 19.2 0.57 0.18 to 1.84 0.350 1.23 0.78 to 1.96 0.372 Non-EU/EEA countries 19 15.8 0.49 0.12 to 1.96 0.309 0.81 0.50 to 1.34 0.414 Glasgow 25 24.0 0.96 0.33 to 2.85 0.945 0.94 0.58 to 1.52 0.801 Edinburgh 38 26.3 0.92 0.35 to 2.43 0.861 0.84 0.54 to 1.32 0.459 Cambridge 27 18.5 0.75 0.25 to 2.30 0.614 0.99 0.58 to 1.68 0.966 Bristol 34 11.8 0.36 0.10 to 1.22 0.100 1.35 0.80 to 2.31 0.263 268 19.0 - - - - - - Main type of work Small animal practice 992 24.4 1 - - 1 - - Farm animal practice 78 21.8 0.86 0.50 to 1.51 0.606 0.96 0.52 to 1.79 0.904 Equine practice 144 21.5 0.85 0.56 to 1.30 0.452 0.86 0.52 to 1.40 0.535 Mixed practice 218 13.3 0.48 0.31 to 0.72 <0.001 0.50 0.31 to 0.80 0.004 Other speciality practice 35 17.1 0.64 0.26 to 1.56 0.328 0.48 0.17 to 1.33 0.156 Charity 32 37.5 1.86 0.90 to 3.86 0.096 3.75 0.83 to 16.89 0.085 Government 109 16.5 0.61 0.36 to 1.04 0.068 1.11 0.38 to 3.22 0.853 University – non-clinical 34 8.8 0.30 0.09 to 0.99 0.048 0.59 0.15 to 2.32 0.449 University – clinical 65 9.2 0.32 0.13 to 0.74 0.008 0.35 0.10 to 1.19 0.093 Industry 34 26.5 1.12 0.51 to 2.42 0.782 1.61 0.45 to 5.80 0.466 Outside the profession 8 0 - - - - - - Employment status Full-time 1431 21.6 1 - - 1 - - Part-time 282 21.6 1.00 0.74 to 1.37 0.989 1.08 0.52 to 2.25 0.843 Unemployed 1 100 - - - - - - Career break 9 11.1 0.45 0.57 to 3.64 0.457 0.75 0.07 to 7.64 0.809 Partially retired 26 7.7 0.30 0.71 to 1.29 0.106 0.53 0.10 to 2.73 0.444 Fully retired 4 0 - - - - - - Continued overleaf
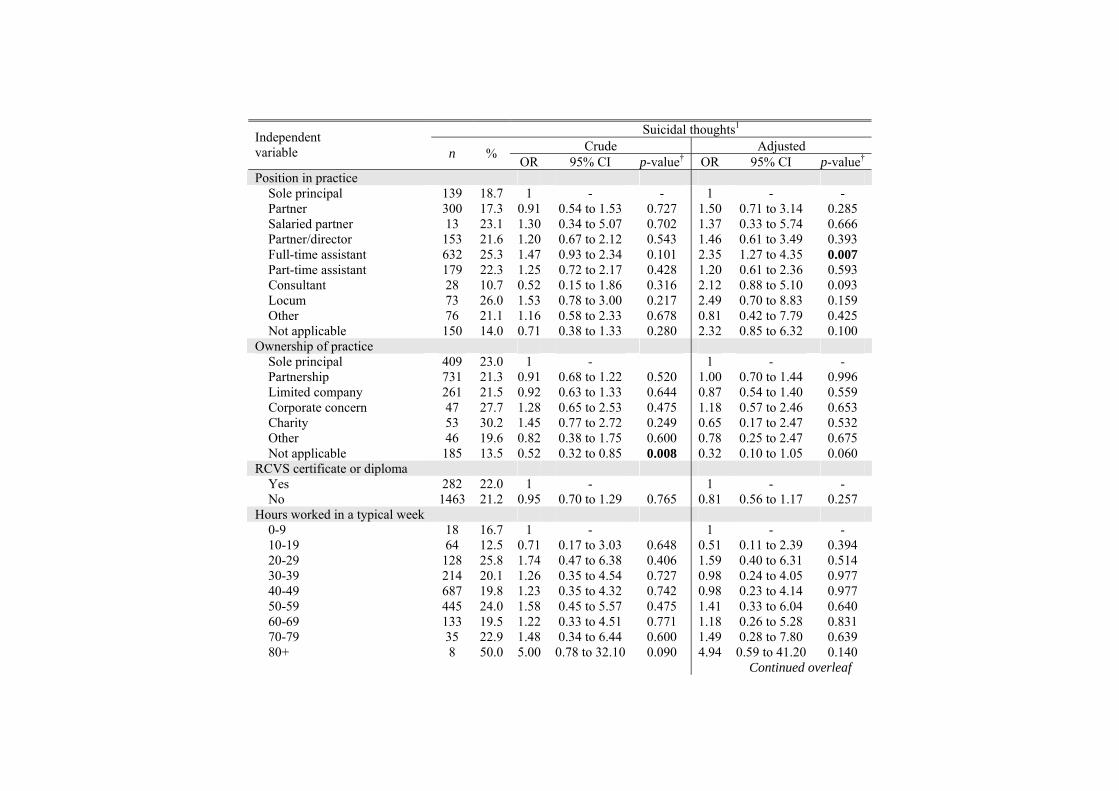
Suicidal thoughts1 Crude Adjusted
Independent variable n % OR 95% CI p-value† OR 95% CI p-value† Position in practice Sole principal 139 18.7 1 - - 1 - - Partner 300 17.3 0.91 0.54 to 1.53 0.727 1.50 0.71 to 3.14 0.285 Salaried partner 13 23.1 1.30 0.34 to 5.07 0.702 1.37 0.33 to 5.74 0.666 Partner/director 153 21.6 1.20 0.67 to 2.12 0.543 1.46 0.61 to 3.49 0.393 Full-time assistant 632 25.3 1.47 0.93 to 2.34 0.101 2.35 1.27 to 4.35 0.007 Part-time assistant 179 22.3 1.25 0.72 to 2.17 0.428 1.20 0.61 to 2.36 0.593 Consultant 28 10.7 0.52 0.15 to 1.86 0.316 2.12 0.88 to 5.10 0.093 Locum 73 26.0 1.53 0.78 to 3.00 0.217 2.49 0.70 to 8.83 0.159 Other 76 21.1 1.16 0.58 to 2.33 0.678 0.81 0.42 to 7.79 0.425 Not applicable 150 14.0 0.71 0.38 to 1.33 0.280 2.32 0.85 to 6.32 0.100 Ownership of practice Sole principal 409 23.0 1 - 1 - - Partnership 731 21.3 0.91 0.68 to 1.22 0.520 1.00 0.70 to 1.44 0.996 Limited company 261 21.5 0.92 0.63 to 1.33 0.644 0.87 0.54 to 1.40 0.559 Corporate concern 47 27.7 1.28 0.65 to 2.53 0.475 1.18 0.57 to 2.46 0.653 Charity 53 30.2 1.45 0.77 to 2.72 0.249 0.65 0.17 to 2.47 0.532 Other 46 19.6 0.82 0.38 to 1.75 0.600 0.78 0.25 to 2.47 0.675 Not applicable 185 13.5 0.52 0.32 to 0.85 0.008 0.32 0.10 to 1.05 0.060 RCVS certificate or diploma Yes 282 22.0 1 - 1 - - No 1463 21.2 0.95 0.70 to 1.29 0.765 0.81 0.56 to 1.17 0.257 Hours worked in a typical week 0-9 18 16.7 1 - 1 - - 10-19 64 12.5 0.71 0.17 to 3.03 0.648 0.51 0.11 to 2.39 0.394 20-29 128 25.8 1.74 0.47 to 6.38 0.406 1.59 0.40 to 6.31 0.514 30-39 214 20.1 1.26 0.35 to 4.54 0.727 0.98 0.24 to 4.05 0.977 40-49 687 19.8 1.23 0.35 to 4.32 0.742 0.98 0.23 to 4.14 0.977 50-59 445 24.0 1.58 0.45 to 5.57 0.475 1.41 0.33 to 6.04 0.640 60-69 133 19.5 1.22 0.33 to 4.51 0.771 1.18 0.26 to 5.28 0.831 70-79 35 22.9 1.48 0.34 to 6.44 0.600 1.49 0.28 to 7.80 0.639 80+ 8 50.0 5.00 0.78 to 32.10 0.090 4.94 0.59 to 41.20 0.140 Continued overleaf

Suicidal thoughts1 Crude Adjusted
Independent variable n % OR 95% CI p-value† OR 95% CI p-value† Hours on call in a typical week 0-9 789 21.8 1 - 1 - - 10-19 304 23.4 1.09 0.80 to 1.50 0.580 1.00 0.70 to 1.42 0.979 20-29 302 21.5 0.98 0.71 to 1.36 0.921 1.08 0.75 to 1.56 0.693 30-39 173 12.7 0.52 0.32 to 0.84 0.008 0.58 0.34 to 0.99 0.044 40-49 70 24.3 1.15 0.65 to 2.04 0.631 1.50 0.79 to 2.84 0.214 50-59 31 19.4 0.86 0.35 to 2.13 0.746 0.89 0.34 to 2.34 0.813 60-69 16 25.0 1.20 0.38 to 3.75 0.759 1.56 0.45 to 5.39 0.485 70-79 8 25.0 1.20 0.24 to 5.98 0.828 1.30 0.22 to 7.72 0.772 80+ 61 24.6 1.17 0.64 to 2.15 0.613 1.40 0.70 to 2.80 0.346
§ Only for veterinary surgeons graduating in the previous 5 years (2003 to 2007 inclusive)
OR, Odds ratio
CI, Confidence interval
1 A positive response to the question ‘Have you thought of taking your life, even if you would not really do it?’
Adjusted figures are from separate multivariable analyses adjusting for age and gender only
† Adjusted p-value from logistic regression; significant p-values (p<0.010) are in boldface font; marginally significant p-values (p=0.010 to p=0.049) are in boldface italicised
font
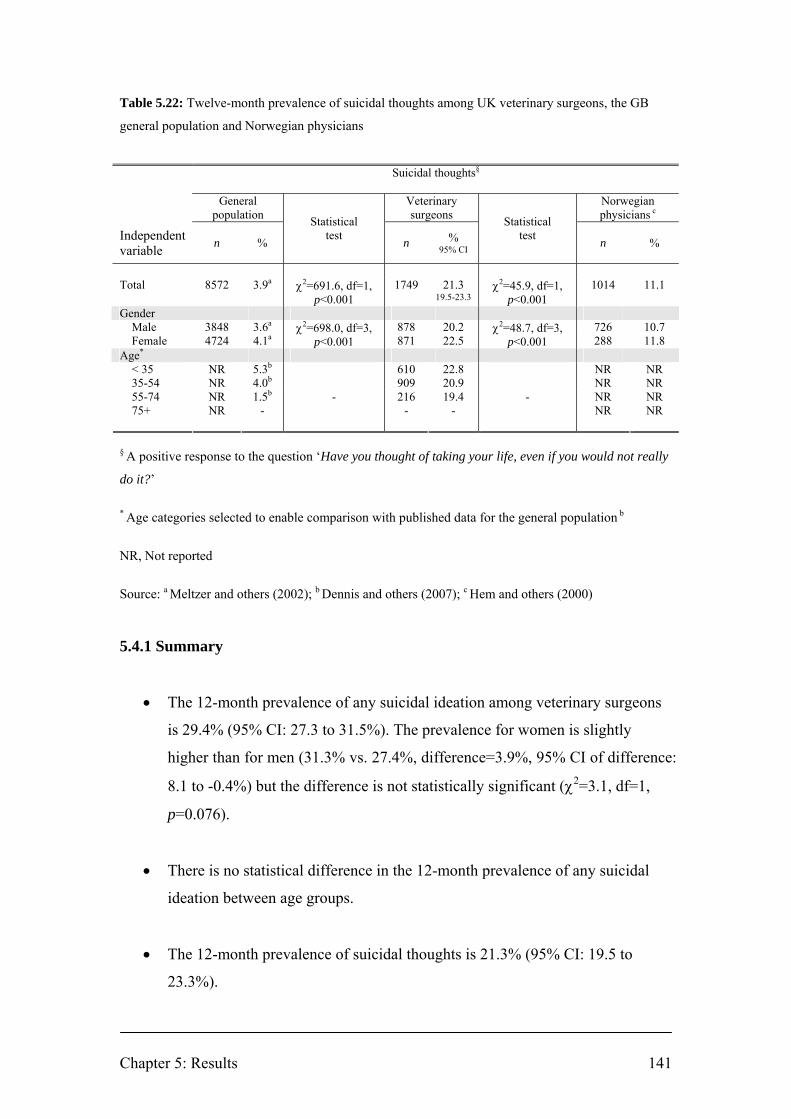
Chapter 5: Results 141
Table 5.22: Twelve-month prevalence of suicidal thoughts among UK veterinary surgeons, the GB
general population and Norwegian physicians
Suicidal thoughts§
General
population Veterinary surgeons
Norwegian physicians c
Independent variable
n
%
Statistical test
n % 95% CI
Statistical test
n %
Total 8572 3.9a χ2=691.6, df=1,
p<0.001 1749 21.3
19.5-23.3 χ2=45.9, df=1,
p<0.001 1014 11.1
Gender Male 3848 3.6a 878 20.2 726 10.7 Female 4724 4.1a
χ2=698.0, df=3, p<0.001 871 22.5
χ2=48.7, df=3, p<0.001 288 11.8
Age* < 35 NR 5.3b 610 22.8 NR NR 35-54 NR 4.0b 909 20.9 NR NR 55-74 75+
NR NR
1.5b
- - 216
- 19.4
- - NR
NR NR NR
§ A positive response to the question ‘Have you thought of taking your life, even if you would not really
do it?’
* Age categories selected to enable comparison with published data for the general population b
NR, Not reported
Source: a Meltzer and others (2002); b Dennis and others (2007); c Hem and others (2000)
5.4.1 Summary
• The 12-month prevalence of any suicidal ideation among veterinary surgeons
is 29.4% (95% CI: 27.3 to 31.5%). The prevalence for women is slightly
higher than for men (31.3% vs. 27.4%, difference=3.9%, 95% CI of difference:
8.1 to -0.4%) but the difference is not statistically significant (χ2=3.1, df=1,
p=0.076).
• There is no statistical difference in the 12-month prevalence of any suicidal
ideation between age groups.
• The 12-month prevalence of suicidal thoughts is 21.3% (95% CI: 19.5 to
23.3%).
Chapter 5: Results 142
• After adjustment for age and gender, veterinary surgeons in mixed practice
(OR: 0.50, 95% CI: 0.31 to 0.80, p=0.004) have significantly lower odds of
reporting suicidal thoughts in comparison with veterinary surgeons in small
animal practice; and full-time assistants (OR: 2.35, 95% CI: 1.27 to 4.35,
p=0.007) have significantly higher odds of reporting suicidal thoughts in
comparison with sole principals.
• A 1-hour increase in hours worked in a typical week increases the odds of
suicidal thoughts by 1.8% (OR: 1.02, 95% CI: 1.00 to 1.03, p=0.013).
• The estimated prevalence of suicidal thoughts among veterinary surgeons is
around 5 times higher than among the general population.
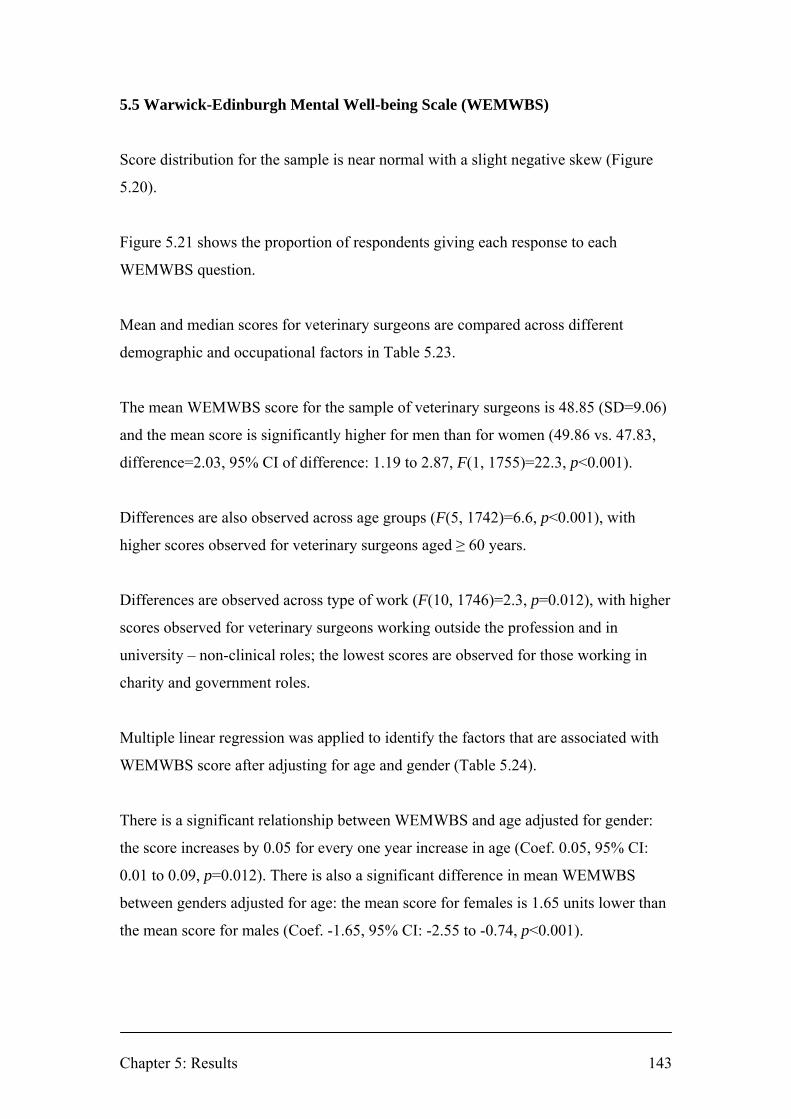
Chapter 5: Results 143
5.5 Warwick-Edinburgh Mental Well-being Scale (WEMWBS)
Score distribution for the sample is near normal with a slight negative skew (Figure
5.20).
Figure 5.21 shows the proportion of respondents giving each response to each
WEMWBS question.
Mean and median scores for veterinary surgeons are compared across different
demographic and occupational factors in Table 5.23.
The mean WEMWBS score for the sample of veterinary surgeons is 48.85 (SD=9.06)
and the mean score is significantly higher for men than for women (49.86 vs. 47.83,
difference=2.03, 95% CI of difference: 1.19 to 2.87, F(1, 1755)=22.3, p<0.001).
Differences are also observed across age groups (F(5, 1742)=6.6, p<0.001), with
higher scores observed for veterinary surgeons aged ≥ 60 years.
Differences are observed across type of work (F(10, 1746)=2.3, p=0.012), with higher
scores observed for veterinary surgeons working outside the profession and in
university – non-clinical roles; the lowest scores are observed for those working in
charity and government roles.
Multiple linear regression was applied to identify the factors that are associated with
WEMWBS score after adjusting for age and gender (Table 5.24).
There is a significant relationship between WEMWBS and age adjusted for gender:
the score increases by 0.05 for every one year increase in age (Coef. 0.05, 95% CI:
0.01 to 0.09, p=0.012). There is also a significant difference in mean WEMWBS
between genders adjusted for age: the mean score for females is 1.65 units lower than
the mean score for males (Coef. -1.65, 95% CI: -2.55 to -0.74, p<0.001).

Chapter 5: Results 144
There is no significant difference in mean score between recent graduates of different
veterinary schools in comparison with Liverpool graduates after adjusting for age and
gender.
The mean scores for veterinary surgeons working in university – non-clinical and
university – clinical roles are higher in comparison with those working in small
animal practice after adjusting for age and gender (university – non-clinical: Coef.
3.50, 95% CI: 0.37 to 6.62, p=0.029; university – clinical: Coef. 2.76, 95% CI: 0.48 to
5.03, p=0.018).
There are no significant differences in mean score between different employment
statuses, positions in practice, ownership of practice, holders and non-holders of an
RCVS certificate or diploma, hours worked in a typical week or hours on-call in a
typical week after adjusting for age and gender.
Figure 5.20: WEMWBS score distribution for sample population of veterinary surgeons

Figure 5.21: Proportion of respondents giving each WEMWBS question response
Excludes imputed values
0% 20% 40% 60% 80% 100%
I've been feeling cheerful (n=1796)
I've been interested in new things (n=1793)
I've been feeling loved (n=1790)
I've been able to make up my own mind about things (n=1789)
I've been feeling confident (n=1791)
I've been feeling close to other people (n=1788)
I've been feeling good about myself (n=1791)
I've been thinking clearly (n=1790)
I've been dealing with problems well (n=1793)
I've had energy to spare (n=1787)
I've been feeling interested in other people (n=1788)
I've been feeling relaxed (n=1788)
I've been feeling useful (n=1789)
I've been feeling optimistic about the future (n=1795)
None of the time Rarely Some of the time Often All of the time

Chapter 5: Results 146
Table 5.23: WEMWBS scores across demographic and occupational factors
WEMWBS score Independent variable n median mean 95% CI SD Statistical test† Total 1757 49 48.85 48.43 to 49.28 9.06 Gender Male 881 50 49.86 49.27 to 50.46 8.99 F(1, 1755)=22.3, p<0.001 Female 876 48 47.83 47.24 to 48.43 9.02 Age 20-29 297 49 48.31 47.33 to 49.30 8.63 F(1, 1742)=6.6, p<0.001 30-39 554 48 48.27 47.52 to 49.02 8.99 40-49 501 49 48.56 47.76 to 49.36 9.14 50-59 299 49 49.42 48.36 to 50.49 9.36 60-69 82 54 53.24 51.46 to 55.20 8.50 70+ 15 54 55.56 52.48 to 58.65 5.57 Veterinary school§ Liverpool 45 48 47.98 45.14 to 50.82 9.45 F(7, 261)=0.9, p=0.506 London 55 49 48.49 46.39 to 50.59 7.76 EU or EEA countries 26 52 51.51 48.59 to 54.43 7.24 Non-EU/EEA countries 19 49 50.50 45.69 to 55.30 9.97 Glasgow 25 50 46.68 45.22 to 52.14 8.39 Edinburgh 38 49.5 47.23 43.54 to 50.92 11.22 Cambridge 27 53 50.49 47.44 to 53.55 7.72 Bristol 34 45 47.65 44.65 to 50.65 8.60 Total 269 50 48.77 47.71 to 49.84 8.88 Main type of work Small animal practice 997 48 48.27 47.70 to 48.84 9.21 F(10, 1476)=2.3, p=0.012 Farm animal practice 79 50 49.86 48.08 to 51.65 7.97 Equine practice 144 51 49.58 48.25 to 50.91 8.08 Mixed practice 219 50 49.48 48.30 to 50.65 8.82 Other speciality practice 35 49 50.54 47.17 to 53.90 9.79 Charity 32 46.5 46.74 43.10 to 50.37 10.09 Government 110 47.5 47.96 46.09 to 49.83 9.88 University – non-clinical 34 52.5 52.55 50.08 to 55.01 7.06 University – clinical 65 51 51.40 49.28 to 53.52 8.55 Industry 34 49 48.82 45.82 to 51.82 8.60 Outside the profession 8 53 51.50 43.79 to 59.21 9.23 Employment status Full-time 1439 49 48.80 48.33 to 49.27 9.08 F(5, 1755)=1.2, p=0.334 Part-time 282 49 48.72 47.65 to 49.78 9.09 Unemployed 1 65 65.00 - Career break 9 47 49.67 43.61 to 55.72 7.87 Partially retired 26 53 51.18 47.93 to 54.42 8.04 Fully retired 4 54 52.50 43.00 to 62.00 5.97 Position in practice Sole principal 140 50 50.05 48.47 to 51.63 9.46 F(9, 1741)=2.3, p=0.015 Partner 302 50 50.23 49.25 to 51.22 8.71 Salaried partner 13 53 49.31 43.61 to 55.01 9.44 Partner/director 153 49 48.36 46.91 to 49.82 9.11 Full-time assistant 636 48 47.90 47.19 to 48.60 9.07 Part-time assistant 179 49 48.66 47.39 to 49.93 8.64 Consultant 28 53 49.72 45.85 to 53.59 9.98 Locum 73 48.5 48.64 46.27 to 51.01 10.15 Other 76 47 47.74 45.75 to 49.72 8.68 Not applicable 151 40 49.88 48.44 to 51.31 8.92 Ownership of practice Sole principal 412 49 48.53 47.64 to 49.40 9.04 F(6, 1733)=1.0, p=0.435 Partnership 735 50 49.16 48.50 to 49.82 9.08 Limited company 261 49 48.36 47.24 to 49.47 9.14 Corporate concern 47 45 47.15 44.24 to 50.06 9.92 Charity 53 47 47.67 45.17 to 50.18 9.09 Other 46 47 48.74 45.70 to 51.78 10.25 Not applicable 186 50 49.58 48.35 to 50.81 8.51 Continued overleaf

Chapter 5: Results 147
WEMWBS score Independent variable n median mean 95% CI SD Statistical test† RCVS certificate or diploma Yes 284 50 49.06 48.00 to 50.11 9.00 F(1, 1751)=0.2, p=0.650 No 1469 49 48.79 48.32 to 49.25 9.08 Hours worked in a typical week 0-9 18 50 47.52 42.60 to 52.45 9.91 F(8, 1730)=1.5, p=0.141 10-19 64 53 50.24 48.02 to 52.47 8.91 20-29 128 49 48.90 47.34 to 50.45 8.88 30-39 214 49.5 49.59 48.42 to 50.76 8.71 40-49 689 50 49.29 48.62 to 49.96 8.93 50-59 448 48 48.04 47.17 to 48.91 9.39 60-69 135 49 48.68 47.12 to 50.23 9.13 70-79 35 50 48.51 45.97 to 51.05 7.41 80+ 8 45.5 42.84 35.66 to 50.01 8.58 Hours on call in a typical week 0-9 792 49 48.82 48.16 to 49.48 9.41 F(8, 1753)=0.7, p=0.728 10-19 306 49 48.75 47.71 to 49.79 9.24 20-29 304 49 48.87 47.90 to 49.84 8.60 30-39 173 49 49.77 48.55 to 50.99 8.12 40-49 70 47.5 48.07 46.34 to 49.81 7.28 50-59 31 49 48.41 45.23 to 51.58 8.66 60-69 16 50.5 48.44 43.71 to 53.17 8.87 70-79 8 43.5 43.50 37.41 to 49.60 7.29 80+ 62 49 48.69 46.03 to 51.35 10.47
§ Only for veterinary surgeons graduating in the previous 5 years (2003 to 2007 inclusive) † One-way ANOVA, significant p-values (p<0.010) are in boldface font; marginally significant p-
values (p=0.010 to p=0.049) are in boldface italicised font
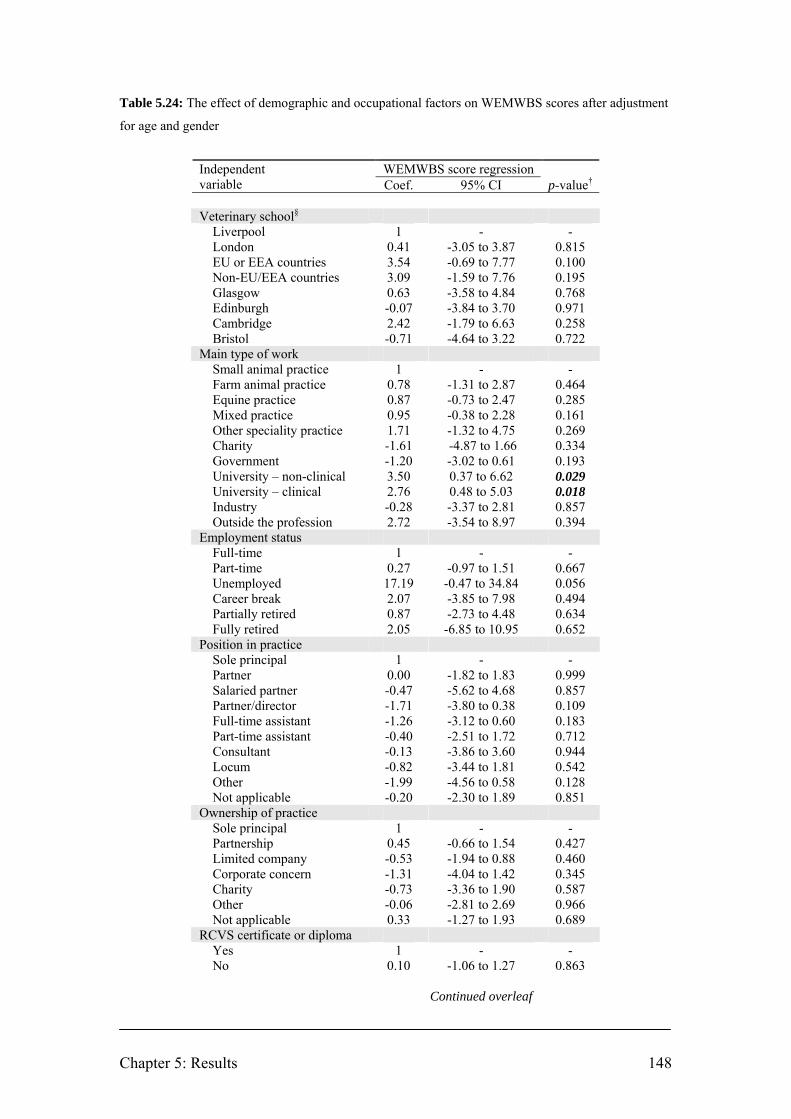
Chapter 5: Results 148
Table 5.24: The effect of demographic and occupational factors on WEMWBS scores after adjustment
for age and gender
WEMWBS score regression Independent
variable Coef. 95% CI p-value† Veterinary school§ Liverpool 1 - - London 0.41 -3.05 to 3.87 0.815 EU or EEA countries 3.54 -0.69 to 7.77 0.100 Non-EU/EEA countries 3.09 -1.59 to 7.76 0.195 Glasgow 0.63 -3.58 to 4.84 0.768 Edinburgh -0.07 -3.84 to 3.70 0.971 Cambridge 2.42 -1.79 to 6.63 0.258 Bristol -0.71 -4.64 to 3.22 0.722 Main type of work Small animal practice 1 - - Farm animal practice 0.78 -1.31 to 2.87 0.464 Equine practice 0.87 -0.73 to 2.47 0.285 Mixed practice 0.95 -0.38 to 2.28 0.161 Other speciality practice 1.71 -1.32 to 4.75 0.269 Charity -1.61 -4.87 to 1.66 0.334 Government -1.20 -3.02 to 0.61 0.193 University – non-clinical 3.50 0.37 to 6.62 0.029 University – clinical 2.76 0.48 to 5.03 0.018 Industry -0.28 -3.37 to 2.81 0.857 Outside the profession 2.72 -3.54 to 8.97 0.394 Employment status Full-time 1 - - Part-time 0.27 -0.97 to 1.51 0.667 Unemployed 17.19 -0.47 to 34.84 0.056 Career break 2.07 -3.85 to 7.98 0.494 Partially retired 0.87 -2.73 to 4.48 0.634 Fully retired 2.05 -6.85 to 10.95 0.652 Position in practice Sole principal 1 - - Partner 0.00 -1.82 to 1.83 0.999 Salaried partner -0.47 -5.62 to 4.68 0.857 Partner/director -1.71 -3.80 to 0.38 0.109 Full-time assistant -1.26 -3.12 to 0.60 0.183 Part-time assistant -0.40 -2.51 to 1.72 0.712 Consultant -0.13 -3.86 to 3.60 0.944 Locum -0.82 -3.44 to 1.81 0.542 Other -1.99 -4.56 to 0.58 0.128 Not applicable -0.20 -2.30 to 1.89 0.851 Ownership of practice Sole principal 1 - - Partnership 0.45 -0.66 to 1.54 0.427 Limited company -0.53 -1.94 to 0.88 0.460 Corporate concern -1.31 -4.04 to 1.42 0.345 Charity -0.73 -3.36 to 1.90 0.587 Other -0.06 -2.81 to 2.69 0.966 Not applicable 0.33 -1.27 to 1.93 0.689 RCVS certificate or diploma Yes 1 - - No 0.10 -1.06 to 1.27 0.863 Continued overleaf
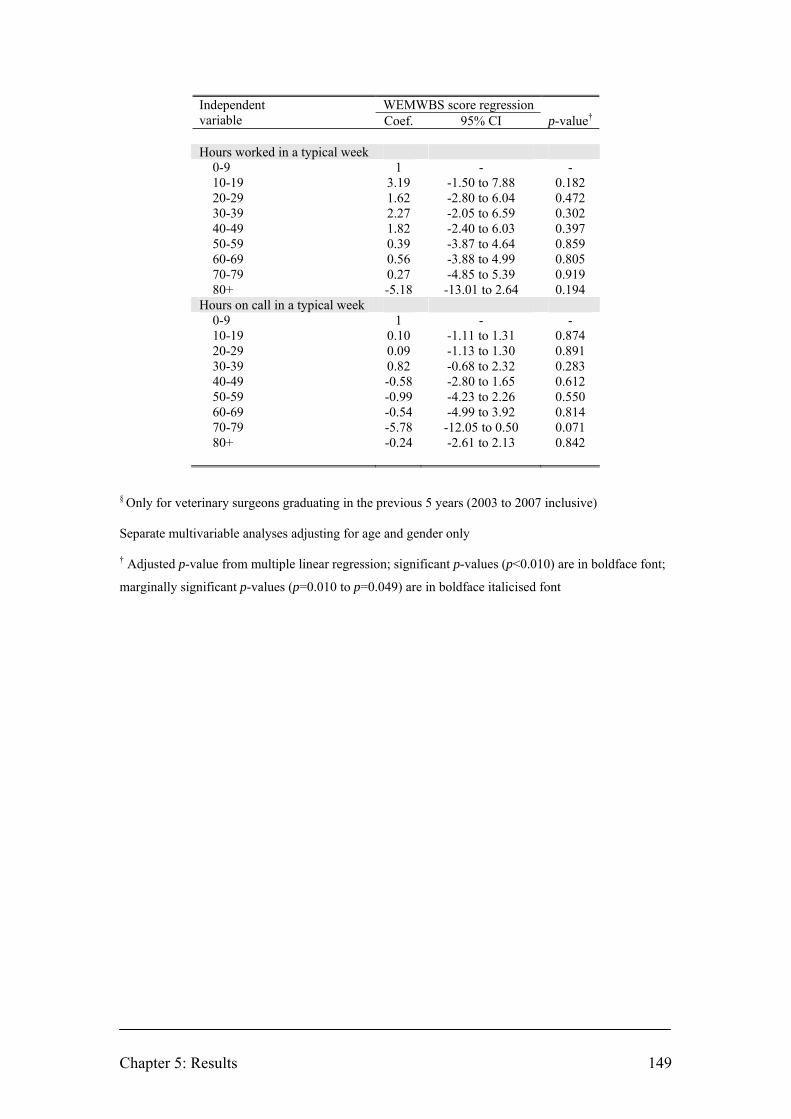
Chapter 5: Results 149
WEMWBS score regression Independent variable Coef. 95% CI p-value† Hours worked in a typical week 0-9 1 - - 10-19 3.19 -1.50 to 7.88 0.182 20-29 1.62 -2.80 to 6.04 0.472 30-39 2.27 -2.05 to 6.59 0.302 40-49 1.82 -2.40 to 6.03 0.397 50-59 0.39 -3.87 to 4.64 0.859 60-69 0.56 -3.88 to 4.99 0.805 70-79 0.27 -4.85 to 5.39 0.919 80+ -5.18 -13.01 to 2.64 0.194 Hours on call in a typical week 0-9 1 - - 10-19 0.10 -1.11 to 1.31 0.874 20-29 0.09 -1.13 to 1.30 0.891 30-39 0.82 -0.68 to 2.32 0.283 40-49 -0.58 -2.80 to 1.65 0.612 50-59 -0.99 -4.23 to 2.26 0.550 60-69 -0.54 -4.99 to 3.92 0.814 70-79 -5.78 -12.05 to 0.50 0.071 80+ -0.24 -2.61 to 2.13 0.842
§ Only for veterinary surgeons graduating in the previous 5 years (2003 to 2007 inclusive) Separate multivariable analyses adjusting for age and gender only † Adjusted p-value from multiple linear regression; significant p-values (p<0.010) are in boldface font;
marginally significant p-values (p=0.010 to p=0.049) are in boldface italicised font
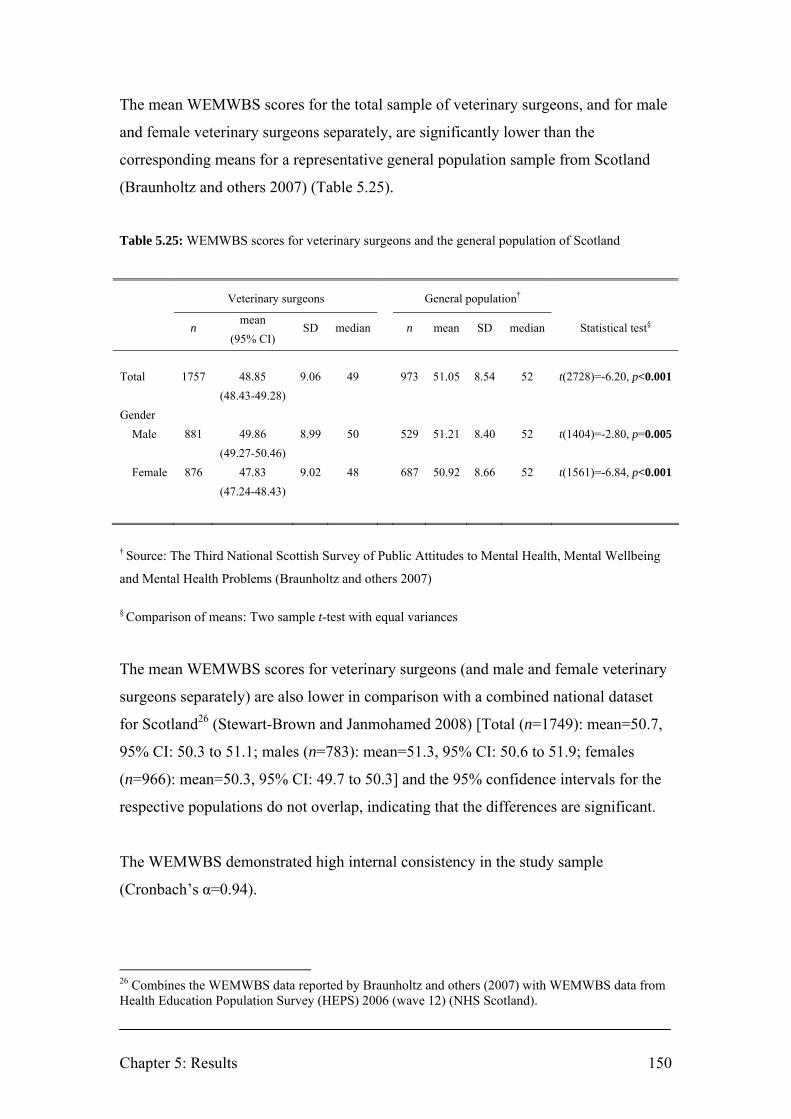
Chapter 5: Results 150
The mean WEMWBS scores for the total sample of veterinary surgeons, and for male
and female veterinary surgeons separately, are significantly lower than the
corresponding means for a representative general population sample from Scotland
(Braunholtz and others 2007) (Table 5.25).
Table 5.25: WEMWBS scores for veterinary surgeons and the general population of Scotland
Veterinary surgeons General population†
mean
n (95% CI)
SD median n mean SD median Statistical test§
Total 1757 48.85 9.06 49 973 51.05 8.54 52 t(2728)=-6.20, p<0.001 (48.43-49.28) Gender Male 881 49.86 8.99 50 529 51.21 8.40 52 t(1404)=-2.80, p=0.005 (49.27-50.46) Female 876 47.83 9.02 48 687 50.92 8.66 52 t(1561)=-6.84, p<0.001 (47.24-48.43)
† Source: The Third National Scottish Survey of Public Attitudes to Mental Health, Mental Wellbeing
and Mental Health Problems (Braunholtz and others 2007)
§ Comparison of means: Two sample t-test with equal variances
The mean WEMWBS scores for veterinary surgeons (and male and female veterinary
surgeons separately) are also lower in comparison with a combined national dataset
for Scotland26 (Stewart-Brown and Janmohamed 2008) [Total (n=1749): mean=50.7,
95% CI: 50.3 to 51.1; males (n=783): mean=51.3, 95% CI: 50.6 to 51.9; females
(n=966): mean=50.3, 95% CI: 49.7 to 50.3] and the 95% confidence intervals for the
respective populations do not overlap, indicating that the differences are significant.
The WEMWBS demonstrated high internal consistency in the study sample
(Cronbach’s α=0.94).
26 Combines the WEMWBS data reported by Braunholtz and others (2007) with WEMWBS data from Health Education Population Survey (HEPS) 2006 (wave 12) (NHS Scotland).

Chapter 5: Results 151
5.5.1 Summary
• There is a significant relationship between WEMWBS and age after
adjustment for gender: the score increases by 0.05 for every one year increase
in age (Coef. 0.05, 95% CI: 0.01 to 0.09, p=0.012).
• There is a significant difference in mean WEMWBS between males and
females after adjustment for age: the mean score for females is 1.65 units
lower than the mean score for males (Coef: -1.65, 95% CI: -2.55 to -0.74,
p<0.001).
• The mean scores for veterinary surgeons in university – non-clinical and
university – clinical are marginally significantly higher in comparison with
small animal practice after adjusting for age and gender (university – non-
clinical: Coef. 3.50, 95% CI: 0.37 to 6.62, p=0.029; university – clinical: Coef.
2.76, 95% CI: 0.48 to 5.03, p=0.018).
• The estimated mean WEMWBS scores for the population of veterinary
surgeons and for male and female veterinary surgeons separately, are
significantly lower than the corresponding means for the general population of
Scotland.

Chapter 5: Results 152
5.6 HSE Management Standards Indicator Tool: Working conditions
For each of the seven scales within the Health and Safety Executive Management
Standards Indicator Tool, a low score indicates less favourable working conditions (i.e.
more risk of stress at work); a high score indicates more favourable working
conditions (i.e. less risk of stress at work). The scores derived for each scale cannot be
compared across scales (Webster and others 2007).
The distribution of scores for each of the scales is presented in Figure 5.22.
Mean and median scores for each of the scales for the veterinary profession are
presented in Table 5.26. Men report significantly higher scores than women on the
scales for control (F(1, 1747)=165.2, p<0.001), relationships (F(1, 1741)=9.3,
p=0.002), role (F(1, 1735)=18.1, p<0.001) and change (F(1, 1709)=108.6, p<0.001).
Percentiles for the mean scores for each stressor domain of are presented in Table
5.27 to enable employers to compare their organisational means against national
benchmarks.
Mean scores for veterinary surgeons for each scale are compared across different
demographic and occupational factors in Tables 5.28 to 5.36. Shaded cells identify the
demographic or occupational factors with the highest and lowest scores (most
favourable and least favourable working conditions respectively) for each of the seven
scales. The p-values refer to the significance of differences between mean scores
within a stress domain across the demographic or occupational factor concerned (one-
way ANOVA).
The response rate was lowest for the managerial support domain: 16% of respondents
failed to answer at least 4 of the 5 questions (for the other six domains 0.5% to 2.6%
failed to answer the requisite number of questions). Respondents who identified their
position in the practice as sole principal or partner were least likely to answer
(respectively, 46% and 37% failed to respond to at least 4 of the 5 questions) (see
Figure 5.6).
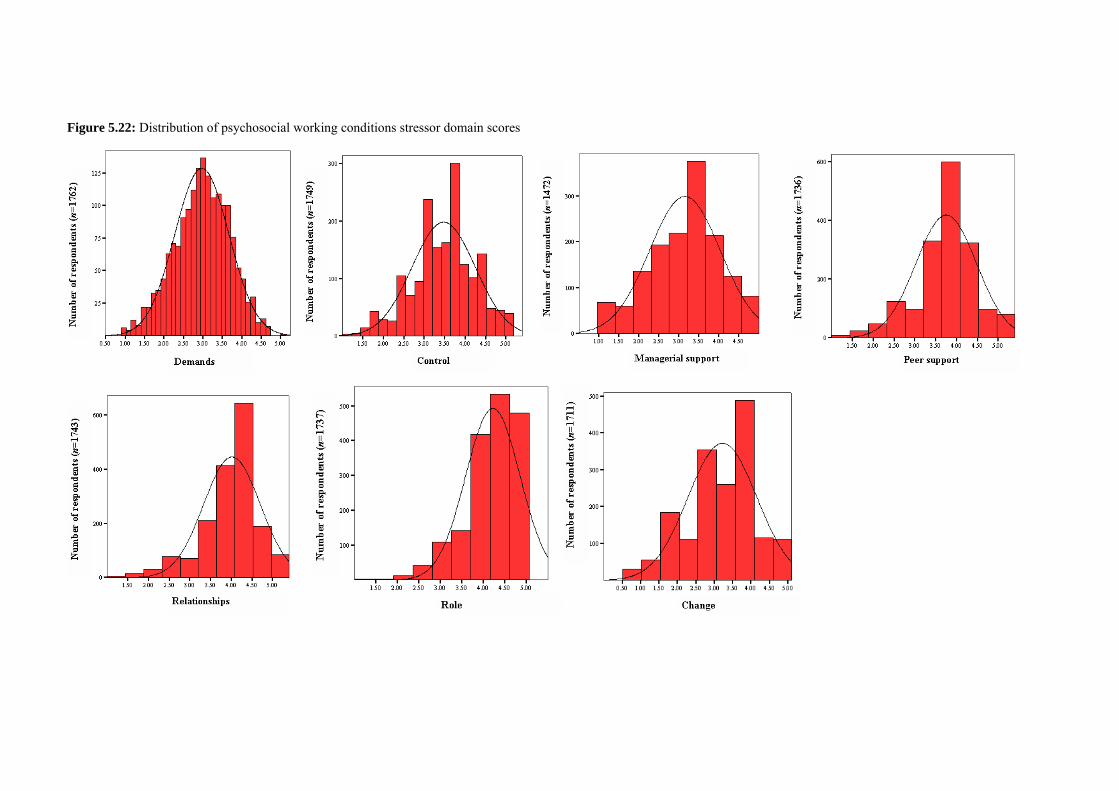
Figure 5.22: Distribution of psychosocial working conditions stressor domain scores

Table 5.26: Stressor domain scores for the sample of veterinary surgeons
Demands Control Managerial support Peer support n mean 95% CI SD median n mean 95% CI SD median n mean 95% CI SD median n mean 95% CI SD median Total 1747 2.96 2.93-3.00 0.70 3.00 1749 3.47 3.43-3.51 0.78 3.50 1472 3.14 3.09-3.18 0.89 3.2 1736 3.75 3.71-3.78 0.73 3.75 Gender Male 876 2.96 2.91-3.00 0.71 3.00 878 3.70† 3.65-3.74 0.72 3.67 681 3.17 3.10-3.24 0.90 3.2 868 3.74 3.69-3.79 0.73 3.75 Female 871 2.97 2.92-3.01 0.69 3.00 871 3.24 3.19-3.29 0.76 3.33 791 3.11 3.05-3.17 0.88 3.2 868 3.75 3.70-3.80 0.73 3.75
Relationships Role Change n mean 95% CI SD median n mean 95% CI SD median n mean 95% CI SD median Total 1743 4.01 3.98-4.04 0.69 4.25 1737 4.21 4.18-4.24 0.63 4.20 1711 3.22 3.17-3.26 0.94 3.33 Gender Male 875 4.06§ 4.02-4.11 0.66 4.25 873 4.28‡ 4.23-4.32 0.62 4.40 858 3.44¤ 3.39-3.50 0.89 3.67 Female 868 3.96 3.91-4.01 0.71 4.00 864 4.15 4.10-4.19 0.65 4.20 853 2.99 2.92-3.05 0.93 3.00
† one-way ANOVA, F(1, 1747)=165.2, p<0.001 § one-way ANOVA, F(1, 1741)=9.3, p=0.002 ‡ one-way ANOVA, F(1, 1735)=18.1, p<0.001 ¤ one-way ANOVA, F(1, 1709)=108.6, p<0.001
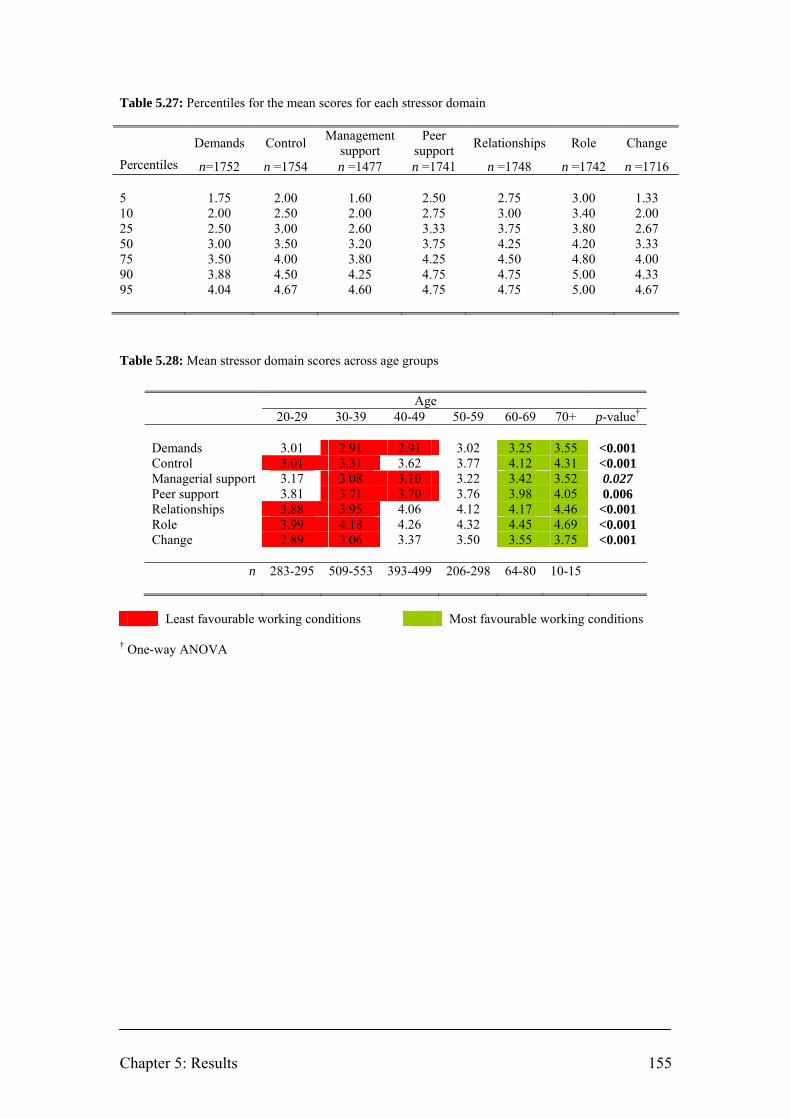
Chapter 5: Results 155
Table 5.27: Percentiles for the mean scores for each stressor domain
Demands Control Management support
Peer support Relationships Role Change
Percentiles n=1752 n =1754 n =1477 n =1741 n =1748 n =1742 n =1716 5 1.75 2.00 1.60 2.50 2.75 3.00 1.33 10 2.00 2.50 2.00 2.75 3.00 3.40 2.00 25 2.50 3.00 2.60 3.33 3.75 3.80 2.67 50 3.00 3.50 3.20 3.75 4.25 4.20 3.33 75 3.50 4.00 3.80 4.25 4.50 4.80 4.00 90 3.88 4.50 4.25 4.75 4.75 5.00 4.33 95 4.04 4.67 4.60 4.75 4.75 5.00 4.67
Table 5.28: Mean stressor domain scores across age groups
Age 20-29 30-39 40-49 50-59 60-69 70+ p-value†
Demands 3.01 2.91 2.91 3.02 3.25 3.55 <0.001 Control 3.01 3.31 3.62 3.77 4.12 4.31 <0.001 Managerial support 3.17 3.08 3.10 3.22 3.42 3.52 0.027 Peer support 3.81 3.71 3.70 3.76 3.98 4.05 0.006 Relationships 3.88 3.95 4.06 4.12 4.17 4.46 <0.001 Role 3.99 4.18 4.26 4.32 4.45 4.69 <0.001 Change 2.89 3.06 3.37 3.50 3.55 3.75 <0.001
n 283-295 509-553 393-499 206-298 64-80 10-15
Least favourable working conditions Most favourable working conditions
† One-way ANOVA

Chapter 5: Results 156
Table 5.29: Mean stressor domain scores across veterinary schools§
Live
rpoo
l
Lond
on
Ove
rsea
s (EU
or E
EA c
ount
ries)
Ove
rsea
s (N
on-E
U/E
EA c
ount
ries)
Gla
sgow
Edin
burg
h
Cam
brid
ge
Bris
tol
Tota
l: gr
adua
ted ≤
5 ye
ars
p-value†
Demands 2.93 3.07 3.12 3.19 3.07 2.95 3.08 2.91 3.02 0.702 Control 2.99 3.06 3.41 3.34 2.99 2.92 2.84 3.05 3.05 0.042 Managerial support 3.25 3.29 3.39 3.22 3.20 3.11 3.30 3.04 3.22 0.836
Peer support 3.82 3.88 4.23 3.93 3.79 3.75 3.94 3.77 3.88 0.213 Relationships 3.88 3.96 3.81 3.80 3.97 3.86 3.87 3.83 3.88 0.982 Role 3.85 4.13 4.03 3.92 4.15 4.01 3.87 4.11 4.02 0.317 Change 2.86 2.98 3.04 2.86 2.85 2.86 3.04 2.90 2.92 0.972
n 45 53-55
25-26
17-19
23-25
36-38
26-27 33 258-
268
Least favourable working conditions Most favourable working conditions
† One-way ANOVA § Only for veterinary surgeons graduating in the previous 5 years (2003 to 2007 inclusive)

Chapter 5: Results 157
Table 5.30: Mean stressor domain scores across type of work
Smal
l ani
mal
pra
ctic
e
Farm
ani
mal
pra
ctic
e
Equi
ne p
ract
ice
Mix
ed p
ract
ice
Oth
er sp
ecia
lity
prac
tice
Cha
rity
Gov
ernm
ent
Uni
vers
ity –
non
-clin
ical
Uni
vers
ity –
clin
ical
Indu
stry
Out
side
the
prof
essi
on
p-value†
Demands 2.99 3.00 2.96 2.96 2.93 2.75 3.02 3.23 2.53 2.78 3.33 <0.001 Control 3.39 3.74 3.65 3.43 3.96 2.89 3.63 3.91 3.36 3.96 3.48 <0.001 Managerial support 3.09 3.13 3.20 3.16 3.27 3.12 3.33 3.50 3.06 3.10 3.20 0.138
Peer support 3.74 3.85 3.84 3.76 3.97 3.56 3.70 3.85 3.65 3.52 3.68 0.121 Relationships 4.03 4.10 4.11 3.92 4.10 3.87 3.91 4.24 3.91 3.76 4.46 0.004 Role 4.28 4.23 4.29 4.13 4.40 4.08 3.88 4.20 3.98 3.86 4.31 <0.001 Change 3.23 3.48 3.34 3.24 3.36 3.04 2.94 3.38 2.85 2.86 3.43 <0.001
n 835-994
55-79
114-144
168-219
27-35 31 108 34 64-
65 33-34 6-7
Least favourable working conditions Most favourable working conditions
† One-way ANOVA Table 5.31: Mean stressor domain scores across current employment status§
Full-
time
Part-
time
Parti
ally
retir
ed
p-value†
Demands 2.89 3.28 3.67 <0.001 Control 3.47 3.43 3.98 0.004 Managerial support 3.14 3.14 3.04 0.901 Peer support 3.75 3.75 3.71 0.869 Relationships 4.00 4.06 4.36 0.046 Role 4.21 4.23 4.41 0.530 Change 3.26 3.04 3.16 0.011
n 1190-1436 258-282 18-25
Least favourable working conditions Most favourable working conditions
† One-way ANOVA § Excludes unemployed, taking a career break and fully retired

Chapter 5: Results 158
Table 5.32: Mean stressor domain scores across position in the practice
Sole
prin
cipa
l
Partn
er
Sala
ried
partn
er
Partn
er/d
irect
or
Full-
time
assi
stan
t
Part-
time
assi
stan
t
Con
sulta
nt
Locu
m
Oth
er
Not
app
licab
le
p-value†
Demands 2.88 2.84 2.72 2.92 3.00 3.30 3.26 3.15 2.74 2.78 <0.001 Control 4.06 3.82 3.60 3.74 3.10 3.24 4.22 3.23 3.50 3.74 <0.001 Managerial support 2.97 3.27 3.21 3.32 3.11 3.03 3.12 2.90 3.25 3.23 0.007
Peer support 3.79 3.84 3.65 3.74 3.74 3.65 3.81 3.64 3.61 3.79 0.139 Relationships 4.27 4.12 4.06 4.04 3.89 3.98 4.22 3.98 3.74 4.16 <0.001 Role 4.56 4.41 4.09 3.97 4.10 4.18 4.29 4.14 3.95 4.41 <0.001 Change 3.87 3.81 3.31 3.04 2.87 2.88 3.23 2.85 3.05 3.79 <0.001
n 75-140
187-301
12-13
144-146
613-634
172-179
23-28
63-73 76 101-
153
Least favourable working conditions Most favourable working conditions
† One-way ANOVA Table 5.33: Mean stressor domain scores across practice ownership
Sole
prin
cipa
l
Partn
ersh
ip
Lim
ited
com
pany
C
orpo
rate
con
cern
Cha
rity
Oth
er
Not
app
licab
le
p-value†
Demands 3.02 2.99 2.90 2.92 2.92 2.55 2.95 0.001 Control 3.44 3.47 3.57 3.15 3.03 3.40 3.64 <0.001 Managerial support 3.02 3.14 3.17 3.23 3.38 3.03 3.27 0.021 Peer support 3.74 3.77 3.78 3.74 3.72 3.50 3.70 0.278 Relationships 3.98 4.02 4.10 4.07 3.90 3.80 3.98 0.071 Role 4.27 4.24 4.29 4.11 4.19 3.90 3.96 <0.001 Change 3.17 3.27 3.43 2.99 3.22 2.80 2.99 <0.001
n 334-411
596-734
202-260 47 53 46 178-
181
Least favourable working conditions Most favourable working conditions
† One-way ANOVA

Chapter 5: Results 159
Table 5.34: Mean stressor domain scores for RCVS Certificate or Diploma holders
RCVS Certificate or Diploma holder
Yes No p-value†
Demands 2.81 3.00 <0.001 Control 3.65 3.44 <0.001 Managerial support 3.16 3.14 0.736 Peer support 3.72 3.75 0.502 Relationships 4.03 4.01 0.572 Role 4.19 4.21 0.604 Change 3.31 3.20 0.062
n 231-283 1237-1462
Least favourable working conditions Most favourable working conditions
† One-way ANOVA Table 5.35: Mean stressor domain scores across hours worked in a typical week
0-9
hour
s
10-1
9 ho
urs
20-2
9 ho
urs
30-3
9 ho
urs
40-4
9 ho
urs
50-5
9 ho
urs
60-6
9 ho
urs
70-7
9 ho
urs
80+
hour
s
p-value†
Demands 3.82 3.48 3.31 3.24 3.04 2.70 2.53 2.44 2.42 <0.001 Control 3.74 3.52 3.41 3.56 3.47 3.40 3.54 3.64 3.23 0.093 Managerial support 3.22 3.14 3.17 3.35 3.19 3.04 2.97 2.75 2.76 <0.001
Peer support 3.71 3.77 3.80 3.85 3.78 3.71 3.60 3.56 3.34 0.022 Relationships 4.28 4.16 4.07 4.03 4.02 3.98 3.91 4.03 3.88 0.232 Role 4.36 4.23 4.24 4.28 4.21 4.16 4.21 4.37 4.08 0.249 Change 3.25 3.03 3.01 3.30 3.25 3.18 3.34 3.38 3.13 0.068
n 13-17
58-64
115-127
196-214
579-688
361-446
102-135
28-35 7-8
Least favourable working conditions Most favourable working conditions
† One-way ANOVA

Chapter 5: Results 160
Table 5.36: Mean stressor domain scores across hours on-call in a typical week
0-9
hour
s
10-1
9 ho
urs
20-2
9 ho
urs
30-3
9 ho
urs
40-4
9 ho
urs
50-5
9 ho
urs
60-6
9 ho
urs
70-7
9 ho
urs
80+
hour
s
p-value†
Demands 3.02 2.96 2.93 2.95 2.86 2.94 2.88 2.66 2.74 0.060 Control 3.49 3.39 3.34 3.53 3.46 3.59 3.94 3.67 3.87 <0.001 Managerial support 3.15 3.09 3.14 3.18 3.14 3.28 3.01 3.04 3.09 0.969
Peer support 3.72 3.81 3.75 3.75 3.80 3.80 3.78 3.56 3.61 0.660 Relationships 4.04 4.01 3.98 3.92 3.95 4.04 4.23 3.91 4.18 0.217 Role 4.22 4.17 4.16 4.24 4.19 4.29 4.23 4.25 4.47 0.072 Change 3.22 3.19 3.17 3.20 3.19 3.36 3.65 3.21 3.52 0.226
n 689-780
253-306
268-304
135-173
60-70
22-31 9-16 5-8 36-
60
Least favourable working conditions Most favourable working conditions
† One-way ANOVA
Mean scores for the veterinary profession, the working general population (Edwards
and others 2008) and nurses (Royal College of Nursing 2006) are compared in Figure
5.23, with higher scores reflecting more favourable conditions.
Veterinary surgeons self-report less favourable working conditions (higher risk of
work-related stress) than the general population for the demands, managerial support
and peer support stressor domains. The mean domain scores for the sample of
veterinary surgeons can be compared with the corresponding percentile scores for
organisations in the general population sample: demands, 10th-25th percentile; control,
50th-75th percentile; managerial support, 5th-10th percentile; peer support, 25th-50th
percentile; relationships, 75th-90th percentile; role, 50th-75th percentile; change, 75th-
90th percentile (Edwards and others 2008). This indicates that, for example,
managerial support is as favourable as or better than only 5-10% of the organisations
in the general population sample; relationships are as favourable as or better than 75-
90% of the organisations in the general population sample. The sample self-reports
more favourable working conditions than the general population for relationships,
role and change. The difference between the mean scores for veterinary surgeons and
Chapter 5: Results 161
the general population for each stressor domain is statistically significant (p<0.001)
(Table 5.37).
Psychometric analysis has indicated that although the seven sub-scales of HSE MSIT
measure distinct concepts, there is evidence consistent with a single underlying
construct, suggesting it may be possible to use the scale to derive a single measure of
work-related stress (Edwards and others 2008). The difference between the mean
score of the overall scale for veterinary surgeons (n=1466, mean=3.45, 95% CI: 3.42
to 3.48) and the mean score of the overall scale for the general population is
statistically significant (p<0.001) (Table 5.37) which suggests that, when all the
stressor domains are taken into consideration, veterinary surgeons report less
favourable working conditions. The mean score of the overall scale for veterinary
surgeons is in the 25th-50th percentile of organisations in the general population
sample (Edwards and others 2008).
Insufficient data are available in the report on the nursing profession to make valid
comparisons with the mean scores for the veterinary profession. However, if the
assumption is made that the standard deviation of the mean for each of the stressor
domains among nurses is the same as among veterinary surgeons, then the results
suggest that veterinary surgeons report significantly less favourable working
conditions for managerial support (t(4494)=5.9, p<0.001) and more favourable
working conditions for relationships (t(4495)=14.8, p<0.001) and change
(t(4463)=4.0, p<0.001) than nurses.

Chapter 5: Results 162
Figure 5.23: Mean stressor domain scores for veterinary surgeons and normative data for UK general
population‡ and nurses†
2.5
3
3.5
4
4.5
5
Dem
ands
Con
trol
Man
ager
ial
supp
ort
Pee
r sup
port
Rel
atio
nshi
ps
Rol
e
Cha
nge
Mea
n sc
ore
Veterinary surgeons (n=1472-1749) General population (n=26,382) Nurses (n=2754-2769)
Error bars represent SD ‡ Source: Edwards and others (2008). Data from 39 different UK organisations † Source: Royal College of Nursing (2006). SD is not reported
Table 5.37: Difference between mean stressor domain scores for veterinary surgeons and the general
population
Mean HSE MSIT
stressor domain
Veterinary surgeons n=1466-1749
General population‡
n=26,382
Difference 95% CI of difference Statistical test
Demands 2.96 3.05 0.09 0.08 to 0.10 t(28,127)=16.1, p<0.001 Control 3.47 3.42 -0.05 -0.07 to -0.03 t(28,129)=5.5, p<0.001 Managerial support 3.14 3.47 0.33 0.32 to 0.34 t(27,852)=44.7, p<0.001
Peer support 3.75 3.80 0.05 0.04 to 0.06 t(28,116)=9.6, p<0.001 Relationships 4.01 3.77 -0.24 -0.22 to -0.26 t(28,123)=21.1, p<0.001 Role 4.21 4.18 -0.03 -0.02 to -0.04 t(28,117)=6.5, p<0.001 Change 3.22 3.00 -0.22 -0.20 to -0.24 t(28,091)=26.9, p<0.001 Overall scale 3.45 3.53 0.08 0.07 to 0.09 t(27,846)=23.0, p<0.001
Shading indicates stressor domains for which the mean score for veterinary surgeons is lower (higher
risk) than for the general population.
‡ Source: Edwards and others (2008)

Chapter 5: Results 163
The internal consistency of each of the component sub-scales of HSE MSIT was
assessed as satisfactory using Cronbach’s alpha reliability coefficient. The coefficient
exceeded 0.6 for all scales (demands α = 0.84; control α = 0.81; managerial support α
= 0.84; peer support α = 0.79; relationships α = 0.79; role α = 0.78; change α = 0.62).
5.6.1 Summary
• Male veterinary surgeons report more favourable working conditions in
control, relationships, role and change domains than females.
• Veterinary surgeons working for charities and in university – clinical roles
report the least favourable working conditions associated with demands and
control; those working in government roles report the least favourable
working conditions associated with relationships and role.
• Veterinary surgeons in full-time employment report less favourable working
conditions associated with demands; those in part-time employment report less
favourable working conditions associated with control and change.
• Younger veterinary surgeons (< 49 years) report the least favourable working
conditions across all stressor domains. Scores for all domains generally
increase (more favourable working conditions) with increasing age group.
• Reported working conditions for demands, managerial support and peer
support domains are least favourable for those working the longest hours.
• Locums and full-time assistants report less favourable working conditions
across more stressor domains than other positions in veterinary practices.
• Less favourable working conditions are reported for demands, managerial
support and peer support than among the UK working general population, and
more favourable working conditions for the other stressor domains.

Chapter 5: Results 164
5.7 Work-home interaction
5.7.1 Negative work-home interaction (WHI_N)
The mean WHI_N score for the total sample (n=1749) is 1.19 (95% CI: 1.16 to 1.21,
SD=0.57).
The distribution of responses for each of the questions relating to WHI_N is presented
in Figure 5.24.
Multiple linear regression was applied to identify the factors that are associated with
WHI_N score after adjusting for age and gender.
There is no significant association between WHI_N score and gender after adjusting
for age (Coef. 0.01, 95% CI: -0.05 to 0.07, p=0.684), although the mean is
significantly higher for women prior to adjustment for age (1.23 vs. 1.14, F(1, 1747),
p=0.001). There is a significant relationship between mean WHI_N score and age
after adjustment for gender: the score decreases by 0.010 for every one year increase
in age (95% CI: -0.012 to -0.007; p<0.001).
The mean score WHI_N for recent graduates of non-EU/EEA countries is lower in
comparison with Liverpool after adjusting for age and gender (Coef. -0.36, 95% CI: -
0.69 to -0.04, p=0.028).
Veterinary surgeons working in government and university – non-clinical roles have
lower mean WHI_N score than those working in small animal practice after adjusting
for age and gender (Government: Coef. -0.13, 95% CI: -0.25 to -0.02, p=0.021;
University – non-clinical: Coef. -0.23, 95% CI: -0.43 to -0.04, p=0.019).
Part-time and partially retired veterinary surgeons have lower mean WHI_N scores
than those in full-time employment after adjusting for age and gender (Part-time: Coef.
-0.39, 95% CI: -0.46 to -0.32, p<0.001; Partially retired: Coef. -0.38, 95% CI: -0.59 to
-0.16, p=0.001).
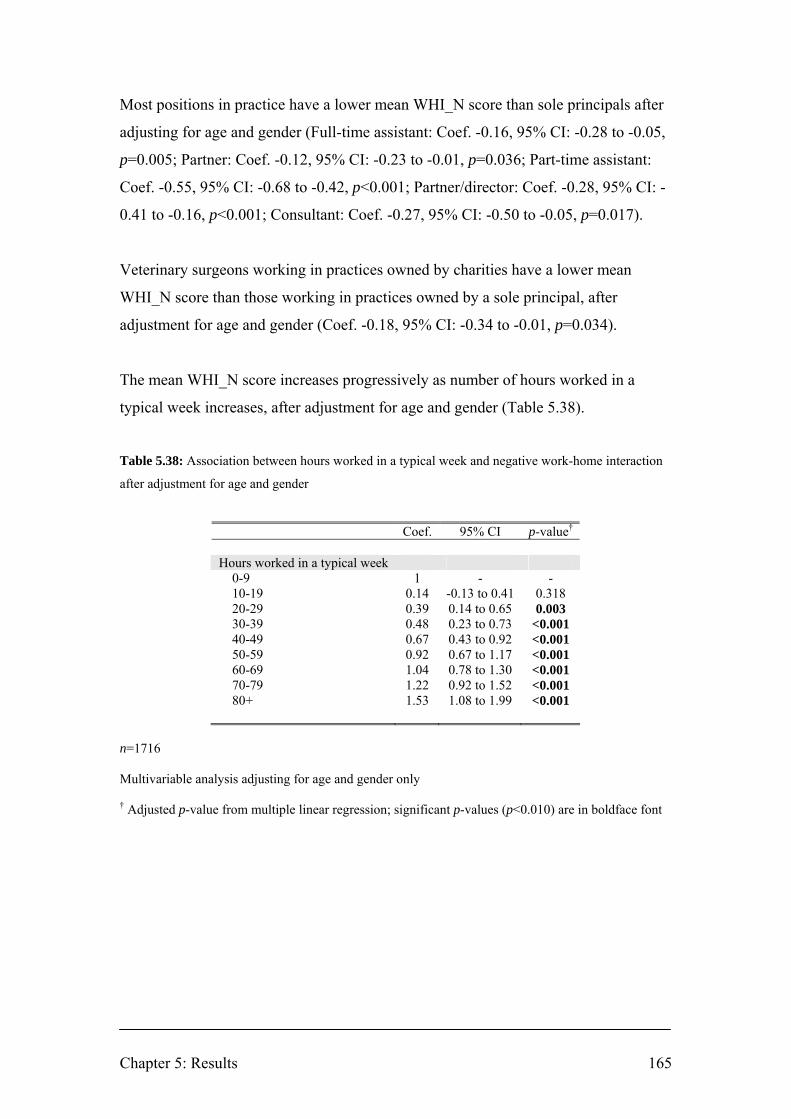
Chapter 5: Results 165
Most positions in practice have a lower mean WHI_N score than sole principals after
adjusting for age and gender (Full-time assistant: Coef. -0.16, 95% CI: -0.28 to -0.05,
p=0.005; Partner: Coef. -0.12, 95% CI: -0.23 to -0.01, p=0.036; Part-time assistant:
Coef. -0.55, 95% CI: -0.68 to -0.42, p<0.001; Partner/director: Coef. -0.28, 95% CI: -
0.41 to -0.16, p<0.001; Consultant: Coef. -0.27, 95% CI: -0.50 to -0.05, p=0.017).
Veterinary surgeons working in practices owned by charities have a lower mean
WHI_N score than those working in practices owned by a sole principal, after
adjustment for age and gender (Coef. -0.18, 95% CI: -0.34 to -0.01, p=0.034).
The mean WHI_N score increases progressively as number of hours worked in a
typical week increases, after adjustment for age and gender (Table 5.38).
Table 5.38: Association between hours worked in a typical week and negative work-home interaction
after adjustment for age and gender
Coef. 95% CI p-value† Hours worked in a typical week 0-9 1 - - 10-19 0.14 -0.13 to 0.41 0.318 20-29 0.39 0.14 to 0.65 0.003 30-39 0.48 0.23 to 0.73 <0.001 40-49 0.67 0.43 to 0.92 <0.001 50-59 0.92 0.67 to 1.17 <0.001 60-69 1.04 0.78 to 1.30 <0.001 70-79 1.22 0.92 to 1.52 <0.001 80+ 1.53 1.08 to 1.99 <0.001
n=1716 Multivariable analysis adjusting for age and gender only † Adjusted p-value from multiple linear regression; significant p-values (p<0.010) are in boldface font

Chapter 5: Results 166
The mean WHI_N score is also associated with number of hours on-call in a typical
week, after adjustment for age and gender (Table 5.39).
Table 5.39: Association between hours on-call in a typical week and negative work-home interaction
after adjustment for age and gender
Coef 95% CI p-value† Hours on call in a typical week 0-9 1 - - 10-19 0.04 -0.04 to 0.11 0.302 20-29 0.12 0.04 to 0.19 0.002 30-39 0.15 0.06 to 0.24 0.001 40-49 0.24 0.10 to 0.37 0.001 50-59 0.10 -0.10 to 0.30 0.323 60-69 0.21 -0.07 to 0.48 0.319 70-79 0.70 0.31 to 1.08 <0.001 80+ 0.33 0.18 to 0.47 <0.001
n=1735 Multivariable analysis adjusting for age and gender only † Adjusted p-value from multiple linear regression; significant p-values (p<0.010) are in boldface font
The WHI_N scale demonstrated satisfactory internal consistency in the study sample
(Cronbach’s α=0.89).

Figure 5.24: Distribution of responses for questions relating to negative work-home interaction
0% 20% 40% 60% 80% 100%
Work takes up time that you w ould like to spend w ith others (n=1754)
Work obligations make it diff icult to feel relaxed at home (n=1754)
No time for hobbies as have to w ork so hard (n=1754)
Insuff icient energy for leisure activities because of job (n=1754)
Work schedule makes it diff icult to fulf il domestic obligations (n=1754)
Have to cancel appointments due to w ork commitments (n=1754)
Diff icult to fulf il domestic obligations as constantly thinking about w ork (n=1754)
Irritable at home because w ork is demanding (n=1754)
Percentage
Never Sometimes Often Alw ays

Chapter 5: Results 168
0
0.2
0.4
0.6
0.8
1
1.2
1.4
1.6
1.8
2
2.2
Netherlands w orkingpopulation (n=1857)
UK veterinary profession(n=1749)
Belgian veterinarysurgeons (n=216)
Mea
n W
HI_
N s
core
The mean WHI_N score for the sample is higher than for a sample of the working
population from the Netherlands (Geurts and others 2005), t(3604)=18.7, p<0.001,
and lower than for Belgian veterinary surgeons (Hansez and others 2008), t(1963)=6.4,
p<0.001 (Figure 5.25).
Figure 5.25: Negative work-home interaction mean score for veterinary surgeons vs. normative data
Error bars represent SD
5.7.1.1 Summary
• The mean WHI_N score for the total sample is 1.19 (95% CI: 1.16 to 1.21,
SD=0.57).
• There is no significant difference between mean WHI_N score for men and
women after adjustment for age (Coef. 0.01, 95% CI: -0.05 to 0.07, p=0.684).
• There is a significant relationship between mean WHI_N score and age after
adjustment for gender: the score decreases by 0.010 for every one year
increase in age (95% CI: -0.012 to -0.007, p<0.001).
• The estimated mean WHI_N score among veterinary surgeons is higher than
among the Netherlands working population.
p<0.001 p<0.001
Chapter 5: Results 169
5.7.2 Positive work-home interaction (WHI_P)
The mean WHI_P score for the total sample (n=1716) is 0.97 (95% CI: 0.94 to 0.99,
SD=0.56).
The distribution of responses for each of the questions relating to WHI_P is presented
in Figure 5.26.
Multiple linear regression was applied to identify the factors that are associated with
WHI_P score after adjusting for age and gender only.
There is no significant difference between mean WHI_P score for men and women
after adjusting for age (Coef. 0.05, 95% CI: -0.11 to 0.01, p=0.075), although the
mean is significantly lower for women prior to adjustment for age (0.92 vs. 1.01, F(1,
1714)=10.9, p=0.001). There is a significant relationship between mean WHI_P score
and age after adjustment for gender: the score increases by 0.005 for every one year
increase in age (Coef. 0.005, 95% CI: 0.002 to 0.007, p<0.001).
There is no significant difference between mean WHI_P score for recent graduates of
different veterinary schools after adjustment for age and gender.
The mean WHI_P score for veterinary surgeons working in farm animal practice is
marginally significantly higher than for those working in small animal practice after
adjustment for age and gender (Coef. 0.16, 95% CI: 0.03 to 0.29, p=0.015).
The mean WHI_P score for veterinary surgeons in partial retirement is higher than for
those working full-time after adjustment for age and gender (Coef. 0.29, 95% CI: 0.06
to 0.53, p=0.015).
The mean WHI_P score for veterinary surgeons working as consultants is higher than
for sole principals after adjustment for age and gender (Coef. 0.28, 95% CI: 0.05 to
0.51, p=0.019).
Chapter 5: Results 170
There are no significant differences between mean WHI_P scores across ownership of
practice, RCVS certificate or diploma holder, hours worked in a typical week or hours
on-call in a typical week, after adjustment for age and gender.
The mean WHI_P score for the sample is higher than for the sample of the working
population from the Netherlands (Geurts and others 2005), t(3571)=7.2, p<0.001, and
lower than for Belgian veterinary surgeons (Hansez and others 2008), t(1930)=5.1,
p<0.001 (Figure 5.27). The results suggest that veterinary surgeons report higher
levels of both negative and positive work-home interaction than the working general
population of the Netherlands. However, comparative data must be interpreted
cautiously due to possible cultural differences in interpretation of the scale items and
the small size of the sample of Belgian veterinary surgeons.
The WHI_P scale demonstrated satisfactory internal consistency in the study sample
(Cronbach’s α=0.75).

Figure 5.26: Distribution of responses for questions relating to positive work-home interaction
0% 20% 40% 60% 80% 100%
Better able to interact w ith others as a result of things learned at w ork (n=1721)
Manage time at home more eff iciently as a result of the w ay you do your job (n=1726)
Better able to keep appointments at home because your job requires this as w ell (n=1721)
Fulf il domestic obligations better because of things you have learned at w ork (n=1733)
More inclined to engage in home activities after pleasant day/w eek at w ork (n=1752)
Percentage
Never Sometimes Often Alw ays

Chapter 5: Results 172
0
0.2
0.4
0.6
0.8
1
1.2
1.4
1.6
1.8
2
2.2
Netherlands w orkingpopulation (n=1857)
UK veterinary profession(n=1716)
Belgian veterinarysurgeons (n=216)
Mea
n W
HI_
P sc
ore
Figure 5.27: Positive work-home interaction mean score for veterinary surgeons vs. normative data
Error bars represent SD
5.7.2.1 Summary
• The mean WHI_P score for the total sample is 0.97 (95% CI: 0.94 to 0.99,
SD=0.56).
• There is no significant difference between mean WHI_P score for men and
women after adjustment for age (Coef. 0.05, 95% CI: -0.11 to 0.01, p=0.075).
• There is a significant relationship between mean WHI_P score and age after
adjustment for gender: the mean score increases with increasing age (Coef.
0.005, 95% CI: 0.002 to 0.007, p<0.001).
• The estimated mean WHI_P score among veterinary surgeons is higher than
among the Netherlands working population.
p<0.001 p<0.001

Chapter 5: Results 173
5.8 Contributors to stress
5.8.1 Personal and general work-related
Number of hours worked, making professional mistakes, client expectations, and
administrative and clerical tasks are reported as the greatest contributors to stress for
the sample population of veterinary surgeons (mean scores: 2.24; 2.22; 2.12; 1.83
respectively) (Figure 5.28). The percentage of respondents reporting that these
stressors contribute quite a lot or very much to their stress is 42.9%, 40.4%, 38.0%
and 27.9% respectively (Figure 5.29).
For making professional mistakes (PM) and client expectations (CE), unadjusted
mean scores are higher for women than men (PM: F(1, 1740)=196.2, p<0.001; CE:
F(1, 1733)=37.4, p<0.001); decrease with increasing age group (PM: F(5, 1728)=39.9,
p<0.001; CE: F(5, 1720)=24.3, p<0.001); vary significantly across type of work (PM:
F(10, 1733)=7.8, p<0.001; CE: F(10, 1725)=14.9, p<0.001) with small animal, mixed,
equine and charity work having the highest mean scores; and vary across position in
the practice (PM: F(9, 1726)=22.5, p<0.001; CE: F(9, 1713)=17.5, p<0.001) with
full-time assistants having the highest mean scores.

Chapter 5: Results 174
Figure 5.28: Mean score and SD for personal and work-related stressors
0 1 2 3 4
Work-related travelling (n=1774)
Availability of professional support (n=1766)
Client expectations (n=1773)
Communication with clients (n=1781)
Physical demands (n=1785)
Non-financial business management (n=1778)
Financial expectations of the business (n=1773)
Administrative and clerical tasks (n=1788)
Making professional mistakes (n=1780)
Maintaining personal skills (n=1788)
Availability of suitable employment (n=1747)
Workplace relationships (n=1785)
Number of hours worked (n=1789)
Addictive behaviours (n=1782)
Managing own finances (n=1786)
Personal relationships outside work (n=1788)
Mean score

Chapter 5: Results 175
Figure 5.29: Distribution of responses for personal and work-related stressors
0% 20% 40% 60% 80% 100%
Work-related travelling (n=1774)
Availability of professional support (n=1766)
Client expectations (n=1773)
Communication with clients (n=1781)
Physical demands (n=1785)
Non-financial business management (n=1778)
Financial expectations of the business (n=1773)
Administrative and clerical tasks (n=1788)
Making professional mistakes (n=1780)
Maintaining personal skills (n=1788)
Availability of suitable employment (n=1747)
Workplace relationships (n=1785)
Number of hours worked (n=1789)
Addictive behaviours (n=1782)
Managing own finances (n=1786)
Personal relationships outside work (n=1788)
Percentage
Not at all Not very much Moderate Quite a lot Very much
For respondents who graduated within the previous 5 years (2003 to 2007 inclusive)
(n=266-269) making professional mistakes, number of hours worked, client
expectations and managing their own finances are reported as the greatest contributors
to stress (mean scores: 2.81; 2.67; 2.35; 1.93 respectively). Unadjusted mean scores
for recent graduates are higher than for respondents who have been graduated for over
5 years for all personal and work-related stressors (p<0.001), except addictive
behaviours, administrative and clerical tasks, financial expectations of the business,
and non-financial business management.
5.8.2 Clinical work-related
The possibility of client complaints or litigation, unexpected clinical outcomes and
out-of-hours on-call duties are reported as the greatest contributors to stress for
respondents treating clinical cases (mean scores: 2.19; 1.98; 1.93 respectively). The

Chapter 5: Results 176
percentage of respondents reporting that these stressors contribute quite a lot or very
much to their stress is 42.9%, 40.4% and 38.0% respectively (Figures 5.30 and 5.31).
For the possibility of client complaints or litigation (CL), and unexpected clinical
outcomes (UO), unadjusted mean scores are higher for women than men (CL: F(1,
1576)=80.2, p<0.001; UO: F(1, 1565)=77.4, p<0.001); decrease with increasing age
group(CL: F(5, 1566)=25.5, p<0.001; UO: F(5, 1555)=10.7, p<0.001); vary
significantly across type of work (CL: F(10, 1568)=5.6, p<0.001; UO: F(10,
1557)=5.3, p<0.001) with small animal, mixed, equine and charity work having the
highest mean scores for complaints or litigation and small animal and farm animal
work having the highest mean scores for unexpected outcomes; and vary across
position in the practice (CL: F(9, 1569)=15.4, p<0.001; UO: F(9, 1588)=6.5, p<0.001)
with full-time assistants having the highest mean scores.
Figure 5.30: Mean score and SD for clinical work-related stressors
0 1 2 3 4
Legal and professional responsibilities (n=1606)
Unexpected clinical outcomes (n=1603)
Possibility of complaints or litigation (n=1614)
Dealing with client grief (n=1601)
Time available for each case (n=1609)
Resources available to you (n=1607)
Clinical decision-making (n=1606)
Times when you have sole charge (n=1585)
Being responsible for animals' lives (n=1609)
Euthanasia of animals (n=1605)
After hours on call duties (n=1543)
Mean score

Chapter 5: Results 177
Figure 5.31: Distribution of responses for clinical work-related stressors
0% 20% 40% 60% 80% 100%
Legal and professional responsibilities (n=1606)
Unexpected clinical outcomes (n=1603)
Possibility of complaints or litigation (n=1614)
Dealing with client grief (n=1601)
Time available for each case (n=1609)
Resources available to you (n=1607)
Clinical decision-making (n=1606)
Times when you have sole charge (n=1585)
Being responsible for animals' lives (n=1609)
Euthanasia of animals (n=1605)
After hours on call duties (n=1543)
Percentage
Not at all Not very much Moderate Quite a lot Very much
For respondents who graduated within the previous 5 years (2003 to 2007 inclusive)
(n=256-264), the possibility of complaints or litigation, out-of-hours on-call duties,
times of sole charge and unexpected clinical outcomes are reported as the greatest
contributors to stress (mean scores: 2.63; 2.48; 2.27; 2.17 respectively). Mean scores
are higher for all clinical work-related stressors (p<0.001), than for respondents who
have been graduated for over 5 years.
5.8.3 Summary
• Number of hours worked, making professional mistakes, client expectations,
and administrative and clerical tasks are reported as the greatest contributors
to stress for the sample population of veterinary surgeons.
• The possibility of client complaints or litigation, unexpected clinical outcomes
and out-of-hours on-call duties are reported as the greatest contributors to
stress for respondents treating clinical cases.

Chapter 5: Results 178
5.9 Sources of satisfaction and/or pleasure
The greatest sources of satisfaction and/or pleasure reported in open responses were
grouped according to theme using a coding frame as described in Section 4.12. Each
respondent reported up to three sources. The ten most frequently identified themes are
listed in Table 5.40. There are gender differences in the frequency of reporting some
themes.
Table 5.40: Frequency of reporting each source of satisfaction theme
%§
95% CI
Total Male Female Satisfaction theme n=1793 n=895 n=893 χ2
Good clinical outcomes 38.8 36.6-41.1
36.5 33.4-39.7
41.2 38.0-44.5 χ2=4.1, df=1, p=0.043
Relationships with colleagues 31.1 29.0-33.3
27.5 24.7-30.5
34.6 31.6-37.8 χ2=10.6, df=1, p=0.001
Intellectual challenge/learning 30.1 28.0-32.3
28.5 25.6-31.5
31.6 28.6-34.7 χ2=2.0, df=1, p=0.154
Client satisfaction 28.6 26.6-30.7
25.9 23.2-28.9
31.2 28.3-34.4 χ2=6.2, df=1, p=0.013
Relationships with clients 27.3 25.3-29.4
25.7 22.9-28.7
29.1 26.2-32.2 χ2=2.6, df=1, p=0.105
Improving animal health and welfare 15.8 14.2-17.5
12.6 10.6-15.0
19.0 16.6-21.7 χ2=13.8, df=1, p<0.001
Surgical work 14.2 12.7-15.9
13.3 11.2-15.7
14.8 12.6-17.3 χ2=0.8, df=1, p=0.366
Working with animals 13.3 11.8-15.0
11.3 9.4-13.5
15.3 13.1-17.9 χ2=6.4, df=1, p=0.012
Financial rewards 11.9 10.5-13.5
16.5 14.2-19.1
7.3 5.8-9.2 χ2=36.5, df=1, p<0.001
Management 9.0 7.7-10.4
13.6 11.5-16.0
4.4 3.2-5.9 χ2=47.2, df=1, p<0.001
§ The percentage of respondents identifying each theme. The percentages do not sum to 100 as each
respondent cited up to three sources of satisfaction.
Note: Themes are listed in descending order of frequency of reporting for the total sample. Others and
Not specified are not included.
Significant p-values (p<0.010) are in boldface font; marginally significant p-values (p=0.010 to
p=0.049) are in boldface italicised font

Chapter 5: Results 179
5.10 Estimation of non-response bias
The demographic and occupational profiles of respondents were compared with those
for the original sample to give an indication of any non-response bias arising from
differences in response rates (Tables 5.41 and 5.42).
Table 5.41: Response rate by gender and for each decade of qualification
Respondents Original sample Response rate
n n % Gender§ Male 899 1731 51.9 Female 897 1469 61.1 Year of qualification† 1940-1949 1 - - 1950-1959 9 22 40.9 1960-1969 61 126 48.4 1970-1979 272 480 56.7 1980-1989 471 795 59.2 1990-1999 505 953 53.0 2000-2007 477 824 57.9 Total 1796 3200 56.1
§ The number of males and females is adjusted by allocating the number whose gender is unknown
(respondents n=5; original sample n=64) in equal proportion to male and female.
† The number in each decade of qualification is adjusted by distributing the number whose year of
qualification is unknown (respondents n=53; original sample n=158) across each of the decades of
qualification in direct proportion to the number whose age is known in that decade of qualification.
The difference in response rate between males and females is statistically significant
(males 51.9% vs. females 61.1%, difference=9.1%, 95% CI of difference=5.7 to
12.5%; χ2=26.9, df=1, p<0.001). The difference in response rate across years of
qualification pre-1979, 1980-1989, 1990-1999 and 2000-2007 is marginally
significant (χ2=8.6, df=3, p=0.036). The latter may be associated with: i) the
difference in response rate between males and females as the number of women in the
profession has steadily increased over recent decades (Robinson and Hooker 2006);
and ii) a greater proportion of retired veterinary surgeons in the pre-1979 cohort who
considered that the survey was not relevant to them.

Chapter 5: Results 180
Table 5.42: Response rate for each type of work
Respondents§ Original sample† Response rate
Type of work n n % Small animal practice 1018 1511 67.4 Farm animal practice 81 151 53.6 Equine practice 148 212 69.8 Mixed practice 224 846 26.5 Other speciality practice 36 - - Total general practice 1507 2720 55.4 Charity 32 64 50.0 Government 113 192 58.8 University – non-clinical 35 University – clinical 66 160 63.1
Industry 35 Outside the profession 8 64 67.2
Total 1796 3200 56.1
† The category ‘Locum’ (n=163) is distributed across each of the categories of general practice in direct
proportion to the number in the original sample in each category of general practice
§ The number of respondents whose type of work is unknown (n=44) is distributed across each of the
types of work in direct proportion to the number of respondents in each type of work
There is no statistically significant difference in response rate across work types:
general practice, charity, government, university and industry/outside the profession
(χ2=8.5, df=4, p=0.075).
Non-response bias occurs when respondents and non-respondents differ in outcome
variables. Estimates of non-response bias based on comparison of response rates
across exposure variables such as demographic and occupational factors is not
particularly informative as outcome variables may also influence the likelihood of
participation and have potential to yield better estimates of non-response bias (Groves
2006). Late respondents can be used as a proxy for non-respondents in estimating
non-response bias in surveys (Groves 2006). A comparative analysis was conducted
to identify any significant differences between outcome measures for late responders
and all earlier responders. Late responders comprised 15.4% (n=272) of respondents
in the analysis. The analysis compared 12-month prevalence of suicidal thoughts,
mean HADS-A and HADS-D scores and WEMWBS score (Table 5.43). The mean

Chapter 5: Results 181
HADS-D score is significantly higher for late responders than for earlier responders
(mean difference=0.54, 95% CI of the difference: 0.10 to 0.98, p=0.017). The 12-
month prevalence of suicidal thoughts and mean HADS-A score are higher for late
responders and the mean WEMWBS score is lower for late responders but these
differences are not statistically significant.
Table 5.43: Comparative analysis of late responders and earlier responders for HADS-A, HADS-D,
WEMWBS and 12-month prevalence of suicidal thoughts
Late responders n=272
Earlier responders n=1490
Statistical test
Dependent variable mean SD mean SD Independent samples t-test§ HADS-A 8.29 3.86 7.86 4.12 t(1760)=1.58, p=0.114 HADS-D 5.11 3.43 4.57 3.42 t(1760)=2.40, p=0.017 WEMWBS 47.88 9.07 49.02 9.05 t(1760)=1.90, p=0.058 % % χ2 test 12-month prevalence of suicidal thoughts 24.0 20.8 χ2=1.4, df=1, p=0.245
§ Equal variances assumed (Levene’s test: variances are not significantly different, p>0.05) Note: Significant p-values (p<0.010) are in boldface font; marginally significant p-values (p=0.010 to
p=0.049) are in boldface italicised font
5.10.1 Summary
• There is evidence that there may be non-response bias associated with a higher
response rate among women and differences in response rates across years of
qualification.
• The higher mean HADS-D score among late responders suggests that non-
responders may have higher levels of depressive symptoms. Thus population
estimates based on survey respondents may underestimate the true prevalence
of psychological morbidity.

Chapter 6: Discussion 182
CHAPTER 6: DISCUSSION
6.0 Introduction
The overarching objective of this study was to explore the mental health and well-
being of the UK veterinary profession to provide empirical evidence to assess their
contribution to the elevated suicide risk and inform the development of strategies to
improve psychological health and attenuate suicide risk.
Specifically, the study aimed to estimate a range of psychological health parameters
for the population of veterinary surgeons in the UK, investigate possible differences
across demographic and occupational factors, compare population parameter values
with published data for the general population and other normative groups, and
propose potentially effective interventions.
This chapter is structured around the study aims and hypotheses. It includes critical
assessment of the strength of evidence in support of the hypotheses, provides
commentary on the relevance of the findings to understanding suicide risk in the
profession and discusses the results in the context of previously published findings.
The chapter concludes with a discussion of the strengths and limitations of the study
and the implications of the study for research and the profession. Proposals for
interventions which have potential to improve psychological health and attenuate
suicide risk are included in the discussion of the implications of the study for the
profession.
6.1 Assessment of study population parameters
6.1.1 Generalisability of results
The demographic and occupational profile of study respondents is generally in close
alignment with that of RCVS membership which suggests that study respondents are
fairly representative of the wider population of veterinary surgeons practising in the
UK. Veterinary surgeons in mixed practice may be under-represented but this may be
associated with differences in question wording on the classification of the type of

Chapter 6: Discussion 183
work between study respondents and respondents to the RCVS Survey of the
Profession 2006.
Comparison of the demographic and occupational profiles of study respondents with
those of the original sample provides evidence that there may be a degree of non-
response bias associated with a higher response rate among women and differences in
response rates across years of qualification. Response rates to surveys are typically
higher among women (Wilkins and others 1997). The gender difference in response
rate may explain in part the lower response rates for graduates of 1950-1959 and
1960-1969, as the gender balance among older members of the profession favours
men (see Figure 3.2). There is no statistical difference in response rate across the
broad work types: general practice, charity, government, university and
industry/outside the profession.
The analysis to identify any differences between outcome measures for late
responders and all earlier responders showed that the mean HADS-D score is
significantly higher for late responders than for earlier responders, which suggests that
non-responders may have higher levels of depressive symptoms. The mean HADS-A
score and 12-month prevalence of suicidal thoughts are also higher for late responders
and the mean WEMWBS score is lower for late responders but these differences are
not statistically significant. Consequently, population estimates based on survey
respondents may underestimate the true prevalence of psychological morbidity. The
reliability of using late respondents as a proxy for non-respondents in estimating non-
response bias is uncertain. According to Groves (2006), the weakness of this method
is that it offers no direct information about the non-respondents, instead relying on the
notion of a ‘continuum of resistance’ (p. 656) in which non-respondents should be
most similar to those respondents measured after a longer elapse of time and greater
efforts to remind them to respond. However, non-responders to surveys generally
have a higher prevalence of psychiatric disorders (Kessler and others 1994, Hansen
and others 2001), which supports the suggestion that estimates of the prevalence of
psychological morbidity in the current study are likely to be conservative.
Chapter 6: Discussion 184
Overall, in view of the degree of representativeness of respondents and the caveats
regarding possible non-response bias considered above, the results are considered
cautiously generalisable to the wider population of UK veterinary surgeons.
6.1.2 Precision of population parameter estimates
Confidence intervals (CIs) provide a measure of the precision of sample statistics as
estimates of true values in the wider target population. They represent a plausible
range of values for the population parameter. In the current study point estimates of
prevalence ranging from, for example, 5.5% (non-drinkers) to 48.4% (anxiety non-
cases) have CIs of ± 1.1 to ± 2.3 respectively at 95% confidence level. This means
that there is a 95% confidence that the true value of a population parameter lies within
the estimated range of values bound by the CI for each sample statistic. This level of
precision was considered acceptable.
6.2 Differences across the study population
Study hypothesis 1 (H11). Self-reported measures of mental ill-health,
mental well-being and psychosocial working conditions differ significantly
with demographic factors (such as age, gender) and occupational factors
(such as type of work, employment status, and hours worked in a typical
week). (Section 1.2)
The study results suggest that veterinary surgeons are not a homogeneous group in
regard to the population parameters estimated. There is strong evidence (p<0.01) in
support of the study hypothesis that there are differences in reported measures of
mental ill-health and well-being among different age, gender and occupational groups
within the profession.
6.2.1 Demographic factors
Female veterinary surgeons have significantly higher HADS-A mean score and
proportion of HADS-A cases, and are at greater odds of HADS-A caseness after
adjustment for age. Moreover, the mean WEMWBS score is significantly lower for
Chapter 6: Discussion 185
females than males after adjustment for age and female veterinary surgeons report less
favourable psychosocial working conditions in control, relationships, role and change
domains and higher scores for the key perceived veterinary-work-related stressors.
However, the differences between men and women in HADS-D mean score and
caseness, the 12-month prevalence of suicidal thoughts, and the mean score for
negative work-home interaction are not statistically significant. The higher levels of
psychological symptoms reported among women is consistent with the findings of
recent reports of psychological symptoms among the general population of Great
Britain (Singleton and others 2001, Singleton and Lewis 2003) and veterinary
surgeons in Australia (Fritschi and others 2009), New Zealand (Gardner and Hini
2006) and Finland (Reijula and others 2003). The gender difference in perception of
psychological working conditions, especially in regard to control, is in keeping with
other studies that consider gender-related differences in stress which also demonstrate
higher prevalence of stress or related outcomes in women (such as, de Smet and
others 2005). In common with the general population (Coulthard and others 2002,
Farrell and Marshall 2006), male veterinary surgeons are more likely to drink, to
drink more often, and to drink more heavily on each occasion than females.
After adjustment for gender, the odds of HADS-A caseness and at-risk drinking both
decrease and the WEMWBS score increases significantly with increasing age. A
similar pattern of declining prevalence of hazardous drinking with increasing age
occurs in the general population (Coulthard and others 2002). However, the
relationship among veterinary surgeons between WEMWBS score and age adjusted
for gender (the score increases with increasing age) is not apparent in the general
population sample reported by Braunholtz and others (2007). Scores for each of the
psychosocial working conditions stressor domains generally increase (more
favourable working conditions) with increasing age group. The mean score for
negative work-home interaction decreases with increasing age. For veterinary-work-
related stressors, mean scores for recent graduates are higher than for respondents
who have been graduated for over 5 years for all personal and general work-related
stressors (except addictive behaviours, administrative and clerical tasks, financial
expectations of the business, and non-financial business management) and all clinical
work-related stressors. Similar findings of higher levels of psychological distress
among younger veterinary surgeons have been reported previously (Reijula and others

Chapter 6: Discussion 186
2003, Gardner and Hini 2006, Fritschi and others 2009). Two possible explanations
are offered. First, skills for coping develop with age-related experience of both work
and life. The level of work-related autonomy in the veterinary profession is relatively
high and this affords the opportunity to develop skills for dealing with job stressors. A
second possible explanation is that self-selection processes may mean that older
veterinary surgeons who found work stressful have left the profession and are not
represented in the study sample. However, only 3% of respondents to a recent survey
of the profession in the UK reported that they planned to leave the profession
prematurely within the next year; albeit mainly due to dissatisfaction with the work
hours or stress (Robinson and Hooker 2006). There is no association between age and
HADS-D caseness or the 12-month prevalence of suicidal thoughts between age
groups. The latter is in common with Norwegian physicians (Hem and others 2000),
but in contrast to the statistically significant decline in prevalence with increasing age
observed in the general population in Great Britain (Meltzer and others 2002, Dennis
and others 2007).
6.2.2 Occupational factors
After adjustment for gender and age, veterinary surgeons working in non-clinical
roles in universities have significantly lower estimated odds of HADS-A caseness
than those working in small animal practice. Part-time assistants have marginally
significant lower estimated odds of at-risk drinking than sole principals and
respondents of practices owned by a charity have marginally significant lower odds of
at-risk drinking than those owned by a sole principal. Veterinary surgeons in mixed
practice have significantly lower odds of reporting suicidal thoughts than those in
small animal practice; and full-time assistants have significantly higher odds than sole
principals. The mean WEMWBS scores for veterinary surgeons working in clinical
and non-clinical roles in universities are significantly higher than those working in
small animal practice, and there is variation in the mean psychosocial working
condition score for the majority of stressor domains across occupational factors.
There were few associations in the study results between hours worked or on-call in a
typical week and psychological health. An increase in the number of hours worked in
a typical week is associated with a small but statistically significant increase in the
Chapter 6: Discussion 187
odds of reporting suicidal thoughts. The odds are not associated however with an
increase in the number of hours on-call in a typical week. Reported working
conditions for demands, managerial support and peer support domains are least
favourable for those working the highest number of hours and the mean negative
work-home interaction score increases progressively as number of hours worked in a
typical week increases.
None of the occupational factors in the study is consistently associated with mental
health or well-being across the outcomes measured. However, small animal practice is
associated with significantly higher levels of anxiety symptoms (HADS-A) and 12-
month prevalence of suicidal thoughts, and lower positive mental well-being
(WEMWBS) than some of the other work types. This is consistent with the
perceptions of New Zealand veterinary surgeons that small animal practice is more
stressful than other types of work (Gardner and Hini 2006). By contrast, there was no
relationship between type of practice and the psychological health parameters
measured in a study of Australian veterinary surgeons and the authors’ explanation
was that individuals probably chose the type of practice within which they are most
comfortable working (Fritschi and others 2009). There was no association between
HADS scores and hours worked or on-call in the current study. Kleppa and others
(2008) reported an association between long work hours (over 40 hours per week) and
increased levels of anxiety and depressive symptoms, with an apparent dose-response
relationship between work hours and symptoms. Studies among young doctors have
also failed to show an association between working long hours and mental ill-health
(Tyssen and Vaglum 2002). By contrast, increasing hours of work was associated
with a small increase in anxiety and depressive symptoms in the Australian study
(Fritschi and others 2009).
6.3 Comparison with normative groups
Study hypothesis 2 (H12). The veterinary profession has higher levels of
mental ill-health, lower levels of mental well-being and less favourable
psychosocial working conditions, when compared to the general
population. (Section 1.2)

Chapter 6: Discussion 188
There is strong evidence (p<0.01) in support of the study hypothesis that the
veterinary profession has higher levels of mental ill-health and lower levels of mental
well-being than the general population. There is further strong evidence that
psychosocial working conditions are less favourable in demands and support stressor
domains. However, veterinary surgeons are estimated to report more favourable
working conditions for the other stressor domains (including control and
relationships), and this direction of difference does not support the study hypothesis.
6.3.1 Anxiety and depressive symptoms
The prevalence of anxiety and depressive symptoms reported in the current study is
significantly higher than among a non-clinical sample of the UK general population
(Crawford and others 2001). Different types of occupation are associated with
different risks for common mental disorders (Stansfeld and others 2003). Sanne and
others (2003) demonstrated in a Norwegian population-based study that HADS-A and
HADS-D scores differed significantly between occupational groups. HADS scores
showed a distinct and inverse relationship with skill levels, most strongly observed for
HADS-D scores among men. Manual occupations (such as labourers in agriculture,
construction and manufacturing) consistently showed higher-than-average HADS
scores. The clinical significance of the differences was established by demonstrating a
strong association between skill level and HADS-D caseness (score ≥ 8) for both
genders. Although anxiety symptoms showed a similar association with skill levels,
the patterns were weaker and may not be clinically relevant.
Depression (Harris and Barraclough 1997), anxiety (Sareen and others 2005) and co-
morbid depression and anxiety (Sareen and others 2005, Hawgood and De Leo 2008)
amplify the risk of suicide and suicidal behaviours. The current study provides
evidence that these disorders may play a role in the elevated suicide rate among the
veterinary profession.
6.3.2 Alcohol consumption
Veterinary surgeons are more likely to be drinkers, and drink more frequently than the
general population, but consume less on a typical drinking day and have a prevalence
Chapter 6: Discussion 189
of daily and weekly binge drinking (6 or more units on one occasion) that is similar to
the general population (Coulthard and others 2002, Farrell and Marshall 2006). A
greater proportion of veterinary surgeons are at-risk drinkers than among the general
population. The magnitude of the difference between the prevalence of at-risk
drinkers in the veterinary profession and the general population is more marked for
women than for men. While employed men generally drink more than employed
women, women’s drinking is known to increase with certain types of employment
(Ames and Rebhun 1996).
Among the general population, income and higher educational level are generally
associated with higher rates of reported hazardous drinking (Coulthard and others
2002) so it is possible that the proportion of at-risk veterinary surgeons may be no
higher than a general population sample of similar socio-economic status. However,
no appropriate data has been identified to validate this hypothesis.
The similarity in the prevalence of daily binge drinking between veterinary surgeons
and the general population may imply that the rates of alcohol dependence are similar.
However the use of a more comprehensive instrument for measurement of alcohol-
related problems – such as the full AUDIT (Saunders and others 1993) or the Severity
of Alcohol Dependence Questionnaire (SAD-Q) (Stockwell and others 1983) – would
be required to validate this. The PMRs for alcohol-related deaths among male and
female veterinary surgeons aged 20-64 years in England and Wales 1993-2005 are
lower than for the general population, although the differences are not statistically
significant (Mellanby and others 2008). This is supportive of the suggestion that the
rates of alcohol dependence may be similar.
Self-report measures of alcohol consumption demonstrate reasonable levels of
reliability and validity (Del Boca and Darkes 2003). However, some caution must be
exercised in comparing the current study’s AUDIT-C results with those for the
general population. The surveys differ in mode of administration: both involved self-
completion of responses but the Psychiatric Morbidity among Adults living in Private
Households, 2000 survey used computer-assisted personal interviewing (CAPI), in
which the respondents entered their responses to the alcohol-related questions directly
into a laptop computer in the context of a face-to-face interview with a researcher
Chapter 6: Discussion 190
(Coulthard and others 2002). This may lead to greater under-reporting than in a postal
survey but higher response rates associated with the face-to-face interview may
reduce selective non-response among heavier drinkers (Knibbe and others 2006).
Levels of alcohol consumption among doctors are generally reported to be high: for
example, a recent survey of Swiss doctors demonstrated a lower prevalence of non-
drinkers and a higher prevalence of at-risk drinkers than among the general population
(Sebo and others 2007). However, there is some evidence to suggest that doctors’
alcohol consumption is declining (Baker 2008, Rosta 2008).
Alcohol has a well-established role in suicidal behaviour through its induction of
negative affect, promotion of adverse life events, impairment of problem-solving
skills, disinhibitory effects and the social disintegrative effects of abuse (Brady 2006).
The quantity of alcohol consumed per drinking day is positively associated with
increased risk of suicide (Mukamal and others 2007). However, although alcohol
consumption is elevated among veterinary surgeons relative to the general population
as a whole, it is possible that the proportion of at-risk veterinary surgeons may be no
higher than a general population sub-group of similar socio-economic status and not
contribute to an explanation of the elevated suicide rate.
6.3.3 Suicidal thoughts
The estimated 12-month prevalence of suicidal thoughts among veterinary surgeons is
significantly higher than among the general population of Great Britain (Meltzer and
others 2002) and Norwegian physicians (Hem and others 2000), in cross-sectional
studies which asked identical suicidal ideation questions.
Suicidal thoughts are a key stage in the pathway leading to suicide (Gunnell and
Harbord 2003). Two possible explanations are offered for the higher prevalence of
suicidal thoughts among veterinary surgeons. First, ready access to means of suicide
is posited as a key factor that influences the translation of suicidal thoughts into an
actual suicide act (Hawton 2007), but it may also act more distally in the suicide
process and account for the high prevalence of suicidal thoughts among veterinary
surgeons, if the ease at which a suicide can be completed cues the consideration of

Chapter 6: Discussion 191
suicide as a possible solution. Second, the high prevalence of suicidal ideation among
veterinary surgeons may be associated with the profession’s acceptance of and
familiarity with animal euthanasia which may change attitudes to suicide as a possible
solution to their own problems. Positive associations have been demonstrated between
favourable attitudes towards suicide (the degree to which an individual views suicide
as an acceptable option under some circumstances) and levels of suicidal thoughts
(Etzersdorfer and others 1998, Gibb and others 2006). Favourable attitudes towards
suicide appear to increase the attractiveness of suicide should situational cues arise,
placing an individual at increased risk of suicidal ideation.
6.3.4 Mental well-being
The estimated mean WEMWBS scores for veterinary surgeons and for male and
female veterinary surgeons separately, are significantly lower than the corresponding
means for representative general population samples from Scotland (Braunholtz and
others 2007, Stewart-Brown and Janmohamed 2008).
For the Scottish general population, WEMWBS score is positively associated with
higher socio-economic status and higher age at leaving full-time education,
(Braunholtz and others 2007, Tennant and others 2007, Stewart-Brown and
Janmohamed 2008). Veterinary surgeons comprise an occupational cohort of
relatively homogeneous high socio-economic status so lower scores for this group are
unexpected.
A possible explanation for lower WEMWBS scores among veterinary surgeons is the
higher levels of parameters of mental ill-health in this population, as WEMWBS score
showed significant moderate-sized negative correlations with measures of mental ill-
health among the general population (Tennant and others 2007, Stewart-Brown and
Janmohamed 2008).
6.3.5 Psychosocial working conditions
Veterinary surgeons self-reported less favourable working conditions (higher risk of
work-related stress) than the UK working general population (Edwards and others

Chapter 6: Discussion 192
2008) for the demands (workload and working patterns), managerial support (level of
support from the organisation and line management in terms of encouragement,
sponsorship and resources) and peer support (level of encouragement and support
from peers) stressor domains of HSE MSIT. The size of the difference is greatest for
demands and managerial support; scores are in the 10th-25th and 5th-10th percentiles of
organisations in the general population sample respectively. The score for the
managerial support stressor domain also appears lower than among the UK nursing
profession (Royal College of Nursing 2006) but insufficient data are available in the
report on the nursing profession to make a valid comparison. By contrast, more
favourable working conditions than the general population were self-reported by
veterinary surgeons for the other stressor domains of HSE MSIT. The size of the
difference is greatest for relationships (the quality of relationships between colleagues)
and change (management and communication of organisational changes); both scores
are in the 75th-90th percentile of organisations in the general population.
The mean score of the overall scale for veterinary surgeons is significantly lower than
the mean score of the overall scale for the general population and the score is in the
25th-50th percentile of organisations in the general population sample which suggests
that, when all the stressor domains are taken into consideration, veterinary surgeons
report less favourable working conditions. However the interpretation of a single
global measure of working conditions derived from the aggregated sub-scales requires
some caution as current evidence does not support the implicit assumption that each
of the component domains carries equal weight in terms of potential health effects.
The stressor domains relating to job content (demands, support, and control) have a
more substantial evidence base for health effects than the others which relate to job
context (MacKay and others 2004, Mustard 2004). When work is characterised by a
combination of high demands and high control, as reported by veterinary surgeons
relative to the general population in the current study, Karasek (1979) defines the job
as ‘active’ (p. 288) and postulates that the effect of demands on work-related stress is
buffered by the opportunity for significant use of discretion and judgement. An active
job setting is thought to promote learning and development of new behavioural
patterns leading to increased feelings of mastery and confidence which may ‘help the
person to cope with the inevitable strain-inducing situations of the job’ resulting in

Chapter 6: Discussion 193
‘increased capacity to accept still more challenging situations, which promote still
more learning and positive personality change’ (Karasek and Theorell 1990, p. 103).
The two separate components of job strain, high demands and low control, can each
have adverse health effects in the absence of the other, though the effects of high
demands are weaker than those of low control, and when the two components occur in
combination their effects seem to be additive rather than multiplicative, in contrast to
Karasek’s original hypothesis (Stansfeld and Candy 2006, Siegrist 2008). Low
occupational social support exacerbates stressful experience whereas higher levels
buffer against adverse health effects. It is possible that any buffering of high demands
by the high control reported in the current study is attenuated by the low levels of
occupational social support perceived.
Psychosocial working conditions may be important risk factors contributing to
suicidal behaviours (Ostry and others 2007) and studies have demonstrated a causal
association between work stress and rates of depression and anxiety (Melchior and
others 2007, Waldenström and others 2008). HADS-A and HADS-D scores have been
shown to increase with increasing demands, decreasing support and decreasing
control, independently (Sanne and others 2005). The risk extends beyond mental
health – findings from the Whitehall studies of British civil servants linked
psychological distress to a subsequent higher risk of coronary heart disease, especially
among men (Stansfeld and others 2002).
Caution must be exercised in comparing the current study’s results with those for the
general population and nurses due to the possible influence of, for example, socio-
demographic factors. Demographic information is not available for the general
population sample (Edwards and others 2008), and the gender balance of the nursing
workforce is predominantly female (Royal College of Nursing 2006). In addition, the
majority of the organisations in the general population sample are public sector
(Edwards and others 2008). Most veterinary surgeons in the UK work in the private
sector and working conditions within private sector organisations may be substantially
different from the general population sample.
The evidence of higher psychological demands and lower social support at work than
among the general population suggests that these elements of the psychosocial work

Chapter 6: Discussion 194
environment may play a role in the aetiology of elevated psychological symptoms and
suicide among veterinary surgeons.
6.3.6 Work-home interaction
The mean WHI_N score is significantly higher than for the working population from
the Netherlands (Geurts and others 2005) and significantly lower than for Belgian
veterinary surgeons (Hansez and others 2008); the mean WHI_P score is higher than
for the working population from the Netherlands and lower than for Belgian
veterinary surgeons. The results suggest that veterinary surgeons report higher levels
of both negative and positive work-home interaction than the working general
population, but comparisons must be interpreted very cautiously due to possible
cultural differences in interpretation of the scale items and the small size of the
Belgian sample.
The WHI_N and WHI_P scales use only self-reported information which may be
biased. Future research could take this limitation into account by using multiple
sources of information (for example, the respondent’s family) to obtain a wider
perspective of the interaction between work and home.
6.4 Critique of study instruments in the context of study aims and hypotheses
Candidate instruments were carefully reviewed and evaluated against selection
criteria to optimise the operationalisation of the elements of mental health and well-
being relevant to the study aims and hypotheses (Sections 3.2, 3.3 and 3.4). It is
considered that the instruments selected performed this function well. However, it is
important to recognise that there may be relevant elements of mental health and well-
being that the selected instruments were unable to explore adequately.
Although depression and anxiety are among the most important antecedents of suicide
and HADS can indicate caseness in a variety of settings (Bjelland and others 2002),
the scale does not reflect the prevalence of more severe mental disorders known to
increase suicide risk which may be relevant in this population. Moreover, HADS does
not include somatic symptoms of anxiety and depression (such as fatigue and

Chapter 6: Discussion 195
insomnia). Inadequate sleep is associated with psychological ill-health among doctors
(Firth-Cozens 2001) and insomnia is a risk factor for the development of anxiety and
depressive symptoms (Neckelmann and others 2007) and for suicide in the context of
major depressive disorder (McGirr and others 2007).
The AUDIT-C cannot differentiate between at-risk drinkers and dependent drinkers;
the use of a more comprehensive instrument for measurement of alcohol-related
problems would be required to determine the proportion of dependent drinkers.
The current study could have been improved by asking respondents who reported
suicidal thoughts what they thought may have influenced those thoughts and offering
them a number of possible work-related and non-work-related problems as response
options. Hem and others (2000) used this approach and identified that physicians
attributed their suicidal thoughts to mainly non-work-related problems. The causal
attribution of suicidal thoughts among veterinarians could be explored through semi-
structured interviews in a possible subsequent qualitative phase of the study.
The HSE MSIT is termed an ‘indicator tool’ to reflect its ability to provide only a
broad indication of perceptions of working conditions in the context of risks
associated with work-related stress (Cousins and others 2004). Follow-up with
qualitative studies would provide a greater depth of understanding. Demands are
diverse in nature; the demands scale used measures psychological demands (i.e.
workload) but may not have captured the emotional demands (such as dealing with
death, illness, and grief) or physical demands (such as constrained standing, and
handling animals or equipment) in the complex work setting of the veterinary
profession. There is some evidence that these specific aspects of demands relate to
different outcomes for common mental disorders among healthcare professionals (de
Jonge and others 1999). In the current study, physical demands and dealing with
client grief were reported to contribute quite a lot or very much to the stress felt by 9.8
percent and 15.4 percent of respondents respectively (see Section 5.8).
Similarly, the other stressor domains of the HSE MSIT may also fail to capture
relevant elements of veterinary work milieus. For example, the control scale used
captures the decision authority (control over the working environment) element of

Chapter 6: Discussion 196
decision latitude but does not capture skill discretion (variety of work and opportunity
for use of skills). Additional risk factors for mental ill-health that are not captured by
any of the domain scales include job insecurity (Stansfeld and others 2008) and
exposure to work-related violence and threats (Wieclaw and others 2006b). However,
neither is reported in the literature as a stressor of veterinarians (see Section 2.4.1.5)
so the impact of omitting their measurement may be minimal. Furthermore, security
of tenure is generally high within the veterinary profession as most jobs are
permanent positions and unemployment is low. The concept of organisational justice,
especially the relational component (respect from and fairness of treatment by
supervisors), is another important dimension of the psychosocial work environment
not captured by scales based on the established theoretical models and may predict
minor psychiatric morbidity independently of other measures (Ferrie and others 2006,
Kivimäki and others 2007). However, there may be some overlap between relational
justice and measures of relationships and managerial support used in the current
study. The inclusion of measurements of effort-reward imbalance in the study would
have provided a more comprehensive assessment of psychosocial work characteristics
as it has been shown to contribute to the risk of mental disorder independently of
other dimensions of the psychosocial work environment (Dragano and others 2008).
The low frequency of complete responses for the managerial support domain among
respondents who identified their position in the practice as sole principal or
partner/director was probably because the questions were perceived as irrelevant due
to the seniority of their positions and their scores may therefore be unreliable.
The demand-control-support (Karasek 1979, Karasek and Theorell 1990) and effort-
reward imbalance (Siegrist 1996) models of work-related stress consider only key
aspects of the psychosocial work environment and do not capture other dimensions of
life which may influence workers’ mental health, such as the family with whom they
live and the society within which they are embedded (Loretto and others 2005, Wang
2006). The current study attempted to adopt a comprehensive perspective by
examining, in addition to psychosocial working conditions, the influence of
interactions between work and home on mental health and well-being. A study of the
psychological health of employees within the UK National Health Service followed a
similar approach (Loretto and others 2005). However there is scant suitable normative
Chapter 6: Discussion 197
data available for scales measuring work-home interaction and the SWING scale
(Geurts and others 2005) used in the current study is no exception.
Potential veterinary work-related stressors were assessed using a series of bespoke
items developed through focus group input and refined following pre- and pilot-
testing. The psychometric properties of this instrument have not been examined.
6.5 Strengths and limitations of the study
6.5.1 Strengths
The study is based on a large nationwide sample of veterinary surgeons in a range of
different types of employment.
The response rate of 56.1% is less than optimal but compares favourably with other
postal surveys of the veterinary profession (cf. Hansez and others 2008, Gardner and
Hini 2006, Mellanby and Herrtage 2004), which may reflect a high level of personal
salience of the subject of mental health to the sample population. The response rate
was achieved despite intermittent disruption to the national postal service due to
industrial action around the time of questionnaire distribution and return. The
demographic and occupational profile of respondents is broadly representative of the
UK veterinary profession. Consequently weighting factors to adjust for differences
between the composition of the sample and the target population were not applied in
statistical analyses. Comparison of the demographic and occupational profile of
respondents with that of the original sample and comparison of key mental health
variables between late and earlier responders (see Sections 5.10 and 6.1.1), suggests
that there may be a degree of non-response bias but overall the results are considered
cautiously generalisable to the wider population of veterinary surgeons practising in
the UK.
The study adopts a comprehensive approach by including measures of positive mental
health and work-home interaction and identifying the greatest sources of pleasure in
veterinary work, in addition to indicators of psychological morbidity.

Chapter 6: Discussion 198
The questionnaire uses standard instruments with known psychometric properties to
help ensure the validity and reliability of the results and availability of normative data.
The short series of bespoke questions on stressors pertinent to the veterinary
profession was developed with input from a focus group and pre- and pilot- tested to
help ensure relevance, comprehensiveness and absence of bias.
The study makes a number of important findings which provide evidence in support
study hypotheses 1 and 2 (Section 1.2). The veterinary profession is a heterogeneous
group in terms of mental health and well-being with differences associated with a
variety of demographic and occupational variables including age, gender, type of
work, and employment status. The main reported contributors to stress are: the
number of hours worked; making professional mistakes; the possibility of client
complaints or litigation; client expectations; unexpected clinical outcomes; and out-
of-hours on-call duties. Compared to the general population, veterinary surgeons
report higher levels of anxiety and depressive symptoms; higher 12-month prevalence
of suicidal thoughts; less favourable psychosocial working conditions in regard to
demands and managerial support; lower levels of positive mental well-being; and
higher levels of negative work-home interaction.
The study has also helped to explore elements of the proposed hypothetical model to
explain the increased risk of suicide among veterinary surgeons, described in Section
2.4.2. The evidence that veterinary surgeons report higher levels of psychological
distress suggests that their higher suicide risk is not entirely associated with access to
and knowledge of means of harm. The reporting of less favourable psychosocial
working conditions in the domains of demands, managerial support and peer support
suggests that workplace factors may play a role in the higher levels of psychological
distress reported and the increased occupational risk of suicide. The elevated
prevalence of anxiety symptoms among veterinary surgeons suggests that anxiety may
play a role in the increased risk of suicide within the profession and it should
therefore be incorporated into the hypothetical model. The level of alcohol
consumption does not appear to be a negative influence on mental health within the
profession as a whole.
The study has achieved all the objectives listed in Section 1.1.

Chapter 6: Discussion 199
6.5.2 Limitations
The data are limited by the cross-sectional design which allows investigation of
associations but does not allow conclusions to be drawn about the direction of
causality. Cross-sectional studies measure risk factors and disease status
contemporaneously. It is therefore possible that concurrent psychiatric disorder might
distort an individual’s reporting of factors such as work-related demands and social
support, leading to biased estimates of their association with mental health and well-
being. Prevalence-incidence bias may occur when possible risk factors such as the
quality of relationships and current employment status may result from, rather than
cause, psychiatric disorder (Gunnell and Harbord 2003). For example, some of the
veterinary surgeons surveyed may have altered their career trajectory by electing to
take early retirement, work part-time or change their type of work within the
profession for reasons relating to their mental health and well-being, thereby
distorting patterns of association in the data. Psychological distress can select people
into increasingly disadvantaged working conditions over their life course (Stansfeld
and others 2008).
In addition, unhealthy individuals are generally excluded from the workforce and
consequently morbidity in the workforce is usually lower than in the general
population (the ‘healthy worker effect’) (Li and Sung 1999). Any attrition from the
veterinary profession for reasons related to mental health may have biased the results
as these individuals will not necessarily have been included in the population sampled.
Questionnaires were mailed to the veterinary surgeons’ preferred mailing address for
receipt of mailings from the database; those sent to work rather than home addresses
may have led to a bias towards healthy workers, omitting those absent from work at
the time through illness. These effects would lead the study to under-report the
prevalence of psychological morbidity.
A further limitation in the study methodology is bias related to the self-reporting of
symptoms and working conditions. Mental health can influence perceptions of work
characteristics (Stansfeld and Candy 2006). Social desirability response bias (a
tendency to overestimate desirable traits and underestimate undesirable traits when
using self-report measures) can also distort results, although self-administered
Chapter 6: Discussion 200
questionnaires are less prone to the latter than face-to-face interviews (Bowling 2005).
Associations between symptoms and working conditions may be overstated as
measures of both exposure and outcome are based on individuals’ perceptions
(common method variance) (Theorell and Hasselhorn 2005). For practical and
economic reasons it was not possible to validate self-reported perceptions and
symptoms with objective independent measures of exposure and outcome such as
assessments of the work environment using external observer-rated work analysis, or
structured clinical interview measures of psychiatric disorder, respectively. Most
previous studies in this research area have also relied on subjective accounts of work
stressors and symptoms of mental disorders (Stansfeld and Candy 2006, Waldenström
and others 2008).
The content of the questionnaire may have led to some selection bias. Veterinary
surgeons with mental health problems may have been disinclined to respond due to
their symptoms or concerns that they might be identified, or conversely those without
mental health problems may have considered that the questionnaire was not relevant
to them. The time constraints of a demanding workload might reduce the likelihood of
responding, or conversely those dissatisfied with their working conditions might be
more inclined to respond in order to express their opinion. Knowledge of a colleague
with mental health problems might also increase the likelihood of response. In order
to help militate against selection bias, the covering letters accompanying mailed
copies of the questionnaire encouraged completion and return the questionnaire
‘regardless of … any past or present experience of stress or mental health problems’
(see Appendix II).
The sequential order of presentation of composite measurement scales within a
questionnaire may influence the pattern of responses (Lucas 1992). The possibility of
an order effect requires caution in the comparison of results across studies in which
the scales may not have been presented in the same order or context. No attempt was
made to control for any possible order or contextual effects in the current study by, for
example, systematically rotating the order of instruments within the questionnaire and
counterbalancing the order of completion across participants.

Chapter 6: Discussion 201
Care was taken during pilot testing of the bespoke questions on veterinary work-
related stressors to attempt to avoid any leading words or phrases which could bias
respondents to answer one way or another (Section 4.1.2). However, it is possible that
some of the self-developed section headings used on the final questionnaire may have
influenced responses. For example, ‘Work-related stress’ (Section F) may have been
more appropriately titled ‘Working conditions’.
The use of multiple scales in the questionnaire, each requesting responses based on a
different time frame, may have caused some confusion. For example, HADS
responses are required to be based on the past week; suicidal thoughts on the last
twelve months; WEMWBS on the last two weeks; and no time frame was specified for
the batteries of work-related stress and work-home interaction questions. However,
the time frames were deliberately not standardised as this would potentially influence
the psychometric properties of the scales and reduce comparability of the results with
normative data.
The survey did not collect information on some potentially relevant mediating or
moderating variables such as marital status, adverse work and life events, attitudes to
euthanasia and suicide, history of any previous psychological distress, family history
of affective disorder, use of prescribed or non-prescribed psychotropic medication,
duration of exposure to possible explanatory variables (e.g. length of time in current
job), social network size and perceived social support outside work, or personality
factors such as negative affectivity, attributional style and social desirability response
bias, which may have confounded associations without adjustment for them (model
misspecification). Another potential source of residual confounding in the current
study is the nature and extent of social and leisure activities outside work, which have
been shown to be protective of mental health among veterinarians with unfavourable
work characteristics (Shouksmith and Hesketh 1986).
In addition, comparison of measures of mental health and well-being with those for
the general population must be undertaken with great care due to the possible
influence of variables including socio-demographic factors.

Chapter 6: Discussion 202
6.6 Implications for research
A qualitative in-depth interview study using a relatively open interview schedule with
participants purposively selected from those respondents in the current study sample
who confirmed their willingness to participate in further research could further
explore the findings. The sample could be selected on the basis of discrepant patterns
between work characteristics and mental health (for example, high work-related stress
and good mental health or low work-related stress and poor mental health). Interviews
would provide an opportunity for in-depth exploration of the personal experiences and
perceived contexts of veterinary surgeons’ working lives and to develop explanations
for the observed discrepant patterns. This method may also uncover new and
unanticipated themes which are relevant to the study hypotheses. Interviews of
respondents reporting suicidal ideation may identify trends in factors considered to
have influenced those thoughts and could explore help-seeking behaviours and
perceived barriers to help-seeking. Over 53.2 percent of all respondents provided their
names and contact details in order that they might be considered to participate in a
possible subsequent interview. Such mixed methods research, integrating qualitative
and quantitative data, holds potential for a more comprehensive understanding of
mental health and well-being in the profession.
Prospective longitudinal studies would help to determine whether the cross-sectional
associations identified in the current study are causal. The mental health and well-
being of the cohort of respondents who voluntarily identified themselves in the
current study could be followed up over time for this purpose. A multiphase design
with cause and effect variables measured at each phase would help to determine the
rate of change of possible causal relationships and allow for the examination of
reciprocal effects (Taris and Kompier 2003).
The current study focuses on practising veterinary surgeons. However, each stage of
the veterinary career path – from the characteristics of applicants to veterinary schools,
undergraduate training, subsequent employment, and through to retirement – requires
examination, to identify early predisposing factors and later triggers for suicidal
behaviour in the profession. This ‘life course’ approach to studying suicide (Gunnell

Chapter 6: Discussion 203
and Lewis 2005) will enable multiple points on the career continuum to be targeted
with appropriate interventions.
Research with veterinary students could help identify if there is a predilection towards
mental health problems in applicants to veterinary school, whether there are negative
influences on mental health during undergraduate training, and whether individual-
specific maladaptive coping strategies might play a role in the development of mental
ill-health.
An investigation based on examination of coroners’ records on veterinary surgeons’
deaths which received a verdict of suicide or undetermined cause is planned
(Mellanby 2008). This will provide insight into the circumstances of suicides in the
profession and help to identify proximal risk factors.
The role of attitudes towards suicide should be considered when investigating
differences in suicide rates between population groups (Etzersdorfer and others 1998).
It has been suggested that attitudes towards suicide (the degree to which an individual
views suicide as an acceptable option under some circumstances) may moderate the
link between hopelessness and depressive symptoms and levels of suicidal ideation
(Gibb and others 2006). Attitudes can also influence help-seeking behaviour. The
veterinary profession’s role in the provision of animal euthanasia and the facilitation
of a ‘good death’ may normalise suicide, with death perceived as a rational solution to
intractable problems. There has been no rigorous examination of this hypothesis to
date. Data on attitudes towards suicide could be collected using, for example, items
from the Suicide Opinion Questionnaire (Domino and others 1982).
Consideration should be given to developing an occupation-specific instrument to
measure psychosocial working conditions within the veterinary profession which can
be incorporated into some form of risk management framework.
The development of international research collaborations may help to identify
countries in which suicide risk among veterinary surgeons is not elevated compared to
the general population. Exploration of the possible reasons may inform the
development of interventions for those countries in which the risk is higher.

Chapter 6: Discussion 204
There is scope for further research in the veterinary profession on the relationship
between objectively measured job stressors and common mental disorders, on the
mediating and moderating pathways between work characteristics and mental
disorders, and the pathways from prior mental health to current work conditions and
mental disorders.
Translational research is required to develop interventions which will then need to be
piloted and their effectiveness and utility evaluated across the range of different
veterinary work settings.
6.7 Implications for the profession
The current study demonstrates that, relative to the general population, the veterinary
profession reports higher levels of anxiety and depressive symptoms; higher 12-month
prevalence of suicidal thoughts; less favourable psychosocial working conditions in
relation to demands and managerial support; lower levels of positive mental well-
being; and higher levels of negative work-home interaction.
These observations have numerous implications for the veterinary profession and
ongoing advocacy will be required across a range of stakeholders within the
profession to demonstrate the need for and encourage the development and
implementation of suitable interventions. The establishment of a single collaborative
body with a mandate from all the key veterinary professional organisations to provide
direction to and co-ordination and integration of initiatives which attempt to improve
psychological health within the veterinary profession would help to ensure a unified
strategy and maximise effectiveness.
Interventions to improve psychological health have been implemented effectively in a
variety of different work settings (Michie and Williams 2003). An occupation-specific
suicide prevention programme implemented in the US Air Force – aimed at
decreasing stigma, enhancing social networks, facilitating help seeking, and
enhancing understanding of mental health – reported success in lowering suicide rates
(Knox and others 2003).

Chapter 6: Discussion 205
Studies suggest that poor mental health among doctors is associated with, for example,
being irritable with patients, taking short-cuts and not following procedures, which
may markedly reduce standards of patient care (Firth-Cozens 2001, Taylor and others
2007). Given similarities between medical and veterinary practice, intervention is
important, not only for the well-being of individual members of the veterinary
profession, but also to safeguard veterinary public health and the health and welfare of
animals committed to veterinary care.
The structure of the UK veterinary profession is highly fragmented. Most practices
are small businesses without the benefit of dedicated human resource staff or
occupational health professionals to advance improvements in working conditions and
the management and health of employees. Employers have ethical and legal duties to
assess the risk of stress-related ill-health arising from work activities and take
measures to control that risk. However, a balance must be achieved between personal
and organisational responsibility for mental health and well-being; a comprehensive
programme of interventions including both individual-oriented and work
environment-oriented elements delivers the most favourable outcomes (Bond 2004,
LaMontagne and others 2007).
Rose ([1992] 2008) observed that the prevalence of many diseases in a population is
directly related to the population mean of the underlying risk factors: when there is a
small shift in the mean of a normal distribution there is a large shift in the tails of the
distribution. Consequently, shifting the mean of the risk factors in a population by
population-level interventions leads to a decline in the prevalence of the disease. The
prevalence of psychiatric disorder in a population is linearly related to the mean
number of psychiatric symptoms in that population (Anderson and others 1993,
Whittington and Huppert 1996). Anderson and others (1993) concluded:
Populations thus carry a collective responsibility for their own mental health and
well-being. This implies that explanations for the differing prevalence rates of
psychiatric morbidity must be sought in the characteristics of their parent populations;
and control measures are unlikely to succeed if they do not involve population-wide
changes. (p. 475)

Chapter 6: Discussion 206
It is important therefore that interventions within the veterinary profession are
directed at the level of the entire occupational population, rather than merely targeting
those in psychological distress.
The cross-sectional nature of the current study precludes inference of causality but the
results suggest a number of primary (preventive), secondary (ameliorative) and
tertiary (reactive) interventions, for both organisations and individuals, which have
the potential to reduce psychological distress in the profession. Consideration is given
to the concept of ‘countervailing interventions’ – those focused on increasing the
positive experience of work rather than decreasing the negative aspects – by
incorporating some of the sources of satisfaction identified in the current study as
these may help counteract the effects of workplace stressors (Kelloway and others
2008, p. 56). Proposed interventions are summarised in Tables 6.1 and 6.2. Research
is required to assess the effectiveness of these proposed interventions on the dual
outcomes of veterinary surgeons’ mental health and work performance in terms of
animal and client care (for example, reduction in complaints and litigation). This
approach applies the precautionary principle in recognising the need for further
research on interventions while simultaneously advocating that there is adequate
evidence from outside the veterinary profession to justify prompt concerted action,
and is in accordance with the assertions of Rose ([1992] 2008):
Certainty is not a prerequisite for action. …that action may then proceed alongside
continuing research and evaluation, recognising that new evidence may mean a
change of policy. (p. 145)
Employee participation in the process of introducing interventions can help to refine
interventions to optimise their fit within the context of a specific workplace and may
in itself help to diminish some dimensions of work-related stress (LaMontagne and
others 2007).
The following are possible areas for intervention to improve the mental health and
well-being of veterinary surgeons, based on evidence of need within the profession
and efficacy of such interventions in other fields.

Chapter 6: Discussion 207
6.7.1 Mental health promotion
Educational initiatives to improve mental health and well-being27 should be integrated
into the early undergraduate curriculum and made accessible to those already working
in the profession. Topics could include evidence-based techniques to: enhance intra-
and inter-personal adaptive coping skills; enable early recognition of mental ill-health
in oneself and others; recognise and engage suicidal colleagues and help them to stay
safe and seek further assistance; increase awareness of the dangers of alcohol misuse;
challenge stigma and discrimination; and enhance help-seeking behaviours. Peer-led
tuition could be provided by a national network of suitably trained veterinary
surgeons. Primary interventions at undergraduate level are likely to have the greatest
long-term benefit and be among the easiest to implement (Gerrity 2001). Timely
intervention with young people who show early signs of mental ill-health is important
as younger age of onset of depression is associated with greater suicidal intent,
irrespective of the age of onset of suicidal thoughts (Thompson 2008).
Consideration should be given to the production of a short educational video for use
in veterinary schools and conferences as part of an outreach campaign to raise
awareness of suggested measures to reduce the levels of psychological distress in the
profession.28
6.7.2 Monitoring of trends
The study provides a baseline of measures from which to monitor future change and
trends in mental health and well-being. The RCVS Survey of the Profession could
provide a suitable medium for such monitoring as it is mailed to the entire
membership and achieves a response rate of around fifty percent (Robinson and 27 Based on, for example, the protective behaviours training programme developed by Protective Behaviours (UK), Worcestershire, England; and suicide alertness skills (safeTALK) and intervention skills (ASIST) training programmes developed by LivingWorks Inc., Alberta, Canada. 28 The American Foundation for Suicide Prevention developed a public television documentary (Struggling in Silence) (broadcast in May 2008) and two educational videos for use within the medical profession as part of an outreach campaign to help reduce physician depression and suicide. Available at http://www.afsp.org/index.cfm?fuseaction=home.viewPage&page_ID=A8913D2A-B133-78B0-E7ADEB9D84C8B34B [Accessed 29 May 2008]. This is one of a series of initiatives to implement the recommendations of a workshop convened to devise a strategy to address mental health issues within the medical profession (Center and others 2003).

Chapter 6: Discussion 208
Hooker 2006).29 WEMWBS would be an appropriate instrument for inclusion in the
questionnaire as it is designed as a measure to capture population-level changes in
mental well-being and the current study demonstrates that the score is correlated with
other measures including anxiety and depressive symptoms, suicidal thoughts and
psychosocial working conditions. A shorter 7-item version of WEMWBS is also
available and benefits from brevity and more robust scaling properties than the full
scale (Stewart-Brown and others 2009). Monitoring would help in evaluating the
effectiveness of any interventions introduced.
6.7.3 Accessible and appropriate support services
There is a need to evaluate the effectiveness of existing initiatives to support mental
health in the UK veterinary profession (see Section 2.6) to determine whether
modification or additional provision is required. Consideration could be given to the
introduction of a telephone counselling service, possibly as part of an employee
assistance programme provided by individual veterinary employers or associated with
membership of a veterinary professional organisation, such as the British Veterinary
Association. Similarly, a conciliation service, using the skills and experience of those
with an intimate knowledge of the profession, may help resolve employment-related
disputes.
6.7.4 Working conditions
Veterinary surgeons self-report less favourable psychosocial work characteristics than
the working general population in relation to demands and managerial support. There
is consistent evidence from a number of cross-sectional and longitudinal studies that
high psychological demands, low decision latitude (control) and low social support at
work are predictive of mental ill-health (Stansfeld and Candy 2006, Bonde 2008,
Netterstrøm and others 2008). Working conditions are potentially modifiable and
improvements can enhance mental health and well-being. Successful interventions
that improve psychological health use training and organisational approaches to 29 The next RCVS Survey of the Profession is scheduled for the first quarter of 2010. Personal communication [e-mail] Gemma Robertson-Smith, Research Officer, Institute of Employment Studies, University of Sussex Campus, Brighton, UK. 04 May 2009.

Chapter 6: Discussion 209
increase participation in decision-making, increase support and feedback, and
improve communication (Michie and Williams 2003).
Veterinary surgeons should be provided with a manageable workload in relation to the
agreed hours of work with tasks matched to an individual’s skills and abilities, and
any concerns about their work environment addressed. Appropriate involvement in
management, decision-making and in the development of workplace policies is likely
to benefit employee mental health.
The development of a workplace culture in which there is regular constructive
feedback and problems are addressed sensitively should generate a more supportive
work environment. Opportunities for clinical supervision, mentorship and review
could be expanded and collaborative team-working encouraged. Deficiencies in
people-management skills, including supervision, team leadership and competence in
strategies for the prevention and reduction of work-related stress among employees,
could be identified and addressed in veterinary practices. Meetings to discuss stressful
work experiences appear to protect against suicidal ideation among female physicians
(Fridner and others 2009) which suggests that regular implementation of such
meetings may have similar value among veterinary surgeons. In the current study,
relationships with colleagues and clients are reported as important sources of work-
related satisfaction. Consequently, encouraging both formal and informal supportive
relationships between work colleagues and with clients has the potential to improve
mental health and well-being. The importance of workplace relationships has been
recently underscored by research associating poor team climate at work with
depressive disorders and subsequent antidepressant use (Sinokki and others 2009).
High levels of job satisfaction have been shown to protect doctors’ mental health
against the harmful effects of job stress (Taylor and others 2005). Interpersonal
relationships are a central theme of mental health promotion programmes (Stewart-
Brown 2005). Durkheim ([1897] 2006) observed over a century ago that the
frequency of suicide varied inversely with social cohesion:
…we might observe that since the strength of the collective is one of the obstacles
that best limits suicide, this cannot weaken without suicide rising. (p. 225)

Chapter 6: Discussion 210
…in a coherent and vital community, there is a continual exchange of ideas and
feelings from all to each and from each to all which is like mutual moral support, so
that the individual, instead of being reduced to his resources only, participates in the
collective energy and draws on it when his own is exhausted. (pp. 225-226)
While it may be facile to suggest that measures to improve social support within the
veterinary profession would make suicide less likely, the possibility should not be
discounted.
The structure of the veterinary profession is presently undergoing considerable
changes, including increasing numbers of women graduates, increasing numbers of
practices in corporate ownership, a decline in traditional mixed practice in favour of
specialisation, and a trend towards consolidation of farm animal practices into fewer
units covering larger geographical regions. Higher perceived amounts of workplace
change have negative effects on psychological health (e.g. Loretto and others 2005).
Perceived co-worker support and accurate information about impending change can
reduce the impact on health (Platt and others 1999). Organisations should provide
employees with timely information to enable them to understand the reasons for
proposed changes and ensure adequate employee consultation on changes and
opportunities for employees to influence proposals.
All employers have a legal responsibility under existing UK health and safety at work
legislation to ensure the health, safety and welfare of their employees and are required
to undertake risk assessments and take reasonably practicable steps to address the
risks identified, but failings in active health risk management systems in UK small-
animal veterinary practices have been reported (D’Souza and others 2009). The legal
responsibility includes minimising the risk of stress-related illness.30 There is a need
to ensure that attention to mental health, and not merely physical health, is recognised
by veterinary employers as an integral requirement of the legislation. The introduction
of mechanisms for measuring and monitoring psychosocial work characteristics using
standard instruments such as the HSE MSIT in the work environments of veterinary
surgeons would enable identification of workplace-specific opportunities to improve
30 Further advice on compliance with legislation concerning work-related stress is available at http://www.hse.gov.uk/stress/furtheradvice/legalresponsibility.htm [Accessed 22 Apr 2009]

Chapter 6: Discussion 211
working conditions. Workplace-specific mean scores for each HSE MSIT stressor
domain can be compared with those estimated for the UK veterinary profession in the
current study (Tables 5.26 and 5.27). The incorporation of formalised procedures for
surveillance of psychosocial risks, and the development and implementation of
suitable plans for their mitigation, into the requirements for accreditation under the
RCVS Practice Standards Scheme is worthy of consideration, especially in view of
the potential effects of the mental health and well-being of veterinary surgeons on
animal care. Practices rely heavily on health and safety guidance produced by
veterinary professional bodies (D’Souza and others 2009) and consequently, by the
omission of any reference to work-related stress in the standards scheme requirements
relating to health and safety of employees,31 the RCVS may be inadvertently
reinforcing any perception among employers that health and safety legislation only
relates to physical risks.
Materials should be developed which present a compelling business case for
psychological health and safety at work, beyond ethical and legal obligations, and
inform veterinary businesses on how to create and sustain working environments
which optimise the mental health of employees. Workplaces implementing specific
measures to improve veterinary surgeons’ mental health and well-being should be
identified and publicised as models of best practice.
The RCVS Professional Development Phase (PDP) aims to support new graduates
during their attainment of clinical skills in their first year in practice. The
incorporation of elements of emotional reflection into this phase would give
recognition to the importance of psychological health and encourage new graduates to
consider their emotional needs and development opportunities early in their careers.
6.7.5 Other personal and work-related stressors
The total number of hours worked and out-of-hours on-call duties are reported by
study respondents to be major contributors to stress although, in keeping with studies 31 RCVS Practice Standards Scheme Manual (March 2009). Section 9: Safety Procedures. London, RCVS. pp 36-43. Available at http://www.rcvs.org.uk/Shared_ASP_Files/UploadedFiles/rcvs/ 367B0F5A-2251-4D47-B2DA-21B318CB4415_pss_manual_310309.pdf [Accessed 22 Apr 2009]

Chapter 6: Discussion 212
among doctors (Tyssen and Vaglum 2002), the current study failed to show an
association between working long hours and mental health and well-being.
Nevertheless, the requirements of the Working Time Regulations (1998)32 – which
prescribe maximum working hours and minimum rest periods – should be observed.
The related issue of whether inactive periods during on-call duties contribute towards
the total number of hours worked requires prompt resolution.
Making professional mistakes, the possibility of client complaints and/or litigation,
and client expectations are reported to be major contributors to stress. Consultation
skills training focused on improving competencies in communication to manage client
expectations and deal with complaints may help to mitigate these stressors. The
curricula of some UK veterinary schools contain elements of professional
communication skills training (Gray and others 2006) but there is scope for this to be
greatly expanded. The RCVS and professional indemnity insurance providers should
give consideration to how to improve veterinary surgeons’ access to appropriate
advice and support when cases are referred to them. There is a general consensus on a
need to update the RCVS complaints and disciplinary procedures33 in the interests of
both the public and the profession. Efforts to improve veterinary surgeons’ respect for
and confidence in the procedures could relieve some of their associated concerns.
In the current study, managing personal finances is self-reported as an important
stressor for respondents who graduated in the previous five years. It is likely that
concerns will rise among future graduates given the introduction of tuition fees in
2006 and the prospect that fees will be increased. The provision of debt management
guidance during undergraduate training has the potential to help reduce the stress
associated with the repayment of student loans after graduation. Consideration should
be given to lobbying government to allow students’ costs associated with compulsory
extramural studies to be incorporated into the tuition fee loan structure.
32 The Working Time Regulations (1998) require that employees should not have to work more than an average of 48 hours per week unless they choose to opt out. Available at http://www.opsi.gov.uk/si/si1998/19981833.htm [Accessed 01 Aug 2008] 33 House of Commons Environment, Food and Rural Affairs Committee (2008) Veterinary Surgeons Act 1966: Sixth Report of Session 2007-08. London, The Stationery Office. http://www.publications.parliament.uk/pa/cm200708/cmselect/cmenvfru/348/348.pdf [Accessed 22 May 2008]

Chapter 6: Discussion 213
6.7.6 Work-home interaction
The results of the current study suggest that some veterinary surgeons experience high
levels of negative work-home interaction. Renewed attention to existing policies and
practices is recommended to address the extent to which work and home life are in
conflict for both men and women in the profession. This may be achieved through
flexible working hours, reduced working and on-call hours, or job sharing as negative
work-home interaction is associated with the number of hours worked and on-call.
The formation of out-of-hours co-operatives with local practices or the use of
dedicated providers of out-of-hours veterinary care has potential to reduce negative
work-home interaction.
6.7.7 Crisis intervention and return to work
Attempts should be made to facilitate the early identification of signs of psychological
distress at work and enable appropriate and supportive intervention, which may
involve making reasonable adjustments to the work environment to enable an
individual to continue working. Screening workers for early signs of depression and
encouraging effective treatment can improve clinical outcomes and work performance
(Wang and others 2007). Associated initiatives to help break the stigma of mental
health as a character weakness would be complementary.
Employers should create a positive culture of acceptability of sickness absence which
enables veterinary surgeons to take time off work without excessive feelings of guilt,
encourages them to recover sufficiently before returning to work, and manages the
consequences of individual absences for their colleagues in a fair and equitable way.
The levels of psychological distress reported in the current study suggest the ready
availability of lethal means is probably not operating in isolation to increase suicide
risk within the profession. However, in view of the overwhelming evidence of an
association between suicide prevalence and availability of lethal means (Hawton
2007), and the effectiveness of restrictions on access to lethal means as an approach to
suicide prevention (Daigle 2005, Mann and others 2005, Hawton 2007), consideration
should be given to mechanisms to moderate the opportunity for veterinary surgeons to

Chapter 6: Discussion 214
use certain medicines for suicide at times of high risk, notwithstanding the immediate
implications for dispensing and administration of medicines. In other professions
where access to lethal means is inevitable, such as the use of firearms by the military,
at times of high risk, restrictions are placed on the opportunity to use lethal means for
suicide (e.g. solitary armed duty), as distinct from imposing blanket restrictions on
access (Mahon and others 2005). This model may have application in the veterinary
profession: for example, restriction of unsupervised access to injectable barbiturates at
times of high risk to minimise opportunity to remove them from the workplace for
self-administration.
Placement of signage at geographical suicide ‘hot spots’, displaying details of
accessible sources of emotional support, can be an effective suicide prevention
measure (e.g. King and Frost 2005). Signage is a low cost intervention which
capitalises on existing services, can be promptly implemented and is based on robust
evidence of effectiveness. Signs encouraging individuals to seek help and displaying
helpline telephone numbers, positioned in close proximity to practice medicine stores,
might have a similar effect on individuals considering suicide and could also serve to
increase awareness among all practice employees of sources of support.34
Consideration should be given by veterinary employers and professional bodies to the
development and implementation of policies to facilitate the reintegration of
veterinary surgeons with respect and sensitivity back into the workplace following a
mental health crisis.
Consideration should also be given to the development of a protocol for effective
suicide postvention to provide guidance to veterinary employers on communication to
employees of information relating to a colleague’s completed suicide and provision of
support to all those affected.
34 This recommendation was adopted by Veterinary Benevolent Fund and A5-sized, full-colour signs displaying telephone numbers for Vet Helpline and Samaritans were distributed to veterinary surgeons as an enclosure with accompanying editorial in Veterinary Times Vol 39, No 16, 27 Apr 2009, p. 3.

Chapter 6: Discussion 215
Table 6.1: Proposed individual-oriented interventions with potential to help alleviate psychological
distress among veterinary surgeons
Primary Secondary Tertiary Enhanced assessments at undergraduate level to inform the development, timing and targeting of educational interventions to improve resilience during subsequent career
Improving help-seeking behaviour, including encouragement to use existing support initiatives
Counselling and psychotherapy
Consider screening undergraduates to identify at-risk individuals and provide appropriate levels of support
Support during complaints and disciplinary proceedings
Mental health promotion: techniques to improve mental well-being, enhance adaptive coping skills, increase awareness of the dangers of alcohol misuse, reduce perceived stigma
Provision of conciliation service to help resolve employment-related disputes
Education to facilitate early recognition of psychological problems in self and others
Litigation under employment law
Consultation skills training to improve communication and thereby help to manage client expectations and handle complaints effectively
Introduction of emotional reflection into PDP
Increase awareness of existing support initiatives: Vet Helpline, VSHSP
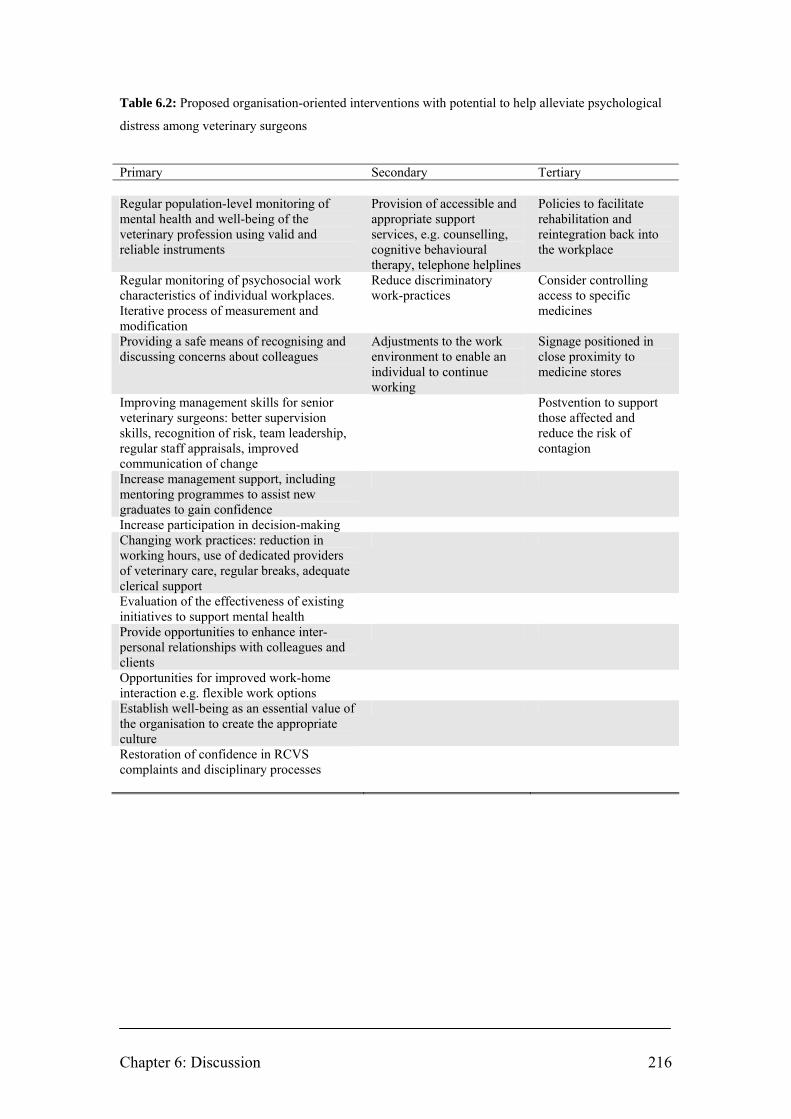
Chapter 6: Discussion 216
Table 6.2: Proposed organisation-oriented interventions with potential to help alleviate psychological
distress among veterinary surgeons
Primary Secondary Tertiary Regular population-level monitoring of mental health and well-being of the veterinary profession using valid and reliable instruments
Provision of accessible and appropriate support services, e.g. counselling, cognitive behavioural therapy, telephone helplines
Policies to facilitate rehabilitation and reintegration back into the workplace
Regular monitoring of psychosocial work characteristics of individual workplaces. Iterative process of measurement and modification
Reduce discriminatory work-practices
Consider controlling access to specific medicines
Providing a safe means of recognising and discussing concerns about colleagues
Adjustments to the work environment to enable an individual to continue working
Signage positioned in close proximity to medicine stores
Improving management skills for senior veterinary surgeons: better supervision skills, recognition of risk, team leadership, regular staff appraisals, improved communication of change
Postvention to support those affected and reduce the risk of contagion
Increase management support, including mentoring programmes to assist new graduates to gain confidence
Increase participation in decision-making Changing work practices: reduction in working hours, use of dedicated providers of veterinary care, regular breaks, adequate clerical support
Evaluation of the effectiveness of existing initiatives to support mental health
Provide opportunities to enhance inter-personal relationships with colleagues and clients
Opportunities for improved work-home interaction e.g. flexible work options
Establish well-being as an essential value of the organisation to create the appropriate culture
Restoration of confidence in RCVS complaints and disciplinary processes
Chapter 7: Conclusions 217
CHAPTER 7: CONCLUSIONS
The demographic and occupational profile of respondents and assessments of non-
response bias allow cautious confidence in the reliability and generalisability of the
study findings to the wider population of veterinary surgeons practising in the UK.
The veterinary profession is a heterogeneous group in terms of mental health and
well-being with differences associated with a variety of demographic and
occupational variables including age, gender, type of work, and employment status.
For example, veterinary surgeons working in mixed practice and in clinical and non-
clinical roles in universities report a significantly lower 12-month prevalence of
suicidal thoughts than those working in small animal practice; those working in
clinical and non-clinical roles in universities report the highest levels of positive
mental well-being; female veterinary surgeons have a higher risk of anxiety caseness;
and the risk of anxiety caseness decreases with increasing age. However, cross-
sectional methodology makes the casual direction between work stressors and mental
health uncertain, particularly in view of the reciprocal relationships which exist
between work characteristics and mental health.
Reported important contributors to stress include: making professional mistakes; the
possibility of client complaints or litigation; client expectations; and unexpected
clinical outcomes. Good clinical outcomes, relationships with colleagues, and
intellectual challenge/learning are the main themes reported as the greatest sources of
professional satisfaction.
Compared to the general population, the sample of veterinary surgeons reported
higher levels of anxiety and depressive symptoms; higher 12-month prevalence of
suicidal thoughts; less favourable psychosocial working conditions in regard to
demands and managerial support; lower levels of positive mental well-being; and
higher levels of negative work-home interaction. They drink more frequently than the
general population, but consume less on a typical drinking day and have a prevalence
of daily and weekly binge-drinking that is similar to the general population. The
numbers of hours worked and on-call are reported as major contributors to stress; the

Chapter 7: Conclusions 218
study showed associations with negative work-home interaction but not mental health
or positive mental well-being.
The high levels of psychological distress reported suggest ready access to and
knowledge of lethal means is probably not operating in isolation to increase suicide
risk within the veterinary profession. The level of alcohol consumption does not
appear to be a negative influence on mental health within the profession as a whole.
The results are used to propose a portfolio of interventions, for both organisations and
individuals, which have potential to reduce psychological distress in the veterinary
profession. However, there is a need for intervention studies to test whether
modifying work-related stressors leads to better mental health in the working
population, which is ultimately the goal of this research in the veterinary profession.
The study has contributed to research in the field of occupational health psychology
by: development of a hypothetical model to explain suicide risk in veterinary surgeons
based on a review of related literature; measurement of the nature and extent of
psychological morbidity among veterinary surgeons in the UK; provision of empirical
insight into possible mechanisms underlying suicidal behaviour within the veterinary
profession; establishing a baseline of measures from which to monitor future change
and trends in mental health and well-being among veterinary surgeons in the UK;
informing the development and targeting of evidence-based interventions to help
promote mental health within the veterinary profession; and contributing to the
general body of knowledge on occupation and suicide and features of the
psychosocial work environment that may influence mental health and well-being.
A qualitative study based on in-depth interviews with participants purposively
selected from respondents to the current study could further explore the findings and
may identify novel relevant themes. Further research could explore other stages of the
veterinary career life course, such as the personality characteristics of students and
elements of the undergraduate training environment, to identify possible influences on
the development of subsequent mental ill-health and suicidal behaviours. Although
the current study suggests that euthanasia of animals is perceived by the majority of
veterinary surgeons to contribute minimally to occupational stress, the possible

Chapter 7: Conclusions 219
contextual influence of the familiarity with and acceptability of animal euthanasia on
attitudes towards the expendability of human life and the extent to which this might
mediate the elevated risk of suicidal ideation and behaviours in the profession requires
investigation.
The mental health and well-being of the veterinary profession is both an individual
and a collective responsibility. There is potential for positive change through
initiatives including education on protective behaviours and recognition of mental ill-
health in oneself and others, redesign of the psychosocial work environment to reduce
demands and increase managerial and peer support, and improving the quality of
social relations in work and home life. This thesis provides an evidence base which
underscores the need for intervention and should serve as a call to action for
employees, employers and the profession’s representative bodies to advance the
changes required.

References 220
REFERENCES
ABRAHAM, W.T. & RUSSELL, D.W. (2004) Missing data: a review of current methods and applications in epidemiological research. Current Opinion in Psychiatry 17, 315-321 ADAY, L.A. & CORNELIUS, L.J. (2006) Designing and conducting health surveys. A comprehensive guide. 3rd edn. San Francisco, Jossey-Bass AGERBO, E., GUNNELL, D., BONDE, J.P., MORTENSEN, P.B. & NORDENTOFT, M. (2007) Suicide and occupation: the impact of socio-economic, demographic, and psychiatric differences. Psychological Medicine 37, 1131-1140 AGERBO, E., MORTENSEN, P.B., ERIKSSON, T., QIN, P. & WESTERGAARD-NIELSEN, N. (2001) Risk of suicide in relation to income level in people admitted to hospital with mental illness: nested case-control study. British Medical Journal 322, 334-335 ALEXANDER, R.E. (2001) Stress-related suicide by dentists and other health care workers: fact or folklore? Journal of the American Dental Association 132, 786-794 AMES, G.M. & REBHUN, L.A. (1996) Women, alcohol and work: interactions of gender, ethnicity and occupational culture. Social Science & Medicine 43, 1649-1663 ANDERSON, J., HUPPERT, F. & ROSE, G. (1993) Normality, deviance and minor psychiatric morbidity in the community. A population-based approach to General Health Questionnaire data in the Health and Lifestyle Survey. Psychological Medicine 23, 475-485 ANDERSSON, L., ALLEBECK, P., GUSTAFSSON, J-E. & GUNNELL, D. (2008) Association of IQ scores and school achievement with suicide in a 40-year follow-up of a Swedish cohort. Acta Psychiatrica Scandinavica 118, 99-105 ANDRIESSEN, K. (2006) Do we need to be cautious in evaluating suicide statistics? [Letter] European Journal of Public Health 16, 445-447 ASCH, D.A., JEDRZIEWSKI, M.K. & CHRISTAKIS, N.A. (1997) Response rates to mail surveys published in medical journals. Journal of Clinical Epidemiology 50, 1129-1136 AUSTIN, E.J., EVANS, P., GOLDWATER, R. & POTTER, V. (2005) A preliminary study of emotional intelligence, empathy and exam performance in first year medical students. Personality and Individual Differences 39, 1395-1405 BACA-GARCIA, E., PARRA, C.P., PEREZ-RODRIGUEZ, M.M., DIAZ SASTRE, C., REYES TORRES, R., SAIZ-RUIZ, J. & DE LEON, J. (2007) Psychosocial stressors may be strongly associated with suicide attempts. Stress and Health 23, 191-198
References 221
BAKER, A. (2008) Alcohol-related deaths by occupation: what do data for England and Wales in 2001-2005 tell us about doctors’ mortality? Alcohol & Alcoholism 43, 121-122 BALDWIN, D.S., EVANS, D.L., HIRSCHFELD, R.M.A. & KASPER, S. (2002) Can we distinguish anxiety from depression? Psychopharmacology Bulletin 36 (Suppl. 2), 158-165 BALDWIN, D.S. & RUDGE, S.E. (1995) Depression and suicide in doctors and medical students. In Health Risks to the Health Care Professional. Ed P. Litchfield. London, Royal College of Physicians. pp 77-90 BARTRAM, D. & BALDWIN, D. (2007) Mental health and wellbeing survey [Letter]. Veterinary Record 161, 360 BARTRAM, D.J. & BALDWIN, D.S. (2008) Veterinary surgeons and suicide: influences, opportunities and research directions. Veterinary Record 162, 36-40 BARTRAM, D. & GARDNER, D. (2008) Coping with stress. In Practice 30, 228-231 BECH, P. (2004) Measuring the dimensions of psychological general well-being by the WHO-5. QoL Newsletter 32, 15-16 BECK, A.T., KOVACS, M. & WEISSMAN, A. (1979) Assessment of suicidal intention: the scale for suicide ideation. Journal of Consulting and Clinical Psychology 47, 343-352 BECK, A.T. & STEER, R.A. (1991) Manual: Beck Scale for Suicide Ideation. Texas, The Psychological Corporation BECK, A.T. & WARD, C.H. (1961) An inventory for measuring depression. Archives of General Psychiatry 4, 561-571 BENNEWITH, O., NOWERS, M. & GUNNELL, D. (2007) Effect of barriers on the Clifton suspension bridge, England, on local patterns of suicide: implications for prevention. British Journal of Psychiatry 190, 266-267 BERTOLOTE, J.M. (2004) Suicide prevention: at what level does it work? World Psychiatry 3, 147-151 BHUGRA, D. (2006) Suicide and gender: cultural factors. Harvard Health Policy Review 7, 166-180 BIDDLE, L., BROCK, A., BROOKES, S.T. & GUNNELL, D. (2008) Suicide rates in young men in England and Wales in the 21st century: time trend study. British Medical Journal 336, 539-542
References 222
BJELLAND, I., DAHL, A.A., HAUG, T.T. & NECKELMANN, D. (2002) The validity of the Hospital Anxiety and Depression Scale: an updated literature review. Journal of Psychosomatic Research 52, 69-77 BLAIR, A. & HAYES, H.M. (1980) Cancer and other causes of death among US veterinarians, 1966-1977. International Journal of Cancer 25, 181-185 BLAIR, A. & HAYES, H.M. (1982) Mortality patterns among US veterinarians, 1947-1977: an expanded study. International Journal of Epidemiology 11, 391-397 BOND, F.W. (2004) Getting the balance right: the need for a comprehensive approach to occupational health. Work & Stress 18, 146-148 BONDE, J.P.E. (2008) Psychosocial factors at work and risk of depression: a systematic review of the epidemiological evidence. Occupational and Environmental Medicine 65, 438-445 BORGES, N.J. & SAVICKAS, M.L. (2002) Personality and medical specialty choice: a literature review and integration. Journal of Career Assessment 10, 362-380 BOWLING, A. (2005) Mode of questionnaire administration can have serious effects on data quality. Journal of Public Health 27, 281-291 BOYNTON, P.M. & GREENHALGH, T. (2004) Selecting, designing, and developing your questionnaire. British Medical Journal 328, 1312-1315 BRADLEY, K.A., BUSH, K.R., EPLER, A.J., DOBIE, D.J., DAVIS, T.M., SPORLEDER, J.L., MAYNARD, C., BURMAN, M.L. & KIVLAHAN, D.R. (2003) Two brief alcohol-screening tests from the alcohol use disorders identification test (AUDIT): validation in a female veterans affairs patient population. Archives of Internal Medicine 163, 821-829 BRADY, J. (2006) The association between alcohol misuse and suicidal behaviour. Alcohol & Alcoholism 41, 473-478 BRAUNHOLTZ, S., DAVIDSON, S., MYANT, K. & O’CONNOR, R. (2007) Well? What Do You Think? (2006): The Third National Scottish Survey of Public Attitudes to Mental Health, Mental Wellbeing and Mental Health Problems. Edinburgh, The Scottish Executive. http://www.scotland.gov.uk/Resource/Doc/197512/0052833.pdf [Accessed 07 May 2008] BRAY, I. & GUNNELL, D. (2006) Suicide rates, life satisfaction and happiness as markers for population mental health. Social Psychiatry and Psychiatric Epidemiology 41, 333-337 BRENT, D.A. & MANN, J.J. (2005) Family genetic studies, suicide, and suicidal behavior. American Journal of Medical Genetics 133C, 13-24
References 223
BREZO, J., PARIS, J. & TURECKI, G. (2006) Personality traits as correlates of suicidal ideation, suicide attempts, and suicide completions: a systematic review. Acta Psychiatrica Scandinavica 113, 180-206 BRITISH VETERINARY ASSOCIATION & THE ASSOCIATION OF VETERINARY STUDENTS (2008) Survey results 2008. London, British Veterinary Association. http://www.bva.co.uk/public/documents/2008_AVS_Survey_Results.pdf [Accessed 25 May 2009] BROCK, A., BAKER, A., GRIFFITHS, C., JACKSON, G., FEGAN, G. & MARSHALL, D. (2006) Suicide trends and geographical variations in the United Kingdom, 1991-2004. Health Statistics Quarterly 31, 6-22 BROCK, A. & GRIFFITHS, C. (2003) Trends in the mortality of young adults aged 15-44 in England and Wales, 1961 to 2001. Health Statistics Quarterly 19, 22-31 BRONISCH, T. & WITTCHEN, H.U. (1994) Suicidal ideation and suicide attempts: comorbidity with depression, anxiety disorders, and substance abuse disorder. European Archives of Psychiatry and Clinical Neuroscience 244, 93-98 BROWN, S.L. (1994) Factor structure of a brief version of the Ways of Coping (WOC) questionnaire: a study with veterinary medicine students. Measurement and Evaluation in Counseling and Development 27, 308-315 BUSH, K., KIVLAHAN, D.R., MCDONNELL, M.B., FIHN, S.D. & BRADLEY, K.A. (1998) The AUDIT alcohol consumption questions (AUDIT-C). An effective screening test for problem drinking. Archives of Internal Medicine 158, 1789-1795 CAPNER, C.A., LASCELLES, B.D.X. & WATERMAN-PEARSON, A.E. (1999) Current British veterinary attitudes to perioperative analgesia for dogs. Veterinary Record 145, 95-99 CAVANAGH, J.T.O., CARSON, A.J., SHARPE, M. & LAWRIE, S.M. (2003) Psychological autopsy studies of suicide: a systematic review. Psychological Medicine 33, 395-405 CENTER, C., DAVIS, M., DETRE, T., FORD, D.E., HANSBROUGH, W., HENDIN, H., LASZLO, J., LITTS, D.A., MANN, J., MANSKY, P.A., MICHELS, R., MILES, S.H., PROUJANSKY, R., REYNOLDS, C.F. & SILVERMAN, M.M. (2003) Confronting depression and suicide in physicians: a consensus statement. Journal of the American Medical Association 289, 3161-3166 CHARLTON, J. (1995) Trends and patterns in suicide in England and Wales. International Journal of Epidemiology 24 (Suppl. 1), S45-S52 CHARLTON, J., KELLY, S., DUNNELL, K., EVANS, B. & JENKINS, R. (1993) Suicide deaths in England and Wales: trends in factors associated with suicide deaths. Population Trends 71, 34-42

References 224
CLACK, G.B., ALLEN, J., COOPER, D. & HEAD, J.O. (2004) Personality differences between doctors and their patients: implications for the teaching of communication skills. Medical Education 38, 177-186 CLARK, M.A. & JONES, J.W. (1979) Suicide by intravenous injection of a veterinary euthanasia agent: report of a case and toxicologic studies. Journal of Forensic Sciences 24, 762-767 CLERY, E., MCLEAN, S. & PHILLIPS, M. (2007) Quickening death: the euthanasia debate. In British Social Attitudes: The 23rd Report – Perspectives on a changing society. Eds A. Park, J. Curtice, K. Thomson, M. Phillips, M. Johnson. London, Sage. pp 35-53 COHEN, S.P. (2007) Compassion fatigue and the veterinary health team. Veterinary Clinics of North America, Small Animal Practice 37, 123-134 CONNOLLY, D.J. (2003) Stress in the veterinary profession: the nature, implications and consequences for veterinarians in the West of Ireland [MA Thesis]. National University of Ireland, Galway CORDELL, W.H., CURRY, S.C., FURBEE, R.B. & MITCHELL-FLYNN, D.L. (1986) Veterinary drugs as suicide agents. Annals of Emergency Medicine 15, 939-943 COULTHARD, M., FARRELL, M., SINGLETON, N. & MELTZER, H. (2002) Tobacco, alcohol and drug use and mental health. London, The Stationery Office COUSINS, R., MACKAY, C.J., CLARKE, S.D., KELLY, C., KELLY, P.J. & MCCAIG, R.H. (2004) ‘Management standards’ and work related stress in the UK: practical development. Work & Stress 18, 113-136 CRAWFORD, J.R., HENRY, J.D., CROMBIE, C. & TAYLOR, E.P. (2001) Normative data for the HADS from a large non-clinical sample. British Journal of Clinical Psychology 40, 429-434 CULL, W.L., O'CONNOR, K.G., SHARP, S. & TANG, S.S. (2005) Response rates and response bias for 50 surveys of pediatricians. Health Services Research 40, 213-226 CUMMINGS, S.M., SAVITZ, L.A. & KONRAD, T.R. (2001) Reported response rates to mailed physician questionnaires. Health Services Research 35, 1347-1355 DAIGLE, M.S. (2005) Suicide prevention through means restriction: assessing the risk of substitution. A critical review and synthesis. Accident Analysis & Prevention 37, 625-632

References 225
DAWSON, D.A., GRANT, B.F., STINSON, F.S. & ZHOU, Y. (2005) Effectiveness of the derived alcohol use disorders identification test (AUDIT-C) in screening for alcohol use disorders and risk drinking in the US general population. Alcoholism: Clinical and Experimental Research 29, 844-854 DE GRAAF, G. (2005) Veterinarians’ discourses on animals and clients. Journal of Agriculture and Environmental Ethics 18, 557-578 DE JONGE, J., MULDER, M.J.G.P. & NIJHUIS, F.J.N. (1999) The incorporation of different demand concepts in the job demand-control model: effects on health care professionals. Social Science & Medicine 48, 1149-1160 DE SMET, P., SANS, S., DRAMAIX, M., BOULENGUEZ, C., DE BACKER, G., FERRARIO, M., CESANA, G., HOUTMAN, I., ISACSSON, S.O., KITTEL, F., OSTERGREN, P.O., PERES, I., PELFRENE, E., ROMON, M., ROSENGREN, A., WILHELMSEN, L. & KORNITZER, M. (2005) Gender and regional differences in perceived job stress across Europe. European Journal of Public Health 15, 536-545 DEL BOCA, F.K. & DARKES, J. (2003) The validity of self-reports of alcohol consumption: state of the science and challenges for research. Addiction 98 (Suppl. 2), 1-12 DENNIS, M., BAILLON, S., BRUGHA, T., LINDESAY, J., STEWART, R. & MELTZER, H. (2007) The spectrum of suicidal ideation in Great Britain: comparisons across a 16-74 years age range. Psychological Medicine 37, 795-805 DIENER, E., EMMONS, R.A., LARSEN, R.J. & GRIFFIN, S. (1985) The satisfaction with life scale. Journal of Personality Assessment 49, 71-75 DINOS, S., STEVENS, S., SERFATY, M., WEICH, S. & KING, M. (2004) Stigma: the feelings and experiences of 46 people with mental illness: qualitative study. British Journal of Psychiatry 184, 176-181 DOMINO, G., MOORE, D., WESTLAKE, L. & GIBSON, L. (1982) Attitudes towards suicide: a factor analytic approach. Journal of Clinical Psychology 38, 257-262 DONALD, M., DOWER, J., CORREA-VELEZ, I. & JONES, M. (2005) Risk and protective factors for medically serious suicide attempts: a comparison of hospital-based with population-based samples of young adults. Australian and New Zealand Journal of Psychiatry 40, 87-96 DRAGANO, N., HE, Y., MOEBUS, S., JÖCKEL, K-H., ERBEL, R. & SIEGRIST, J. (2008) Two models of job stress and depressive symptoms: results from a population-based study. Social Psychiatry and Psychiatric Epidemiology 43, 72-78 DRUSS, B. & PINCUS, H. (2000) Suicidal ideation and suicide attempts in general medical illnesses. Archives of Internal Medicine 160, 1522-1526

References 226
D’SOUZA, E., BARRACLOUGH, R., FISHWICK, D. & CURRAN, A. (2009) Management of occupational health risks in small-animal veterinary practices. Occupational Medicine 59, 316-322 DUBERSTEIN, P.R., CONWELL, Y., CONNER, K.R., EBERLY, S., EVINGER, J.S. & CAINE, E.D. (2004) Poor social integration and suicide: fact or artifact? A case-control study. Psychological Medicine 34, 1331-1337 DURKHEIM, É. ([1897] 2006) On Suicide. London, Penguin Classics EDWARDS, J.A., WEBSTER, S., VAN LAAR, D. & EASTON, S. (2008) Psychometric analysis of the UK Health and Safety Executive’s Management Standards work-related stress Indicator Tool. Work & Stress 22, 96-107 EDWARDS, P., ROBERTS, I., CLARKE, M., DIGUISEPPI, C., PRATAP, S., WENTZ, R. & KWAN, I. (2002) Increasing response rates to postal questionnaires: systematic review. British Medical Journal 324, 1183-1190 EDWARDS, P., ROBERTS, I., CLARKE, M., DIGUISEPPI, C., PRATAP, S., WENTZ, R., KWAN, I. & COOPER, R. (2007) Methods to increase response rates to postal questionnaires. Cochrane Database of Systematic Reviews, Issue 2 ELEJALDE, J.I., LOUIS, C.J., ELCUAZ, R. & PINILLOS, M.A. (2003) Drug abuse with inhalated xylazine. European Journal of Emergency Medicine 10, 252-253 ELLIOTT, D.M. & GUY, J.D. (1993) Mental health professionals versus non-mental-health professionals: childhood trauma and adult functioning. Professional Psychology: Research and Practice 24, 83-90 ELLIOTT, S.P. & HALE, K.A. (1999) Analysis of etorphine in postmortem samples by HPLC with UV diode-array detection. Forensic Science International 101, 9-16 ETZERSDORFER, E., VIJAYAKUMAR, L., SCHÖNY, W., GRAUSGRUBER, A. & SONNECK, G. (1998) Attitudes towards suicide among medical students – comparison between Madras (India) and Vienna (Austria). Social Psychiatry and Psychiatric Epidemiology 33, 104-110 EVANS, O. & STEPTOE, A. (2002) The contribution of gender-role orientation, work factors and home stressors to psychological well-being and sickness absence in male- and female-dominated occupational groups. Social Science & Medicine 54, 481-492 EWING, J.A. (1984) Detecting alcoholism: the CAGE questionnaire. Journal of the American Medical Association 252, 1905-1907 FAIRNIE, H.M. (2005) Occupational injury, disease and stress in the veterinary profession [PhD Thesis]. Curtin University of Technology, Australia. http://adt.curtin.edu.au/theses/available/adt-WCU20070528.140327/ [Accessed 07 Mar 2008]

References 227
FARAGHER, E.B., COOPER, C.L. & CARTWRIGHT, S. (2004) A shortened stress evaluation tool (ASSET). Stress and Health 20, 189-201 FARRELL, M. & MARSHALL, E.J. (2006) Epidemiology of tobacco, alcohol and drug use. Psychiatry 5, 427-430 FAZEL, S., BENNING, R. & DANESH, J. (2005) Suicides in male prisoners in England and Wales, 1978-2003. Lancet 366, 1301-1302 FERRIE, J.E., HEAD, J., SHIPLEY, M.J., VAHTERA, J., MARMOT, M.G. & KIVIMÄKI, M. (2006) Injustice at work and incidence of psychiatric morbidity: the Whitehall II study. Occupational and Environmental Medicine 63, 443-450 FIRTH-COZENS, J. (1990) Sources of stress in women junior house officers. British Medical Journal 301, 89-91 FIRTH-COZENS, J. (2001) Interventions to improve physicians’ well-being and patient care. Social Science & Medicine 52, 215-222 FISHBAIN, D.A. (1986) Veterinarians with psychiatric impairment – a comparison with impaired physicians. Journal of the National Medical Association 78, 133-137 FITZPATRICK, R., DAVEY, C., BUXTON, M.J. & JONES, D.R. (1998) Evaluating patient-based outcome measures for use in clinical trials. Health Technology Assessment Vol: 2, No: 14 FOGLE, B. & ABRAHAMSON, D. (1990) Pet loss: a survey of the attitudes and feelings of practicing veterinarians. Anthrozoös 3, 143-150 FRANK, E., BOSWELL, L., DICKSTEIN, L.J. & CHAPMAN, D.P. (2001) Characteristics of female psychiatrists. American Journal of Psychiatry 158, 205-212 FRIDNER, A., BELKIC, K., MARINI, M., MINUCCI, D., PAVAN, L. & SCHENCK-GUSTAFSSON, K. (2009) Survey on recent suicidal ideation among female university hospital physicians in Sweden and Italy (The HOUPE Study): cross-sectional associations with work stressors. Gender Medicine 6, 314-328 FRITSCHI, L., MORRISON, D., SHIRANGI, A. & DAY, L. (2009) Psychological well-being of Australian veterinarians. Australian Veterinary Journal 87, 76-81 GARDNER, D.H. & HINI, D. (2006) Work-related stress in the veterinary profession in New Zealand. New Zealand Veterinary Journal 54, 119-124 GELBERG, S. & GELBERG, H. (2005) Stress management interventions for veterinary students. Journal of Veterinary Medical Education 32, 173-181 GENERAL REGISTER OFFICE FOR SCOTLAND (2007) Scotland’s population 2006. The Registrar General’s Annual Review of Demographic Trends. 152nd edition. Edinburgh, General Register Office for Scotland. p 32. http://www.gro-
References 228
scotland.gov.uk/files1/stats/annual-report2006/annual-report-2006.pdf [Accessed 13 Feb 2008] GERRITY, M.S. (2001) Interventions to improve physicians’ well-being and patient care: a commentary. Social Science & Medicine 52, 223-225 GEURTS, S.A.E., TARIS, T.W., KOMPIER, M.A.J., DIKKERS, J.S.E., VAN HOOFF, M.L.M. & KINNUNEN, U.M. (2005) Work-home interaction from a work psychological perspective: development and validation of a new questionnaire, the SWING. Work & Stress 19, 319-339 GIBB, B.E., ANDOVER, M.S. & BEACH, S.R.H. (2006) Suicidal ideation and attitudes toward suicide. Suicide and Life-Threatening Behavior 36, 12-18 GIBBS, J.P. (2000) Status integration and suicide: occupational, marital, or both? Social Forces 79, 363-384 GILBODY, S., HOUSE, A.O. & SHELDON, T.A. (2005) Screening and case finding instruments for depression. Cochrane Database of Systematic Reviews, Issue 4 GOLDNEY, R.D. (2005) Risk factors for suicidal behaviour. In Prevention and Treatment of Suicidal Behaviour: From Science to Practice. Ed K. Hawton. Oxford, Oxford University Press. pp 161-182 GOSSOP, M., STEPHENS, S., STEWART, D., MARSHALL, J., BEARN, J. & STRANG, J. (2001) Health care professionals referred for treatment of alcohol and drug problems. Alcohol & Alcoholism 36, 160-164 GOULD, M.S., FISHER, P., PARIDES, M., FLORY, M. & SHAFFER, D. (1996) Psychosocial risk factors of child and adolescent completed suicide. Archives of General Psychiatry 53, 1155-1162 GRAY, C. A., BLAXTER, A. C., JOHNSTON, P. A., LATHAM, C. E., MAY, S., PHILLIPS, C. A., TURNBULL, N. & YAMAGISHI, B. (2006) Communication education in veterinary education in the United Kingdom and Ireland: the NUVACS project coupled to progressive individual school endeavors. Journal of Veterinary Medical Education 33, 85-92 GRIFFITHS, C., LADVA, G., BROCK, A. & BAKER, A. (2008) Trends in suicide by marital status in England and Wales, 1982-2005. Health Statistics Quarterly 37, 8-14 GRIFFITHS, C., ROONEY, C. & BROCK, A. (2005) Leading causes of death in England and Wales – how should we group causes? Health Statistics Quarterly 28, 6-17 GROSS, E.B. (1997) Gender differences in physician stress: why the discrepant findings? Women and Health 26, 1-14

References 229
GROVES, R.M. (2006) Non-response rates and non-response bias in household surveys. Public Opinion Quarterly 70, 646-675 GUAL, A., SEGURA, L., CONTEL, M., HEATHER, N. & COLOM, J. (2002) AUDIT-3 and AUDIT-4: effectiveness of two short forms of the alcohol use disorders identification test. Alcohol & Alcoholism 37, 591-596 GUNNELL, D. & HARBORD, R. (2003) Suicidal thoughts. In Better or Worse: A Longitudinal Study of the Mental Health of Adults Living in Private Households in Great Britain. Eds N. Singleton, G. Lewis. London, The Stationery Office. pp 45-65 GUNNELL, D. & LEWIS, G. (2005) Studying suicide from the life course perspective: implications for prevention. British Journal of Psychiatry 187, 206-208 GUNNELL, D., MAGNUSSON, P.K.E. & RASMUSSEN, F. (2005) Low intelligence test scores in 18-year-old men and risk of suicide: cohort study. British Medical Journal 330, 167 doi: 10.1136/bmj.38310.473565.8F HAFEN, M., Jr, REISBIG, A.M.J., WHITE, M.B. & RUSH, B.R. (2006) Predictors of depression and anxiety in first-year veterinary students: a preliminary report. Journal of Veterinary Medical Education 33, 432-440 HAFEN, M., Jr, REISBIG, A.M.J., WHITE, M.B. & RUSH, B.R. (2008) The first-year veterinary student and mental health: the role of common stressors. Journal of Veterinary Medical Education 35, 102-109 HALLIWELL, R.E.W. & HOSKIN, B.D. (2005) Reducing the suicide rate among veterinary surgeons: how the profession can help. Veterinary Record 157, 397-398 HANSEN, V., JACOBSEN, B.K. & ARNESEN, E. (2001) Prevalence of serious psychiatric morbidity in attenders and non-attenders to a health survey of a general population. American Journal of Psychiatry 154, 891-894 HANSEZ, I., SCHINS, F. & ROLLIN, F. (2008) Occupational stress, work-home interference and burnout among Belgian veterinary practitioners. Irish Veterinary Journal 61, 233-241 HARLING, M., STREHMEL, P., SCHABLON, A. & NIENHAUS, A. (2009) Psychosocial stress, demoralization and the consumption of tobacco, alcohol and medical drugs by veterinarians. Journal of Occupational Medicine and Toxicology 4, 4 doi: 10.11186/1745-6673-4-4 HARMON-JONES, E. & HARMON-JONES, C. (2007) Cognitive dissonance theory after 50 years of development. Zeitschrift für Sozialpsychologie 38, 7-16 HARRIS, E.C. & BARRACLOUGH, B. (1997) Suicide as an outcome for mental disorders: a meta-analysis. British Journal of Psychiatry 170, 205-228 HATCHER, S. (1994) Debt and deliberate self-poisoning. British Journal of Psychiatry 164, 111-114

References 230
HAWGOOD, J. & DE LEO, D. (2008) Anxiety disorders and suicidal behaviour: an update. Current Opinion in Psychiatry 21, 51-64 HAWTHORNE, G. & ELLIOTT, P. (2005) Imputing cross-sectional missing data: comparison of common techniques. Australian and New Zealand Journal of Psychiatry 39, 583-590 HAWTON, K. (1989) Suicide and attempted suicide. In The Instruments of Psychiatric Research. Ed C. Thompson. Cirencester, Wiley. pp 195-210 HAWTON, K. (2007) Restricting access to methods of suicide: rationale and evaluation of this approach to suicide prevention. Crisis 28 (Suppl. 1), 4-9 HAWTON, K., CLEMENTS, A., SAKAROVITCH, C., SIMKIN, S. & DEEKS, J.J. (2001) Suicide in doctors: a study of risk according to gender, seniority and specialty in medical practitioners in England and Wales, 1979-1995. Journal of Epidemiology and Community Health 55, 296-300 HAWTON, K., CLEMENTS, A., SIMKIN, S. & MALMBERG, A. (2000) Doctors who kill themselves: a study of the methods used for suicide. Quarterly Journal of Medicine 93, 351-357 HAWTON, K., FAGG, J., SIMKIN, S., HARRISS, L. & MALMBERG, A. (1998) Methods used for suicide by farmers in England and Wales: the contribution of availability and its relevance to prevention. British Journal of Psychiatry 173, 320-324 HAWTON, K., MALMBERG, A. & SIMKIN, S. (2004) Suicide in doctors: a psychological autopsy study. Journal of Psychosomatic Research 57, 1-4 HAWTON, K., SIMKIN, S., RUE, J., HAW, C., BARBOUR, F., CLEMENTS, A., SAKAROVITCH, C. & DEEKS, J. (2002) Suicide in female nurses in England and Wales. Psychological Medicine 32, 239-250 HAWTON, K. & VISLISEL, L. (1999) Suicide in nurses. Suicide and Life-Threatening Behavior 29, 86-95 HAWTON, K., ZAHL, D. & WEATHERALL, R. (2003) Suicide following deliberate self-harm: long-term follow-up of patients who presented to a general hospital. British Journal of Psychiatry 182, 537-542 HEATH, T.J. (2007) Longitudinal study of veterinary students and veterinarians: the first 20 years. Australian Veterinary Journal 85, 281-289 HEM, E., GRØNVOLD, N.T., AASLAND, O.G. & EKEBERG, Ø. (2000) The prevalence of suicidal ideation and suicidal attempts among Norwegian physicians: results from a cross-sectional survey of a nationwide sample. European Psychiatry 15, 183-189

References 231
HEM, E., HALDORSEN, T., AASLAND, O.G., TYSSEN, R., VAGLUM, P. & EKEBERG, Ø. (2005) Suicide rates according to education with a particular focus on physicians in Norway 1960-2000. Psychological Medicine 35, 873-880 HENNING, K., EY, S. & SHAW, D. (1998) Perfectionism, the impostor phenomenon and psychological adjustment in medical, dental, nursing and pharmacy students. Medical Education 32, 456-464 HERRMANN, C. (1997) International experiences with the Hospital Anxiety and Depression Scale – a review of validation data and clinical results. Journal of Psychosomatic Research 42, 17-41 HERZOG, H.A., Jr, VORE, T.L. & NEW, J.C., Jr. (1989) Conversations with veterinary students: attitudes, ethics, and animals. Anthrozoös 2, 181-188 HESKETH, B. & SHOUKSMITH, G. (1986) Job and non-job activities, job satisfaction and mental health among veterinarians. Journal of Occupational Behaviour 7, 325-339 HINTIKKA, J., KONTULA, O., SAARINEN, P., TANSKANEN, A., KOSKELA, K. & VIINAMÄKI, H. (1998) Debt and suicidal behaviour in the Finnish general population. Acta Psychiatrica Scandinavica 98, 493-496 HIRSCH, J.K. (2006) A review of the literature on rural suicide: risk and protective factors, incidence, and prevention. Crisis 27, 189-199 HUGONNARD, M., LEBLOND, A., KEROACK, S., CADORÉ, J., TRONCY, E. (2004) Attitudes and concerns of French veterinarians towards pain and analgesia in dogs and cats. Veterinary Anaesthesia and Analgesia 31, 154-163 JENKINS, R., BHUGRA, D., BEBBINGTON, P., BRUGHA, T., FARRELL, M., COID, J., FRYERS, T., WEICH, S., SINGLETON, N. & MELTZER, H. (2008) Debt, income and mental disorder in the general population. Psychological Medicine 38, 1485-1493 JEYARETNAM, J., JONES, H. & PHILLIPS, M. (2000) Disease and injury among veterinarians. Australian Veterinary Journal 78, 625-629 JOE, S., ROMER, D. & JAMIESON, P.E. (2007) Suicide acceptability is related to suicide planning in U.S. adolescents and young adults. Suicide and Life-Threatening Behavior 37, 165-178 JOHNSON, S., COOPER, C., CARTWRIGHT, S., DONALD, I., TAYLOR, P. & MILLET, C. (2005) The experience of work-related stress across occupations. Journal of Managerial Psychology 20, 178-187 JONES-FAIRNIE, H., FERRONI, P., SILBURN, S. & LAWRENCE, D. (2008) Suicide in Australian veterinarians. Australian Veterinary Journal 86, 114-116

References 232
JORM, A.F., KELLY, C.M. & MORGAN, A.J. (2007) Participant distress in psychiatric research: a systematic review. Psychological Medicine 37, 917-926 JÖRNGÅRDEN, A., WETTERGEN, L. & VON ESSEN, L. (2006) Measuring health-related quality of life in adolescents and young adults: Swedish normative data for the SF-36 and the HADS, and the influence of age, gender, and method of administration. Health and Quality of Life Outcomes 4, 91 JOSEPH, S., LINLEY, P.A., HARWOOD, J., LEWIS, C.A. & MCCOLLAM, P. (2004) Rapid assessment of well-being: the short depression-happiness scale (SDHS). Psychology and Psychotherapy: Theory, Research and Practice 77, 463-478 KARASEK, R.A., Jr. (1979) Job demands, job decision latitude, and mental strain: implications for job redesign. Administrative Science Quarterly 24, 285-308 KARASEK, R., BRISSON, C., KAWAKAMI, N., HOUTMAN, I., BONGERS, P. & AMICK, B. (1998) The Job Content Questionnaire (JCQ): an instrument for internationally comparative assessments of psychosocial job characteristics. Journal of Occupational Health Psychology 3, 322-355 KARASEK, R. & THEORELL, T. (1990) Healthy Work: Stress, Productivity, and the Reconstruction of Working Life. New York, Basic Books KELLOWAY, E.K., TEED, M. & KELLEY, E. (2008) The psychosocial environment: towards an agenda for research. International Journal of Workplace Health Management 1, 50-64 KELLY, S. & BUNTING, J. (1998) Trends in suicide in England and Wales, 1982-96. Population Trends 92, 29-41 KELLY, S., CHARLTON, J. & JENKINS, R. (1995) Suicide deaths in England and Wales, 1982-1992: the contribution of occupation and geography. Population Trends 80, 16-25 KESSLER, R., MCGONAGLE, K.A., ZHAO, S., NELSON, C.B., HUGHES, M., ESHLEMAN, S., WITTCHEN, H.-U. & KENDLER, K.S. (1994) Lifetime and 12-month prevalence of DSM-III-R psychiatric disorders in the United States: results from the National Comorbidity Survey. Archives of General Psychiatry 51, 8-19 KING, E. & FROST, N. (2005) The New Forest Suicide Prevention Initiative (NFSPI). Crisis 26, 25-33 KINLEN, L.J. (1983) Mortality among British veterinary surgeons. British Medical Journal 287, 1017-1019 KINSELLA, M. (2006) Suicide in the veterinary profession: the hidden reality – Part Two. Irish Veterinary Journal 59, 704-706 KINTZ, P., CIRIMELE, V. & LUDES, B. (2002) Blood investigation in a fatality involving the veterinary drug T-61. Journal Analytical Toxicology 26, 529-531
References 233
KIRWAN, A.P. (2005) Mankind and other animals [MA Thesis]. Open University, Milton Keynes, UK KIVIMÄKI, M., VAHTERA, J., ELOVAINIO, M., VIRTANEN, M. & SIEGRIST, J. (2007) Effort-reward imbalance, procedural injustice and relational injustice as psychosocial predictors of health: complementary or redundant models? Occupational and Environmental Medicine 64, 659-665 KLEPPA, E., SANNE, B. & TELL, G.S. (2008) Working overtime is associated with anxiety and depression: The Hordaland Health Study. Journal of Occupational and Environmental Medicine 50, 658-666 KNIBBE, R.A., DERICKX, M., KUNTSCHE, S., GRITTNER, U. & BLOOMFIELD, K. (2006) A comparison of the alcohol use disorder identification test (AUDIT) in general population surveys in nine European countries. Alcohol & Alcoholism 41 (Suppl. 1), i19-i25 KNOX, K.L., LITTS, D.A., TALCOTT, G.W., FEIG, J.C. & CAINE, E.D. (2003) Risk of suicide and related adverse outcomes after exposure to a suicide prevention programme in the US Air Force: cohort study. British Medical Journal 327, 1376-1378 KOGAN, L.R., MCCONNELL, S.L. & SCHOENFELD-TACHER, R. (2005) Veterinary students and non-academic stressors. Journal of Veterinary Medical Education 32, 193-200 KOHN, M.L. & SCHOOLER, C. (1982) Job conditions and personality: a longitudinal assessment of their reciprocal effects. American Journal of Sociology 87, 1257-1286 KROENKE, K., SPITZER, R.L. & WILLIAMS, J.B.W. (2001) The PHQ-9: validity of a brief depression severity measure. Journal of General Internal Medicine 16, 606-613 LABOVITZ, S. & HAGEDORN, R. (1971) An analysis of suicide rates among occupational categories. Sociological Inquiry 41, 67-72 LAMONTAGNE, A.D., KEEGEL, T., LOUIE, A.M., OSTRY, A. & LANDBERGIS, P.A. (2007) A systematic review of the job-stress intervention evaluation literature, 1990-2005. International Journal of Occupational and Environmental Health 13, 268-280 LEVIN, K.A. & LEYLAND, A.H. (2005) Urban/rural inequalities in suicide in Scotland, 1981-1999. Social Science & Medicine 60, 2877-2890 LEVINE, R.E., BREITKOPF, C.R., SIERLES, F.S. & CAMP, G. (2003) Complications associated with surveying medical student depression: the importance of anonymity. Academic Psychiatry 27, 12-18
References 234
LI, C.-Y. & SUNG, F.-C. (1999) A review of the healthy worker effect in occupational epidemiology. Occupational Medicine 49, 225-229 LINDEMAN, S., LÄÄRÄ, E., HAKKO, H. & LÖNNQVIST, J. (1996) A systematic review on gender-specific suicide mortality in medical doctors. British Journal of Psychiatry 168, 274-279 LINSLEY, K.R., SCHAPIRA, K. & KELLY, T.P. (2001) Open verdict v. suicide – importance to research. British Journal of Psychiatry 178, 465-468 LORETTO, W., POPHAM, F., PLATT, S., PAVIS, S., HARDY, G., MACLEOD, L. & GIBBS, J. (2005) Assessing psychological well-being: a holistic investigation of NHS employees. International Review of Psychiatry 17, 329-336 LUCAS, C.P. (1992) The order effect: reflections on the validity of multiple test presentations. Psychological Medicine 22, 197-202 MACKAY, C.J., COUSINS, R., KELLY, P.J., LEE, S. & MCCAIG, R.H. (2004) ‘Management standards’ and work related stress in the UK: policy background and science. Work & Stress 18, 91-112 MAHON, M.J., TOBIN, J.P., CUSAK, D.A., KELLEHER, C. & MALONE, K.M. (2005) Suicide among regular-duty military personnel: a retrospective case-control study of occupation-specific risk factors for workplace suicide. American Journal of Psychiatry 162, 1688-1696 MALMBERG, A., SIMKIN, S. & HAWTON, K. (1999) Suicide in farmers. British Journal of Psychiatry 175, 103-105 MALONE, K.M., OQUENDO, M.A., HAAS, G.L., ELLIS, S.P., LI, S. & MANN, J.J. (2000) Protective factors against suicidal acts in major depression: reasons for living. American Journal of Psychiatry 157, 1084-1088 MANDAL, A., EADEN, J., MAYBERRY, M.K. & MAYBERRY, J.F. (2000) Questionnaire surveys in medical research. Journal of Evaluation in Clinical Practice 6, 395-403 MANN, J.J. (2003) Neurobiology of suicidal behaviour. Nature Reviews Neuroscience 4, 819-828 MANN, J.J., APTER, A., BERTOLOTE, J., BEAUTRAIS, A., CURRIER, D., HAAS, A., HEGERL, U., LONNQVIST, J., MALONE, K., MARUSIC, A., MEHLUM, L., PATTON, G., PHILLIPS, M., RUTZ, W., RIHMER, Z., SCHMIDTKE, A., SHAFFER, D., SILVERMAN, M., TAKAHASHI, Y., VARNIK, A., WASSERMAN, D., YIP, P. & HENDIN, H. (2005) Suicide prevention strategies – a systematic review. Journal of the American Medical Association 294, 2064-2074 MANN, J.J., WATERNAUX, C., HAAS, G.L. & MALONE, K.M. (1999) Toward a clinical model of suicidal behaviour in psychiatric patients. American Journal of Psychiatry 156, 181-189
References 235
MARIS, R.W., BERMAN, A.L. & SILVERMAN, M.M. (2000) The social relations of suicides. In Comprehensive Textbook of Suicidology. New York, Guilford Publications. pp 240-265 MARTIN, F., RUBY, K. & FARNUM, J. (2003) Importance of the human-animal bond for pre-veterinary, first-year, and fourth-year veterinary students in relation to their career choice. Journal of Veterinary Medical Education 30, 67-72 MARTIN, F. & TAUNTON, A. (2005) Perceptions of the human-animal bond in veterinary education of veterinarians in Washington State: structured versus experiential learning. Journal of Veterinary Medical Education 32, 523-530 MARTIN, L.T. & KUBZANSKY, L.D. (2005) Childhood cognitive performance and risk of mortality: a prospective cohort study of gifted individuals. American Journal of Epidemiology 162, 887-890 MAYER, J.D. & SALOVEY, P. (1997) What is emotional intelligence? In Emotional Development and Emotional Intelligence: Educational Implications. Eds P. Salovey, D. Sluyter. New York, Basic Books. pp 3-31 MCCOLL, E., JACOBY, A., THOMAS, L., SOUTTER, J., BAMFORD, C., STEEN, N., THOMAS, R., HARVEY, E., GARRATT, A. & BOND, J. (2001) Design and use of questionnaires: a review of best practice applicable to surveys of health service staff and patients. Health Technology Assessment 5, 31 MCDOWELL, I. (2006) Measuring Health: A Guide to Rating Scales and Questionnaires. 3rd edn. New York, Oxford University Press MCGIRR, A., RENAUD, J., SEGUIN, M., ALDA, M., BENKELFAT, C., LESAGE, A. & TURECKI, G. (2007) An examination of DSM-IV depressive symptoms and risk for suicide completion in major depressive disorder: a psychological autopsy study. Journal of Affective Disorders 97, 203-209 MCKENZIE, K., SERFATY, M. & CRAWFORD, M. (2003) Suicide in ethnic minority groups. British Journal of Psychiatry 183, 100-101 MCLEAN, J., MAXWELL, M., PLATT, S., HARRIS, F. & JEPSON, R. (2008) Risk factors for suicide and suicidal behaviour: a literature review. Scottish Government Social Research. Available at http://www.scotland.gov.uk/Resource/Doc/251539/0073687.pdf [Accessed 07 Mar 2009] MCMANUS, I.C., KEELING, A. & PAICE, E. (2004) Stress, burnout and doctors' attitudes to work are determined by personality and learning style: a twelve year longitudinal study of UK medical graduates. BMC Medicine 2, 29 MEIT, S.S., BORGES, N.J. & EARLY, L.A. (2007) Personality profiles of incoming male and female medical students: results of a multi-site 9-year study. Medical Education Online 12, 7

References 236
MELCHIOR, M., CASPI, A., MILNE, B.J., DANESE, A., POULTON, R. & MOFFITT, T.E. (2007) Work stress precipitates depression and anxiety in young, working women and men. Psychological Medicine 37, 1119-1129 MELLANBY, R.J. (2005) Incidence of suicide in the veterinary profession in England and Wales. Veterinary Record 157, 415-417 MELLANBY, R.J. (2008) Suicide and the veterinary profession. Scientific Proceedings of 33rd Annual World Small Animal Veterinary Association Congress. FECAVA Symposium. 20-24 August, 2008. Dublin, Ireland. pp 266-268 MELLANBY, R.J. & HERRTAGE, M.E. (2004) Survey of mistakes made by recent veterinary graduates. Veterinary Record 155, 761-765 MELLANBY, R.J., PLATT, B., SIMKIN, S. & HAWTON K. (2008) Incidence of alcohol-related deaths in the veterinary profession in England and Wales, 1993-2005. The Veterinary Journal 181, 332-335 MELTZER, H., GRIFFITHS, C., BROCK, A., ROONEY, C. & JENKINS, R. (2008) Patterns of suicide by occupation in England and Wales: 2001-2005. British Journal of Psychiatry 193, 73-76 MELTZER, H., LADER, D., CORBIN, T., SINGLETON, N., JENKINS, R. & BRUGHA, T. (2002) Non-fatal suicidal behaviour among adults aged 16 to 74 in Great Britain. London, The Stationery Office MICHIE, S. & WILLIAMS, S. (2003) Reducing work related psychological ill health and sickness absence: a systematic literature review. Occupational and Environmental Medicine 60, 3-9 MILHAM, S. & OSSIANDER, E. (2001) Occupational mortality database, Washington State Department of Health, 1950-1999. Available at https://fortress.wa.gov/doh/occmort/ [Accessed 09 Sep 2008] MILLER, I.W., NORMAN, W.H., BISHOP, S.B. & DOW, M.G. (1986) The modified scale for suicidal ideation: reliability and validity. Journal of Consulting and Clinical Psychology 54, 724-725 MILLER, J.M. & BEAUMONT, J.J. (1995) Suicide, cancer and other causes of death among California veterinarians, 1960-1992. American Journal of Industrial Medicine 27, 37-49 MILLER, M., AZRAEL, D. & HEMENWAY, D. (2004) The epidemiology of case fatality rates for suicide in the Northeast. Annals of Emergency Medicine 43, 723-730 MITCHENER, K.L. & OGILVIE, G.K. (2002) Understanding compassion fatigue: keys for the caring veterinary healthcare team. Journal of the American Animal Hospital Association 38, 307-310
References 237
MOŚCICKI, E.K. (1997) Identification of suicide risk factors using epidemiologic studies. Psychiatric Clinics of North America 20, 499-517 MOUNT, M.K., BARRICK, M.R., SCULLEN, S.M & ROUNDS, J. (2005) Higher-order dimensions of the big five personality traits and the big six vocational interest types. Personnel Psychology 58, 447-478 MUKAMAL, K.J., KAWACHI, I., MILLER, M. & RIMM, E.B. (2007) Drinking frequency and quantity and risk of suicide among men. Social Psychiatry and Psychiatric Epidemiology 42, 153-160 MURPHY, G.E. (1998) Why women are less likely than men to commit suicide. Comprehensive Psychiatry 39, 165-175 MUSTARD, C. (2004) Work-related stress in the UK: a new, ‘Management Standards’ approach. Work & Stress 18, 140-141 NAKASH, R.A., HUTTON, J.L., JØRSTAD-STEIN, E.C., GATES, S. & LAMB, S.E. (2006) Maximising response to postal questionnaires – a systematic review of randomised trials in health research. BMC Medical Research Methodology 6, 5 NECKELMANN, D., MYKLETUN, A. & DAHL, A.A. (2007) Chronic insomnia as a risk factor for developing anxiety and depression. Sleep 30, 873-880 NEELEMAN, J. (1998) Regional suicide rates in the Netherlands: does religion still play a role? International Journal of Epidemiology 27, 466-472 NEELEMAN, J., HAPLERN, D., LEON, D. & LEWIS, G. (1997) Tolerance of suicide, religion and suicide rates: an ecological and individual study in 19 Western countries. Psychological Medicine 27, 1165-1171 NETEMEYER, R.G., BOLES, J.S. & MCMURRIAN, R. (1996) Development and validation of work-family conflict and family-work conflict scales. Journal of Applied Psychology 81, 400-410 NETTERSTRØM, B., CONRAD, N., BECH, P., FINK, P., OLSEN, O., RUGULIES, R. & STANSFELD, S. (2008) The relation between work-related psychosocial factors and the development of depression. Epidemiologic Reviews 30, 118-132 NUSBAUM, K.E., WENZEL, J.G.W. & EVERLY, G.S., Jr. (2007) Psychologic first aid and veterinarians in rural communities undergoing livestock depopulation. Journal of the American Veterinary Medical Association 231, 692-694 O'CONNOR, R.C. (2007) The relations between perfectionism and suicidality: a systematic review. Suicide and Life-Threatening Behavior 37, 698-714 O'CONNOR, R.C. & NOYCE, R. (2008) Personality and cognitive processes: self-criticism and different types of rumination as predictors of suicidal ideation. Behaviour Research and Therapy 46, 392-401

References 238
OOMENS, S., GEURTS, S. & SCHEEPERS, P. (2007) Combining work and family in the Netherlands: blessing or burden for one’s mental health? International Journal of Law and Psychiatry 30, 369-384 OSTRY, A., MAGGI, S., TANSEY, J., DUNN, J., HERSHLER, R., CHEN, L., LOUIE, A.M. & HERTZMAN, C. (2007) The impact of psychosocial work conditions on attempted and completed suicide among western Canadian sawmill workers. Scandinavian Journal of Public Health 35, 265-271 PALLANT, J.F. & TENNANT, A. (2007) An introduction to the Rasch measurement model: an example using the Hospital Anxiety and Depression Scale (HADS). British Journal of Clinical Psychology 46, 1-18 PARKER, J.D.A., CREQUE, R.E., Sr, BARNHART, D.L., HARRIS, J.I., MAJESKI, S.A., WOOD, L.M., BOND, B.J. & HOGAN, M.J. (2004) Academic achievement in high school: does emotional intelligence matter? Personality and Individual Differences 37, 1321-1330 PARKINSON, J. (2006) Establishing national mental health and well-being indicators for Scotland. Journal of Public Mental Health 5, 42-48 PAUL, E.S. & PODBERSCEK, A.L. (2000) Veterinary education and students' attitudes towards animal welfare. Veterinary Record 146, 269-272 PAYKEL, E.S., MYERS, J.K., LINDENTHAL, J.J. & TANNER, J. (1974) Suicidal feelings in the general population: a prevalence study. British Journal of Psychiatry 124, 460-469 PECK, D.F. (2005) Foot and mouth outbreak: lessons for mental health services. Advances in Psychiatric Treatment 11, 270-276 PECK, D.F., GRANT, S., MCARTHUR, W. & GODDEN, D. (2002) Psychological impact of foot-and-mouth disease on farmers. Journal of Mental Health 11, 523-531 PETERSEN, M.R. & BURNETT, C.A. (2008) The suicide mortality of working physicians and dentists. Occupational Medicine 58, 25-29 PETRIDES, K.V., FREDERICKSON, N. & FURNHAM, A. (2004) The role of trait emotional intelligence in academic performance and deviant behavior at school. Personality and Individual Differences 36, 277-293 PHILLIPS-MILLER, D.L., CAMPBELL, N.J. & MORRISON, C.R. (2000) Work and family: satisfaction, stress, and spousal support. Journal of Employment Counseling 37, 16-30 PHILLIPS-MILLER, D., MORRISON, C. & CAMPBELL, N.J. (2001) Same profession, different career: a study of men and women in veterinary medicine. In Advances in Psychology Research, Volume 5. Ed F. Columbus. New York, Nova Science Publishers. pp 1-53
References 239
PLATT, S. & HAWTON, K. (2000) Suicidal behaviour and the labour market. In The International Handbook of Suicide and Attempted Suicide. Eds K. Hawton, K. van Heeringen. Chichester, Wiley. pp 309-384 PLATT, S., PAVIS, S. & AKRAM, G. (1999) Changing labour market conditions and health: a systematic literature review 1993-98. Report for European Foundation for the Improvement of Living and Working Conditions. Luxembourg, Office for Official Publications of the European Communities. http://www.eurofound.europa.eu/pubdocs/1999/15/en/1/ef9915en.pdf [Accessed 22 May 2008] PTACEK, J.T., LEONARD, K. & MCKEE, T.L. (2004) “I’ve got some bad news…”: veterinarians’ recollections of communicating bad news to clients. Journal of Applied Social Psychology 34, 366-390 RAEKALLIO, M., HEINONEN, K.M., KUUSSAARI, J. & VAINIO, O. (2003) Pain alleviation in animals: attitudes and practices of Finnish veterinarians. Veterinary Journal 165, 131-135 RCVS (2007) Annual Report 2007. London, Royal College of Veterinary Surgeons REEVE, C.L., ROGELBERG, S.G., SPITZMÜLLER, C. & DIGIACOMO, N. (2005) The caring-killing paradox: euthanasia-related strain among animal-shelter workers. Journal of Applied Social Psychology 35, 119-143 REICHENBERG, A. & MACCABE, J.H. (2007) Feeling the pressure: work stress and mental health. Psychological Medicine 37, 1073-1074 REIJULA, K., RÄSÄNEN, K., HÄMÄLÄINEN, M., JUNTUNEN, K., LINDBOHM, M., TASKINEN, H., BERGBOM, B. & RINTA-JOUPPI, M. (2003) Work environment and occupational health of Finnish veterinarians. American Journal of Industrial Medicine 44, 46-57 REINERT, D.F. & ALLEN, J.P. (2007) The alcohol use disorders identification test: an update of research findings. Alcoholism: Clinical and Experimental Research 31, 185-199 REISBIG, A.M.J., HAFEN, M., Jr, WHITE, M.B. & RUSH, B.R. (2007) Improving response rates: introducing an anonymous longitudinal survey research protocol for veterinary medical students. Journal of Veterinary Medical Education 34, 194-200 RÉSIÈRE, D., MÉGARBANE, B., MANET, P., BUISINE, A. & HILPERT, F. (2001) Acute intoxication by pentobarbital. Presse Medicale 30, 269-270 RICE, D. (2008) Suicide by veterinary surgeons [Letter]. Veterinary Record 162, 355 RICK, J., BRINER, R.B., DANIELS, K., PERRYMAN, S. & GUPPY, A. (2001) A critical review of psychosocial hazard measures. Contract research report 356/2001. Sudbury, HSE Books

References 240
ROBINSON, D. & HOOKER, H. (2006) The UK Veterinary Profession in 2006: The Findings of a Survey of the Profession Conducted by the Royal College of Veterinary Surgeons. London, RCVS ROGELBERG, S.G., DIGIACOMO, N., REEVE, C.L., SPITZMULLER, C., CLARK, O.L., TEETER, L., WALKER, A.G., CARTER, N.T. & STARLING, P.G. (2007) What shelters can do about euthanasia-related stress: an examination of recommendations from those on the front line. Journal of Applied Animal Welfare Science 10, 331-347 ROHLF, V. & BENNETT, P. (2005) Perpetration-induced traumatic stress in persons who euthanize nonhuman animals in surgeries, animal shelters, and laboratories. Society & Animals 13, 201-219 ROLLIN, B.E. (1987) Euthanasia and moral stress. Loss, Grief & Care 1, 115-126 ROLLIN, B.E. (2006) An Introduction to Veterinary Medical Ethics: Theory and Cases. 2nd edn. Oxford, Blackwell ROMAIN, N., GIROUD, C., MICHAUD, K. & MANGIN, P. (2003) Suicide by injection of a veterinarian barbiturate euthanasia agent: report of a case and toxicological analysis. Forensic Science International 131, 103-107 ROSE, G. ([1992] 2008) Rose’s strategy of preventive medicine. Oxford, Oxford University Press ROSTA, J. (2008) Hazardous alcohol use among hospital doctors in Germany. Alcohol & Alcoholism 43, 198-203 ROUTLY, J.E., TAYLOR, I.R., TURNER, R., MCKERNAN, E.J. & DOBSON, H. (2002) Support needs of veterinary surgeons during the first few years of practice: perceptions of recent graduates and senior partners. Veterinary Record 150, 167-171 ROYAL COLLEGE OF NURSING (2006) At breaking point? A survey of the wellbeing and working lives of nurses in 2005. London, Royal College of Nursing. http://www.rcn.org.uk/__data/assets/pdf_file/0003/78690/003021.pdf [Accessed 28 Apr 2008] RUMPF, H.J., HAPKE, U., MEYER, C. & JOHN, U. (2002) Screening for alcohol use disorders and at-risk drinking in the general population: psychometric performance of three questionnaires. Alcohol & Alcoholism 37, 261-268 RYFF, C.D. & KEYES, C.L.M. (1995) The structure of psychological well-being revisited. Journal of Personality and Social Psychology 69, 719-727 SANDERS, C.R. (1995) Killing with kindness: veterinary euthanasia and the social construction of personhood. Sociological Forum 10, 195-214
References 241
SANNE, B., MYKLETUN, A., DAHL, A.A., MOEN, B.E. & TELL, G.S. (2003) Occupational differences in levels of anxiety and depression: the Hordaland Health Study. Journal of Occupational and Environmental Medicine 45, 628-638 SANNE, B., MYKLETUN, A., DAHL, A.A., MOEN, B.E. & TELL, G.S. (2005) Testing the job demand-control-support model with anxiety and depression as outcomes: the Hordaland Health Study. Occupational Medicine 55, 463-473 SAREEN, J., COX, B.J., AFIFI, T.O., DE GRAAF, R., ASMUNDSON, G.J.G., TEN HAVE, M. & STEIN, M.B. (2005) Anxiety disorders and risk for suicidal ideation and suicide attempts: a population-based longitudinal study of adults. Archives of General Psychiatry 62, 1249-1257 SARTORIUS, N. (2007) Stigma and mental health. Lancet 370, 810-811 SAUNDERS, J.B., AASLAND, O.G., BABOR, T.F., DE LA FUENTE, J.R. & GRANT, M. (1993) Development of the alcohol use disorders identification test (AUDIT): WHO collaborative project on early detection of persons with harmful alcohol consumption – II. Addiction 88, 791-804 SAUNDERS, K.E.A. & HAWTON, K. (2006) Suicidal behaviour and the menstrual cycle. Psychological Medicine 36, 901-912 SCHERNHAMMER, E.S. & COLDITZ, G.A. (2004) Suicide rates among physicians: a quantitative and gender assessment (meta-analysis). American Journal of Psychiatry 161, 2295-2302 SCHNEIDER, B., WETTERLING, T., SARGK, D., SCHNEIDER, F., SCHNABEL, A., MAURER, K. & FRITZE, J. (2006) Axis I disorders and personality disorders as risk factors for suicide. European Archives of Psychiatry and Clinical Neuroscience 256, 17-27 SCHUTTE, N.S., MALOUFF, J.M., THORSTEINSSON, E.B., BHULLAR, N. & ROOKE, S.E. (2007) A meta-analytic investigation of the relationship between emotional intelligence and health. Personality and Individual Differences 42, 921-933 SEALE, C. (2009) Legalisation of euthanasia or physician-assisted suicide: survey of doctors’ attitudes. Palliative Medicine 23, 205-212 SEBO, P., GALLACCHI, M.B., GOEHRING, C., KÜNZI, B. & BOVIER, P.A. (2007) Use of tobacco and alcohol by Swiss primary care physicians: a cross-sectional survey. BMC Public Health 7, 5 SERPELL, J.A. (2005) Factors influencing veterinary students’ career choices and attitudes to animals. Journal of Veterinary Medical Education 32, 491-496 SHEEHY, N. & O’CONNOR, R.C. (2008) Cognitive style and suicidal behaviour. In Suicide: Strategies and Interventions for Reduction and Prevention. Ed S. Palmer. Hove, Routledge. pp 69-83

References 242
SHORT, N. & LANE, A. (2007) Using interactive theatre in veterinary education to promote mental health awareness. Abstracts of Association for Medical Education in Europe Annual Conference. 25-29 August, 2007. Trondheim, Norway. p 95 SHORT, N. & SOMERS, J. (2007) Raising awareness of mental health in the veterinary profession. The Academy Subject Centre for Medicine, Dentistry and Veterinary Medicine Newsletter 01, No. 15, December 2007. pp 16-17. http://www.medev.ac.uk/external_files/pdfs/01_newsletter/0115_lo_res.pdf [Accessed 01 Mar 2008] SHOUKSMITH, G. & HESKETH, B. (1986) Changing horses in mid-stream: job and life satisfaction for veterinarians. New Zealand Veterinary Journal 34, 141-144 SIEGRIST, J. (1996) Adverse health effects of high-effort/low-reward conditions. Journal of Occupational Health Psychology 1, 27-41 SIEGRIST, J. (2008) Chronic psychosocial stress at work and risk of depression: evidence from prospective studies. European Archives of Psychiatry and Clinical Neuroscience 258 (Suppl. 5), 115-119 SIEGRIST, J., STARKE, D., CHANDOLA, T., GODIN, I., MARMOT, M., NIEDHAMMER, I. & PETER, R. (2004) The measurement of effort-reward imbalance at work: European comparisons. Social Science & Medicine 58, 1483-1499 SINGLETON, N., BUMPSTEAD, R., O’BRIEN, M., LEE, A. & MELTZER, H. (2001) Psychiatric Morbidity among Adults Living in Private Households, 2000. London, The Stationery Office SINGLETON, N. & LEWIS, G. (2003) Better or Worse: A Longitudinal Study of the Mental Health of Adults Living in Private Households in Great Britain. London, The Stationery Office SINOKKI, M., HINKKA, K., AHOLA, K., KOSKINEN, S., KLAUKKA, T., KIVIMÄKI, M., PUUKKA, P., LÖNNQVIST, J. & VIRTANEN, M. (2009) The association between team climate at work and mental health in the Finnish Health 2000 Study. Occupational and Environmental Medicine, Published online first: 9 Apr 2009. doi:10.1136/oem.2008.043299 SMEETH, L. & FLETCHER, A.E. (2002) Improving the response rates to questionnaires. British Medical Journal 324, 1168-1169 SMITH, R.A. & LEWIS, D. (1989) Suicide by ingestion of T-61. Veterinary and Human Toxicology 31, 319-320 SNAITH, R.P. (2003) The Hospital Anxiety and Depression Scale. Health and Quality of Life Outcomes 1, 29 STACK, S. (2001) Occupation and suicide. Social Science Quarterly 82, 384-396

References 243
STANSFELD, S. (2002) Work, personality and mental health. British Journal of Psychiatry 181, 96-98 STANSFELD, S. & CANDY, B. (2006) Psychosocial work environment and mental health – a meta-analytic review. Scandinavian Journal of Work, Environment and Health 32, 443-462 STANSFELD, S.A., CLARK, C., CALDWELL, T., RODGERS, B. & POWER, C. (2008) Psychosocial work characteristics and anxiety and depressive disorders in midlife: the effects of prior psychological distress. Occupational and Environmental Medicine 65, 634-642 STANSFELD, S.A., FUHRER, R., SHIPLEY, M.J. & MARMOT, M.G. (2002) Psychological distress as a risk factor for coronary heart disease in the Whitehall II study. International Journal of Epidemiology 31, 248-255 STANSFELD, S.A., HEAD, J., RASUL, F., SINGLETON, N. & LEE, A. (2003) Occupation and mental health: secondary analyses of the ONS Psychiatric Morbidity Survey of Great Britain. Research report 168. Sudbury, HSE Books STARK, C., BELBIN, A., HOPKINS, P., GIBBS, D., HAY, A. & GUNNELL, D. (2006a) Male suicide and occupation in Scotland. Health Statistics Quarterly 29, 26-29 STARK, C., GIBBS, D., HOPKINS, P., BELBIN, A., HAY, A. & SELVARAJ, S. (2006b) Suicide in farmers in Scotland. Rural and Remote Health 6, 509 STERKEN, J., TROUBLEYN, J., GASTHUYS, F., MAES, V., DILTOER, M. & VERBORGH, C. (2004) Intentional overdose of Large Animal Immobilon. European Journal of Emergency Medicine 11, 298-301 STEWART-BROWN, S. (2005) Interpersonal relationships and the origins of mental health. Journal of Public Mental Health 4, 24-29 STEWART-BROWN, S. & JANMOHAMED, K. (2008) Warwick-Edinburgh Mental Well-being Scale. User Guide Version 1, June 2008. Ed J. Parkinson. Available at http://www.healthscotland.com/documents/2702.aspx [Accessed 16 Apr 2009] STEWART-BROWN, S., TENNANT, A., TENNANT, R., PLATT, S. & PARKINSON, J. (2009) Internal construct validity of the Warwick-Edinburgh Mental Well-being Scale (WEMWBS): a Rasch analysis using data from the Scottish Health Education Population Survey. Health and Quality of Life Outcomes 7, 15 STOCKWELL, T., MURPHY, D. & HODGSON, R. (1983) The severity of alcohol dependence questionnaire: its use, reliability and validity. British Journal of Addiction 78, 145-155

References 244
STORDAL, E., MORKEN, G., MYKLETUN, A., NECKELMANN, D. & DAHL, A.V. (2008) Monthly variation in prevalence rates of comorbid depression and anxiety in the general population at 63-65° North: the HUNT study. Journal of Affective Disorders 106, 273-278 STOWELL, L.I. (1998) Suicide with the veterinary drug acepromazine. Journal of Analytical Toxicology 22, 166-168 TABANELLI, M.C., DEPOLO, M., COOKE, R.M.T., SARCHIELLI, G., BONFIGLIOLI, R., MATTIOLI, S. & VIOLANTE, F.S. (2008) Available instruments for measurement of psychosocial factors in the work environment. International Archives of Occupational and Environmental Health 82, 1-12. Published online first: 13 Mar 2008. doi: 10.1007/s00420-008-0312-6 TANNENBAUM, J. (1993) Veterinary medical ethics: a focus of conflicting interests. Journal of Social Issues 49, 143-156 TARIS, T.W. & KOMPIER, M. (2003) Challenges in longitudinal designs in occupational health psychology. Scandinavian Journal of Work, Environment and Health 29, 1-4 TAYLOR, C., GRAHAM, J., POTTS, H., CANDY, J., RICHARDS, M. & RAMIREZ, A. (2007) Impact of hospital consultants’ poor mental health on patient care. British Journal of Psychiatry 190, 268-269 TAYLOR, C., GRAHAM, J., POTTS, H.W.W., RICHARDS, M.A. & RAMIREZ, A.J. (2005) Changes in mental health of UK hospital consultants since the mid-1990s. Lancet 366, 742-744 TENNANT, R., HILLER, L., FISHWICK, R., PLATT, S., JOSEPH, S., WEICH, S., PARKINSON, J., SECKER, J. & STEWART-BROWN, S. (2007) The Warwick-Edinburgh Mental Well-being Scale (WEMWBS): development and UK validation. Health and Quality of Life Outcomes 5, 63 THEORELL, T. & HASSELHORN, H.M. (2005) On cross-sectional questionnaire studies of relationships between psychosocial conditions at work and health – are they reliable? International Archives of Occupational and Environmental Health 78, 517-522 THOMPSON, A.H. (2008) Younger onset of depression is associated with greater suicidal intent. Social Psychiatry and Psychiatric Epidemiology 43, 538-544 TIMMINS, R.P. (2006) How does emotional intelligence fit into the paradigm of veterinary medical education? Journal of Veterinary Medical Education 33, 71-75 TORRE, D.M., WANG, N.Y., MEONI, L.A., YOUNG, J.H., KLAG, M.J. & FORD, D.E. (2005) Suicide compared to other causes of mortality in physicians. Suicide and Life-Threatening Behavior 35, 146-153
References 245
TRIMPOP, R., AUSTIN, E.J. & KIRKCALDY, B.D. (2000a) Occupational and traffic accidents among veterinary surgeons. Stress Medicine 16, 243-257 TRIMPOP, R., KIRKCALDY, B., ATHANASOU, J. & COOPER, C. (2000b) Individual differences in working hours, work perceptions and accident rates in veterinary surgeries. Work & Stress 14, 181-188 TYSSEN, R., DOLATOWSKI, F.C., RØVIK, J.O., THORKILDSEN, R.F., EKEBERG, Ø., HEM, E., GUDE, T., GRØNVOLD, N.T. & VAGLUM, P. (2007) Personality traits and types predict medical school stress: a six-year longitudinal and nationwide study. Medical Education 41, 781-787 TYSSEN, R., HEM, E., VAGLUM, P., GRØNVOLD, N.T. & EKEBERG, Ø. (2004) The process of suicidal planning among medical doctors: predictors in a longitudinal Norwegian sample. Journal of Affective Disorders 80, 191-198 TYSSEN, R. & VAGLUM, P. (2002) Mental health problems among young doctors: an updated review of prospective studies. Harvard Review of Psychiatry 10, 154-165 TYSSEN, R., VAGLUM, P., GRØNVOLD, N.T. & EKEBERG, Ø. (2001a) Factors in medical school that predict postgraduate mental health problems in need of treatment: a nationwide and longitudinal study. Medical Education 35, 110-120 TYSSEN, R., VAGLUM, P., GRØNVOLD, N.T. & EKEBERG, Ø. (2001b) Suicidal ideation among medical students and young physicians: a nationwide and prospective study of prevalence and predictors. Journal of Affective Disorders 64, 69-79 VAN HEERINGEN, K. (2002) Towards a psychobiological model of the suicidal process. In Understanding Suicidal Behaviour: The Suicidal Process Approach to Research, Treatment and Prevention. Ed K. van Heeringen. Chichester, Wiley. pp 136-159 VANGEEST, J.B., JOHNSON, T.P. & WELCH, V.L. (2007) Methodologies for improving response rates in surveys of physicians: a systematic review. Evaluation & the Health Professions 30, 303-321 VBF (2007) Annual Report and Accounts 2006. London, Veterinary Benevolent Fund VERROTTI, A., CICCONETTI, A., SCORRANO, B., DE BERARDIS, D., COTELLESSA, C., CHIARELLI, F. & FERRO, F.M. (2008) Epilepsy and suicide: pathogenesis, risk factors and prevention. Neuropsychiatric Disease and Treatment 4, 365-370 VORACEK, M. (2004) National intelligence and suicide rate: an ecological study of 85 countries. Personality and Individual Differences 37, 543-553 VOYDANOFF, P. (2004) The effects of work demands and resources on work-to-family conflict and facilitation. Journal of Marriage and Family 66, 398-412
References 246
WALDENSTRÖM, K., AHLBERG, G., BERGMAN, P., FORSELL, Y., STOETZER, U., WALDENSTRÖM, M. & LUNDBERG, I. (2008) Externally assessed psychosocial work characteristics and diagnoses of anxiety and depression. Occupational and Environmental Medicine 65, 90-96 WALLACE, P. (2001) Patients with alcohol problems – simple questioning is the key to effective identification and management. British Journal of General Practice 51, 172-173 WANG, J.L. (2006) Perceived work stress, imbalance between work and family/personal lives, and mental disorders. Social Psychiatry and Psychiatric Epidemiology 41, 541-548 WANG, P.S., SIMON, G.E., AVORN, J., AZOCAR, F., LUDMAN, E.J., MCCULLOCH, J., PETUKHOVA, M.Z. & KESSLER, R.C. (2007) Telephone screening, outreach, and care management for depressed workers and impact on clinical and work productivity outcomes: a randomized controlled trial. Journal of the American Medical Association 298, 1401-1411 WATSON, D., CLARK, L.A. & TELLEGEN, A. (1988) Development and validation of brief measures of positive and negative affect: the PANAS scales. Journal of Personality and Social Psychology 6, 1063-1070 WEBSTER, S., BUCKLEY, P. & ROSE, I. (2007) Psychosocial working conditions in Britain in 2007. London, Health and Safety Executive WHITE, A., SHIRALKAR, P., HASSAN, T., GALBRAITH, N. & CALLAGHAN, R. (2006) Barriers to mental healthcare for psychiatrists. Psychiatric Bulletin 30, 382-384 WHITTINGTON, J.E. & HUPPERT, F.A. (1996) Changes in the prevalence of psychiatric disorder in a community are related to changes in the mean level of psychiatric symptoms. Psychological Medicine 26, 1253-1260 WHO (2001) Mental health: strengthening mental health promotion (Fact Sheet No. 220). Geneva, World Health Organization WIECLAW, J., AGERBO, E., MORTENSEN, P.B. & BONDE, J.P. (2005) Occupational risk of affective and stress-related disorders in the Danish workforce. Scandinavian Journal of Work, Environment and Health 31, 343-351 WIECLAW, J., AGERBO, E., MORTENSEN, P.B. & BONDE, J.P. (2006a) Risk of affective and stress-related disorders among employees in human service professions. Occupational and Environmental Medicine 63, 314-319 WIECLAW, J., AGERBO, E., MORTENSEN, P.B., BURR, H., TÜCHSEN, F. & BONDE, J.P. (2006b) Work related violence and threats and the risk of depression and stress disorders. Journal of Epidemiology and Community Health 60, 771-775

References 247
WILHELM, K., KOVESS, V., RIOS-SEIDEL, C. & FINCH, A. (2004) Work and mental health. Social Psychiatry and Psychiatric Epidemiology 39, 866-873 WILKINS, J.R., HUESTON, W.D., CRAWFORD, J.M., STEELE, L.L. & GERKEN, D.F. (1997) Mixed-mode survey of female veterinarians yields high response rate. Occupational Medicine 47, 458-462 WILLIAMS, D. (2006) Pressures of student debt [Letter]. Veterinary Record 158, 383 WILLIAMS, J.M.G. & BROADBENT, K. (1986) Autobiographical memory in suicide attempters. Journal of Abnormal Psychology 95, 144-149 WILLIAMS, J.M.G. & POLLOCK, L.R. (2002) Psychological aspects of the suicidal process. In Understanding Suicidal Behaviour: The Suicidal Process Approach to Research, Treatment and Prevention. Ed K. van Heeringen. Chichester, Wiley. pp 76-93 WILLIAMS, S.M., ARNOLD, P.K. & MILLS, J.N. (2005) Coping with stress: a survey of Murdoch University veterinary students. Journal of Veterinary Medical Education 32, 201-212 WORLEY, L.L.M. (2008) Our fallen peers: a mandate for change. Academic Psychiatry 32, 8-12 YIP, P.S.F., YANG, K.C.T., IP, B.Y.T., LAW, Y.W. & WATSON, R. (2007) Financial debt and suicide in Hong Kong SAR. Journal of Applied Social Psychology 37, 2788-2799 ZEMAITIENE, N. & ZABORSKIS, A. (2005) Suicidal tendencies and attitude towards freedom to choose suicide among Lithuanian schoolchildren: results from three cross-sectional studies in 1994, 1998 and 2002. BMC Public Health 5, 83 ZENNER, D., BURNS, G.A., RUBY, K.L., DEBOWES, R.M. & STOLL, S.K. (2005) Veterinary students as elite performers: preliminary insights. Journal of Veterinary Medical Education 32, 242-248 ZIGMOND, A.S. & SNAITH, R.P. (1983) The Hospital Anxiety and Depression Scale. Acta Psychiatrica Scandinavica 67, 361-370

Appendices 248
APPENDICES

Appendix I: Questionnaire 249
Appendix I:
Questionnaire

Appendix I: Questionnaire 250
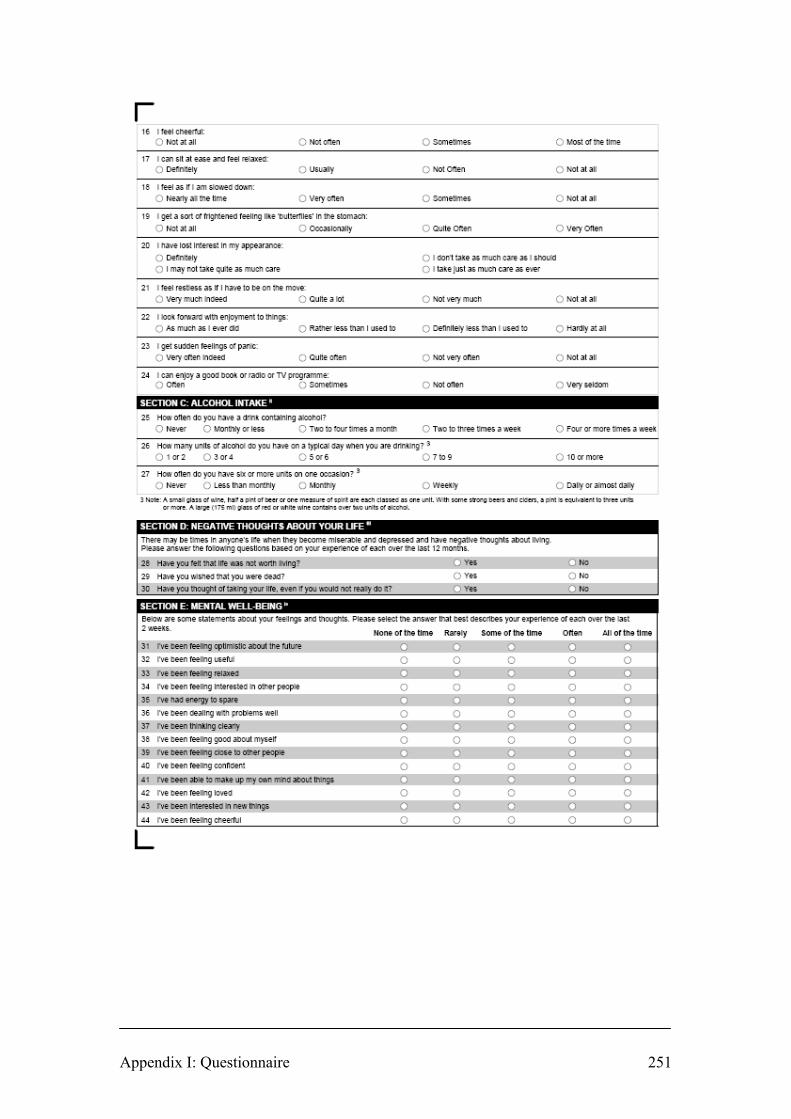
Appendix I: Questionnaire 251

Appendix I: Questionnaire 252

Appendix I: Questionnaire 253
Appendix II: Covering letters mailed with questionnaires 254
Appendix II:
Covering letters mailed with questionnaires

David J. Bartram External supervisor: BVetMed MRCVS Dr David S. Baldwin 43 Leafy Lane MB BS DM FRCPsych Whiteley Reader in Psychiatry Fareham Division of Clinical Neurosciences Hants. PO15 7HL School of Medicine E-mail: [email protected] University of Southampton www,vetwellbeing.co.uk October 2007 Dear Colleague Survey of mental health and well-being in the UK veterinary profession You are one of 3,200 veterinary surgeons in the UK selected at random and invited to participate in this survey; an independent, academic research initiative with external supervision through the School of Medicine, University of Southampton. The study is prompted by the statistic that a disproportionately high number of veterinary surgeons die by suicide: one of the highest rates of any occupation. The purpose of this survey is to identify some of the variables associated with work-related stress and inform the development of strategies to help improve mental health within the veterinary profession. The measured parameters will be compared against normative data for the UK population (and other professions where possible) and provide a baseline from which to monitor change and future trends. The results will be available to the British Veterinary Association and the Royal College of Veterinary Surgeons and submitted for publication in peer-reviewed veterinary and medical journals. Participation is voluntary. You are encouraged to complete and return the questionnaire regardless of whether you have any past or present experience of stress or mental health problems. It takes around 20 minutes to complete. Your answers are needed to help ensure that the results are representative and can be generalised to the whole profession. A high response rate is critical to the success of the survey. Your responses are anonymous. The source of individual data cannot be identified so confidentiality is assured. The study has been reviewed by an NHS Research Ethics Committee to help protect the interests of participants. The survey-based research expertise of Veterinary Business Development Ltd. is used to distribute the questionnaire and receive the envelopes containing the responses. The study is otherwise completely independent of the company and is entirely non-commercial. I hope that you will be able to assist in this key initiative and thank you in advance for your response. Please try to return the completed questionnaire as soon as possible, or before the end of November at the latest, in the enclosed reply-paid envelope. If you have any questions or would like to know more about the study please contact me, preferably by sending an e-mail to the following address: [email protected] Yours faithfully
David J. Bartram BVetMed MRCVS

David J. Bartram External supervisor: BVetMed MRCVS Dr David S. Baldwin 43 Leafy Lane MB BS DM FRCPsych Whiteley Reader in Psychiatry Fareham Division of Clinical Neurosciences Hants. PO15 7HL School of Medicine E-mail: [email protected] University of Southampton www,vetwellbeing.co.uk November 2007 Dear Colleague REMINDER: Survey of mental health and well-being in the UK veterinary profession In October you should have received an invitation by post to participate in this survey, as one of 3,200 UK veterinary surgeons selected at random. As all responses are anonymous, it is not possible to identify who has already returned a completed questionnaire. This is a reminder letter with identical enclosures inviting you to respond if you have not yet done so. PLEASE COMPLETE AND RETURN THE QUESTIONNAIRE AS SOON AS POSSIBLE, OR BEFORE THE END OF NOVEMBER AT THE LATEST, IN THE ENCLOSED REPLY-PAID ENVELOPE. THE SURVEY RELATES TO ALL TYPES OF WORK, INCLUDING VETERINARY SURGEONS NOT WORKING IN CLINICAL PRACTICE OR WORKING OUTSIDE THE PROFESSION. If you have already responded, thank you for participating and please accept my apologies for this reminder letter which you can now ignore. The study, an academic research initiative supervised by the School of Medicine, University of Southampton, is prompted by the statistic that a disproportionately high number of veterinary surgeons die by suicide: one of the highest rates of any occupation. The purpose of this survey is to identify some of the variables associated with work-related stress and inform the development of strategies to help improve mental health within the veterinary profession. The measured parameters will be compared against normative data for the UK population (and other professions where possible) and provide a baseline from which to monitor change and future trends. The results will be available to the British Veterinary Association and the Royal College of Veterinary Surgeons and submitted for publication in peer-reviewed veterinary and medical journals. Participation is voluntary. You are encouraged to complete and return the questionnaire regardless of whether you have any past or present experience of stress or mental health problems. It takes around 20 minutes to complete. Your answers are needed to help ensure that the results are representative and can be generalised to the whole profession. A high response rate is critical to the success of the survey. The source of individual data cannot be identified so confidentiality is assured. The study has been reviewed by an NHS Research Ethics Committee to help protect the interests of participants. The survey-based research expertise of Veterinary Business Development Ltd. is used to distribute the questionnaire and receive the envelopes containing the responses. The study is otherwise completely independent of the company and is entirely non-commercial. I hope that you will be able to assist in this key initiative and thank you in advance for your response. If you have any questions or would like to know more about the study please contact me, preferably by sending an e-mail to the following address: [email protected] Yours faithfully
David J. Bartram BVetMed MRCVS

Appendix III: Pre-study awareness editorials 257
Appendix III:
Pre-study awareness editorials

Appendix III: Pre-study awareness editorials 258
Veterinary Record Vol 161, No 10, 8 September 2007, p. 360 Reproduced with permission of the British Veterinary Association
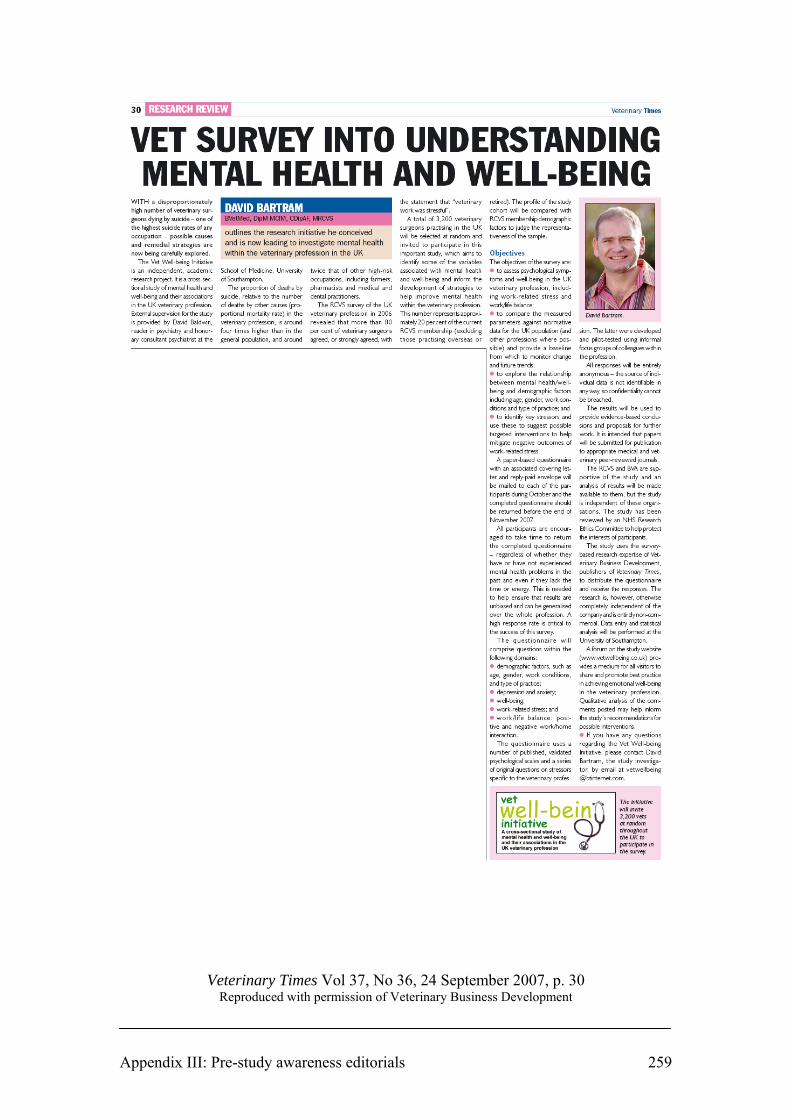
Appendix III: Pre-study awareness editorials 259
Veterinary Times Vol 37, No 36, 24 September 2007, p. 30 Reproduced with permission of Veterinary Business Development

Appendix III: Pre-study awareness editorials 260
UK Vet Livestock Vol 12, No 6, October 2007, p. 32 Reproduced with permission of Wiley-Blackwell, Oxford

Appendix IV: Reminder editorials 261
Appendix IV:
Reminder editorials
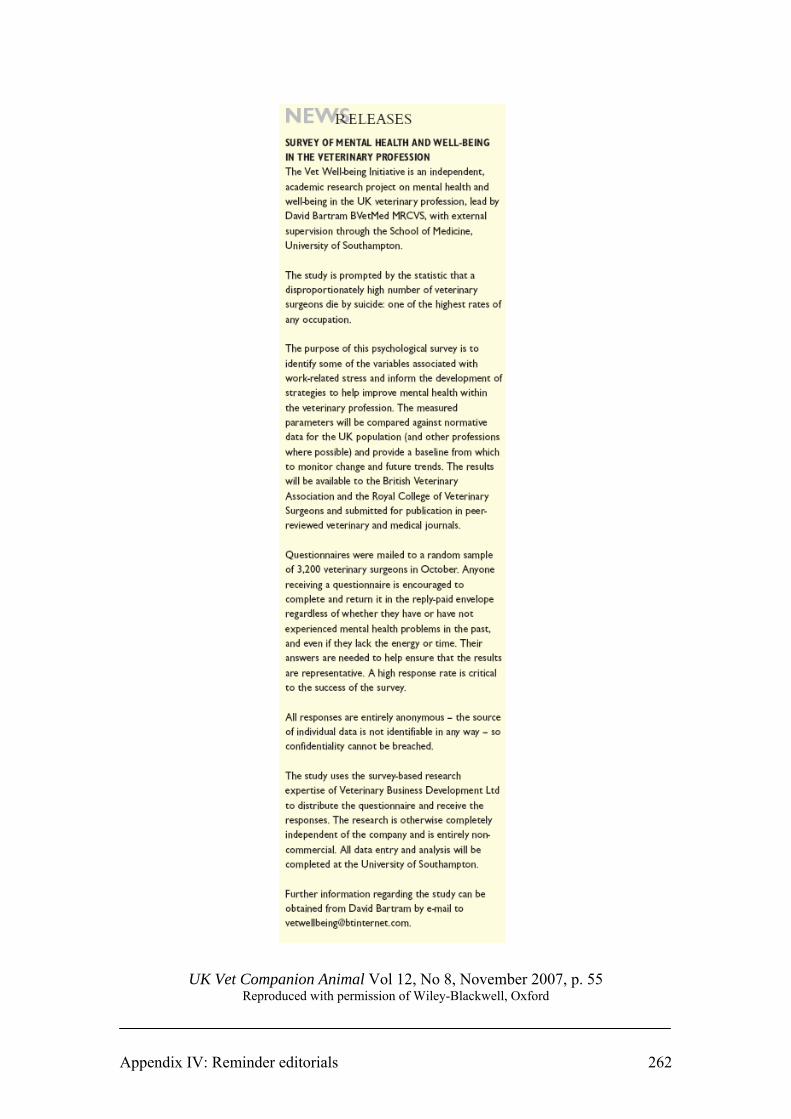
Appendix IV: Reminder editorials 262
UK Vet Companion Animal Vol 12, No 8, November 2007, p. 55
Reproduced with permission of Wiley-Blackwell, Oxford

Appendix IV: Reminder editorials 263
Veterinary Times Vol 37, No 44, 19 November 2007, p. 35 Reproduced with permission of Veterinary Business Development

Appendix IV: Reminder editorials 264
Veterinary Times Vol 37, No 48, 17 December 2007, p. 26 Reproduced with permission of Veterinary Business Development

Appendix V: Coding frame for sources of satisfaction 265
Appendix V:
Coding frame for sources of satisfaction
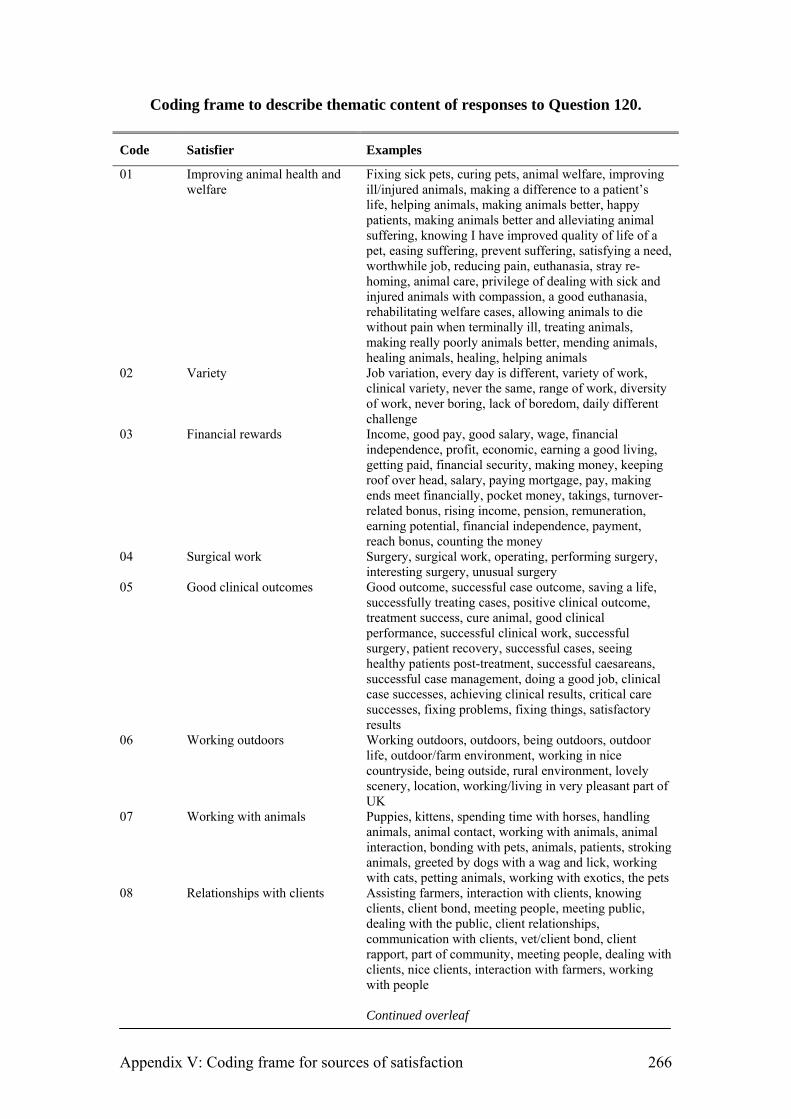
Appendix V: Coding frame for sources of satisfaction 266
Coding frame to describe thematic content of responses to Question 120.
Code Satisfier Examples
01 Improving animal health and welfare
Fixing sick pets, curing pets, animal welfare, improving ill/injured animals, making a difference to a patient’s life, helping animals, making animals better, happy patients, making animals better and alleviating animal suffering, knowing I have improved quality of life of a pet, easing suffering, prevent suffering, satisfying a need, worthwhile job, reducing pain, euthanasia, stray re-homing, animal care, privilege of dealing with sick and injured animals with compassion, a good euthanasia, rehabilitating welfare cases, allowing animals to die without pain when terminally ill, treating animals, making really poorly animals better, mending animals, healing animals, healing, helping animals
02 Variety Job variation, every day is different, variety of work, clinical variety, never the same, range of work, diversity of work, never boring, lack of boredom, daily different challenge
03 Financial rewards Income, good pay, good salary, wage, financial independence, profit, economic, earning a good living, getting paid, financial security, making money, keeping roof over head, salary, paying mortgage, pay, making ends meet financially, pocket money, takings, turnover-related bonus, rising income, pension, remuneration, earning potential, financial independence, payment, reach bonus, counting the money
04 Surgical work Surgery, surgical work, operating, performing surgery, interesting surgery, unusual surgery
05 Good clinical outcomes Good outcome, successful case outcome, saving a life, successfully treating cases, positive clinical outcome, treatment success, cure animal, good clinical performance, successful clinical work, successful surgery, patient recovery, successful cases, seeing healthy patients post-treatment, successful caesareans, successful case management, doing a good job, clinical case successes, achieving clinical results, critical care successes, fixing problems, fixing things, satisfactory results
06 Working outdoors Working outdoors, outdoors, being outdoors, outdoor life, outdoor/farm environment, working in nice countryside, being outside, rural environment, lovely scenery, location, working/living in very pleasant part of UK
07 Working with animals Puppies, kittens, spending time with horses, handling animals, animal contact, working with animals, animal interaction, bonding with pets, animals, patients, stroking animals, greeted by dogs with a wag and lick, working with cats, petting animals, working with exotics, the pets
08 Relationships with clients Assisting farmers, interaction with clients, knowing clients, client bond, meeting people, meeting public, dealing with the public, client relationships, communication with clients, vet/client bond, client rapport, part of community, meeting people, dealing with clients, nice clients, interaction with farmers, working with people
Continued overleaf

Appendix V: Coding frame for sources of satisfaction 267
Code Satisfier Examples
9 Relationships with colleagues Work colleagues, work social, friends at work, team support, colleagues, contact with colleagues, interaction with colleagues, talking with fellow staff, getting on well with support staff, communication with colleagues, pleasant colleagues, banter with staff, colleagues, fun in the office, the other members of staff, teamwork, nice staff, good team at work, tea and cake with colleagues, good working relationships, happy working environment, happy atmosphere, camaraderie with colleagues, working with mates, humour at work
10 Client satisfaction Appreciation for problems resolved, client satisfaction, good feedback from clients, satisfied and thankful clients, respect from clients, happy clients, making clients happy, clientele positive response, client gratitude, being thanked, client recommendation, positive client feedback, respect
11 Intellectual challenge/ learning Gaining new people or clinical skills, CPD, personal achievement, problem solving, making new diagnoses, solving a clinical puzzle, mental challenge, intellectual stimulation, using new techniques, clinical decision-making, knowledge, undertaking new procedures, science of medicine, reaching a diagnosis, keeping work up to date, learning, gaining my qualification for my own satisfaction, reading, learning a new technique, interesting work, acquiring new skills, working up a difficult case, a good diagnosis, intellectual freedom, problem solving, solving puzzles, correct diagnosis, strategic thinking, clinical accuracy, case discussion, performing a new/difficult procedure, diagnosis, maintaining competence, using your brain, solving clinical problems from referring practices, challenge and change, challenging cases, improving, mentally stimulating, clinical discussion, investigation, new cases, personal growth, learning new things, an interesting case, discovery, working up cases in insured animals, using my brain, stimulation, learning from professional colleagues, gaining RCVS certificate, mental stimulation, solving complicated medical cases
12 Teaching Teaching others, helping young vets, doing teaching well, development of colleagues, nurse training, clerking students, colleagues turning to me for advice, training staff, supporting new graduates, educating clients, sharing knowledge, supporting others, training and mentoring others, lecturing
13 Time off Job finish, annual leave/time off in lieu, holidays, finish on time, time off, going home, getting to the end of the day, completing of day’s work, half days, going home, day off each week for hobby, pending retirement, finishing on time, not being there, good time off, leave, quiet weekend on call, no night duty, weekends off, time off in week, Friday afternoon
Continued overleaf

Appendix V: Coding frame for sources of satisfaction 268
Code Satisfier Examples
14 Management Happy staff, running a good practice, managing staff well, tidy surgery, expansion-building the practice, running own company, project management, merging with neighbouring practice, leadership, own boss, influencing staff job satisfaction, seeing the office work effectively, success of the business, happy practice, thriving practice, keeping staff happy and motivated, developing staff, staff morale, organising things, staff satisfaction, in control, business, building up practice, building a good working environment, improving health and safety, running a successful business, owning a successful and respected business, contended and proactive staff, managing staff well, management, managing change in the practice, practice success, practice development, business planning, personnel management, financial management
15 Other Case continuity at my own branch, well-equipped practice, data analysis, pathology, excelling, sense of achievement, ultrasound, travelling, public perception of vets, efficient working days, little paperwork, satisfaction of job, independence, companionship, self determination, my Christian faith, being good at what I do, respect, other peoples’ disasters, escaping from domestic situation, profession itself, autonomy, practical nature of the job, positive feedback from boss, doing my best, client continuity, car, continuity of care, medicine, following cases through to conclusion, consults, status in society, admin project, success, efficiency, support, parturition, births, clinical freedom, professional recognition, doing a job well, being good at what I do, respected, profession, fulfilling lifelong ambition, admin, managing cases, orthopaedics, working environment, being efficient, avoiding paperwork, preventative e.g. vaccination/flea treatments, being ‘needed’ using high tech equipment, travelling, well equipped clinic, fulfilling my calling, practical, orthopaedics, imaging, working at favourite branch surgery, boss happy, good work/home balance, enjoying God’s creation, positive feedback from colleagues, nursing care, driving, not behind desk, getting in bad debts, keeping up with appointments list, IT work, manual skills, illegible
16 Not specified BLANK, who knows – too numb to know!, nothing! 17 Research Research, improving others’ experimental designs,
successful research results, statistics, getting a paper published, publishing
18 Flexibility Flexible hours, flexibility, flexibility of working, flexible time, being part time, working hours, short working hours, reasonable hours, suitability in family situation, flexi-time
19 Helping people Reducing client suffering, helping people, helpful to people, helping clients, helping others, assisting farmers, social worth, making people happy, managing complex decisions for clients, feel useful

Appendix VI: Study-related publications 269
Appendix VI
Selected study-related publications

Appendix VI: Study-related publications
BARTRAM, D.J. & BALDWIN, D.S. (2008) Veterinary surgeons and suicide:
influences, opportunities and research directions. Veterinary Record 162, 36-40

Special Article
Veterinary Record (2008) 162, 36-40
D. J. Bartram, BVetMed, DipM, MCIM, CDipAF, MRCVS,43 Leafy Lane, Whiteley, Fareham, Hampshire PO15 7HL
D. S. Baldwin, MB, BS, DM, FRCPsych,Clinical Neuroscience Division, School of Medicine, University of Southampton, RSH Hospital, Southampton SO14 0YG
Veterinary surgeons and suicide: influences, opportunities and research directions
Veterinary surgeons are at high risk of suicide, with a proportional mortality ratio approximately four times that of the general population and around twice that of other health care professions. It is uncertain whether this derives from the characteristics of individuals entering the profession, the nature of the work environment, or other factors known to influence suicide. In this article, David Bartram and David Baldwin present a hypothetical model to explain suicide risk in veterinary surgeons, and argue that research is required to validate the model and to inform the development of appropriate interventions.
D. J. Bartram, D. S. Baldwin
SEVERAL studies have found that members of some occu-pations are at greatly increased risk of suicide (Agerbo and others 2007), with reports of an elevated risk for health care professionals including doctors (Hawton and others 2001, Schernhammer and Colditz 2004), pharmacists (Kelly and Bunting 1998), dentists (Alexander 2001) and nurses (Hawton and Vislisel 1999). On the basis of proportional mortality ratios (PMRs) in England and Wales (Kelly and Bunting 1998, Mellanby 2005) and Scotland (Stark and others 2006), and similar estimates in the USA (Miller and Beaumont 1995), Australia (Jones-Fairnie and others 2008), and Norway (Hem and others 2005), veterinary surgeons appear to be at particu-larly high risk, around four times more likely to die of sui-cide than the general population and around twice as likely than other health care professionals. While PMR is a widely used measure, it should be acknowledged that the ratio is affected by the relative frequency of other causes of death. An increased PMR can indicate lower mortality from other causes as well as higher mortality from the cause being examined.
There are a number of problems in comparing the risk of suicide across occupational groups. These include the effects of different sociodemographic factors both between occu-pations and within occupational specialisms. It is important that confounding by such factors is adequately controlled (Wilhelm and others 2004). While most differences in suicide risk between occupations are accounted for by differences in income and employment status, the most striking excep-tions are veterinary surgeons, doctors, nurses and pharma-cists, who have significantly higher rates of suicide even when demographic factors are taken into account (Charlton 1995, Agerbo and others 2007).
These observations have prompted many investigations to aid understanding of the causes of the elevated suicide risk in the human health care professions and the development of suitable interventions. Although there has been much speculation regarding mechanisms of increased suicide risk in the veterinary profession, to date, there is a dearth of empirical research.
The risk factors for suicide are well known, including depression, alcohol and drug abuse, inherited factors, per-sonality factors, and environmental factors, including chronic major difficulties and undesirable life events such as separa-tion or divorce (Goldney 2005). Several circumstances may elevate the risk in specific occupations and, although the reasons are unclear, an interplay between various potentially malign influences is suggested for the veterinary profession.
POSSIBLE INFLUENCES ON THE SUICIDE RATE AMONG VETERINARIANS
The interrelations between work, personality and mental health are well documented (Stansfield 2002), but reports
specific to the veterinary profession (such as Halliwell and Hoskin 2005) have tended simply to present the observations and opinions of concerned individuals. These commentar-ies offer prima facie compelling concepts, but there has been little research to test their veracity. Little is known about the scope and magnitude of problematic outcomes, possible predisposing factors, or effective interventions for veterin-arians.
Access to means of suicideSuicidal impulses are often brief and, at the point at which a person feels hopeless and suicidal, ready access to means of suicide may be the key factor that influences the translation of suicidal thoughts into an actual suicide act (Hawton 2007). Access to lethal means has a strong influence on the suicide rate; for example, decreases in the rate have been associated with changes to non-toxic domestic gas from coal gas, the use of catalytic converters in cars, smaller over-the-counter pack sizes of paracetamol, and the installation of barriers on high bridges (Hawton 2007). Veterinary surgeons have ready access to medicines, as they are typically stored in practice premises, and knowledge of medicines for self-poisoning, which together offer a possible contributory factor for their high suicide rate. Deliberate self-poisoning is the most com-mon method of suicide by both male and female veterinari-ans, accounting for 76 and 89 per cent of suicides, respectively, compared with 20 and 46 per cent, respectively, of suicides in the general population (Kelly and Bunting 1998). Veterinary surgeons and pharmacists have the highest proportions of suicides using this method for all occupational groups; medi-cal practitioners also have an increased risk of this specific method of suicide (Kelly and Bunting 1998).
Attitudes to death and euthanasiaVeterinary surgeons are frequently responsible for ending the lives of animals, either directly in the case of euthanasia, or indirectly in the case of the slaughter of meat-producing livestock. The emotional intensity of the relationships that often develop between people and their pets is such that it is the veterinary profession’s routine experience to discuss, justify the legitimacy of and ultimately administer eutha-nasia to animals that are considered by their owners to be virtual persons (Sanders 1995). The effects of this ‘culture of death’ may affect attitudes within the profession with regard to the expendability of human life: 93 per cent of veterinary health care workers interviewed in a small-scale study indicated a favourable inclination towards euthana-sia of humans (Kirwan 2005). This is a higher proportion than reported for the general population (Clery and others 2007) and is counter to prevailing medical opinion (Seale 2006), but comparison of these studies is confounded by dissimilar research methods. Positive associations have been demonstrated between tolerance of suicide (more permis-
36 The Veterinary Record, January 12, 2008
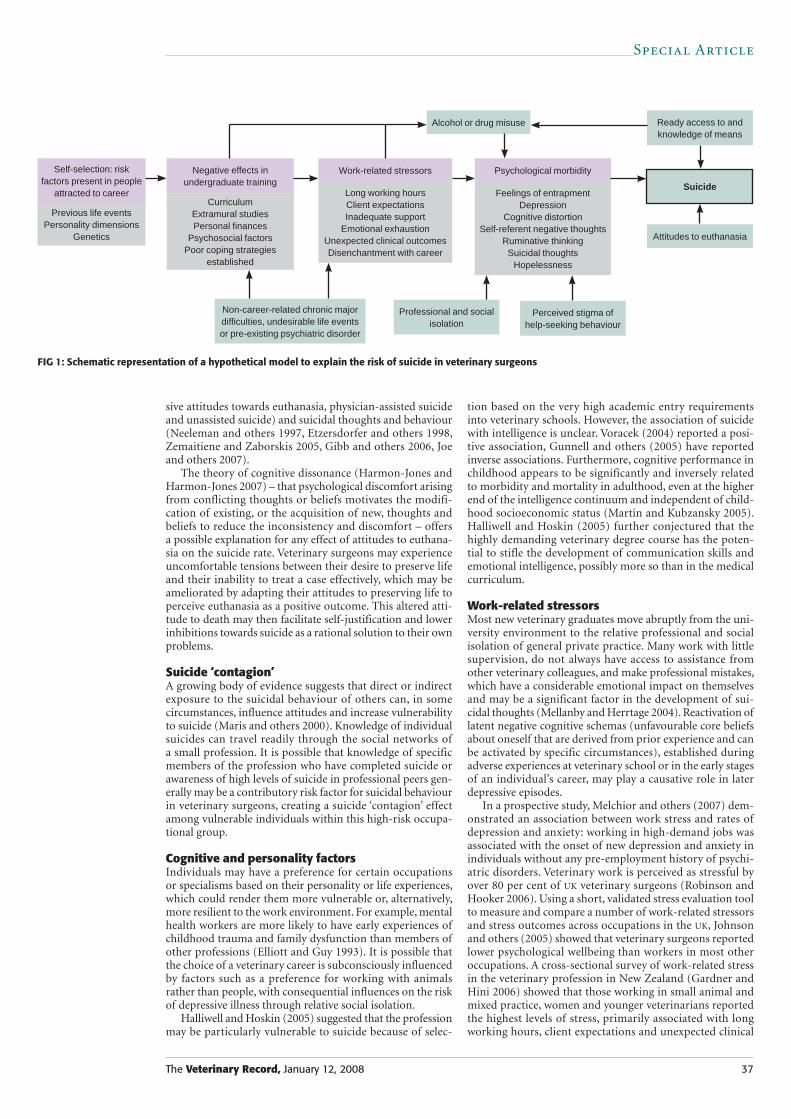
Special Article
sive attitudes towards euthanasia, physician-assisted suicide and unassisted suicide) and suicidal thoughts and behaviour (Neeleman and others 1997, Etzersdorfer and others 1998, Zemaitiene and Zaborskis 2005, Gibb and others 2006, Joe and others 2007).
The theory of cognitive dissonance (Harmon-Jones and Harmon-Jones 2007) – that psychological discomfort arising from conflicting thoughts or beliefs motivates the modifi-cation of existing, or the acquisition of new, thoughts and beliefs to reduce the inconsistency and discomfort – offers a possible explanation for any effect of attitudes to euthana-sia on the suicide rate. Veterinary surgeons may experience uncomfortable tensions between their desire to preserve life and their inability to treat a case effectively, which may be ameliorated by adapting their attitudes to preserving life to perceive euthanasia as a positive outcome. This altered atti-tude to death may then facilitate self-justification and lower inhibitions towards suicide as a rational solution to their own problems.
Suicide ‘contagion’A growing body of evidence suggests that direct or indirect exposure to the suicidal behaviour of others can, in some circumstances, influence attitudes and increase vulnerability to suicide (Maris and others 2000). Knowledge of individual suicides can travel readily through the social networks of a small profession. It is possible that knowledge of specific members of the profession who have completed suicide or awareness of high levels of suicide in professional peers gen-erally may be a contributory risk factor for suicidal behaviour in veterinary surgeons, creating a suicide ‘contagion’ effect among vulnerable individuals within this high-risk occupa-tional group.
Cognitive and personality factorsIndividuals may have a preference for certain occupations or specialisms based on their personality or life experiences, which could render them more vulnerable or, alternatively, more resilient to the work environment. For example, mental health workers are more likely to have early experiences of childhood trauma and family dysfunction than members of other professions (Elliott and Guy 1993). It is possible that the choice of a veterinary career is subconsciously influenced by factors such as a preference for working with animals rather than people, with consequential influences on the risk of depressive illness through relative social isolation.
Halliwell and Hoskin (2005) suggested that the profession may be particularly vulnerable to suicide because of selec-
tion based on the very high academic entry requirements into veterinary schools. However, the association of suicide with intelligence is unclear. Voracek (2004) reported a posi-tive association, Gunnell and others (2005) have reported inverse associations. Furthermore, cognitive performance in childhood appears to be significantly and inversely related to morbidity and mortality in adulthood, even at the higher end of the intelligence continuum and independent of child-hood socioeconomic status (Martin and Kubzansky 2005). Halliwell and Hoskin (2005) further conjectured that the highly demanding veterinary degree course has the poten-tial to stifle the development of communication skills and emotional intelligence, possibly more so than in the medical curriculum.
Work-related stressorsMost new veterinary graduates move abruptly from the uni-versity environment to the relative professional and social isolation of general private practice. Many work with little supervision, do not always have access to assistance from other veterinary colleagues, and make professional mistakes, which have a considerable emotional impact on themselves and may be a significant factor in the development of sui-cidal thoughts (Mellanby and Herrtage 2004). Reactivation of latent negative cognitive schemas (unfavourable core beliefs about oneself that are derived from prior experience and can be activated by specific circumstances), established during adverse experiences at veterinary school or in the early stages of an individual’s career, may play a causative role in later depressive episodes.
In a prospective study, Melchior and others (2007) dem-onstrated an association between work stress and rates of depression and anxiety: working in high-demand jobs was associated with the onset of new depression and anxiety in individuals without any pre-employment history of psychi-atric disorders. Veterinary work is perceived as stressful by over 80 per cent of UK veterinary surgeons (Robinson and Hooker 2006). Using a short, validated stress evaluation tool to measure and compare a number of work-related stressors and stress outcomes across occupations in the UK, Johnson and others (2005) showed that veterinary surgeons reported lower psychological wellbeing than workers in most other occupations. A cross-sectional survey of work-related stress in the veterinary profession in New Zealand (Gardner and Hini 2006) showed that those working in small animal and mixed practice, women and younger veterinarians reported the highest levels of stress, primarily associated with long working hours, client expectations and unexpected clinical
FIG 1: Schematic representation of a hypothetical model to explain the risk of suicide in veterinary surgeons
Self-selection: risk factors present in people
attracted to career
Previous life eventsPersonality dimensions
Genetics
CurriculumExtramural studiesPersonal finances
Psychosocial factorsPoor coping strategies
established
Long working hoursClient expectationsInadequate support
Emotional exhaustionUnexpected clinical outcomesDisenchantment with career
Feelings of entrapmentDepression
Cognitive distortionSelf-referent negative thoughts
Ruminative thinkingSuicidal thoughts
Hopelessness
Negative effects in undergraduate training
Work-related stressors Psychological morbidity
Alcohol or drug misuse
Attitudes to euthanasia
Professional and social isolation
Non-career-related chronic major difficulties, undesirable life events or pre-existing psychiatric disorder
Suicide
Ready access to and knowledge of means
Perceived stigma of help-seeking behaviour
The Veterinary Record, January 12, 2008 37
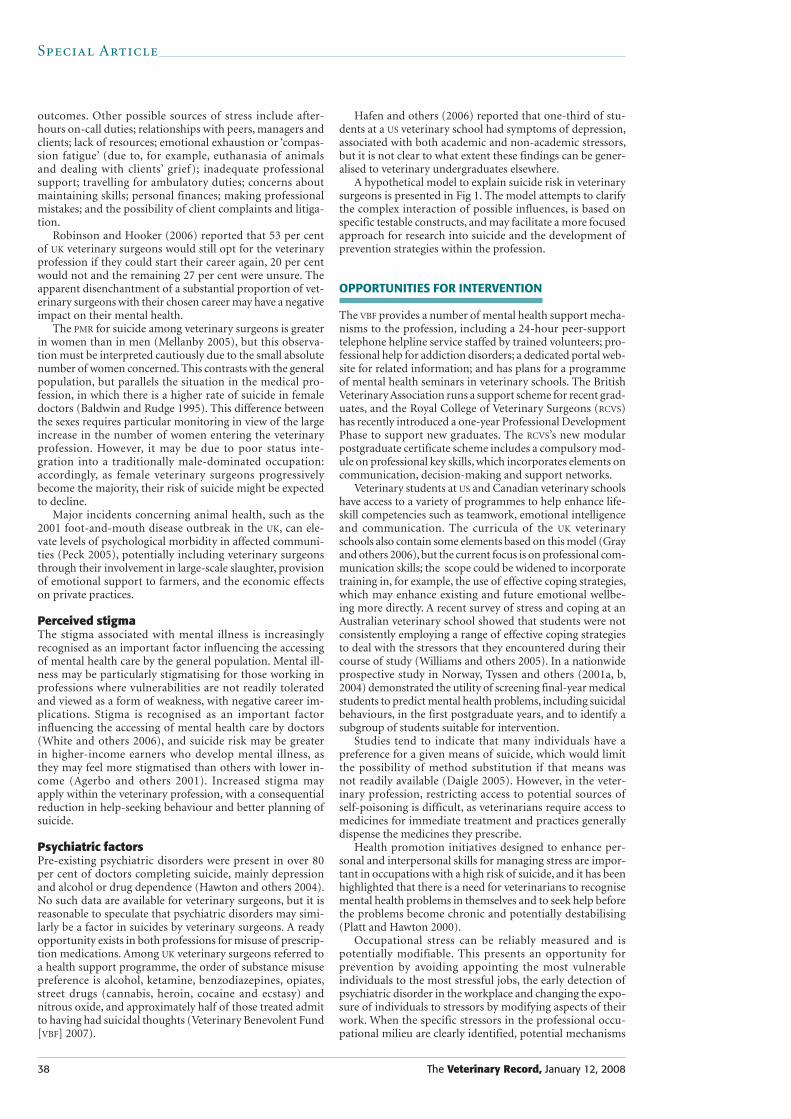
Special Article
outcomes. Other possible sources of stress include after-hours on-call duties; relationships with peers, managers and clients; lack of resources; emotional exhaustion or ‘compas-sion fatigue’ (due to, for example, euthanasia of animals and dealing with clients’ grief); inadequate professional support; travelling for ambulatory duties; concerns about maintaining skills; personal finances; making professional mistakes; and the possibility of client complaints and litiga-tion.
Robinson and Hooker (2006) reported that 53 per cent of UK veterinary surgeons would still opt for the veterinary profession if they could start their career again, 20 per cent would not and the remaining 27 per cent were unsure. The apparent disenchantment of a substantial proportion of vet-erinary surgeons with their chosen career may have a negative impact on their mental health.
The PMR for suicide among veterinary surgeons is greater in women than in men (Mellanby 2005), but this observa-tion must be interpreted cautiously due to the small absolute number of women concerned. This contrasts with the general population, but parallels the situation in the medical pro-fession, in which there is a higher rate of suicide in female doctors (Baldwin and Rudge 1995). This difference between the sexes requires particular monitoring in view of the large increase in the number of women entering the veterinary profession. However, it may be due to poor status inte-gration into a traditionally male-dominated occupation: accordingly, as female veterinary surgeons progressively become the majority, their risk of suicide might be expected to decline.
Major incidents concerning animal health, such as the 2001 foot-and-mouth disease outbreak in the UK, can ele-vate levels of psychological morbidity in affected communi-ties (Peck 2005), potentially including veterinary surgeons through their involvement in large-scale slaughter, provision of emotional support to farmers, and the economic effects on private practices.
Perceived stigmaThe stigma associated with mental illness is increasingly recognised as an important factor influencing the accessing of mental health care by the general population. Mental ill-ness may be particularly stigmatising for those working in professions where vulnerabilities are not readily tolerated and viewed as a form of weakness, with negative career im-plications. Stigma is recognised as an important factor influencing the accessing of mental health care by doctors (White and others 2006), and suicide risk may be greater in higher-income earners who develop mental illness, as they may feel more stigmatised than others with lower in-come (Agerbo and others 2001). Increased stigma may apply within the veterin ary profession, with a consequential reduction in help-seeking behaviour and better planning of suicide.
Psychiatric factorsPre-existing psychiatric disorders were present in over 80 per cent of doctors completing suicide, mainly depression and alcohol or drug dependence (Hawton and others 2004). No such data are available for veterinary surgeons, but it is reasonable to speculate that psychiatric disorders may simi-larly be a factor in suicides by veterinary surgeons. A ready opportunity exists in both professions for misuse of prescrip-tion medications. Among UK veterinary surgeons referred to a health support programme, the order of substance misuse preference is alcohol, ketamine, benzodiazepines, opiates, street drugs (cannabis, heroin, cocaine and ecstasy) and nitrous oxide, and approximately half of those treated admit to having had suicidal thoughts (Veterinary Benevolent Fund [VBF] 2007).
Hafen and others (2006) reported that one-third of stu-dents at a US veterinary school had symptoms of depression, associated with both academic and non-academic stressors, but it is not clear to what extent these findings can be gener-alised to veterinary undergraduates elsewhere.
A hypothetical model to explain suicide risk in veterinary surgeons is presented in Fig 1. The model attempts to clarify the complex interaction of possible influences, is based on specific testable constructs, and may facilitate a more focused approach for research into suicide and the development of prevention strategies within the profession.
OPPORTUNITIES FOR INTERVENTION
The VBF provides a number of mental health support mecha-nisms to the profession, including a 24-hour peer-support telephone helpline service staffed by trained volunteers; pro-fessional help for addiction disorders; a dedicated portal web-site for related information; and has plans for a programme of mental health seminars in veterinary schools. The British Veterinary Association runs a support scheme for recent grad-uates, and the Royal College of Veterinary Surgeons (RCVS) has recently introduced a one-year Professional Development Phase to support new graduates. The RCVS’s new modular postgraduate certificate scheme includes a compulsory mod-ule on professional key skills, which incorporates elements on communication, decision-making and support networks.
Veterinary students at US and Canadian veterinary schools have access to a variety of programmes to help enhance life-skill competencies such as teamwork, emotional intelligence and communication. The curricula of the UK veterinary schools also contain some elements based on this model (Gray and others 2006), but the current focus is on professional com-munication skills; the scope could be widened to incorporate training in, for example, the use of effective coping strategies, which may enhance existing and future emotional wellbe-ing more directly. A recent survey of stress and coping at an Australian veterinary school showed that students were not consistently employing a range of effective coping strategies to deal with the stressors that they encountered during their course of study (Williams and others 2005). In a nationwide prospective study in Norway, Tyssen and others (2001a, b, 2004) demonstrated the utility of screening final-year medical students to predict mental health problems, including suicidal behaviours, in the first postgraduate years, and to identify a subgroup of students suitable for intervention.
Studies tend to indicate that many individuals have a preference for a given means of suicide, which would limit the possibility of method substitution if that means was not readily available (Daigle 2005). However, in the veter-inary profession, restricting access to potential sources of self-poisoning is difficult, as veterinarians require access to medicines for immediate treatment and practices generally dispense the medicines they prescribe.
Health promotion initiatives designed to enhance per-sonal and interpersonal skills for managing stress are impor-tant in occupations with a high risk of suicide, and it has been highlighted that there is a need for veterinarians to recognise mental health problems in themselves and to seek help before the problems become chronic and potentially destabilising (Platt and Hawton 2000).
Occupational stress can be reliably measured and is potentially modifiable. This presents an opportunity for prevention by avoiding appointing the most vulnerable individuals to the most stressful jobs, the early detection of psychiatric disorder in the workplace and changing the expo-sure of individuals to stressors by modifying aspects of their work. When the specific stressors in the professional occu-pational milieu are clearly identified, potential mechanisms
38 The Veterinary Record, January 12, 2008
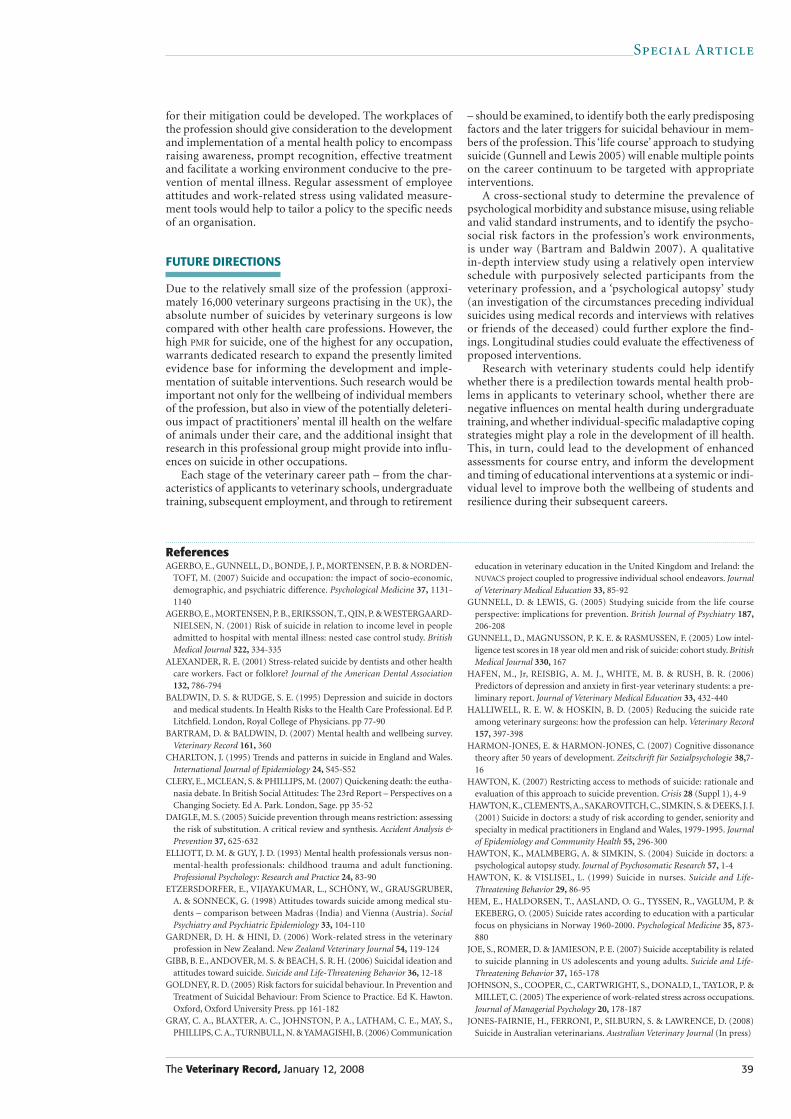
Special Article
for their mitigation could be developed. The workplaces of the profession should give consideration to the development and implementation of a mental health policy to encompass raising awareness, prompt recognition, effective treatment and facilitate a working environment conducive to the pre-vention of mental illness. Regular assessment of employee attitudes and work-related stress using validated measure-ment tools would help to tailor a policy to the specific needs of an organisation.
FUTURE DIRECTIONS
Due to the relatively small size of the profession (approxi-mately 16,000 veterinary surgeons practising in the UK), the absolute number of suicides by veterinary surgeons is low compared with other health care professions. However, the high PMR for suicide, one of the highest for any occupation, warrants dedicated research to expand the presently limited evidence base for informing the development and imple-mentation of suitable interventions. Such research would be important not only for the wellbeing of individual members of the profession, but also in view of the potentially deleteri-ous impact of practitioners’ mental ill health on the welfare of animals under their care, and the additional insight that research in this professional group might provide into influ-ences on suicide in other occupations.
Each stage of the veterinary career path – from the char-acteristics of applicants to veterinary schools, undergraduate training, subsequent employment, and through to retirement
– should be examined, to identify both the early predisposing factors and the later triggers for suicidal behaviour in mem-bers of the profession. This ‘life course’ approach to studying suicide (Gunnell and Lewis 2005) will enable multiple points on the career continuum to be targeted with appropriate interventions.
A cross-sectional study to determine the prevalence of psychological morbidity and substance misuse, using reliable and valid standard instruments, and to identify the psycho-social risk factors in the profession’s work environments, is under way (Bartram and Baldwin 2007). A qualitative in-depth interview study using a relatively open interview schedule with purposively selected participants from the veterinary profession, and a ‘psychological autopsy’ study (an investigation of the circumstances preceding individual suicides using medical records and interviews with relatives or friends of the deceased) could further explore the find-ings. Longitudinal studies could evaluate the effectiveness of proposed interventions.
Research with veterinary students could help identify whether there is a predilection towards mental health prob-lems in applicants to veterinary school, whether there are negative influences on mental health during undergraduate training, and whether individual-specific maladaptive coping strategies might play a role in the development of ill health. This, in turn, could lead to the development of enhanced assessments for course entry, and inform the development and timing of educational interventions at a systemic or indi-vidual level to improve both the wellbeing of students and resilience during their subsequent careers.
The Veterinary Record, January 12, 2008 39
AGERBO, E., GUNNELL, D., BONDE, J. P., MORTENSEN, P. B. & NORDEN-TOFT, M. (2007) Suicide and occupation: the impact of socio-economic, demographic, and psychiatric difference. Psychological Medicine 37, 1131-1140
AGERBO, E., MORTENSEN, P. B., ERIKSSON, T., QIN, P. & WESTERGAARD-NIELSEN, N. (2001) Risk of suicide in relation to income level in people admitted to hospital with mental illness: nested case control study. British Medical Journal 322, 334-335
ALEXANDER, R. E. (2001) Stress-related suicide by dentists and other health care workers. Fact or folklore? Journal of the American Dental Association 132, 786-794
BALDWIN, D. S. & RUDGE, S. E. (1995) Depression and suicide in doctors and medical students. In Health Risks to the Health Care Professional. Ed P. Litchfield. London, Royal College of Physicians. pp 77-90
BARTRAM, D. & BALDWIN, D. (2007) Mental health and wellbeing survey. Veterinary Record 161, 360
CHARLTON, J. (1995) Trends and patterns in suicide in England and Wales. International Journal of Epidemiology 24, S45-S52
CLERY, E., MCLEAN, S. & PHILLIPS, M. (2007) Quickening death: the eutha-nasia debate. In British Social Attitudes: The 23rd Report – Perspectives on a Changing Society. Ed A. Park. London, Sage. pp 35-52
DAIGLE, M. S. (2005) Suicide prevention through means restriction: assessing the risk of substitution. A critical review and synthesis. Accident Analysis & Prevention 37, 625-632
ELLIOTT, D. M. & GUY, J. D. (1993) Mental health professionals versus non-mental-health professionals: childhood trauma and adult functioning. Professional Psychology: Research and Practice 24, 83-90
ETZERSDORFER, E., VIJAYAKUMAR, L., SCHÖNY, W., GRAUSGRUBER, A. & SONNECK, G. (1998) Attitudes towards suicide among medical stu-dents – comparison between Madras (India) and Vienna (Austria). Social Psychiatry and Psychiatric Epidemiology 33, 104-110
GARDNER, D. H. & HINI, D. (2006) Work-related stress in the veterinary profession in New Zealand. New Zealand Veterinary Journal 54, 119-124
GIBB, B. E., ANDOVER, M. S. & BEACH, S. R. H. (2006) Suicidal ideation and attitudes toward suicide. Suicide and Life-Threatening Behavior 36, 12-18
GOLDNEY, R. D. (2005) Risk factors for suicidal behaviour. In Prevention and Treatment of Suicidal Behaviour: From Science to Practice. Ed K. Hawton. Oxford, Oxford University Press. pp 161-182
GRAY, C. A., BLAXTER, A. C., JOHNSTON, P. A., LATHAM, C. E., MAY, S., PHILLIPS, C. A., TURNBULL, N. & YAMAGISHI, B. (2006) Communication
Referenceseducation in veterinary education in the United Kingdom and Ireland: the NUVACS project coupled to progressive individual school endeavors. Journal of Veterinary Medical Education 33, 85-92
GUNNELL, D. & LEWIS, G. (2005) Studying suicide from the life course perspective: implications for prevention. British Journal of Psychiatry 187, 206-208
GUNNELL, D., MAGNUSSON, P. K. E. & RASMUSSEN, F. (2005) Low intel-ligence test scores in 18 year old men and risk of suicide: cohort study. British Medical Journal 330, 167
HAFEN, M., Jr, REISBIG, A. M. J., WHITE, M. B. & RUSH, B. R. (2006) Predictors of depression and anxiety in first-year veterinary students: a pre-liminary report. Journal of Veterinary Medical Education 33, 432-440
HALLIWELL, R. E. W. & HOSKIN, B. D. (2005) Reducing the suicide rate among veterinary surgeons: how the profession can help. Veterinary Record 157, 397-398
HARMON-JONES, E. & HARMON-JONES, C. (2007) Cognitive dissonance theory after 50 years of development. Zeitschrift für Sozialpsychologie 38,7-16
HAWTON, K. (2007) Restricting access to methods of suicide: rationale and evaluation of this approach to suicide prevention. Crisis 28 (Suppl 1), 4-9
HAWTON, K., CLEMENTS, A., SAKAROVITCH, C., SIMKIN, S. & DEEKS, J. J. (2001) Suicide in doctors: a study of risk according to gender, seniority and specialty in medical practitioners in England and Wales, 1979-1995. Journal of Epidemiology and Community Health 55, 296-300
HAWTON, K., MALMBERG, A. & SIMKIN, S. (2004) Suicide in doctors: a psychological autopsy study. Journal of Psychosomatic Research 57, 1-4
HAWTON, K. & VISLISEL, L. (1999) Suicide in nurses. Suicide and Life-Threatening Behavior 29, 86-95
HEM, E., HALDORSEN, T., AASLAND, O. G., TYSSEN, R., VAGLUM, P. & EKEBERG, O. (2005) Suicide rates according to education with a particular focus on physicians in Norway 1960-2000. Psychological Medicine 35, 873-880
JOE, S., ROMER, D. & JAMIESON, P. E. (2007) Suicide acceptability is related to suicide planning in US adolescents and young adults. Suicide and Life-Threatening Behavior 37, 165-178
JOHNSON, S., COOPER, C., CARTWRIGHT, S., DONALD, I., TAYLOR, P. & MILLET, C. (2005) The experience of work-related stress across occupations. Journal of Managerial Psychology 20, 178-187
JONES-FAIRNIE, H., FERRONI, P., SILBURN, S. & LAWRENCE, D. (2008) Suicide in Australian veterinarians. Australian Veterinary Journal (In press)

Special Article
40 The Veterinary Record, January 12, 2008
KELLY, S. & BUNTING, J. (1998) Trends in suicide in England and Wales, 1982-96. Population Trends 92, 29-41
KIRWAN, A.P. (2005) Mankind and other animals. MA Thesis. Open University, Milton Keynes, UK
MARIS, R. W., BERMAN, A. L. & SILVERMAN, M. M. (2000) The social rela-tions of suicides. In Comprehensive Textbook of Suicidology. New York, Guilford Publications. pp 240-265
MARTIN, L. T. & KUBZANSKY, L. D. (2005) Childhood cognitive perform-ance and risk of mortality: a prospective cohort study of gifted individuals. American Journal of Epidemiology 162, 887-890
MELCHIOR, M., CASPI, A., MILNE, B. J., DANESE, A., POULTON, R. & MOFFITT, T. E. (2007) Work stress precipitates depression and anxiety in young working women and men. Psychological Medicine 37, 1119-1129
MELLANBY, R. J. (2005) Incidence of suicide in the veterinary profession in England and Wales. Veterinary Record 155, 415-417
MELLANBY, R. J. & HERRTAGE, M. E. (2004) Survey of mistakes made by recent veterinary graduates. Veterinary Record 155, 761-765
MILLER, J. M. & BEAUMONT, J. J. (1995) Suicide, cancer and other causes of death among California veterinarians, 1960-1992. American Journal of Industrial Medicine 27, 37-49
NEELEMAN, J., HAPLERN, D., LEON, D. & LEWIS, G. (1997) Tolerance of suicide, religion and suicide rates: an ecological and individual study in 19 Western countries. Psychological Medicine 27, 1165-1171
PECK, D. F. (2005) Foot and mouth outbreak: lessons for mental health serv-ices. Advances in Psychiatric Treatment 11, 270-276
PLATT, S. & HAWTON, K. (2000) Suicidal behaviour and the labour market. In The International Handbook of Suicide and Attempted Suicide. Eds K. Hawton, K. van Heeringen. Chichester, Wiley. pp 309-384
ROBINSON, D. & HOOKER, H. (2006) The UK Veterinary Profession in 2006: The Findings of a Survey of the Profession Conducted by the Royal College of Veterinary Surgeons. London, RCVS
SANDERS, C. R. (1995) Killing with kindness: veterinary euthanasia and the social construction of personhood. Sociological Forum 10, 195-214
SCHERNHAMMER, E. S. & COLDITZ, G. A. (2004) Suicide rates among physicians: a quantitative and gender assessment (meta-analysis). American Journal of Psychiatry 161, 2295-2302
SEALE, C. (2006) National survey of end-of-life decisions made by UK medical practitioners. Palliative Medicine 20, 3-10
STANSFIELD, S. (2002) Work, personality and mental health. British Journal of Psychiatry 181, 96-98
STARK, C., BELBIN, A., HOPKINS, P., GIBBS, D., HAY, A. & GUNNELL, D. (2006) Male suicide and occupation in Scotland. Health Statistics Quarterly 29, 26-29
TYSSEN, R., HEM, E., VAGLUM, P., GRØNVOLD, N. T. & EKEBERG, O. (2004) The process of suicidal planning among medical doctors: predictors in a longitudinal Norwegian sample. Journal of Affective Disorders 80, 191-198
TYSSEN, R., VAGLUM, P., GRØNVOLD, N. T. & EKEBERG, Ø. (2001a) Factors in medical school that predict postgraduate mental health prob-lems in need of treatment. A nationwide and longitudinal study. Medical Education 35, 110-120
TYSSEN, R., VAGLUM, P., GRØNVOLD, N. T. & EKEBERG, Ø. (2001b) Suicidal ideation among medical students and young physicians: a nation-wide and prospective study of prevalence and predictors. Journal of Affective Disorders 64, 69-79
VBF (2007) Annual Report and Accounts 2006. London, Veterinary Benevolent Fund
VORACEK, M. (2004) National intelligence and suicide rate: an eco-logical study of 85 countries. Personality and Individual Differences 37, 543-553
WHITE, A., SHIRALKAR, P., HASSAN, T., GALBRAITH, N. & CALLAGHAN, R. (2006) Barriers to mental healthcare for psychiatrists. Psychiatric Bulletin 30, 382-384
WILHELM, K., KOVESS, V., RIOS-SEIDEL, C. & FINCH, A. (2004) Work and mental health. Social Psychiatry and Psychiatric Epidemiology 39, 866-873
WILLIAMS, S. M., ARNOLD, P. K. & MILLS, J. N. (2005) Coping with stress: a survey of Murdoch University veterinary students. Journal of Veterinary Medical Education 32, 201-212
ZEMAITIENE, N. & ZABORSKIS, A. (2005) Suicidal tendencies and attitude towards freedom to choose suicide among Lithuanian schoolchildren: results from three cross-sectional studies in 1994, 1998 and 2002. BMC Public Health 5, 83

Appendix VI: Study-related publications
BARTRAM, D.J., YADEGARFAR, G. & BALDWIN, D.S. (2009) A cross-sectional
study of mental heath and well-being and their associations in the UK veterinary
profession. Social Psychiatry and Psychiatric Epidemiology, Published online first:
18 Mar 2009. doi: 10.1007/s00127-009-0030-8

ORIGINAL PAPER
A cross-sectional study of mental health and well-beingand their associations in the UK veterinary profession
David J. Bartram Æ Ghasem Yadegarfar ÆDavid S. Baldwin
Received: 5 September 2008 / Accepted: 2 March 2009
� Springer-Verlag 2009
Abstract
Background Veterinary surgeons are at elevated risk of
suicide, with a proportional mortality ratio around four
times that of the general population and approximately
twice that of other healthcare professions. There has been
much speculation regarding possible mechanisms under-
lying increased suicide risk in the profession but little
empirical research. We aimed to assess the contribution of
mental health and well-being to the elevated risk, through a
postal questionnaire survey of a large stratified random
sample of veterinary surgeons practising within the UK.
Methods A questionnaire was mailed twice to 3,200
veterinary surgeons. Anxiety and depressive symptoms,
alcohol consumption, suicidal ideation, positive mental
well-being, perceptions of psychosocial work characteris-
tics, and work–home interaction were assessed using valid
and reliable existing instruments and a series of bespoke
questions previously developed through informal focus
groups.
Results Evaluable questionnaires were returned by 1,796
participants, a response rate of 56.1%. The demographic
and occupational profile of respondents was representative
of the UK veterinary profession. The prevalence of ‘case-
ness’ (i.e. HADS subscale score C8) for anxiety,
depression, and co-morbid anxiety and depression was
26.3, 5.8 and 4.5%. 5.4% of respondents were non-drink-
ers, 32.0% low-risk drinkers, and 62.6% ‘at-risk’ drinkers
(i.e. AUDIT-C score C4 for women, C5 for men). The 12-
month prevalence of suicidal thoughts was 21.3%.
Conclusions Compared to the general population, the
sample reported high levels of anxiety and depressive
symptoms; higher 12-month prevalence of suicidal
thoughts; less favourable psychosocial work characteris-
tics, especially in regard to demands and managerial
support; lower levels of positive mental well-being; and
higher levels of negative work–home interaction. The
levels of psychological distress reported suggest ready
access to and knowledge of lethal means is probably not
operating in isolation to increase suicide risk within the
profession.
Keywords Mental health � Veterinary surgeon �Depression � Anxiety � Well-being
Introduction
Members of some occupational groups are at greatly
increased risk of suicide [1], this elevated risk being seen
among healthcare professionals including doctors [22, 40,
48] pharmacists [29], dentists [2], and nurses [23]. Farmers
are also at increased risk [30].
The absolute number of suicides by veterinary sur-
geons is low due to the small size of the profession
(approximately 16,000 veterinary surgeons practising in
the UK), but the profession is at increased risk of suicide
when compared to other occupations and the general
population. Proportional mortality ratios (PMRs) in Eng-
land and Wales [29, 32, 34] and Scotland [45], and
D. J. Bartram (&) � D. S. Baldwin
Division of Clinical Neurosciences, School of Medicine,
RSH Hospital, University of Southampton, Brintons Terrace,
Southampton SO14 0YG, UK
e-mail: [email protected]
G. Yadegarfar
Department of Epidemiology and Biostatistics,
School of Public Health,
Isfahan University of Medical Sciences, Isfahan, Iran
123
Soc Psychiat Epidemiol
DOI 10.1007/s00127-009-0030-8

similar estimates in the USA [36], Australia [26] and
Norway [25], indicate that the veterinary profession has
around four times the proportion of all deaths certified as
suicide than would be expected from the proportion for
the general population, and around twice that for other
healthcare professionals. While most differences in sui-
cide risk between occupations are accounted for by
differences in income and employment status, the most
striking exceptions are for vets, doctors, nurses and
pharmacists, all having significantly higher rates of sui-
cide, even when demographic factors are taken into
account [1, 9, 43]. Lower mortality from other causes
may account for the high PMRs for suicide identified for
some high social class occupational groups, including
healthcare professionals [29].
There has been much speculation regarding possible
mechanisms underlying increased suicide risk in the
profession but little empirical research. A hypothetical
model postulates an interplay between various potentially
malign influences [3]. Such influences include the char-
acteristics of individuals entering the profession, negative
effects during undergraduate training, work-related
stressors, ready access to and knowledge of lethal means,
stigma associated with mental illness, professional and
social isolation, alcohol or drug misuse, and veterinary
surgeons’ attitudes to death and euthanasia. These occu-
pation-specific factors are assumed to act in association
with other variables known to be more widely associ-
ated with completed suicide, including male gender and
single status [29], the presence of anxiety or depressive
symptoms and the presence of recurrent suicidal thoughts
[7].
We aimed to assess the contribution of mental ill health
and well-being to the elevated risk, through a postal
questionnaire survey of a large stratified random sample of
veterinary surgeons practising within the UK. Our primary
hypothesis was that the veterinary profession has higher
levels of mental ill health, lower levels of mental well-
being and less favourable psychosocial working conditions,
when compared to the general population. The secondary
hypothesis was that self-reported measures of mental ill
health, mental well-being and psychosocial working con-
ditions differ significantly with demographic factors and
occupational factors within the profession.
Research into suicide among veterinary surgeons is
important, not only with a view towards enhancing the
well-being of individuals within the profession, but also to
help mitigate the potentially deleterious impact of any
mental ill health among practitioners on the health and
welfare of animals under their care, and the additional
insight that research in this professional group might pro-
vide into influences on mental health and well-being in
other occupations.
Methods
The study was reviewed and approved by Southampton and
South West Hampshire Research Ethics Committee (B)
(REC reference number: 07/H0504/122).
Sample
A random stratified sample of 3,200 veterinary surgeons
practising in the UK was identified. This number represents
approximately 20% of the membership of the Royal Col-
lege of Veterinary Surgeons (RCVS), excluding those
practising overseas or retired. Veterinary surgeons listed in
the sampling frame (Vetfile�, Veterinary Business Devel-
opment Ltd) were stratified according to type of work
within the profession and selected at random within each
stratum in proportion to the number of veterinary surgeons
in each type of work practising in the UK. The gender and
decade of qualification profile of the entire study cohort
was then compared with RCVS membership data for vet-
erinary surgeons practising in the UK to check the
representativeness of the sample. Assuming a response rate
of 50% (1,600 completed questionnaires), point estimates
of prevalence ranging from 10 to 50% would have confi-
dence intervals of ±1.39 to ±2.32, respectively at 95%
confidence level.
Data collection
Questionnaires were mailed with a covering letter and
stamped addressed envelope for return to each member of
the sample (in October and November 2007). The follow-
up mailing was sent to all veterinary surgeons in the
sample, as it was not possible to identify those who had
already responded anonymously. Data entry was automated
by using an electronic optical reading system with related
software TeleForm� (Verity Inc., Sunnyvale, CA) to scan
the returned questionnaires.
Measures
The 4-page questionnaire comprised a total of 120 items
which included:
• Background information consisting of brief demo-
graphic and occupational details, including age, sex,
main type of work in the profession, position in the
practice (if applicable), hours of work and hours on call
in a typical week.
• The hospital anxiety and depression scale (HADS): this
is a 14-item self-report measure of the prevalence and
severity of both anxiety (HADS-A; 7 items) and
depressive (HADS-D; 7 items) symptoms separately,
Soc Psychiat Epidemiol
123
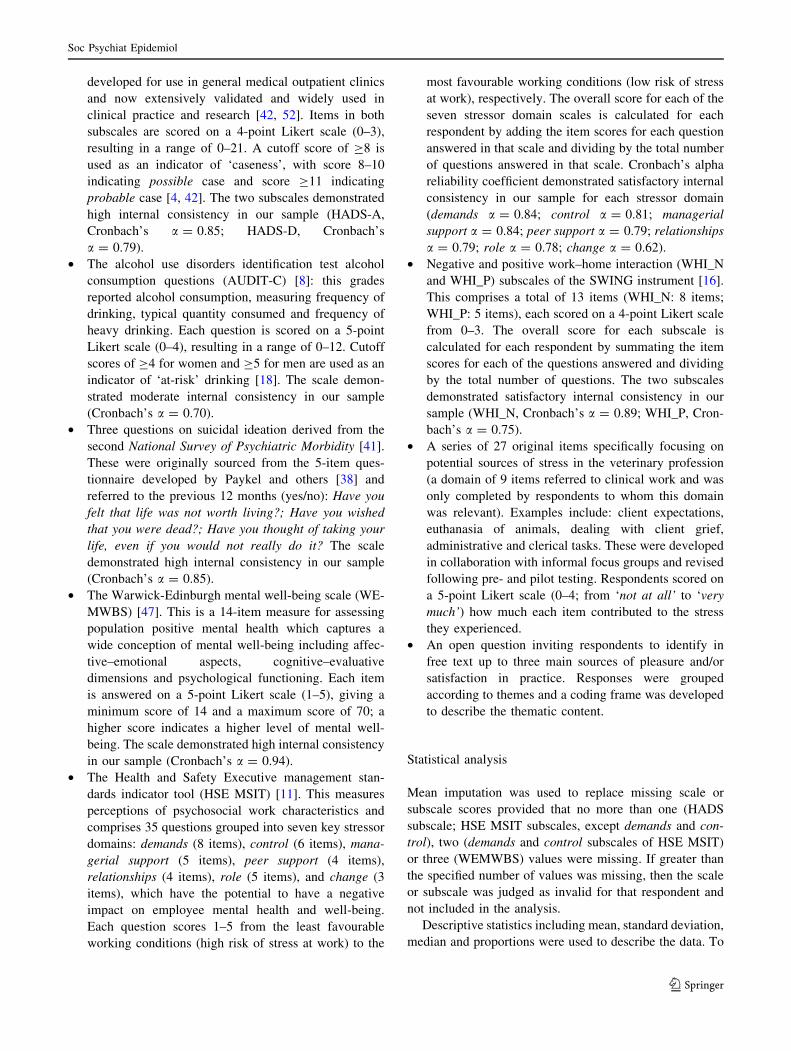
developed for use in general medical outpatient clinics
and now extensively validated and widely used in
clinical practice and research [42, 52]. Items in both
subscales are scored on a 4-point Likert scale (0–3),
resulting in a range of 0–21. A cutoff score of C8 is
used as an indicator of ‘caseness’, with score 8–10
indicating possible case and score C11 indicating
probable case [4, 42]. The two subscales demonstrated
high internal consistency in our sample (HADS-A,
Cronbach’s a = 0.85; HADS-D, Cronbach’s
a = 0.79).
• The alcohol use disorders identification test alcohol
consumption questions (AUDIT-C) [8]: this grades
reported alcohol consumption, measuring frequency of
drinking, typical quantity consumed and frequency of
heavy drinking. Each question is scored on a 5-point
Likert scale (0–4), resulting in a range of 0–12. Cutoff
scores of C4 for women and C5 for men are used as an
indicator of ‘at-risk’ drinking [18]. The scale demon-
strated moderate internal consistency in our sample
(Cronbach’s a = 0.70).
• Three questions on suicidal ideation derived from the
second National Survey of Psychiatric Morbidity [41].
These were originally sourced from the 5-item ques-
tionnaire developed by Paykel and others [38] and
referred to the previous 12 months (yes/no): Have you
felt that life was not worth living?; Have you wished
that you were dead?; Have you thought of taking your
life, even if you would not really do it? The scale
demonstrated high internal consistency in our sample
(Cronbach’s a = 0.85).
• The Warwick-Edinburgh mental well-being scale (WE-
MWBS) [47]. This is a 14-item measure for assessing
population positive mental health which captures a
wide conception of mental well-being including affec-
tive–emotional aspects, cognitive–evaluative
dimensions and psychological functioning. Each item
is answered on a 5-point Likert scale (1–5), giving a
minimum score of 14 and a maximum score of 70; a
higher score indicates a higher level of mental well-
being. The scale demonstrated high internal consistency
in our sample (Cronbach’s a = 0.94).
• The Health and Safety Executive management stan-
dards indicator tool (HSE MSIT) [11]. This measures
perceptions of psychosocial work characteristics and
comprises 35 questions grouped into seven key stressor
domains: demands (8 items), control (6 items), mana-
gerial support (5 items), peer support (4 items),
relationships (4 items), role (5 items), and change (3
items), which have the potential to have a negative
impact on employee mental health and well-being.
Each question scores 1–5 from the least favourable
working conditions (high risk of stress at work) to the
most favourable working conditions (low risk of stress
at work), respectively. The overall score for each of the
seven stressor domain scales is calculated for each
respondent by adding the item scores for each question
answered in that scale and dividing by the total number
of questions answered in that scale. Cronbach’s alpha
reliability coefficient demonstrated satisfactory internal
consistency in our sample for each stressor domain
(demands a = 0.84; control a = 0.81; managerial
support a = 0.84; peer support a = 0.79; relationships
a = 0.79; role a = 0.78; change a = 0.62).
• Negative and positive work–home interaction (WHI_N
and WHI_P) subscales of the SWING instrument [16].
This comprises a total of 13 items (WHI_N: 8 items;
WHI_P: 5 items), each scored on a 4-point Likert scale
from 0–3. The overall score for each subscale is
calculated for each respondent by summating the item
scores for each of the questions answered and dividing
by the total number of questions. The two subscales
demonstrated satisfactory internal consistency in our
sample (WHI_N, Cronbach’s a = 0.89; WHI_P, Cron-
bach’s a = 0.75).
• A series of 27 original items specifically focusing on
potential sources of stress in the veterinary profession
(a domain of 9 items referred to clinical work and was
only completed by respondents to whom this domain
was relevant). Examples include: client expectations,
euthanasia of animals, dealing with client grief,
administrative and clerical tasks. These were developed
in collaboration with informal focus groups and revised
following pre- and pilot testing. Respondents scored on
a 5-point Likert scale (0–4; from ‘not at all’ to ‘very
much’) how much each item contributed to the stress
they experienced.
• An open question inviting respondents to identify in
free text up to three main sources of pleasure and/or
satisfaction in practice. Responses were grouped
according to themes and a coding frame was developed
to describe the thematic content.
Statistical analysis
Mean imputation was used to replace missing scale or
subscale scores provided that no more than one (HADS
subscale; HSE MSIT subscales, except demands and con-
trol), two (demands and control subscales of HSE MSIT)
or three (WEMWBS) values were missing. If greater than
the specified number of values was missing, then the scale
or subscale was judged as invalid for that respondent and
not included in the analysis.
Descriptive statistics including mean, standard deviation,
median and proportions were used to describe the data. To
Soc Psychiat Epidemiol
123

explore the data initially, means were compared using t test
and one-way analysis of variance (one-way ANOVA) or the
non-parametric equivalents, Mann–Whitney U and Krus-
kal–Wallis tests. Chi-square test was employed to compare
proportions. To investigate the effect of predictor variables
on response variables, multiple linear regression and
logistic regression were applied to continuous and binary
outcome variables, respectively. Odds ratios (ORs) and
regression coefficients were accompanied by 95% confi-
dence intervals (CIs). Statistical significance was defined as
P \ 0.05. Statistical analysis was performed using Statis-
tical Package for the Social Sciences (SPSS�) version 15.0
(SPSS Inc.) and STATA� version 9.0 (StataCorp LP).
Results
Evaluable questionnaires were returned by 1,796 partici-
pants, a response rate of 56.1%.
Demographic characteristics of respondents
The mean age of respondents was 40.9 years (SD = 11.0),
and 50.0% were male. 83.9% of respondents worked in
general practice, of which 69.2% reported small animal
practice as their main type of work. The median duration of
hours worked and on call in a typical week for study
respondents working full-time (n = 1458) is 48 h
(mean = 47.8, SD = 8.8) and 15 h (mean = 20.2,
SD = 24.9), respectively.
The demographic and occupational profile of study
respondents was generally in close alignment with that of
RCVS membership which suggests that study respondents
are representative of the wider population of veterinary
surgeons practising in the UK.
HADS
Table 1 shows that, in contrast to HADS-D scores, HADS-A
scores differ significantly between genders and across age
groups. Female veterinary surgeons have significantly
higher HADS-A mean score (F = 45.8, P \ 0.001) and
proportion of HADS-A cases (v2 = 32.0, P \ 0.001).
HAD-A mean score (F = 19.6, P \ 0.001) and the pro-
portion of HADS-A cases (v2 = 37.1, P \ 0.001) decline
in higher age groups. The HADS-A, HADS-D and HADS-T
mean scores for veterinary surgeons are significantly higher
than for the general population [12] (HADS-A, 7.9 vs. 6.1
[t(3547) = 13.57, P \ 0.001]; HADS-D, 4.6 vs. 3.9
[t(3547) = 6.41, P \ 0.001]; HADS-T, 12.6 vs. 9.8
[t(3547) = 13.01, P \ 0.001]). Possible or probable clini-
cally significant depression and anxiety are defined by a
cutoff score of C8 on the HADS-A and HADS-D scales Ta
ble
1H
AD
S-s
ub
scal
ean
d-t
ota
lsc
ore
s,an
dp
rev
alen
ceo
fan
xie
tyan
dd
epre
ssio
nca
sen
ess
for
the
tota
lsa
mp
le,
by
gen
der
and
by
age
gro
up
Ch
arac
teri
stic
nH
AD
S-A
HA
DS
-DH
AD
S-T
aH
AD
S-A
An
xie
tysu
bsc
ale
HA
DS
-D
Dep
ress
ion
sub
scal
e
Co
-mo
rbid
anx
iety
and
dep
ress
ion
Pro
bab
leD
and
Pro
bab
leA
No
n-
case
Po
ssib
le
case
Pro
bab
le
case
No
n-
case
Po
ssib
le
case
Pro
bab
le
case
Mea
nS
DM
edia
nM
ean
SD
Med
ian
Mea
nS
DM
edia
n0
–7
(%)
8–
10
(%)
11
?(%
)0
–7
(%)
8–
10
(%)
11?
(%)
To
tal
1,7
57
7.9
4.1
84
.63
.44
12
.66
.81
24
8.4
25
.32
6.3
80
.61
3.6
5.8
4.5
Gen
der
Mal
e8
81
7.3
4.0
74
.63
.44
11
.86
.61
15
4.5
24
.32
1.1
81
.61
3.0
5.5
4.0
Fem
ale
87
68
.64
.18
4.7
3.5
41
3.3
6.9
13
42
.32
6.3
31
.47
9.7
14
.36
.15
.0
Pv
alu
eP
\0
.00
1P
=0
.26
8P
\0
.00
1P
\0
.00
1P
=0
.59
8P
=0
.28
8
Ag
e
\3
56
13
8.6
4.0
84
.53
.34
13
.16
.61
24
2.2
27
.63
0.2
82
.21
2.2
5.5
4.9
35
–5
49
13
7.9
4.1
84
.83
.54
12
.76
.81
24
8.9
24
.52
6.6
78
.61
5.2
6.1
4.6
55
–7
42
17
6.3
3.9
64
.23
.43
10
.56
.71
06
3.1
22
.11
4.7
83
.41
2.9
3.7
2.3
C7
55
2.6
1.1
32
.41
.12
5.0
2.0
61
00
––
10
0–
––
Pv
alu
eP
\0
.00
1P
=0
.01
9P
\0
.00
1P
\0
.00
1P
=0
.36
7P
=0
.21
8
aH
AD
S-T
isth
esu
mm
ated
tota
lo
fth
eit
emsc
ore
sfo
rea
cho
fth
esu
bsc
ales
.It
may
be
use
das
ag
lob
alm
easu
reo
fp
sych
olo
gic
ald
istr
ess
[12]
Soc Psychiat Epidemiol
123
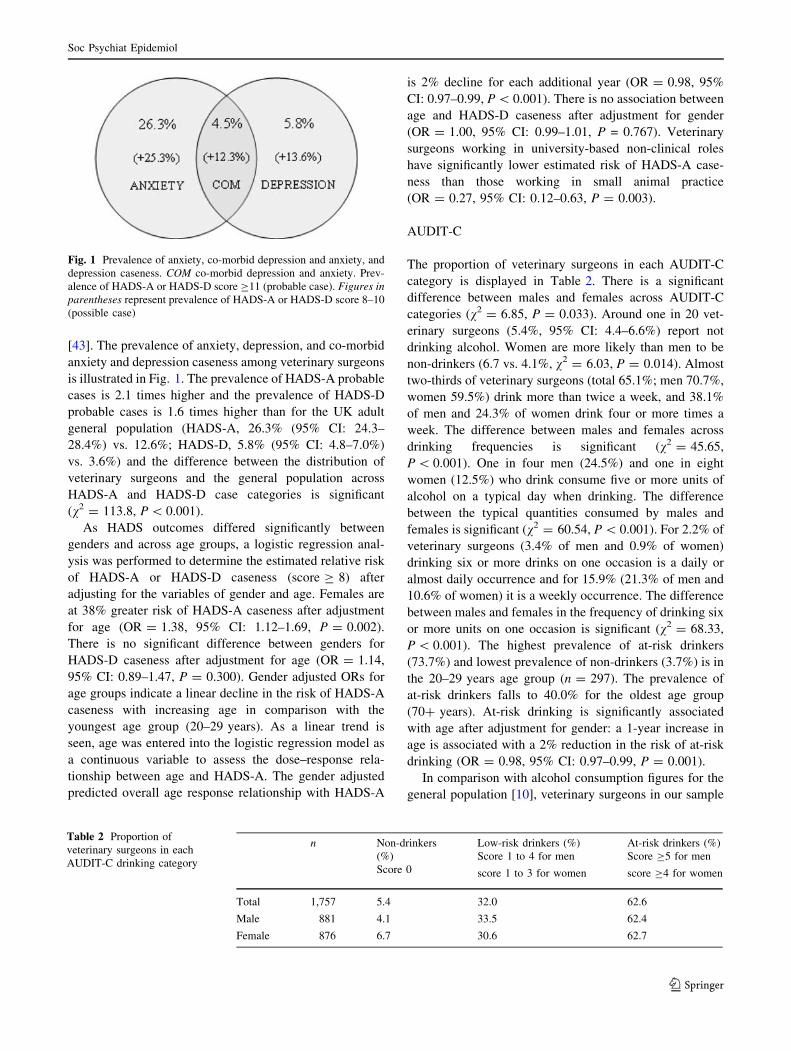
[43]. The prevalence of anxiety, depression, and co-morbid
anxiety and depression caseness among veterinary surgeons
is illustrated in Fig. 1. The prevalence of HADS-A probable
cases is 2.1 times higher and the prevalence of HADS-D
probable cases is 1.6 times higher than for the UK adult
general population (HADS-A, 26.3% (95% CI: 24.3–
28.4%) vs. 12.6%; HADS-D, 5.8% (95% CI: 4.8–7.0%)
vs. 3.6%) and the difference between the distribution of
veterinary surgeons and the general population across
HADS-A and HADS-D case categories is significant
(v2 = 113.8, P \ 0.001).
As HADS outcomes differed significantly between
genders and across age groups, a logistic regression anal-
ysis was performed to determine the estimated relative risk
of HADS-A or HADS-D caseness (score C 8) after
adjusting for the variables of gender and age. Females are
at 38% greater risk of HADS-A caseness after adjustment
for age (OR = 1.38, 95% CI: 1.12–1.69, P = 0.002).
There is no significant difference between genders for
HADS-D caseness after adjustment for age (OR = 1.14,
95% CI: 0.89–1.47, P = 0.300). Gender adjusted ORs for
age groups indicate a linear decline in the risk of HADS-A
caseness with increasing age in comparison with the
youngest age group (20–29 years). As a linear trend is
seen, age was entered into the logistic regression model as
a continuous variable to assess the dose–response rela-
tionship between age and HADS-A. The gender adjusted
predicted overall age response relationship with HADS-A
is 2% decline for each additional year (OR = 0.98, 95%
CI: 0.97–0.99, P \ 0.001). There is no association between
age and HADS-D caseness after adjustment for gender
(OR = 1.00, 95% CI: 0.99–1.01, P = 0.767). Veterinary
surgeons working in university-based non-clinical roles
have significantly lower estimated risk of HADS-A case-
ness than those working in small animal practice
(OR = 0.27, 95% CI: 0.12–0.63, P = 0.003).
AUDIT-C
The proportion of veterinary surgeons in each AUDIT-C
category is displayed in Table 2. There is a significant
difference between males and females across AUDIT-C
categories (v2 = 6.85, P = 0.033). Around one in 20 vet-
erinary surgeons (5.4%, 95% CI: 4.4–6.6%) report not
drinking alcohol. Women are more likely than men to be
non-drinkers (6.7 vs. 4.1%, v2 = 6.03, P = 0.014). Almost
two-thirds of veterinary surgeons (total 65.1%; men 70.7%,
women 59.5%) drink more than twice a week, and 38.1%
of men and 24.3% of women drink four or more times a
week. The difference between males and females across
drinking frequencies is significant (v2 = 45.65,
P \ 0.001). One in four men (24.5%) and one in eight
women (12.5%) who drink consume five or more units of
alcohol on a typical day when drinking. The difference
between the typical quantities consumed by males and
females is significant (v2 = 60.54, P \ 0.001). For 2.2% of
veterinary surgeons (3.4% of men and 0.9% of women)
drinking six or more drinks on one occasion is a daily or
almost daily occurrence and for 15.9% (21.3% of men and
10.6% of women) it is a weekly occurrence. The difference
between males and females in the frequency of drinking six
or more units on one occasion is significant (v2 = 68.33,
P \ 0.001). The highest prevalence of at-risk drinkers
(73.7%) and lowest prevalence of non-drinkers (3.7%) is in
the 20–29 years age group (n = 297). The prevalence of
at-risk drinkers falls to 40.0% for the oldest age group
(70? years). At-risk drinking is significantly associated
with age after adjustment for gender: a 1-year increase in
age is associated with a 2% reduction in the risk of at-risk
drinking (OR = 0.98, 95% CI: 0.97–0.99, P = 0.001).
In comparison with alcohol consumption figures for the
general population [10], veterinary surgeons in our sample
Fig. 1 Prevalence of anxiety, co-morbid depression and anxiety, and
depression caseness. COM co-morbid depression and anxiety. Prev-
alence of HADS-A or HADS-D score C11 (probable case). Figures inparentheses represent prevalence of HADS-A or HADS-D score 8–10
(possible case)
Table 2 Proportion of
veterinary surgeons in each
AUDIT-C drinking category
n Non-drinkers
(%)
Score 0
Low-risk drinkers (%)
Score 1 to 4 for men
score 1 to 3 for women
At-risk drinkers (%)
Score C5 for men
score C4 for women
Total 1,757 5.4 32.0 62.6
Male 881 4.1 33.5 62.4
Female 876 6.7 30.6 62.7
Soc Psychiat Epidemiol
123

are less likely to be non-drinkers (5 vs. 12%), drink more
frequently than the general population (65 vs. 48% drink
more than twice per week), but consume less on a typical
drinking day and a have a prevalence of daily and weekly
binge-drinking that is similar to the general population.
Suicidal ideation
The proportion of veterinary surgeons giving a positive
response to each of the questions regarding negative
thoughts about their life in the previous 12 months is dis-
played in Table 3. The 12-month prevalence of any
suicidal ideation is 29.4% (life was not worth living,
23.0%; death wishes, 15.0%; suicidal thoughts, 21.3%).
Women are more likely than men to think that life is not
worth living (OR = 1.31, 95% CI: 1.05–1.64, P = 0.017)
but there is otherwise no statistically significant difference
between genders or the age groups examined. Logistic
regression analysis with adjustment for age and gender was
used to identify demographic and occupational risk factors
for suicidal thoughts. Veterinary surgeons working in
mixed practice (OR = 0.46, 95% CI: 0.29–0.71,
P = 0.001) and in university-based clinical roles
(OR = 0.29, 95% CI: 0.09–0.94, P = 0.039) are at
reduced risk of suicidal thoughts than those working in
small animal practice (the reference category). Veterinary
surgeons employed as full-time assistants are at increased
risk of suicidal thoughts (OR = 2.07, 95% CI: 1.15–3.73,
P = 0.016) than those working as sole principals. Longer
working hours is also a risk factor: a 1-h increase in hours
worked in a typical week increases the risk of suicidal
thoughts by 1.9% (OR = 1.02, 95% CI: 1.01–1.03,
P = 0.007). By contrast, risk is unaffected by an increase
in number of hours on call in a typical week (OR = 1.00,
95% CI: 1.00–1.01, F = 10.9, P = 0.527).
A 1-unit increase in HADS-A score is associated with a
15% higher estimated relative risk of reporting having
experienced suicidal thoughts in the previous 12 months
(OR = 1.15, 95% CI: 1.09–1.20, P \ 0.001); a 1-unit
increase in the relationships domain score for HSE MSIT
is associated with a 22% lower risk (OR = 0.78, 95% CI:
0.62–0.99, P = 0.045); and a 1-unit increase in WEMWBS
score is associated with a 7% lower risk (OR = 0.93, 95%
CI: 0.90–0.96, P \ 0.001).
In the second National Survey of Psychiatric Morbidity
[41] of adults in Great Britain, which used identical sui-
cidal ideation questions, the 12-month prevalence of
suicidal thoughts was 3.9% (4.1% of women, 3.6% of men)
[35]; the prevalence was three or more times higher among
younger people and the middle-aged than among older
people [14]. The 12-month prevalence (21.3%, 95% CI:
19.5–23.3) of suicidal thoughts in this sample is around 5.5
times higher than among the general population. Although
the gender difference in 12-month prevalence of suicidal
thoughts among veterinary surgeons is not statistically
significant, the higher prevalence among women is con-
sistent with the gender difference in this parameter among
the general population in Great Britain [35]. The 12-month
prevalence of suicidal thoughts among veterinary surgeons
is similar across all the age groups examined, in contrast to
the decline in prevalence with increasing age observed in
the general population in Great Britain [14].
Table 3 Twelve-month prevalence of suicidal ideation
Characteristic Life not worth livinga Wished you were deadb Suicidal thoughtsc Any suicidal ideationd
n % OR 95% CI n % OR 95% CI n % OR 95% CI n % OR 95% CI
Total 1,751 23.0 – – 1,751 15.0 – – 1,749 21.3 – – 1,750 29.4 – –
Gender
Male 878 20.6 1 – 879 13.5 1 – 878 20.2 1 – 878 27.4 1 –
Female 873 25.4 1.31* 1.05–1.64 872 16.5 1.26 0.97–1.64 871 22.5 1.15 0.92–1.45 872 31.3 1.20 0.98–1.48
Age
\35 611 23.7 1 – 611 15.5 1 – 610 22.8 1 – 611 30.4 1 –
35–54 910 22.3 0.92 0.72–1.18 911 14.9 0.95 0.72–1.27 909 20.9 0.90 0.70–1.15 909 28.3 0.90 0.72–1.13
55–74 216 23.1 0.97 0.67–1.40 215 12.6 0.78 0.49–1.23 216 19.4 0.82 0.56–1.20 216 31.0 1.03 0.73–1.44
C75 5 0 – – 5 0 – – 5 0 – – 5 0 – –
OR odds ratio, CI confidence interval
* P = 0.017a A positive response to the question: ‘Have you felt that life was not worth living?’b A positive response to the question: ‘Have you wished that you were dead?’c A positive response to the question: ‘Have you thought of taking your life, even if you would not really do it?’d A positive response to any of the three questions above; an extended definition of suicidal thoughts used by Gunnell and Harbord [19]
Soc Psychiat Epidemiol
123

WEMWBS
The mean WEMWBS score for the sample of veterinary
surgeons is 48.85 (SD = 9.06) and the score is signifi-
cantly higher for men than for women (49.86 vs. 47.83,
P \ 0.001). There is a significant relationship between
WEMWBS and age adjusted for gender: the score increa-
ses by 0.05 for every 1-year increase in age (b = 0.05,
95% CI: 0.01–0.09, P = 0.012). There is also a significant
difference in mean WEMWBS between genders adjusted
for age: the mean score for females is 1.65 less than
the mean score for males (b = -1.65, 95% CI: -2.55 to
-0.74, P \ 0.001). The mean scores for veterinary sur-
geons working in university-based non-clinical university-
based clinical roles are higher in comparison with those
working in small animal practice after adjusting for age and
gender (university–non-clinical: b = 3.50, 95% CI: 0.37–
6.62, P = 0.029; university–clinical: b = 2.76, 95% CI:
0.48–5.03, P = 0.018).
The mean WEMWBS scores for the total sample of
veterinary surgeons, and for male and female veterinary
surgeons separately, are significantly lower than the cor-
responding means for a representative general population
sample from Scotland [6] (48.85 vs. 51.05 [t(2728) =
-6.20, P \ 0.001]; 49.86 vs. 51.21 [t(1408) = -2.80,
P = 0.003]; 47.83 vs. 50.92 [t(1561) = -6.84,
P \ 0.001], respectively).
Psychosocial work characteristics
Mean and median scores for each of the HSE MSIT scales
for the veterinary profession are displayed in Table 4. A
low score indicates less favourable working conditions
(high risk of stress at work). The scores derived for each
scale cannot be compared across scales [51].
Veterinary surgeons self-report less favourable psycho-
social work characteristics than the general population
across all of the seven stressor domains of HSE MSIT [51]
and the differences are statistically significant (except for
the control domain). The greatest differences between the
mean scores for the veterinary profession and the general
population are for the demands [2.96 vs. 3.57;
t(2267) = 16.50, P \ 0.001] and managerial support [3.14
vs. 3.76; t(2252) = 13.74, P \ 0.001] scales. In keeping
with other studies that consider gender-related differences
in stress, e.g. [13], male veterinary surgeons report more
favourable working conditions associated with control,
relationships, role and change than female veterinary
surgeons. Younger veterinary surgeons (\49 years) report
the least favourable working conditions across all stressor
domains. Reported working conditions for demands, man-
agerial support and peer support domains are least
favourable for those working the longest hours. Reported
working conditions for the seven stressor domains vary
with other occupational factors. For example, veterinary
surgeons working for charities and in university-based
clinical roles report the least favourable working conditions
related to demands and control; those working in govern-
ment roles report the least favourable working conditions
related to relationships and role.
Work–home interaction
The mean WHI_N score for the total sample (n = 1,749) is
1.19 (SD = 0.57). Multiple linear regression indicated that
there is no significant difference between mean score for
Table 4 Stressor domain scores for the veterinary profession
Demands Control Managerial support Peer support
n Mean SD Median n Mean SD Median n Mean SD Median n Mean SD Median
Total 1,762 2.96 0.70 3.00 1,749 3.47 0.78 3.50 1,472 3.14 0.89 3.2 1,736 3.75 0.73 3.75
Gender
Male 876 2.97 0.71 3.00 878 3.70� 0.72 3.67 681 3.17 0.90 3.2 868 3.74 0.73 3.75
Female 871 2.96 0.69 3.00 871 3.24 0.76 3.33 791 3.11 0.88 3.2 868 3.75 0.73 3.75
Relationships Role Change
n Mean SD Median n Mean SD Median n Mean SD Median
Total 1,743 4.01 0.69 4.25 1,737 4.21 0.63 4.20 1,711 3.22 0.94 3.33
Gender
Male 875 4.06§ 0.66 4.25 873 4.28� 0.62 4.40 858 3.44� 0.89 3.67
Female 868 3.96 0.71 4.00 864 4.15 0.65 4.20 853 2.99 0.93 3.00
§ P \ 0.01, one-way ANOVA; � P \ 0.001, one-way ANOVA
Soc Psychiat Epidemiol
123

men and women after adjusting for age, although the mean
is significantly higher for women prior to adjustment for
age (1.23 vs. 1.14, F = 11.3, P = 0.001). There is a sig-
nificant relationship between mean score and age after
adjustment for gender; the score decreases by 0.010 for
every one year increase in age (95% CI: -0.012 to -0.007,
P \ 0.001). Veterinary surgeons working in government
and university-based non-clinical roles have lower mean
WHI_N score than those working in small animal practice
after adjusting for age and gender (Government: b = -0.13,
95% CI: -0.25 to -0.02, P = 0.021; University non-
clinical: b = -0.23, 95% CI: -0.43 to -0.04, P = 0.019).
The mean WHI_P score for the total sample (n = 1,716)
is 0.97 (SD = 0.56). Multiple linear regression indicated
that there is no significant difference between mean score for
men and women after adjusting for age, although the mean is
significantly lower for women prior to adjustment for age
(0.92 vs. 1.01, F = 10.9, P = 0.001). There is a significant
relationship between mean score and age after adjustment
for gender: the score increases by 0.005 for every 1-year
increase in age (95% CI: 0.002–0.007, P \ 0.001).
The mean WHI_N score for the sample is higher than
for a sample of the working population from the Nether-
lands [16] and lower than for Belgian veterinary surgeons
[20]. The mean WHI_P score for the sample is higher than
for the sample of the working population from the Neth-
erlands [16] and lower than for Belgian veterinary surgeons
[20]. The results suggest that veterinary surgeons report
higher levels of both negative and positive work–home
interaction, but comparative data must be interpreted cau-
tiously due to possible cultural differences in interpretation
of the scale items and the small size of the Belgian sample.
Contributors to stress
Number of hours worked, making professional mistakes,
client expectations, and administrative and clerical tasks
are reported as the greatest contributors to stress for the
sample population of veterinary surgeons. The percentage
of respondents reporting that these stressors contribute
quite a lot or very much to their stress is 42.9, 40.4, 38.0
and 27.9%, respectively. Respondents who treated clinical
cases were asked a further set of questions regarding pos-
sible stressors. The possibility of client complaints or
litigation, unexpected clinical outcomes and out-of-hours
on-call duties are reported as the greatest contributors to
stress for respondents treating clinical cases.
Sources of satisfaction
The greatest sources of satisfaction cited included: good
clinical outcomes (41.5%), relationships with colleagues
(33.7%) and intellectual challenge/learning (32.4%).
Non-response bias
The demographic and occupational profile of study
respondents was generally in close alignment with that of
the original sample. A comparative analysis to identify
any differences between outcome measures for late
responders (n = 272) and earlier responders showed that
the HADS scores and 12-month prevalence of suicidal
thoughts were higher and WEMWBS score lower among
late responders, but the difference was only significant for
HADS-D (mean = 5.11 vs. 4.57, t(1760) = -2.40,
P = 0.017).
Discussion
Main findings
Compared to the general population, the sample of veter-
inary surgeons reported high levels of anxiety and
depressive symptoms; higher 12-month prevalence of sui-
cidal thoughts; less favourable psychosocial working
characteristics, especially in regard to demands and man-
agerial support; lower levels of positive mental well-being;
and higher levels of negative work–home interaction. The
levels of psychological distress reported suggest ready
access to and knowledge of lethal means is probably not
operating in isolation to increase suicide risk within the
profession.
The prevalence of possible co-morbid anxiety and
depression among this sample of veterinary surgeons
[defined by coexisting probable and possible cases (scor-
es C 8)] is 16.8%. The presence of co-morbid anxiety
disorders increases the risk of suicidal behaviour in people
with depression [21, 39], and there is evidence to suggest
that co-morbidity, and not depression itself, is a risk factor
for suicide attempts [17] and completed suicide [46].
Alcohol has a well-established role in suicidal behaviour
through its induction of negative affect, promotion of
adverse life events, impairment of problem-solving skills,
disinhibitory effects and the social disintegrative effects of
abuse [5]. However, the level of alcohol consumption does
not appear to be a negative influence on mental health
within the profession as a whole.
Suicidal thoughts are a key stage in the pathway
leading to suicide [19]. Positive associations have been
demonstrated between favourable attitudes towards sui-
cide (the degree to which an individual views suicide as
an acceptable option under some circumstances) and
levels of suicidal thoughts [15, 17]. Favourable attitudes
towards suicide appear to increase the attractiveness of
suicide should situational cues arise, placing an individual
at increased risk of suicidal ideation. The high prevalence
Soc Psychiat Epidemiol
123

of suicidal ideation among veterinary surgeons may be
associated with the profession’s acceptance of and
familiarity with animal euthanasia which may change
attitudes to suicide as a possible solution to their own
problems [2]. Ready access to means of suicide is posited
as a key factor that influences the translation of suicidal
thoughts into an actual suicide act [24]. Ready access to
lethal means may also act more distally in the suicide
process and account for the high prevalence of suicidal
thoughts among veterinary surgeons, if the ease at which
a suicide can be completed cues the consideration of
suicide as a possible solution.
Psychosocial working conditions may be important risk
factors contributing to suicidal behaviours [37] and studies
have demonstrated a causal association between work stress
and rates of depression and anxiety [31, 49]. A recent meta-
analysis provided robust evidence that a combination of high
demands and low decision latitude, effort–reward imbal-
ance, and low social support at work from co-workers and
supervisors are risk factors for common mental disorders
[44]. The less favourable psychosocial working character-
istics reported in comparison with the general population
suggest that high demands and low managerial support may
be important contributors to work-related stress among
veterinary surgeons, in keeping with the demand–control–
support model of work-related stress [27, 28].
Strengths
Our study has several strengths. First, it is based on a large
nationwide sample of veterinary surgeons in a range of
different types of employment and the demographic and
occupational profile of respondents is broadly representa-
tive of the UK veterinary profession which gives some
confidence in the generalisability of the results. Second, the
questionnaire uses standard instruments with known psy-
chometric properties to help ensure the validity and
reliability of the results and availability of normative data.
The short series of bespoke questions on stressors pertinent
to the veterinary profession was developed using focus
groups and subsequently pre- and pilot-tested to help
ensure relevance, comprehensiveness and absence of bias.
The response rate of 56% is less than optimal but compares
favourably with other postal surveys of the veterinary
profession (e.g. Mellanby and Herrtage [33]), which may
reflect a high level of personal salience of the subject of
mental health to the sample population. The study adopts a
comprehensive approach to the assessment of mental
health in the veterinary profession, seeking to identify
sources of pleasure in veterinary work and complementing
indicators of psychological morbidity with measures of
mental well-being and work–home interaction. The latter
may be important in the aetiology of mood disorders
among the working population [50].
Limitations
The data are limited by the cross-sectional design which
allows investigation of associations, but does not allow
conclusions to be drawn about the direction of causality. A
further limitation in the study methodology is bias related
to the self-reporting of symptoms and working conditions.
The difference between outcome measures for late and
earlier responders suggests that the reported prevalence of
mental ill-health may have been higher if the study
response rate was higher. The content of the questionnaire
may have led to some selection bias. Veterinary surgeons
with mental health problems may have been disinclined to
respond due to their symptoms or concerns that they might
be identified, or conversely those without mental health
problems may have considered that the questionnaire was
not relevant to them. The survey did not collect informa-
tion on some potentially relevant mediating or moderating
variables such as marital status, adverse work and life
events, attitudes to euthanasia and suicide, history of any
previous psychological distress, family history of affective
disorder, use of prescribed or non-prescribed psychotropic
medication, duration of exposure to possible explanatory
variables (e.g. length of time in current job), social network
size and perceived social support outside work, and per-
sonality factors such as negative affectivity and
attributional style, which may have confounded associa-
tions without adjustment for them. Comparison of
measures of mental health and well-being for the study
sample with those for the general population must be
undertaken with great care due to the possible influence of
variables including socio-demographic factors.
Future research
There is scope for further research to explore the results of
the current study with, for example, qualitative interviews
with a purposive sample of respondents, and longitudinal
studies would help to determine whether the cross-sec-
tional associations identified in the current study are causal.
Research is also required to develop interventions and
evaluate their effectiveness and utility.
Acknowledgments The study was funded by Veterinary Times and
BUPA Giving. We thank the veterinary surgeons throughout the UK
who participated in the survey. Catherine Carr provided administra-
tive support. Julia Sinclair kindly reviewed and commented on a late
draft of the manuscript.
Conflict of interest statement The authors declare that they have
no competing interests.
Soc Psychiat Epidemiol
123

References
1. Agerbo E, Gunnell D, Bonde JP, Mortensen PB, Nordentoft M
(2007) Suicide and occupation: the impact of socio-economic,
demographic and psychiatric differences. Psychol Med 37:1131–
1140
2. Alexander RE (2001) Stress-related suicide by dentists and other
health care workers. Fact or folklore? J Am Dent Assoc 132:786–
794
3. Bartram DJ, Baldwin DS (2008) Veterinary surgeons and suicide:
influences, opportunities and research directions. Vet Rec
162:36–40
4. Bjelland I, Dahl AA, Haug TT, Neckelmann D (2002) The
validity of the hospital anxiety and depression scale. An updated
literature review. J Psychosom Res 52:69–77
5. Brady J (2006) The association between alcohol misuse and
suicidal behaviour. Alcohol Alcohol 41:473–478
6. Braunholtz, S, Davidson S, Myant K, O’Connor R. (2007) Well?
What do you think? (2006): the third national Scottish survey of
public attitudes to mental health, mental wellbeing and mental
health problems. The Scottish Executive, Edinburgh
7. Bronisch T, Wittchen HU (1994) Suicidal ideation and suicide
attempts: comorbidity with depression, anxiety disorders, and sub-
stance abuse disorder. Eur Arch Psychiatry Clin Neurosci 244:93–98
8. Bush K, Kivlahan DR, McDonell MB, Fihn SD, Bradley KA
(1998) The AUDIT alcohol consumption questions (AUDIT-C):
an effective brief screening test for problem drinking. Arch Intern
Med 158:1789–1795
9. Charlton J (1995) Trends and patterns in suicide in England and
Wales. Int J Epidemiol 24(Suppl 1):S45–S52
10. Coulthard M, Farrell M, Singleton N, Meltzer H (2002) Tobacco,
alcohol and drug use and mental health. The Stationery Office,
London
11. Cousins R, MacKay CJ, Clarke SD, Kelly C, Kelly PJ, McCaig
RH (2004) ‘Management standards’ and work related stress in the
UK: practical development. Work Stress 18:113–136
12. Crawford JR, Henry JD, Crombie C, Taylor EP (2001) Normative
data for the HADS from a large non-clinical sample. Br J Clin
Psychol 40:429–434
13. De Smet P, Sans S, Dramaix M, Boulenguez C, de Backer G,
Ferrario M et al (2005) Gender and regional differences in per-
ceived job stress across Europe. Eur J Public Health 15:536–545
14. Dennis M, Baillon S, Brugha T, Lindesay J, Stewart R, Meltzer H
(2007) The spectrum of suicidal ideation in Great Britain: com-
parisons across a 16–74 years age range. Psychol Med 37:795–805
15. Etzersdorfer E, Vijayakumar L, Schony W, Grausgruber A,
Sonneck G (1998) Attitudes towards suicide among medical
students: comparison between Madras (India) and Vienna (Aus-
tria). Soc Psychiatry Psychiatr Epidemiol 33:104–110
16. Geurts SAE, Taris TW, Kompier MAJ, Dikkers JSE, Van Hoof
MLM, Kinnunen UM (2005) Work–home interaction from a
work psychological perspective: development and validation of a
new questionnaire, the SWING. Work Stress 40:429–434
17. Gibb BE, Andover MS, Beach SR (2006) Suicidal ideation and
attitudes toward suicide. Suicide Life Threat Behav 36:12–18
18. Gual A, Segura L, Contel M, Heather N, Colom J (2002) Audit-3
and audit-4: effectiveness of two short forms of the alcohol use
disorders identification test. Alcohol Alcohol 37:591–596
19. Gunnell D, Harbord R (2003) Suicidal Thoughts. In: Singleton N,
Lewis G (eds) Better or worse: a longitudinal study of the mental
health of adults living in private households in Great Britain. The
Stationery Office, London, pp 45–65
20. Hansez I, Schins F, Rollin F (2008) Occupational stress, work–
home interference and burnout among Belgian veterinary prac-
titioners. Ir Vet J 61:233–241
21. Hawgood J, De Leo D (2008) Anxiety disorders and suicidal
behaviour: an update. Curr Opin Psychiatry 21:51–64
22. Hawton K, Clements A, Sakarovitch C, Simkin S, Deeks JJ
(2001) Suicide in doctors: a study of risk according to gender,
seniority and specialty in medical practitioners in England and
Wales, 1979–1995. J Epidemiol Community Health 55:296–300
23. Hawton K, Vislisel L (1999) Suicide in nurses. Suicide Life
Threat Behav 29:86–95
24. Hawton K (2007) Restricting access to methods of suicide:
rationale and evaluation of this approach to suicide prevention.
Crisis 28(Suppl 1):4–9
25. Hem E, Haldorsen T, Aasland OG, Tyssen R, Vaglum P, Ekeberg
O (2005) Suicide rates according to education with a particular
focus on physicians in Norway 1960–2000. Psychol Med 35:873–
880
26. Jones-Fairnie H, Ferroni P, Silburn S, Lawrence D (2008) Suicide
in Australian veterinarians. Aust Vet J 86:114–116
27. Karasek R, Theorell T (1990) Healthy work: stress, productivity,
and the reconstruction of working life. Basic Books, New York
28. Karasek RA Jr (1979) Job demands, job decision latitude, and
mental strain: implications for job redesign. Adm Sci Q 24:285–
308
29. Kelly S, Bunting J (1998) Trends in suicide in England and
Wales, 1982–96. Popul Trends 92:29–41
30. Malmberg A, Simkin S, Hawton K (1999) Suicide in farmers. Br
J Psychiatry 175:103–105
31. Melchior M, Caspi A, Milne BJ, Danese A, Poulton R, Moffitt TE
(2007) Work stress precipitates depression and anxiety in young,
working women and men. Psychol Med 37:1119–1129
32. Mellanby RJ (2005) Incidence of suicide in the veterinary pro-
fession in England and Wales. Vet Rec 157:415–417
33. Mellanby RJ, Herrtage ME (2004) Survey of mistakes made by
recent veterinary graduates. Vet Rec 155:761–765
34. Meltzer H, Griffiths C, Brock A, Rooney C, Jenkins R (2008)
Patterns of suicide by occupation in England and Wales: 2001–
2005. Br J Psychiatry 193:73–76
35. Meltzer H, Lader D, Corbin T, Singleton N, Jenkins R, Brugha T
(2002) Non-fatal suicidal behaviour among adults aged 16 to 74
in Great Britain. The Stationery Office, London
36. Miller JM, Beaumont JJ (1995) Suicide, cancer, and other causes
of death among California veterinarians, 1960–1992. Am J Ind
Med 27:37–49
37. Ostry A, Maggi S, Tansey J, Dunn J, Hershler R, Chen L et al
(2007) The impact of psychosocial work conditions on attempted
and completed suicide among western Canadian sawmill work-
ers. Scand J Public Health 35:265–271
38. Paykel ES, Myers JK, Lindenthal JJ, Tanner J (1974) Suicidal
feelings in the general population: a prevalence study. Br J
Psychiatry 24:460–469
39. Sareen J, Cox BJ, Afifi TO, de Graaf R, Asmundson GJ, ten Have
M et al (2005) Anxiety disorders and risk for suicidal ideation
and suicide attempts: a population-based longitudinal study of
adults. Arch Gen Psychiatry 62:1249–1257
40. Schernhammer ES, Colditz GA (2004) Suicide rates among
physicians: a quantitative and gender assessment (meta-analysis).
Am J Psychiatry 161:2295–2302
41. Singleton N, Bumpstead R, O’Brien M, Lee A, Meltzer H (2001)
Psychiatric morbidity among adults living in private households,
2000. The Stationery Office, London
42. Snaith RP (2003) The hospital anxiety and depression scale.
Health Qual Life Outcomes 1:29
43. Stack S (2001) Occupation and suicide. Soc Sci Q 82:384–396
44. Stansfeld S, Candy B (2006) Psychosocial work environment and
mental health—a meta-analytic review. Scand J Work Environ
Health 32:443–462
Soc Psychiat Epidemiol
123

45. Stark C, Belbin A, Hopkins P, Gibbs D, Hay A, Gunnell D (2006)
Male suicide and occupation in Scotland. Health Stat Q 29:26–29
46. Stordal E, Morken G, Mykletun A, Neckelmann D, Dahl AA
(2008) Monthly variation in prevalence rates of comorbid
depression and anxiety in the general population at 63–65 degrees
North: the HUNT study. J Affect Disord 106:273–278
47. Tennant R, Hiller L, Fishwick R, Platt S, Joseph S, Weich S et al
(2007) The Warwick–Edinburgh mental well-being scale (WE-
MWBS): development and UK validation. Health Qual Life
Outcomes 5:63
48. Torre DM, Wang NY, Meoni LA, Young JH, Klag MJ, Ford DE
(2005) Suicide compared to other causes of mortality in physi-
cians. Suicide Life Threat Behav 35:146–153
49. Waldenstrom K, Ahlberg G, Bergman P, Forsell Y, Stoetzer U,
Waldenstrom M et al (2008) Externally assessed psychosocial
work characteristics and diagnoses of anxiety and depression.
Occup Environ Med 65:90–96
50. Wang JL (2006) Perceived work stress, imbalance between work
and family/personal lives, and mental disorders. Soc Psychiatry
Psychiatr Epidemiol 41:541–548
51. Webster S, Buckley P, Rose I (2007) Psychosocial working
conditions in Britain in 2007. Health and Safety Executive,
London
52. Zigmund AS, Snaith RP (1983) The hospital anxiety and
depression scale. Acta Psychiatr Scand 67:361–370
Soc Psychiat Epidemiol
123

Appendix VI: Study-related publications
BARTRAM, D.J., YADEGARFAR, G. & BALDWIN, D.S. (2008) Reported alcohol
consumption, depressive and anxiety symptoms, and mental well-being among UK
veterinary surgeons: cross-sectional questionnaire survey. [Poster presentation at the
Summer Meeting of the British Association for Psychopharmacology, 20-23 July,
2008. Harrogate, UK] Journal of Psychopharmacology 22 (5 Abstract Suppl.), A30
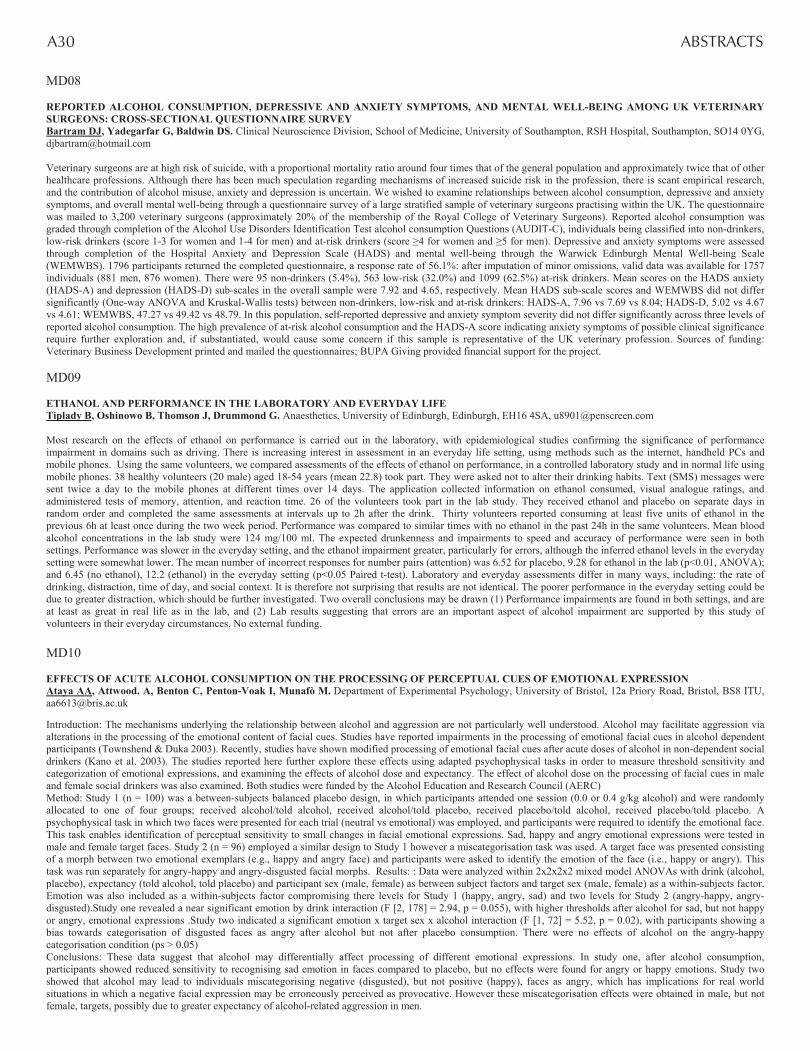
A30 AbstrActs
MD08 REPORTED ALCOHOL CONSUMPTION, DEPRESSIVE AND ANXIETY SYMPTOMS, AND MENTAL WELL-BEING AMONG UK VETERINARY SURGEONS: CROSS-SECTIONAL QUESTIONNAIRE SURVEY Bartram DJ, Yadegarfar G, Baldwin DS. Clinical Neuroscience Division, School of Medicine, University of Southampton, RSH Hospital, Southampton, SO14 0YG, [email protected] Veterinary surgeons are at high risk of suicide, with a proportional mortality ratio around four times that of the general population and approximately twice that of other healthcare professions. Although there has been much speculation regarding mechanisms of increased suicide risk in the profession, there is scant empirical research, and the contribution of alcohol misuse, anxiety and depression is uncertain. We wished to examine relationships between alcohol consumption, depressive and anxiety symptoms, and overall mental well-being through a questionnaire survey of a large stratified sample of veterinary surgeons practising within the UK. The questionnaire was mailed to 3,200 veterinary surgeons (approximately 20% of the membership of the Royal College of Veterinary Surgeons). Reported alcohol consumption was graded through completion of the Alcohol Use Disorders Identification Test alcohol consumption Questions (AUDIT-C), individuals being classified into non-drinkers, low-risk drinkers (score 1-3 for women and 1-4 for men) and at-risk drinkers (score 4 for women and 5 for men). Depressive and anxiety symptoms were assessed through completion of the Hospital Anxiety and Depression Scale (HADS) and mental well-being through the Warwick Edinburgh Mental Well-being Scale (WEMWBS). 1796 participants returned the completed questionnaire, a response rate of 56.1%: after imputation of minor omissions, valid data was available for 1757 individuals (881 men, 876 women). There were 95 non-drinkers (5.4%), 563 low-risk (32.0%) and 1099 (62.5%) at-risk drinkers. Mean scores on the HADS anxiety (HADS-A) and depression (HADS-D) sub-scales in the overall sample were 7.92 and 4.65, respectively. Mean HADS sub-scale scores and WEMWBS did not differ significantly (One-way ANOVA and Kruskal-Wallis tests) between non-drinkers, low-risk and at-risk drinkers: HADS-A, 7.96 vs 7.69 vs 8.04; HADS-D, 5.02 vs 4.67 vs 4.61; WEMWBS, 47.27 vs 49.42 vs 48.79. In this population, self-reported depressive and anxiety symptom severity did not differ significantly across three levels of reported alcohol consumption. The high prevalence of at-risk alcohol consumption and the HADS-A score indicating anxiety symptoms of possible clinical significance require further exploration and, if substantiated, would cause some concern if this sample is representative of the UK veterinary profession. Sources of funding: Veterinary Business Development printed and mailed the questionnaires; BUPA Giving provided financial support for the project. MD09 ETHANOL AND PERFORMANCE IN THE LABORATORY AND EVERYDAY LIFE Tiplady B, Oshinowo B, Thomson J, Drummond G. Anaesthetics, University of Edinburgh, Edinburgh, EH16 4SA, [email protected] Most research on the effects of ethanol on performance is carried out in the laboratory, with epidemiological studies confirming the significance of performance impairment in domains such as driving. There is increasing interest in assessment in an everyday life setting, using methods such as the internet, handheld PCs and mobile phones. Using the same volunteers, we compared assessments of the effects of ethanol on performance, in a controlled laboratory study and in normal life using mobile phones. 38 healthy volunteers (20 male) aged 18-54 years (mean 22.8) took part. They were asked not to alter their drinking habits. Text (SMS) messages were sent twice a day to the mobile phones at different times over 14 days. The application collected information on ethanol consumed, visual analogue ratings, and administered tests of memory, attention, and reaction time. 26 of the volunteers took part in the lab study. They received ethanol and placebo on separate days in random order and completed the same assessments at intervals up to 2h after the drink. Thirty volunteers reported consuming at least five units of ethanol in the previous 6h at least once during the two week period. Performance was compared to similar times with no ethanol in the past 24h in the same volunteers. Mean blood alcohol concentrations in the lab study were 124 mg/100 ml. The expected drunkenness and impairments to speed and accuracy of performance were seen in both settings. Performance was slower in the everyday setting, and the ethanol impairment greater, particularly for errors, although the inferred ethanol levels in the everyday setting were somewhat lower. The mean number of incorrect responses for number pairs (attention) was 6.52 for placebo, 9.28 for ethanol in the lab (p<0.01, ANOVA); and 6.45 (no ethanol), 12.2 (ethanol) in the everyday setting (p<0.05 Paired t-test). Laboratory and everyday assessments differ in many ways, including: the rate of drinking, distraction, time of day, and social context. It is therefore not surprising that results are not identical. The poorer performance in the everyday setting could be due to greater distraction, which should be further investigated. Two overall conclusions may be drawn (1) Performance impairments are found in both settings, and are at least as great in real life as in the lab, and (2) Lab results suggesting that errors are an important aspect of alcohol impairment are supported by this study of volunteers in their everyday circumstances. No external funding. MD10 EFFECTS OF ACUTE ALCOHOL CONSUMPTION ON THE PROCESSING OF PERCEPTUAL CUES OF EMOTIONAL EXPRESSION Ataya AA, Attwood. A, Benton C, Penton-Voak I, Munafò M. Department of Experimental Psychology, University of Bristol, 12a Priory Road, Bristol, BS8 ITU, [email protected] Introduction: The mechanisms underlying the relationship between alcohol and aggression are not particularly well understood. Alcohol may facilitate aggression via alterations in the processing of the emotional content of facial cues. Studies have reported impairments in the processing of emotional facial cues in alcohol dependent participants (Townshend & Duka 2003). Recently, studies have shown modified processing of emotional facial cues after acute doses of alcohol in non-dependent social drinkers (Kano et al. 2003). The studies reported here further explore these effects using adapted psychophysical tasks in order to measure threshold sensitivity and categorization of emotional expressions, and examining the effects of alcohol dose and expectancy. The effect of alcohol dose on the processing of facial cues in male and female social drinkers was also examined. Both studies were funded by the Alcohol Education and Research Council (AERC) Method: Study 1 (n = 100) was a between-subjects balanced placebo design, in which participants attended one session (0.0 or 0.4 g/kg alcohol) and were randomly allocated to one of four groups; received alcohol/told alcohol, received alcohol/told placebo, received placebo/told alcohol, received placebo/told placebo. A psychophysical task in which two faces were presented for each trial (neutral vs emotional) was employed, and participants were required to identify the emotional face. This task enables identification of perceptual sensitivity to small changes in facial emotional expressions. Sad, happy and angry emotional expressions were tested in male and female target faces. Study 2 (n = 96) employed a similar design to Study 1 however a miscategorisation task was used. A target face was presented consisting of a morph between two emotional exemplars (e.g., happy and angry face) and participants were asked to identify the emotion of the face (i.e., happy or angry). This task was run separately for angry-happy and angry-disgusted facial morphs. Results: : Data were analyzed within 2x2x2x2 mixed model ANOVAs with drink (alcohol, placebo), expectancy (told alcohol, told placebo) and participant sex (male, female) as between subject factors and target sex (male, female) as a within-subjects factor. Emotion was also included as a within-subjects factor compromising there levels for Study 1 (happy, angry, sad) and two levels for Study 2 (angry-happy, angry-disgusted).Study one revealed a near significant emotion by drink interaction (F [2, 178] = 2.94, p = 0.055), with higher thresholds after alcohol for sad, but not happy or angry, emotional expressions .Study two indicated a significant emotion x target sex x alcohol interaction (F [1, 72] = 5.52, p = 0.02), with participants showing a bias towards categorisation of disgusted faces as angry after alcohol but not after placebo consumption. There were no effects of alcohol on the angry-happy categorisation condition (ps > 0.05) Conclusions: These data suggest that alcohol may differentially affect processing of different emotional expressions. In study one, after alcohol consumption, participants showed reduced sensitivity to recognising sad emotion in faces compared to placebo, but no effects were found for angry or happy emotions. Study two showed that alcohol may lead to individuals miscategorising negative (disgusted), but not positive (happy), faces as angry, which has implications for real world situations in which a negative facial expression may be erroneously perceived as provocative. However these miscategorisation effects were obtained in male, but not female, targets, possibly due to greater expectancy of alcohol-related aggression in men.

Bartram DJ1, Yadegarfar G2, Baldwin DS1
1. Clinical Neuroscience Division, School of Medicine, University of Southampton, UK;2. Epidemiology and Biostatistics Department, School of Public Health, Isfahan University of Medical Sciences, Iran
Reported alcohol consumption, depressive and anxiety symptoms, and mental well-being among UK veterinary surgeons: cross-sectional questionnaire survey
Veterinary surgeons are at high risk of suicide, with a proportional mortality ratio around four times that of the general population and approximately twice that of other healthcare professions. Although there has been much speculation regarding mechanisms of increased suicide risk in the profession, there is scant empirical research, and the contribution of alcohol misuse, anxiety and depression is uncertain. We wished to examine relationships between alcohol consumption, depressive and anxiety symptoms, and overall mental well-being through a questionnaire survey of a large stratified sample of veterinary surgeons practising within the UK.
The questionnaire was mailed to 3,200 veterinary surgeons (approximately 20% of the membership of the Royal College of Veterinary Surgeons). Reported alcohol consumption was graded through completion of the Alcohol Use Disorders Identification Test alcohol consumption Questions (AUDIT-C), individuals being classified into non-drinkers, low-risk drinkers (score 1-3 for women and 1-4 for men) and at-risk drinkers (score ≥4 for women and ≥5 for men). Depressive and anxiety symptoms were assessed through completion of the Hospital Anxiety and Depression Scale (HADS) and mental well-being through the Warwick Edinburgh Mental Well-being Scale (WEMWBS).
1796 participants returned the completed questionnaire, a response rate of 56.1%: after imputation of minor omissions, valid data was available for 1757 individuals (881 men, 876 women). There were 95 non-drinkers (5.4%), 563 low-risk (32.0%) and 1099 (62.5%) at-risk drinkers. Mean scores on the HADS anxiety (HADS-A) and depression (HADS-D) sub-scales in the overall sample were 7.92 and 4.65, respectively. Mean HADS sub-scale scores and WEMWBS did not differ significantly (one-way ANOVA and Kruskal-Wallis tests) between non-drinkers, low-risk and at-risk drinkers: HADS-A, 7.96 vs. 7.69 vs. 8.04; HADS-D, 5.02 vs. 4.67 vs. 4.61; WEMWBS, 47.27 vs. 49.42 vs. 48.79.
In this population, self-reported depressive and anxiety symptom severity did not differ significantly across three levels of reported alcohol consumption. The high prevalence of at-risk alcohol consumption and the HADS-A score indicating anxiety symptoms of possible clinical significance require further exploration and, if substantiated, would cause some concern if this sample is representative of the UK veterinary profession.
ABSTRACT
BACKGROUND
Mortality due to suicide is higher in the veterinary profession than in the general population, the proportional mortality ratio for suicide being around four times that of the general population and twice that of other healthcare professions. The relative risk of suicide across occupational groups is often explained by differences in demographic factors but veterinary surgeons have higher rates of suicide even when these are taken into account1.
Little is known regarding the mechanisms of increased suicide risk in the profession. It is uncertain whether the increased risk derives from the characteristics of individuals entering the profession, the work environment, or other factors known to influence suicide. In common with other high risk occupational groups, veterinary surgeons have ready access to effective means of suicide which may play an important aetiological role.
Suicide rate is sometimes used as an imperfect proxy indicator of population mental health status2 so it follows that psychological morbidity among veterinary surgeons may also be increased. Initiatives to provide mental health support to members of the profession have been established but there has been no attempt to measure the nature and extent of psychological morbidity among veterinary surgeons in the UK.
METHOD
A questionnaire was mailed twice to 3,200 veterinary surgeons (approximately 20% of the membership of the Royal College of Veterinary Surgeons, excluding those practising overseas or retired). Depressive and anxiety symptoms were assessed through completion of the Hospital Anxiety and Depression Scale (HADS). Reported alcohol consumption was graded through completion of the Alcohol Use Disorders Identification Test alcohol consumption questions (AUDIT-C) and mental well-being through the Warwick Edinburgh Mental Well-Being Scale (WEMWBS). The questionnaire also included measures of suicidal ideation, psychosocial work characteristics and work-home interaction.
To investigate the effect of each predictor variable on continuous response (outcome) variables, simple and multiple linear regression was applied. Simple and multiple logistic regression was applied for binary outcome variables. Odds ratios (ORs) and regression coefficients were accompanied by 95% confidence interval. Statistical significance was defined as p<0.05.
RESULTS
1796 participants returned the completed questionnaire, a response rate of 56.1%. After imputation of minor omissions, valid data was available for 1757 individuals (881 men, 876 women). There were 95 non-drinkers (5.4%), 563 low-risk (32.0%) and 1099 (62.5%) at-risk drinkers. Mean scores on the HADS and WEMWBS are compared across alcohol consumption categories in Table 1.
† HADS-A, HADS-T and WEMWBS scores are nearly normally distributed and HADS-D is positively skewed. Levene test of homogeneity of variances indicated one-way ANOVA is acceptable for testing relationship between AUDIT-C and outcome variables.
CONCLUSIONS
HADS-A subscale scores for non-drinkers are higher than for low-risk drinkers and lower than for at-risk drinkers; HADS-D subscale scores are higher for non-drinkers than for low-risk drinkers and lowest for at-risk drinkers; WEMWBS scores are lowest for non-drinkers, higher for at-risk drinkers and highest for low-risk drinkers. However, self-reported depressive and anxiety symptom severity and positive mental well-being did not differ significantly across three levels of reported alcohol consumption. The high prevalence of at-risk alcohol consumption and the HADS-A score indicating anxiety symptoms of possible clinical significance require further exploration and, if substantiated, would cause some concern if this sample is representative of the UK veterinary profession.
REFERENCES AND ACKNOWLEDGEMENTS
Figure 1. summarises the distribution of AUDIT-C scores among male and female veterinary surgeons. AUDIT-C scores are nearly normally distributed but slightly positively skewed. The gender difference across AUDIT-C scores is significant (Pearson χ2=96.34, df=12, p<0.001).
1. BARTRAM, D.J. & BALDWIN, D.S. Veterinary Record 2008; 162: 36-402. BRAY, I. & GUNNELL, D. Social Psychiatry and Psychiatric Epidemiology 2006; 41: 333-337We gratefully acknowledge all respondents for completing and returning the questionnaire, Veterinary Business Development for printing and mailing the questionnaires, and BUPA Giving for financial support of the project. Administrative assistance was provided by Catherine Carr.
SDmeanSDmeanSDmeanSDmean
0.3010.7200.5270.284Kruskal-Wallis0.1370.6050.5180.264One-way ANOVA
p-value†
9.0648.856.7912.573.424.654.097.92Total (n=1757)
8.9648.796.7512.643.414.614.078.04At-risk drinkers (n=1757)
8.9949.246.7512.363.424.674.037.69Low risk drinkers (n=563)
10.4047.277.4712.983.645.024.577.96Non-drinkers (n=95)
WEMWBSHADS-THADS-DHADS-A
0
2
4
6
8
10
12
14
16
18
20
0 1 2 3 4 5 6 7 8 9 10 11 12AUDIT-C score
Perc
ent
Male (n=881) Female (n=876)
Table 1
Figure 1

Appendix VI: Study-related publications
BARTRAM, D.J. & BALDWIN, D.S. (2008) Veterinary surgeons and suicide: a
hypothetical model to explain risk. [Oral presentation] Proceedings of 12th European
Symposium on Suicide and Suicidal Behaviour, 27-30 August, 2008. Glasgow,
Scotland. pp 57-58


ESSSB12
Presentation O3.5.2, 28 August 2008
Veterinary surgeons and suicide:a hypothetical model to explain risk
Bartram DJ, Baldwin DSClinical Neuroscience Division, School of Medicine
University of Southampton, UK
12th European Symposium on Suicide and Suicidal Behaviour, 27-30 August 2008, Glasgow
Presentation: O3.5.2 2
• Evidence for elevated suicide risk among vets
• Reasons for developing a conceptual model
• Basis for model
• Overview of the model
• Future research
Outline of presentation
3
Elevated PMR for suicide – male vets
252-50336120-74Eng & Wales1979-1990Mellanby (2005)3
Stark and others (2006)4
Stark and others (2006)4
Mellanby (2005)3
Kelly and Bunting (1998)2
Kelly and Bunting (1998)2
Charlton and others (1993)1
Author
1981-1999
1981-1999
1991-2000
1991-1996
1982-1987
1979-1990
Year
NR36416-64Eng & Wales
46-64
16-45
20-74
20-64
20-64
Age
244-548374Eng & Wales
36-1088
80-749
148-615
203-559
95% CI
301Scotland
293Scotland
324Eng & Wales
349Eng & Wales
PMRRegion
1. CHARLTON, J. et al (1993) Population Trends 71, 34-42
2. KELLY, S. & BUNTING, J. (1998) Population Trends 92, 29-41
3. MELLANBY, R. (2005) Veterinary Record 157, 415-417
4. STARK, C. et al (2006) Health Statistics Quarterly 29, 26-29
NR, not reported
4
166-85341420-74Eng & Wales1979-1990Mellanby (2005)2
Meltzer and others (2008)3
Mellanby (2005)2
Kelly and Bunting (1998)1
Author
2001-2005
1991-2000
1991-1996
Year
20-64
20-74
20-59
Age
446-27101240Eng & Wales
198-1422
136-1279
95% CI
609Eng & Wales
500Eng & Wales
PMRRegion
Elevated PMR for suicide – female vets
1. KELLY, S. & BUNTING, J. (1998) Population Trends 92, 29-412. MELLANBY, R. (2005) Veterinary Record 157, 415-417
3. MELTZER, H. et al (2008) British Journal of Psychiatry 193, 73-76
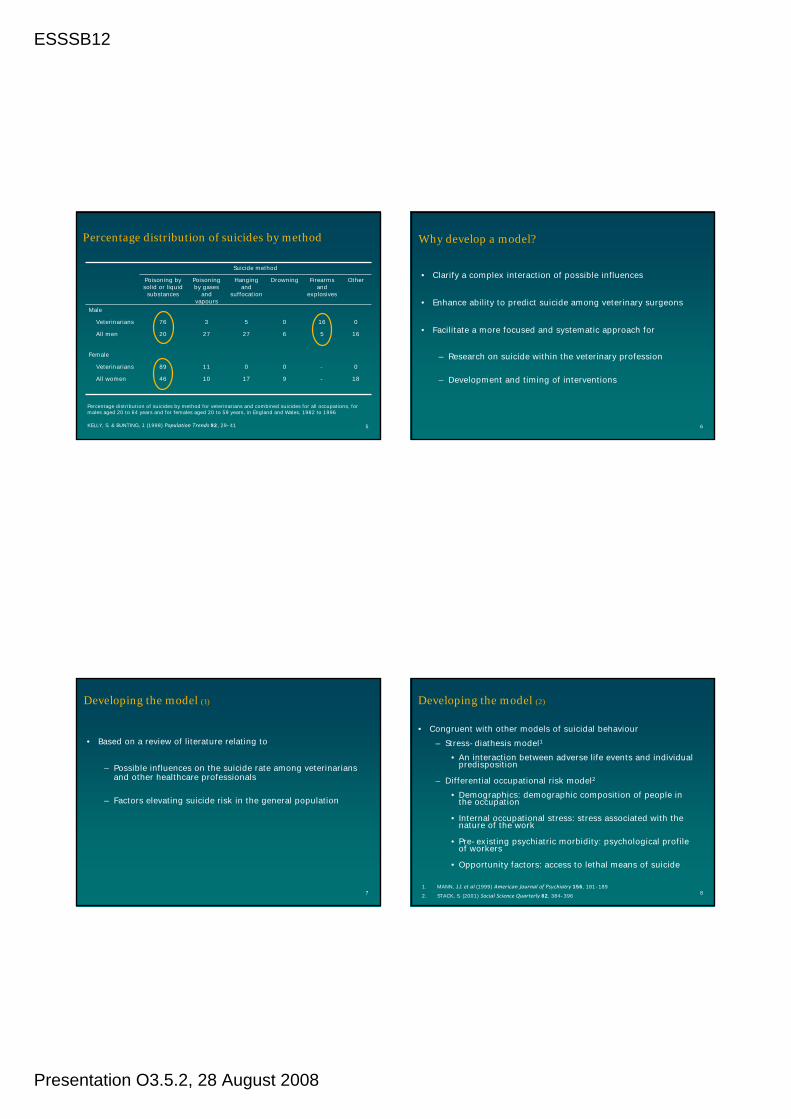
ESSSB12
Presentation O3.5.2, 28 August 2008
5
0
18
-
-
0
9
0
17
11
10
89
46
Female
Veterinarians
All women
0
16
16
5
0
6
5
27
3
27
76
20
Male
Veterinarians
All men
OtherFirearms and
explosives
DrowningHanging and
suffocation
Poisoning by gases
and vapours
Poisoning by solid or liquid
substances
Suicide method
Percentage distribution of suicides by method
KELLY, S. & BUNTING, J. (1998) Population Trends 92, 29-41
Percentage distribution of suicides by method for veterinarians and combined suicides for all occupations, for males aged 20 to 64 years and for females aged 20 to 59 years, in England and Wales, 1982 to 1996
6
Why develop a model?
• Clarify a complex interaction of possible influences
• Enhance ability to predict suicide among veterinary surgeons
• Facilitate a more focused and systematic approach for
– Research on suicide within the veterinary profession
– Development and timing of interventions
7
• Based on a review of literature relating to
– Possible influences on the suicide rate among veterinarians and other healthcare professionals
– Factors elevating suicide risk in the general population
Developing the model (1)
8
Developing the model (2)
• Congruent with other models of suicidal behaviour– Stress-diathesis model1
• An interaction between adverse life events and individual predisposition
– Differential occupational risk model2
• Demographics: demographic composition of people in the occupation
• Internal occupational stress: stress associated with the nature of the work
• Pre-existing psychiatric morbidity: psychological profile of workers
• Opportunity factors: access to lethal means of suicide
1. MANN, J.J. et al (1999) American Journal of Psychiatry 156, 181-189
2. STACK, S. (2001) Social Science Quarterly 82, 384-396
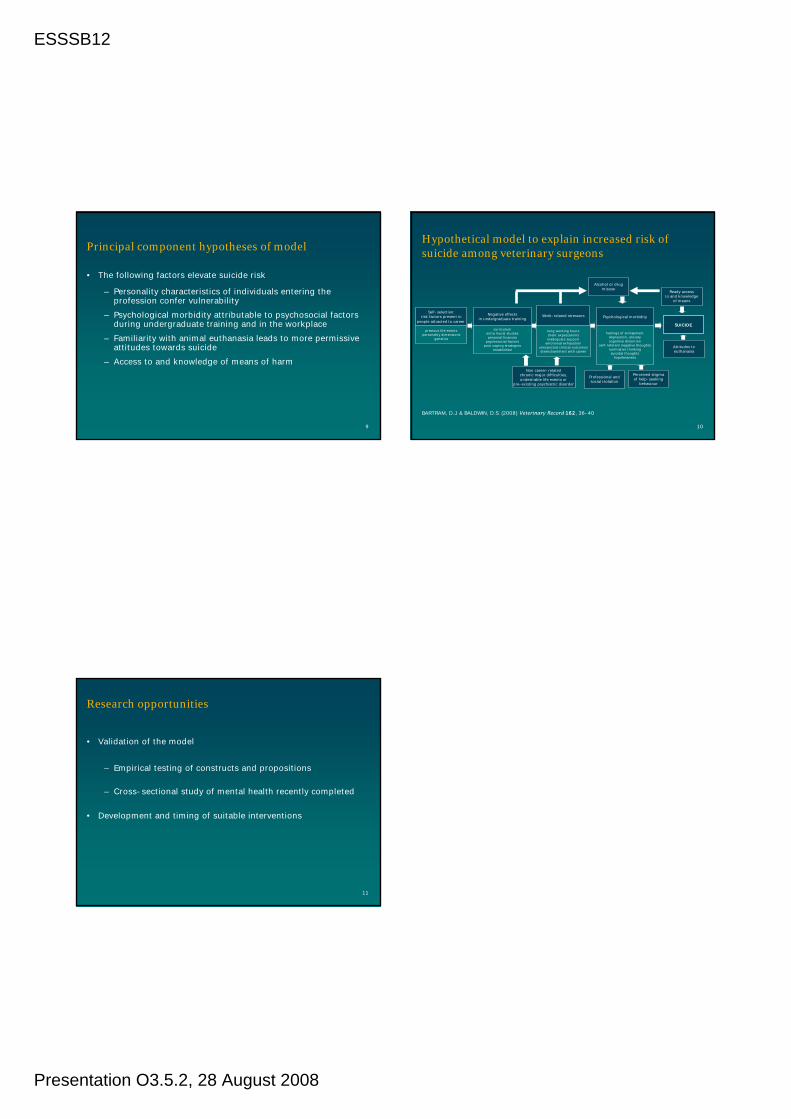
ESSSB12
Presentation O3.5.2, 28 August 2008
9
Principal component hypotheses of model
• The following factors elevate suicide risk
– Personality characteristics of individuals entering the profession confer vulnerability
– Psychological morbidity attributable to psychosocial factors during undergraduate training and in the workplace
– Familiarity with animal euthanasia leads to more permissive attitudes towards suicide
– Access to and knowledge of means of harm
10
Self-selection:risk factors present in
people attracted to career
previous life eventspersonality dimensions
genetics
Negative effectsin undergraduate training
curriculumextra mural studiespersonal finances
psychosocial factorspoor coping strategies
established
Work-related stressors
long working hoursclient expectationsinadequate support
emotional exhaustionunexpected clinical outcomesdisenchantment with career
Psychological morbidity
feelings of entrapmentdepression, anxietycognitive distortion
self-referent negative thoughtsruminative thinkingsuicidal thoughts
hopelessness
SUICIDE
Ready accessto and knowledge
of means
Attitudes toeuthanasia
Alcohol or drugmisuse
Professional andsocial isolation
Perceived stigmaof help-seeking
behaviour
Non career-relatedchronic major difficulties,undesirable life events or
pre-existing psychiatric disorder
Hypothetical model to explain increased risk of suicide among veterinary surgeons
BARTRAM, D.J. & BALDWIN, D.S. (2008) Veterinary Record 162, 36-40
11
• Validation of the model
– Empirical testing of constructs and propositions
– Cross-sectional study of mental health recently completed
• Development and timing of suitable interventions
Research opportunities