a critical evaluation of job satisfaction levels during the
TRANSCRIPT
A CRITICAL EVALUATION OF JOB SATISFACTION LEVELS DURING THE TRANSITIONAL PERIOD OF A MERGER: THE CASE OF WALTER SISULU
UNIVERSITY
By
IRENE NTOMBENTSHA MBUNDU
Submitted in accordance with the requirements for the degree of
MAGISTER TECHNOLOGIAE
in the subject
BUSINESS ADMINISTRATION
at the
UNIVERSITY OF SOUTH AFRICA
SUPERVISOR: Dr S J LE ROUX
AUGUST 2011
DECLERATION
I, Irene Ntombentsha Mbundu hereby declare that this dissertation it the outcome of my own independent research and that all sources used in the process have been recognised by means of full reference.
................................................... …………………………. Mbundu Irene Ntombentsha DATE
i

DEDICATION
I dedicate this work to my late brother, Mr Zamile Mbundu. When my parents could not
afford to take me to high school, he rescued me from joining many domestic workers
from my village by supporting me financially to carry on with my studies. Though he
was not educated himself and worked as a mine worker (eRhawutini), he valued
education, and he gave me all the support and encouragement I needed from high school
through to tertiary.
Glory Be To God, HE who made everything possible for me to be where I am today.
ii

ACKNOWLEDGMENTS
I would like to thank my mother, Mandaba, for helping me with my children while I
was attending classes.
And my sister, Smonto, for always encouraging my learning and her confidence in my
ability to accomplish whatever I had set out to do.
I thank my immediate family, my husband, Peter, for believing in me and
understanding the value of education.
Thank you to my two kids, Avuyile and Calvin, for their assistance in coding and
capturing the research data and for understanding why mom came home at odd hours
because the research demanded so much time.
The success of this dissertation would have not been possible without the support and
co-operation of others; library staff, colleagues and friends. Special thanks to Ms
Timba Priscilla, Ms Mbebe Monalisa and Mr Maphinda Khaya for assisting me in
crafting the topic. Special thanks also to Mrs Mpunga Lalie and Mr Mlisana Mzi, for
their IT skills, and also Mr Mhlanga Oswald.
Many thanks go to my supervisor Dr J Le Roux for his constant guidance and
encouragement through this dissertation and Dr H Nienabar research coordinator.
To all employees who willingly participated in the research, I THANK YOU ALL.
iii

ABSTRACT
The restructuring of the South African higher education system ranges widely across
mergers and incorporations, the creation of new institutional forms, regional-level
programme collaboration and rationalisation. The Council on Higher Education (CHE)
calls for greater productivity and more cost-effective deployment of resources. Such
changes need to be managed effectively in order for staff and managers to adapt and
find new ways to operate effectively within the changing environment and to maintain
job satisfaction. The aim of this study was to critically evaluate job satisfaction levels
during the transitional period of merger in the case of Walter Sisulu University (WSU),
as organisational excellence can be achieved when employees experience job
satisfaction. The research method employed to gather data was that of quantitative
design. The sample consisted of academics and non-academics of WSU employees
from the former Border Technikon, Eastern Cape Technikon and University of
Transkei. The instrument used to collect data was a modified version of the 1977
Minnesota Satisfaction Questionnaire (MSQ). Of the 130 respondents 69 were
academics and 61 non-academics. Key findings of the study indicated that there are
more factors that contribute to job dissatisfaction compared to those factors that
contribute to job satisfaction dimension. The results also indicated that the majority of
respondents were dissatisfied with most of the job satisfaction factors. The paper
recommends that, during a transitional period, human capital issues should be accorded
the proper attention and should be addressed early in order to maintain high staff
morale (job satisfaction). This will create a smooth transition during which employees
will feel valued and experience job satisfaction.
Key words: Job satisfaction; job dissatisfaction; transitional period; academics; non-
academics
iv

INDEX PAGE
CHAPTER 1
1.1 BACKGROUND 1
1.1.1 Mergers 1-2
1.1.2 South African Higher Education mergers 2-4
1.1.3 Study area 4-5
1.2 PROBLEM STATEMENT 5-6
1.3 AIM OF THE STUDY 6
1.4 OBJECTIVES OF THE RESEARCH 6
1.5 VALUE OF THE RESEARCH 7
1.6 RESEARCH METHODOLOGY AND DESIGN 7
1.7 RESEARCH INTRUMENTS 8
1.7.1 Demographic questionnaire 8
1.7.2 Job satisfaction questionnaire 8-9
1.8 POPULATION AND SAMPLING 9
1.8.1 Targeted population 9
1.8.2 Sampling 9-10
1.9 DATA COLLECTION 10
1.10 DATA ANALYSIS 10
1.11 VALIDITY AND RELIABILITY 11
1.12 LIMITATIONS 11
1.13 ACRONYMS 12
1.14 ORGANISATION OF CHAPTERS 12-13
1.15 SUMMARY 13
CHAPTER 2: LITERATURE REVIEW
2.1 INTRODUCTION 14
2.2 BACKGROUNG 14-16
2.3 IMPACT OF MERGER ON STAFF MERALE 16-17
2.4 DEFINITION OF JOB SATISFACTION 18-19
v

2.5 THEORIES OF JOB SATISFACTION 19-20
2.5.1 Maslow’s theory 21
2.5.2 Alderfer’s theory 22-23
2.5.3 Frederick Hertzberge’s two factor theory 23
2.5.3.1 Hygiene factors 24
2.5.3.2 Hertzberg’s motivators 25-27
2.6 FACTORS INFLUENCING JOB SATISFACTION 28-31
2.7 CONSEQUENCES OF JOB SATIFACTION/DISSATISFACTION 31-34
2.8 ANALYSIS OF PREVIOUS RESEARCH 34-37
2.9 SUMMARY 37-38
CHAPTER 3: RESEARCH METHODOLOGY
3.1 INTRODUCTION 39
3.2 RESEARCH METHODOLOGY AND DESIGN 39-40
3.3 POPULATION AND SAMPLING PROCEDURES 40
3.3.1 Population 40-41
3.3.2 Targeted population 41
3.3.3 Sampling 42-43
3.3.4 Pilot study 43
3.3.5 Ethical aspects 43-44
3.4 RESEARCH INSTRIMENTS 44-46
3.5 DATA COLLECTION AND DATA ANALYSIS 47
3.5.1 Data collection 47-48
3.5.2 Data analysis 48-50
3.6 VALIDITY AND RELIABILITY 50
3.6.1 Methods to ensure reliability 50-51
3.6.2 Validity 51-52
3.7 SUMMARY 52
CHAPTER 4: ANALYSIS OF DATA COLLECTED
4.1 INTRODUCTION 53
4.2 PRESENTATION OF DEMOGRAPHIC DATA COLLECTED 53-61
vi

4.3 PRESENTATION OF COLLECTED DATA ANALYSIS 61-74
4.4 SUMMARY 74-75
CHAPTER 5: FINDINGS AND RECOMMENDATIONS
5.1 INTRODUCTION 76
5.2 DISCUSSION AND RECOMMENDATIONS 76
5.2.1 Company policies/practices 76-77
5.2.2 Remuneration and benefits 77-78
5.2.3 Working environment/conditions 78
5.2.4 Independent work 78-79
5.2.5 Recognition for good work done 79-80
5.2.6 Work itself 80
5.2.7 Supervision – technical and human relations 81
5.2.8 Relationship with co-workers 81
5.2.9 Achievements 82
5.2.10 Institutional culture 82-83
5.2.11 Communication 83
5.2.12 Job security 83
5.2.13 Social services 84
5.3 FINDINGS OF THE STUDY 84
5.3.1 Factors affecting fob satisfaction 84
5.3.2 Factors affecting job dissatisfaction 85-87
5.3.3 Recommendations 87-88
5.4 LIMITATION OF THE STUDY 88-89
5.5 SUMMARY 89
REFERENCES 90-96
ANNEXURES 97-101
vii
LIST OF FIGURES
Figure 2.1 Maslow’s heirachy-of-needs 22 Figure 2.2 Alderfer’s model 23 Figure 2.3 Maslow, Herzberg and Alderfer comparison. 27 Figure 4.2.1 Employment categories 54 Figure 4.2.2 Gender 55 Figure 4.2.3 Age 56 Figure 4.2.4 Years of employment 57 Figure 4.2.5 Institution before merger 58 Figure 4.2.6 Qualifications 59 Figure 4.2.7 Job Grades 60
LIST OF TABLES
Table 1 Sample size 42 Table 2 Job facets/dimensions, categories and questions asked 46 Table 3 Factors affecting job satisfaction 84 Table 4 Factors affecting job dissatisfaction 85 Table 4.3.1 The general institutional policies 62 Table 4.3.2 The ability to work independently and creativity 63 Table 4.3.3 You have the opportunity to voice your opinion 63 Table 4.3.4 You are paid fairly for the amount of work you do 64 Table 4.3.5 Institutional policies are constantly applied to all employees64 Table 4.3.6 Institutional benefits are adequate 65 Table 4.3.7 Institutional changes affected your career 66 Table 4.3.8 The institution utilises individual talents by the institution 67 Table 4.3.9 Prompt feedback and communication received 67 Table 4.3.10 Clear, achievable job goals and standards are set 68 Table 4.3.11 Good work done is recognised 69 Table 4.3.12 Relationship with immediate supervisor 69 Table 4.3.13 There are institutional awards for outstanding achievement 70 Table 4.3.14 Participative decision making exists 70 Table 4.3.15 Relation with co-workers from legacy institutions 71 Table 4.3.16 Institutional culture is supportive 72 Table 4.3.17 Technological changes affect your employability 72 Table 4.3.18 There is a clear job description of what is expected of you 73 Tabel 4.3.19 General social services are offered by the institution 73 Table 4.3.20 Physical conditions in your work environment 74
viii

CHAPTER 1
1.1 BACKGROUND
The restructuring of the South African higher education system ranges widely across
mergers, incorporations, the creation of new institutional forms, and regional-level
programme collaboration and rationalisation. The Council on Higher Education
(CHE) calls for greater productivity and more cost-effective deployment of
resources. These changes need to be managed effectively in order for staff and
managers to adapt and find new ways to operate effectively within the changing
environment and to maintain job satisfaction (CHE, 2000).
Research suggests that change, whether planned or unplanned, tends to lead to
discomfort and feelings of insecurity (Robbins, 2001: 558). Change could have a
significant impact on employee morale, be it positive or negative. It is therefore
imperative that during the transitional period employees are valued and that they
experience job satisfaction throughout the process.
Research on mergers in the higher education sector suggests that, as with any other
form of change, the university employees became insecure about their jobs during
the universities’ transitional period of merging. This was due to the complex
interplay of academic and non-academic characteristics that impacted negatively on
the institutions throughput and research.
1.1.1 Mergers
A merger is a combination of two or more separate entities (such as companies) to
form a new entity. Whether in the public sector or the private sector, mergers are
globally driven and shaped by social, political, economic and technological forces.
Literature on mergers discusses the fact that mergers recently became a common
response strategy in higher education worldwide to address these forces.
1
The literature on higher education mergers shows that the ‘people issues’, which
contribute to merger success or failure in corporate mergers, are equally relevant in
higher education mergers (Reddy, 2007: 487).
However, the governments of countries such as Australia, Britain, Netherlands,
Norway, Sweden and South Africa have either mandated or encouraged mergers by
providing policy incentives so as to rationalise their higher education systems.
In Australia, many of their current public institutions are the result of a long history
of mergers, also in Japan as the population and enrolments dwindled, universities
started to consider merging as the best solution. Research suggests that 35 of Japan’s
99 national universities are planning mergers and also Taiwan is considering
consolidating its higher education institutions so as to improve their quality and
prestige (Wan & Peterson, 2007).
The literature on mergers suggests that a merger denotes radical institutional changes
and the literature confirms that the realisation of merger benefits is mixed. A merger
is by all means a complex process and during this transitional period not only are
governing systems of the institutions affected, but also the ‘souls’, that is the human
component of the partners involved (Wan & Peterson, 2007). Globally, mergers are
characterised by heightened emotions, fears of losing one’s job, having to move
sites, changes to conditions of service that might be unfavourable as well as losing
some benefits due to financial constraints of the new institution not being able to
afford these benefits in the long term.
1.1.2 South African higher education mergers
The higher education system of South Africa before 1994 was characterised by
inequalities in student access and success as well as disciplines and institutions with
regard to research outputs, staffing, governance and funding (NCHE 1996).
2

Later in April 2001, the Minister of Education investigated how the South African
higher education system could be restructured to establish a new instructional
landscape. From 2002 to 2005, the South African higher education landscape
underwent an extensive merger and incorporation process to bring about an equitable
dispensation to meet the requirements of a fast-developing new nation.
The 36 universities and ‘technikons’ were merged in various ways to produce 23
universities in three categories, namely traditional academic universities,
universities of technology and comprehensive universities (which offer both
academic and technological qualifications). South Africa’s higher education
transition is occurring in a context of globalisation and a global economy in which
economic growth is increasingly dependent on knowledge and information.
The literature review on South African higher education mergers concurs with that of
international higher education mergers, whereby it is stated that the realisation of
merger benefits is mixed. This is supported by authors like Stumpf (2009) who
states that in some cases the effect of geographical distance on establishing and
sustaining cohesive and integrated new institutions seem to have been grossly
underestimated. He suggests that the mergers between the University of the North
and Medunsa to form a new University of Limpopo, and the merger between the
former Border Technikon and the University of Transkei in Umtata put financial
strain on the new institutions because of the geographical location. Travelling
between campuses to attend meetings is unavoidable. Debetle (2009) also wrote an
article titled ‘Merger headaches’ where he reported on complaints from merged
institutions like the Tshwane University of Technology where the Nehawu
chairperson was complaining that when the merger took effect some of the staff
members posts’ were downgraded to achieve equality of status and most vacant posts
were frozen, so no new appointments were made while the quality and standards of
education were compromised. Some mergers did, however, make sense such as
Nelson Mandela Metropolitan University, Durban University of Technology and the
establishment of the University of KwaZulu-Natal (Debetle, 2009).
3

It is reported that some mergers failed to achieve post-merger financial growth
because, amongst other things, the people’ issues were not handled strategically.
According to Hornby (2005) a merger is a process of transition and a transitional
period refers to the period of changing from one state to another. Research suggests
that the human factor should be monitored during transformation as employee
dissatisfaction is reportedly responsible for all merger failures. Thus this study
critically evaluates job satisfaction levels during the transitional period of the merger
in the case of WSU.
1.1.3 Study area
WSU is a comprehensive tertiary institution conceived out of a hybrid merger of the
former University of Transkei and two former Technikons in the Eastern Cape,
namely Border Technikon and Eastern Technikon. WSU was established on 1 July
2005 in terms of the Higher Education Act 101 of 1997, as amended. WSU consists
of four campuses situated in four different towns of the Eastern Cape Province with
400 km between them, namely at Mthatha former UNITRA known as Nelson
Mandela Drive and Zamukulingisa site; former ECT now called Ibika Campus at
Butterworth; former Border Technikon named as Buffalo City Campus in East
London and the Whittle Sea Campus in Queenstown. The merger that led to the
formation of WSU is unique since all three merged institutions are from Historically
Black Disadvantaged Institutions (HDIs) and are in the poorest part of the Eastern
Cape Province. WSU consists of four faculties, a student population of
approximately 24,000 with a staff complement of 1,179 both academics and non-
academics. According to the Programme and Qualification Mix (PQM) approved by
the Department of Education (DoE), the targets for the qualifications offered are that
73% for the students should be registered for undergraduate certificates and
diplomas, 24% for first degrees, and 3% for postgraduate degrees. The institution
presently conforms to these targets as it is a developmental university and is growing
in its size.
4

Technikons have traditionally defined and positioned themselves as Higher
Education Institutions (HEI) of science and technology with more reservation of
acceptance by the universities as their counterparts. This was perpetuated by
discrimination of Technikons when distributing funding for academic salaries and
research by the Education System. Cooper (1995) argues that Technikons under
apartheid regime have been operated as ‘minors’ to the much better resourced
universities. Also, Technikon employees are significantly under qualified in
comparison with university staff due to the fact that Technikon education has been
focused on practical education as opposed to theory. During the transitional period
of a merger for WSU it became clear that the university population feel that they are
superior to the other group which is the Technikon’s group. This created division
between the three institutions.
This division has also contributed to the threat to self-esteem and self-efficacy by
making employees less likely to feel their status/worth/ability which leads to job
dissatisfaction.
1.2 PROBLEM STATEMENT AND RESEARCH QUESTION
A fairly large proportion of university employees became insecure about their jobs
during the universities’ transitional period of merging. This was due to the complex
interplay of academic and non-academic characteristics that impacted negatively on
the research output of the institutions concerned. As with any other form of change
that they might have had to face, university employees faced an uncertain future
during the transitional period, as new policies were implemented. This resulted in
some employees even resisting change. The transitional period of a university tends
to portray a negative image among the staff members concerned, as they tend to fear
and to feel insecure about the unknown, resulting in the experiencing of instability
within the university’s working environment.
5
After the apartheid era, most South African tertiary institutions underwent change.
As such, a study to evaluate job satisfaction levels during the transitional period of a
merger at WSU was visualised. The results of the study could help to improve staff
motivation and morale at other universities also undergoing transition. High levels of
staff morale, particularly among academic staff members, might contribute to a high
pass rate and to a concomitantly high research output.
1.3 AIM/PURPOSE OF THE STUDY
The aim of this study is to critically evaluate job satisfaction levels during the
transitional period of a merger, in this case WSU, as organisational excellence can be
attained when employees experience job satisfaction.
1.4 OBJECTIVES OF THE RESEARCH The primary objective of the study is to critically evaluate the job satisfaction levels
experienced during the transitional period of the merger at WSU, as excellence can
only be achieved when employees experience job satisfaction. To achieve the
primary objective, the following secondary objectives were set:
• to determine the factors that influence the levels of job satisfaction
experienced by WSU employees during the transitional period of the
merger;
• to determine the factors that influence the levels of job dissatisfaction
experienced by WSU employees during the transitional period of
merger; and
• to make recommendations to the merger facilitators to ensure that the
transition is smooth and that the employees concerned feel valued and
experience job satisfaction despite the change
6

1.5 VALUE OF THE RESEARCH
The value of the research is to critically evaluate the intrinsic, extrinsic and job
satisfaction levels of WSU employees during the transition period, as human
resource management is the central activity that needs the most attention and needs
to be addressed as early as possible to maintain high staff morale during the
transitional period. A possible outcome of this research will be suggested to merger
facilitators.
1.6 RESEARCH METHODOLOGY AND DESIGN
According to Welman and Kruger (2004:46), the research design describes the plan
in which information is obtained from the research participants. In the plan it must
be clearly illustrated how participants will be selected in order to get valid and
reliable research results. Gronhaug and Ghauri (2005) note that quantitative designs
deal with a large number of respondents and use sufficiently large numbers to allow
for general stable comparisons and for conclusions to be drawn about populations.
The research method employed to gather data for this study is that of quantitative
design using a structured questionnaire. Proportional stratified random sampling
was used to select the number of employees in each category of employees, namely
academics and non-academics alike. The questionnaire has two sections, namely
Section A for Demographic Information and Section B statements to evaluate a
participant’s job satisfaction. The Demographical Information (Section A) enables
the researcher to analyse participants' responses according to groups of individuals
such as academics and non-academics. Section B contains statements based on the
Minnesota Satisfaction Questionnaire to measure an individual’s satisfaction levels
on aspects of the work environment. This enables the researcher to analyse and come
up with findings and recommendations of the study.
7

1.7 RESEARCH INSTRUMENTS
Minnesota Satisfaction Questionnaire (MSQ) was developed in 1967 by Weiss,
Dawis, England and Lofquist to measure specific aspects of an employee’s
satisfaction with his or her job. The MSQ has two forms; two 100-item long forms
(1977 version and 1967 version) and a 20-item short-form. The MSQ has become a
widely used instrument to evaluate job satisfaction because of its accuracy and its
ability to identify specific areas that impact performance and human behaviour in the
workplace. Minnesota Satisfaction Questionnaire is easy to use, easy to understand,
valid and reliable and also applicable in any organisation.
There are many methods for measuring job satisfaction. The most common method
for collecting data about job satisfaction is the Likert scale (Wikipedia, Free
Encyclopedia). For this study the researcher uses a standardised measuring
instrument by means of MSQ questionnaires. The MSQ makes it feasible to obtain
an individualised picture of job satisfaction, as well as providing an accurate
measurement of job satisfaction for groups of individuals on numerous workplace
factors. The use of a questionnaire is preferable as it is inexpensive and efficient.
Also, it is easily quantified and easy to analyse statistically.
1.7.1 Demographical questionnaire
Section A focuses on the personal information of each respondent such as age,
gender, levels of education, salary grades and length of service with any of the
legacy institutions and of the new institution.
1.7.1 Job satisfaction questionnaire
The Shortened Version of the MSQ (Weiss, Davis, England & Lofquist, 1967) is
used to measure the dimensions of job satisfaction such as intrinsic and extrinsic
variables.
8

The MSQ is one of the most widely researched and utilised measure of job
satisfaction. MSQ Shortened Version consists of three scales: Intrinsic Satisfaction,
Extrinsic Satisfaction and General Satisfaction with the current job. Research also
suggests that the MSQ measures an individual’s satisfaction with 20 aspects of the
work environment. The questionnaire consists of a 4-point scale, where one
1 indicates Very Dissatisfied, 2 indicates Dissatisfied, 3 indicates Satisfied and a
value of 4 indicates Very Satisfied.
1.8 POPULATION AND SAMPLING PROCEDURE
According to Seal, Gobo, Gubrium and Silverman (2004: 435), it is essential to
define sampling units clearly before choosing cases. This is to avoid messy and
empirically shallow research. The population chosen for this study is WSU
academic and non-academic employees from the three legacy institutions and the
Directorate of WSU.
1.8.1 Targeted population
The targeted population are employees from Grades 3 to17, as the university uses the
Peromnes Job Grading System for grouping employees. Grades 3 and 4 personnel
are executive directors and deputy vice-chancellors, Grades 5 and 6 are professors,
directors, deputy directors and managers of WSU, Grades 7 and 8 are senior
lecturers/lecturers and senior managers, Grades 9 to 11 are senior officers/officers
and Grades 12 to15 assistant officers and clerks and Grades 16 and 17 are
maintenance personnel. At the time of the study there are no associate professors
within the university as the academic structure/architecture is not yet finalised.
1.8.1 Sampling
After having specified a population, the researcher decides if he or she will collect
information on all its individuals or on a sub-set only. So the sample is just a sub-set
of cases (Seale, Gobo, Gubrium & Silverman, 2004: 437).
9

A sample size of 200 will be used, since the population size is 1 179. The selection
of the sample size is based on Leedy and Ormrod’s (2010: 214) guidelines. A
systematic sampling method will be used for issuing the questionnaires to
respondents, in terms of which every fourth respondent is given a questionnaire, until
the required sample size is reached. Proportional stratified random sampling is used
to find the number of employees in each category of employees.
1.9 DATA COLLECTION
• MSQ questionnaire hard copies (printed) are distributed and collected.
• Two main job categories are represented in the population, namely
academics and non-academics.
• All participants are permanent WSU employees migrated from the three
legacy institutions.
1.10 DATA ANALYSIS
The data are obtained from WSU employees who are affected by the merger, more
specifically those that are still employed by the university. Those who left the
university do not form part of the study.
The collected data are presented as follows:
For the Demographic Information (Section A) the researcher uses bar
charts
For MSQ (Section B) questions the researcher uses the Statistical
Package for Social Sciences (SPSS, version 1.8.
A critical analysis to evaluate job satisfaction levels of WSU employees are made
based on the MSQ questionnaires. In scoring the MSQ for general job satisfaction,
percentile scores are used.
10

1.11 VALIDITY AND RELIABILITY
People’s judgments are imperfect, so it is important to determine how reliable and
valid each information analysis is (Spector, 2005: 69). For this study the following
methods are used to check the reliability and validity of the study:
• The distributed questionnaires are collected directly from participants since
the researcher asks them to participate voluntary and freely in the research
project.
• The completion of the questionnaires is voluntary and questionnaires are
completed anonymously.
1.12 LIMITATIONS
• During the study period the environment was unstable due to a deadlock on
the harmonisation of benefits of the legacy institutions and thus respondents
might have been too negative in their responses as there is always
uncertainty and indecisiveness during mergers.
• During the study period on this research some WSU employees from legacy
institutions had already left the WSU and those that are still available may
be scared to participate.
• Time constraints could also have a negative impact on this study when
participants take time to respond as this was conducted during the
examination period at the university.
11
1.13 ACRONYMS
CHE – Council of Higher Education
JDI - Job Descriptive Index
JGI - Job General Index
JSS - Job Satisfaction Survey
MSQ - Minnesota Satisfaction Questionnaire
NCHE - National Commission of Higher Education
SPSS - Statistical Package for Social Sciences
WSU - Walter Sisulu University
1.14 ORGANISATION OF CHAPTERS
Chapter 1 - in this chapter the researcher focuses on the background to the research,
the problem statement, aims and objectives of the research, a brief outline on
research design and methodology, limitations and chapter outline.
Chapter 2 - is where the researcher contextualises the research topic. In this chapter
a literature review is discussed as well as the definitions of job
satisfaction/dissatisfaction by different authors. This chapter also focuses on job
satisfaction/dissatisfaction theories as well as research by other researchers in this
study field. Also the literature review focuses on factors influencing job
satisfaction/dissatisfaction and their impact on employees.
Chapter 3 - in this chapter the researcher identifies and discusses the design and
methodology in detail which include the research instruments, questionnaire,
population and sampling, administrative procedures and statistical data analysis.
Chapter 4 - this chapter discusses the findings and data analysis responding to who
said what, meaning, significance, relation to the study and literature.
12
Chapter 5 - this chapter presents the conclusions and recommendations. The
researcher gives a summary of the findings followed by the conclusions, and then
possible implications and suggestions for further research.
1.5 SUMMARY
This chapter provided the introduction to the study, the background of the study,
problem statement, primary and secondary objectives of the research, research
methodology and the layout of chapters. Chapter 2 focuses on the literature review
and an analysis of previous research conducted on job satisfaction and the concept of
the impact of mergers on people is discussed to put job satisfaction in context during
transitional periods.
13

CHAPTER 2
LITERATURE REVIEW
2.1 INTRODUCTION
The previous chapter provided the introduction to the study, the background of the
study, problem statement, primary and secondary objectives of the research, the
research methodology and the layout of chapters.
This chapter the researcher intends to provide an overview of the impact of a merger
and transformation on people, the relevant literature on job satisfaction factors will
be reviewed and an analysis of previous research conducted on mergers in higher
education institutions in South Africa will be given. This will assist the researcher to
place the study into perspective and to gain a better understanding of the theoretical
job satisfaction and its definition and factors that lead to job
satisfaction/dissatisfaction during the transitional period of a merger, in this case
WSU.
2.2 BACKGROUND
As a point of departure, the higher education system of South Africa before 1994
was characterised by inequalities regarding student access and success, as well as
disciplines and institutions with regard to research outputs, staffing, governance and
funding (NCHE 1996). The representation of blacks and South African women in the
academic workforce was marked by more sever inequalities, being concentrated in
the lower ranks of academic staff and other professional staff categories. Also,
during this period universities were established and confined to different
‘homelands’ and were to pursue self-determination in those territories as part of the
divide and rule strategy of the apartheid policy of separate development.
14
After 1994, the new government came in with an agenda of restructuring and
transformation. The South African Constitution of 1996 and the 1997 Act and White
Paper pronounced the wide-ranging imperatives and goals to be achieved through
higher education. The South African higher education also formulated strategies and
instruments for effecting change in areas such as, access and success, learning and
teaching, governance, financing and funding, and the shape and size of higher
education. Without any doubt, universities were key instruments in this agenda of the
new government to demonstrate transformation.
However, the South African higher education transition is occurring in a context of
restructuring the colonialism and apartheid social, political and economic
discrimination and inequalities of class, race, gender and institutional accessibility.
This transition takes place in the presence of the external factor of “globalisation”
which is usefully defined as the intensification of worldwide social relations which
link distant localities in such a way that local happenings are shaped by the events
occurring many miles away and vice versa (Held, 1991:9). In a global economy,
economic growth is increasingly dependent on knowledge and information.
Mergers have become an established part of life, particularly in the environment of
institutions of higher education (Brousseau, 1989). The South African higher
education landscape is not unique in this regard. Higher education institutions
worldwide also embarked on mergers. WSU is the product of university mergers that
took place in South Africa after 1994.
The transitional period of a university tends to portray a negative image among the
staff members concerned, as they tend to fear and to feel insecure about the
unknown, resulting in the fact that staff experiences a sense of instability within the
university’s working environment. The consideration of people during the
transitional period is an ethical issue that promotes a dedicated workforce, a common
culture, and participative structures; all of which help to ensure acceptable levels of
15

productivity and profitability (Hoffman, Frederick & Petry, 1989), and this team
workforce can only be achieved when employees experience job satisfaction.
2.2 IMPACT OF MERGER ON STAFF MORALE/JOB SATISFACTION
Van der Westhuizen (2004: 154) describes the emotional consequences experienced
by staff in the process of a merger as a ‘crisis in human life’ that is similar to death.
In addition, staff endure a great deal of stress and anxiety during the transformation
process. In view of the impact of transformation on employees, it is, therefore,
essential that ‘people issues’ are adequately addressed as early as possible to
maintain high staff morale. Furthermore, Wyngaard & Kapp (2004: 189) argues that
one of the problems encountered with mergers is ‘people issues’, namely the human
factor. However, Wyngaard and Kapp (2004) conclude that support structures
should be established and that staff preparation programmes should be instituted in
order to reduce stress on human capital during a transitional period.
According to Arnold and Feldman (1996: 86), many different factors tend to cause
people to feel positive or negative about their jobs. Accordingly, job variables
require consideration in order to maintain job satisfaction, which is considered as a
strong predictor of whether an individual will decide to stay on at, or to leave an
organisation. Such choices are critical during a transitional period. However,
existing literature on mergers suggests that the following three key factors should be
considered as crucial to work stability during transitional periods: job security;
procedural fairness; and effective communication.
Research has also indicated that job security is the most important factor for
employees during a transitional period, followed by pay and benefits, work
autonomy, and performance feedback (Schweiger, Ivancevich & Power, 1987), so
that organisations should prioritise the human factor during a transitional period.
16

During transitional periods, especially when harmonising salaries, benefits and
conditions of services, the loss of one benefit from the legacy institution may
become a pushing factor for one group, with another group benefiting from the
change, so that said factor will serve as a pulling factor for them. However, it must
be kept in mind that harmonisation is not equalisation, and that the merged
institution must develop its own policies, salary scales, benefits, and conditions of
service. Staff members who are affected will consider the latter, comparing them
with those from the legacy institution, and then decide whether they wish to stay
with the new institution or to leave it.
Wyngaard and Kapp (2004:200) in their study conclude that the negative impact of
mergers on people could have been avoided or at least reduced if the process had
been planned and managed in a professional way. They argue that people have lost
their jobs, individuals are suffering from depression and a significant number of
people directly influenced by mergers have lost their self-esteem and confidence, and
have become cynical. They recommend that when future mergers are planned, the
lessons learnt from experience will be taken to heart to avoid the devastating effect
mergers may have on their most valuable asset, their people.
In summary, the literature on mergers reveals that mergers had and have a negative
impact on staff morale in many ways. It is therefore prudent that employees are
valued during the transitional period, and that they experience job satisfaction
throughout the merger process. As mentioned in chapter 1, WSU was established on
the 1 July 2005 but at the time of this study (2009) to maintain employees job
satisfaction/morale high during transitional periods, structure had been restructured
to have one governing council, a vice-chancellor, deputy vice-chancellor, executive
deans/directors and directors while everything else remained as before. This has
been a change process and it has affected human behaviour and has impacted on
employee job satisfaction aspects.
The next section focuses on job satisfaction definition, theories, factors and
consequences of job satisfaction and dissatisfaction in relation to transitional periods.
17
2.4 DEFINITION OF JOB SATISFACTION
Researchers argue that job satisfaction is “as the degree to which individuals feel
positively and negative about their jobs” (Steyn & Van Wyk 1999: 37-40). Job
satisfaction is considered to be the strong predictor for an individual to decide to stay
or leave the organisation. Job satisfaction may also impact on employee’s behaviour
like absenteeism, frequent labour unrest and high turnover; hence during transition
periods the human element should be the priority.
Blyton and Jenkins (2007:106) argue that job satisfaction remains one of the most
researched topics in the study of work. They argue that “despite all the research
undertaken, not all the important questions about job satisfaction have been fully
answered and these include, to what extent the factors that give rise to satisfaction by
their presence also create dissatisfaction by their absence”.
According to Diaz-Serrano and Cabral Vieira (2005) job satisfaction is the predictor
of overall individual wellbeing and also a good predictor of intention or decisions of
employees to leave a job.
Robbins, Odendaal and Roodt (2003:72) refer to job satisfaction as an individual’s
general attitude to his or her job. A person with a high level of job satisfaction holds
positive attitudes towards his or her job, and one who is dissatisfied with his or her
job holds negative attitudes towards the job.
Schultz, Bagrain, Potgieter, Viedge and Werner (2003: 219), define job satisfaction
as a personal appraisal of the job and the psychological experience at work. The
happier people are within their jobs, the more satisfied they are said to be.
According to Locke, (1976:1300) job satisfaction refers to “a pleasant or positive
emotional state resulting from the appraisal of one’s job or experiences.”
18

Spector (2005:217) defines job satisfaction as an attitudinal variable that reflects
how people feel about their jobs overall and in certain aspects. In simple terms, job
satisfaction is the extent to which people like their jobs; job dissatisfaction is the
extent to which they dislike them.
According to Rothman and Cooper, (2008:59) job satisfaction is a pleasurable or
positive emotional state resulting from the appraisal of one’s job or job experience.
They argue that the main factors influencing job satisfaction are organisational
factors (pay, promotions, the work itself and working conditions), group factors (the
role of the supervisor and of co-workers) and personal factors (needs and aspiration
and how these are met, and how an individual views the instrumental benefits of the
job).
For the purpose of this study the researcher concluded that job satisfaction is how
people feel about their jobs and the various aspects of their jobs.
2.5 THEORIES OF JOB SATISFACTION
Many theorists have tried to formulate an explanation for why people feel the way
they do with regard to their jobs. There are various job satisfaction components that
are considered to be vital to job satisfaction, namely pay, promotion, benefits,
supervisor, co-worker, work conditions, communication, safety, productivity and the
work itself. Rothmann and Cooper (2008:57) argued during the Conference on
Promoting Markets in Creativity: Copyright in the Internet Age (2003) in
Washington, DC, that although money is a symbolic way of showing employees that
they are valued it might also be a dangerous motivator. She pointed out that there
are three ways in which money can have serious repercussions for the creative
process:
• Financial rewards can distract employees from the organisation’s
underlying goals.
19
• Employees may not put forward their best work if they are ‘bought out’
for limited rewards.
• Extrinsic rewards such as money can actually damage intrinsic motivation.
Most scholars recognise that job satisfaction is a global concept that comprises of
various facets, such as employee satisfaction with pay, supervisor and co-workers
(Judge, Thoresen & Bono, 2001; Rainey, 2003). Other theorists (for instance, Rose,
2001) have viewed job satisfaction as a bi-dimensional concept consisting of both an
intrinsic and extrinsic satisfaction dimension.
Intrinsic sources of satisfaction depend on the individual characteristics of the
person, such as the ability to use initiative, relations with supervisors, or the work
that the person actually performs; these are symbolic or qualitative facets of the job.
Extrinsic sources of satisfaction are situational and depend on the environment, such
as pay, promotion, or job security. Both intrinsic and extrinsic job facets should be
represented as equally as possible, in a composite measure of overall job satisfaction.
One useful stream of research has studied the causes and consequences of job
satisfaction, and its interrelationships with other important job-related variables.
Research results from Kinicki (2002) showed that job characteristics, role states,
group and organisational characteristics and leader relations are generally considered
to be antecedents of job satisfaction and motivation, whilst citizenship behaviours
and job performance are generally considered to be consequences of job satisfaction.
In the same vein of thought, Rainey (2003:276) posits that, it has been unclear
whether job satisfaction contributes to individual performance or vice versa. The
relationship between job satisfaction and performance is somewhat controversial as
mentioned above, though some studies have shown that a positive mood – including
job satisfaction – is linked to altruistic motives and prosaic behaviour, such as public
service motivation, organisational citizenship behaviour, etc. (Brewer, 2001; Organ,
1977).
20

2.5.1 Maslow’s theory
Job satisfaction may be a condition for high performance not a determination of it.
This suggests a Malowian interpretation of employees’ basic safety and security
needs (job satisfaction, job security, adequate pay, etc) that must be met before high
performance is possible. However, as Rainey (2003: 283-284) explains, research on
work-related satisfaction does not as yet produce a clear pattern.
Some researchers argue that Maslow’s hierarchy of needs theory, a motivation
theory, laid the foundation for job satisfaction theory. This theory explains that
people seek to satisfy five specific needs in life:
• Physiological needs such as hunger, thirst and sleep are the first level on
the hierarchy.
• Safety/security needs such as shelter and protection from physical danger
and economic instability, contribution toward medical, insurance and
pension schemes.
• Social needs such as a need to affiliate with others and supportive
relationships like to be accepted and to be loved.
• Self-esteem needs for recognition, achievement, independence, freedom
and a belief in oneself in the next level.
• Self-actualisation a need to realise one’s full potential, capable of being,
recognition and a belief in oneself in the next level.
• If these needs are fulfilled and being maintained, then, you can say the
employees are satisfied by their jobs.
21
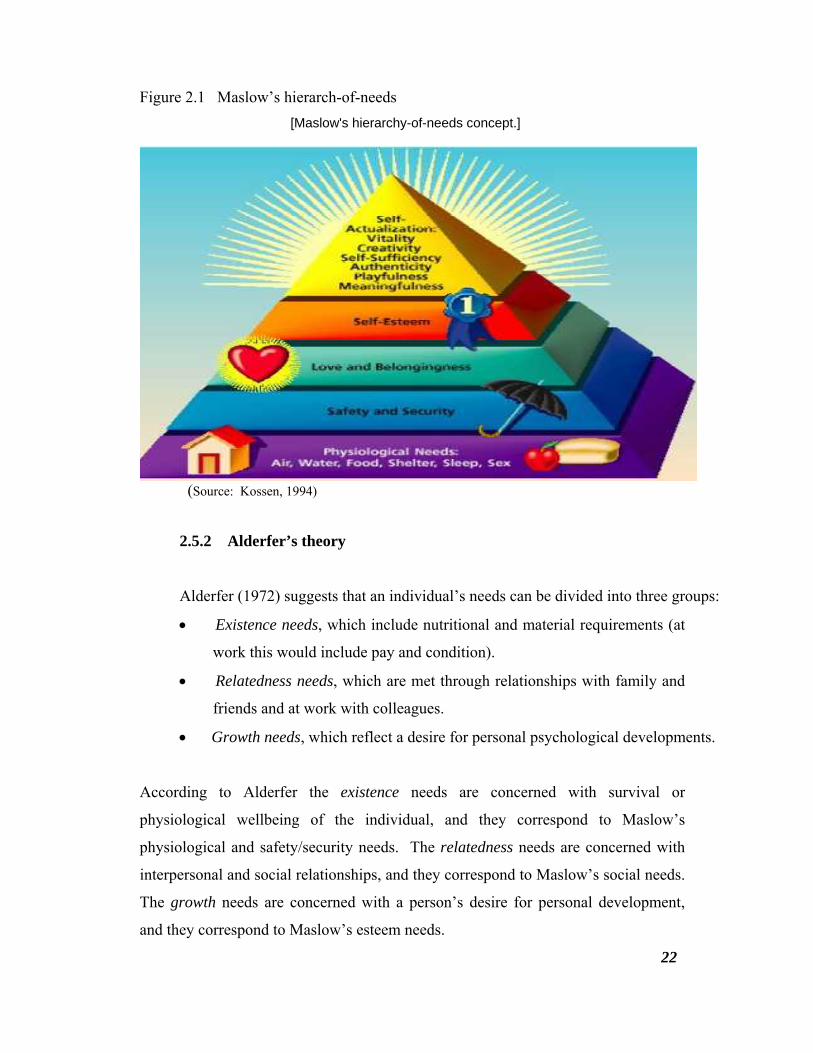
Figure 2.1 Maslow’s hierarch-of-needs [Maslow's hierarchy-of-needs concept.]
(Source: Kossen, 1994)
2.5.2 Alderfer’s theory
Alderfer (1972) suggests that an individual’s needs can be divided into three groups:
• Existence needs, which include nutritional and material requirements (at
work this would include pay and condition).
• Relatedness needs, which are met through relationships with family and
friends and at work with colleagues.
• Growth needs, which reflect a desire for personal psychological developments.
According to Alderfer the existence needs are concerned with survival or
physiological wellbeing of the individual, and they correspond to Maslow’s
physiological and safety/security needs. The relatedness needs are concerned with
interpersonal and social relationships, and they correspond to Maslow’s social needs.
The growth needs are concerned with a person’s desire for personal development,
and they correspond to Maslow’s esteem needs.
22

According to Existence needs, Relatedness needs and Growth needs (ERG) theory,
more than one need may be in operation at a given moment. This implies that a
lower level need does not have to be substantially gratified in order for a higher level
of need to come into operation (Robbins, 1996: 219).
Figure 2.2 ERG’S Model
(Source: Kossen, 1994)
2.5.3 Frederick Hertzberg’s two factor theory (aka Motivator Hygiene Theory)
Although this theory is more often presented as a motivation theory, it has become
another famous theory that explains job satisfaction. This theory states that
satisfaction and dissatisfaction are driven by different factors (motivation and
hygiene).
According to Schultz et al. (2003: 60), Hertzberg’s research showed that factors that
made employees feel good about their jobs were significantly different from the
factors that made them feel bad about their jobs. Motivators are aspects of the job
that make people want to perform and they provide people with satisfaction while
hygiene factors refer to the aspects of job that do not make people satisfied (such as
pay), but their absence would cause dissatisfaction.
23

2.5.3.1 Hygiene factors cannot, according to Hertzberg, motivate
employees but can minimise dissatisfaction if handled properly,
these include:
• Company policies – If an organisation’s policies and procedures are
not clear, sometimes unreasonably strict and if not applied to
everybody, they create frustration, especially during transitions when
companies are trying to get the “best practice” for the merged
institution.
• Supervision – The role of a supervisor is extremely difficult and
critical. It requires leadership skills and the ability to treat all
employees equally and fairly.
• Salary - Salary is not a motivator for employees, but they want to be
paid fairly. There should be clear policies related to salary increases
and bonuses and these policies should be consistent and fairly
applicable to all employees.
• Interpersonal relations – Part of the satisfaction of being employed is
the social contact it brings, therefore employees should be allowed a
reasonable time for socialisation. Workshops could be organised for
staff from all merged institutions to get to know each other.
• Working conditions – The environment in which people work has a
tremendous effect on their level of pride for themselves and for the
work they are doing. For this reason equipment and facilities such as
lecture halls, good laboratories with the latest technology, exam
venues, staff rooms, offices and network systems of the university
should always be conducive and kept up to date.
24

2.5.3.2 Hertzberg’s motivators, on the other hand, create satisfaction by
fulfilling an individual’s needs for meaning and personal growth.
They are issues such as:
• Achievement – Hertzberg’s theory states that most individuals
sincerely want to do a good job, and managers need to place them in
positions that use their talents and not set them up for failure. Set clear,
achievable goals and standards for each position and make sure
employees understand them.
• Recognition – Employees at all levels of the organisation want to be
recognised for their achievements in their jobs. This can be improved
by promoting an employee to senior position or sending a word of
congratulation when work is well done. Also to give awards for the
excellent performance, that will assist to maintain job satisfaction
• The work itself – Employees need to know that their work is
important and meaningful. Make employees accountable, she/he must
own the decisions revolving around their work.
• Responsibility – Employees will be more motivated to do their jobs
well if they have ownership of their work. Thus, university employees
tend to have autonomy to a certain degree especially academic staff
which in turn tends to boost their sense of self control and
independency and also make staff members more responsible.
• Advancement – Reward loyalty and performance with advancement
for employees who are doing their best in the form of promotion or a
new title to show your appreciation.
25

Hertzberg proposed that job satisfaction and dissatisfaction appeared to be caused by
two sets of different factors. The presence of motivators in the workplace caused
enduring states of motivation in employees but their absence did not lead to
dissatisfaction. Hygiene, on the other hand, produced an acceptable working
environment but did not increase satisfaction – their absence did, however, not cause
job dissatisfaction. According to Hertzberg, the motivators will promote job
satisfaction and encourage high and quality production once the hygiene areas are
addressed. This will spill over to customer satisfaction and that can only be attained
when employees experience job satisfaction.
Figure 2.3 on the next page shows a comparison of the motivational theories of
Maslow, Herzberg and Alderfer.
26
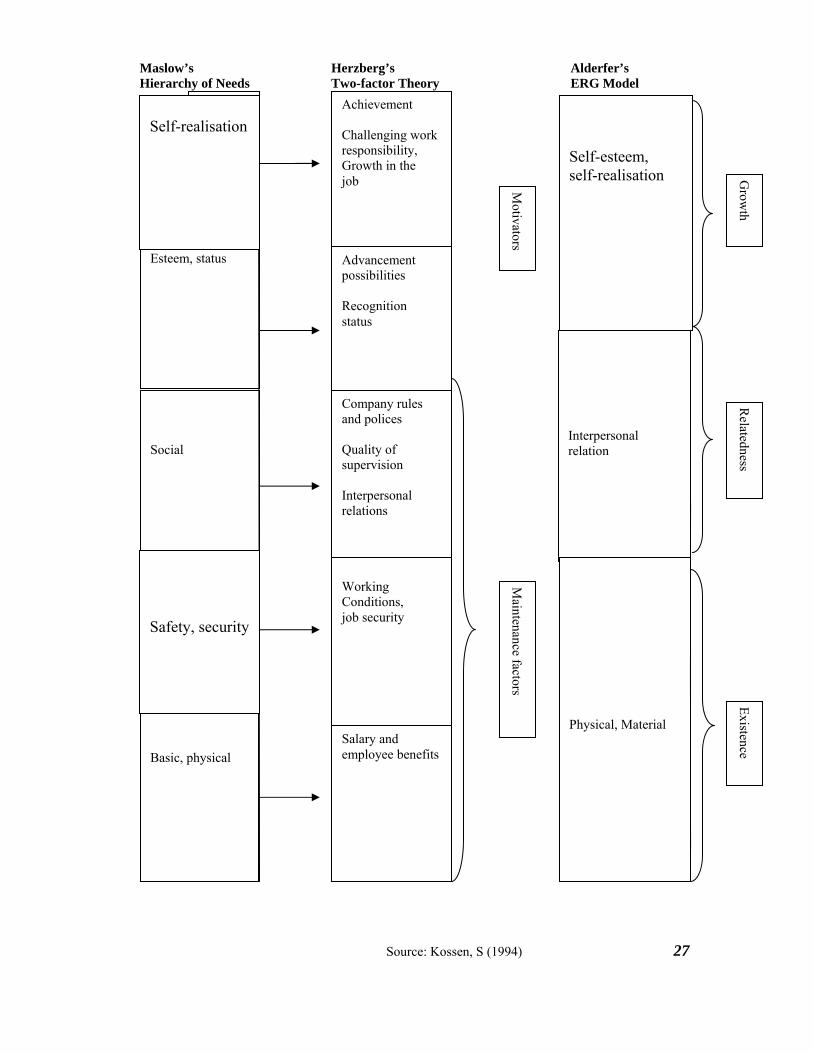
Maslow’s Herzberg’s Alderfer’s Hierarchy of Needs Two-factor Theory ERG Model
Source: Kossen, S (1994) 27
Esteem, status
Social
Basic, physical
Achievement Challenging work responsibility, Growth in the job
Advancement possibilities Recognition status
Company rules and polices Quality of supervision Interpersonal relations
Working Conditions, job security
Salary and employee benefits
Interpersonal relation
Physical, Material
Motivators
Maintenance factors
Grow
th R
elatedness Existence
Self-esteem, self-realisation
Safety, security
Self-realization
Self-realisation
2.6 FACTORS INFLUENCING JOB SATISFACTION
In another vein of thought, various aspects/variables of jobs and the terms under which
those jobs are carried out have been identified as important influences on job
satisfaction. To be exact about what makes people feel satisfied or dissatisfied about
their work the approach is to focus on job facets or different aspects of a job.
Common job satisfaction facets
Pay Job conditions
Promotion opportunities Nature of the work itself
Fringe benefits Communication
Supervision Security
Co-workers
According to Arnold and Feldman (1996:86-86), there are a variety of factors that
make people feel positive or negative about their jobs. This means that there are job
variables that need to be considered in order to maintain job satisfaction as job
satisfaction is considered to be the strong predictor for an individual to decide to stay
or leave an organisation.
Rothman and Cooper (2008:56) identified factors that lead workers to have positive or
negative perceptions of their jobs as follows:
Pay. This seems to be the major factor in job satisfaction, because the money a
person earns not only gives him or her opportunity to satisfy their basic needs,
but also to satisfy higher-level needs. After the merger of the three institutions
it has become clear that the salary scales of WSU employees in the same grade
are not the same because of the historical disparities.
28

Nel, Van Dyk, Haasbroek, Schultz, Sono and Werner (2004:552-553) argue that
staff members will compare themselves to other employees regarding what they
put in and what they get out of an organisation.
WSU had to undergo salary harmonisation as the first step in the transition in
order to alleviate much of the frustration, irritation and aggression towards
management caused by historical disparities in salaries.
Work itself, This also seems to be a major source of job satisfaction, especially
characteristics such as feedback, interesting and challenging work, and work
which provides status to the employee. An employee may be happy with
everything the organisation offers in terms of benefits, pay, bonuses and
conditions of service but may be very dissatisfied with the work itself. Nel et al
(2004: 552-553) argues that people would rather prefer a job that is interesting,
challenging and that creates opportunities for self-actualisation and recognition.
Promotion. Promotional opportunities have a stronger impact on job
satisfaction, hence management should use this as a motivating tool to ensure
that the employee attains goals at a higher level. During the transitional periods
in the formulation of the new structure, there could be positions that could be
utilised as promotion opportunities to employees and that could be motivational
and improve on job satisfaction.
Supervision. According to Rothmann and Cooper (2008: 56), supervision is a
moderately important source of job satisfaction. It seems as if there are two
dimensions of supervision that influence job satisfaction, namely worker-
centeredness and participation Rothmann and Cooper (2008: 56).
29

Supervision becomes very difficult within merged institutions. In the case of
WSU where employees have different working cultures, policies and procedure
manuals the supervisor needs to come up with strong strategies for integration
of all the different processes. This process has a challenge of people that resist
change, then in that instant she/he will be perceived as unfair, incompetent and
selfish by employees who resist the change.
That perception will therefore lead to a lower level of job satisfaction, while the
level of job satisfaction will be high if supervisors are perceived as fair,
competent and sincere.
Working conditions. If working conditions are fine there will be no job
satisfaction problems because good working conditions will lead to physical
comfort and convenience, but if they are poor they will impact poorly on
employees.
In addition to these factors there are also other aspects of work that are related to job
satisfaction, such as the degree of job security which refers to the likelihood of a job
remaining available to the current job holder, especially during a transitional period of
mergers where some positions from the legacy institutions will not be on the structure
of the newly formed institution which gives the incumbents of such positions no other
option but to leave the organisation. Furthermore, communication effectiveness and
feedback on a job well done are important. This holds even for constructive negative
feedback from which improvement and skills development programmes can follow.
Apart from the above, large surveys have identified that job satisfaction tends to be
associated with a number of individual and organisational variables (Blyton &
Jenkins, 2007:109-110). These include gender, age, education, hours of work and size
of establishment. Their surveys show that, overall, women tend to report higher levels
of job satisfaction than men.
30
Workers in their thirties, the well-educated, those working longer hours and workers
in larger establishments, on the other hand, tend to report lower average levels of job
satisfaction. More educated employees tend to report lower average levels of job
satisfaction; this may reflect a relationship between education and higher
expectations, which may generate dissatisfaction if not fulfilled.
2.7 CONSEQUENCES OF JOB SATISFACTION AND
DISSATISFACTION
Having identified the various sources of job satisfaction it is of great importance to
evaluate how these factors influence an individual’s behaviour. There is sufficient
evidence that job satisfaction or dissatisfaction can have positive or negative
consequences for employees.
Robbins (2001: 77-78) indicated that in recent years, ample research studies have
been designed to assess the effects of job satisfaction on employee productivity,
absenteeism and turnover.
Productivity
Job satisfaction is good not only for employees but also for employers since it
increases productivity, and decreases staff turnover. However, research results showed
that the link between job satisfaction and performance is weak, there are very few
signs of such relationship, in some cases there is a negative relationship, in some cases
there is a positive relationship.
Hence Mckenna (2000) argues that if an organisation does not create conditions for
minimal levels of job satisfaction, the outcomes may be deterioration in productivity,
increased employee turnover and absenteeism, and a decrease in morale. During
transitional periods, employees turn their focus from productive work,
31

to concern about job security, career path and this affects the work productivity and
quality of work produced. It is therefore imperative that management should at all
times keep employee’s morale high to avoid this situation.
Turnover
Paul and Spector (2005:186-187) state that turnover ratios tend to be lower during
periods of economic recession. When jobs are scarce, employees stick to what they
have as it is risky to leave your job during an economic recession. When economic
conditions return to normal, disgruntled employees often begin to seek employment
elsewhere. When jobs are plentiful, job satisfaction is a prominent consideration in
turnover decisions. Ratios and costs then begin to rise.
McShane and Glinow (2005: 37-39) state that if the levels of job satisfaction are
constantly low employees are more likely to leave their jobs. They argue that the
main cause of turnover is job satisfaction. When the turnover rate begins to rise
abnormally it can be regarded as a sign of job dissatisfaction and the management
(HR department) should evaluate the exit questionnaires to determine the cause of the
high turnover and work out suitable remedies. Turnover is of major concern to
management; it is costly because of the need to train inexperienced new personnel and
the tremendous impact on operations.
Marshall, Joe, Olphert & Anne-Maria (2009: 1) contend that employee retention
during a merger is attributed to a number of ‘push’ and ‘pull’ factors influencing staff
decisions about whether to leave or remain within the organisation. In every
organisation employees leave for different reasons and others are hired for different
reasons. This has been witnessed as happening at WSU. After the merger some senior
positions became redundant and workers were advised to take packages and leave the
organisation.
32
Newstrom and Davis (1997:257), however, argue that there can be some positive
outcomes resulting from a turnover. This could lead to internal promotions and new
appointments. These new employees could come with fresh ideas. During transitional
periods, the turnover tends to be high as employees decide to leave their jobs for
various reasons and that opens up for internal promotions and new appointments.
Absenteeism
Absenteeism can be involuntary, that means that absenteeism is unavoidable because
of sickness, family crises, and other valid reasons. Sometimes absenteeism can be
voluntary which means an individual may choose to stay away from work.
Robbins (2001:78) states that there is a negative relationship between satisfaction and
absenteeism. According to Steel and Rentsch (1995), there is an inverse relationship
between job satisfaction and absenteeism, which implies that, when job satisfaction is
low, absenteeism tends to be high. Workers who experience low job satisfaction tend
to be absent from work more often. Of course absenteeism is unavoidable in certain
circumstances, for example sickness, family crises and other valid reasons but
absenteeism can point towards employee’s negative attitudes towards their work. If
workers enjoy their jobs, they will usually exert the effort necessary to do what is
expected of them (Paul & Spector, 2005:185).
According to Robbins (2001:79-80), employees who are dissatisfied with their jobs
can express themselves in various ways such as:
• Workers will join a union mainly based on their dissatisfaction with
working conditions and their perceived lack of influence to change those
conditions (Arnold & Feldman, 1996:95).
33

• Strikes and instances of sabotage are extreme examples of dissatisfaction
among the work force and are costly in both human and economic terms.
• Employees’ lack of pride in their work, an attitude of “Who cares?” and
low job satisfaction are serious and can have a direct effect on an
organisation’s productivity.
2.8 ANALYSIS OF PREVIOUS RESEARCH
To give more insight about mergers Marshall, Joe, Olphert & Anne-Maria (2009:3)
confer different theories on mergers as discussed below.
In a research study conducted by Lalla (2009:89), to explore the impact of the
merger on the employees of Tshwane University of Technology, the findings
revealed that mergers definitely impact on staff from both a personal and a
professional perspective. The study further revealed that the merger had a negative
impact on management relationships, job security, job position and promotion,
communication, performance standards and some elements of collegial
relationships. The researcher utilised a quantitative descriptive research design to
analyse the data using statistical procedures. The sample comprised 72 respondents
and the tool used was a self- administered questionnaire.
Furthermore, the study indicated distinctly that there was a breakdown in
communication as a result of the merger. This links up with the findings of other
researchers on merger issues who alluded to the communication breakdown. It was
then recommended that this area should be further investigated to allow those
involved in mergers to discover what mechanisms can be put in place so that
communication during a merger is transparent and consistent.
34
It was also recommended that management should consider investing in employees’
wellbeing on both personal and professional levels, as this will also avoid the
possibility of a high turnover which will add to the financial burden of the institution.
This means that mergers should be managed in a very professional manner to avoid
the possible loss of valuable employees during this period of transition.
Research done by Jewell, Beavers III, Malpied and Flowers (1990) reveals that
vocational agricultural teachers in North Carolina have a moderate level of general job
satisfaction and average levels of intrinsic and extrinsic job satisfaction. The aim of
the study was to determine the levels of job satisfaction of the vocational agriculture
teachers in North Carolina and to determine whether a relationship existed between
their level of job satisfaction and their perceptions of various portions of the teaching
profession.
The study was conducted as a descriptive study, using the Minnesota Satisfaction
Questionnaire (MSQ Shortened Version) in collecting data.
The MSQ included 20 items, each item represented either an intrinsic facet or an
extrinsic facet of the job and percentile scores were used. The population of the study
consisted of the vocational agricultural teachers employed in North Carolina from
1985 to 1986 school year (N = 375). The conclusions and recommendations that
followed this study were that, since only average to moderate levels of job satisfaction
were determined; efforts need to be made to provide in-service training activities to
increase the various levels of job satisfaction. It was also concluded that North
Carolina’s vocational agricultural teachers were more dissatisfied with the financial
support they receive than their working environment and professional acceptance.
Recommendation was then given that efforts should be made to increase both local
and state dollars for instructional material, consumable instructional materials, travel
reimbursements, and local salary supplements.
35

Efforts should also continue to encourage the state legislature to take steps to raise
salaries for teachers in the state. If this is not taken in consideration it can lead to high
staff turnover as people will be looking for satisfying job salaries elsewhere and leave
the teaching profession.
In research conducted by Feistein (2006:1), University of Nevada, the findings were
that tenure was shown to have a significant relationship with general satisfaction and
several of the category variables. The study was conducted through a survey
instrument consisting of demographic, job satisfaction, and organisational
commitment questions adopted from the validated Minnesota Job Satisfaction and
Organizational Commitment Questionnaires.
The research study generated a 74.5% response rate from 137 employees who had
worked at two restaurants in Southern Nevada. Results of the study indicated that
tenure had a significant (α = 0,5) effect on several of the component scores for
satisfaction; store location had a significant effect on the level of satisfaction with
policies, and the level of education significantly affected satisfaction with recognition.
A recommendation to this effect was that management should reward individuals who
acquire higher levels of education by providing a structure for advancement or by
providing some monetary compensation.
A study conducted by Marshal, Joe, Olphert & Anne-Maria (2009:3) reveals that the
primary emotions described during change were uncertainty, insecurity and
vulnerability. The aim of the study was based on understanding the effects of
organisational change on staff in the NHS: a case study of a local primary care trust
merger.
Marshall et al. (2009: 3) posit that there are a number of ‘push’ and ‘pull’ factors
influencing staff decisions of whether to remain within the organisation.
36

The mentioned authors further assert that it became clear from the literature that has
been developed around the human side that it is the uncertainty, increased anxiety,
increased staff turnover and lowered job satisfaction that such change provokes
dissatisfaction in individuals.
From the above, it can be argued that during transitional periods issues of job security
are the most critical issues that organisations should prioritise as there appear to be
general consensus from previous researchers that job losses occur during mergers.
During the transitional periods, especially when harmonising salaries, benefits and
conditions of services, one group may lose a benefit provided by the legacy institution
which could become a pushing factor. On the other hand, a group might benefit from
something which will then be a pulling factor to them. Harmonisation is not
equalisation but rather that the merged institution must develop its own new policies,
salary scales, benefits and conditions of services. One will look at these new policies,
salary scales, benefits and conditions of services and compare them with the ones
from the legacy institution and decide to stay within the new institution or leave.
2.9 SUMMARY
This chapter dealt with the literature review on the impact of mergers on employees in
relation to job satisfaction during transitional periods. Theories on job satisfaction,
factors that influence job satisfaction, dissatisfaction and common job satisfaction
facets were discussed and previous research was reviewed.
Research evidence shows that job satisfaction is considered to be the strong predictor
for an individual to decide to stay or leave the organisation. Because of this
phenomenon, management has to ensure that employees’ job satisfaction is
maintained at a high level throughout the transformation process.
37

Job satisfaction describes how content an individual is in his or her job. For an
employee to be satisfied with his or her job is good, not only for employees but
employers too. It increases productivity, decreases staff turnover and should therefore
be maintained at all costs.
In the next chapter, chapter 3 the researcher will identify and discuss research design
and methodology in detail which will include the research instruments, questionnaire,
population and sampling, administrative procedures and statistical data analysis.
38
CHAPTER 3
RESEARCH METHODOLOGY
3.1 INTRODUCTION
In this chapter the researcher will focus on the research design and methodology
under the following sub-headings:
• Research methodology and design
• Population and sampling procedure
• Research instruments
• Data collection and data analysis
• Validity and reliability
3.2 RESEARCH METHODOLOGY AND DESIGN
Welman and Kruger (2004:46) describe the research design as the plan in which
information is obtained from the research participants. In the plan it is clearly defined
how participants are going to be selected in order to get valid and reliable research
results. However, Olivier (1997: 38) argues that researchers should accept that there
are a variety of research approaches and perspectives, all of which are relevant to
different research problems. The researcher agrees with Olivier, where he
recommends that, rather than having a preferred methodology, researchers should just
select the approach which seems the most suitable for the study.
According to Henning (2004: 3), the distinction between the qualitative paradigm and
the better known quantitative paradigm lies in the quest for understanding and for in-
depth inquiry. In quantitative research methodology the study will be guided with
39
acute focus on how variables are related, whereas in qualitative research the variables
are usually not controlled.
Neuman (2000: 121-155) makes a distinction between qualitative and quantitative
research designs. For the purpose of this study the research methodology to gather
data is that of quantitative design which Neuman (2000:121-155) describes as
including: experiments, surveys and content analysis, using a structured questionnaire.
Gronhaug and Ghauri (2005) conclude that quantitative designs deal with a large
number of respondents and use sufficiently large numbers to allow for generalisable
comparisons and for conclusions to be drawn about populations.
3.3 POPULATION AND SAMPLING PROCEDURES
In this section the research population and related sampling method will be discussed.
3.3.1 Population
Researchers suggest that a population, sometimes referred to as a “target population”,
is the set of elements on which the research focuses and to which the results obtained
by testing the sample, should be generalised (Bless & Higson-Smith 2000:85).
According to Olivier (1997: 38), a population is the group of people to which the
research applies and conclusions will be drawn from those people. Furthermore,
Leedy and Ormord (2000:218) provide specific characteristics to describe a
population:
• A population is generally a homogenous group of individual units.
• A population contains definite strata that are approximately equal in size.
40

• A population contains definite strata that appear in different proportions within
the population.
• A population consists of clusters whose cluster characteristics are similar, yet
whose characteristics are as heterogeneous as those of the overall population.
Taking this into consideration and for the purpose of this study the researcher
identifies the population to be drawn from WSU's academic and non-academic
employees from the three legacy institutions and the directorate of WSU. WSU's
delivery sites are situated in four different towns of the Eastern Cape province,
namely Mthatha, Butterworth, East London and Queenstown with a distance of 400
km between them. In some instances, certain members may have no chance at all of
being included in this research due to distance and time constraints.
3.3.2 Targeted population
The targeted population for this study is WSU employees from Grades 3 to 17,
according to the Peromnes Job Grading System for grouping employees used by the
university. Grades 3 and 4 personnel are executive directors and deputy vice-
chancellors, Grades 5 and 6 are professors, directors, deputy directors and managers
of WSU; Grades 7 and 8 are senior lecturers/lecturers and senior managers; Grades 9
to 11 are senior officers/officers and Grades 12 to15 are assistant officers and clerks
and Grades16 and 17 are maintenance personnel. At the time of the study there are no
associate professors within the university as the academic structure/architecture is not
yet finalised.
41

3.3.3 Sampling
According to (Oliver 1997: 46) the most representative type of sample would be one
in which every individual person in the targeted population had an equal chance of
being selected for the sample. Also researchers suggest that defining sampling units
clearly before choosing cases is essential in order to avoid messy and empirically
shallow research (Seal, Gobo, Gubrium & Silverman, 2004:435).
According to Stuart and Wayne (1996:30), samples must be representative of the
population of concern; otherwise no general observations about the population can be
made from the sample. One of the aims of the study is to be able to say with
confidence that the results of the study apply to a wider population at WSU. That can
only be obtained and be confirmed if the sample size was large enough to represent a
population correctly.
Researchers argue that after having specified a population, the researcher decides if he
or she will collect information on all its individuals or on a sub-set only. So the
sample is just a sub-set of cases (Seale, Gobo, Gubrium & Silverman, 2004:437).
For the purpose of this study a sample size of 200 is used, since the population size of
WSU is 1 179. The selection of the sample size is based on Leedy and Ormrod’s
(2010: 214) guidelines. A systematic sampling method is used for issuing the
questionnaires to respondents, in terms of which every fourth respondent is issued
with a questionnaire, until the required sample size is reached.
Welman and Kruger (2001:56) describe many different types of sampling and for this
study the researcher employed stratified random sampling because with a stratified
random sample researchers are ensured of representatively, irrespective of sample
size, because it has been built into the sampling strategy from the very beginning.
42

Taking that into consideration and for the purpose of this study the researcher uses
proportional stratified random sampling to find the number of employees in each
category of employees (Table 1).
Table 1 Sample size
Staff WSU employees Sample sAcademics 750 127Non-academics 429 73TOTAL 1 179 200
3.3.4 Pilot study
Researchers Bless and Higson-Smith (2000:155) define a pilot as “a small study
conducted prior to a larger piece of research to determine whether the methodology,
sampling, instruments and analysis are adequate and appropriate”. Neuman
(2000:257) also asserts that the researcher may uncover aspects that need refinement
through pilot testing. A pilot study using ten respondents is conducted to ascertain the
reliability and validity of the questionnaire design and are not used in the main study.
3.3.5 Ethical aspects
Strydom (2002:63) provides the researcher with several ethical issues that should be
taken into consideration while conducting a research. This includes that harm should
be avoided, that informed consent should be given and that confidentiality should be
maintained.
Furthermore, Strydom points out that subjects can be harmed either in a physical or
emotional manner and that in the social sciences one should expect harm to
respondents to take the form of emotional harm. It is the responsibility of the
researcher to protect respondents against harm.
43
In this study the researcher believes that respondents are still experiencing a
tremendous change process and this change is still creating tension and uneasiness
amongst WSU employees. To date, the institution is still battling to harmonise
conditions of service, qualification offerings and integration of working processes
through other channels such as bargaining labour forums and some cases are referred
to the Commission for Conciliation, Mediation and Arbitration (CCMA) for
arbitration. The researcher is aware of the situation and does not want to exacerbate
the situation any further.
To ensure that the ethical aspect is covered, the researcher also includes a letter of
informed concern (Annexure B) to participants informing them about the nature of the
study that it is for academic research only, that participation is voluntary, that
confidentiality and anonymity of records will be maintained at all times and that they
are free to withdraw their participation at any time.
3.4 RESEARCH INSTRUMENTS
Job satisfaction is measured in many different instruments with a variety of questions
and wording. Spector (1985: 693-713) identified instruments that are commonly used
as:
Job Descriptive Index (JDI) – is one of the job satisfaction measuring tools. JDI is a
specific questionnaire of job satisfaction whereby participants answer either Yes or
No or can’t decide (indicated by ‘?’). JDI is used throughout the world. JDI focuses
on five key facets that influence overall job satisfaction, namely (1) work itself, (2)
remuneration, (3) co-workers, (4) opportunities and (5) supervision.
Job in General Index (JGI) – is an overall measurement of job satisfaction. It is an
improvement to the Job Descriptive Index because the JDI focuses too much on
individual facets and not enough on work satisfaction in general. 44
Job Satisfaction Survey (JSS) is a 36 item questionnaire that measures nine facets of
job satisfaction.
Faces Scale, is one of the first scales used widely, measuring overall job satisfaction
with just one item which participants respond to by choosing a face.
Minnesota Satisfaction Questionnaire (MSQ) is the one of the most widely
researched and utilised measures of job satisfaction available worldwide and MSQ is
designed to measure an employee’s satisfaction with his or her job. The MSQ makes
it feasible to obtain an individualised picture of worker job satisfaction, as well as
providing an accurate measurement of job satisfaction for groups of individuals on
numerous workplace factors. The MSQ have three forms available: two long forms
(1977 version and 1967 version) and a short form. MSQ uses a 5-point Likert scale
yielding interval data.
The MSQ measures an individual’s satisfaction with 20 aspects of the work
environment as listed below:
Ability Utilisation Co-workers Moral Values
Achievement Creativity Recognition
Activity Independence Responsibility
Advancement Security Supervision – Human Relations
Authority Social Service Supervision – Technical
Company Policies Social Status Variety
Compensation Working Conditions
The MSQ Shortened Version is composed of one question from each of the twenty
aspects of job facets. However, benefits of using MSQ are described as follows:
Easy to use, easy to understand
Valid and reliable 45

Applicable to any organisation
Applicable for managers, supervisors and employees.
For the purpose of the study a modified MSQ version in wording is used to make the
instrument more consistent with the university environment. The neutral response is
eliminated, leaving the 4-point Likert scale to simplify the interpretation of results.
The Likert scale is designed as follows:
1 – Very Dissatisfied; 2 – Dissatisfied; 3 – Satisfied and 4 – Very Satisfied.
Further analysis of the 20 item resulted in two factors: intrinsic and extrinsic
satisfaction (Table 2). A questionnaire (Appendix B) based on MSQ was created,
consisting of 20 questions. In the same vein, participants answer by crossing the box
that specifically corresponds to their attitudes.
The questions relate as follows to the MSQ model:
Table 2 Job facets, category and asked questions
Job Facets/Dimensions Job Satisfaction Category
Asked Questions
Company Policies/Practices Extrinsic Q1 & Q5
Remuneration Extrinsic Q4 & Q6
Independent Work Intrinsic Q2, Q3 & Q14
Supervision-Technical -Human Relations
Extrinsic Extrinsic
Q8 Q12
Work itself Intrinsic Q10 & Q18 Communication Intrinsic Q9 Achievement Intrinsic Q13
Job Security Intrinsic Q7
Working Conditions General Q17 & Q20
Recognition Extrinsic Q11
Co-workers General Q15 & Q16
Social Service Intrinsic Q19
The next section outlines the data collection method and the data analysis.
46

3.5 DATA COLLECTION AND DATA ANALYSIS
3.5.1 Data collection
After the design activities have been completed, the researcher has to decide on which
data-collecting method is the most suitable for the inquiry and the particular
population. As mentioned earlier, for this study the researcher will be using
questionnaires to collect data from participants.
According to Welman and Kruger (2004:146), survey questionnaires are used to
obtain the following types of information from participants:
• Biographical particulars
• Typical behaviour
• Opinions, beliefs and convictions
• Attitudes
Stuart and Wayne (1996: 43) state that questionnaires are commonly used and also
commonly abused. They argue that it is easy to compile a questionnaire; it is not easy
to complete an effective questionnaire.
Welman and Kruger (2004:147) identify the advantages and disadvantages of using
survey questionnaires as follows:
Disadvantages
Control over responding - The researcher has the least control over the conditions
under which questionnaires are completed, though this lack of control also holds
potential advantage in the sense that respondents are allowed to complete the
questionnaires at their own convenience. 47

Response rate - The researcher’s lack of control over the completion of the
questionnaires may result in a poor response rate, also in poorly completed
questionnaires. A poor response rate restricts the generalisation of inquiry; the results
of any research should apply to a wider population.
Advantages
Cost and ease of application -The use of questionnaire is preferable as it is
inexpensive and efficient. Also questionnaires are easily quantified and analysed
statistically. It is simpler and quicker to work with questionnaires.
Anonymity - Questionnaires provide the greatest possibility of anonymity, they can be
returned to the researcher without any indication of who has completed it.
For the purpose of this study, the instrument used to collect data is a modified version
of the 1977 Minnesota Satisfaction Questionnaire (MSQ) and the researcher collects
data from participants in the following manner:
• MSQ questionnaires hard copies (printed) are distributed and collected
• Two main job categories are represented in the population, namely
academics and non-academics
• All participants are permanent WSU employees who migrated from the
three legacy institutions.
3.5.2 Data analysis
According to Oliver (1997:41), research is always seen as a series of overlapping
activities which often proceed simultaneously. This view applies very much to the
processes of data collection and data analysis.
48

Welman and Kruger (2004:194), state that once an appropriate research design and a
suitable means of measuring instrument have been chosen, the researcher has to
choose an appropriate statistical procedure to analyse the data obtained. Once the data
is collected it should be organised, coded, captured into a computer and then the
analysis proceeds.
For the statistical analysis the researcher uses computers to analyse the data obtained.
Computers are relatively inexpensive and work efficiently.
They accurately execute these complicated and time-consuming manipulations in a
matter of seconds at a relatively low cost. Therefore, the Statistical Package for
Social Sciences (SPSS, version 8.1) were used to capture and analyse the data
collected.
For this study, the data are obtained from WSU employees who are affected by the
merger; more specifically those who are still employed at the university. Those who
left the service of the university do not form part of the study. The collected data are
presented as follows:
• For demographic information the researcher uses bar charts.
• MSQ question statements are presented in a frequency table constructed
by arranging collected data values in ascending order of magnitude with
their corresponding frequencies.
A critical analysis to evaluate job satisfaction levels of WSU employees will be made
out of the MSQ questionnaires and in scoring the MSQ for job satisfaction, percentile
scores will be used. Thus, a group of respondents will be categorised according to
their responses on a scale measuring a MSQ questionnaire statement. The term
percentile refers to the proportion of scores in a distribution that a specific score is
greater than or equal to.
49
In statistics, a percentile (or centile) is the value of a variable below which a certain
percent of observations fall (Howell, 2002). For example, the 20th percentile is the
value (or score) below which 20 percent of the observations may be found.
3.6 VALIDITY AND RELIABILITY
3.6.1 Methods to ensure reliability
Welman and Kruger (2004:139), refer to reliability as the extent to which the obtained
scores may be generalised to different measuring occasions, measurements/tests forms
and measurements/test administrators. This means that if the research would be
repeated at some time in the future the results would be identical.
According to Olivier (1997:54) highly structured, closed questions tend to have a
higher reliability than open-ended questions that ask the participant to write a
paragraph in response.
However, Stuart and Wayne (1996:42), suggest that reliability can be checked by
using one of the three approaches:
• The test-retest approach – administer the same instrument at a later
time and see if you get the same results as in the first test.
• The equivalent form approach – here each question on the original
test/interview/questionnaire is rephrased so that one winds up with two
tests that ‘look different’ but effectively ask the same question.
• The split-half approach – this is a modification of the equivalent form
approach where the two tests are combined into one.
50

For the purpose of this study, the researcher applies the first approach mentioned,
namely the test-retest approach. This is done by way of a pilot study consisting of ten
respondents to ascertain the reliability and validity of the questionnaire design to
determine whether the methodology, sampling, instruments and analysis are adequate
and appropriate and these responses are not be used in the main study.
3.6.2 Validity
An instrument is reliable if it consistently gives the same results, but that does not
make the answer valid (Stuart & Wayne, 1996:42-43). Again Stuart and Wayne
suggest that validity can be checked by using one the three approaches. In order of
preference these are:
• Criterion-related validity – this measures whether an instrument
accurately predicts or diagnoses some particular variable. If you have an
instrument to measure the same thing you should simply compare the
results obtained by the new instrument with that of the old one.
• Construct validity – if you have an existing instrument that measures
something which is known to be closely related to the thing you want to
measure, compare the results obtained by the new instrument and check
if there is a high correlation.
• Content validity – if no instruments exist, get expert opinion on each
question on an instrument to determine whether or not each question
actually tests what it is supposed to.
People’s judgments are imperfect, so it is important to determine how reliable and
valid each information analysis is (Spector, 2006: 69). For this study the following
methods are used to check the reliability and validity of the study:
51

• A pilot study involving ten respondents is conducted to ascertain the
reliability and validity of the questionnaire design. These respondents
are not be used in the main study.
• The distributed questionnaires are collected directly from participants as
the researcher asks them to voluntary and freely participate in the
research project.
• The completion of the questionnaires is voluntary and questionnaires are
completed anonymously.
3.7 SUMMARY
In this chapter the researcher provided a broader explanation of the research
methodology and design, population and sampling procedure, research instruments,
data collection and data analysis that is used for this study. Methods to ensure
reliability and validity were also discussed.
In this chapter a questionnaire was also developed as a measuring instrument and tool
of collecting data from participants. The presentation and findings of the data obtained
from participants will be discussed in the next chapter.
52
CHAPTER 4
ANALYSIS OF DATA COLLECTED
4.1 INTRODUCTION
This chapter is to analyse and discuss the results obtained from the data collected from
participants for the purpose of the study.
Welman and Kruger (2001:194) state that once decided on an appropriate research
design and suitable means of measuring instrument, the researcher has to choose an
appropriate statistical procedure to analyse the data obtained. Once the data is
collected it should be organised, coded, captured on a computer and then the analysis
can proceed.
4.2 PRESENTATION OF DATA COLLECTED
For a statistical analysis the researcher uses computers (SPSS version 18) to analyse
data. The sample size of 200 participants was issued with questionnaires; 130
participants returned their questionnaires. A questionnaire was developed as a
measuring instrument and tool for collecting data from participants. The demographic
data in Section A of the questionnaire, obtained from the research sample are
represented in a bar chart format from figure 4.2.1 to figure 4.2.7. Thereafter the
responses obtained from MSQ statements in the questionnaire will be presented by
means of frequencies and percentages since they can easily show the behaviour and
distribution of a variable (Howell, 2002) as illustrated from table 4.3.1 to table 4.3.20.
53
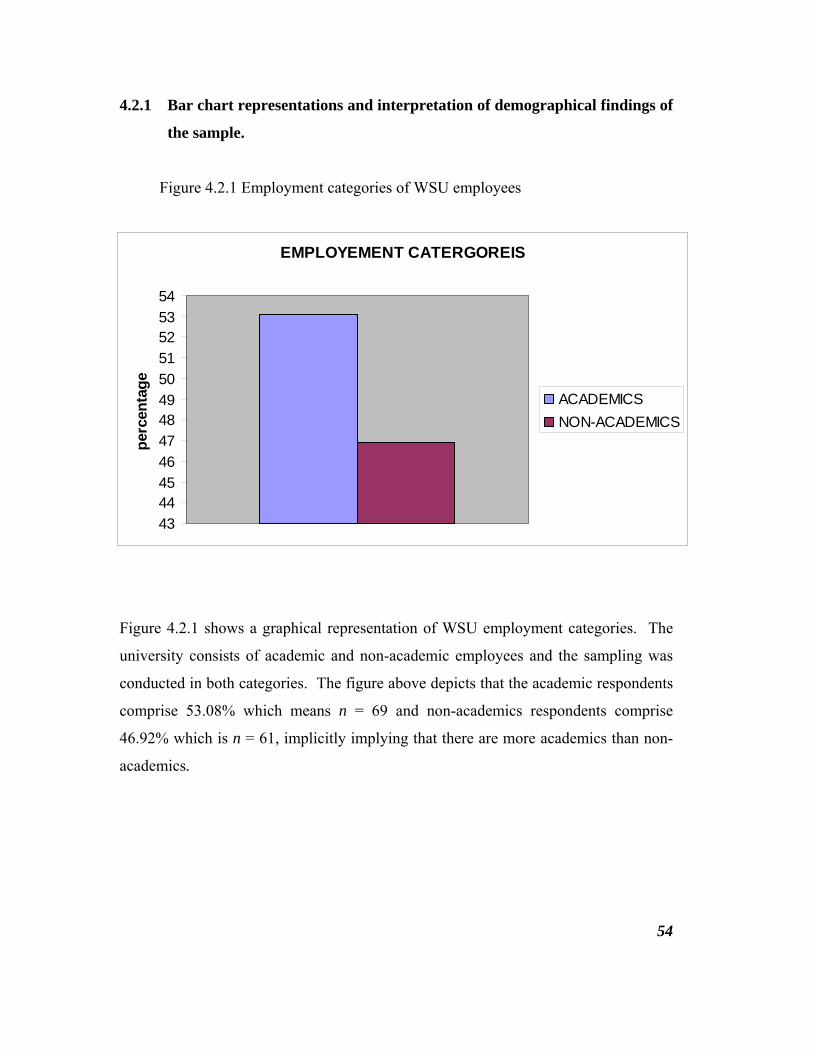
4.2.1 Bar chart representations and interpretation of demographical findings of
the sample.
Figure 4.2.1 Employment categories of WSU employees
Figure 4.2.1 shows a graphical representation of WSU employment categories. The
university consists of academic and non-academic employees and the sampling was
conducted in both categories. The figure above depicts that the academic respondents
comprise 53.08% which means n = 69 and non-academics respondents comprise
46.92% which is n = 61, implicitly implying that there are more academics than non-
academics.
54
EMPLOYEMENT CATERGOREIS
434445464748495051525354
perc
enta
ge
ACADEMICSNON-ACADEMICS

Figure 4.2.2 Gender of WSU respondents
Figure 4.2.2 shows the graphical representation of the gender of the sample. In the
figure above female respondents obtained 56.92% which means n = 74 and males
obtained 43.08% which is n = 56.
55
GENDER
0
10
20
30
40
50
60
perc
enta
ge
FEMALESMALES

Figure 4.2.3 Age of respondents
Figure 4.2.3 reflects a graphical representation of the age distribution of the
respondents. The graph clearly depicts that most respondents fall in the age category
of 36 to 50 years old whereby the sampled population of this age group obtained
49.23% which means n = 64 which can be generalised to be a true reflection of the
university employees. The second group is that of ages between 21 and 35 years old,
this age group obtained 28.46% which is n = 37. The least population age group is
between 50 and 60 years and above and obtained 22.31% which means n = 29.
This means that, in terms of the age distribution of the respondents which completed
the questionnaire, the age group of 36 – 50 had more respondents.
56
AGE
0
10
20
30
40
50
60
perc
enta
ge 21-35 yrs36-50 yrs51-60 and above

Figure 4.2.4 Years of employment of respondents at WSU
Figure 4.2.4 depicts a graphical representation of the employment of respondents at
WSU. This graph shows that most of the population have been at the university for
more than three years which means that they were part of the merger that took place in
2005. The population group for employees that are three or more years with the
institution obtained 87.69%, that is n = 114, whereas the population group for two
years obtained 8.46% namely n = 11 which is closely followed by the least population
group of employees with employment of less than a year. This population group
obtained 3.85% which is n = 5.
57
YEARS OF EMPLOYMENT AT WSU
0102030405060708090
100
perc
enta
ge Less than a yearTwo yearsThree and more

Figure 4.2.5 Place of employment before merger
Figure 4.2.5 reflects previous employment of the sampled population from the legacy
institutions. This includes the population sample from former Border Technikon (BT),
former Eastern Cape Technikon (ECT), former University of Transkei (UNITRA) and
any other institution before joining WSU. Results are as follows: respondents from
former BT obtained the highest percentage of 34.66% where n = 45. Respondents
from former ECT comprised of 30.77% (n = 40), followed by respondents from
former UNITRA which obtained 25.38% (n = 33). The population group of
employees from other institutions obtained 9.23% whereby according to the sample (n
= 12).
58
INSTITUTION BEFORE MERGER
0
5
10
15
20
25
30
35
40
perc
enta
ge BTECTUNITRAOTHER

Figure 4.2.6 Educational Qualifications of the population
Figure 4.2.6 depicts a graphical representation of the educational qualifications of the
sample. The first population group is of those who have matric/senior Certificates with
5.38% and n = 7 from the sample of this study. The second group is that of the
population group that have diplomas and degrees, this group obtained 26.92% with n =
28 followed by a population group with BTech and Honours students, this group is
basically junior lecturers and some few non-academic employees which obtained
32.31% where n = 42. The fourth group obtained 40.77% whereby n = 53. Thus, the
graph shows that the majority of the population group have a master’s degree and
above. These are mostly academics as a master’s degree is the entry requirement for
lecturers and for non-academics who occupy senior positions. The implication is that
most staff members have a formal qualification with a few with only matric.
59
QUALIFICATIONS
05
101520
253035
4045
perc
enta
ge MATRICDIP/DEGREEB'TECH/HONOURSMASTERS

Figure 4.2.7 Job grades
Figure 4.2.7 reflects the graphical representation of the population sample according
to the Peromnes Job Grading System used by WSU. The grades indicate the salary
scale and the level of the position employment. In this graph, most respondents in the
population group are on Grades 7 and 8 and comprise of academics (senior lecturers,
lecturers and some non-academics in senior positions, such as senior managers and
managers). This group (Grades 7 and 8) obtained 43.08% which is n = 56. The
second population group of Grades 9 and10 comprises of senior officers and a few
academics and they obtained 21.62% of the sample which is n = 28. The third group
of Grades 11 to 13 are mostly a category of officers and assistant officers and
obtained 14.62 which is n = 19. The fourth group is Grades 5 and 6 and consists of
directors and deputy directors/deans also some professors of the university. On this
graph they obtained 5.38% of the sample where n = 7. Grades 14 to17 is basically
clerks and maintenance employees of which this population group obtained 12.31%
where n = 16. The smallest population group in the sample is Grades 3 and 4 which
comprises of executive directors/deans and they obtained 3.08% whereby n = 4.
60
JOB GRADES
05
101520253035404550
perc
enta
ge
GRADE 4-4GRADE 5-6GRADE 7-8GRADE 9-10GRADE 11-14GRADE 14-17
The responses indicated that the majority of respondents were:
academics
female
aged between 36 and 50 years
employed for three or more years at WSU
employed at the former Border Technikon before the merger is
in possession of a master's degree and above
in job Grades 7 and 8
The following section focuses on the presentation of data collected in Section B of the
questionnaire.
4.3 PRESENTATION OF COLLECTED DATA ANALYSIS
According to Delport (2002:165) one such measuring instrument is the questionnaire
and, since this study has been identified as being quantitative, the researcher uses a
MSQ modified questionnaire as discussed in chapter 3 as a method of data collection
(Fouche & De Vos, 2002: 138-147). The data obtained from the respondents will be
captured into separate databases constructed for this purpose and statistical analysis is
performed by using SPSS version 18.
Participants were requested to specify their level of job satisfaction and dissatisfaction
on a Likert 4-point scale, whereby the scale was represented as follows:
1 - Very dissatisfied
2 - Dissatisfied
3 - Satisfied
4 - Very satisfied
61
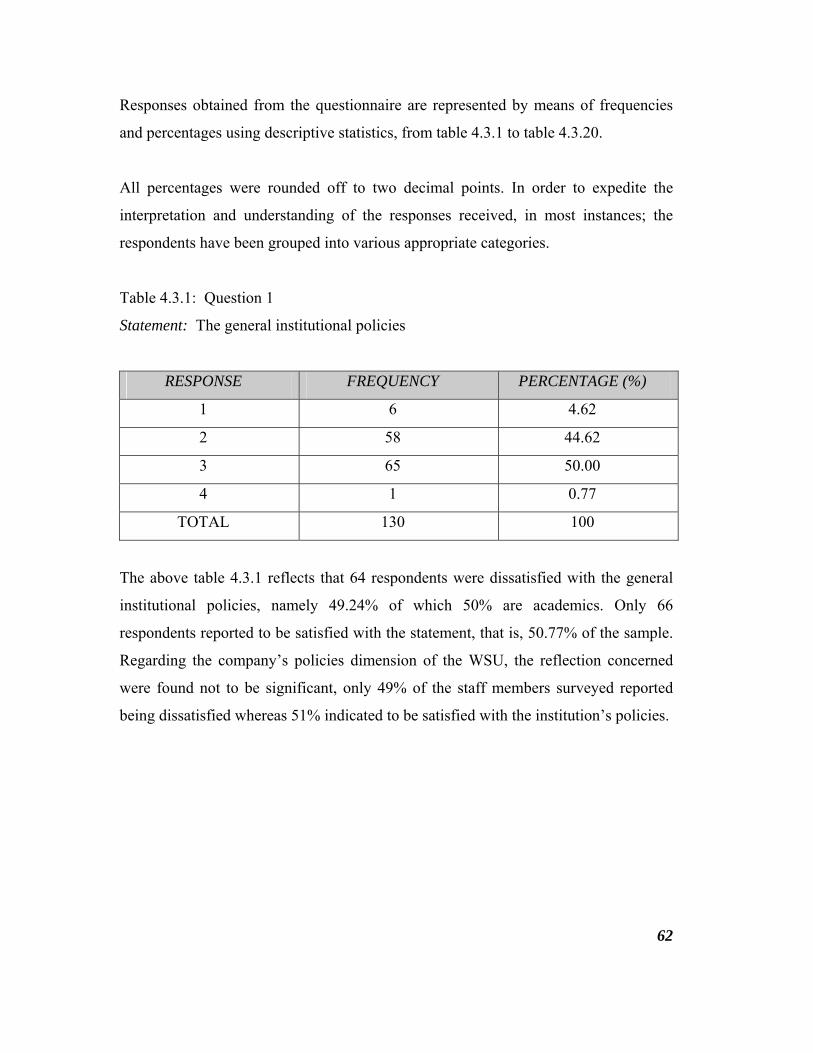
Responses obtained from the questionnaire are represented by means of frequencies
and percentages using descriptive statistics, from table 4.3.1 to table 4.3.20.
All percentages were rounded off to two decimal points. In order to expedite the
interpretation and understanding of the responses received, in most instances; the
respondents have been grouped into various appropriate categories.
Table 4.3.1: Question 1
Statement: The general institutional policies
RESPONSE FREQUENCY PERCENTAGE (%)
1 6 4.62
2 58 44.62
3 65 50.00
4 1 0.77
TOTAL 130 100
The above table 4.3.1 reflects that 64 respondents were dissatisfied with the general
institutional policies, namely 49.24% of which 50% are academics. Only 66
respondents reported to be satisfied with the statement, that is, 50.77% of the sample.
Regarding the company’s policies dimension of the WSU, the reflection concerned
were found not to be significant, only 49% of the staff members surveyed reported
being dissatisfied whereas 51% indicated to be satisfied with the institution’s policies.
62
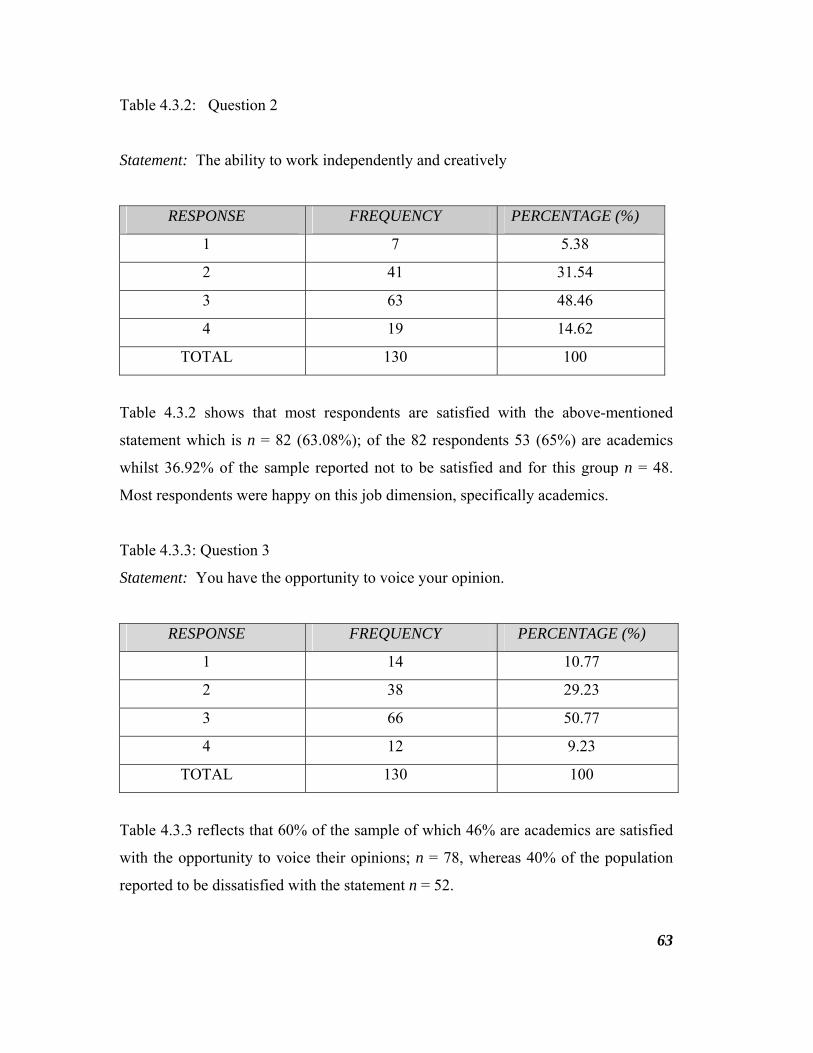
Table 4.3.2: Question 2
Statement: The ability to work independently and creatively
RESPONSE FREQUENCY PERCENTAGE (%)
1 7 5.38
2 41 31.54
3 63 48.46
4 19 14.62
TOTAL 130 100
Table 4.3.2 shows that most respondents are satisfied with the above-mentioned
statement which is n = 82 (63.08%); of the 82 respondents 53 (65%) are academics
whilst 36.92% of the sample reported not to be satisfied and for this group n = 48.
Most respondents were happy on this job dimension, specifically academics.
Table 4.3.3: Question 3
Statement: You have the opportunity to voice your opinion.
RESPONSE FREQUENCY PERCENTAGE (%)
1 14 10.77
2 38 29.23
3 66 50.77
4 12 9.23
TOTAL 130 100
Table 4.3.3 reflects that 60% of the sample of which 46% are academics are satisfied
with the opportunity to voice their opinions; n = 78, whereas 40% of the population
reported to be dissatisfied with the statement n = 52.
63

Table 4.3.4: Question 4
Statement: You are paid fairly for the amount of work you do.
RESPONSE FREQUENCY PERCENTAGE (%)
1 14 10.77
2 58 44.62
3 54 41.54
4 4 3.08
TOTAL 130 100
Table 4.3.4 shows that 72 respondents (55.38%) of which 38 respondents (52%) are
academics, reported that they were not satisfied with the pay they get for the amount
of work they do, whilst 58 respondents (44.62%) reported to be satisfied. Regarding
this job dimension for WSU the majority of employees expressed their dissatisfaction
with the pay they receive for the work they perform.
Table 4.3.5: Question 5
Statement: Institutional policies are constantly applied to all employees.
RESPONSE FREQUENCY PERCENTAGE (%)
1 24 18.46
2 66 50.77
3 39 30.00
4 1 0.77
TOTAL 130 100
Table 4.3.5 shows that 69.23% (n = 90) of the respondents of which 64% (n = 58) are
academics were dissatisfied with the application of institutional policies to employees,
while 30.77% (n = 40) reported that they were satisfied.
64

A high percentage of respondents expressed their unhappiness with the application of
WSU policies. The inconsistent application of WSU policies arose because at the
time of the study, WSU had not yet signed the recognition agreement with labour
unions and when managers attempted to apply WSU policies, especially if the policy
is less favourable than that of the legacy institution, labour would raise the issue of
recognition of legacy agreements as per legacy institution.
Table 4.3.6: Question 6
Statement: Institutional benefits are adequate.
RESPONSE FREQUENCY PERCENTAGE (%)
1 13 10.00
2 61 46.92
3 53 40.77
4 3 2.31
TOTAL 130 100
This table indicates that 56.92% (n = 74) of the population sample is dissatisfied with
the institutional benefits of which 63.5% are academics, whereas 43.08%, (n = 56)
reported that they were satisfied. At the time of the study, the harmonisation of
benefits for WSU employees was not yet finalised as a result WSU benefits still vary,
although they were already documented and awaiting council approval.
65

Table 4.3.7: Question 7
Statement: Institutional changes affected your career.
RESPONSE FREQUENCY PERCENTAGE (%)
1 19 14.62
2 55 42.31
3 53 40.77
4 3 2.31
TOTAL 130 100
In this table 56.92% (n = 74) reported that they were dissatisfied with the effects of
institutional changes to their careers of which 55.4% were academics, whilst 43.08%
(n = 56) indicated that they were satisfied. The majority of respondents were
dissatisfied with this dimension.
It may then be assumed that the majority of the respondents experienced the merger as
having negatively affected their career path within the university especially since the
merger was between two former technikons and a traditional university. After the
merger, the minimum lecturing requirements changed to match university standards as
for former technikons minimum lecturing requirement was a matric plus a four-year
qualification (M + 4), which was a BTech qualification in most cases. Employees
from former technikons were forced to upgrade their lecturing qualifications to that of
a master’s degree.
66

Table 4.3.8: Question 8
Statement: The institution utilises individual talents by the institution.
RESPONSE FREQUENCY PERCENTAGE (%)
1 18 13.85
2 64 49.23
3 41 31.54
4 7 5.38
TOTAL 130 100
Table 4.3.8 shows that 63.08% (n = 82) of the sample were dissatisfied in the manner
in which their individual talents were being utilised by the institution of which 47.6%
were academics, whereas 36.92% (n = 48) reported that they were satisfied with the
statement.
Table 4.3.9: Question 9
Statement: Prompt feedback and communication are received from the management.
RESPONSE FREQUENCY PERCENTAGE (%)
1 26 20.00
2 62 47.69
3 37 28.46
4 5 3.85
TOTAL 130 100
Table 4.3.9 shows a significant difference of dissatisfied compared to satisfied
sample. The population sample of 67.69% (n = 88) reported that they were dissatisfied
with the prompt feedback from management; 49 of the 88 respondents (55.6%) were
academics, while a very small percentage of 32.31% (n = 42) of the population sample
reported that they were satisfied with the statement.
67
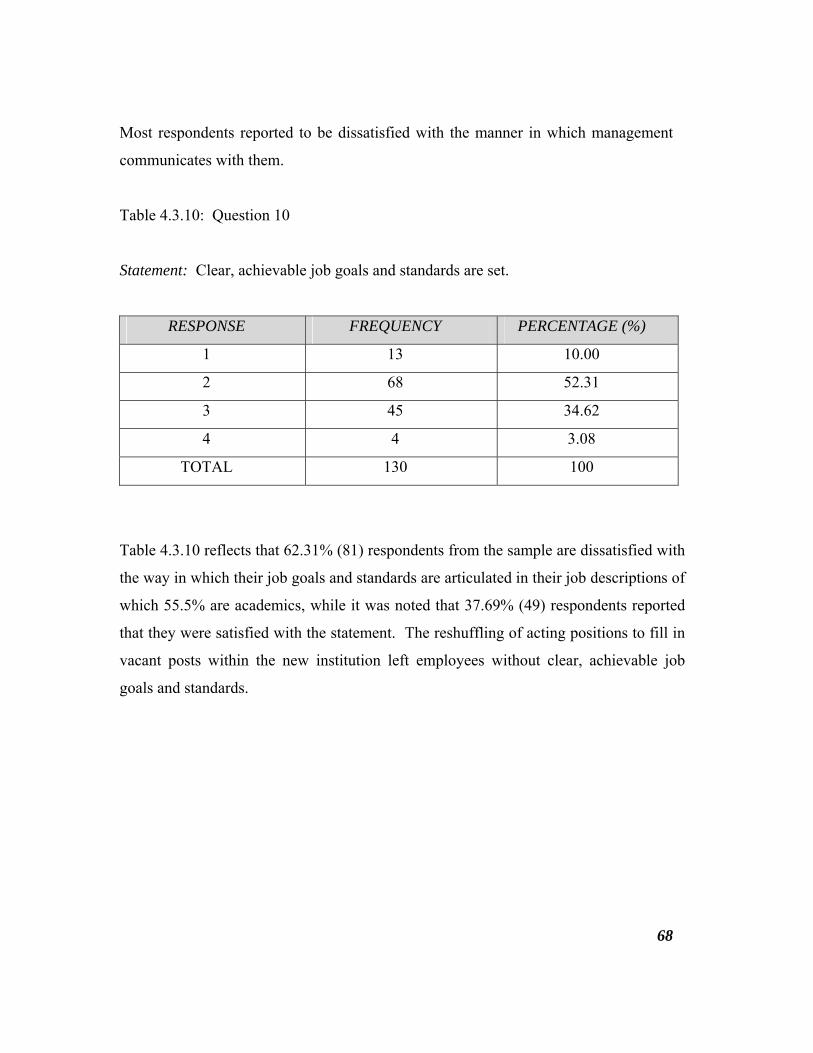
Most respondents reported to be dissatisfied with the manner in which management
communicates with them.
Table 4.3.10: Question 10
Statement: Clear, achievable job goals and standards are set.
RESPONSE FREQUENCY PERCENTAGE (%)
1 13 10.00
2 68 52.31
3 45 34.62
4 4 3.08
TOTAL 130 100
Table 4.3.10 reflects that 62.31% (81) respondents from the sample are dissatisfied with
the way in which their job goals and standards are articulated in their job descriptions of
which 55.5% are academics, while it was noted that 37.69% (49) respondents reported
that they were satisfied with the statement. The reshuffling of acting positions to fill in
vacant posts within the new institution left employees without clear, achievable job
goals and standards.
68
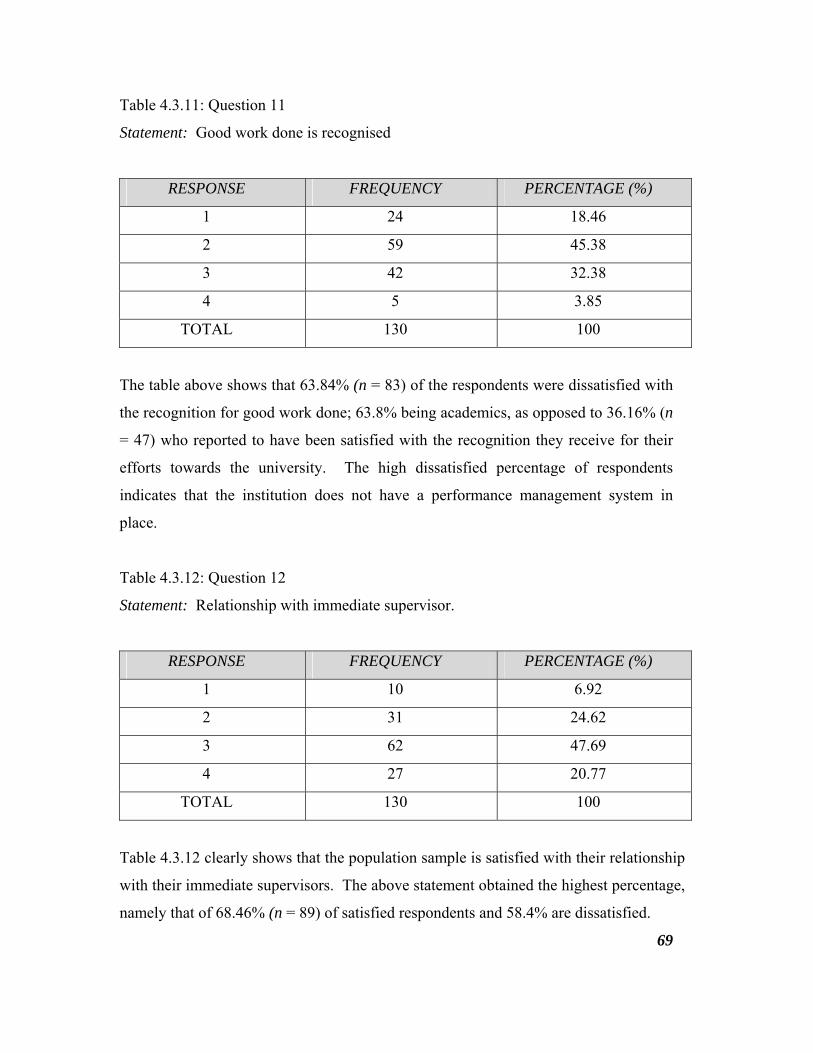
Table 4.3.11: Question 11
Statement: Good work done is recognised
RESPONSE FREQUENCY PERCENTAGE (%)
1 24 18.46
2 59 45.38
3 42 32.38
4 5 3.85
TOTAL 130 100
The table above shows that 63.84% (n = 83) of the respondents were dissatisfied with
the recognition for good work done; 63.8% being academics, as opposed to 36.16% (n
= 47) who reported to have been satisfied with the recognition they receive for their
efforts towards the university. The high dissatisfied percentage of respondents
indicates that the institution does not have a performance management system in
place.
Table 4.3.12: Question 12
Statement: Relationship with immediate supervisor.
RESPONSE FREQUENCY PERCENTAGE (%)
1 10 6.92
2 31 24.62
3 62 47.69
4 27 20.77
TOTAL 130 100
Table 4.3.12 clearly shows that the population sample is satisfied with their relationship
with their immediate supervisors. The above statement obtained the highest percentage,
namely that of 68.46% (n = 89) of satisfied respondents and 58.4% are dissatisfied.
69

Table 4.3.13: Question 13
Statement: There are institutional awards for outstanding achievements.
RESPONSE FREQUENCY PERCENTAGE (%)
1 22 16.92
2 72 55.38
3 33 25.38
4 3 2.31
TOTAL 130 100
Table 4.3.13 reflects that 72.30% (n = 94) of the sample were dissatisfied with
institutional awards for outstanding achievements of which 50% were academics,
whereas it was observed that a very small portion of the sample 27.70% (n = 36) were
satisfied with the above statement. At the time of the study the new institution had no
motivational awards for outstanding performance in place.
Table 4.3.14: Question 14
Statement: Participative decision making exists.
RESPONSE FREQUENCY PERCENTAGE (%)
1 26 20.00
2 67 51.54
3 30 23.08
4 7 5.38
TOTAL 130 100
Table 4.3.14 indicates that a significant number, namely 71.54% (n = 93) of the sample
are dissatisfied with the level of participative decision making, of which 46.2% are
70
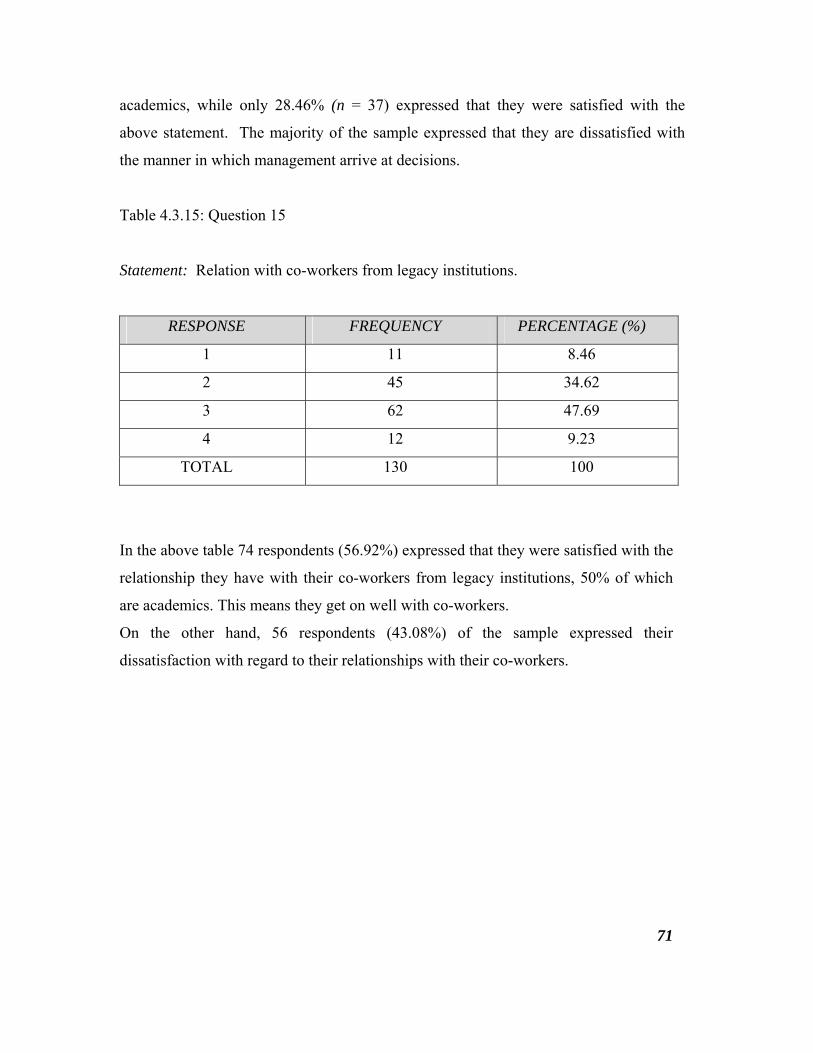
academics, while only 28.46% (n = 37) expressed that they were satisfied with the
above statement. The majority of the sample expressed that they are dissatisfied with
the manner in which management arrive at decisions.
Table 4.3.15: Question 15
Statement: Relation with co-workers from legacy institutions.
RESPONSE FREQUENCY PERCENTAGE (%)
1 11 8.46
2 45 34.62
3 62 47.69
4 12 9.23
TOTAL 130 100
In the above table 74 respondents (56.92%) expressed that they were satisfied with the
relationship they have with their co-workers from legacy institutions, 50% of which
are academics. This means they get on well with co-workers.
On the other hand, 56 respondents (43.08%) of the sample expressed their
dissatisfaction with regard to their relationships with their co-workers.
71

Table 4.3.16: Question 16
Statement: Institutional culture is supportive.
RESPONSE FREQUENCY PERCENTAGE (%)
1 18 13.85
2 56 43.08
3 52 40.00
4 4 3.08
TOTAL 130 100
The above table 4.3.16 states that 56.93% (n = 74) of the sample were dissatisfied
with the institutional culture meaning that the institution culture is not supportive to
them, (68.9% of the sample were academics) while 43.07% (n = 56) indicated that
they were satisfied with the above statement.
Table 4.3.17: Question 17
Statement: Technological changes affect your employability.
RESPONSE FREQUENCY PERCENTAGE (%)
1 19 14.62
2 64 49.23
3 44 33.85
4 3 2.31
TOTAL 130 100
Table 4.3.17 indicates that 63.85% (n = 83) of the sample were satisfied with the
effect of institutional technological changes in their employability of which 53% were
academics whilst only 36.15% expressed that they were dissatisfied with the
institutional technological changes.
72
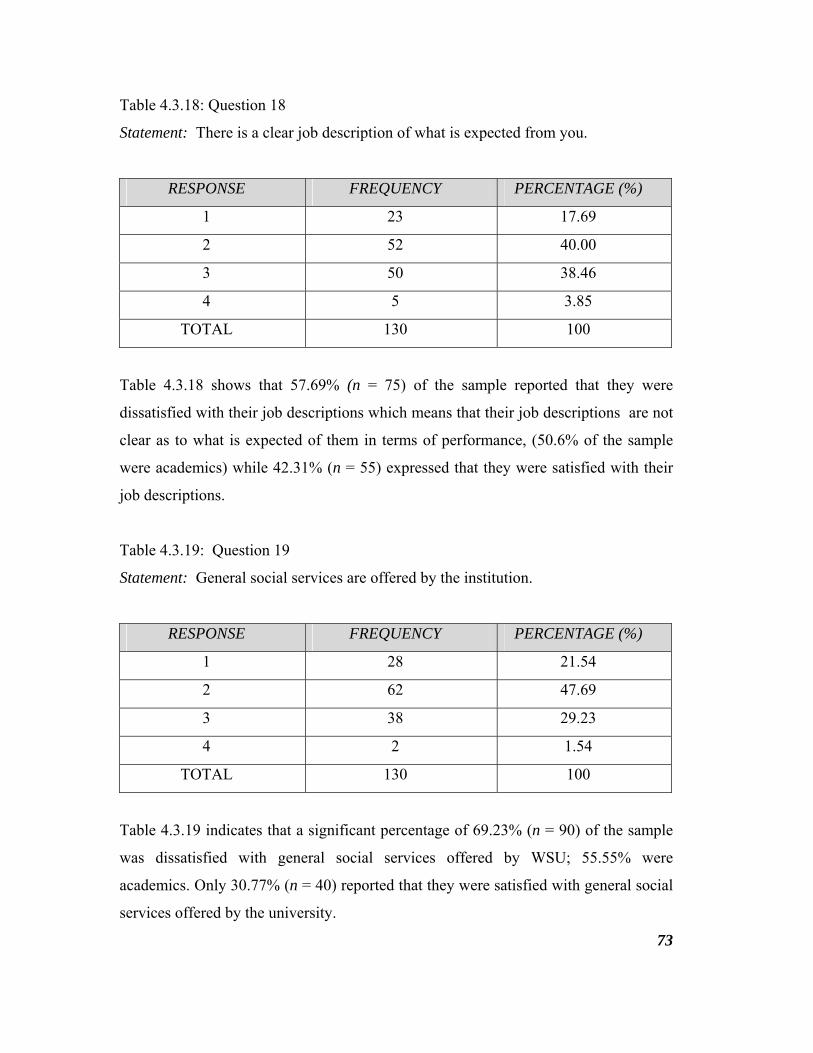
Table 4.3.18: Question 18
Statement: There is a clear job description of what is expected from you.
RESPONSE FREQUENCY PERCENTAGE (%)
1 23 17.69
2 52 40.00
3 50 38.46
4 5 3.85
TOTAL 130 100
Table 4.3.18 shows that 57.69% (n = 75) of the sample reported that they were
dissatisfied with their job descriptions which means that their job descriptions are not
clear as to what is expected of them in terms of performance, (50.6% of the sample
were academics) while 42.31% (n = 55) expressed that they were satisfied with their
job descriptions.
Table 4.3.19: Question 19
Statement: General social services are offered by the institution.
RESPONSE FREQUENCY PERCENTAGE (%)
1 28 21.54
2 62 47.69
3 38 29.23
4 2 1.54
TOTAL 130 100
Table 4.3.19 indicates that a significant percentage of 69.23% (n = 90) of the sample
was dissatisfied with general social services offered by WSU; 55.55% were
academics. Only 30.77% (n = 40) reported that they were satisfied with general social
services offered by the university.
73

Table 4.3.20: Question 20
Statement: The physical conditions in your work environment.
RESPONSE FREQUENCY PERCENTAGE (%)
1 42 32.31
2 57 43.85
3 29 22.31
4 2 1.54
TOTAL 130 100
The table above clearly shows that there is a problem within the university concerning
the above statement, namely the physical conditions of the work environment within
the university. From the sample 99 (76.16%) respondents of which 54.5% are
academics expressed their dissatisfaction with the physical conditions of their working
environment, while only 23.84 reported that they were satisfied.
4.4 SUMMARY
From the analysis of data collected from the 20 questions, 15 questions got the highest
percentage on the job dissatisfaction dimension. These questions are:
• Q4: You are paid fairly for the amount of work you do.
• Q5: Institutional policies are consistently applied to all employees.
• Q6: Institutional benefits are adequate.
• Q7: Institutional changes affected your career.
• Q8: The institution utilises individual talents.
• Q9: Prompt feedback and communication are received from management.
• Q10: Clear, achievable job goals and standards are set.
• Q11: Good work done is recognised.
74

• Q13: There are institutional awards for outstanding achievements.
• Q14: Participative decision making exists.
• Q16: The institutional culture is supportive.
• Q17: Technological changes affect your employability.
• Q18: There is a clear job description of what is expected from you.
• Q19: General social services are offered by the institution.
• Q20: The physical conditions in your work environment.
The remaining five questions the respondents reported that they were generally
satisfied with them. The following questions represented the dimension of job
satisfaction were as:
• Q1: The general institutional policies
• Q2: The ability to work independently and creativity
• Q3: You have the opportunity of voice your opinion
• Q12: Your relationship with your immediate supervisor
• Q15: Relationship with co-workers from legacy institutions
The above analysis significantly indicates that there are more factors that contribute to
the job dissatisfaction dimension than those factors that contribute to the job
satisfaction dimension. This simply draws the attention of the management to know
that more people are unhappy in the work environment as opposed to the former
institutions. This analysis contributes to the earlier introductory chapters whereby it
was stated that due to the recent merger that took place of the three legacy institutions,
the change in the paradigm of thinking, transformation and the new governance
structures, namely organograms and Programme Qualification Management (PQM)
offerings at the new institution WSU affects the job satisfaction levels of employees.
In chapter 5 the conclusions and recommendations of the researcher’s interpretations
will be discussed and presented.
75

CHAPTER 5
FINDINGS AND RECOMMENDATIONS
5. 1 INTRODUCTION
The collected data and presentation of results were presented in chapter 4. This chapter
focuses on the interpretation of the results from the data collected in order to depict the
synopsis of the results related to the objectives of the study.
5.2 DISCUSSIONS AND RECOMMENDATIONS
The discussion is structured in the same manner in which the questionnaire was
structured, namely as per job dimensions/facets.
5.2.1 Company policies/practices
With regard to this job dimension on university policies 64 (49.24%) of the respondents
reported to be dissatisfied with general rules of the university, whereas 67 (50.76%)
indicated that they were satisfied. This suggests that WSU employees have mixed
feelings about policies at the new institution and this job dimension is of vital
importance as employee’s attraction and retention depend on organisational wellness.
The institution can find itself operating on high staff turnover.
However, the second question related to this dimension, namely the consistent
application of these policies to all employees showed a significant indication that 90
(69.23%) were generally dissatisfied with the application of the policies and procedures
(64% are academics).
76

This high percentage of unhappy employees within the university means that though
there are good policies and procedures on paper there is still a lack of consistency in
application. Employees from legacy institutions are still operating within their own
legacy policies and practices since at the time of the study the harmonisation was not
yet finalised.
It is therefore recommended that senior managers should take drastic steps to ensure
that the new policies of the new institution are being executed and practised across
campuses of WSU. Directors should conduct workshops to educate employees on the
new policies and practices.
5.2.2 Remuneration and benefits
In this job facet, 72 respondents (55.39%) were not satisfied with the pay they get for
the amount of work they perform (52% being academics) and also on institutional
benefits 74 respondents (56.92%) of which 63.5% were academics, reported that they
were dissatisfied with benefits they received. After the merger of the three institutions it
has become clear that the salary scales of WSU employees in the same grade are not the
same because of the historical disparities. Nel, Van Dyk, Haasbroek, Schultz, Sono and
Werner (2004:552-553) argue that staff members will compare themselves to other
employees regarding what they put in and what they get out of an organisation. The
problem is that employees in one department, same duties, same qualifications and
same grades are still receiving different pay and benefits. WSU had to undergo salary
harmonisation as the first step in the transition. At the time of the study harmonisation
was not yet finalised, employees were still enjoying benefits from legacy institutions,
which is why the majority respondents reported to be unhappy with this job dimension.
It is recommended to parties, labour and management, to resolve this issue amicably
and to take cognisance of the fact that unhappiness regarding this factor will impact
poorly on the country’s economic and social wellbeing.
77

Organisational excellence can be attained when employees experience job satisfaction
and this dimension also forms part of organisational wellness.
5.2.3 Working environment/conditions
This job dimension is covered in the MSQ research questions 17 and 20. Respondents
for question 17 indicated dissatisfaction, namely 83 respondents (63.85%) of which
53% are academics and for research question 20 respondents also expressed their
dissatisfaction. Of these 99 respondents (76.16%) of which 54.5% are academics were
unhappy about their lecture venues, offices and general working conditions.
The environment in which people work has a tremendous effect on their level of pride
for themselves and for the work they do. This high percentage of dissatisfaction calls
for the management of WSU to review their current working environment and to make
enquiries to all staff on what need to be improved, removed or added on to create a
conducive working environment. The research respondents were from all campuses
which means that in all WSU campuses staff expressed dissatisfaction with working
environment/conditions.
It is therefore recommended that each campus should have a management committee
comprising of members from facilities, a campus director and other stakeholders, such
as labour and student representatives and one of their terms of reference should be to
establish and maintain a conducive working environment.
5.2.4 Independent work
The independent work dimension comprised of three MSQ research questions, namely
questions 2, 3, and 14, in terms of which 82 (63.08%) of the respondents, of whom 65%
were academics in the case of Question 2, and 78 (61%) of the respondents in the case
of Question 3,
78
reported that they were satisfied with the levels of independent work and creativity
allowed them. The finding indicates that the university gives its employees a certain
degree of autonomy in which to work on their own.
This holds a positive note on the side of management, and it is recommended that there
should be a sustainable collective effort from all university stakeholders. Independent
work contributes to employee retention. If employees are satisfied with this job facet it
means that the university has a great potential to retain its employees and employee
turnover will be minimal.
On the other hand, the last question on this job facet, namely question 14, reflects that
74 respondents (56.92%) of which 68.9% of the sample are academics reported to be
dissatisfied with participative decision making. This reflects that there is a huge
boundary between senior managers and general employees because the positive aspect
of independent work meant that respondents were satisfied with those statements as far
as their job entails such as lecturing. It is evident that senior management is too
ignorant to listen to the views of employees and to involve them in decision making.
From the results it is clear that participative decision style is lacking in the university.
5.2.5 Recognition for good work done
In terms of the recognition for good work done, the researcher noted that the
respondents expressed a great deal of dissatisfaction with the amount of recognition that
they received. The results indicate that 83 (63.84%) of the respondents, of whom
63.8% were academics, were dissatisfied with the amount of praise that they received
for the outstanding efforts that they exerted at WSU. The results reflect that employees
are generally dissatisfied with this aspect of their work, with especially more of the
academics reporting their dissatisfaction than did the non-academics.
79

It is therefore recommended that employees should receive acknowledgement for their
outstanding performance in the university. Employees at all levels of the organisation
want to be recognised for their achievements in their jobs.
This can be improved by promoting an employee to a senior position or sending a word
of congratulation when work is well done. A reward system attributes towards
employee attraction, motivation and retention at all organisational levels.
Future research should investigate the best criteria for recognition of outstanding
performance as this will assist in motivating and lifting employee morale and also the
degree of its transparency.
5.2.6 Work itself
This job aspect is entailed in MSQ research question 10 and 18, whereby question 10
obtained 81 respondents (62.31%) with 55.5% being academics and 75 respondents
(57.69%) of which 38 respondents (50.6%) were academics for question 18 expressed
their dissatisfaction as far as this job aspect is concerned, respectively.
Employees need to know that their work is important and meaningful. Employees
should be accountable and must own the decisions which affect their work. Due to the
recent merger that took place involving the three legacy institutions, the change in the
paradigm of thinking, transformation and the new governance structures, that is the
organogram and PQM offerings at the new institution of the WSU, as determined by the
DOE, lead to uncertainty and affect job satisfaction on all levels.
During this study the new institutional organogram was not yet populated and as a result
most employees were mostly in acting positions without clear job descriptions. This
situation caused them to be unhappy with the work itself. They are unsure of what is
expected from them. 80
5.2.7 Supervision – technical and human relations
Regarding supervision, 68.54% (89) of the respondents show that they are satisfied with
their relations with their immediate supervisors. Of these 58.4% are academics. The
institution again scores a positive response which needs to be maintained to keep
employees happy with this job aspect.
Supervision – Technical, this job aspect obtained the highest percentage of unhappy
employees. The results showed that 82 respondents (63.08%) were dissatisfied with the
manner in which their talents were being utilised by the institution.
The recommendation is that supervisors must be trained to identify employees with
special skills and utilise their staff talents and capacity more effectively. This could be
done through a skills audit, followed by a match and place process during the
transitional period in the university.
5.2.8 Relationship with co-workers
In this job dimension 56.92%, that is (74) respondents reported that they were satisfied
with their relationship with their co-workers from the three legacy institution; 50% of
them are academics. This is a positive aspect for the university as team work is what is
needed at this time of transition in order to achieve the goals and the mission of the new
university and also that of the Department of Education (DOE) who is the driver of
Higher Education Institution (HEI) mergers.
It is therefore recommended that the parties involved should maintain this relationship
and keep up the good work for the future survival of the new institution and its slogan,
“First Choice University”.
81

5.2.9 Achievements
The results reflect that 99 respondents (72.30%) of which 50% are academics reported
to be dissatisfied or very dissatisfied with the manner in which the institution deals with
outstanding achievements. In fact, this clearly shows that there are no incentives in
place to reward outstanding achievements. Reward loyalty and performance with
advancement for employees who perform the best. This could be in the form of
promotion or a new title to show your appreciation.
Therefore, it is recommended that directors should budget for incentives and rewards to
be awarded to the highest achievers. Individuals need to be motivated to aim for
outstanding achievement.
5.2.10 Institutional culture
Respondents are clear on the fact that the institutional culture is not supportive towards
them. Results showed that 74 respondents (56.93%) of which 68.9% (51) respondents
were academics, expressed dissatisfaction in this regard. Employees are still adhering
to their cultures, policies and procedure manuals obtained from their legacy institutions
and carried these forward to the new institution.
Robbins et al (2003: 384-385) asserts that a number of acquisitions consummated in the
1990s already failed and the primary cause was conflicting organisational cultures.
According to Robbins et al (2003:385), culture building starts at the top of the
organisation, once the culture is in place, practice within the organisation maintain the
culture by giving employees a set of similar experiences (shared values). One of the
functions of an organisational culture is the social glue that helps to bind the
organisation by providing appropriate standards for what employees should say and do.
82

The recommendation is that managers need to come up with strong strategies for
integrating all the different working cultures carried forward from legacy institutions.
This process is a challenge if people resist change; managers have to establish time
frames to ensure that employees are working within the framework to create a new
institutional culture.
5.2.11 Communication
The results indicated that 88 respondents (67.69%) of which 55.6% are academics
reported to be dissatisfied with the communication and feedback processes of the
university. Communication and feedback are the key role players in the survival of any
organisation.
When there is no communication system in place that organisation definitely dies.
Employees need continuous feedback on the institutional transitional progress. Such
regular feedback assists to alleviate frustration and feelings of uncertainty employees
might experience during the transitional period.
5.2.12 Job security
For this job facet, 56.93% (74) respondents expressed their dissatisfaction, of which
53% (44) respondents are academics. Job security refers to the likelihood of a job
remaining available to the current job holder, especially during transitional period of
mergers where some positions from the legacy institutions will not be on the structure
of the newly formed institution which gives the incumbents of such positions no other
options but to leave the organisation.
It is recommended that management should re-skill employees for alternative jobs
available within the new institution. They should be assured that there will be no job
losses during the transitional period.
83
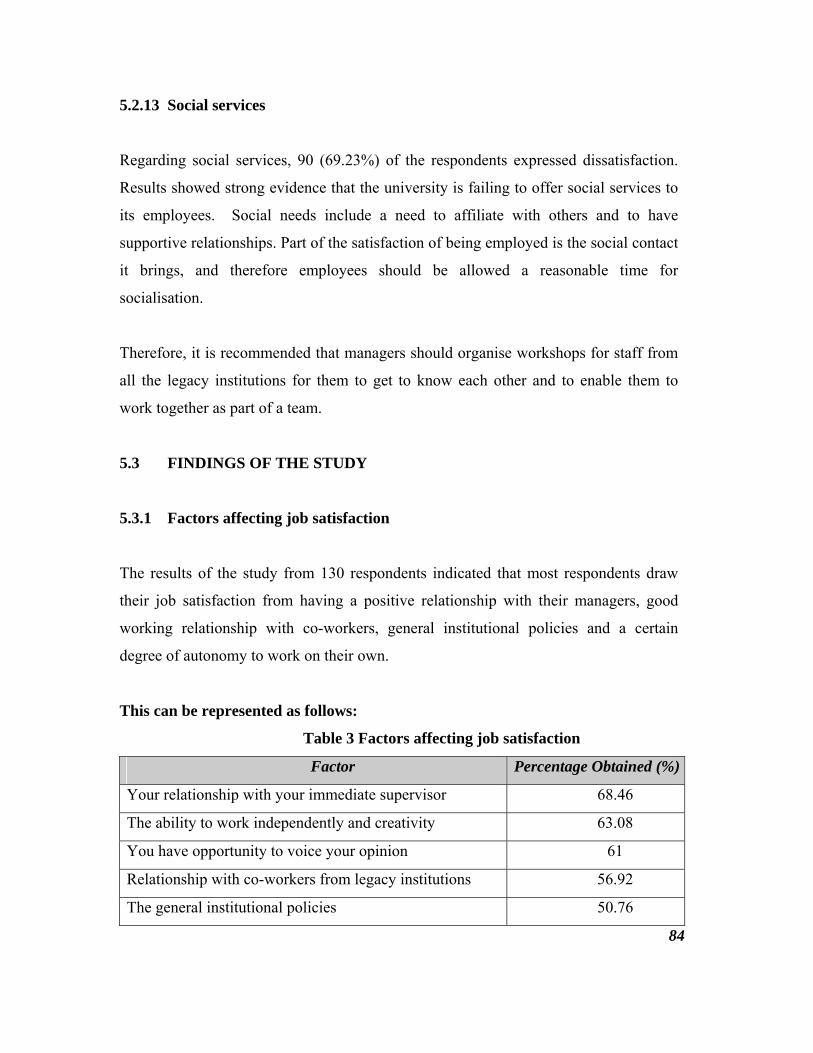
5.2.13 Social services
Regarding social services, 90 (69.23%) of the respondents expressed dissatisfaction.
Results showed strong evidence that the university is failing to offer social services to
its employees. Social needs include a need to affiliate with others and to have
supportive relationships. Part of the satisfaction of being employed is the social contact
it brings, and therefore employees should be allowed a reasonable time for
socialisation.
Therefore, it is recommended that managers should organise workshops for staff from
all the legacy institutions for them to get to know each other and to enable them to
work together as part of a team.
5.3 FINDINGS OF THE STUDY
5.3.1 Factors affecting job satisfaction
The results of the study from 130 respondents indicated that most respondents draw
their job satisfaction from having a positive relationship with their managers, good
working relationship with co-workers, general institutional policies and a certain
degree of autonomy to work on their own.
This can be represented as follows:
Table 3 Factors affecting job satisfaction
Factor Percentage Obtained (%)
Your relationship with your immediate supervisor 68.46
The ability to work independently and creativity 63.08
You have opportunity to voice your opinion 61
Relationship with co-workers from legacy institutions 56.92
The general institutional policies 50.76
84
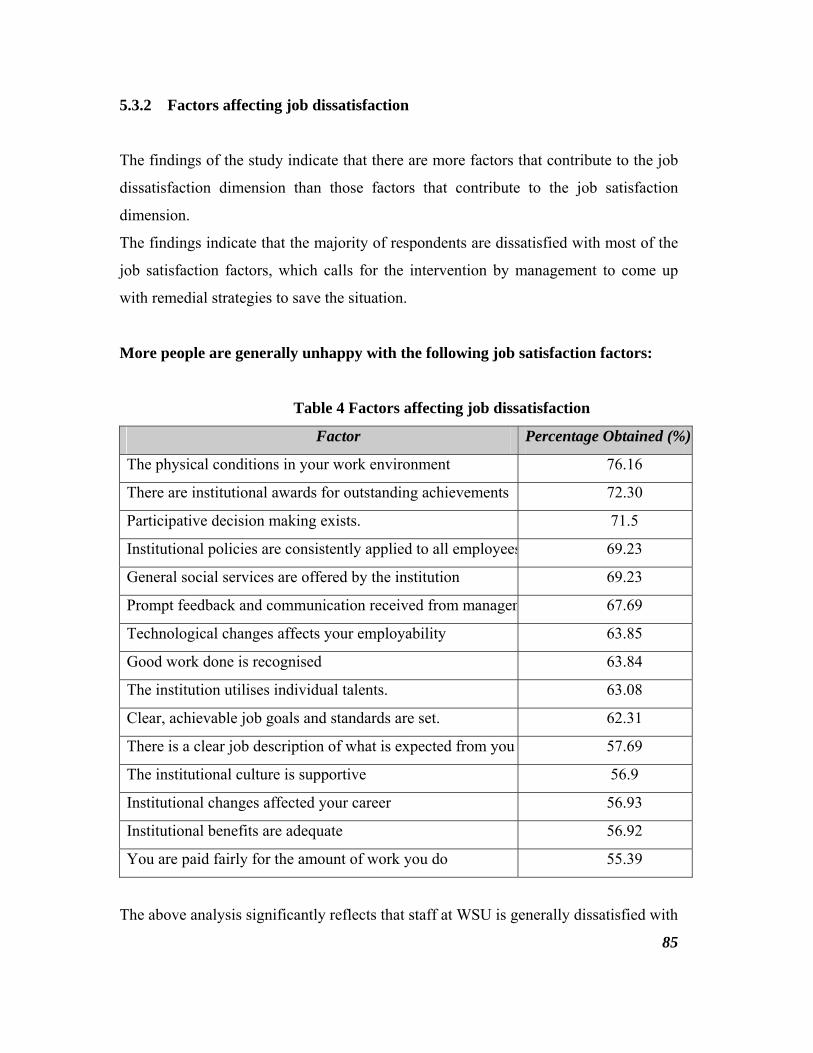
5.3.2 Factors affecting job dissatisfaction
The findings of the study indicate that there are more factors that contribute to the job
dissatisfaction dimension than those factors that contribute to the job satisfaction
dimension.
The findings indicate that the majority of respondents are dissatisfied with most of the
job satisfaction factors, which calls for the intervention by management to come up
with remedial strategies to save the situation.
More people are generally unhappy with the following job satisfaction factors:
Table 4 Factors affecting job dissatisfaction
Factor Percentage Obtained (%)
The physical conditions in your work environment 76.16
There are institutional awards for outstanding achievements 72.30
Participative decision making exists. 71.5
Institutional policies are consistently applied to all employees 69.23
General social services are offered by the institution 69.23
Prompt feedback and communication received from managem 67.69
Technological changes affects your employability 63.85
Good work done is recognised 63.84
The institution utilises individual talents. 63.08
Clear, achievable job goals and standards are set. 62.31
There is a clear job description of what is expected from you 57.69
The institutional culture is supportive 56.9
Institutional changes affected your career 56.93
Institutional benefits are adequate 56.92
You are paid fairly for the amount of work you do 55.39
The above analysis significantly reflects that staff at WSU is generally dissatisfied with
85

their jobs and management needs to attend to the factors that affect job dissatisfaction.
The research results also reflect that academic staff members are more dissatisfied than
non-academic. In all the factors that affect job dissatisfaction academic staff scored the
highest percentage. Research literature reveals that job dissatisfaction leads to a low
level of employee commitment to performance and achievement of organisational
goals, hence it is recommended that:
• If employees are satisfied with this job facet this means that the university
has a great potential to retain its employees resulting in minimal employee
turnover. Management should re-skill employees for alternative jobs
available within the new institution. They should be assured that there
will be no job losses during the transitional period.
• Managers should organise workshops for staff from all the legacy
institutions in order to get to know each other and to work together as a
team. It is therefore recommended that each campus should have a
management committee comprising of members from facilities, a campus
director and other stakeholders, such as labour and student representatives.
One of their terms of reference should be to maintain a conducive working
environment.
Furthermore, managers need to come up with strong strategies for
integrating all the different working cultures carried forward from the
legacy institutions. This process poses a challenge if people resist change;
managers have to put time frames to ensure that employees are working
within the new institutional culture.
• It is recommended that directors should budget for incentives and rewards
to be awarded to the highest achievers. Individuals need to be motivated
for their outstanding achievement. Supervisors must be trained to identify
86

employees with special skills and utilise their staff talents and capacity more
effectively. This could be done through a skills audit, followed by matching
and placing employees according to their fields of specialisation.
• The human resource department should also speed up the process of
populating the organogram of the new institution to alleviate the
uncertainty employees have about their future employment in the positions
they are acting in. It has been made clear that acting in a position does not
mean the post will automatically be given to you. The post will be
advertised and the best candidate will be offered the post.
• Employees should receive acknowledgement for their outstanding
performance in the university. Employees at all levels of the organisation
want to be recognised senior position or sending a word of congratulation
when work is well done.
• It is recommended that employees should be allowed the opportunity to be
heard through their labour representatives, they should also own
decisions made by the university as this could not only promote job
satisfaction but also become a tool for problem solving. This will also
help management to minimise cases of disputes with stakeholders for
their unanimous decisions that are always referred to the CCMA for
arbitration.
5.3.3 Recommendations for future research
The findings of this study led to the following recommendations for future research:
• It is therefore recommended that for further research, communication
effectiveness and a feedback system to employees should be management’s
priority by ensuring that this takes place effectively.
87

Communication and feedback are key to the survival of any organisation.
When there is no communication system in place that organisation will
suffer. Employees need continuous feedback on institutional transitional
progress. Regular feedback help to alleviate frustration and feelings of
uncertainty employees have during the transitional period.
• Future research should investigate strategies to manage conflict of
organisational cultures during the transitional period.
• It is also recommended that for future research, harmonisation of benefits during
the transitional period should become management’s first priority.
• Future research should investigate the best criteria for recognition of
outstanding performance as this will assist in motivating and enhancing
employee morale and also the degree of its transparency.
5.4 LIMITATIONS OF THE STUDY
• During the study period the environment was unstable due to a deadlock
between labour and management on the harmonisation of benefits of the
legacy institutions and thus respondents might have been too negative in their
responses as there is always uncertainty and indecisiveness during mergers.
• During the study period on this research some of WSU’s employees from
legacy institutions had already left the WSU and those who were still
available might have been scared to participate.
• Time constraints could also have had a negative impact on this study because
participants need time to respond and the study was conducted during the
examination period at the university.
88

• Having mentioned the limitations, the researcher is confident that they would
not adversely affect the reliability and validity of the results.
5.5 SUMMARY
The study achieved its aim of evaluating job satisfaction levels of WSU
employees during the transitional period and to determine factors that affect job
satisfaction and those that affect job dissatisfaction. Findings were discussed;
recommendations for intervention and for future research were made. Study
limitations were outlined.
89

REFERENCES
Alderfer, C. P. (1972). Existence, relatedness and growth. New York: Free Press.
Amold, H. J. & Feldman, D.C. (1996). Organizational behavior. Boston, Irwin-
McGraw Hill.
Bless, C. & Higson-Smith, C. (2000). Fundamentals of social research methods. 2nd
edition. Cape Town: Juta.
Blyton, P. & Jenkins, J. (2007). Key concepts in work: Los Angeles, Calif; London: Sage.
Brousseau, K. R. (1989). Navigating the merger transition. Journal of Organizationl
Change Management, 2 (1), 72-78.
Cooper, D. (1995). Technikons and higher education restructuring. JSTOR
Comperative Education, 31(2), 243. [ONLINE]. Available at
http://jstor.org/pass/2099649 (Accessed: 16 December 2008)
Council on Higher Education. (2000). Towards a new higher education landscape:
meeting the equity, quality and social development imperatives of South Africa in the
21st century. Pretoria: Government of South Africa, Department of Education.
Debetle, M. (2009). Merger headaches: higher learning supplement. Mail and
Guardian, October.
Delport, C.S.L. (2002). Quantitative data collection methods. In De Vos, A.S. (Ed),
Strydom, H., Fouchẻ, C.B., & Delport, C.S.L. Research at grass roots: for the social
sciences and human service professions. 2nd edition. Pretoria: Van Schaik.
90
Diaz-Serrano, L. & Cabral Vieira, J. A. (2005). Low pay, higher pay and job
satisfaction within the European Union [ONLINE]. Available at
http://ideas.repec.org/p/iza/izapds/dp 1558.html. (Accessed: 05 January 2007).
Dickson. H., Peck, E. & Smith, J. (2006). Leadership in organizational transition –
What can we learn from research evidence. Research report. [ONLINE]. Available a
http://.www.pavpub.com/pavpub/jounals/BJLPS/samples/0906sample.pdf. (Accessed:
18 June 2009).
Feistein, A.H. A study of relationships between job satisfaction and organizational
commitment among restaurants employees [ONLINE]. Available at
http://hotel.unlv.edu/pdf/job satisfaction.pdf. (Accessed 25 June 2009).
Free encyclopedia – job satisfaction – Wikipedia[ONLINE]. Available at
http://en.wikipedia.org/wiki/job-satisfaction. (Accessed 19 January 2007).
Fouchẻ, C.B. & De Vos, A.S. (2002). Quantitative research designs. In De Vos, A. S.
(Ed.), Strydom, H., Fouchẻ, C. B., & Delport, C.S.L. Research at grass roots: for the
social sciences and human service professions. 2nd edition. Pretoria: Van Schaik.
Gronhaug, K. & Ghauri, P. N. (2005). Research methods in Business Studies: a
practical guide. 3rd edition. London, FT: Prentice Hall.
Held, D. (ed.). (1991). Political theory today. Stanford, CA: Stanford University Press.
Henning, E. (2004). Finding your way in qualitative research. 1st edition. Pretoria: Van
Schaik.
Hoffman, W. M., Frederick, M. & Petry, E.S. (1989). The ethics of organisational
transformations. Connecticut: Quantum Books.
91

Hornby, A.S. (2005). Oxford advanced learners dictionary: international student’s
edition.7th edition. Oxford university press, United Kingdom.
Howell, D. C. (2002). Statistical methods for psychology. 5th edition. Belmont, CA:
Duxbury Press.
Jewell, L. R., Beavers III, C. K., Malpied, B. J. & Flowers J. L. (19900. Relationships
between levels of job satisfaction expressed by North Carolina Vocational Agriculture
teachers and their perceptions towards the agricultural education teaching profession.
Journal of Agricultural Education, 4(3), 52-57.
Judge, T. A., Thoresen, C. J. and Bono, J. E. (2001). The job satisfaction – job
performance relationship: A qualitative and quantitative review. Vol. 127(3): 376-407.
Kinicki, A.J. (2002). Work, Happiness, and Unhappiness. Mahwah: New Jersey.
Kossen, S. (1994). The human side of organization. 6th edition. New York: Harper
Collins
Lalla V. (2009). The impact of the merger on the employees of Tshwane University of technology. Thesis submitted in fulfilment of the requirements for the degree in Employee Assistance Programme, University of Pretoria, South Africa.
Leedy, P. D. & Ormrod, J. E. (2010). Practical research: planning and design. 9th
edition. New Jersey: Allyn & Bacon/Pearson Educational.
Locke, E. A. (1976). The handbook of industrial and organisational psychology. New
York: Wiley.
92
Marshall, Joe, Olphert & Anne-Maria (2009). Understanding the effects of
organizational change on staff in the NHS: a case of a local primary care trust merger
[ONLINE]. Available at http://www.allbusiness.com/marketing-
advertising/marketing/market-research-analysis/12301678-1.html. (Accessed 18
January 2010).
Mckenna, A. H. (2000). Business psychology and organizational behaviour: a
student’s handbook. 3rd edition. East Sussex: Psychology Press.
McShane, S. L. & Von Glinow, M. (2005). Organizational behavior: emerging
realities for the workplace revolution. Boston, MA: Irwin-McGraw Hill.
National Commission on Higher Education. (1996). A framework for transformation.
Pretoria: Government of South Africa, Department of Education.
Nel, P. S. van Dyk, P. S., Haasbroek, G. D., Schultz, H.B., Sono, T. & Werner, A.
(20040. Human resources management. Oxford: Oxford University Press.
NetMBA. (2005). Herzberg’s theory. Motivation-Hygiene Theory[ONLINE].
Available at http://www.aafp.org/fpm/991000fm/26.html. (Accessed 15 December
2009).
Neuman, W.L. (2000). Social research methods: qualitative and quantitative
approach. 4th edition. Boston. USA: Allyn & Bacon.
Newstrom, J. W. & Davis, K. (1997). Organizational behavior: human behavior at
work. New York: McGraw Hill.
Olivier P. (1997). Research. London: Hodder and Stoughton.
93

Paul, E. and Spector (2005). Industrial and Organisational Psychology. John Wiley &
Sons Inc.
Rainey, H.G. (2003). Understanding and managing public organizations. 3rd edition.
San Francisco: Jossey Bass.
Reddy, T. (2007). Staff perceptions of the merger between two South African higher
education. South African Journal of Higher Education 21 (3): 485-502.
Robbins, S.P (2001). Organizational behavior. 9th edition. Upper Saddle River, N.J.:
Prentice-Hall.
Robbins, S.P. Odendaal, A. & Roodt, G. (2003). Organizational behavior: global and
South African perspectives. Cape Town: Pearson Education.
Rose, M. (2001). Good Deal, Bad Deal? Job satisfaction in occupations. Sept. 2003,
Vol. 17(13): 503-530.
Rothmann, I. I. & Cooper, C. (2008). Organizational Psychology. London: Sage.
Schultz, H., Bagrain, J., Potgieter, T., Viedge, C. & Werner, A. (2003). Organizational
behavior: a contemporary South African perspective.1st edition. Pretoria: Van Schaik.
Schweiger, D., Ivancevich, F. and Power, F. (1987). Executive actions for managing
human resources before and after an acquisition. Academy of Management Executive,
Vol. 1(2), 65-76.
Seale, C., Gobo, G., Gubrium, J. F & Silverman, D. (2004). Qualitative research
practice: London: Sage.
94

Spector , P. E. (1985). Measurement of human service staff satisfaction: development
of job satisfaction survey. American Journal of Community of Psychology, (13), 693-
714.
Spector, P.E. (2005). Industrial and organisational psychology: research and practice.
4th edition. Hoboken, N.J: Wiley.
Steel, R. P. & Rentsch, J. R. (1995). Influence of cumulation strategies on the long –
range prediction of absenteeism. Academy of Management Journal, 38(6), 1616-1634.
Steyn, G. M. and Van Wyk, J. N. (1999). Job Satisfacition: perception of principals and
teachers in urban black schools in South Africa. South African Journal of Education,
19(1), 37-43.
Stuart, M. & Wayne, G. (1996). Research methodology. Kenwyn: Juta.
Stumpf, R. (2009). Mergers: Where are we now? Higher Learning Supplement. Mail
and Guardian. October.
Strydom, H. (2002). Ethical aspects of research in the human service professions. In
De Vos, A. S. (Ed.), Strydom, H., Fouche, C. B., & Delport, C.S.L Research at Grass
Roots. For the social sciences and human service professions. 2nd ed. Pretoria: Van
Schaik Publishers.
Strydom, H. (2005). Ethical aspects of research in the social and human service
professions. In De Vos, A.S. (Ed.), Strydom, H., Fouche, C, B., & Delport, C.S.L.
Research at Grass Roots. For the social sciences and human service professions. 3rd
edition. Pretoria: Van Schaik Publishers.
95

Van der Westhuizen, C. N. (2004). The games institutions play – or the impact of
university incorporation on the attitude, beliefs and perceptions of college lecturers.
South African Journal of Higher Education 18 (1), 153-164.
Wan, Y. & M. W. Peterson. (2007). A case study of a merger in Chinese higher
education: the motives, processes, and outcomes. International Journal of Educational
Development 27, 683-696.
Weiss, D.J., Dawis, R.V., England, G.W., & Lofquist, L.H. (1967). Mannual for
Minnesota Job Satisfaction Questionnaire. (Minnesota studies in vocational
rehabilitation, 22). Minnesota Industrial Relations Center.
Welman, J.C., Kruger, S.J., (2004). Research methodology for the business and
administrative sciences. 2nd edition. Pretoria. Oxford University Press Southern Africa.
Wyngaard, A. & Kapp, C. (2004). Rethinking and reimagining mergers in the further
and higher education: a human perspective. South African Journal of Higher
Education 18(1), 185-201.
96

ANNEXURE A
M E M O
TO: Vice Chancellor: WSU
FROM: Mbundu-Carter IN: WSU Exams Section
DATE: 06 October 2009
SUJECT: Consent for conducting research at WSU
I hereby tender my request for consent to conduct a research survey questionnaire. Research topic ‘A critical evaluation of job satisfaction levels during transitional period of a merger: in the case of WSU.
Responses will contribute towards the research carried out by myself for the Mini Dissertation in M’Tech: Business Administration at UNISA.
Kindly note that
• all information is purely for academic Research • the completion of questionnaires will not take more than 15 minutes • the questionnaire can be completed in one’s free time I trust that my request will receive your favourable response. Thanking you in advance. Regards
97

ANNEXURE B
UNIVERSITY OF SOUTH AFRICA
DIVISION: ECONOMIC AND MANAGEMENT SCIENCES
Dear Participant
MTech: Business Administration
Mini Dissertation: Research Project
Researcher: Irene N Mbundu-Carter (043- 702927)
Supervisor: Dr J Le Roux
I, Irene N Mbundu-Carter an M’Tech student, at UNISA, Division: Economic and Management Sciences invites you to participate in a research project entitle ‘A critical evaluation of job satisfaction levels during transitional period of a merger: the case of WSU’.
The aim of the study is to critical evaluate job satisfaction levels during transitional period of merger in the case of WSU as organizational excellence can be attained when employees experience job satisfaction.
Please note:
Your participation in this project is voluntary. You may withdraw your participation from the project at any time. Confidentiality and anonymity of records will be maintained at all times Information received will serve no other purpose than purely for academic
research.
If you have any questions or concerns about completing the questionnaire, your may contact me or my supervisor at the numbers listed above. For further information do not hesitate to contact me at 043-7029227.
This questionnaire will take you fifteen minutes to complete.
Thank you for your time and cooperation …………………………………….. Mbundu-Carter I N (Researcher) 98

ANNEXURE C
QUESTIONNAIRE
SECTION A: BIOGRAPHICAL INFORMATION
Please place an in the box that refers to you.
TAKE NOTE: Do not identify yourself or persal number anywhere in this document.
Information about yourself
1. Are you ?
An Academic staff
Non-Academic staff
2. Your gender?
Male
Female
3. Your age group?
20 years or younger
21 – 35 years old
36 - 50 years old
51 – 60 and above
4. How long have you been with the university (WSU)?
Less than a year
More than a year but less than three years
More than three years
5. At which institution were you working before merger of (WSU)?
Border Technikon
Eastern Cape Technikon
University of Transkei
Other
99
X

6. Your highest qualification?
Matric
Diploma/Degree
Honours/B’Tech
Masters +
7. At what grade are you?
Grade 5 - 6
Grade 7 - 8
Grade 9 – 10
Grade 11 – 13
Grade 14 - 17
SECTION B
QUESTIONNAIRE: MINNESOTA JOB SATISFACTION
QUESTIONNAIRE
Please place an in the block that relates to you.
Choose one option only.
These questions are rated on a Likert 4 point scale as follows:
1 = Very Dissatisfied 2 = Dissatisfied 3 = Satisfied 4 = Very Dissatisfied
100
X
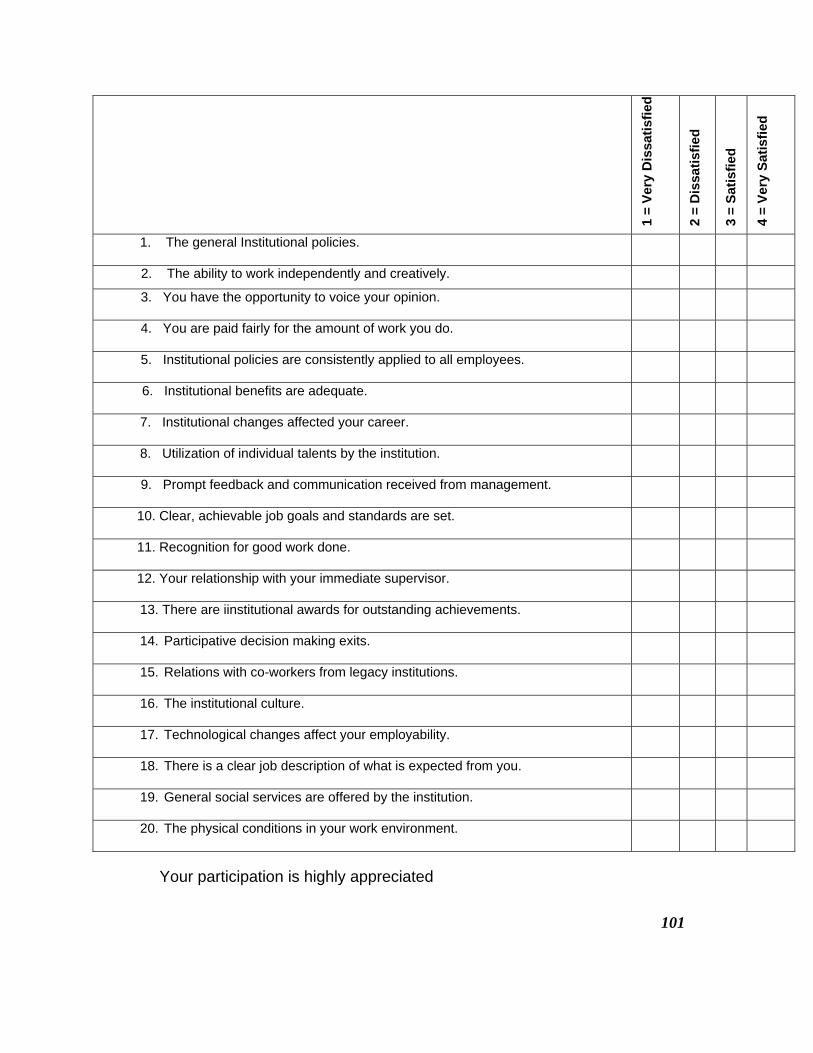
1
= Ve
ry D
issa
tisfie
d
2 =
Dis
satis
fied
3 =
Satis
fied
4 =
Very
Sat
isfie
d
1. The general Institutional policies.
2. The ability to work independently and creatively.
3. You have the opportunity to voice your opinion.
4. You are paid fairly for the amount of work you do. 5. Institutional policies are consistently applied to all employees.
6. Institutional benefits are adequate.
7. Institutional changes affected your career. 8. Utilization of individual talents by the institution.
9. Prompt feedback and communication received from management.
10. Clear, achievable job goals and standards are set.
11. Recognition for good work done.
12. Your relationship with your immediate supervisor. 13. There are iinstitutional awards for outstanding achievements. 14. Participative decision making exits. 15. Relations with co-workers from legacy institutions. 16. The institutional culture. 17. Technological changes affect your employability. 18. There is a clear job description of what is expected from you. 19. General social services are offered by the institution. 20. The physical conditions in your work environment.
Your participation is highly appreciated
101
