a cost-based ripley’s k function to assess social ...famarmu/doc/preprint-jamt2017.pdf · a...
TRANSCRIPT

1 23
Journal of Archaeological Methodand Theory ISSN 1072-5369 J Archaeol Method TheoryDOI 10.1007/s10816-017-9358-7
A Cost-Based Ripley’s K Function to AssessSocial Strategies in Settlement Patterning
Joan Negre, Facundo Muñoz & JuanAntonio Barceló

1 23
Your article is protected by copyright and
all rights are held exclusively by Springer
Science+Business Media, LLC, part of
Springer Nature. This e-offprint is for personal
use only and shall not be self-archived in
electronic repositories. If you wish to self-
archive your article, please use the accepted
manuscript version for posting on your own
website. You may further deposit the accepted
manuscript version in any repository,
provided it is only made publicly available 12
months after official publication or later and
provided acknowledgement is given to the
original source of publication and a link is
inserted to the published article on Springer's
website. The link must be accompanied by
the following text: "The final publication is
available at link.springer.com”.
A Cost-Based Ripley’s K Function to Assess SocialStrategies in Settlement Patterning
Joan Negre1 & Facundo Muñoz2 &
Juan Antonio Barceló1
# Springer Science+Business Media, LLC, part of Springer Nature 2017
Abstract Most quantitative approaches to distributional analysis in archaeology as-sume a homogeneous study surface that is amenable to easy generalisations. Thisframework has been widely used to describe settlement processes, disregarding thespatial heterogeneity inherent to geographic reality. In other words, researchers haveoften assumed that the correlation between the elements of a spatial distribution is afunction of the Euclidean distance (i.e. straight line distance) between them. Otherarchaeological studies have tested alternative measures to Euclidean distances, such ascost-based ones, both to describe optimal routes and to assess spatial autocorrelation ina point pattern. Nevertheless, until now there has been no suitable model to introducethese measures into spatial statistical equations. In order to overcome this obstacle, weapproach the implementation problem inversely by embedding the spatial pattern understudy into a Euclidean frame of reference based on its cost-distance pairwise matrix.This paper describes the application of this methodology on one of the main tools usedby archaeologists to assess settlement patterns: Ripley’s K function. We present twocase studies, covering both macroscale and mesoscale, with significant variations in theresults depending on the use of the Euclidean or cost-based approach. Data, functionsand results have been R-packaged for the sake of reproducibility and reusability,allowing other researchers to build upon our methods.
Keywords Ripley’sK function . Cost distances . Settlement patterns . Spatialheterogeneity . Euclidean embedding .Multidimensional scaling
J Archaeol Method Theoryhttps://doi.org/10.1007/s10816-017-9358-7
* Joan [email protected]
1 Laboratori d’Arqueologia Quantitativa, Departament de Prehistòria, Universitat Autònoma deBarcelona, Edifici B-Fac. Filosofia i Lletres, 08193 Barcelona, Bellaterra, Spain
2 UR AGPF, INRA, 45610 Ardon, France
Author's personal copy
Introduction
The use of spatial statistics in archaeology can be traced back to the advent ofgeographic quantitative approaches over the past several decades (Matthews 1981;Fotheringham and O’Kelly 1989; Fotheringham et al. 2000; Rogerson 2002). Thesemethods have provided a powerful toolbox for addressing many archaeological prob-lems, but their implementation has mostly rested on a trial basis. In this context,different authors have developed approaches for analysing settlement patterns usingdifferent statistical methods. Most have focused on either the correlation betweenhabitat and socioenvironmental features (such as physiographic characters, roads orirrigation canals, among others) or neighbourhood dependence between sites (Kvamme1997; Bevan and Conolly 2006; Conolly and Lake 2006; Schwarz and Mount 2006;Mayer 2006; Verhagen et al. 2010; White and Surface-Evans 2012). Both approachesare interrelated in that they aim to analyse human occupation strategies and their spatialsignatures. Nevertheless, these methodological advances have not always been inte-grated into a proper archaeological discussion (Barceló and Pallarés 1998; Church et al.1999; Lock and Harris 2000; Woodman and Woodward 2002; Philipps 2004).
Our study focuses on one of the main tools used by archaeologists to assessneighbourhood dependence: Ripley’s K function (Ripley 1976). This statistical test iswidely used to detect clustering or dispersion trends, where the null hypothesis is thatthe point process under analysis is a homogeneous Poisson distribution. Its popularity isrelated to the limitations of previous tools, such as nearest neighbour and quadrantanalyses—scale-dependent statistics that fail to detect second order processes. Ripley’sK function aims to illustrate the underlying social rationale in the settlement patternunder study against the topography of the region of study, which is assumed to be anabsolute plane (Fotheringham et al. 2000; Veen and Schoenberg 2006; Macchi 2009).Since we know that topographical reality is more complex than Euclidean space, theresults of this statistic must be linked to a confusing mix of interactions between socialand topographical sources of variability. The main limitation of the K function,therefore, is related to the assumption of an oversimplified Euclidean frame of refer-ence, in which most models use a homogeneous and undifferentiated surface, amenableto easy generalisations (Bevan and Conolly 2006; Negre 2015a).
The spatial variation in archaeological elements should be analysed as primarilystructured by complex social behaviour, as correlated to landscape variation and manyother geological and ecological mechanisms that can vary widely across locations. Thatis, two settlements separated by a short Euclidean distance can be very far away interms of social distance when there is a topographical barrier between them. Converse-ly, a long Euclidean distance does not necessarily preclude a social relationship if a roador other connection exists that reduces travel time from one site to the other. Likewise,even if the capital is relatively far away from a rural outpost, the flow of socialinteraction between them might be far greater that the social interaction with othervillages that may be nearer in the Euclidean sense.
Therefore, what appears to be random in the Euclidean space might not be within asocially built territory. Consequently, it is not possible to test socially intentional spatialaggregation of settlements at particular places against a null hypothesis based onequally spaced points; it is necessary to consider the substantial heterogeneity ofgeographic reality.
Negre et al.
Author's personal copy
In this paper, we propose a new way of applying Ripley’s K function. Instead ofpresuming spatial homogeneity in the area of study, we assume a limited amount ofaggregation and clustering that is not the consequence of intentional social activity, butthe obvious result of the pressure of physical environment. We rely then on thecalculation of an appropriate cost surface of the area under study, which accounts forthe influence of the geographic criteria on the distribution of the habitat. That sourceshould include both physical features (slope, rivers, geology, etc.) and the humaninterventions created to navigate them (mainly river crossings and roads) (Marble1996; van Leusen 2002; Wheatley and Gillings 2002; Conolly and Lake 2006;Herzog 2014b). In these conditions, we will use Ripley’s K function to characterisethe degree of settlement clustering generated by intentional social activities, going wellbeyond the clustering that can be attributed to the particular topographical variation.
Our proposal enables more exact insight of the spatial structure of settlementpatterns and its relationship with historical occupation dynamics, taking into accountthe geographic reality in which humans socialised and testing whether human decisionsregarding settlement strategies were simply adapted to the territory or if they contrib-uted to modify the territory in a particular way.
Methodological Proposal
The current algorithms for estimating the Ripley’s K function take inputs of a set ofcoordinates that are assumed to be Euclidean. It is not possible to directly input a set ofpairwise cost-based distances, which would require methodological developmentsbeyond the scope of this paper. The problem is ultimately related to the developmentof a valid complete spatial randomness (CSR) null hypothesis. When the region understudy is heterogeneous (Fig. 1a), we do not expect a uniform intensity for theunderlying point process (i.e. CSR), which is based in the Euclidean assumption. Thisapproach tries to codify that heterogeneity in a cost surface (Fig. 1b), allowing us toanalyse the clustering pattern after accounting for this source of variability. With this inmind, we conceive the implementation inversely, modelling a new spatial distributionbased on its cost-based pairwise matrix (Fig. 1c). Thanks to this approach, it is possibleto offer an alternative clustering measure by embedding the point process under studyinto a Euclidean frame of reference (Fig. 1d and e) that is more representative of thegeographic distances between its elements. The structure of this new spatial distributionis now only related to the social source of variability (i.e. human decisions about habitatlocation) for which Ripley’s K function (Fig. 1f) can be estimated for furtherinterpretation.
Alternative measures to Euclidean metrics have been widely tested in other disci-plines. In archaeology, cost-based metrics are the most usual alternative for understand-ing the optimal paths between settlements and site catchment areas (Gaffney andStančič 1991; Llobera 2000; Bell and Lock 2000; Ducke and Kroefges 2008; Herzog2014b). They have also been used as a reference for spatial autocorrelation analysiswhen stationarity cannot be assumed (Negre 2015a; Negre et al. 2016b), that is, whenthe spatial point process cannot verify constant intensity and uniform correlationdepending only on the lag vector between point pairs (Schabenberger and Gotway2005; López-Quílez and Muñoz 2009; Møller and Toftaker 2012).
A Cost-Based Ripley’s K Function to Assess Social Strategies
Author's personal copy

From a methodological perspective, the main goal of cost distances is todefine the least-cost path to reach a known point from each cell location in theoriginal raster dataset. The measurement algorithms present the length of theirregular vectors formed by a spatial distribution using the shortest weighteddistance, that is, the path with the least accumulated cost. The base where thesecalculations are performed is the cost surface; the purpose of which is to assigneach cell of a raster layer with an impedance value that quantifies the ease withwhich it can be crossed (Soule and Goldman 1972). Researchers have a widevariety of options to calculate these friction surfaces, each dependent on theirgeophysical and social assumptions (Llobera and Sluckin 2007; Herzog 2014a, b;Negre 2015a). The resulting friction model can be defined as a function f, whichdescribes for each cell of our territory a real, positive value representing thedifficulty of crossing them, that is, its cost-weighted density. Therefore, the costof a displacement dx at point x is f(x)dx, and the cost of any path in a region Acan be calculated by integrating along the pathway (Muñoz 2012; López-Quílezand Muñoz 2009). More formally, the cost of a path α : (0, 1)→ A between pointss1, s2 ∈ A will be
∫10 f α tð Þð Þα0tð Þdt
These measures verify the properties of non-negativity, symmetry and triangleinequality. Thus, we implicitly assume the hypothesis of movement isotropy, meaningthat directional slope has a minor effect on the quality of the correlation model (Llobera2000; van Leusen 2002).
Once the matrix of cost-based distances is created, a bi-dimensional pointpattern that approximates the given pairwise distances can be derived by ordina-tion techniques, such as multidimensional scaling (MDS). Specifically, thesemethods seek a Euclidean representation of a set of similarity relations betweenthe objects. In this case, the similarities are represented in the form of an n × n
Fig. 1 Cost-based and Euclidean workflows. From a spatial pattern in a heterogeneous environment (a), acost surface is derived (b). The matrix of cost-based distances (c) is computed and embedded into a Euclideanspace (d) of possibly large dimensions. This point pattern is then projected into the most relevant two-dimensional Euclidean space (e), and the standard methods for estimating the Ripley’s K function (f) areapplied. The standard Euclidean workflow jumps directly to the bi-dimensional space (e), ignoring thegeographic heterogeneity
Negre et al.
Author's personal copy
symmetrical matrix of all pairwise cost distances, which represent the geographicdistance between the settlements. Unlike other ordination methods, MDS makesfew assumptions about the nature of the data, with no linear or modal relationshipstaken for granted in the data matrix. This makes it well suited for a wide variety ofdata; any distance measure between data points is allowed (Holland 2008).Moreover, because MDS operates on dissimilarities, no statistical distributionassumptions are necessary. The result constitutes a two-dimensional point patternin the Euclidean space R2, whose clustering can be measured using the standardform of the Ripley’s K function that operates under this setting.
Package Overview
In what follows, we describe the tools used for each of the steps for the analysis. Wepackaged the data, functions and results for our case studies into an R package for thesake of reproducibility and reusability so that other researchers can build on ourmethods (Marwick 2016). The package is available at gitlab.com/famuvie/cbK(Muñoz and Negre 2017) and includes the convenience function cbK() for automaticcalculation of all results given the cost surface and a point pattern (i.e. it automates thesteps c to f in Fig. 1).
Computing the Cost Surface (Fig. 1b)
Slope is calculated by using Llobera and Sluckin’s (2007) symmetric quadratic costfunction. Soil properties are used as multipliers of cost expenditure for crossingdifferent land covers (Soule and Goldman 1972). Swampy riverbanks, peat bogsand heavy brush areas are given a value of more than 1, and known road paths,below 1. Watercourses are likewise considered as multipliers, in the range of 5 to10 for small streams and 15 for navigable rivers (Herzog 2014b). We haveconsidered that displacement along the watercourse was not common, since theriverbanks are muddy, and fast-flowing rivers overflow periodically. Roads andstrategic river crossings are placed where archaeological and written sourcesindicate. In the second case there are only small streams, with a value of 5 assignedto them. The resulting cost surface is box-plotted, and outliers (an order ofmagnitude higher) are filtered.
This step cannot be automated. It is up to the researcher to adequately represent themeaningful aspects of the problem as a cost-surface. The following steps are automat-ically taken care of by the function cbK() in our package and are described as followsfor the sake of transparency and comprehensiveness.
Computing the Cost-Distance Matrix (Fig. 1c)
We leveraged the function distmatGen() from the package geoRcb (Muñoz 2015). For agiven set of points and conductivity (i.e. inverse cost) surface, this function generates acost-based distance matrix among the points. Behind the scenes, the function uses thepackage gdistance (van Etten 2015). The use of the conductivity rather than costsurface is more convenient computationally, especially when high or infinite costs areinvolved.
A Cost-Based Ripley’s K Function to Assess Social Strategies
Author's personal copy
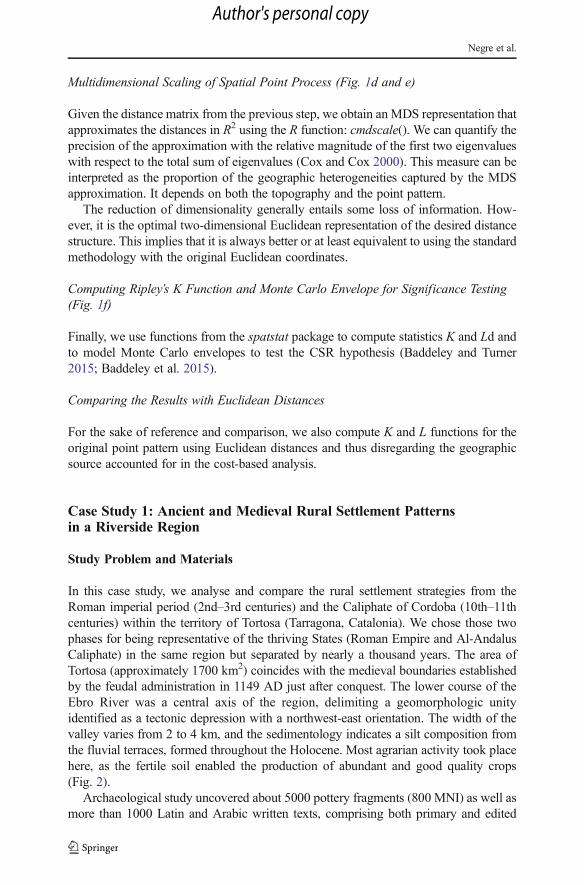
Multidimensional Scaling of Spatial Point Process (Fig. 1d and e)
Given the distance matrix from the previous step, we obtain anMDS representation thatapproximates the distances in R2 using the R function: cmdscale(). We can quantify theprecision of the approximation with the relative magnitude of the first two eigenvalueswith respect to the total sum of eigenvalues (Cox and Cox 2000). This measure can beinterpreted as the proportion of the geographic heterogeneities captured by the MDSapproximation. It depends on both the topography and the point pattern.
The reduction of dimensionality generally entails some loss of information. How-ever, it is the optimal two-dimensional Euclidean representation of the desired distancestructure. This implies that it is always better or at least equivalent to using the standardmethodology with the original Euclidean coordinates.
Computing Ripley’s K Function and Monte Carlo Envelope for Significance Testing(Fig. 1f)
Finally, we use functions from the spatstat package to compute statistics K and Ld andto model Monte Carlo envelopes to test the CSR hypothesis (Baddeley and Turner2015; Baddeley et al. 2015).
Comparing the Results with Euclidean Distances
For the sake of reference and comparison, we also compute K and L functions for theoriginal point pattern using Euclidean distances and thus disregarding the geographicsource accounted for in the cost-based analysis.
Case Study 1: Ancient and Medieval Rural Settlement Patternsin a Riverside Region
Study Problem and Materials
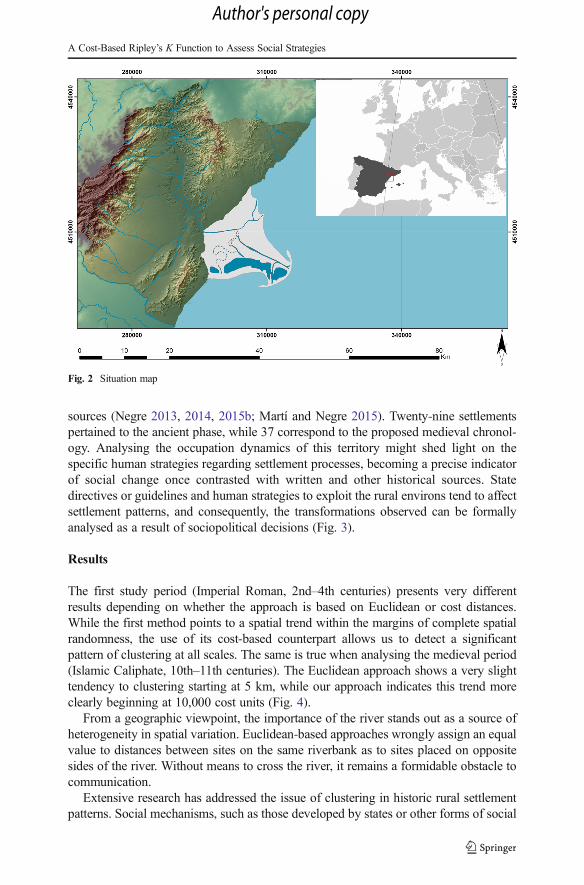
In this case study, we analyse and compare the rural settlement strategies from theRoman imperial period (2nd–3rd centuries) and the Caliphate of Cordoba (10th–11thcenturies) within the territory of Tortosa (Tarragona, Catalonia). We chose those twophases for being representative of the thriving States (Roman Empire and Al-AndalusCaliphate) in the same region but separated by nearly a thousand years. The area ofTortosa (approximately 1700 km2) coincides with the medieval boundaries establishedby the feudal administration in 1149 AD just after conquest. The lower course of theEbro River was a central axis of the region, delimiting a geomorphologic unityidentified as a tectonic depression with a northwest-east orientation. The width of thevalley varies from 2 to 4 km, and the sedimentology indicates a silt composition fromthe fluvial terraces, formed throughout the Holocene. Most agrarian activity took placehere, as the fertile soil enabled the production of abundant and good quality crops(Fig. 2).
Archaeological study uncovered about 5000 pottery fragments (800 MNI) as well asmore than 1000 Latin and Arabic written texts, comprising both primary and edited
Negre et al.
Author's personal copy
sources (Negre 2013, 2014, 2015b; Martí and Negre 2015). Twenty-nine settlementspertained to the ancient phase, while 37 correspond to the proposed medieval chronol-ogy. Analysing the occupation dynamics of this territory might shed light on thespecific human strategies regarding settlement processes, becoming a precise indicatorof social change once contrasted with written and other historical sources. Statedirectives or guidelines and human strategies to exploit the rural environs tend to affectsettlement patterns, and consequently, the transformations observed can be formallyanalysed as a result of sociopolitical decisions (Fig. 3).
Results
The first study period (Imperial Roman, 2nd–4th centuries) presents very differentresults depending on whether the approach is based on Euclidean or cost distances.While the first method points to a spatial trend within the margins of complete spatialrandomness, the use of its cost-based counterpart allows us to detect a significantpattern of clustering at all scales. The same is true when analysing the medieval period(Islamic Caliphate, 10th–11th centuries). The Euclidean approach shows a very slighttendency to clustering starting at 5 km, while our approach indicates this trend moreclearly beginning at 10,000 cost units (Fig. 4).
From a geographic viewpoint, the importance of the river stands out as a source ofheterogeneity in spatial variation. Euclidean-based approaches wrongly assign an equalvalue to distances between sites on the same riverbank as to sites placed on oppositesides of the river. Without means to cross the river, it remains a formidable obstacle tocommunication.
Extensive research has addressed the issue of clustering in historic rural settlementpatterns. Social mechanisms, such as those developed by states or other forms of social
Fig. 2 Situation map
A Cost-Based Ripley’s K Function to Assess Social Strategies
Author's personal copy
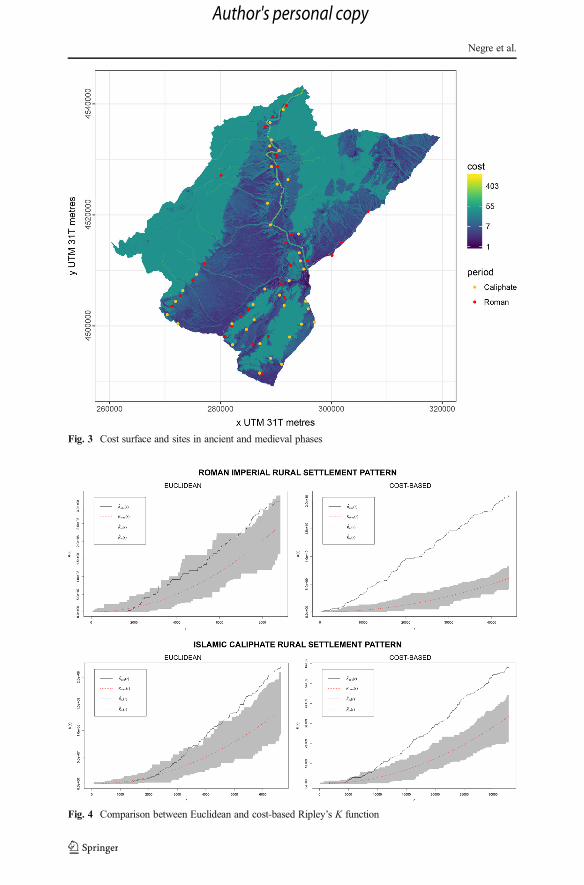
Fig. 3 Cost surface and sites in ancient and medieval phases
Fig. 4 Comparison between Euclidean and cost-based Ripley’s K function
Negre et al.
Author's personal copy

organisation, tend to act over settlement strategies within their borders in an extremelysound way. Different theoretical approaches to rural location processes have proposedthree main stages in their development: colonisation, by which the occupied territory ofa population expands; spread, through which settlement density increases with atendency to short-distance dispersal; and competition, a process that produces aregularity in settlement pattern when there are sufficient rural dwellers to compete forspace (Hudson 1969; Birch and Hudson 1970). The last stage is also considered anindicator of a fully mature settlement process on a certain scale, with settlementslocated at very similar distances from each other (Christaller 1966).
In summary, our results are concordant with the spreading phase described above, inwhich settlement multiplies and distance between sites decreases, tending to concen-trate in the most fertile areas and giving rise in some cases to cooperation strategies. Wecan infer, therefore, that the two periods analysed correspond to the thriving stages ofRoman and Islamic political structures in our territory. After an initial phase ofcolonisation of the rural landscape, where settlement patterns tend to be almost random,farmers and peasants spread and the habitat stabilises in an aggregated way. Whereasthe traditional Ripley’s function cannot identify this process, our methodologicalapproach detects the general underlying tendency towards clustering. In the sociallandscape created by the Roman city of Dertosa and later by the Islamic state ofṬurṭūša, our data reflect a phase of prosperity and growth in the rural structures duringpeace times.
Case Study 2: Hunter-Gatherer Reoccupation Patterns in a Closed Bay
Study Problem and Materials
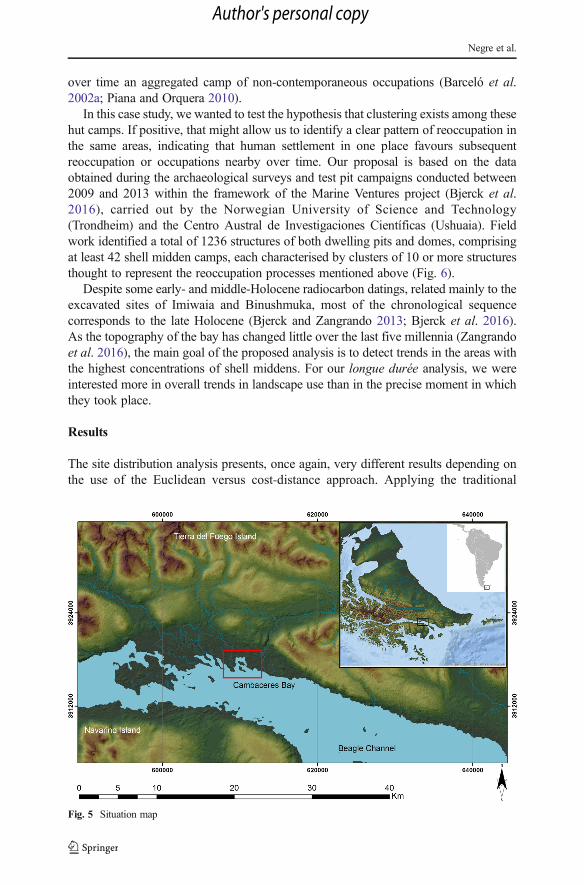
The Cambaceres Bay area (Beagle Channel, Tierra del Fuego, Argentina), with anextension of about 10 km2, has been the focus of several archaeological studies onhunter-gatherer settlement and mobility strategies (Fig. 5). Those works included fieldsurveys (Bjerck et al. 2016) and excavations (Orquera and Piana 1999; Álvarez et al.2013) as well as specific analyses on palaeogeographic reconstructions (Zangrandoet al. 2016), fishing resources (Zangrando 2009) and pinniped consumption patterns(Martinoli and Vázquez 2017), among other topics.
We centred our attention on the specific matter of hunter-gatherer mobility, which isthought to be related to aspects such as duration, functionality and reoccupation of aspecific place (Kelly 1992; Bailey 2007; Zedeño and Anderson 2010; Negre et al.2016a). In the particular case of indigenous societies settled on the Beagle Channelprior to the arrival of European expeditions, reoccupation patterns are thought to be akey aspect of mobility strategies. Archaeological methods have enabled the study ofthose patterns in the Fuegian region through the analysis of the disposition of theirhabitats. Ethnographic studies have contended that as long as a hut was still standing,reoccupation remained an option, increasing the density of the garbage deposits aroundit. These garbage mounds, also called shell middens due to the high proportion ofmarine molluscs in their composition, served both as basal shelter from climaticadversities and as a beacon for new settlements. When one of these accumulationsreached an impractical size, the group tended to raise a new adjacent hut, developing
A Cost-Based Ripley’s K Function to Assess Social Strategies
Author's personal copy
over time an aggregated camp of non-contemporaneous occupations (Barceló et al.2002a; Piana and Orquera 2010).
In this case study, we wanted to test the hypothesis that clustering exists among thesehut camps. If positive, that might allow us to identify a clear pattern of reoccupation inthe same areas, indicating that human settlement in one place favours subsequentreoccupation or occupations nearby over time. Our proposal is based on the dataobtained during the archaeological surveys and test pit campaigns conducted between2009 and 2013 within the framework of the Marine Ventures project (Bjerck et al.2016), carried out by the Norwegian University of Science and Technology(Trondheim) and the Centro Austral de Investigaciones Científicas (Ushuaia). Fieldwork identified a total of 1236 structures of both dwelling pits and domes, comprisingat least 42 shell midden camps, each characterised by clusters of 10 or more structuresthought to represent the reoccupation processes mentioned above (Fig. 6).
Despite some early- and middle-Holocene radiocarbon datings, related mainly to theexcavated sites of Imiwaia and Binushmuka, most of the chronological sequencecorresponds to the late Holocene (Bjerck and Zangrando 2013; Bjerck et al. 2016).As the topography of the bay has changed little over the last five millennia (Zangrandoet al. 2016), the main goal of the proposed analysis is to detect trends in the areas withthe highest concentrations of shell middens. For our longue durée analysis, we wereinterested more in overall trends in landscape use than in the precise moment in whichthey took place.
Results
The site distribution analysis presents, once again, very different results depending onthe use of the Euclidean versus cost-distance approach. Applying the traditional
Fig. 5 Situation map
Negre et al.
Author's personal copy

Ripley’s K function points to a spatial tendency within the margins of complete spatialrandomness, showing a very slight tendency towards clustering starting at 450 m. Onthe other hand, the use of our cost-based approach reveals a significant pattern towardsclustering at all scales. Furthermore, these results show that aggregations are very nearto each other, suggesting higher-density clustering in more circumscribed areas (Fig. 7).
From a geographic viewpoint, the coast is an important source of heterogeneity interms of spatial dependence. Euclidean-based approaches gave equal value to distancesbetween sites placed on opposite sides of the bay as to those on the same side.However, these straight-line measures are misleading from a practical point of viewgiven the restrictions on movement associated with crossing the frigid waters of theBeagle Channel—impossible without appropriate means or equipment.
Succinctly, shell mounds in this bay tend to be aggregated, thus forming largestructured midden camps. Nevertheless, excavations suggest that this aspect does notnecessarily account for social aggregation in the formation processes of the sites butsequences of individual depositions over time (Piana and Orquera 2010). The shore isan important feature where the largest structures are located, while the medium- andsmall-sized camps tend to occupy space at some distance, around the top of the lowdrumlin hills (Bjerck et al. 2016). When a nomad human population depends on marineresources for survival, vicinity to the shoreline and availability of firewood emerge as a
Fig. 6 Cost surface and sites along the Cambaceres Bay
Fig. 7 Comparison between Euclidean and cost-based Ripley’s K function
A Cost-Based Ripley’s K Function to Assess Social Strategies
Author's personal copy
basic assumption. Therefore, the clustering pattern detected for the shell midden campsin this bay cannot be solely attributed to the proximity to these features, as the entireshoreline presents the same main characteristics. Space, in this case, is not a cause but amaterial product of social processes arising from social structures by determining futurelocations. Thus, human occupation begets reoccupation and occupation ofneighbouring spaces, with evidence indicating that the generic presence of those campswas the direct cause of future settlements.
Comparing and Adjusting Approaches
The two-dimensional MDS (cfr. 2, 2.1.3) representation captures 75.7% of the vari-ability in the cost-based distances for the Roman rural settlement patterns; it rises to81.3% for the Islamic rural settlements and to 92.3% of the variability in CambaceresBay. In all cases, the cost-based distances are around an order of magnitude higher thanthe Euclidean distances. In a Euclidean space, the cost of crossing each cell of the rasteris equal to 1 per metre, but the friction surface implies an exponential increase in thatenergetic expenditure. All three examples present a main positive gradient with linearassociation. The medieval phase shows the strongest positive correlation between thevalues, meaning that the results of the two approaches will differ less drastically. Thereare no obvious outliers in the visualisation results of the samples.
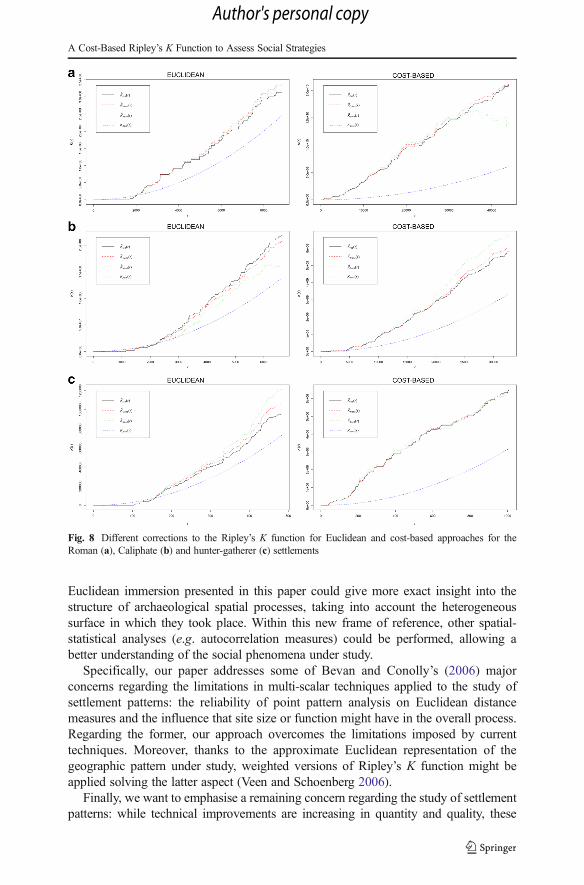
We also assessed whether any adjustments in the function are statistically necessarydue to different effects. Border, translation and isotropic-corrected estimations for bothEuclidean and cost-based approaches show no significant differences in any case study.Only the cost-based approach to the ancient Roman settlement pattern presents a slightdecrease in clustering beginning at 35,000 cost units when edge-corrected (Fig. 8).
Discussion
We present two case studies, covering both macroscale and mesoscale territories, withsignificant variations in the results according to the choice of the Euclidean versus cost-based approach. The results of the latter show a highly convincing improvement in theaccuracy and trustworthy of settlement pattern analysis. The higher the irregularity ofthe region under study, the more pronounced the divergence between the resultsgenerated by the traditional function and ours. Applying this method to a wide rangeof spatial processes and case studies should improve assessment. As we presented formicroscale geostatistics, the use of non-Euclidean metrics for spatial correlation mea-surements is not a minor aspect to take into consideration (Negre et al. 2016b). Only bymodelling the geographic source of spatial variability through the use of cost distancescan our results be used as valid indicators of the underlying social processes in asettlement pattern.
Therefore, the most important contribution of this work lies in the possibility offinally overcoming the assumption of a homogeneous and undifferentiated surface ofanalysis. Actual human landscapes offer topographically dependent movement envi-ronments, and spatially heterogeneous natural resources and social attractors thatcannot be overlooked in the historical analysis (Bevan and Conolly 2006). The
Negre et al.
Author's personal copy
Euclidean immersion presented in this paper could give more exact insight into thestructure of archaeological spatial processes, taking into account the heterogeneoussurface in which they took place. Within this new frame of reference, other spatial-statistical analyses (e.g. autocorrelation measures) could be performed, allowing abetter understanding of the social phenomena under study.
Specifically, our paper addresses some of Bevan and Conolly’s (2006) majorconcerns regarding the limitations in multi-scalar techniques applied to the study ofsettlement patterns: the reliability of point pattern analysis on Euclidean distancemeasures and the influence that site size or function might have in the overall process.Regarding the former, our approach overcomes the limitations imposed by currenttechniques. Moreover, thanks to the approximate Euclidean representation of thegeographic pattern under study, weighted versions of Ripley’s K function might beapplied solving the latter aspect (Veen and Schoenberg 2006).
Finally, we want to emphasise a remaining concern regarding the study of settlementpatterns: while technical improvements are increasing in quantity and quality, these
Fig. 8 Different corrections to the Ripley’s K function for Euclidean and cost-based approaches for theRoman (a), Caliphate (b) and hunter-gatherer (c) settlements
A Cost-Based Ripley’s K Function to Assess Social Strategies
Author's personal copy
advances are generally lacking in historical insight. Different mathematical modelshave demonstrated a number of significant relationships, both in studying settlementcorrelation with geophysical and social features and in analysing neighbouring patterns.Nevertheless, a settlement theory that generalises regularities in location strategies andspatial behaviours for different historical scenarios is still pending. In this line ofresearch, the discussions on rural settlement and spatial behaviours available in theAnnals of the Association of American Geographers are worth mentioning (Hudson1969; Rushton 1969; Birch and Hudson 1970; Haining 1982). In those works, theauthors proposed using spatial processes similar to those described for plant ecology inorder to explain changes in habitat locations over time. Social dynamics like colonisa-tion, spreading and competition, among others, were defined in terms of the distributionpatterns they generated. Other works in this same direction defend, for example, theinfluence of urban cores (i.e. sites presenting a concentration of wealth and capital,individual enrichment and class formation, among other aspects) on the spatial structureof rural periphery (Barceló et al. 2002b; Macchi 2007; Negre 2013).
Our procedure may be useful for scholars interested in discovering how a particularspatial structure of distances between settlements can condition and determine theprobability of social interaction, and how social and political factors (taxation, ex-change, war, banditry, etc.) may have affected the particular location of residential andproductive actions well beyond the limitations of topography. Social interaction ismostly a product of the social division of labour, so it is not a function only of observedspatial clustering, but of the differences and dependencies among social agents. Thispattern is linked in turn to the flow of commodities (tools, raw materials, andmanufactured goods), and information among social agents is linked through a networkof spatial dependencies. Consequently, analysing the differences and dependenciesamong the location points of social actions should give us a better idea of how socialinteraction is built and reproduced, as well as the consequences of the specific means ofinteraction adopted.
The mere spatial distribution of archaeological sites cannot be used as a surrogate foridentifying past social spaces. A point on a map signals where someone made some-thing, used something produced elsewhere, and/or exchanged something from faraway. These social actions were performed at particular places because of a socialdecision concerning the ‘best’ place, whether in terms of spatial efficiency, cost ofmobility or some other consideration. Sometimes, this cost may have depended onphysical factors (topography), but in many circumstances it would have depended onprevious decisions regarding the probabilities of social and/or political interaction thattranscend natural mobility (Barceló and Pallarés 1998). In this paper we have aimed todevelop a theoretical framework by approaching the nature of spatial aggregation andsocial clustering as an obvious consequence of social interaction. In particular, we haveexamined the spatial relationship of different activities and whether such relationshipssprang more from social decisions than the limitations imposed by the physical featuresof the land.
The development of models that capture the complex relationships between spatialregularity modalities and social processes can greatly complement ground-breakingmethodological advances, allowing a better understanding of our reality. Interdisciplin-ary teams dealing with cross-cutting problems are currently the most important meansto understand and process archaeological information.
Negre et al.
Author's personal copy
Conclusions
Our proposed pseudo-Euclidean immersion, in which we can operate with conventionalspatial-statistical tools, has proven to be a practical alternative for archaeologicalanalysis of settlement patterns. The cost-based calculations produce more reliableresults, avoiding the unrealistic assumption of a homogeneous study area. The reduc-tionist application of the classical Ripley’s function has been popular not because it fitsthe prevalent models of social dynamics but because it is the most straightforward wayto work with currently available spatial statistical software packages. Nevertheless, ourframework does not impose a conceptual model or a specific kind of interpretation.
In this paper, we have argued that a statistical index like Ripley’s K function can beused to test whether places where a particular activity took place were clustered as aresult of social decisions, independently of the natural advantages that such a place hadfrom a topographical point of view. Our proposal is based on the use of a nullhypothesis of lack of social intentionality instead of a null hypothesis of supposedspatial randomness. We have argued that this lack of human intervention does not takethe form of a pattern of Euclidean equidistance between points—it should be analysedas a pattern of distances correlated to the cost surface of that particular landscape. Inthis way, we are enlarging the usual definition of social space, considering not only thephysical features of a geographic area, but also the social uses of these features (rivers,mountains, plains, woods, etc.).
Space and time are the fundamental dimensions of change and dynamics, whichhave to be described, measured and understood. Spatial analysis involves operationswhose results depend on data locations and thus cannot be reduced to the production ofmaps from a simple manipulation of the attribute database. In that way, we call forimproving quality of spatial-statistical methods but, above all, relating those methodsand their results to a different theories and scenarios regarding the social uses of space.
Acknowledgements We wish to thank Dr. Atilio F. Zangrando and Dr. Hein B. Bjerck who allowed us touse the data from Cambaceres Bay surveys in order to illustrate the benefits of our method. The present workbenefitted from the input of Benjamin Ducke and Giancarlo Macchi who provided valuable comments to theundertaking of the method presented here. Joan Negre is part of the OCORDE Research Group, a recognisedexcellence group of the Generalitat de Catalunya [SGR2014-1454].
Funding InformationThis work was supported by Spanish Ministry of Economy and Competitiveness through the project
Genesis of the medieval nobility: fortresses and land control in northeastern Iberian Peninsula between the 8thand the 11th centuries [HAR2015-63661-P; MINECO-FEDER], directed by Dr. Ramon Martí at theUniversitat Autònoma de Barcelona. Facundo Muñoz’s research is partially supported by a research grantfrom the Spanish Ministry of Economy and Competitiveness (MTM2016-77501-P). Funding from Spanishministerial projects Ethnicity in the Past [HAR2012-31036] and Computational simulation of sociohistoricaland technological change phenomena during the Neolithic [HAR2016-76534-C2-1-R] are also acknowledged.We also thank Meggan Harris at Rosetta Manuscripts for her helpful comments and English language editing.
References
Álvarez, M., Fiore, D., Tivoli, A., Salvatelli, L., Saletta, M. J., & Briz, I. (2013). Variabilidad de actividadeshumanas en momentos recientes de la ocupación del canal Beagle (Tierra del Fuego): el caso deLanashuaia XXI. In A. F. Zangrando, R. Barberena, A. Gil, G. Neme, M. Giardina, L. Luna, C.
A Cost-Based Ripley’s K Function to Assess Social Strategies
Author's personal copy
Otaola, S. Paulides, L. Salgán, & A. Tivoli (Eds.), Tendencias teórico-metodológicas y casos de estudioen la Arqueología de la Patagonia (pp. 559–568). Altuna: Buenos Aires.
Baddeley, A., & Turner, R. (2015). Spatstat: An R package for analyzing spatial point patterns. Journal ofStatistical Software, 12(6), 1–42.
Baddeley, A., Rubak, E., & Turner, R. (2015). Spatial point patterns: methodology and applications with R.London: Chapman and Hall/CRC Press.
Bailey, G. (2007). Time perspectives, palimpsests and the archaeology of time. Journal of AnthropologicalArchaeology, 26, 198–223.
Barceló, J. A., & Pallarés, M. (1998). Beyond GIS: the archaeology of social spaces. Archeologia eCalcolatori, 9, 47–80.
Barceló, J. A., Piana, E. L., & Martinioni, D. (2002a). Archaeological spatial modelling: a case study fromBeagle Channel (Argentina). In G. Burenhult & J. Arvidsson (Eds.), Archaeological informatics: pushingthe envelope (pp. 351–360). Oxford: Archaeopress.
Barceló, J. A., Pelfer, G., & Mandolesi, A. (2002b). The origins of the city. From social theory toarchaeological description. Archeologia e Calcolatori, 13, 41–63.
Bell, T., & Lock, G. R. (2000). Topographic and cultural influences on walking the ridgeway in laterprehistoric times. In G. R. Lock (Ed.), Beyond the map. Archaeology and spatial technologies (pp. 85–100). Amsterdam: IOS Press.
Bevan, A., & Conolly, J. (2006). Multiscalar approaches to settlement pattern analysis. In G. R. Lock & B.Molyneaux (Eds.), Confronting scale in archaeology: issues of theory and practice (pp. 217–234). NewYork: Springer.
Birch, B., & Hudson, J. C. (1970). On a theory for rural settlement. Annals of the Association of AmericanGeographers, 60(3), 610–614.
Bjerck, H. B., & Zangrando, A. F. (2013). Marine ventures: comparative perspectives on the dynamics of earlyhuman approaches to the seascapes of Tierra del Fuego and Norway. The Journal of Island and CoastalArchaeology, 8(1), 79–90.
Bjerck, H. B., Zangrando, A. F., Breivik, H. M., Piana, E., & Negre, J. (2016). Marine ventures: theCambaceres Surveys (2009, 2011–2013). Trondheim: Norwegian University of Science and Technology.
Christaller, W. (1966). Central places in Southern Germany. New Jersey: Prentice Hall.Church, T., Brandon, R. J., & Burgett, G. R. (1999). GIS applications in archaeology: method in search of
theory. In K. L. Wescott & R. J. Brandon (Eds.), Practical applications of GIS for archaeologists. Apredictive modelling toolkit (pp. 135–155). Boca Ratón: CRC Press.
Conolly, J., & Lake, M. (2006). Geographical information systems in archaeology. Cambridge: CambridgeUniversity Press.
Cox, T. F., & Cox, M. A. (2000). Multidimensional Scaling. Boca Ratón: Chapman & Hall/CRC Press.Ducke, B., & Kroefges, P. (2008). From points to areas: constructing territories from archaeological site
patterns using and enhanced Xtent model. In A. Posluschny, K. Lambers, & I. Herzog (Eds.), Layers ofperception. Proceedings of the 35th international conference on computer applications and quantitativemethods in archaeology (pp. 245–251). Bonn: Dr. Rudolf Habelt.
Fotheringham, A. S., & O’Kelly, M. E. (1989). Spatial interaction models: formulations and applications.London: Kluwer Academic.
Fotheringham, A. S., Brunsdon, C., & Charlton, M. (2000). Quantitative geography: perspectives on spatialdata analysis. London: Sage.
Gaffney, V., & Stančič, Z. (1991). GIS approaches to regional analysis: a case study of the island of Hvar.Oxford: Oxbow Books.
Haining, R. (1982). Describing and modeling rural settlement maps. Annals of the Association of AmericanGeographers, 72(2), 211–223.
Herzog, I. (2014a). A review of case studies in archaeological least-cost analysis. Archeologia e Calcolatori,25, 223–239.
Herzog, I. (2014b). Least-cost paths—some methodological issues. Internet Archaeology, 36. https://doi.org/10.11141/ia.36.5.
Holland, S. (2008). Non-metric Multidimensional Scaling (MDS). Technical Report, University of Georgia.Hudson, J. C. (1969). A location theory for rural settlement. Annals of the Association of American
Geographers, 59(2), 365–381.Kelly, R. L. (1992). Mobility/Sedentism: Concepts, Archaeological Measures and Effects. Annual Reviewers
of Anthropology, 21, 43-66.Kvamme, K. L. (1997). Ranters corner: bringing the camps together, GIS and ED. Archaeological Computing
Newsletter, 47, 1–5.
Negre et al.
Author's personal copy
Llobera, M. (2000). Understanding movement: a pilot model toward the sociology of movement. In G. R.Lock (Ed.), Beyond the map. Archaeology and spatial technologies (pp. 65–84). Amsterdam: IOS Press.
Llobera, M., & Sluckin, T. J. (2007). Zigzagging: theoretical insights on climbing strategies. Journal ofTheoretical Biology, 249, 206–217.
Lock, G. R., & Harris, T. (2000). Introduction: return to Ravello. In G. R. Lock (Ed.), Beyond the map.Archaeology and spatial technologies (pp. XIII–XXXV). Amsterdam: IOS Press.
López-Quílez, A., & Muñoz, F. (2009). Geostatistical computing of acoustic maps in the presence of barriers.Mathematical and Computational Models, 50(5–6), 929–938.
Macchi, G. (2007). Geografia dell’incastellamento. Firenze: All’Insegna del Giglio.Macchi, G. (2009). Spazio e misura. Introduzione ai metodi geografici-quantitativi applicati allo studio dei
fenomeni sociali. Siena: Edizioni dell’Università.Marble, D. F. (1996). The human effort involved in movement over natural terrain: a working bibliography.
Technical Report: Ohio State University, Department of Geography.Martí, R., & Negre, J. (2015). Assentaments i espais agraris medievals al Baix Ebre i al Montsià: una anàlisi
diacrònica. Estudis d’Història Agraria, 27, 67–89.Martinoli, M. P., & Vázquez, M. (2017). Pinniped Capture and Processing: A Comparative Analysis from
Beagle Channel (Tierra del Fuego, Argentina). In: M. Mondini, A. Muñoz, P. Fernández (Eds.),Zooarchaeology in the Neotropics. Cham: Springer.
Marwick, B. (2016). Computational reproducibility in archaeological research: basic principles and a casestudy of their implementation. Journal of Archaeological Method and Theory, 24(2), 424–450.
Matthews, J. A. (1981). Quantitative and statistical approaches to geography. Oxford: Pergamon.Mayer, C. (2006). Making use of distances: estimating parameters of spatial processes. In M. W. Mehrer & K.
L. Wescott (Eds.),GIS and archaeological site location modeling (pp. 137–153). Boca Ratón: CRC Press.Møller, J., & Toftaker, H. (2012). Geometric anisotropic spatial point pattern analysis and cox processes.
Research Report Series, Department of Mathematical Sciences, Aalborg University.Muñoz, F. (2012). Geoestadística en regiones heterogéneas con distancia basada en el coste. PhD Thesis,
Universitat de València.Muñoz, F. (2015). geoRcb: An extension of package geoR that Works with Cost-based Distances. R package
v.1.7–6. https://github.com/famuvie/geoRcb.Muñoz, F., & Negre, J. (2017). cbK: Cost-based clustering analysis of human settlements. R package v.1.0.
Zenodo. https://doi.org/10.5281/zenodo.250466.Negre, J. (2013). De Dertosa a Turtusa. L’extrem oriental d'al-Tagr al-A’là en el context del procés
d’islamització d’al-Andalus. PhD Thesis, Universitat Autònoma de Barcelona.Negre, J. (2014). La cerámica altomedieval de Tortosa (siglos VII-X). Una primera clasificación y análisis
interpretativo. Arqueología y Territorio Medieval, 21, 39–67.Negre, J. (2015a). Non-Euclidean distances in point pattern analysis: anisotropic measures for the study of
settlement networks in heterogeneous regions. In J. A. Barceló & I. Bogdanovic (Eds.),Mathematics andarchaeology (pp. 369–382). Boca Ratón: CRC Press.
Negre, J. (2015b). Producciones cerámicas en el distrito de Turtusa entre la Antigüedad Tardía y el MundoIslámico (siglos VI–XII). In M. J. Gonçalves & S. Gómez-Martínez (Eds.), 10th international congress onmedieval pottery in the Mediterranean. Silves: Cámara Municipal.
Negre, J., Álvarez, M., Pal, N., Bas, M., Briz, I., Lacrouts, A. & Lasa, A. (2016a). Spatial variability andoccupation intensity in hunter-gatherer sites from the atlantic coast of Tierra del Fuego, Argentina.Arqueología Iberoamericana, 32, 37–51.
Negre, J., Muñoz, F., & Lancelotti, C. (2016b). Geostatistical modelling of chemical residues on archaeolog-ical floors in the presence of barriers. Journal of Archaeological Science, 70, 91–101.
Orquera, L. A., & Piana, E. L. (1999). Arqueología de la región del canal Beagle (Tierra del Fuego, RepúblicaArgentina). Buenos Aires: Sociedad Argentina de Antropología.
Philipps, C. (2004). GIS and landscape analysis, or the cart before the horse? Internet Archaeology, 16.https://doi.org/10.11141/ia.16.4.
Piana, E. L., & Orquera, L. A. (2010). Shell midden formation at the Beagle Channel (Tierra del Fuego,Argentine). In D. Calado, M. Baldia, & M. Boulanger (Eds.), Monumental questions: prehistoricmegaliths, mounds and enclosures (pp. 263–271). Oxford: Archaeopress.
Ripley, B. (1976). The second-order analysis of stationary point processes. Journal of Applied Probability, 13,255–266.
Rogerson, P. A. (2002). Statistical methods for geography. London: Sage.Rushton, G. (1969). Analysis of spatial behavior by revealed space preference. Annals of the Association of
American Geographers, 59(2), 391–400.
A Cost-Based Ripley’s K Function to Assess Social Strategies
Author's personal copy
Schabenberger, O., & Gotway, C. (2005). Statistical methods for spatial data analysis. Boca Ratón: CRCPress.
Schwarz, K. R., & Mount, J. (2006). Integrating spatial statistics into archaeological data modeling. In M. W.Mehrer & K. L. Wescott (Eds.), GIS and archaeological site location modeling (pp. 154–174). BocaRatón: CRC Press.
Soule, R. G., & Goldman, R. F. (1972). Terrain coefficients for energy cost prediction. Journal of AppliedPhysiology, 32(5), 706–708.
van Etten, J. (2015). gDistance: distances and routes on geographical grids. R Package, version 1.1–9.https://CRAN.R-project.org/package=gdistance.
van Leusen, M. (2002). Pattern to process: methodological investigations into the formation and interpretationof spatial patterns in archaeological landscapes. PhD Thesis: University of Groningen.
Veen, A., & Schoenberg, F. P. (2006). Assessing spatial point process models using weighted K-functions:analysis of California earthquakes. Lecture Notes in Statistics, 185, 293–306.
Verhagen, P., Kamermans, H., van Leusen, M., & Ducke, B. (2010). New developments in archaeologicalpredictive modelling. In T. Bloemers, H. Kars, A. van der Valk, & M. Wijnen (Eds.), The culturallandscape and heritage paradox (pp. 431–444). Amsterdam: Amsterdam University Press.
Wheatley, D., & Gillings, M. (2002). Spatial technology and archaeology. The archaeological applications ofGIS. London: Taylor & Francis.
White, D. A., & Surface-Evans, S. (2012). Least cost analysis of social landscapes. Archaeological casestudies. Salt Lake City: The University of Utah Press.
Woodman, P. E., & Woodward, M. (2002). The use and abuse of statistical methods in archaeological sitelocation modelling. In S. Poppy, D. Wheatley, & G. Earl (Eds.), Contemporary themes in archaeologicalcomputing. Oxford: Oxbow.
Zangrando, A. F. (2009). Is fishing intensification a direct route to hunter-gatherer complexity? A case studyfrom the Beagle Channel region (Tierra del Fuego, southern South America). World Archaeology, 41(4),589–608.
Zangrando, A. F., Ponce, J. F., Martinoli, M. P., Montes, A., Piana, E., & Vanella, F. (2016). Palaeogeographicchanges drove prehistoric fishing practices in the Cambaceres Bay (Tierra del Fuego, Argentina) duringthe middle and late Holocene. Environmental Archaeology. https://doi.org/10.1080/14614103.2015.1130888.
Zedeño, M. N. & Anderson, D. (2010). Agency and politics in hunter-gatherer territory formation. Revista deArqueología, 23, 10-29.
Negre et al.
Author's personal copy