a cooperative agreement between nasa and the uab school of
TRANSCRIPT
September 28, 2010
San Antonio, TX
Leslie Ain McClure, PhD
Associate Professor of Biostatistics
University of Alabama at Birmingham
Successfully Integrating NASA Data Into an
On-going Public Health Study and Linking
NASA Environmental Data with a National
Public Health Cohort Study to Enhance
Public Health Decision Making
2
Outline
• What is REGARDS?
• Objectives of current funding
• Progress to date
• Goals for the next year

3
Why REGARDS?Racial Disparity
Race/Ethnic Relative Risk
White Reference (1997)
• Higher prevalence of
hypertension and
diabetes, and lower
SES are clearly
contributing to excess
• But:
– Only 30% to 50% of the
excess is mediated by
these factors
– Why is there a higher
incidence of
hypertension and
diabetes in AA?

4CDC: Atlas of Stroke Mortality, 2003
http://www.cdc.gov/cvh/maps/strokeatlas/atlas.htm
United States, Total Population Ages 35+
Stroke Death Rates, 1991 - 1998
• 10 published
hypothesized causes
– AA higher in south
– Death certificate coding
– Higher case fatality
– Poorer risk factor profile
– Environmental factors
– Lower SES
– Poor quality health care
– Genetic factors
– Lifestyle choices
– Infection rates
• Little data evaluated
contributions
Why REGARDS?Regional Disparity

5
Unlikely
Causes
Uninvestigated
Causes
Co
din
g o
f D
eath
Cer
tifi
cate
s
Pro
port
ion
of
AA
Ca
se F
ata
lity
Pre
va
len
ce o
f C
VD
Ris
k F
act
ors
En
vir
on
men
tal
Ex
po
sure
s
SE
S D
iffe
ren
ces
Qu
ali
ty o
f H
ealt
h C
are
Gen
etic
Fa
ctors
Infe
ctio
n R
ate
s
Lif
esty
le C
hoic
es
Why REGARDS?Regional Disparity

6
REGARDS
• Provides national
– Stroke incidence data
– Stroke risk factor description
• Understand relationship between risk factors and
stroke incidence
• Assess potential
– Mediation of racial and geographic disparities associated
risk factor adjustment
– Differential racial and geographic susceptibility in role of
risk factors (interactions)
• Provide repository (including genetic materials)

7
REGARDS
• Addition of longitudinal measures of cognitive function
– Epidemiology of cognitive change among a national cohort
– Cognitive function as subclinical measure of vascular health
• Ancillary studies (partial list)
– Myocardial infarction endpoints
– Environmental exposures through satellite measures
– Renal endpoints
– Bone fracture endpoints
– Racial disparities in caregiver burden
– Additional analytes (phosphorous, sodium, etc).
8
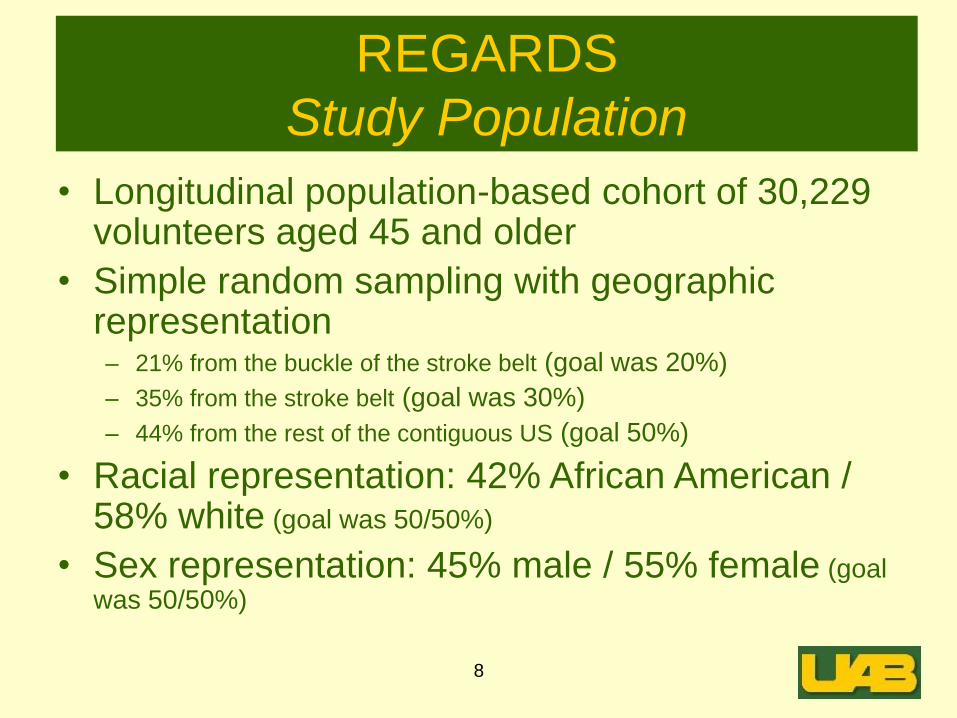
• Longitudinal population-based cohort of 30,229 volunteers aged 45 and older
• Simple random sampling with geographic representation– 21% from the buckle of the stroke belt (goal was 20%)
– 35% from the stroke belt (goal was 30%)
– 44% from the rest of the contiguous US (goal 50%)
• Racial representation: 42% African American / 58% white (goal was 50/50%)
• Sex representation: 45% male / 55% female (goal was 50/50%)
REGARDS
Study Population

9
White
African American
N = 30,229
REGARDS
Study Population

10
Overarching Goals of this Research
• Characterize PM2.5, solar insolation, and land surface temperature using NASA satellite observations, EPA ground level data, and other national datasets
• Link these data with data from REGARDS, in order to assess whether these factors impact cognitive decline
• Disseminate the dataset to end-users for decision making through CDC WONDER
11
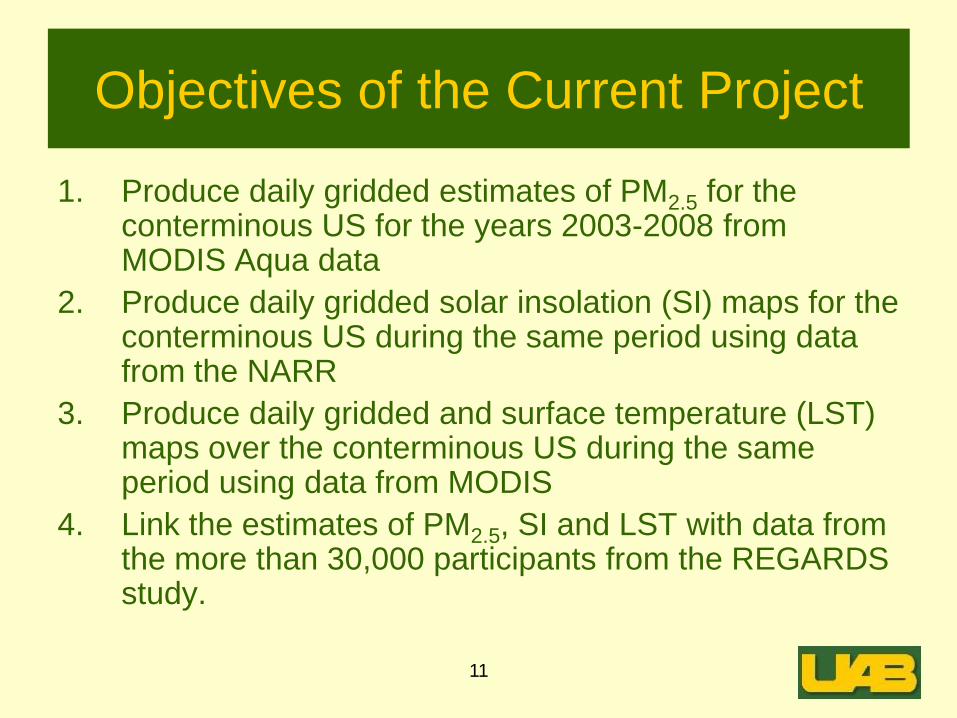
Objectives of the Current Project
1. Produce daily gridded estimates of PM2.5 for the conterminous US for the years 2003-2008 from MODIS Aqua data
2. Produce daily gridded solar insolation (SI) maps for the conterminous US during the same period using data from the NARR
3. Produce daily gridded and surface temperature (LST) maps over the conterminous US during the same period using data from MODIS
4. Link the estimates of PM2.5, SI and LST with data from the more than 30,000 participants from the REGARDS study.

12
Objectives (continued)
5. Determine whether exposure to PM2.5 or SI is related to the rate of cognitive decline among participants in the REGARDS study, independent of other known risk factors for cognitive decline
6. Examine the relationship between the estimated PM2.5
and SI and other health-related conditions among REGARDS participants, including diminished kidney function, hypercholesterolemia, hypertension, and inflammation (CRP)
7. Deliver daily gridded environmental data sets (PM2.5, SI and LST) to CDC-WONDER for the 2003-08 period

13
Why study cognition in a stroke cohort?
• Cognitive decline is a co-primary outcome
in the REGARDS study
– Prevention of cognitive decline is a huge
public health concern, with a rapidly aging US
population
– Little data available about cognitive function
over time, particularly in African Americans
– Has been shown to be a sub-clinical marker
of vascular disease
14
Year 1 Activities
• Excellent progress made on each objective of the research
– SI data are processed and linked to REGARDS
– LST data are processed and ready to be linked to REGARDS
– PM2.5 is in process
– Cognitive data are almost complete
– Discussions regarding data transfer to CDC WONDER are underway

15
SI Data
• Early in the study, the decision was made
to use the NLDAS dataset for solar
insolation, rather than the NARR
– More data are available both temporally and
spatially
• Hourly data
• 12 km grid

16
SI Data
• Data were processed:– Data were downloaded from NLDAS for the period
between 2003 and 2008
– Daily maximum, minimum and average temperature were computed for each of 120,000 grid cells
– Daily total solar insolation computed for the same 120,000 grid cells
• Data were linked– Each REGARDS participant was assigned a grid cell
based on their longitude and latitude, and 4 tables containing the daily data for each measurement for each participant was produced
17
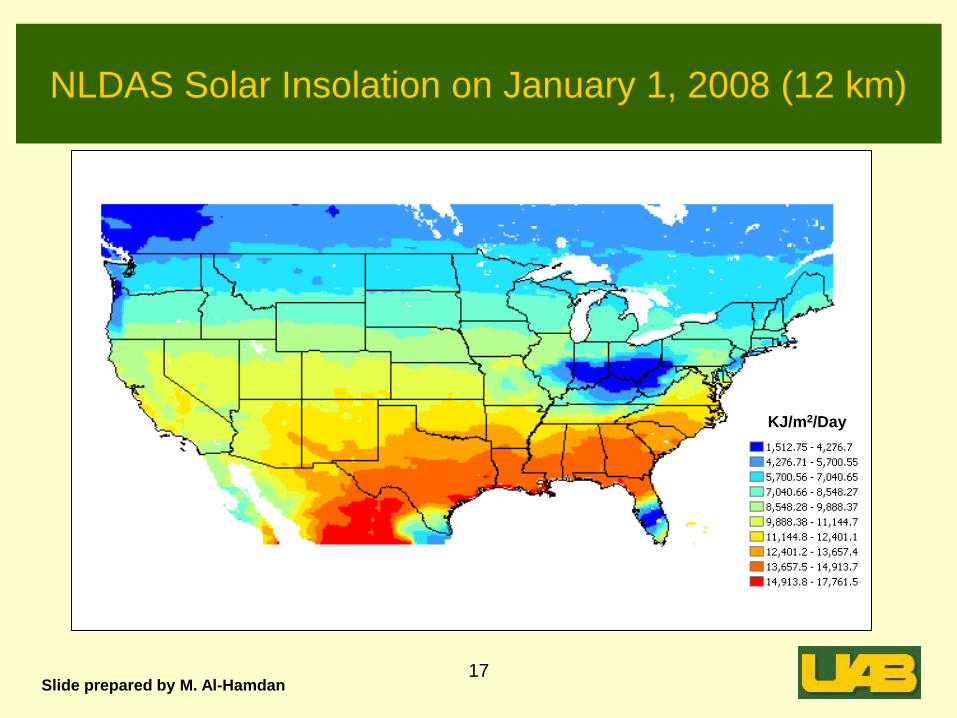
NLDAS Solar Insolation on January 1, 2008 (12 km)
KJ/m2/Day
Slide prepared by M. Al-Hamdan

18
SI Data
REGARDS
Participant
ID
County State Day1
Solar
Insolation
Day2
Solar
Insolation
. . . . . .
. .
Day365
Solar
Insolation
1
2
3
.
.
.
.
.
30,200

19
LST Data
• Land surface temperature data were obtained by an algorithm merging the Aqua and Terra MODIS satellite data measurements
– Aqua has a daytime pass (approximately 1:30 p.m.), but is missing when there is cloud cover
– Terra provides has a morning pass (approximately 10:30 a.m.)
• Algorithm developed to fill in missing Aqua values using time-adjusted Terra values

20
LST Data
• This algorithm (developed by Bill Crosson,
Gina Wade & Sarah Hemmings) utilizes
season-specific estimates of average
differences between Aqua and Terra
measurements
– The missing values are then filled in with the
Terra values, adjusted by the season-specific
difference

21
Aqua LST (1:30 PM) Terra LST (10:30 AM)
Merged LST
16 June 2003
Slide prepared by W. Crosson, G. Wade & S. Hemmings

22
LST Data
• Data were processed:
– Aqua and Terra MODIS data were downloaded for the period between 2003 and 2008
– Data were “mosaiced” as described above
• Manuscript describing the methods is in process, pending preparation of nighttime LST
• Data linkage is forthcoming
– Dataset will be prepared in a similar format to the SI data

23
PM2.5 Data
• MODIS AOD data are used to generate a smooth PM surface based on a complex algorithm– Estimate PM based on regression equation
– Bias adjustment procedure
– Smoothing algorithm
• A new relationship between AOD and PM has recently been published, which is defined by EPA region and season– This requires translation of the EPA regions to
longitude and latitude
24
PM2.5 Data
• Data processing is in progress:
– Programming of the new regression equation for each region and season has been completed
• Next steps:
– Run the updated algorithm that simultaneously estimates the PM2.5, performs the bias adjustment, and generates the smoothed surfaces
– Link these estimates with the REGARDS participants
25
Cognitive Data
• The REGARDS Working Group on Cognitive
Decline has spent many hours discussing how to
define “decline” in the cohort
• Several options are available, and the datasets
will be ready in mid-October
– Six Item Screener (SIS): Coarse screener of cognitive
function
– Word List Learning: Measures memory and learning
– Animal Naming & Letter F: Measure executive
function

26
Planned Year 2 Activities
• Complete the production of the PM2.5 data
• Complete the linkage of each of the environmental datasets with REGARDS participants
• Begin analyses of the linked data– Cognitive decline and solar insolation (Kent
dissertation)
– Cognitive decline and PM2.5
• Prepare REGARDS datasets for secondary analyses
• Continue to work with CDC WONDER to ensure a smooth data transfer

27
Major Deliverables & Time Schedule
• Major deliverables and time schedule:
– Solar insolation dataset (ahead of schedule)
• Preparation and production: 10/2009-6/2010
• Linkage with cognitive decline data: 7/2010-
12/2010
• Analysis: 1/2011-9/2011
– LST dataset (ahead of schedule)
• Preparation and production: 10/2009-6/2010
• Linkage with cognitive decline data: 7/2010-
12/2010

28
Major Deliverables & Time Schedule
• Major deliverables and time schedule:
– PM2.5 dataset (on schedule)• Preparation and production: 10/2009-3/2011
• Linkage with cognitive decline data: 4/2011-9/2011
• Analysis: 10/2011-3/2012
– Analysis of secondary outcomes: 10/2011-6/2012
– Transition to end-users, through CDC WONDER: 4/2012-9/2012
– Preparation of final research report: 4/2012-9/2012

29
Task
Year 1 Year 2 Year 3
Q1 Q2 Q3 Q4 Q1 Q2 Q3 Q4 Q1 Q2 Q3 Q4
1a Production of LST data set
1b Production of solar
insolation data set
1c Production of PM2.5 data set
2a Linkage of LST and
cognitive decline data sets
2b Linkage of insolation and
cognitive decline data sets
2c Linkage of PM2.5 and
cognitive decline data sets
3a Analysis of insolation and
cognitive decline
3b Analysis of PM2.5 and
cognitive decline
4a Analysis of insolation and
secondary outcomes
4b Analysis of PM2.5 and
secondary outcomes
5 Transition to end-users
through CDC WONDER
6 Final research report

30
Collaborators
UAB
Kalyani Peri
Shia Kent
George Howard
NASA
Dale Quattrochi
Douglas Rickman
CDC
Sigrid Economou
USRA
Mohammad Al-Hamdan (co-PI)
William Crosson
Maury Estes
Sue Estes
Gina Wade
Sarah Hemmings