a contrarian look at hcit vendors
TRANSCRIPT
Steven A. Rubis [email protected] (202) 778-4780
Stifel Equity Trading Desk (800) 424-8870
Industry Update
Initiating Coverage on HCIT: CERN, CPSI, MDRX; A Contrarian Look at HCIT Vendors
We are initiating coverage on the enterprise EHR (electronic health record) industry with a negatively biasedHold rating, including Hold ratings on the shares of Cerner, Allscripts, and CPSI. We believe enterprise EHRsrepresent a structurally flawed business model set to face significant disruption over the next several years.
Overview. The flaws of the enterprise EHR industry revolve around: exorbitant costs, lengthy implementation cycles, lack
of interoperability, and ROI. We believe enterprise EHR vendors focus on transactional infrastructure for healthcare, a
commodity product. We believe the healthcare industry is shifting away from basic technology infrastructure investment
towards performance based technology investment driven by value-add software-enabled services (SES). We see the
shift manifesting itself via an unbundling of the EHR, whereby traditional vendors will dominate transactional functions, but
third party innovators will lead the value-added services.
The Unbundling of the EHR. The purpose of driving EHR adoption across the U.S. healthcare system revolved around
building a digital transactional foundation to facilitate the modernization of healthcare. We believe an unbundling of the
EHR is underway, whereby the services within an EHR are segmented into one of two areas: (1) transactions and (2)
value-added services. For the most part, we believe traditional EHR vendors focus on the transactional functions, and
have just begun to focus on value-add services. While some vendors are developing population health management and
revenue cycle solutions, we believe the core opportunity for these vendors revolves around the core transaction business.
The Triple Aim of Worry. Our industry outlook revolves around three questions: (1) can technology bend the national
health expenditure cost curve? We think bending the NHE cost curve represents the fundamental presupposition of digital
health and HCIT. (2) Will HCIT spend increase or decrease? We believe clients seek low cost, and agile solutions. We
believe performance driven solutions will put pricing pressure on non-performance driven solutions. (3) Will tech
investment revolve around performance? We believe operating margin pressure, reimbursement pressure, et al., will force
clients to make investment decisions according to performance not simply adoption.
The Shift from Infrastructure Driven to Performance Driven Technology Investment. We believe the unbundling of
the EHR revolves around the ongoing shift from infrastructure and mandate driven technology investment towards
performance driven technology investment. We believe the healthcare system yearns for agile, low cost solutions. We
believe the value proposition associated with high cost adoption and lengthy implementation cycles will erode over the
next several years. In our view, the rip and replace market opportunity will be extremely slow to develop and a new value
proposition (low cost and agile) will be required to gain share.
We See Drivers of Valuation, Such As Backlog, Recurring and Visible Revenue, As Negatives. Many investors view
massive backlogs as a positive for EHR vendors because such backlogs create recurring and visible revenue streams. In
our view, stability alone does not drive a valuation premium, but significant sustainable growth driven by a proprietary
technological advantage does. We believe massive backlogs present a problem for EHR vendors because backlogs
represent an impediment to innovation, and prevent a pivot to evolving growth opportunities.
Important Themes. The DoD EHR contract, competition from Apple and Google, athenahealth’s inpatient product
development efforts, digital health/mHealth, and the increasing importance of driving performance improvement and
operational efficiency throughout the continuum of care.
April 6, 2015
Internet & MediaDigital Healthcare
Stifel does and seeks to do business with companies covered in its research reports. As a result, investors shouldbe aware that the firm may have a conflict of interest that could affect the objectivity of this report. Investorsshould consider this report as only a single factor in making their investment decision.
All relevant disclosures and certifications appear on pages 69 - 72 of this report.

Introduction
The Fundamental Question of Digital Healthcare. We believe investors can use one fundamental question as a way to distinguish between entities with significant long-term viability versus the possibility of looming uncertainty. The fundamental question of digital healthcare asks, “Does this business exist in and of itself without government sponsored mandates associated with Healthcare IT?”
In our view, the application of this question allows an investor to distinguish between infrastructure versus data driven and outcomes based services. We believe digital healthcare can be divided into two groups: traditional vendors, which are for the most part focused on infrastructure solutions and software-enabled services (SES) entities focused on developing data driven and outcomes based services. In our view, investors are currently willing to pay a premium for businesses with solid recurring and visible revenue streams despite unimpressive revenue growth. We believe valuation premiums should be driven by the underlying proprietary technological advantage of a specific company or platform. In our view, while businesses levered to government mandates may provide perceived stability, we believe government mandates do not represent a significant competitive advantage in a performance driven environment. We believe a government mandate environment creates an “I am in the business of making sure you need to do business with me” environment. A major problem we see with these mandates is that hospitals and physicians are not necessarily required to meet each component of each mandate. Often times, hospitals and physicians only need to meet a smaller portion of the entire mandate. Ironically, mandate deadlines are often delayed because of vendor, hospital, or physician complaints.
The Digital Healthcare Business Model Triptych. We believe digital healthcare and HCIT businesses can be segmented into three categories: (1) Businesses focused mostly on helping clients achieve government mandates (e.g., Meaningful Use, etc.). (2) Businesses focused on helping clients achieve mandates, but also providing some form of software-enabled services (SES). (3) Businesses primarily focused on developing software-enabled services, which utilize data, analytics, and technology to drive meaningful ROI and deliver meaningful performance improvement and operational efficiencies throughout the care continuum. In our view, the traditional electronic health records (EHR) vendors fall in categories one and two. We believe athenahealth and other small, nimble innovators fall into category three. We believe a key characteristic of category three revolves around revenue models with a risk-sharing component. Additionally, these businesses are attractive because these services help pay for themselves through meaningful performance.
The Unbundling of the EHR. We believe the functions of the EHR can be divided into two segments: transactional services, and value-add software-enabled services. In our view, transactional services are those parts of the EHR, which facilitate the day-to-day transactions of a hospital system. These services are typically aimed at meeting a government mandate and ensure regulatory requirement. We believe value-add software-enabled services are focused on those areas of an EHR that can drive performance improvement or operational efficiency across the care continuum. In our view, the industry is evolving to a point where smaller, more nimble innovators are able to develop solutions in the value-add software-enabled service area. Significant backlogs and government mandates keep traditional EHR vendors focused on the transactional services of the EHR, despite recent efforts to develop both revenue cycle management and population health management solutions.
Page 2
Internet & MediaDigital Healthcare April 6, 2015

Industry Is Shifting from Infrastructure to Software-Enabled Services (SES). We believe the digital healthcare industry and HCIT industry are undergoing a shift from a focus on infrastructure driven technology investment to performance driven technology investment. Given the government mandate environment driven by HITECH/ARRA, Meaningful Use, ICD-10, etc., we believe hospitals and physicians alike are experiencing installation fatigue. These numerous government mandates seem to have created an environment of incomplete foundational systems perpetuating a continuous cycle of upgrades and new module implementations. In our view, the high cost and long implementation cycles associated with traditional HCIT solutions are driving frustration. Based on industry commentary, we believe hospitals and physician groups recognize the value of a digitized healthcare system, but remain frustrated by a lack of low cost, and agile solutions. We believe many entities are likely to keep the technology systems in which they have invested. However, we believe these entities seek tools that can optimize and improve the function of their core technology investment. In our view, a robust rip and replace cycle will not materialize until a vendor introduces a product driven by low installation costs and short implementation cycles, which would mark a significant departure from the norms of traditional enterprise EHR vendors.
Which Is the Better Foundation, EHRs or Revenue Cycle Management? Given our view that the industry continues to shift towards performance driven technology investment, we believe a key question facing companies revolves around what makes for a better foundation, the EHR or revenue cycle management? In our view, the performance driven models of revenue cycle management are better positioned to succeed in a performance driven technology investment environment.
We think that the shift to SES creates a faceoff between EHRs and revenue cycle management. Many investors believe that because Epic and Cerner (CERN, Hold, $72.77) are the industry standards and that these vendors will dominate the industry in the future. We disagree with this view because, in our view, Epic and Cerner represent a standard around facilitating the baseline transaction. In our view, just because these platforms represent a standard for baseline transaction does not necessarily mean these same vendors will dominate the growth areas of the future (e.g., revenue cycle, population health management, telehealth, cost transparency, second opinions, precision medicine, or even patient engagement). Based on industry sources, we believe these vendors currently dominating the industry are not likely to lead consolidation of innovative SES companies because of their significant backlogs. In our view, traditional HCIT vendors, while they are now talking about new offerings around revenue cycle and even population health, remain focused on system installations and maintenance. We believe that these traditional HCIT vendors need to pivot or adjust their value propositions away from installation and maintenance to driving performance to dominate the industry in the future.
At the same time, we believe that health reform places a greater importance on efficient and automated RCM solutions. In our view, the next five to 10 years will be characterized by a greater emphasis on data and outcomes driven solutions providing meaningful ROI via performance improvement and operational efficiencies. In our view, EHR vendors will have trouble navigating the shift, and we do not believe their current dominance will translate to an SES environment.
Page 3
Internet & MediaDigital Healthcare April 6, 2015

We do believe that revenue cycle vendors are uniquely positioned to thrive in a shift from transactions (EHRs) to SES. Ultimately, RCM represents the foundation of software-enabled services, especially when the RCM solution revolves around automating and codifying billing and reimbursement via technology on a unified system. Additionally, the risk-based revenue model of RCM is better positioned to compete in a SES environment compared to the traditional installation and maintenance revenue model of EHRs. Finally, due to the analytic and data driven nature of RCM, we believe it provides a strong foundation from which to build an eco-system of SES solutions via internal development, partnership, or acquisition.
Closed/Introverted Systems or Open Application Programming Interfaces (APIs). Another major controversy of healthcare technology revolves around the philosophy associated with the underlying technology. We believe the majority of traditional EHR vendors operate closed / introverted systems consisting of home grown technology solutions. For the most part, these vendors avoid acquiring or partnering with third party innovators for technology solutions. There are other vendors, typically cloud-based, who welcome open collaboration and support an ecosystem of technology innovators through application programming interfaces. We note that most companies can easily develop, maintain, and operate open APIs, but many do a poor job of this in reality. In our view, companies operating with an open and collaborative infrastructure will be best positioned for the shift to performance based technology investment.
We believe our views are illustrated in two ways. First, when most HCIT vendors acquire technology they do not typically re-write the code of the acquired technology or fully integrate it into their core system. In our view, examples include several acquisitions done by Allscripts and most recently Cerner’s acquisition of Siemens Health Services. The second proxy for system openness revolves around interest in collaborating with third party developers. In our view, the most collaborative vendors are athenahealth via More Disruption Please and Allscripts via the Allscripts Developer Program.
The Triple Aim of Worry
Our industry outlook revolves around three questions: (1) can technology bend the national health expenditure cost curve? We think bending the NHE cost curve represents the fundamental presupposition of digital health and HCIT. (2) Will HCIT spend increase or decrease? We believe clients seek low cost, and agile solutions. We believe performance driven solutions will put pricing pressure on non-performance driven solutions. (3) Will tech investment revolve around performance? We believe operating margin pressure, reimbursement pressure, et al., will force clients to make investment decisions according to performance not simply adoption.
Question 1: Can Technology Bend the National Health Expenditure Cost Curve? We believe the answer is yes. In our view, the fundamental presupposition of investing in and developing healthcare IT products and digital healthcare products revolves around driving performance and efficiency throughout the continuum of care. In our view, new technologies should facilitate a more efficient and productive health care complex in the United States. Furthermore, we believe that the ability to bend the cost curve will ultimately determine the success and long-term viability of healthcare IT and digital healthcare. We doubt that the U.S. healthcare complex will continue to increase IT spending if the underlying technology provides no cost reduction, performance improvement, or operational efficiency.
Page 4
Internet & MediaDigital Healthcare April 6, 2015
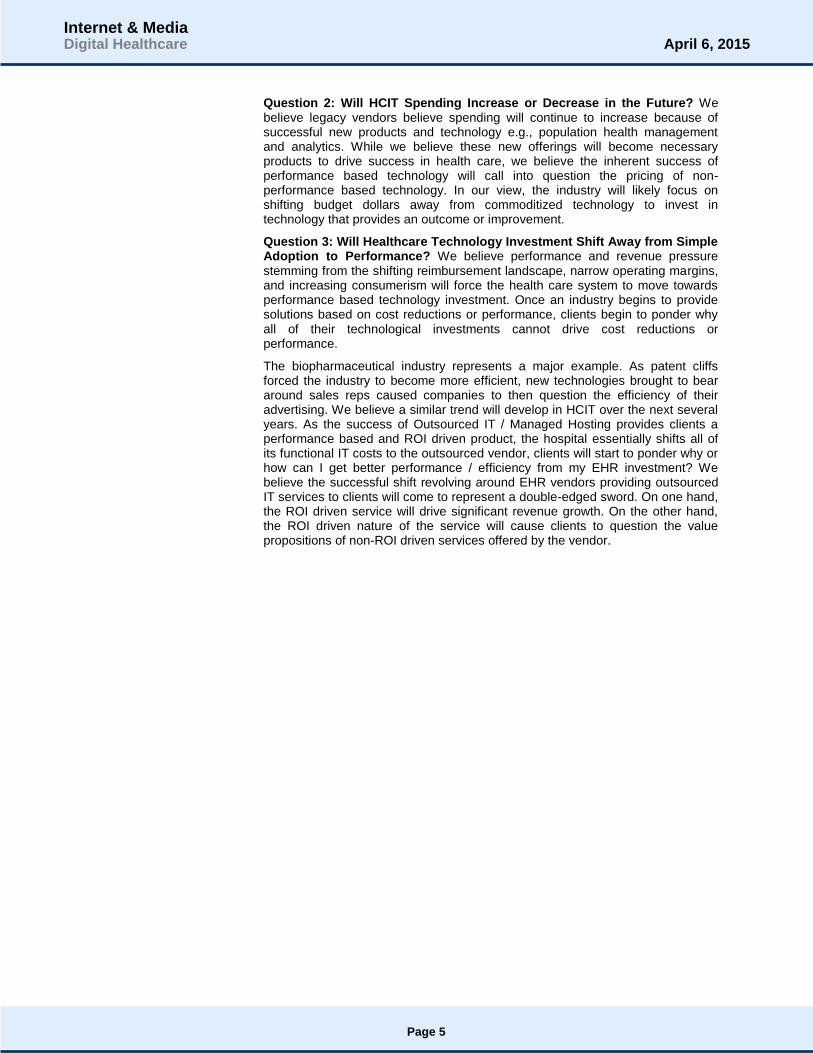
Question 2: Will HCIT Spending Increase or Decrease in the Future? We believe legacy vendors believe spending will continue to increase because of successful new products and technology e.g., population health management and analytics. While we believe these new offerings will become necessary products to drive success in health care, we believe the inherent success of performance based technology will call into question the pricing of non-performance based technology. In our view, the industry will likely focus on shifting budget dollars away from commoditized technology to invest in technology that provides an outcome or improvement.
Question 3: Will Healthcare Technology Investment Shift Away from Simple Adoption to Performance? We believe performance and revenue pressure stemming from the shifting reimbursement landscape, narrow operating margins, and increasing consumerism will force the health care system to move towards performance based technology investment. Once an industry begins to provide solutions based on cost reductions or performance, clients begin to ponder why all of their technological investments cannot drive cost reductions or performance.
The biopharmaceutical industry represents a major example. As patent cliffs forced the industry to become more efficient, new technologies brought to bear around sales reps caused companies to then question the efficiency of their advertising. We believe a similar trend will develop in HCIT over the next several years. As the success of Outsourced IT / Managed Hosting provides clients a performance based and ROI driven product, the hospital essentially shifts all of its functional IT costs to the outsourced vendor, clients will start to ponder why or how can I get better performance / efficiency from my EHR investment? We believe the successful shift revolving around EHR vendors providing outsourced IT services to clients will come to represent a double-edged sword. On one hand, the ROI driven service will drive significant revenue growth. On the other hand, the ROI driven nature of the service will cause clients to question the value propositions of non-ROI driven services offered by the vendor.
Page 5
Internet & MediaDigital Healthcare April 6, 2015

Part 1: The Current State of Healthcare Digitization
The digitization of the U.S. healthcare system remains a major focal point for the healthcare technology industry. We note that over the past five to seven years adoption of electronic health records (EHRs) has increased substantially. Currently, we believe the industry is entering a phase whereby digital infrastructure investments shift from a transactional focus to a focus on software-enabled services (SES) that facilitate performance improvement and operational efficiencies throughout the care continuum. We are skeptical that the traditional healthcare IT (HCIT) players will lead the shift toward SES. At the same time, we believe SES innovators must focus on developing solutions that truly drive meaningful ROI in order to sustain possible hospital IT budget wallet share gains.
We believe healthcare digitization develops through four stages. The focus of Stage 1 is developing a basic digital infrastructure that moves the clinical back-office (medical records, billing, etc.) from pen and paper to digital. Stage 2 is driven by the development of new digital healthcare technologies that leverage the wireless infrastructure digitizing the clinical front-office (communication with patients, scheduling, monitoring, diagnostics, et al.). The focus of Stage 2 is on
developing digital healthcare solutions that facilitate performance improvement and operational efficiencies throughout the care continuum. In our view, an important aspect of Stage 2 lies in driving consumer adoption and closing the digital healthcare eco-system. We believe without patient buy-in, the digitization of healthcare will likely begin and end with the government mandates driving the digitization of the clinical back-office.
In Stage 3, companies will begin to integrate developments achieved in Stage 1 and Stage 2. At this point, we believe companies will focus on how to close the eco-system in terms of their respective business models. We believe the best positioned companies are those that can help facilitate the development of a software-enabled services (SES) eco-system that can be successfully integrated with the digital foundation to drive performance improvement and operational efficiencies.
Lastly, in Stage 4, constituents will begin to focus on driving meaningful analysis off of the vast data created by a digitized healthcare system. We believe Stage 4 represents the greatest opportunity for the digitization of healthcare, but also represents the least defined opportunity, as we remain in the relatively early innings of healthcare digitization. Additionally, we believe that in Stage 4 the U.S. healthcare system will operate more rationally by favoring the highest quality clinicians and care givers who operate at the lowest cost. We provide an illustration of “The Four Stages of Healthcare Digitization” in Exhibit 1.
Exhibit 1: U.S. Healthcare Digitization Development Cycle
Source: Stifel
The Four Stages of Healthcare DigitizationTechnological
FocusBeneficiaries Investment Area(s)
Stage 1• Digitizing the Clinical Back-Office
Stage 2• Digitizing the Clincial Front-Office
Stage 3• Integration
Stage 4• Monetization
EMRs/EHRsRCMsPBMsCROs
Digital Healthcare
Combines Stage 1 and
Stage 2
Entire Healthcare Supply Chain
CliniciansHospitals
ConsumersClinicians
Closes the Eco-system by
Integrating Stage 1 and Stage 2
Constituents
Focus on Leveraging the Value of
Data
Healthcare IT Companies
Digital Healthcare Companies
In Stage 3, we believe Healthcare IT companies will acquire Digital Healthcare
companies. Additionally, Digital Healthcare companies will become IPO candidates
The Entire Eco-system: Healthcare IT
Digital Healthcare TechnologyManaged Care Organizations (MCO)s
Pharmaceuticals
Page 6
Internet & MediaDigital Healthcare April 6, 2015

In Exhibit 2, we illustrate the current state of digitization across the U.S. healthcare system. According to The Office of the National Coordinator for Health Information Technology (ONC), electronic health record (EHR) adoption is high and has increased substantially since the implementation of incentive payments as part of HITECH / ARRA, which facilitated EHR adoption.
We note that office-based physicians exhibit significant adoption of EHRs. According to ONC, roughly 78% of office-based physicians utilize any EHR system, and 48% utilize a basic EHR system. Additionally, only 53% of primary care physicians utilize an EHR that meets the criteria of a basic EHR system. Hospital adoption of EHRs seems to be stronger than that of office-based physicians. According to ONC, roughly 94% of hospitals use a certified EHR, and roughly 59% of hospitals utilize a basic EHR system. In 2013, roughly 89% of Critical Access Hospitals (CAHs) used an EHR system with roughly 49% of CAHs planning to install or upgrade an EHR system within a year. In 2012, roughly 90% of Federally Qualified Health Centers (FQHCs) adopted an EHR system, and 50% had adopted an EHR with basic capabilities.
While government incentive programs have driven increased adoption, the digital foundation of healthcare remains incomplete. We believe the digital infrastructure of U.S. healthcare is incomplete for several reasons: (1) adoption is close to but not ubiquitous, (2) the current foundation was developed around transactions based on government mandates, rather than true performance improvement and operational efficiency, and (3) ongoing interoperability issues.
Exhibit 2: Hospital and Physician Electronic Health Record (EHR) Adoption
Source: The Office of the National Coordinator for Health Information Technology (ONC) Office of the Secretary, United States Department of Health and Human Services and Stifel
We believe this shift from the transactional systems and solutions of an EHR to the software-enabled services is analogous to the shift from Internet service providers (ISPs) to algorithmic search. When the Internet first developed, Internet service providers represented the main access point to the Internet. The core value proposition of these businesses revolved around simply connecting the user with the Internet; essentially the value of ISPs resided in the ability to facilitate a transaction. We believe the traditional EHR systems are the ISPs of today’s digital healthcare infrastructure. These systems provide a sound transactional foundation, but were not designed for the next generation of solutions, which use technology, data, and analytics to drive performance improvements and operational efficiencies in the hospital.
Currently, we see the advent and development of several SES verticals as analogous to the Internet Portal era. Internet portals facilitated data aggregation and compilation of important data in a central place and facilitated a customized or personalized experience. We believe population health management and
11% 12%
17%
22%
28%34%
40%
48%
18% 17% 17%21%
24%29%
35%
42%48%
51%
57%
72%78%
2001 2002 2003 2004 2005 2006 2007 2008 2009 2010 2011 2012 2013
Office-Based Physicians
Any EHR System Basic System
9% 12%16%
28%
44%
59%
72%
85%
94%
2008 2009 2010 2011 2012 2013
Non-Federal Acute Care Hospitals
Basic System Certified EHR
Page 7
Internet & MediaDigital Healthcare April 6, 2015

precision medicine are good examples within digital healthcare. Ultimately, the digitization of healthcare seeks to move toward algorithmic search.
We note that algorithmic search seemingly unified the Internet, making information capture a somewhat frictionless process. The value lies in delivering the right information at the right time to the right user. In our view, the algorithmic search environment represents the Holy Grail for the digitization of healthcare. Healthcare’s version of algorithmic search revolves around an integrated eco-system of SES providers who can deliver the right care at the right cost to the right person. More importantly, the system utilizes these technology systems to ensure patients are directed to the highest quality care givers operating at the lowest price. We illustrate the ISP to algorithmic search transition in Exhibit 3.
Exhibit 3: Electronic Health Records (EHRs) and the Shift to Algorithmic Search
Source: Stifel
In our view, the shift toward software-enabled services provides an opportunity for innovators to focus on specific tasks that unbundle, yet optimize the EHR. We believe that traditional HCIT vendors seek to provide platforms that provide all services possible. A major problem with this view lies in the slow pace of innovation and closed / introverted systems offered by traditional HCIT vendors. Many of these solutions are primarily focused on developing software solutions that digitize transactions in order to help facilitate Meaningful Use attestation.
While we recognize hospitals seem to prefer a single vendor for healthcare technology infrastructure, we believe the view stems from the high cost of infrastructure and need for information fidelity, rather than true technological advantage. Based on industry discussions, we note that within the past six months hospitals have been more interested in working with smaller innovators than say 18 months ago.
We believe hospitals will increasingly look to work with innovators that can provide services that can optimize the core EHR investment. These SES offerings will focus on unbundling the EHR, by developing best-in-breed solutions around a single friction point. The key in maximizing the long-term value of the opportunity will lie in SES innovators developing solutions that produce meaningful ROI through performance improvement and operational efficiencies. We believe that if hospital IT budgets are going to continually increase, the majority of the increased spend will be allocated to SES solutions versus building and maintaining the core EHR infrastructure.
What The Development of Algorithmic Search Means for EHRs
Value Lies in Connecting to
Information
Internet Service Provider
Value Lies in Data Aggregation in a Central Location
Customized Experience
Value Lies in Delivery of Right Info, At Right Time, To Right Spot Configurable Experience
Algorithmic SearchInternet Portals
Move Away From Transactional Value to Software Enabled Services That Drive Value and Optimize
EHRs Today:Value Lies in Transactions
Population Health Management Precision Medicine Will EHR Be Able to Facilitate?
Development of a Healthcare Internet Ability To Drive Care to Best Quality at Lowest Price
Page 8
Internet & MediaDigital Healthcare April 6, 2015

In Exhibit 4, we provide an illustration of what the unbundling of the EHR might look like. The illustration identifies the key areas of the EHR that can be optimized by third party innovators. We believe the inherent functions of an EHR or digitized health system fall into two categories: transactions and value-add software-enabled services. In our view, traditional EHR vendors currently dominate and will dominate the transactions inherent in the EHR, which we believe are commodity. These transactions certainly improve the quality of care and workflow, but often times these improvements are not apparent financially. The value-added services portion of an EHR not only improves the quality of care and workflow, but also has an ability to impact the bottom line. We believe the unbundling of the EHR will result in the development of numerous niche vendors, which compete to provide the best solution focused on a particular value-added service area. Importantly, we do not believe EHR vendors possess a first move advantage. We believe the unbundling and creation of SES offerings benefits smaller, nimble innovators who can focus on developing solutions that remove key friction points and at the same time impact the bottom line of a hospital or health system.
Exhibit 4: The Unbundling of the Electronic Health Record (EHR)
Source: Jonathan Govette, CEO of Referral MD and Stifel
We believe the unbundling of the EHR coupled with the reform environment will help give rise to new provider business models. We illustrate several evolving provider business models in Exhibit 5. New provider models are aimed at driving quality improvement and system efficiency. These new models range from treating patients prior to getting sick to tearing down the traditional four walls of the clinic to driving greater specialization around chronic care.
We believe several of these new provider models will require technology solutions that can drive performance improvement and operational efficiency where it may be lacking currently. In our view, hospitals will increasingly seek to invest in these evolving business models in order to supplement and offset declining revenues. We believe that several of these evolving care models revolve around software-enabled services (SES), especially telehealth, medical home, and mobile and home care.
In our view, the EHR system that can successfully integrate technology services associated with these evolving business models will be well-positioned for the years to come. Currently, we believe that the traditional EHR vendors will face challenges in trying to both develop solutions around these evolving models, as well as face challenges in terms of integrating third party solutions into their core EHR system.
Unbundling the Electronic Medical Record (EHR) Through Software Enabled Services (SES)
CaredoxPersonal Health
Tracker
ZocDocOnline Patient
Appointments
PatientPayBilling
EligibleInsurance API
Castlight HealthPricing Transparency
Filament LabsPatient Engagement
GrandRoundsSecond Opinion
Services
visiblehealthPatient Education
referral MDPatient Referrals
Precision MedicineSyapse
Zapp RxPrescription
Management
surescriptsPrescription Filling
evolent healthPopulation Health
Management
TeladocTelehealth /
Telemedicine
Page 9
Internet & MediaDigital Healthcare April 6, 2015

Exhibit 5: Examples of Evolving Provider Business Models
Source: IBM Global Business Services, IBM Institute for Business Value, and Stifel
Our 2015 Outlook and Investment Scenarios
As we enter 2015, we believe there are several possible investment scenarios that may unfold throughout the year. These scenarios range from being positive on select companies to being negative on the entire industry.
We believe there are five macro drivers of our 2015 HCIT investment scenarios, including: underlying proprietary technological advantages, the shift from transactional infrastructure driven technology investment to performance driven technology investment, the inertia associated with backlog, digital biomarkers, small, nimble third-parties leading innovation, and the interest rate environment.
Understanding the Difference Between SaaS and HCIT SaaS. We think healthcare investors may think of SaaS models somewhat differently from traditional technology investors. In our view, there are several characteristics of a strong SaaS investment, including: strong, sustainable revenue growth over the long-term, driven by a significant proprietary technological advantage, and characterized by high renewal rates, and high revenue visibility. Based on our discussions, we believe high renewal rates and high revenue visibility may represent the key drivers of a SaaS premium in healthcare technology. We justify a SaaS premium in digital healthcare by focusing on how the underlying proprietary technological advantages drive strong, sustainable long-term revenue growth. The ability to drive high renewal rates, high visibility, and improving margins provide additional support for the premium. We believe the best example of the HCIT SaaS valuation phenomenon revolves around companies operating businesses primarily levered to government mandates rather than underlying performance, (i.e., ROI).
Wellness / Prevention Acute Care Chronic Care
Wellness Centers
Retail Clinics
Complimentary Medicine
Concierge Medicine
Medical Home
Telehealth, Telemedicine, e-Visits
Medical Tourism
Ambulatory Surgery Centers
Centers of Excellence
Specialty Hospitals
Mobile and Home Care
Page 10
Internet & MediaDigital Healthcare April 6, 2015

We Think 2015 Will Be About the Shift from Technology Investment to Performance-Based Technology Investment. In our view, a major theme facing healthcare remains developing tools and solutions that can help extract costs and drive long-term sustainable cost reductions throughout the care continuum. For the past five to 10 years, the majority of technology investment seems to have revolved around implementing infrastructure. In our view, the next five to 10 years will revolve around optimizing the technology infrastructure now in place. We believe the major change between these eras will be a shift away from need based infrastructure technology investment towards performance and value driven technology investment. We see this shift manifesting itself via the unbundling of the EHR, which essentially separates the functions of the EHR or digital healthcare infrastructure into commoditized transactional services or value-added software-enabled services.
The Drivers of Inertia Will Help Digital Healthcare Innovators. We believe the main driver of inertia among traditional HCIT companies revolves around large backlogs. In our view, investors love these backlogs because they provide visibility into the future. However, backlog also removes an impetus for traditional HCIT companies to truly lead the industry in terms of innovation. As the industry shifts from transactional infrastructure technology investment to performance-driven technology investment, we believe an unbundling of the EHR will occur. In our view, the traditional HCIT vendors are mostly focused on the commodity transactional functions of the EHR. We believe these entities have unwittingly ceded the performance, value-add service functions to third-party innovators.
Could 2015 Represent the Year of the Digital Biomarker? Based on our meetings and recent news flow, we believe mHealth devices are poised to unlock value in the clinic. We believe that biosensor and even diagnostic companies realize the inherent value of the data generated and collected by their devices. Biosensor companies such as iRhythm recognize the value of the data sets generated by the use of its ZIO device. Furthermore, we believe recent collaborations between Novartis and Qualcomm Life illustrate the interest major biopharmaceutical companies have in mHealth. In December 2014, Biogen gave away fitness tracking devices to 250 MS sufferers in order to evaluate how the biometric device may provide additional insight into adherence and medication impact. Lastly, we think the approval of Dexcom Share provides proof of concept and validates the value of the digital biomarker. We believe successful development around the digital biomarker could come to represent a more robust data set for population health management compared to the data contained in EHR systems today. We do not believe the traditional EHR vendors are prepared to truly integrate a plethora of mHealth devices. Our view is rooted in their closed / introverted natures, as well as the fact that vendors like Epic have struggled with the early development of their apps / tools for Apple’s Health Kit.
We Believe Innovation Comes from Outside the Core HCIT EHR Vendors. A major theme of digital healthcare revolves around the fact that small, nimble third-parties are driving innovation rather than traditional HCIT vendors. We believe small, nimble innovators focus on developing solutions to major friction points rather than specific government mandates. For example, we believe the Dexcom Share tool represents the natural innovation of a product focused on removing major friction points from a process or experience. We believe a focus on removing major friction points from a process or experience in healthcare represents a key differentiator between digital health innovators and traditional HCIT companies. Ultimately, we think the Dexcom Share approval illustrates how friction points in healthcare technology may be solved inadvertently in other parts of biotech, healthcare, and med tech. Based on our discussions, we believe technologists such as Apple and Google will likely represent the facilitators of innovation rather than enterprise EHR vendors.
Page 11
Internet & MediaDigital Healthcare April 6, 2015

The Importance of the Interest Rate Environment to HCIT Companies. We believe the low interest rate environment represents a main driver of investor interest in both CPSI (Hold, $53.33) and Quality Systems (QSII, $15.85, Not Covered). The dividend yields associated with these companies are 4.8% and 4.4%, respectively. In our view, these dividend yields may be attractive to investors especially compared to current rates on U.S. Government bonds. While we view the dividend payments negatively, we believe investors may be attracted to these names until their dividend payments deteriorate, or debt yields become more attractive.
Given the five macro drivers of our 2015 outlook, we provide our thoughts on five investment scenarios, below.
Scenario 1: Bullish on athenahealth and SES, but neutral on traditional HCIT
We subscriber to scenario one, as we believe athenahealth represents the best positioned healthcare IT company to benefit from the shift to software-enabled services. Based on our industry discussions, only athenahealth (ATHN, Buy, $117.65)seems to be eschewing a closed / introverted system. Through the More Disruption Please program, the company continues to build and support the development of an eco-system of software-enabled services that provide performance improvement and operational efficiencies throughout the care continuum.
Furthermore, we believe athenaNet continues to represent a key proprietary technological advantage. The fact that athenahealth’s foundation revolves around the digitization of revenue cycle management positions the company well to drive a SES eco-system and help clients tackle increasingly more complex payment constructs.
In this scenario, we believe investors should also familiarize themselves with public and private companies operating within the Fab 5 of digital healthcare verticals: cost transparency, telehealth, second opinion services, analytics (population health management and precision medicine), and patient engagement.
We are bullish on SES because we believe that hospitals will increasingly look to shift spending towards technology solutions that improve the bottom line. In our view, hospitals currently prefer to work with a single technology vendor due to costs and information fidelity, rather than a true technological advantage. We believe that as SES vendors prove their ability to drive meaningful ROI that these entities will be able to gain greater wallet share of hospital IT spend.
Scenario 2: Bullish on Cerner, but neutral on athenahealth, SES, and the rest of traditional HCIT
In scenario two, investors remain focused on Cerner (CERN, Hold, $72.77) due to its competitive position within the acute care market, and its historical stability. Investors believe the status quo will remain intact for Cerner for several years to come, and that the company is not likely susceptible to uncertainties stemming from healthcare reform and new payment models. Investors in scenario two are likely negative on athenahealth due to valuation and a belief that the company will be unable to easily gain traction in the hospital market. Investors in this scenario may also be negative on SES because they likely believe that hospitals will seek to work with only one vendor rather than many.
Page 12
Internet & MediaDigital Healthcare April 6, 2015

Scenario 3: Bullish on Value/Turnarounds, e.g., Allscripts, Quality Systems, CPSI, but neutral on the rest of HCIT
Investors in scenario three prefer the turnarounds and value players to the market leaders. These investors are likely disinterested in market leaders due to valuation and seek to time the bottom in turn arounds like Allscripts (MDRX, Hold, $11.77) and Quality Systems. These investors are also likely attracted to the dividend payments provided by Quality Systems and CPSI. We are not advocates of this scenario, as we believe technology turnarounds can prove quite difficult, especially when the competitive set may exhibit technological advantages and a greater pace of innovation.
Scenario 4: Bullish on athenahealth and Cerner, but neutral on the rest of HCIT
Investors in scenario four primarily focus on the market leaders and exhibit a neutral to negative stance towards other HCIT players. These investors prefer the historical stability and market leading position of Cerner in the acute market. Additionally, these investors prefer the strong revenue growth rates exhibited by athenahealth. These investors believe that Cerner will be able to maintain its market dominance and face little negative impact from changes stemming from healthcare reform. Additionally, these investors likely believe that athenahealth can continue to meet a 20% year over year revenue growth target for the next few years.
Scenario 5: Bearish on all of HCIT
We believe some investors may be negatively inclined regarding the entire HCIT industry group. These investors view population health management as a compelling opportunity not yet ready for prime time. Additionally, the bearish view holds that revenue growth will likely be difficult in an industry with little to no greenfield opportunity. The replacement super-cycle will likely take longer than expected to develop, and when it does the replacement super-cycle will be characterized by very long replacement cycle times. Additionally, those vendors who have been experiencing client attrition likely continue to do so, (e.g., Quality Systems and Allscripts).
Page 13
Internet & MediaDigital Healthcare April 6, 2015

Part 2: The Shift to Software-Enabled Services (SES)
What Are SES and Why Are They Important?
Software-enabled services are solutions that provide performance improvement and operational efficiencies throughout the care continuum. These solutions are delivered via software and revolve around a proprietary technological advantage, and characterized by delivering meaningful ROI. SES solutions address a myriad of issues facing hospitals and providers ranging from revenue cycle to utilization and volumes to patient engagement among others. In our view, the environment of health reform and significant infrastructure investment will lead many hospitals and providers to seek ways to optimize their organizations. We believe that over time, hospitals and physicians will seek to shift their HCIT investment dollar towards data and outcomes driven services that drive performance improvement and operational efficiencies throughout the care continuum.
Electronic Health Records (EHRs) represent the digital foundation for a digitized healthcare system in the United States. These systems are often incomplete in that users only need to perform a subset of functions outlined within government adoption mandates. Furthermore, these systems are plagued by inter and intraoperability issues and often represent close / introverted systems (meaning they avoid working with third party technologists). While we recognize that Epic and Cerner represent the standard in terms of EHRs, we do not believe these EHR vendors will necessarily become the leaders in SES. For the most part, these entities while offering some SES offerings (population health and revenue cycle) are primarily focused on increasing and expanding the footprint of their EHR system user base.
In the future, we believe hospitals and providers will increasingly look for ways to extract value and performance from their HCIT investments. In our view, best-in-breed SES offerings can develop and thrive regardless of who represents the standard in EHRs. We believe SES offerings thrive no matter what because they are services that would exist regardless of whether or not government driven HCIT adoption mandates existed. The common thread of data and outcomes driven solutions that provide meaningful ROI through performance improvement and operational efficiency drives SES independence. In our view, as the health reform environment strives for greater cost reduction and moves toward increasingly complex reimbursement structures, we believe SES will play an integral role in hospitals and physicians maintaining the long-term viability of their businesses.
We believe the movement from transactional infrastructure investment to SES offerings evolves in three parts. First, the hospital and physician decides the organization needs to move beyond the digital foundation to be successful. The decision may manifest itself in the organization striving for EHR optimization or seeking to defend against operating margin degradation. Secondly, the organization actively decides that technology investments need to provide meaningful ROI. Lastly, organizations make an active shift to leveraging SES offerings because they realize they need to employ solutions that actually do what the organization needs / wants to remain successful.
Page 14
Internet & MediaDigital Healthcare April 6, 2015
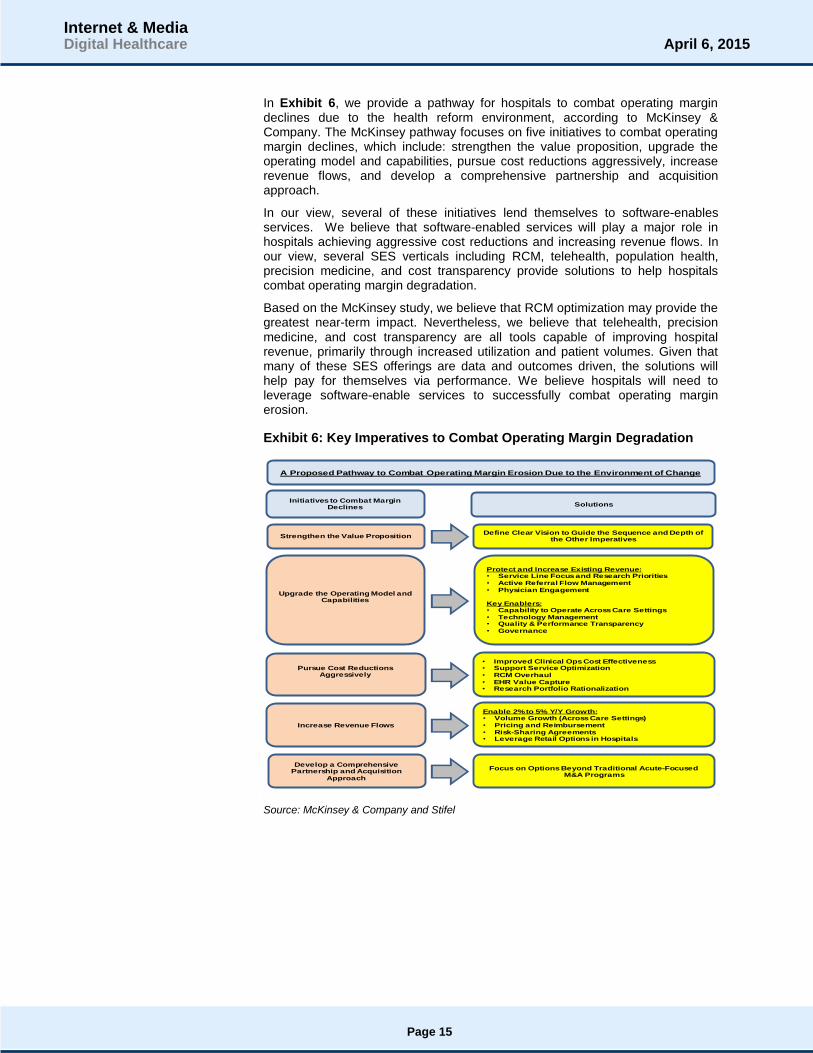
In Exhibit 6, we provide a pathway for hospitals to combat operating margin declines due to the health reform environment, according to McKinsey & Company. The McKinsey pathway focuses on five initiatives to combat operating margin declines, which include: strengthen the value proposition, upgrade the operating model and capabilities, pursue cost reductions aggressively, increase revenue flows, and develop a comprehensive partnership and acquisition approach.
In our view, several of these initiatives lend themselves to software-enables services. We believe that software-enabled services will play a major role in hospitals achieving aggressive cost reductions and increasing revenue flows. In our view, several SES verticals including RCM, telehealth, population health, precision medicine, and cost transparency provide solutions to help hospitals combat operating margin degradation.
Based on the McKinsey study, we believe that RCM optimization may provide the greatest near-term impact. Nevertheless, we believe that telehealth, precision medicine, and cost transparency are all tools capable of improving hospital revenue, primarily through increased utilization and patient volumes. Given that many of these SES offerings are data and outcomes driven, the solutions will help pay for themselves via performance. We believe hospitals will need to leverage software-enable services to successfully combat operating margin erosion.
Exhibit 6: Key Imperatives to Combat Operating Margin Degradation
Source: McKinsey & Company and Stifel
Strengthen the Value Proposition
Upgrade the Operating Model and Capabilities
Pursue Cost Reductions Aggressively
Increase Revenue Flows
Develop a Comprehensive Partnership and Acquisition
Approach
Initiatives to Combat Margin Declines Solutions
Define Clear Vision to Guide the Sequence and Depth of the Other Imperatives
Protect and Increase Existing Revenue:• Service Line Focus and Research Priorities• Active Referral Flow Management• Physician Engagement
Key Enablers:• Capability to Operate Across Care Settings• Technology Management• Quality & Performance Transparency• Governance
• Improved Clinical Ops Cost Effectiveness• Support Service Optimization• RCM Overhaul• EHR Value Capture• Research Portfolio Rationalization
Enable 2% to 5% Y/Y Growth:• Volume Growth (Across Care Settings)• Pricing and Reimbursement• Risk-Sharing Agreements• Leverage Retail Options in Hospitals
Focus on Options Beyond Traditional Acute-FocusedM&A Programs
A Proposed Pathway to Combat Operating Margin Erosion Due to the Environment of Change
Page 15
Internet & MediaDigital Healthcare April 6, 2015

According to a 2013 McKinsey & Company report titled “The ‘Big Data’ Revolution in Healthcare: Accelerating Value and Innovation,” the application of early successes in big data applied to healthcare at scale could drive an annual cost savings between $300 billion and $450 billion, Exhibit 7. We believe these estimates are achievable based on the verticals identified in Exhibit 7. In our view, the value cost savings derived from the categories will increase as the big data and analytics solutions being developed become increasingly more sophisticated. For example, health tracking starts simply with devices such as activity trackers, but becomes more sophisticated once adherence programs are included. Essentially, the $300 billion to $450 billion in possible savings will either increase or decrease as a function of the data-driven performance improvements and operational efficiencies provided by SES innovators. In our view, the digital foundation of EHRs cannot achieve these cost reductions alone.
Exhibit 7: Impact of Analytics & Big Data on National Health Expenditures
Source: American Diabetes Association, American Hospital Association, HealthPartners Research Foundation, McKinsey Global Institute, National Bureau of Economic Research (NBER), U.S. Census Bureau, and Stifel
In Exhibit 8, we estimate what the total addressable revenue opportunity associated with McKinsey’s cost savings estimates driven by analytics and big data. We apply a 5% to 10% take-rate to estimate the possible revenue opportunity for each vertical identified by the McKinsey report. We believe that these estimates likely prove conservative, as the verticals represent broad categories. In our view, there are several SES verticals that currently represent addressable markets of several billion dollars and growing.
Exhibit 8: Market Opportunity by Vertical Driven by Analytics & Big Data
Source: Stifel
$70
$90
$50 $50
$40
$-
$20
$40
$60
$80
$100
$120
HealthTracking
CoordinatedCare
Best Provider AccountableCare
DigitalHealthcare
Es
tim
ate
d S
avin
gs ($b
illion
s)
Estimated Cost Savings: Low Estimate
$100
$110
$70
$100
$70
$-
$20
$40
$60
$80
$100
$120
HealthTracking
CoordinatedCare
Best Provider AccountableCare
DigitalHealthcare
Es
tim
ate
d S
avin
gs ($b
illion
s)
Estimated Cost Savings: High Estimate
Total Estimated Costs Savings (Low Estimate) = $300 Billion
Total Estimated Costs Savings (High Estimate) = $450 Billion
$5.0 $5.5
$3.5
$5.0
$3.5
$10.0
$11.0
$7.0
$10.0
$7.0
$0.0
$2.0
$4.0
$6.0
$8.0
$10.0
$12.0
HealthTracking
CoordinatedCare
Best Provider AccountableCare
DigitalHealthcare
Low TAM High TAM
$3.5
$4.5
$2.5 $2.5 $2.0
$7.0
$9.0
$5.0 $5.0
$4.0
$0.0
$1.0
$2.0
$3.0
$4.0
$5.0
$6.0
$7.0
$8.0
$9.0
$10.0
HealthTracking
CoordinatedCare
Best Provider AccountableCare
DigitalHealthcare
Low TAM High TAM
TAM Estimates Based on $300 Billion Cost Savings
TAM Estimates Based on $450 Billion Cost Savings
Page 16
Internet & MediaDigital Healthcare April 6, 2015
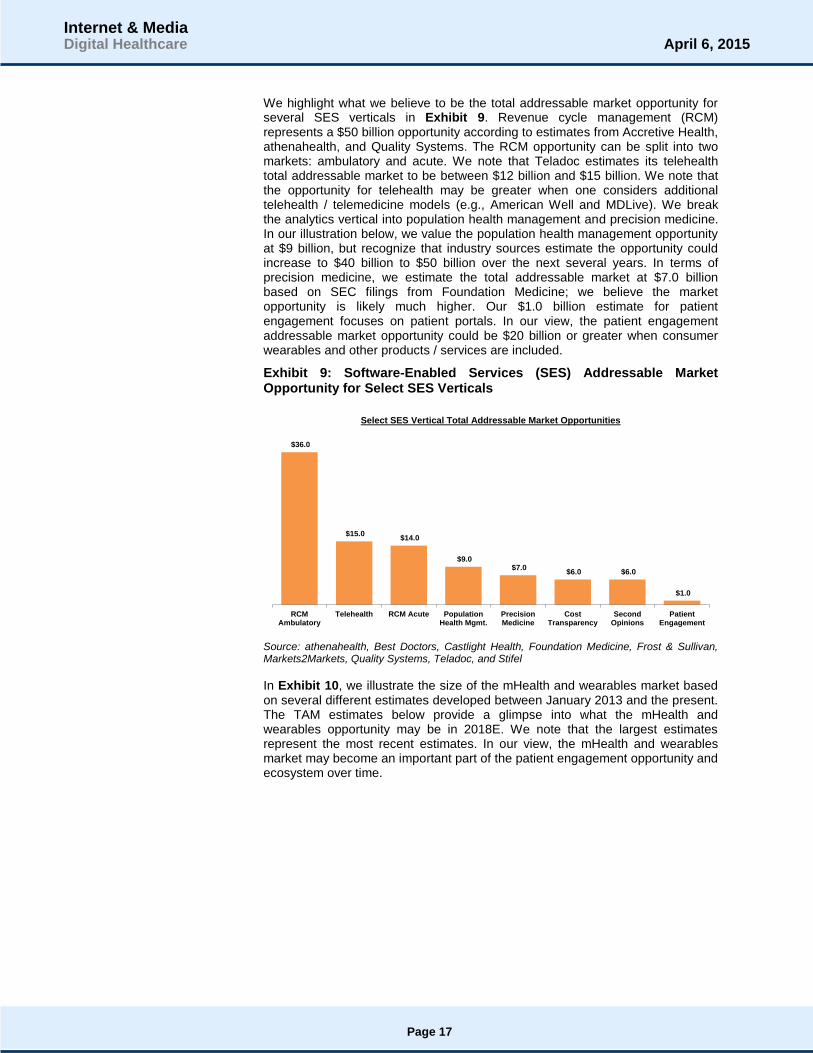
We highlight what we believe to be the total addressable market opportunity for several SES verticals in Exhibit 9. Revenue cycle management (RCM) represents a $50 billion opportunity according to estimates from Accretive Health, athenahealth, and Quality Systems. The RCM opportunity can be split into two markets: ambulatory and acute. We note that Teladoc estimates its telehealth total addressable market to be between $12 billion and $15 billion. We note that the opportunity for telehealth may be greater when one considers additional telehealth / telemedicine models (e.g., American Well and MDLive). We break the analytics vertical into population health management and precision medicine. In our illustration below, we value the population health management opportunity at $9 billion, but recognize that industry sources estimate the opportunity could increase to $40 billion to $50 billion over the next several years. In terms of precision medicine, we estimate the total addressable market at $7.0 billion based on SEC filings from Foundation Medicine; we believe the market opportunity is likely much higher. Our $1.0 billion estimate for patient engagement focuses on patient portals. In our view, the patient engagement addressable market opportunity could be $20 billion or greater when consumer wearables and other products / services are included.
Exhibit 9: Software-Enabled Services (SES) Addressable Market Opportunity for Select SES Verticals
Source: athenahealth, Best Doctors, Castlight Health, Foundation Medicine, Frost & Sullivan, Markets2Markets, Quality Systems, Teladoc, and Stifel
In Exhibit 10, we illustrate the size of the mHealth and wearables market based on several different estimates developed between January 2013 and the present. The TAM estimates below provide a glimpse into what the mHealth and wearables opportunity may be in 2018E. We note that the largest estimates represent the most recent estimates. In our view, the mHealth and wearables market may become an important part of the patient engagement opportunity and ecosystem over time.
$36.0
$15.0 $14.0
$9.0 $7.0
$6.0 $6.0
$1.0
RCMAmbulatory
Telehealth RCM Acute PopulationHealth Mgmt.
PrecisionMedicine
CostTransparency
SecondOpinions
PatientEngagement
Select SES Vertical Total Addressable Market Opportunities
Page 17
Internet & MediaDigital Healthcare April 6, 2015
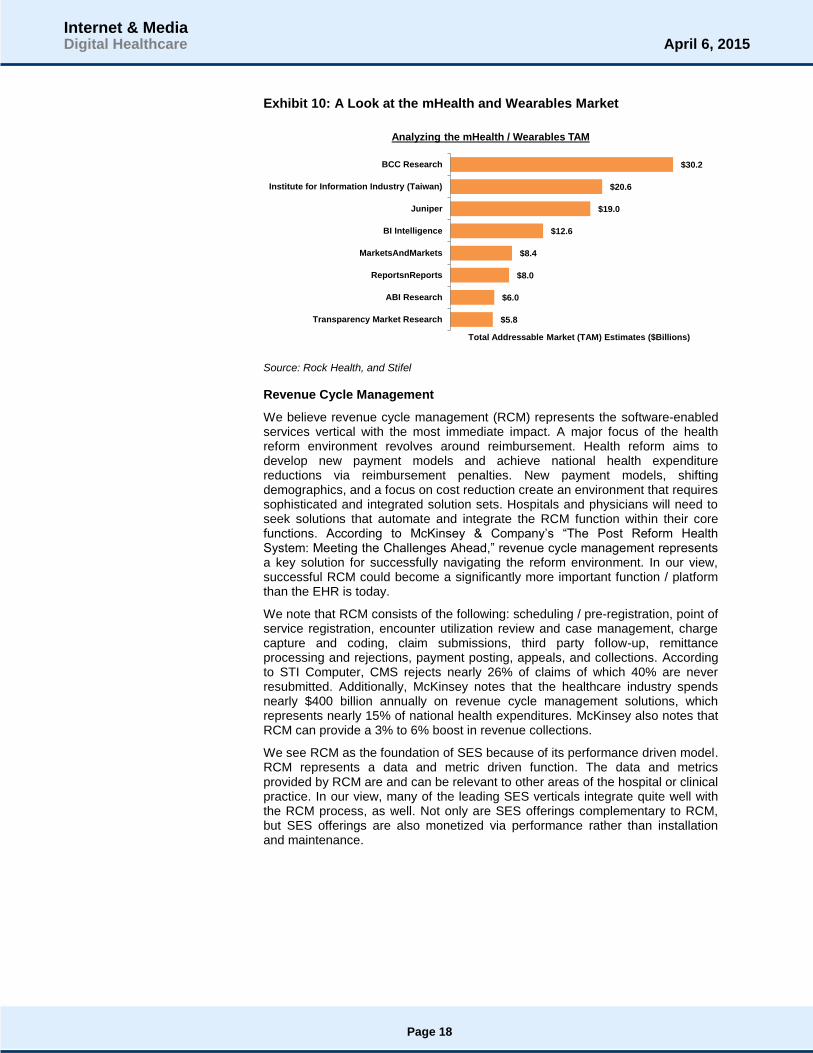
Exhibit 10: A Look at the mHealth and Wearables Market
Source: Rock Health, and Stifel
Revenue Cycle Management
We believe revenue cycle management (RCM) represents the software-enabled services vertical with the most immediate impact. A major focus of the health reform environment revolves around reimbursement. Health reform aims to develop new payment models and achieve national health expenditure reductions via reimbursement penalties. New payment models, shifting demographics, and a focus on cost reduction create an environment that requires sophisticated and integrated solution sets. Hospitals and physicians will need to seek solutions that automate and integrate the RCM function within their core functions. According to McKinsey & Company’s “The Post Reform Health System: Meeting the Challenges Ahead,” revenue cycle management represents a key solution for successfully navigating the reform environment. In our view, successful RCM could become a significantly more important function / platform than the EHR is today.
We note that RCM consists of the following: scheduling / pre-registration, point of service registration, encounter utilization review and case management, charge capture and coding, claim submissions, third party follow-up, remittance processing and rejections, payment posting, appeals, and collections. According to STI Computer, CMS rejects nearly 26% of claims of which 40% are never resubmitted. Additionally, McKinsey notes that the healthcare industry spends nearly $400 billion annually on revenue cycle management solutions, which represents nearly 15% of national health expenditures. McKinsey also notes that RCM can provide a 3% to 6% boost in revenue collections.
We see RCM as the foundation of SES because of its performance driven model. RCM represents a data and metric driven function. The data and metrics provided by RCM are and can be relevant to other areas of the hospital or clinical practice. In our view, many of the leading SES verticals integrate quite well with the RCM process, as well. Not only are SES offerings complementary to RCM, but SES offerings are also monetized via performance rather than installation and maintenance.
$5.8
$6.0
$8.0
$8.4
$12.6
$19.0
$20.6
$30.2
Transparency Market Research
ABI Research
ReportsnReports
MarketsAndMarkets
BI Intelligence
Juniper
Institute for Information Industry (Taiwan)
BCC Research
Total Addressable Market (TAM) Estimates ($Billions)
Analyzing the mHealth / Wearables TAM
Page 18
Internet & MediaDigital Healthcare April 6, 2015
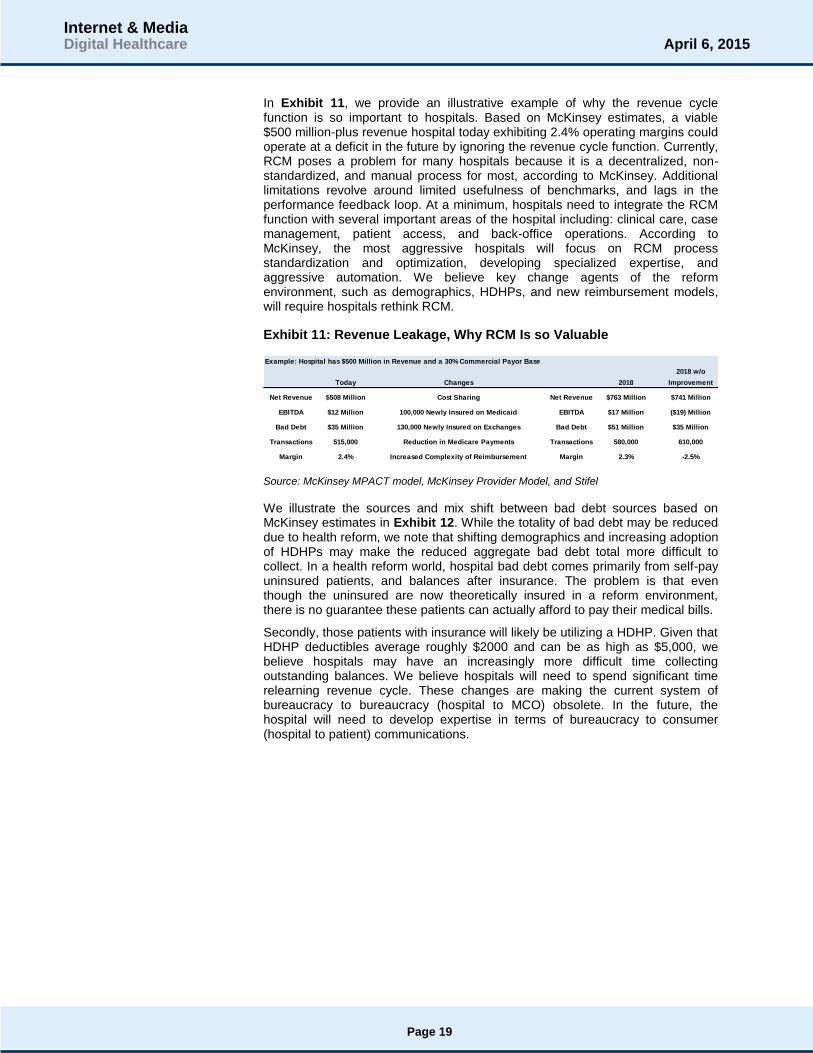
In Exhibit 11, we provide an illustrative example of why the revenue cycle function is so important to hospitals. Based on McKinsey estimates, a viable $500 million-plus revenue hospital today exhibiting 2.4% operating margins could operate at a deficit in the future by ignoring the revenue cycle function. Currently, RCM poses a problem for many hospitals because it is a decentralized, non-standardized, and manual process for most, according to McKinsey. Additional limitations revolve around limited usefulness of benchmarks, and lags in the performance feedback loop. At a minimum, hospitals need to integrate the RCM function with several important areas of the hospital including: clinical care, case management, patient access, and back-office operations. According to McKinsey, the most aggressive hospitals will focus on RCM process standardization and optimization, developing specialized expertise, and aggressive automation. We believe key change agents of the reform environment, such as demographics, HDHPs, and new reimbursement models, will require hospitals rethink RCM.
Exhibit 11: Revenue Leakage, Why RCM Is so Valuable
Source: McKinsey MPACT model, McKinsey Provider Model, and Stifel
We illustrate the sources and mix shift between bad debt sources based on McKinsey estimates in Exhibit 12. While the totality of bad debt may be reduced due to health reform, we note that shifting demographics and increasing adoption of HDHPs may make the reduced aggregate bad debt total more difficult to collect. In a health reform world, hospital bad debt comes primarily from self-pay uninsured patients, and balances after insurance. The problem is that even though the uninsured are now theoretically insured in a reform environment, there is no guarantee these patients can actually afford to pay their medical bills.
Secondly, those patients with insurance will likely be utilizing a HDHP. Given that HDHP deductibles average roughly $2000 and can be as high as $5,000, we believe hospitals may have an increasingly more difficult time collecting outstanding balances. We believe hospitals will need to spend significant time relearning revenue cycle. These changes are making the current system of bureaucracy to bureaucracy (hospital to MCO) obsolete. In the future, the hospital will need to develop expertise in terms of bureaucracy to consumer (hospital to patient) communications.
Example: Hospital has $500 Million in Revenue and a 30% Commercial Payor Base
2018 w/o
Today Changes 2018 Improvement
Net Revenue $508 Million Cost Sharing Net Revenue $763 Million $741 Million
EBITDA $12 Million 100,000 Newly Insured on Medicaid EBITDA $17 Million ($19) Million
Bad Debt $35 Million 130,000 Newly Insured on Exchanges Bad Debt $51 Million $35 Million
Transactions 515,000 Reduction in Medicare Payments Transactions 580,000 610,000
Margin 2.4% Increased Complexity of Reimbursement Margin 2.3% -2.5%
Page 19
Internet & MediaDigital Healthcare April 6, 2015

Exhibit 12: Sources of Bad Debt at U.S. Hospitals
Note: Self-pay is post discount for uninsured. All figures account for increased use of HDHPs (based on historical trends) and increased cost sharing for commercial plans in light of reform.
BAI stands for balance after insurance; HDHP stands for high deductible health plan.
Source: McKinsey MPACT and provider models; literature search; McKinsey Analysis, and Stifel
Not only is it a demographic and HDHP mix shift, but also an increase in volumes and complexity that makes RCM so important. In Exhibit 13, we provide an illustration of increasing payment volumes and the increasing sources of payment driven by health reform, according to McKinsey. With transaction volumes increasing, integrated and automated RCM systems that can prevent errors will become increasingly important.
BAI 5.4 8.8 14
2010 2018 (No Reform) 2018 (with Reform)
Non-Self-Pay 32%-33% 32% to 34% 53% to 55%
BAI 15% 15% to 17% 35%
Payor Dispute 17% to 18% 17% 18% to 20%
Self-pay 67% to 68% 66% to 68% 45% to 47%
$23.7 - $24.6
$33.6 - $35.9
$17.7 - $8.2
$6.2 - $6.3
$8.7 - $9.1
$7.2 - $8.0
$5.2 - $5.4
$8.2 - $8.8
$13.6 - $13.9
2010 2018 (No Reform) 2018 (with Reform)
Sources of U.S. Hospital Bad Debt (Billions, USD)
Self-pay/Uninsured Payor Dispute BAI
Page 20
Internet & MediaDigital Healthcare April 6, 2015

Exhibit 13: Hospital Payment Mix Shift Requires More Efficient RCM
Note: Includes both HDHP and traditional commercial plans; accounts for increasing use of HDHPs (based on historical trends) and increased cost sharing for commercial plans in light of reform.
BAI stands for balance after insurance; HDHP stands for high deductible health plan.
Source: McKinsey MPACT and provider models, literature search, McKinsey Analysis, and Stifel.
The “Fab 5” Software-Enabled Service Verticals of Digital Healthcare
We define the “Fab 5” of digital healthcare as the software-enabled service verticals, which reflect greatest investor interest and strongest fundamental performance. The verticals that comprise our “Fab 5” include: cost transparency, telehealth / telemedicine, second opinion services, analytics (population health management and precision medicine), and patient engagement.
Cost Transparency: We believe cost transparency solutions help both employers and consumers better manage and understand healthcare costs. These platforms provide dashboards and services for employers who wish to better understand and control the healthcare expenditures of their employee base. These tools allow Human Resources to then make decisions and implement policies, which can help to lower health expenditures for the organization.
Consumers benefit from cost transparency from a shopping for care perspective. Utilizing cost and quality data allows consumers to avoid over paying for routine healthcare and procedures. An extension of cost transparency revolves around platforms providing cost, quality, and provider locator services to consumers. These services utilize user-generated content to help identify the highest quality providers, and utilize carrier data to highlight cost information associated with the provider, clinic, or hospital in question.
Representative examples of Cost Transparency include: Platforms such as Castlight Health, Change Healthcare (acquired by Emdeon) ,and Healthx.
Representative examples of Cost, Quality, and Provider Locator Services include: Doximity, Vitals, and ZocDoc
101.5 102.557.0
0.0 0.060.0
55.5 68.572.5
78.083.0
102.5
101.5101.5
57.00.0
0.060.0
55.568.5
72.578.0
83.0
102.5
31.5
37.0
19.5
2010 2018 (No Reform) 2018 (with Reform)
Hospital Payment Volume Mix Is Changing
Self-Pay / Uninsured
Medicaid BAI
Medicare BAI
Exchange BAI
Commercial BAI
Medicaid
Medicare
Exchange
Commercial
Page 21
Internet & MediaDigital Healthcare April 6, 2015
Telehealth / Telemedicine: We believe telehealth / telemedicine solutions seek to tear down the four walls of the clinic. These solutions help to reduce the burden and cost of in-person visits, expand physician activity, and expand the knowledge networks in both acute and ambulatory care settings. We note that hospitals such as Thomas Jefferson University Hospital in Philadelphia view telehealth as a major tool for keeping patients out of the hospital. A major shift in reducing healthcare costs revolves around keeping patients away from the hospital. We believe telehealth represents a powerful tool because of its strong ROI and ability to help maintain utilization.
Representative examples of Telehealth / Telemedicine include: AmericanWell, Doctors On Demand, MDLive, Ringadoc, and Teladoc.
Second Opinion Services: The second opinion services vertical aims to ensure patients receive the right treatment in order to avoid unnecessary or suboptimal medical procedures. Additionally, second opinion services vendors seek to use analytics to better understand and risk-stratify healthy patients today in order to keep them from becoming chronic health cases.
Representative examples of Second Opinion Services include: Best Doctors and GrandRounds.
Analytics (Big Data – Population Health Management and Precision Medicine): We believe a major focus of the healthcare complex will revolve around the development of strong data architecture. Currently, the digital foundation of the U.S. healthcare system provides solid transactional data, but lacks robust outcomes data. For the most part, healthcare technologists are focused on bringing analytics to bear in terms of population health management. Based on our industry discussions, a need exists around collecting more outcomes based data. The collection of outcomes data will allow for strong and accurate predictive analytics. Meanwhile, the question is can healthcare develop prescriptive or suggestive analytics models?
While population health remains the primary analytic focus of healthcare IT, we believe diagnostic companies focused on precision medicine are developing prescriptive and suggestive analytics tools. A major focus of precision medicine revolves around using diagnostics and the mapping of the human genome to help oncologists identify the best course of treatment for the patient. Platforms such as Syapse allow oncologists to understand the tumor genome sequence, a data input from vendors such as Foundation Medicine (FMI, $48.74, Not Covered) among others, in conjunction with the patient’s clinical and treatment history. Doing so allows the oncologist to make more educated decisions about care going forward.
Representative examples of Population Health Management solutions include: The Advisory Board, Allscripts, athenahealth, Cerner, Evolent Health, Health Catalyst, Lumeris, Phytel, and Truven Analytics among others. We think investors should also pay close attention to entities working on digital biomarkers (e.g., iRhythm), as these companies may have an ability to generate important data sets for population health management.
Representative examples of Precision Medicine solutions include: Flatiron Health, Foundation Medicine, and Syapse among others.
Page 22
Internet & MediaDigital Healthcare April 6, 2015

Patient Engagement: The Patient Engagement vertical, in our view, represents difficult low hanging fruit. On one hand, engaging patients should be quite simple, but the difficulty lies in the fact that hospitals and HC IT vendors may not necessarily be well suited to drive engagement. We believe patient engagement represents an important tool given the requirements of Meaningful Use Stage 2. In our view, successful examples of platforms with strong patient engagement include athenaCommunicator and Everyday Health. We believe that patient engagement will come to represent wearable devices and health and wellness solutions that help consumers manage their health. Ultimately, we believe patient engagement will require more than a portal and likely involve developing or partnering to provide relevant content to consumers. We believe wearable devices will come to represent an important driver of patient engagement.
Representative examples of Patient Engagement solutions include: athenaCommunicator, Everyday Health, WebMD, Sharecare, health & wellness platforms such as RedBrick Health, consumer / fitness wearable devices such as Jawbone and Misfit, as well as more clinically focused devices such as Cohero and Propeller Health.
Page 23
Internet & MediaDigital Healthcare April 6, 2015

Part 3: Understanding the Macro Economic Environment
We believe an important aspect of Healthcare IT (HCIT) and digital healthcare revolves around the macro-economic outlook. The main source of macro estimates revolve around healthcare expenditure forecasts provided by The Centers for Medicare and Medicaid Services (CMS). As of July 2014, CMS estimates that healthcare expenditures will reach $4.1 trillion in 2020, up from $2.7 trillion in 2013. We believe most investors, and most vendors accept these healthcare expenditures at face value. In our view, investors should consider a range of possible scenarios that consider a possible bending of the cost curve driven by performance improvement and operational efficiencies driven by technology. In our view, assuming that national health expenditures continuously rise with no bending of the cost curve suggests that the U.S. transition to a digitized health system will represent a massive failure.
In Exhibit 14, we illustrate the base case macro outlook for national health expenditures according to CMS. According to CMS, national health expenditures will increase at a 6.0% compound annual growth rate between 2014E and 2022E. As of 2013, national health expenditures (NHE) totaled roughly $2.7 trillion and roughly 16.3% of U.S. Gross Domestic Product (GDP). By 2015, national health expenditures are expected to reach $3.0 trillion and roughly 16.7% of U.S. GDP. By 2020, national health expenditures are expected to reach roughly $4.1 trillion and roughly 17.5% of U.S. GDP. We believe the main purpose of digital health care and SES offerings revolves around bending the national health expenditure cost cure, and at least attempting to slow the rate of growth to some extent. In our view, if CMS’ cost curve represents future reality, then we believe both traditional HCIT vendors and digital healthcare innovators will have trouble maintaining viable businesses in the future.
Exhibit 14: CMS estimates on National Healthcare Expenditures
Source: CMS and Stifel
2,893 3,041
3,213 3,396
3,602 3,834
4,085 4,341
4,610
16.7% 16.7%16.8%
16.9%17.0%
17.2%
17.5%
17.7%
18.0%
15.5%
16.0%
16.5%
17.0%
17.5%
18.0%
18.5%
0
500
1,000
1,500
2,000
2,500
3,000
3,500
4,000
4,500
5,000
2014E 2015E 2016E 2017E 2018E 2019E 2020E 2021E 2022E
U.S. National Health Expenditure Trends
National Health Expenditures (NHE) NHE as a % of GDP
Page 24
Internet & MediaDigital Healthcare April 6, 2015
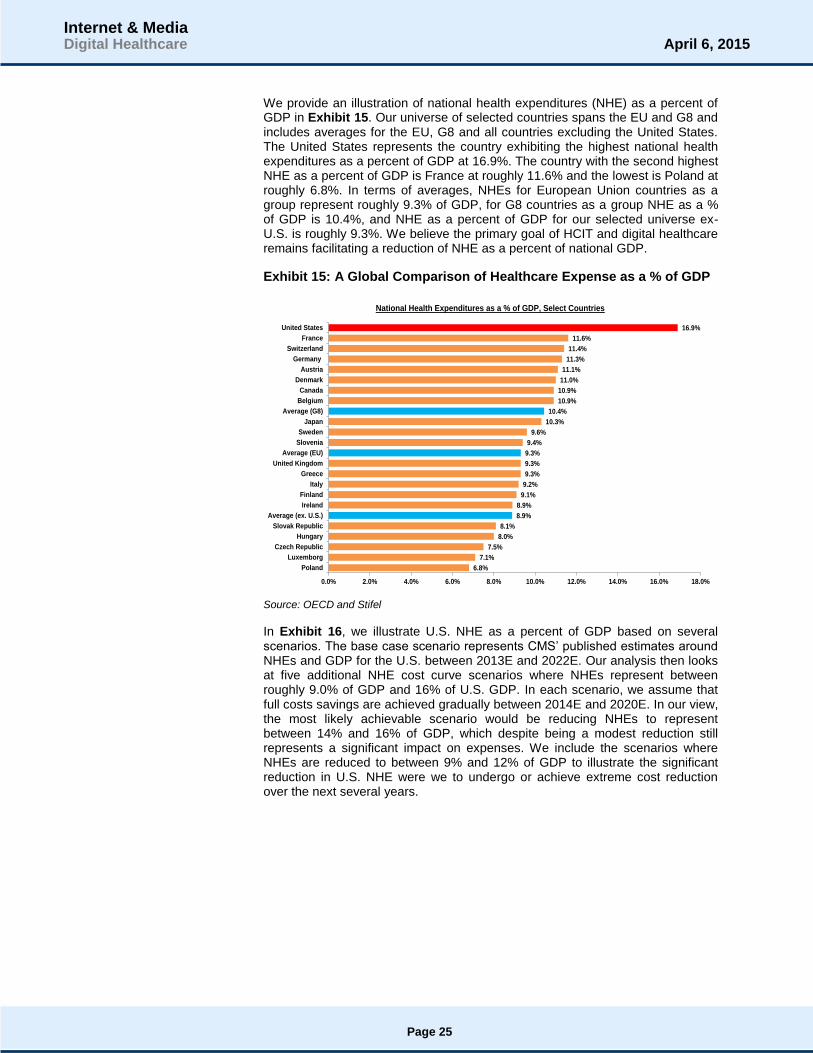
We provide an illustration of national health expenditures (NHE) as a percent of GDP in Exhibit 15. Our universe of selected countries spans the EU and G8 and includes averages for the EU, G8 and all countries excluding the United States. The United States represents the country exhibiting the highest national health expenditures as a percent of GDP at 16.9%. The country with the second highest NHE as a percent of GDP is France at roughly 11.6% and the lowest is Poland at roughly 6.8%. In terms of averages, NHEs for European Union countries as a group represent roughly 9.3% of GDP, for G8 countries as a group NHE as a % of GDP is 10.4%, and NHE as a percent of GDP for our selected universe ex-U.S. is roughly 9.3%. We believe the primary goal of HCIT and digital healthcare remains facilitating a reduction of NHE as a percent of national GDP.
Exhibit 15: A Global Comparison of Healthcare Expense as a % of GDP
Source: OECD and Stifel
In Exhibit 16, we illustrate U.S. NHE as a percent of GDP based on several scenarios. The base case scenario represents CMS’ published estimates around NHEs and GDP for the U.S. between 2013E and 2022E. Our analysis then looks at five additional NHE cost curve scenarios where NHEs represent between roughly 9.0% of GDP and 16% of U.S. GDP. In each scenario, we assume that full costs savings are achieved gradually between 2014E and 2020E. In our view, the most likely achievable scenario would be reducing NHEs to represent between 14% and 16% of GDP, which despite being a modest reduction still represents a significant impact on expenses. We include the scenarios where NHEs are reduced to between 9% and 12% of GDP to illustrate the significant reduction in U.S. NHE were we to undergo or achieve extreme cost reduction over the next several years.
6.8%
7.1%
7.5%
8.0%
8.1%
8.9%
8.9%
9.1%
9.2%
9.3%
9.3%
9.3%
9.4%
9.6%
10.3%
10.4%
10.9%
10.9%
11.0%
11.1%
11.3%
11.4%
11.6%
16.9%
0.0% 2.0% 4.0% 6.0% 8.0% 10.0% 12.0% 14.0% 16.0% 18.0%
Poland
Luxemborg
Czech Republic
Hungary
Slovak Republic
Average (ex. U.S.)
Ireland
Finland
Italy
Greece
United Kingdom
Average (EU)
Slovenia
Sweden
Japan
Average (G8)
Belgium
Canada
Denmark
Austria
Germany
Switzerland
France
United States
National Health Expenditures as a % of GDP, Select Countries
Page 25
Internet & MediaDigital Healthcare April 6, 2015

Exhibit 16: Comparison of Several Scenarios Involving a Reduction in Healthcare Expense as a % of GDP
Source: CMS, OECD, and Stifel
We illustrate a few additional scenarios around U.S. NHEs as a percent of GDP in Exhibit 17. Once again, we start with the base case U.S. NHE assumptions published by CMS in July 2014. We then compare the base case to three additional cost curve scenarios. The first scenario assumes costs savings gradually reach $375 billion by 2020E driven by big data and analytics. The scenario represents the midpoint of McKinsey’s estimated annual savings of $300 billion to $450 billion associated with the application of analytics and big data to the U.S. healthcare system. The second scenario assumes that we can bend the NHE cost curve by gradually reducing NHEs to roughly 15% of U.S. GDP by 2020E. The final scenario assumes a gradual reduction in NHE, which reaches roughly $1.125 billion on an annual basis in 2020E. The final scenario consists of the midpoint of the McKinsey estimates and the removal of $750B in annual waste in U.S. NHE, according to Rock Health.
Each scenario assumes that we gradually reach a target annual reduction goal and holds NHE as a percent of GDP constant once the full savings are achieved. Our assumption revolves around our belief that SES offerings that provide significant ROI and drive performance improvement and operational efficiencies will allow the system to more easily maintain NHEs as a percent of U.S. GDP. In our view, the scenarios presented in Exhibit 16 and Exhibit 17 suggest that the scenarios where NHEs reach 14% to 16% of U.S. GDP are achievable. In our view, the biggest risk to our assumptions revolves around the fact that achieving full annual cost savings may not be achieved until after 2020E. Nevertheless, we believe these scenarios illustrate the real opportunity facing digital healthcare innovators and further illustrates why we believe the industry will continue to shift more towards SES over the coming years.
0
500
1,000
1,500
2,000
2,500
3,000
3,500
4,000
4,500
5,000
2014E 2015E 2016E 2017E 2018E 2019E 2020E 2021E 2022E
Bending the National Health Expenditure Cost Curve Scenario Analysis
NHE as a % of GDP NHE as 16% of GDP
NHE as 14% of GDP NHE as 12% of GDP (France Scenario)
NHE as 10% of GDP (G8 Avg. Scenario) NHE as 9% of GDP (EU Avg. Scenario)
Page 26
Internet & MediaDigital Healthcare April 6, 2015

Exhibit 17: Scenario Inputs NHE as % of GDP in 2014E and 2022E
Source: CMS, McKinsey, Rock Health, and Stifel
In Exhibit 18, we illustrate the key assumptions involved in each of our NHE as a percent of GDP scenarios presented in Exhibit 16 and Exhibit 17. The key assumptions shown in Exhibit 18 are the NHE CAGR for the 2014E to 2022E period and NHEs as a percent of GDP in 2022E. In our view, the easiest scenario to achieve revolves around achieving cost savings due to analytics and big data, based on McKinsey research. We believe driving NHEs as a percent of GDP to the 14% to 16% range represents the long-term goal for both HCIT vendors and digital health innovators. We believe these scenarios will be driven by the development of software-enabled solutions that drive meaningful ROI and provide meaningful performance improvement and operational efficiencies throughout the continuum of care. In our view, the McKinsey plus waste scenario represents an aggressive best case scenario. Lastly, the scenarios where NHEs reach 9% to 12% of GDP are quite unlikely given the differences in healthcare delivery and infrastructure between European nations and the United States.
Exhibit 18: Comparison of Several Scenarios Involving a Reduction in Healthcare Expense as a % of GDP
Source: CMS, OECD, McKinsey, and Stifel
0
500
1,000
1,500
2,000
2,500
3,000
3,500
4,000
4,500
5,000
2014E 2015E 2016E 2017E 2018E 2019E 2020E 2021E 2022E
Additional National Health Expenditure Cost Curve Scenarios
National Health Expenditures (NHE) NHE as 14% of GDP
NHE Adjusted for McKinsey Estimates (Midpoint) NHE Adjusted for McKinsey (MP) and $750B Waste
-2.8%
-1.5%
0.7%
2.4%
2.7%
3.6%
4.4%
4.9%
6.0%
9.0%
10.0%
12.0%
13.6%
14.0%
15.0%
16.0%
16.6%
18.0%
-5.0% 0.0% 5.0% 10.0% 15.0% 20.0%
NHE as 9% of GDP (EU Avg. Scenario)
NHE as 10% of GDP (G8 Avg. Scenario)
NHE as 12% of GDP (France Scenario)
NHE Adjusted for McKinsey (MP) and $750B Waste
NHE as 14% of GDP
NHE as 15% of GDP
NHE as 16% of GDP
NHE less $375 billion in savings due to analytics
NHE as a % of GDP
National Health Expenditures Cost Curve Scenario Assumptions
NHE as % of GDP 2022E NHE CAGR 2014E to 2022E
Page 27
Internet & MediaDigital Healthcare April 6, 2015

Understanding the Stifel NHE Macro Scenario
In Exhibit 19, we illustrate the Stifel macro scenario associated with United States national health expenditures. The Stifel scenario assumes that new technology provided by HCIT and digital healthcare can have a positive effect on healthcare costs in the United States. Our macro scenario holds that national health expenditures can decline to roughly 16% of GDP by 2020 compared to the CMS cost estimate of 17.5% of GDP.
Exhibit 19: Stifel NHE as a % of GDP Base Case Scenario
Source: CMS, McKinsey & Co., and Stifel estimates
We illustrate the underlying cost savings drivers that support our view in Exhibit 20. Our macro base case of NHEs at 16% of U.S. GDP by 2020 represents between a $300 billion and $400 billion difference from current CMS estimates published in July 2014. We believe our scenario may be achievable for several reasons. First, we point to the estimated $300 billion to $450 billion in annual savings associated with the development and application of analytics in health care, according to McKinsey & Co. Second, we note that the U.S. healthcare complex generates roughly $750 billion in waste annually.
Exhibit 20: Key Drivers of the Stifel NHE Scenario in 2020
Source: CMS, McKinsey & Co., StartUp Health, and Stifel estimates
2,893 3,014
3,145 3,285
3,434 3,583
3,732 16.7%
16.6%
16.4%
16.3%
16.2%
16.1%
16.0%
15.6%
15.8%
16.0%
16.2%
16.4%
16.6%
16.8%
0
500
1,000
1,500
2,000
2,500
3,000
3,500
4,000
2014E 2015E 2016E 2017E 2018E 2019E 2020E
U.S. National Health Expenditure Trends
National Health Expenditures at 16% of GDP NHE as a % of GDP
16.7%
16.7%16.8%
16.9%17.0%
17.2%
17.5%
16.6%16.4%
16.3%16.2%
16.1%16.0%
15.0%
15.5%
16.0%
16.5%
17.0%
17.5%
18.0%
2014E 2015E 2016E 2017E 2018E 2019E 2020E
National Health Expenditures as a % of U.S. GDP: 2014E to 2020E
NHE as a % of GDP NHE as 16% of GDP
We Estimate a 150 Bps Decline in NHEs as a % of US GDP in 2020
What Supports Our Scenario?McKinsey & Co Estimates: $300B to $450B
Annual Waste of $750B
Page 28
Internet & MediaDigital Healthcare April 6, 2015

Part 4: Understanding the Total Addressable Market Opportunity
Analyzing and understanding the total addressable market (TAM) associated with EHRs represents a complex and painstaking process. We note that several sources provide a wide range of market estimates and use different methodologies to obtain a TAM estimate. In our view, the most reliable fundamental data sources used to derive a TAM estimate for the EHR industry include: (1) national health expenditure data estimates from CMS, (2) Gartner, and (3) Cerner’s past presentation of an unofficial outlook for 2020. We estimate the industry may grow at a compound annual growth rate between 4.5% and 5.5% through 2020. Given the low industry growth rate, we believe outsized growth at traditional EHR vendors suggests such vendors will benefit from share gains via a replacement market or new growth opportunities via software-enabled services (SES).
In Exhibits 21–23, we illustrate our base, bear, and bull global EHR total addressable market estimates based on our macro scenario of NHEs representing 16% of U.S. GDP in 2020. Our three scenarios illustrate the global total addressable market for EHRs, based on our base case of U.S. national health expenditures reaching 16% of GDP, or roughly $3.7 trillion, in 2020 compared to roughly $4.0 trillion based on current CMS estimates. The key assumption in our TAM analysis revolves around the hospital IT spending as a percentage of U.S. national health expenditures. We provide a base, bear, and bull scenario, which revolve around a 3.5% IT spending penetration rate in the base case, a 2.5% IT spending penetration rate in the bear case, and a 4.5% IT spending penetration rate in the bull case. In both the bear and bull cases, we assume a gradual decrease / increase over the 2012 to 2020 period reaching the 2.5% / 4.5% target in FY20E. We note that the applicable penetration range falls between 2.5% and 5.0%. Based on our research, we think the industry will be hard pressed to increase spending penetration from 3.5% to 5.0%.
Based on industry data, we assume the hospital focused EHR market TAM was roughly $33.9 billion as of FY12E. We add an additional $10 billion to represent the ambulatory or physician market TAM as of FY12E, which yields a total U.S. EHR market TAM of roughly $43.9 billion. In order to estimate the global EHR market TAM, we apply a factor of 2x and 2.5x the U.S. EHR TAM. We recognize the lack of scientific precision associated with this global estimate. We believe our global EHR TAM for FY12E may be accurate because Gartner and Cerner data suggest the global TAM in FY12E was approximately $89.7 billion.
In Exhibit 21, we provide a graphical illustration of the U.S. EHR TAM for the 2012E to 2020E period. Additionally, our illustration provides a detailed walk-down of our U.S. and global EHR TAM estimates for the 2012 to 2020 period. We note that our aggregate hospital TAM consists of a discrete analysis of the hospital market by bed size and show the aggregate addressable market here for illustrative purposes.
Page 29
Internet & MediaDigital Healthcare April 6, 2015

Exhibit 21: Global EHR Total Addressable Market Base Case - CMS
Source: AHA, CMS, and Stifel
In Exhibit 22, we illustrate our global EHR total addressable market bear case. Our bear case scenario assumes that IT spending as a percentage of U.S. national health expenditures will decline from 3.5% in 2012E to 2.5% in 2020E. The decline in spending rate from 3.5% to 2.5% results in a TAM CAGR of 1.4% for the 2012E to 2020E period.
Exhibit 22: Global EHR Total Addressable Market Bear Case
Source: AHA, CMS, and Stifel
TAM Analysis 2012E 2013E 2014E 2015E 2016E 2017E 2018E 2019E 2020E
Hospital TAM (3.5%) 30.9$ 32.2$ 33.6$ 35.0$ 36.6$ 38.2$ 40.0$ 41.5$ 43.1$
Ambulatory 10.0$ 10.5$ 11.0$ 11.6$ 12.2$ 12.8$ 13.4$ 14.1$ 14.8$
Total TAM 40.9$ 42.7$ 44.6$ 46.6$ 48.8$ 51.0$ 53.4$ 55.6$ 57.9$
TAM Analysis 2012E 2013E 2014E 2015E 2016E 2017E 2018E 2019E 2020E
US + Intl. TAM (2x US) 81.8$ 85.3$ 89.3$ 93.1$ 97.5$ 101.9$ 106.8$ 111.2$ 115.8$
US + Intl. TAM (2.5x US) 102.2$ 106.7$ 111.6$ 116.4$ 121.9$ 127.4$ 133.5$ 139.0$ 144.7$
$40.9 $42.7
$44.6 $46.6
$48.8 $51.0
$53.4 $55.6
$57.9
$-
$10.0
$20.0
$30.0
$40.0
$50.0
$60.0
$70.0
2012E 2013E 2014E 2015E 2016E 2017E 2018E 2019E 2020E
HCIT TAM Base Scenario
Our HCIT TAM Base Scenario:Spending remains 3.5% of US NHE
for the FY12E to FY20E period,
which results in a 4.4% CAGR
TAM Analysis 2012E 2013E 2014E 2015E 2016E 2017E 2018E 2019E 2020E
Hospital TAM (2.5%) 30.9$ 31.0$ 31.2$ 31.2$ 31.4$ 31.4$ 31.4$ 31.1$ 30.8$
Ambulatory 10.0$ 10.5$ 11.0$ 11.6$ 12.2$ 12.8$ 13.4$ 14.1$ 14.8$
Total TAM 40.9$ 41.5$ 42.2$ 42.8$ 43.5$ 44.1$ 44.8$ 45.2$ 45.6$
TAM Analysis 2012E 2013E 2014E 2015E 2016E 2017E 2018E 2019E 2020E
US + Intl. TAM (2x US) 81.8$ 83.0$ 84.5$ 85.6$ 87.0$ 88.3$ 89.7$ 90.4$ 91.1$
US + Intl. TAM (2.5x US) 102.2$ 103.8$ 105.6$ 107.0$ 108.8$ 110.3$ 112.1$ 113.0$ 113.9$
$40.9
$41.5
$42.2
$42.8
$43.5
$44.1
$44.8 $45.2
$45.6
$38.0
$39.0
$40.0
$41.0
$42.0
$43.0
$44.0
$45.0
$46.0
2012E 2013E 2014E 2015E 2016E 2017E 2018E 2019E 2020E
HCIT TAM Bear Scenario
Our HCIT TAM Bear Scenario:Spending declines from 3.5% of US NHE
in FY12E to 2.5% of US NHE in FY20E
The decline results in a 1.4% CAGR
Page 30
Internet & MediaDigital Healthcare April 6, 2015

In Exhibit 23, we illustrate our global EHR total addressable market bull case. Our bull case scenario assumes that IT spending as a percentage of U.S. national health expenditures increases from 3.5% in 2012E to 4.5% in 2020E. In our view, the bull case scenario seems aggressive as the resulting CAGR for the 2012E to 2020E period is roughly 7.0%. We believe the presupposition of digital healthcare and healthcare IT revolves around the fact that such solutions focus on bending the healthcare cost curve. In our view, traditional enterprise EHR vendors do not seem well equipped to help bend the cost curve; therefore we find it difficult to believe the bull case will materialize.
Exhibit 23: Global EHR Total Addressable Market Bull Case
Source: AHA, CMS, and Stifel
We provide an illustration of the U.S. EHR total addressable market based on Gartner and Leidos estimates in Exhibit 24. Based on the Gartner and Leidos data, the total addressable EHR market in the U.S. will grow at a 5.3% CAGR between 2012E and 2020E growing from $35.0 billion to $52.8 billion during that time. Additionally, we note that Leidos estimates the international health IT market to be greater than $90 billion, as of early 2013. Our view is that while the international market represents a large opportunity it remains a relatively untapped market, and we are unsure of the true value of this market. According to Gartner and Leidos data, the U.S. EHR opportunity can be segmented into five separate categories, including: hardware, telecom, software, internal services, and IT services. Based on industry data, we believe the majority of EHR vendors do address the telecom segment and may not really address the internal services segment either. Importantly, we note the overall EHR total addressable market seems to be growing at a 5.3% CAGR for the 2012E to 2020E period, which we believe may be slower than some investor and company estimates.
TAM Analysis 2012E 2013E 2014E 2015E 2016E 2017E 2018E 2019E 2020E
Hospital TAM (4.5%) 30.9$ 33.3$ 36.0$ 38.7$ 41.8$ 45.0$ 48.6$ 51.9$ 55.4$
Ambulatory 10.0$ 10.5$ 11.0$ 11.6$ 12.2$ 12.8$ 13.4$ 14.1$ 14.8$
Total TAM 40.9$ 43.8$ 47.0$ 50.3$ 54.0$ 57.8$ 62.0$ 66.0$ 70.2$
TAM Analysis 2012E 2013E 2014E 2015E 2016E 2017E 2018E 2019E 2020E
US + Intl. TAM (2x US) 81.8$ 87.6$ 94.1$ 100.6$ 108.0$ 115.6$ 124.0$ 132.0$ 140.4$
US + Intl. TAM (2.5x US) 102.2$ 109.5$ 117.6$ 125.8$ 135.0$ 144.4$ 155.0$ 164.9$ 175.5$
$40.9 $43.8
$47.0 $50.3
$54.0 $57.8
$62.0 $66.0
$70.2
$-
$10.0
$20.0
$30.0
$40.0
$50.0
$60.0
$70.0
$80.0
2012E 2013E 2014E 2015E 2016E 2017E 2018E 2019E 2020E
HCIT TAM Bull Scenario
Our HCIT TAM Base Scenario:Spending increases from 3.5% of US NHE
in FY12E to 4.5% of US NHE in FY20E
The increase results in a 7.0% CAGR
Page 31
Internet & MediaDigital Healthcare April 6, 2015

Exhibit 24: U.S. EHR Market Opportunity 2012E to 2020E
Source: Gartner, Leidos, and Stifel
In Exhibit 25, we illustrate the global total addressable market for EHRs based on Accenture analysis. We note that Accenture’s analysis may be outdated, as the analysis was performed in August 2010. Nevertheless, we believe the analysis illustrates our concern that the EHR industry TAM may be lower than many realize. As we noted about Exhibit 24 above, traditional HCIT EHR vendors do not participate across all segments of the EHR TAM. Therefore, we think Accenture’s analysis provides a glimpse into the extreme bear scenario around the TAM associated with EHRs.
Exhibit 25: Accenture Global EHR Total Addressable Market
Source: Accenture, “Overview of International EMR/EHR Markets: Results from a Survey of Leading Health Care Companies,” August 2010.
$35.0 $36.3$38.3
$40.4 $42.6
$44.9$47.4
$50.0 $52.8
$0.0
$10.0
$20.0
$30.0
$40.0
$50.0
$60.0
2012 2013 2014 2015 2016 2017 2018 2019 2020
U.S. Healthcare Provider IT Market
Hardware Telecom Software Internal Services IT Services
2012E to 2020 CAGRsHardware = 5.3%Telecom = 3.1%Software = 6.9%
Internal Services = 3.5%IT Services = 7.0%
Total = 5.3%
AsiaPacific
$2.9
EALA$7.0
NorthAmerica
$9.8
EHR TAM Estimate
Page 32
Internet & MediaDigital Healthcare April 6, 2015

We provide an illustration of how Allscripts historically framed their view of the EHR total addressable market in Exhibit 26. Allscripts historically viewed the market opportunity through three areas: ambulatory stand-alone, acute stand-alone, and the integrated market, which consists of a hospital adopting both an ambulatory and an acute system from the same vendor. We note the Allscripts view seems to be based on market data from 2013 from a McKinsey & Company study. We believe Allscripts view aligns with the data presented from Gartner and Leidos. While some investors believe this analysis suggests the EHR market is quite large, we would be cautious given our belief that a successful rip and replace cycle requires a value proposition around low cost and agility, which is significantly different from traditional vendor offerings. Should a cloud-based vendor develop a successful inpatient offering, the total addressable market could shrink due to a low cost to adopt a cloud-based system and lower switching costs.
Exhibit 26: TAM Analysis According to Allscripts
Source: Allscripts, McKinsey & Company, and Stifel
In Exhibit 27, we illustrate the total addressable market as characterized by Quality Systems. The company views its total addressable market across four major areas: dental software, ambulatory software, less than 100 bed hospital software, and revenue cycle management services. We include this analysis to provide investors with a look at how certain vendors segment the opportunity, as well as to provide a different TAM estimate. For example, we note that Quality Systems estimates the ambulatory software market opportunity to be about $6 billion and 60% to 70% penetrated. We believe other vendors, similar to Allscripts estimates above, view the ambulatory opportunity as closer to $10 billion. Additionally, Quality Systems estimates the less than 100 bed hospital software market opportunity to be roughly $1 billion to $2 billion. Based on our estimates using CMS data and American Hospital Association data, we estimate the less than 100 bed market to be a $2.4 billion opportunity. We believe the size of the addressable market may change as lower cost and more agile solutions are introduced to the market.
$16.0
$10.0
$17.0
$0.0
$5.0
$10.0
$15.0
$20.0
$25.0
$30.0
$35.0
$40.0
$45.0
Acute Stand-Alone
Ambulatory Stand-Alone
Integrated / CompleteSolution
Page 33
Internet & MediaDigital Healthcare April 6, 2015

Exhibit 27: TAM Analysis According to Quality Systems
Source: Quality Systems and Stifel
In Exhibit 28, we provide an illustration of EHR market share among Hospitals in the United States based on reported information from hospitals participating in the CMS EHR incentive program as of December 2014. Three vendors dominate the market, including: MEDITECH, Epic, and Cerner. When adjusting the CMS data to reflect Cerner’s acquisition of Siemens Healthcare, Cerner’s market share increases to 20.0% and 936 hospitals. While two primary vendors, Epic and Cerner, dominate the high end of the hospital market, the number of EHR providers servicing the middle and lower end of the market remains numerous. According to CMS, roughly 179 health IT vendors supplied a certified EHR product to 4,623 hospitals participating in the CMS EHR incentive programs. Three vendors, including: MEDITECH, Epic, and Cerner, represents more than 53% of market share among participating hospitals. CMS notes that the top 10 EHR vendors provide an EHR to more than 9 out of 10 hospitals.
Exhibit 28: EHR Vendor Market Share Based on Hospitals
Source: Office of the National Coordinator for Health Information Technology. ‘Electronic Health Record Vendors Reported by Hospitals Participating in the CMS EHR Incentive Programs,’ Health IT Quick-Stat #29. http://dashboard.healthit.gov/quickstats/pages/FIG-Vendors-of-EHRs-to-Participating-Hospitals.php. February 2015.
$-
$10.0
$20.0
$30.0
$40.0
$50.0
$60.0
0% 10% 20% 30% 40% 50% 60% 70% 80% 90%
To
tal A
dd
res
sa
ble
Ma
rke
t O
pp
ort
un
ity
Penetration of Total Addressable Market Opportunity
Dental Software
<$1B80%
Penetrated
Ambulatory Software
$6B60-70%
Penetrated
<100 BedHospital
Software$1-2B
60-70%
RCMServices
$50B20-25%
Penetrated
10
18
32
74
151
209
228
299
313
408
449
708
835
953
Iatric Systems
T-System Technologies
Health Care Systems
NextGen Healthcare
Allscripts
Healthland
Siemens Medical Solutions
Other
Medhost
McKesson
CPSI
Cerner
Epic
MEDITECH
Vendor Count
0.2%
0.4%
0.7%
1.6%
3.2%
4.5%
4.9%
6.4%
6.7%
8.7%
9.6%
15.1%
17.8%
20.3%
Iatric Systems
T-System Technologies
Health Care Systems
NextGen Healthcare
Allscripts
Healthland
Siemens Medical Solutions
Other
Medhost
McKesson
CPSI
Cerner
Epic
MEDITECH
Market Share
Page 34
Internet & MediaDigital Healthcare April 6, 2015

In Exhibit 29, we illustrate EHR market share in the United States as of December 2014 based on reported information from professionals participating in the CMS EHR incentive program. Despite the dominance of a few vendors, we note that the EHR industry remains extremely fragmented illustrated by the large number of vendors providing EHR products. According to CMS, roughly 760 health IT vendors supplied a certified EHR product to more than 479,820 health care professionals participating in the CMS EHR incentive program. The top five vendors, including Epic, Allscripts, eClinicalWorks, NextGen Healthcare, and GE Healthcare, represent more than 50% of market share among participating professionals. CMS estimates that the top 10 EHR vendors serving professionals supply the primary EHR for 7 out of 10 professionals.
Exhibit 29: EHR Vendor Market Share Based on Professionals
Source: Office of the National Coordinator for Health Information Technology. ‘Electronic Health Record Vendors Reported by Health Care Professionals Participating in the CMS EHR Incentive Programs and ONC Regional Extension Centers Program,’ Health IT Quick-Stat #30. http://dashboard.healthit.gov/quickstats/pages/FIG-Vendors-of-EHRs-to-Participating-Professionals.php. February 2015.
In Exhibit 30, we illustrate an EHR vulnerability analysis recently published by KLAS Enterprises, LLC, in 2015. The analysis represents a simple survey of hospitals asking whether or not they intend to replace their current EHR system. Based on the survey data, the only company not facing any sort of customer attrition is Epic. We note that the largest vendor platforms exhibit the greatest stability (e.g., Epic and Cerner). In our view, the results of the vulnerability analysis could look quite different with the introduction of low cost and agile acute care EHR solutions.
4,745
5,966
10,927
13,039
15,373
18,640
22,594
29,280
37,704
41,025
45,677
49,236
91,073
101,205
Eyefinity/OfficeMate
e-MDs
McKesson
athenahealth
Practice Fusion
Cerner
Greenway Medical
GE Healthcare
NextGen Healthcare
eClinicalWorks
Less than 1.0% Share (18 Vendors)
Allscripts
Others
Epic
Vendor Count
1.0%
1.2%
2.2%
2.7%
3.2%
3.8%
4.6%
6.0%
7.8%
8.4%
9.4%
10.1%
18.7%
20.8%
Eyefinity/OfficeMate
e-MDs
McKesson
athenahealth
Practice Fusion
Cerner
Greenway Medical
GE Healthcare
NextGen Healthcare
eClinicalWorks
Less than 1.0% Share (18 Vendors)
Allscripts
Others
Epic
Market Share
Page 35
Internet & MediaDigital Healthcare April 6, 2015

Exhibit 30: Understanding the EHR Replacement Opportunity
Source: KLAS Enterprises, LLC, and Stifel
We illustrate the fact that no EHR vendor seems to be immune to customer attrition in Exhibit 31. The vendors of highest quality among healthcare systems exhibit significantly more customer wins compared to client defections in 2013. We believe the analysis illustrates the fact that health systems are willing to rip and replace even the most expensive EHR systems in certain instances. We believe movement might look significantly different in an environment where a low cost and agile solution can be deployed among hospitals. In our view, in order to drive movement, vendors must approach the market with new value propositions around cost and short implementation cycles, which are differentiated from the industry.
Exhibit 31: EHR Customer Movement in 2013
Source: “Clinical Marketshare 2014: Competition Mounts as Markets Collide,” June 2014, KLAS
Enterprises, LLC, all rights reserved, www.klasresearch.com, and Stifel.
14
15
21
22
32
36
64
81
2
2
6
6
4
2
5
4
9
2
43
5
2
11
21
10
4
8
4
6
QuadraMed
McKesson Horizon
GE Healthcare
Siemens INVISION
MEDITECH MAGIC
MEDITECH C/S
Siemens Soarian
MEDITECH 6.0
McKesson Paragon
Allscripts
Cerner
Epic
EMR Replacement Vulnerability Analysis
No Maybe Yes
-14
-11
-12
-1
-8
-42
-10
-1
-2
-15
-3
-4
-8
-13
-13
-9
-28
-19
-7
-4
1
3
18
8
31
46
5
7
8
11
9
18
33
56
62
GE Healthcare
Quadramed
Allscripts
Medhost (HMS)
Healthland
CPSI
Siemens
McKesson
MEDITECH
Cerner
Epic
2013 Market Movement by Hospital Size
Losses Over 200 Beds Losses, 1-200 Beds Wins, 1-200 Beds Wins, Over 200 Beds
Page 36
Internet & MediaDigital Healthcare April 6, 2015

In Exhibit 32, we illustrate the change in competitive environment among EHR vendors between 2014 and 2015 according to a KLAS Research report titled, “Acute Care EMR Purchasing Plans 2015: New Energy in a More Competitive Market.” The data illustrates that providers looking to purchase an EMR are largely undecided, which marks a significant departure from a year ago. Additionally, the competitive gap between Epic and Cerner seems to have declined as well. In our view, the KLAS data further supports our view that a vendor with a low cost, agile solution faces an opportunity to significantly disrupt the market.
Exhibit 32: The Competitiveness of the Acute EMR Purchasing Environment
Source: KLAS Research and Stifel.
22%
41%4%
1%
10%
13%
12%
5%
36%
25%
14% 14%
2% 1%
0%
10%
20%
30%
40%
50%
60%
70%
80%
90%
100%
2014 2015
Acute EMR Purchasing Plans: 2014 Vs. 2015
Allscripts
Cerner
Epic
McKesson Paragon
Meditech 6.0
Other
Siemens Soarian
Up For Grabs
Page 37
Internet & MediaDigital Healthcare April 6, 2015

Part 5: An Overview of Key Industry Drivers – Raining Mandates
We believe several disruptive forces permeate the healthcare industry and are driving the development of digital healthcare. Changes stemming from the ACA are further driving the consumerization of healthcare. The disruptive forces facing healthcare impact the entire care continuum ranging from benefits design and delivery to the actual information infrastructure to consumer engagement and health management.
We believe the front end of disruption revolves around benefits delivery and benefit plan design. Employers continue to shift healthcare costs to consumers as high deductible health plans (HDHPs) increasingly become the norm. Companies such as Castlight Health and Change Healthcare are providing cost transparency to help employers drive lower healthcare and benefit costs. Additionally, we note that defined contribution exchanges are developing more sophisticated ways to recommend health plans to consumers. We believe tools such as algorithmic recommendations place defined contribution exchanges at the forefront of exchange technology innovation, and further illustrate the need to not only provide a service or product, but to truly engage the consumer during the decision process.
In terms of healthcare information technology, we believe two super-cycles exist: the Healthcare IT Adoption Super-Cycle and the Healthcare IT Replacement Super-Cycle. The $22 billion in stimulus funding made possible by HITECH / ARRA created an EHR adoption super-cycle. The cycle began in the 2007 to 2009 period and lasted through the 2011 to 2013 period. The rush to adopt technology due to incentive payments created a highly fragmented market of nearly 500 different vendors. In our view, the key characteristics of the adoption cycle revolve around inter- and intra- operability issues as well as systems characterized by high installation costs and costly maintenance fees. Additional catalysts driving technological adoption involved regulatory requirements such as Meaningful Use measures, which drive the ability to obtain incentive payments, as well as technology transitions such as the move to ICD-10.
In our view, the Healthcare IT Replacement Super-Cycle will play out over the next five or 10 years and should favor companies using cloud-based modern technological solutions. We believe the key drivers of the replacement cycle include: doctor dissatisfaction with current systems, further cloud-development and awareness, consolidation of the 500-plus EHR vendors in existence, and meeting technological requirements of Meaningful Use. We believe the key characteristics of the replacement cycle will include greater interoperability and collaboration, as well as better financial alignment with current pay-for-performance structures. In our view, the key catalysts that will drive replacement include improved technology, increased awareness of the cloud, and medical providers and health systems looking to differentiate their offerings via technology.
We believe the replacement cycle will be extremely long, and will exhibit cycle times significantly longer than ambulatory enterprise sales deals. In our view, the Cerner acquisition of Siemens illustrates our view, as we believe the acquisition will represent a replacement jump start by forcing clients on the oldest Siemens systems to switch. Additionally, the commentary of representatives from Ascension and CHRISTUS at athenahealth’s annual investor summit illustrates our view. These representatives were reluctant to “rip and replace” due to significant investments and talked about a view towards optimizing first.
Page 38
Internet & MediaDigital Healthcare April 6, 2015

In Exhibit 33, we illustrate the costly nature of electronic health record upgrades, which we believe helps illustrate the costly nature of the rip and replace decision. According to a study from Peer60, major upgrade expenses at the three major EHR vendors (Allscripts, Cerner, and Epic), average between 20% and 50% of the initial contract value. In our view, the most successful value proposition in the replacement super-cycle revolves around providing prospective customers little to no switching costs. We believe cloud-based vendors are the best positioned to provide such a value proposition. In our view, cloud-based vendors can help facilitate a switch to a new system with a more economical installation cost, and monetize their services in a way that is aligned with their client. We believe these are the key characteristics that will allow athenahealth to successfully enter the acute care market and ultimately gain market share over the next several years.
Exhibit 33: EHR Upgrades Are Quite Costly
Source: The Total Cost of Ownership of Electronic Health Record Systems, Peer60, 2013.
We see the shift to SES as the first step in the development of the replacement cycle. In our view, hospitals will seek to optimize their current EHR investments before considering replacement. Optimization will involve a shift in strategy from infrastructure technology investment to performance driven technology investment. In the new SES / optimization era, vendors must provide performance in terms of not only better outcomes, but also in terms of adding value through performance and cost reduction.
In our view, the replacement cycle will also have difficulty evolving as vendors seem to be utilizing the same value proposition that drove the adoption super-cycle era. We believe that in order to drive a successful replacement market, vendors must provide a value proposition that revolves around minimal upfront investment to switch. As long as traditional EHR vendor models are levered to high installation costs and high maintenance fees, replacement opportunities will remain minimal. The key question will be can traditional EHR vendors change their models before cloud-based vendors such as athenahealth and Practice Fusion build out acute care offerings?
In other words, we believe that providers and health systems will ultimately view the cloud, especially in terms of infrastructure, as a way to improve their ranking and standing through technology. Additionally, as Meaningful Use requirements become more complex, replacement becomes a more realistic option. We provide an illustration of our thoughts regarding the Healthcare IT Adoption Super-Cycle and Healthcare IT Replacement Super-Cycle in Exhibit 34.
~2%
~1%
~3% to 5%
~3%
10% to 13%
40% to 49%
30% to 35%
20% to 22%
McKesson
Epic
Cerner
Allscripts
Major Upgrades Minor Upgrades
Page 39
Internet & MediaDigital Healthcare April 6, 2015

Exhibit 34: The HCIT Adoption and Replacement Super Cycles
Source: Stifel
Meaningful Use measures represent an additional driver of technological disruption driving the EHR replacement cycle. We note that Meaningful Use requirements represent the standards that drive the ability of a provider to obtain incentive payments for adoption of an EHR under the HITECH/ARRA act. Meaningful Use Stage 1 began in 2011 and requires meeting 15 core objectives and five of 10 menu objectives. Meaningful Use Stage 2 began in 2014 and requires meeting 17 core objectives and three of six menu objectives. Additionally, eligible providers must report on nine out of 64 approved clinical quality measures (CQMs).
We note that Meaningful Use Stage 3 is set to begin in 2016. Currently, many are lobbying for the inclusion of patient-centric biometric device functionality and telehealth measures in MU Stage 3. We believe as the standards and requirements of Meaningful Use increase that the cloud will be seen as the best option for solutions in the future.
We provide an overview of the Meaningful Use program in Exhibit 35. The Meaningful Use program occurs over three stages focused on three primary objectives. The primary goal of Stage 1 revolves around data capture and sharing. The primary goal of Stage 2 revolves around advance clinical processes. The primary goal of Stage 3 revolves around improved outcomes. The industry is currently moving from Stage 1 to Stage 2 for the most part and continues to await the criteria for Stage 3. In our view, Stage 1 has failed in terms of sharing, as interoperability remains a key issue of our digital healthcare infrastructure.
The Healthcare IT Adoption Super-Cycle and Replacement Super-Cycle
The Adoption Super-Cycle The Replacement Super-Cycle
Drivers: HITECH/ARRA Stimulus Rush to adopt Fragmented market - 500-plus
vendors
Drivers: Doctor disatisfaction Cloud-development Consolidation Meaningful Use and ICD-10, et al.
Characteristics: Interoperability difficulties Intraoperability difficulties High costs: implementation and
maintenance
Characteristics: More interoperability Colaboration due to technology Costs aligned with performance
Catalysts: Meaningful Use measures ICD-10 transition Other technological requirements
Catalysts: Better technology Increased adoption of the Cloud Differentiation via technology
Software Enabled Services (SES)
Drivers: Infrastructure optimization Operating margin degradation Health reform - demographics,
HDHPs, new reimbursement models
Characteristics: Meaningful ROI Data and outcomes driven
performance improvement and operational efficiencies
Catalysts: ROI driven technology investment Search for new revenue streams Defend against operating margin loss
Page 40
Internet & MediaDigital Healthcare April 6, 2015

Exhibit 35: An Overview of the CMS Meaningful Use Program
Source: CMS and Stifel
While the Meaningful Use program framework seems sound, we believe the process does have some negative impacts. First, each stage of Meaningful Use does not require attestation to all criteria, which we believe has led to a fragmented industry of vendors. These vendors exhibit various abilities to provide working solutions. In our view, the part and parcel nature of Meaningful Use creates an environment of being in the business of making sure clients need to do business with the vendor. We find it somewhat peculiar that a technology industry requires continual delays to meet the criteria of Meaningful Use. In our view, at some point the industry and the U.S. Government need to ask the question, “Does the problem lie in our criteria or does the problem lie in the underlying technology infrastructure?”
We provide an overview of the Meaningful Use Stage 2 measures eligible providers must meet to achieve attestation in Exhibit 36. Based on Meaningful Use Stage 2 attestations so far, providers continue to face a difficult time attesting.
Stage 1 - 2011 to 2012:Data Capture and Sharing
Stage 2 - 2014:Advance Clinical Processes
Stage 3 - 2016:Improved Outcomes
Focus of Stage 1 Criteria: Focus of Stage 2 Criteria: Focus of Stage 3 Criteria:
Electronically Capturing Health Information in a Standardized Format
Using Information to Track Key Clinical Conditions
More Rigorous Health Information Exchange (HIE)
Improving Quality, Safety, and Efficiency, Leading to Improved Health Outcomes
Increased Requirements for e-Prescribing & Incorporating Lab Results
Decision Support for National High-Priority Conditions
Communicating that Information for Care Coordination Processes
Electronic Transmission of Patient Care Summaries Across Multiple Settings
Patient Access to Self-Management Tools
Initiating the Reporting of Clinical Quality Measures and Public Health Information
More Patient-Controlled DataAccess to Comprehensive Patient Data
Through Patient-Centered HIE
Using Information to Engage Patients and Their Families in Their Care
Improving Population Health
Meaningful Use Criteria and Objectives: Stage 1, Stage 2, and Stage 3
Page 41
Internet & MediaDigital Healthcare April 6, 2015

Exhibit 36: Meaningful Use Stage 2 Measures for Eligible Providers
Source: CMS and Stifel
In Exhibit 37, we provide an overview of the Meaningful Use Stage 2 measures hospitals and critical access hospitals (CAHs) must meet in order to attest for Meaningful Use Stage 2. Much like providers, hospitals continue to face challenges in attesting for Meaningful Use Stage 2.
Exhibit 37: Meaningful Use Stage 2 Measures for Hospitals and CAHs
Source: CMS and Stifel
MU Stage 2 Core Requirements: MU Stage 2 Menu Objectives:
Satisfaction of All 17 Measures Required: Must Satisfy 3 of 6 Measures:
1. CPOE
2. eRX
18. Public Health Surveillance
19. Electronic Notes
3. Demographics 20. Incorporate Imaging
4. Vital Signs 21. Family History
22. Cancer Registry
Required Measures for Eligible Providers to Meet Meaningful Use Stage 2
5. Smoking Screen
6. Decision Support
7. Patients: View, Download,
8. Clinical Summaries
9. Data Security
10. Clinical Lab Results
11. Patient Lists
12. Patient Follow Up
13. Patient Education
14. Medication Reconciliation
15. Care Transitions
16. Immunization
17. Secure Communication
23. Other Registries
MU Stage 2 Core Requirements: MU Stage 2 Menu Objectives:
Satisfaction of All 16 Measures Required: Must Satisfy 3 of 6 Measures:
1. CPOE
2. eRX
17. Advance Directives - 65 & Older
18. Electronic Notes2. Demographics
19. Incorporate Imaging3. Vital Signs
20. Family History
21. eRx
Required Measures for Eligible Hospitals and CAHs to Meet Meaningful Use Stage 2
4. Smoking Screen
5. Decision Support
6. Patients: View, Download, Transmit
8. Clinical Lab Results
7. Data Security
9. Patient Lists
10. Patient Education
11. Medication Reconciliation
12. Care Transitions
13. Immunization
22. Provide Labs to Ambulatory Providers14. Lab Surveillance
15. Public Health Surveillance
16. Track Medications (eMAR)
Page 42
Internet & MediaDigital Healthcare April 6, 2015

We provide an overview of the Meaningful Use attestation program launch timeline in Exhibit 38. Incentive payments associated with Meaningful Use attestation are obtained over a several year period. Those who first attested in 2011 stand to obtain the greatest amount of incentive payments. Those entities that continue to wait will ultimately receive the least reimbursement funding.
Exhibit 38: Meaningful Use Launch Timeline
Source: CMS, MTBC, and Stifel
In Exhibit 39, we provide an illustration of the Meaningful Use incentive payment timeline. We note that total collectible Medicaid incentives are $63,750 per physician, but total collectible Medicare incentives decline each year with the maximum being $44,000 and the minimum being $24,000 per physician.
Exhibit 39: Meaningful Use Incentive Payment Timeline
Source: CMS and Stifel
We illustrate the number of Meaningful Use Stage 2 Attestations according to CMS in Exhibit 40. The data shown below compares the number of MU2 attestations as of November 1
st and December 1
st for both eligible hospitals and
critical access hospitals (CAHs), and eligible providers. Between November 1st
and December 1st, the number of eligible hospital and CAHs attestations
increased approximately 100% and the number of eligible professional attestations increased approximately 43%. We note that the aggregate totals as of December 1, 2015, pale in comparison to the attestation totals for MU1.
First
Payment
Year 2011 2012 2013 2014 2015 2016 2017 2018 2019 2020 2021
2011 1 1 1 2 2 3 3 TBD TBD TBD TBD
2012 1 1 2 2 3 3 TBD TBD TBD TBD
2013 1 1 2 2 3 3 TBD TBD TBD
2014 1 1 2 2 3 3 TBD TBD
2015 1 1 2 2 3 3 TBD
2016 1 1 2 2 3 3
2017 1 1 2 2 3ME
DIC
AR
E P
en
alt
ies B
eg
in i
n 2
015
Stage of Meaningful Use
Fall 2010 2011 2012 2013 2014 2015 2016 2017 2018 2019 2020 2021
$18,000 $12,000 $8,000 $4,000 $2,000 $44,000
$18,000 $12,000 $8,000 $4,000 $2,000 $44,000
$15,000 $12,000 $8,000 $4,000 $39,000
$12,000 $8,000 $4,000 $24,000
$21,250 $8,500 $8,500 $8,500 $8,500 $8,500 $63,750
$21,250 $8,500 $8,500 $8,500 $8,500 $8,500 $63,750
$21,250 $8,500 $8,500 $8,500 $8,500 $8,500 $63,750
$21,250 $8,500 $8,500 $8,500 $8,500 $8,500 $63,750
$21,250 $8,500 $8,500 $8,500 $8,500 $8,500 $63,750
$21,250 $8,500 $8,500 $8,500 $8,500 $8,500 $63,750
EHR Incentive Payment Timeline
Stage 1
Stage 2
Stage 3
Maximum
Payments
Medicare
Incentive
Payments
Medicaid
Incentive
Payments
Page 43
Internet & MediaDigital Healthcare April 6, 2015

Exhibit 40: A Current Look at Meaningful Use Stage 2 Attestations
Source: CMS, EHRIntelligence.com, and Stifel
In Exhibit 41, we illustrate key trends around eligible hospital and critical access hospital (CAH) Meaningful Use Stage 2 attestation trends. In the upper left quadrant, we illustrate the mix of hospitals and CAHs who were eligible to attest to Stage 1 or Stage 2 in 2014. In the upper right quadrant, we illustrate the attestation mix of those hospitals and CAHs eligible to attest to Stage 2. In the lower left quadrant, we illustrate the mix of hospitals and CAHs attesting to Stage 2 that required an exemption or not. Lastly, in the lower right quadrant, we illustrate the mix of technologies used to achieve Meaningful Use Stage 2 attestation.
According to the Office of the National Coordinator for Health Information Technology, there are 4,993 eligible hospitals, of which 54% or 2,700 were scheduled to attest to Stage 2 in 2014. Of these hospitals scheduled to attest to Stage 2, roughly 88% or 2,400 attested. Roughly 75% or 1,800 hospitals were able to attest to Stage 2, but roughly 25% or approximately 600 hospitals used the flexibility rule to attest to Stage 1.
Exhibit 41: Eligible Hospital and CAH Meaningful Use Stage 2 Attestations
Source: The Office of the National Coordinator for Health Information Technology, “Data Analytics Update: Health IT Policy Committee Meeting,” January 27, 2015.
1,681
16,455
840
11,478
Eligible Hospital & CAHs Eligible Professionals
December 1st November 1st
Stage 2-Eligible Hospital Attestation MixStage 2-Eligible Hospital Attestations
Proportion of Stage 2-Scheduled AttestingEligible Hospitals and CAHs
46%
54%
Stage 1 Eligible Stage 2 Eligible
25%
75%
Stage 1 Stage 2
62%13%
25%
2014 Certified EHR
Combo 2011 and 2014
2011 Certified
88%
12%
Attested Not Attested
Scheduled for
Stage 2
Scheduled for
Stage 1
FlexibilityRule
Stage 1
Page 44
Internet & MediaDigital Healthcare April 6, 2015

In Exhibit 42, we illustrate key trends around eligible professionals Meaningful Use Stage 2 attestation trends. In the upper left quadrant, we illustrate the mix of professionals who were eligible to attest to Stage 1 or Stage 2 in 2014. In the upper right quadrant, we illustrate the attestation mix of those professionals eligible to attest to Stage 2. In the lower left quadrant, we illustrate the mix of professionals attesting to Stage 2 that required an exemption or not. Lastly, in the lower right quadrant, we illustrate the mix of technologies used to achieve Meaningful Use Stage 2 attestation.
According to the Office of the National Coordinator for Health Information Technology, there are 537,600 eligible professionals, of which 42% or roughly 223,000 were scheduled to attest to Stage 2 in 2014. Of these hospitals schedule to attest to Stage 2, roughly 15% or roughly 33,000 attested. Of those professionals attesting, roughly 53% or 17,000 attested to Stage 2, while 47% or 16,000 used the flexibility rule to attest to Stage 1.
Exhibit 42: Eligible Professional Meaningful Use Stage 2 Attestations
Source: The Office of the National Coordinator for Health Information Technology, “Data Analytics Update: Health IT Policy Committee Meeting,” January 27, 2015.
Technological requirements driven by the government seem to represent a key catalyst for industry consolidation. Two major technological drivers revolve around the transition to the International Classification of Diseases 10th edition (ICD-10), as well as Meaningful Use measures. The transition to ICD-10 is important because these are the codes used to classify patient treatment and drive provider reimbursement. The ICD-9 to ICD-10 transition will increase the total number of codes from 18,000 to 155,000, see Exhibit 43. We note the deadline for switching over to ICD-10 is October 1, 2015.
Eligible Professionals Proportion of Stage 2-Scheduled Attesting
Stage 2-Eligible Professional Attestations Stage 2-Eligible Professional Attestation Mix
58%
42%
Stage 1 Eligible Stage 2 Eligible
Scheduled for
Stage 1
47%
53%
Stage 1 Stage 2
28%
6%65%
2014 Certified EHR
Combo 2011 and 2014
2011 Certified EHR
85%
15%
Attested Not Attested
Scheduled for
Stage 2
FlexibilityRule
Stage 1
Page 45
Internet & MediaDigital Healthcare April 6, 2015

Exhibit 43: ICD-10 Code Expansion Drives a Need for Education
Source: CMS, AMA, and Stifel
The looming healthcare professional workforce shortage will represent an impetus for further technology adoption. The U.S. Department of Health and Human Services estimates that physician supply will increase only 7% by 2020. Such tepid growth will not likely meet the demand associated with the 30 million-plus Americans entering the healthcare system because of the Affordable Care Act. Additionally, the Census Bureau expects the number of Americans over 65 to grow 36% by 2020. These two factors will make the looming physician shortage more acute and create an opportunity for SES solutions to help fill the gap.
Exhibit 44: Physician Supply / Demand Imbalance
Source: Association of American Medical Colleges and Stifel
14,000
68,000
ICD-9-CM ICD-10-CM
Diagnosis Codes
4,000
87,000
ICD-9-PCS ICD-10-PCS
Procedure Codes
699,100 709,700 735,600
759,800 785,400 706,500
723,400
798,500
851,300
916,000
500,000
550,000
600,000
650,000
700,000
750,000
800,000
850,000
900,000
950,000
1,000,000
2008 2010 2015E 2020E 2025E
Physician Supply / Demand Imbalance Provide an Opportunity
Physician Supply Physician Demand
Page 46
Internet & MediaDigital Healthcare April 6, 2015
Part 6: The Major Issues Associated with EHRs
Our negativity around the long-term opportunity associated with EHR vendors stems from the fact that EHRs remain focused primarily on developing transactional infrastructure. In our view, the industry continues to shift towards performance driven technology investment around value-added services that can optimize not only the EHR, but also drive performance improvement and operational efficiencies for the health system.
We believe there are several overarching issues with the current positioning of the EHR industry as well. For the most part, hospitals and physicians have adopted basic EHRs, as only 23.5% of physicians in the U.S. utilize a fully functional EHR system. The progress benchmarks such as the HIMSS EMRAM and HIMSS Ambulatory EMRAM models are static and really only provide insight as to how well a hospital installs software. The most valuable data sets remain unstructured and outside of the core data capture areas of the EHR. Interoperability and data sharing between different entities remains far from ubiquitous. We believe EHR vendors spend vast amounts on Research and Development, yet have little to show for the investment. Lastly, we think the industry must rethink its strategy around patient engagement, as the current strategy focuses on data connectivity rather than actual action. Our biggest problem revolves around our view that EHR systems seem poorly positioned to help the industry solve the main issues of health reform such as driving performance improvement and operational efficiencies throughout the care continuum.
We think the athenahealth analyst day provided a glimpse into the issues facing the EHR industry as well as U.S. healthcare. In early December 2014, roughly 85% of eligible hospitals had attested to Meaningful Use Stage 1, while only 34% of eligible had attested to Meaningful Use Stage 2. At that time, roughly 41% of EHR adopters could not enter lab or imaging orders or request a consult electronically. Roughly 72% of adults were unable to access their medical record online. Lastly, approximately 87% of physicians were unable to exchange information electronically with others outside of their organization. We believe these are issues that should be solved by the adoption of EHRs.
Furthermore, the presentation also highlighted the financial pressures facing health systems. In 2013, hospitals provided more than $49 billion in care that went uncompensated. Roughly 88% of patients did not receive their annual well visit and roughly 50% of consults and imaging orders are never closed. Additionally, the average patient waits 33.4 days for follow-up care, yet the average physician practice schedule is only 70% full. In our view, these are issues that should be solved by the EHR and the digitization of the U.S. healthcare system.
While adoption of basic EHR systems remains high throughout the U.S., less than 24% of U.S. physicians were using a fully functional EHR system. We highlight the components that comprise a basic EHR system based on the definition provided by The Office of the National Coordinator for Health Information Technology in Exhibit 45. We note that these basic systems lack important functionality associated with computerized provider order entry, as well as clinical decision support tools.
Page 47
Internet & MediaDigital Healthcare April 6, 2015

Exhibit 45: Electronic Functions Required for Hospital Adoption of Basic EHR Systems
Source: Update on the Adoption of Health Information Technology and Related Efforts to Facilitate the Electronic Use and Exchange of Health Information, The Office of the National Coordinator for Health Information Technology, October 2014, and Stifel.
In Exhibit 46, we illustrate the Health Information Management Systems Society (HIMSS) Analytics EMR Adoption Models. These models reflect hospital aspirations towards digitization and adoption of a paperless medical record. We believe these models represent a significant benchmark for hospitals, physicians, and EHR vendors. These entities can quickly assess how their organizations are facilitating and implementing EHR technology. In our view, the HIMSS EHR adoption model does the industry a disservice to some extent.
We believe the adoption model represents a static benchmark in an environment of technological advancement. Furthermore, we believe the adoption model merely provides an assessment of how well U.S. hospitals and physicians are at installing and adopting software. The problem is that these adoption models provide no way to really benchmark the efficiency or impact of the adopted technology.
We think the lack of Stage 7 adoption further illustrates the inefficiency of the EHR market. In our view, many vendors focus on providing a seemingly endless cycle of upgrades and new software purchases rather than providing a complete system. Furthermore, we believe the current static benchmark illustrates a hospitals financial resources or lack thereof, as the majority of Stage 6 and Stage 7 hospitals are larger, well financed entities. In our view, the HIMSS EMRAM adoption rates illustrates why vendors place such a strong emphasis on the transactional infrastructure rather than innovation around the value-added services that can improve the value and efficiency of the EHR. Lastly, we believe the static benchmark provides a further impediment to innovation, as the benchmark provides no impetus for hospitals to adopt innovative technology.
EHR Basic EHR w/o Basic EHR with Basic EHR with
Functions Clinician Notes Clinician Notes Clinician Notes
Required (Hospitals) (Hospitals) (Physicians)
Electronic Clinical Information
Patient Demographics X X X
Physician Notes X X
Nursing Assessments X
Problem Lists X X
Medication Lists X X X
Discharge Summaries X X
Advance Directives X X
Computerized Provider Order Entry
Lab Reports
Radiology Tests
Medications X X X
Consultation Requests
Nursing Orders
Results Management
View Lab Reports X X X
View Radiology Reports X X X
View Radiology Images
View Diagnostic Test Results X X X
View Diagnostic Test Images
View Consultant Report
Decision Support
Clinical Guidelines
Clinical Reminders
Drug Allergy Results
Drug-Drug Interactions
Drug-Lab Interactions
Drug Dosing Report
Page 48
Internet & MediaDigital Healthcare April 6, 2015

Exhibit 46: HIMSS Analytics EMR Adoption Models
Source: HIMSS Analytics and Stifel
Do EHRs Even Capture the Most Valuable and Relevant Data Sets? A major question facing EHR systems revolves around whether these systems actually collect the most valuable data sets. Based on a recent study from WebChartMD, only 7% of structured EHR data is required to meet meaningful use measures, which increases to 9% when lab results are included. The study authors suggest that 91% to 93% of data collected in an EHR should really be captured as unstructured data. In our view, the study actually begs the question “Are EHRs actually capturing the most relevant and valuable data set?”
The problem facing the healthcare system revolves around the fact that valuable analytic data points are captured in unstructured data. According to IDC Health Insights, more than 80% of health data today lies in unstructured formats e.g., free-text physician notes, patient histories, and hospital admission notes. Data required for meaningful use requirements include: demographics, vital signs, smoking status, problem list, medication list, medication allergies, lab tests/values, and minimum of one family history. The current data architecture fails to capture physco-social, socioeconomic, and environmental factors in structured and analyzable fashion. These unstructured data sets often times yield the best data sets used to drive risk stratification and predictive analytics.
Do EHRs Make Physicians More or Less Efficient? One would expect digitization of simple functions to increase the time needed to perform these functions. The learning curve of new technology, especially when shifting from pen and paper to digital, can be significant. The problem with EHRs revolves around the fact that even after several years of usage; the simplest task still takes a significant amount of time to complete.
According to an article published in JAMA called, “Use of Internists Free Time by Ambulatory Care Electronic Medical Record Systems,” illustrates how EHRs have taken valuable time from physicians. The survey consisted of 411 physician respondents that used 61 different EHR systems; roughly 66.5% of respondents have been using their EHR system for more than two years. The inefficient data capture of EHR systems drives significant time loss for physicians. In Exhibit 47, we illustrate how the EHR has for the most part decreased physician free time.
Stage Cumulative Capabilities 3Q14 4Q14 Stage Cumulative Capabilities 4Q14
Stage 7
Complete EMR; CCD transactions to share data;
Data warehousing; Data continuity with ED,
ambulatory, OP
3.4% 3.6% Stage 7
HIE capable, sharing of data between the EMR and
community based EHR, business, and clinical
intelligence
6.2%
Stage 6Physician documentation (structured templates),
full CDSS (variance & compliance), full R-PACS16.5% 17.9% Stage 6
Advanced clinical decision support, proactive care
management, structured messaging7.6%
Stage 5 Closed loop medication administration 29.5% 32.8% Stage 5 Personal health record, online tethered patient portal 7.3%
Stage 4CPOE, Clinical Decision Support (clinical
protocols)14.5% 14.0% Stage 4
CPOE, Use of structured data for accessibility in EMR
and internal and external sharing of data1.0%
Stage 3Nursing/clinical documentation (flow sheets),
CDSS (error checking), PACS available outside 23.9% 21.0% Stage 3
Electronic messaging, computers have replaced the
paper chart, clinical documentation and clinical 12.0%
Stage 2CDR, Controlled Medical Vocabulary, CDS, may
have Document Imaging; HIE capable5.3% 5.1% Stage 2
Beginning of a CDR with orders and results,
computers may be at point-of-care, access to results 28.1%
Stage 1 Ancilaries - Lab, Rad, Pharmacy - All Installed 2.5% 2.0% Stage 1Desktop access to clinical information, unstructured
data, multiple data sources, intra-office / informal 32.7%
Stage 0 All Three Ancilaries Not Installed 4.4% 3.7% Stage 0 Paper chart based 5.1%
U.S. EMR Adoption Model U.S. Ambulatory EMR Adoption Model
Page 49
Internet & MediaDigital Healthcare April 6, 2015
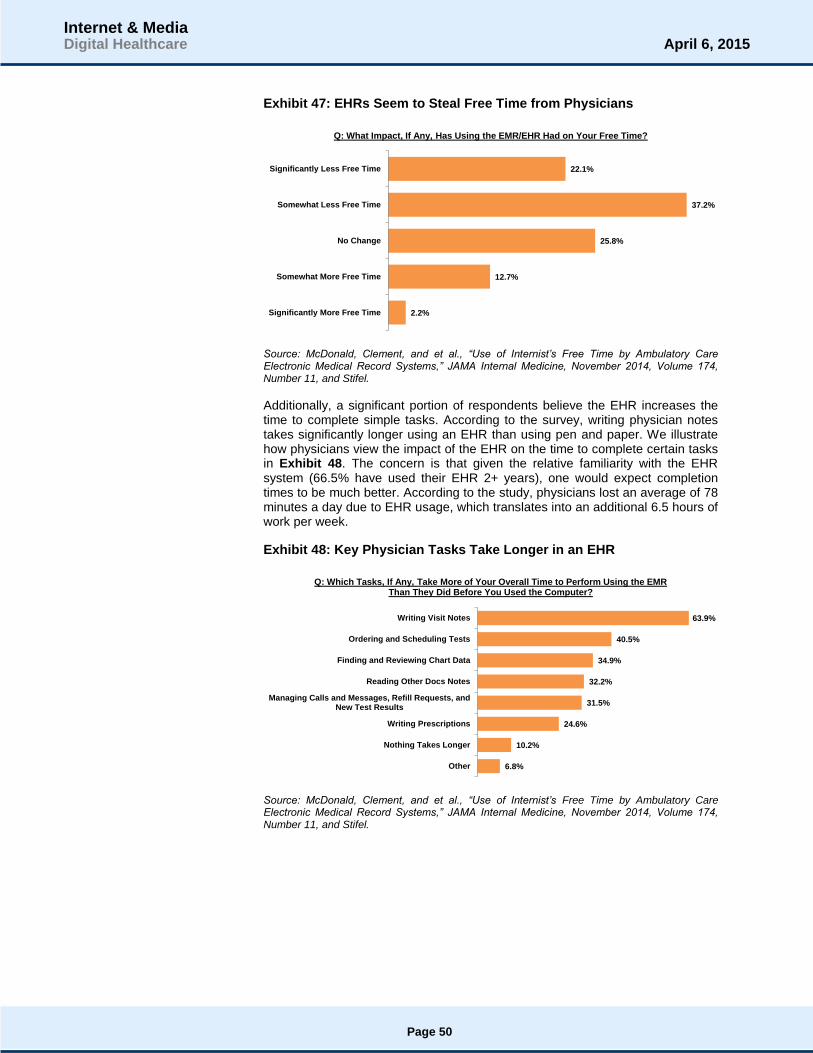
Exhibit 47: EHRs Seem to Steal Free Time from Physicians
Source: McDonald, Clement, and et al., “Use of Internist’s Free Time by Ambulatory Care Electronic Medical Record Systems,” JAMA Internal Medicine, November 2014, Volume 174, Number 11, and Stifel.
Additionally, a significant portion of respondents believe the EHR increases the time to complete simple tasks. According to the survey, writing physician notes takes significantly longer using an EHR than using pen and paper. We illustrate how physicians view the impact of the EHR on the time to complete certain tasks in Exhibit 48. The concern is that given the relative familiarity with the EHR system (66.5% have used their EHR 2+ years), one would expect completion times to be much better. According to the study, physicians lost an average of 78 minutes a day due to EHR usage, which translates into an additional 6.5 hours of work per week.
Exhibit 48: Key Physician Tasks Take Longer in an EHR
Source: McDonald, Clement, and et al., “Use of Internist’s Free Time by Ambulatory Care Electronic Medical Record Systems,” JAMA Internal Medicine, November 2014, Volume 174, Number 11, and Stifel.
2.2%
12.7%
25.8%
37.2%
22.1%
Significantly More Free Time
Somewhat More Free Time
No Change
Somewhat Less Free Time
Significantly Less Free Time
Q: What Impact, If Any, Has Using the EMR/EHR Had on Your Free Time?
6.8%
10.2%
24.6%
31.5%
32.2%
34.9%
40.5%
63.9%
Other
Nothing Takes Longer
Writing Prescriptions
Managing Calls and Messages, Refill Requests, andNew Test Results
Reading Other Docs Notes
Finding and Reviewing Chart Data
Ordering and Scheduling Tests
Writing Visit Notes
Q: Which Tasks, If Any, Take More of Your Overall Time to Perform Using the EMR Than They Did Before You Used the Computer?
Page 50
Internet & MediaDigital Healthcare April 6, 2015

In Exhibit 49, we illustrate health information exchange trends between non-federal acute care hospitals in 2013, according to The Office of the National Coordinator for Health Information Technology. As of 2013, hospitals were certainly sharing information, but we believe there is significant room for improvement. We note that seemingly basic information sets e.g., lab results, radiology reports, clinical care summaries, and medication lists, are not always widely exchanged. We believe the types of data sets shown in Exhibit 49 represent relatively basic data sets, which we believe should be able to be shared by all hospitals not some. In our view, the fact that data sharing is not higher further illustrates how EHRs and Government mandates may hinder actual progress.
Exhibit 49: Hospitals Are Sharing Data But Need to Improve
Source: ONC/American Hospital Association (AHA), AHA Annual Survey of Information Technology Supplement, and Stifel.
We illustrate the prevalence of electronically exchanged data between non-federal acute care hospitals and outside entities (providers, ambulatory providers, and other hospitals) in Exhibit 50. In our view, electronic exchange rates should be much higher. Current penetration levels further illustrate the issues associated with EHRs, especially around interoperability.
Exhibit 50: Percent of Hospitals Exchanging Data Electronically
Source: ONC/American Hospital Association (AHA), AHA Annual Survey of Information Technology Supplement, and Stifel.
37%
42%
55%
57%
Medication Lists
Clinical Care Summaries
Radiology Reports
Laboratory Results
Electronic Data Sharing Among Hospitals
41%45% 44%
50%
58%62%
36%40%
38%
44%
51%
57%
15%17%
19%
25%
36%40%
0%
10%
20%
30%
40%
50%
60%
70%
2008 2009 2010 2011 2012 2013
Percent of Hospitals Exchanging Certain Data Electronically
Any Providers Outside the Organization Ambulatory Providers Outside the Organization
Other Hospitals Outside the Organization
Page 51
Internet & MediaDigital Healthcare April 6, 2015
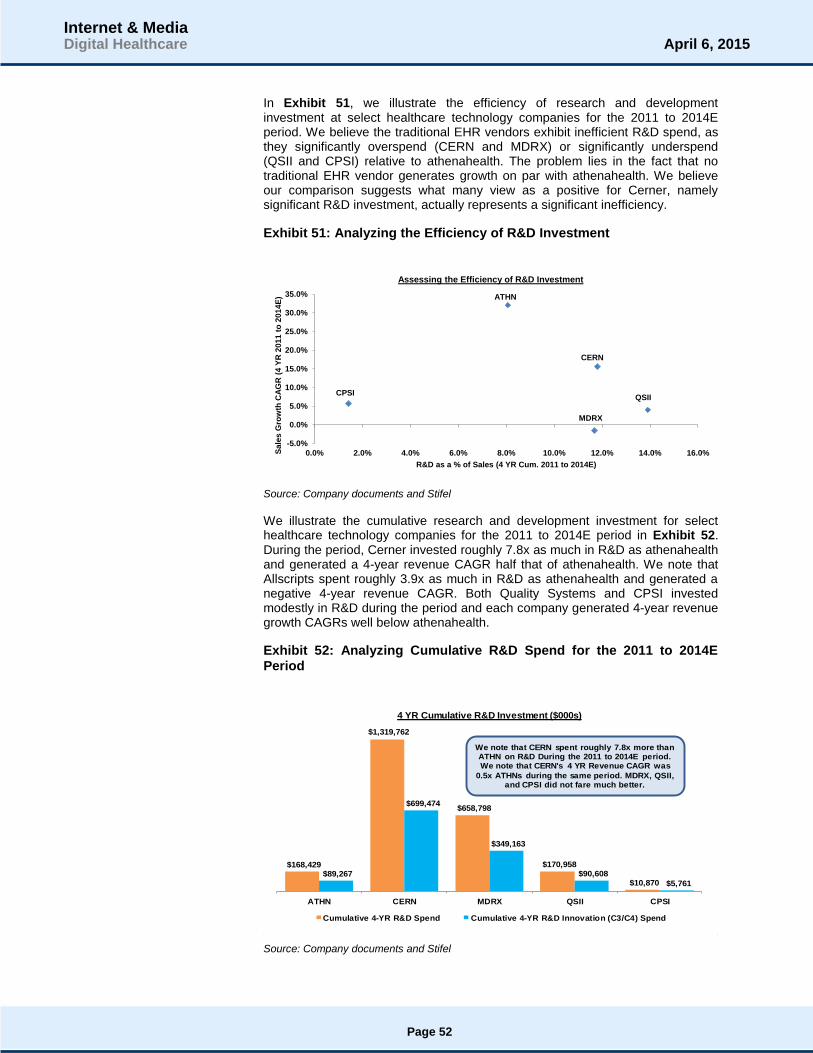
In Exhibit 51, we illustrate the efficiency of research and development investment at select healthcare technology companies for the 2011 to 2014E period. We believe the traditional EHR vendors exhibit inefficient R&D spend, as they significantly overspend (CERN and MDRX) or significantly underspend (QSII and CPSI) relative to athenahealth. The problem lies in the fact that no traditional EHR vendor generates growth on par with athenahealth. We believe our comparison suggests what many view as a positive for Cerner, namely significant R&D investment, actually represents a significant inefficiency.
Exhibit 51: Analyzing the Efficiency of R&D Investment
Source: Company documents and Stifel
We illustrate the cumulative research and development investment for select healthcare technology companies for the 2011 to 2014E period in Exhibit 52. During the period, Cerner invested roughly 7.8x as much in R&D as athenahealth and generated a 4-year revenue CAGR half that of athenahealth. We note that Allscripts spent roughly 3.9x as much in R&D as athenahealth and generated a negative 4-year revenue CAGR. Both Quality Systems and CPSI invested modestly in R&D during the period and each company generated 4-year revenue growth CAGRs well below athenahealth.
Exhibit 52: Analyzing Cumulative R&D Spend for the 2011 to 2014E Period
Source: Company documents and Stifel
ATHN
CERN
MDRX
QSIICPSI
-5.0%
0.0%
5.0%
10.0%
15.0%
20.0%
25.0%
30.0%
35.0%
0.0% 2.0% 4.0% 6.0% 8.0% 10.0% 12.0% 14.0% 16.0%Sa
les
Gro
wth
CA
GR
(4
YR
20
11
to
20
14
E)
R&D as a % of Sales (4 YR Cum. 2011 to 2014E)
Assessing the Efficiency of R&D Investment
$168,429
$1,319,762
$658,798
$170,958
$10,870 $89,267
$699,474
$349,163
$90,608
$5,761
ATHN CERN MDRX QSII CPSI
4 YR Cumulative R&D Investment ($000s)
Cumulative 4-YR R&D Spend Cumulative 4-YR R&D Innovation (C3/C4) Spend
We note that CERN spent roughly 7.8x more than ATHN on R&D During the 2011 to 2014E period. We note that CERN's 4 YR Revenue CAGR was
0.5x ATHNs during the same period. MDRX, QSII, and CPSI did not fare much better.
Page 52
Internet & MediaDigital Healthcare April 6, 2015
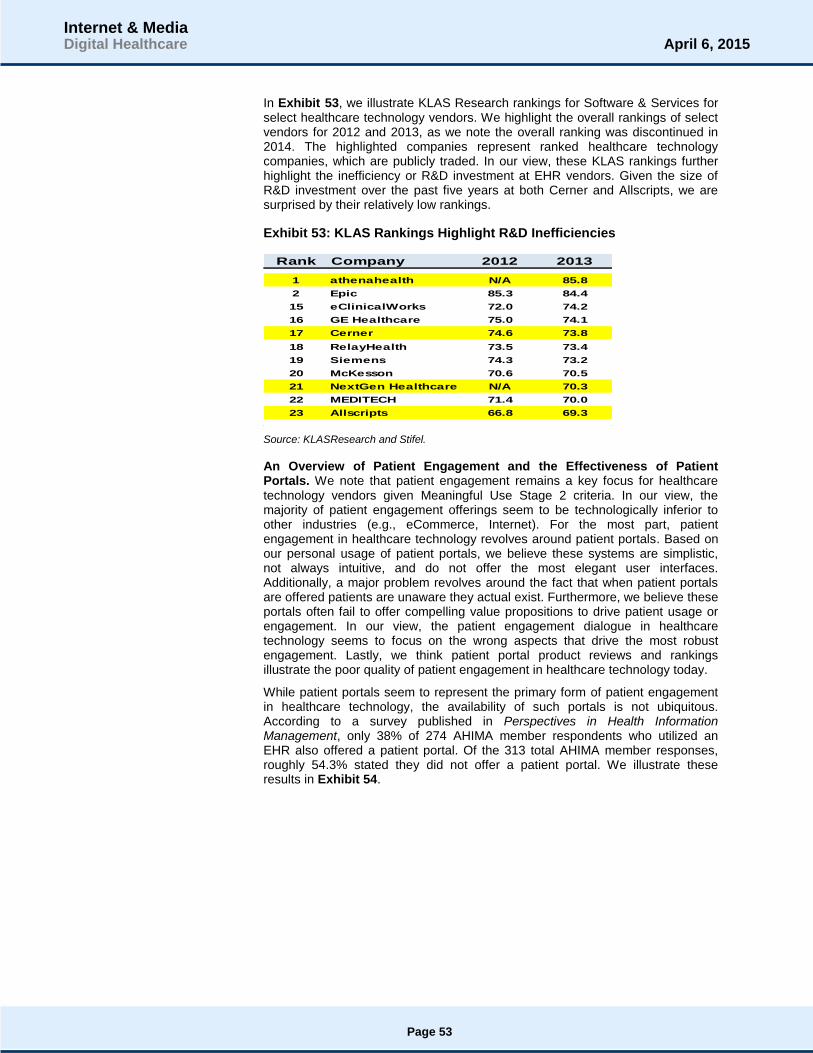
In Exhibit 53, we illustrate KLAS Research rankings for Software & Services for select healthcare technology vendors. We highlight the overall rankings of select vendors for 2012 and 2013, as we note the overall ranking was discontinued in 2014. The highlighted companies represent ranked healthcare technology companies, which are publicly traded. In our view, these KLAS rankings further highlight the inefficiency or R&D investment at EHR vendors. Given the size of R&D investment over the past five years at both Cerner and Allscripts, we are surprised by their relatively low rankings.
Exhibit 53: KLAS Rankings Highlight R&D Inefficiencies
Source: KLASResearch and Stifel.
An Overview of Patient Engagement and the Effectiveness of Patient Portals. We note that patient engagement remains a key focus for healthcare technology vendors given Meaningful Use Stage 2 criteria. In our view, the majority of patient engagement offerings seem to be technologically inferior to other industries (e.g., eCommerce, Internet). For the most part, patient engagement in healthcare technology revolves around patient portals. Based on our personal usage of patient portals, we believe these systems are simplistic, not always intuitive, and do not offer the most elegant user interfaces. Additionally, a major problem revolves around the fact that when patient portals are offered patients are unaware they actual exist. Furthermore, we believe these portals often fail to offer compelling value propositions to drive patient usage or engagement. In our view, the patient engagement dialogue in healthcare technology seems to focus on the wrong aspects that drive the most robust engagement. Lastly, we think patient portal product reviews and rankings illustrate the poor quality of patient engagement in healthcare technology today.
While patient portals seem to represent the primary form of patient engagement in healthcare technology, the availability of such portals is not ubiquitous. According to a survey published in Perspectives in Health Information Management, only 38% of 274 AHIMA member respondents who utilized an EHR also offered a patient portal. Of the 313 total AHIMA member responses, roughly 54.3% stated they did not offer a patient portal. We illustrate these results in Exhibit 54.
Rank Company 2012 2013
1 athenahealth N/A 85.8
2 Epic 85.3 84.4
15 eClinicalWorks 72.0 74.2
16 GE Healthcare 75.0 74.1
17 Cerner 74.6 73.8
18 RelayHealth 73.5 73.4
19 Siemens 74.3 73.2
20 McKesson 70.6 70.5
21 NextGen Healthcare N/A 70.3
22 MEDITECH 71.4 70.0
23 Allscripts 66.8 69.3
Page 53
Internet & MediaDigital Healthcare April 6, 2015

Exhibit 54: Not Many Providers Offer Patient Portals
Source: Murphy-Abdouch, Kim, “Patient Access to Personal Health Information: Regulation vs. Reality,” Perspectives in Health Information Management, Winter 2015, and Stifel
In Exhibit 55, we illustrate reported patient portal utilization trends among the AHIMA member respondents. A majority of survey respondents, roughly 62.5%, stated that less than 10% of their patient populations actually utilized the patient portal when made available. We believe these results illustrate the lack of awareness among patients that patient portals even exist. Furthermore, we think the lack of awareness lies in the fact that these portals fail to provide functionality important to the patients they serve. Additionally, we believe these results combined with an analysis of patient portal functionality suggest most vendors need to rethink the strategy behind their solutions.
Exhibit 55: When Patient Portals Exist, No One Seems to Use Them
Source: Murphy-Abdouch, Kim, “Patient Access to Personal Health Information: Regulation vs. Reality,” Perspectives in Health Information Management, Winter 2015, and Stifel.
According to a survey from TechnologyAdvice, digital services may play a prominent role in patient selection of a provider. Based on the survey, roughly 61% of patient respondents stated that digital services were either important or somewhat important in terms of their physician selection decision, see Exhibit 56. These results suggest that patient portals or offering digital tools and services to patients can drive engagement and ultimately increase utilization at the hospital or physician level.
12.5%
33.2%
54.3%
Not Sure
Yes
No
Do You Offer a Patient Portal?
1.0%
9.6%
26.9%
16.3%
46.2%
> 50%
> 25% to 50%
> 10% to 25%
> 5% to 10%
< 5%
Percentage of Patients Utilizing
Page 54
Internet & MediaDigital Healthcare April 6, 2015

Exhibit 56: Digital Services May Drive Physician Selection
Source: “What Digital Services Do Patients Value The Most? 2015 Trends in Patient Engagement,” TechnologyAdvice, January 2015, and Stifel.
While digital tools and services seem valuable to patients, physicians and hospitals seem to overlook these tools for the most part. According to the TechnologyAdvice survey, less than 30% of patient respondents reported having access to key digital tools or services. Notably, less than 20% of respondents reported having access to online appointment scheduling or online bill pay capabilities. In our view, these services represent the low hanging fruit of patient engagement, as these services offer a compelling value proposition for patients. Nearly 40% of respondents reported not having access to any of the digital services analyzed in the TechnologyAdvice survey. We illustrate the survey results in Exhibit 57.
Exhibit 57: Physicians Seem to Overlook Digital Services
Source: “What Digital Services Do Patients Value The Most? 2015 Trends in Patient Engagement,” TechnologyAdvice, January 2015, and Stifel.
In Exhibit 58, we illustrate the key digital tools and services patients would like their provider to offer. Disappointingly, no more than approximately 33% of respondents requested their physician offer one of the queried digital tools or services. The three most requested digital tools or services were the ability to access online test results or diagnoses, online appointment scheduling, and online bill pay. While the survey results suggest tepid interest among patients for digital tools and services, we believe strong innovators will continue to focus on developing these tools. Currently, we think many vendors are able to hide behind the perceived lack of interest among patients for digital tools and services.
22%
17%
29%
32%
Unimportant
Somewhat Unimportant
Somewhat Important
Important
The Importance of Digital Services in Physician Choice
37.4%
17.7%
19.7%
20.0%
27.8%
29.3%
30.0%
None of the Above
Online Bill Pay
Online Appointment Scheduling
Secure Online Messaging
Online Test Results or Diagnoses
Health Resources / Education
Follow-up Messages
Percent of Patients Who Reported Access to Digital Services
Page 55
Internet & MediaDigital Healthcare April 6, 2015

Additionally, the minimal requirements of Meaningful Use Stage 2 criteria around patient engagement provide no impetus for vendors to develop more robust patient engagement offerings. In our view, the best positioned vendors are focused on building patient portals around the key tools and services such as online scheduling and online bill pay in-spite of perceived tepid interest. We believe that patient portals built around strong user interfaces rooted in online bill pay and online scheduling will exhibit the strongest foundation upon which to drive robust patient engagement over time.
Exhibit 58: Key Digital Services Requested by Patients
Source: “What Digital Services Do Patients Value The Most? 2015 Trends in Patient Engagement,” TechnologyAdvice, January 2015, and Stifel.
We analyze key trends associated with U.S. hospital adoption of patient engagement functionality in Exhibit 59. Based on data from the Office of the National Coordinator of Healthcare Information Technology (ONCIT), the hospital view of patient engagement revolves around providing access to discharge instructions, health records, and educational content. We believe the data further illustrates the opportunity that exists for more robust and innovative patient engagement platforms to gain market share. Furthermore, we believe these trends further highlight our belief that hospitals and physicians need to rethink patient engagement. Currently, care givers and healthcare technology vendors are focused on providing access to information not actual engagement.
In order to create a true engagement experience, these entities need to develop a more retail like experience, which entails providing tools to drive a call to action and utilization of the portal. Without basic functions such as online bill pay, online scheduling, or online Rx refill no impetus exists for the patient to utilize the patient portal. Lastly, we believe these results illustrate how the industry seems to overlook the core of patient engagement, which revolves around helping patients actively participate and manage their own health. In our view, mHealth and wearable devices represent an essential aspect of patient engagement and seem to be missing from the patient engagement dialogue. In our view, successful patient engagement starts with providing digital tools that drive a compelling call to action (e.g., online bill pay, online scheduling, and online Rx refill). The most successful engagement offerings will build a foundation around these services and over time incorporate mHealth devices and data to facilitate personal management of one’s own health.
35.2%
18.2%
19.5%
22.7%
25.1%
29.3%
32.8%
None of the Above
Health Resources / Education
Smartphone App for Scheduling
Secure Messaging Outside of Office Hours
Online Bill Pay
Online Appointment Scheduling
Online Test Results or Diagnoses
Digital Services Patients Would Like Their Physician to Offer
Page 56
Internet & MediaDigital Healthcare April 6, 2015

Exhibit 59: Hospital Adoption of Patient Engagement Functionality Trends
Source: Office of the National Coordinator for Health Information Technology. 'U.S. Hospital Adoption of Patient Engagement Functionalities,' Health IT Quick-Stat #24. http://dashboard.healthit.gov/quickstats/pages/FIG-Hospital-Adoption-of-Patient-Engagement-Functionalities.php. April 2014, and Stifel.
In Exhibit 60, we illustrate the quality of existing patient portal offerings as ranked by the 2014 Best in KLAS report from KLASResearch. In our view, these rankings highlight the opportunity that exists for innovators to gain share in the patient engagement market. For example, the Medfusion and NextGen patient portals were ranked 4
th and 5
th in the 2014 Best in KLAS report. Our personal
experience with both platforms found each system to be lacking and cumbersome to use. In terms of Medfusion, we note that a patient cannot edit an already scheduled payment. In terms of NextGen, we found it difficult to interact with our provider.
We realize our complaints are subjective, but the bottom line is that the user experience associated with these platforms falls well short of what one can expect from digital companies like Facebook, Amazon, HomeAway, Netflix, etc. In our view, if Medfusion and NextGen are the fourth and fifth best patient portal platforms, then those platforms ranked lower must be pretty poor, too. We believe the quality and functionality of the Epic and athenahealth patient portals is greater than the KLAS scores would suggest. In our view, a key problem lies in the ability of each hospital and provider practice to configure the patient portal. Ultimately, while the vendors provide a basic system, the tools and services actually provided to patients varies widely based on hospital and physician. We believe this illustrates a key problem which permeates healthcare technology, which revolves around the lack of common standards around technology offerings.
7.3%
19.3%
21.6%
30.9%
49.3%
14.3%
24.0%
82.8%
81.1%
82.7%
5.2%
7.7%
7.5%
1.9%
6.1%
11.6%
13.4%
15.9%
7.4%
10.6%
9.7%
Submit Patient-Generated Data
Request Rx Refills Online
Schedule Appointment Online
Request Change/Update Health Info
Pay Bills Online
Transmit Health Info Online
Download Health Info
View Health Info Online
Patient Specific Education
eCopy of Health Record
eCopy of Discharge Instructions
U.S. Hospital Adoption of Patient Engagement Functionalities
MU Functionality: 2012 Adoption Rate MU Functionality: 2013 Increase
Page 57
Internet & MediaDigital Healthcare April 6, 2015

Exhibit 60: 2014 Best in KLAS – Patient Portals
Source: Best in KLAS 2014 Software & Services and Stifel
A major problem with EHR systems revolves around the fact that end users dislike their EHR systems. For the most part, EHR systems do not seem to contribute to the goals of health reform, specifically improving care and cutting costs. Providers seem to view EHRs as costly investments that make care worse and fail to improve care coordination. Providers seem unhappy with their original investments and for the most part would not select their current vendor if given a do over. Overall, physicians remain skeptical as to the actual value of the EHR. We believe these characteristics represent significant negatives for an industry facing slowing growth, few areas of new growth, and an inability to innovate at a fast and efficient pace. We highlight the results of the Medical Economics physician survey regarding EHRs in Exhibits 61–66.
In Exhibit 61, we highlight the significant expense associated with implementing an EHR system. Roughly 45% of respondents spent more than $100,000 on an EHR implementation.
Exhibit 61: EHR Implementations Are Costly
Source: Medical Economics and Stifel
We illustrate the lack of return on investment associated with EHRs according to physician perception in Exhibit 62. Roughly 65% of respondents either suffered significant losses or some losses stemming from their EHR implementation. Roughly 70% of physician groups of 10 or more experienced significant losses or some losses.
RelayHealth Patient Portal
Cerner HealtheLife
eClinicalWorks Patient Portal
Allscripts FollowMyHealth
NextGen Healthcare NextMD
Medfusion Patient Portal
Greenway PrimePATIENT
athenahealth athenaCommunicator
Epic MyChart
2014 Best in KLAS Patient Portals
15%
22%
18%
10%
6%
29%
< $10,000
$10,000 to $50,000
$50,000 to $100,000
$100,000 to $150,000
$150,000 to $200,000
> $200,000
Q: How Much Have You Invested Today in Your EHR System, Including Hardware, Software, Training, Consulting, etc.?
Page 58
Internet & MediaDigital Healthcare April 6, 2015
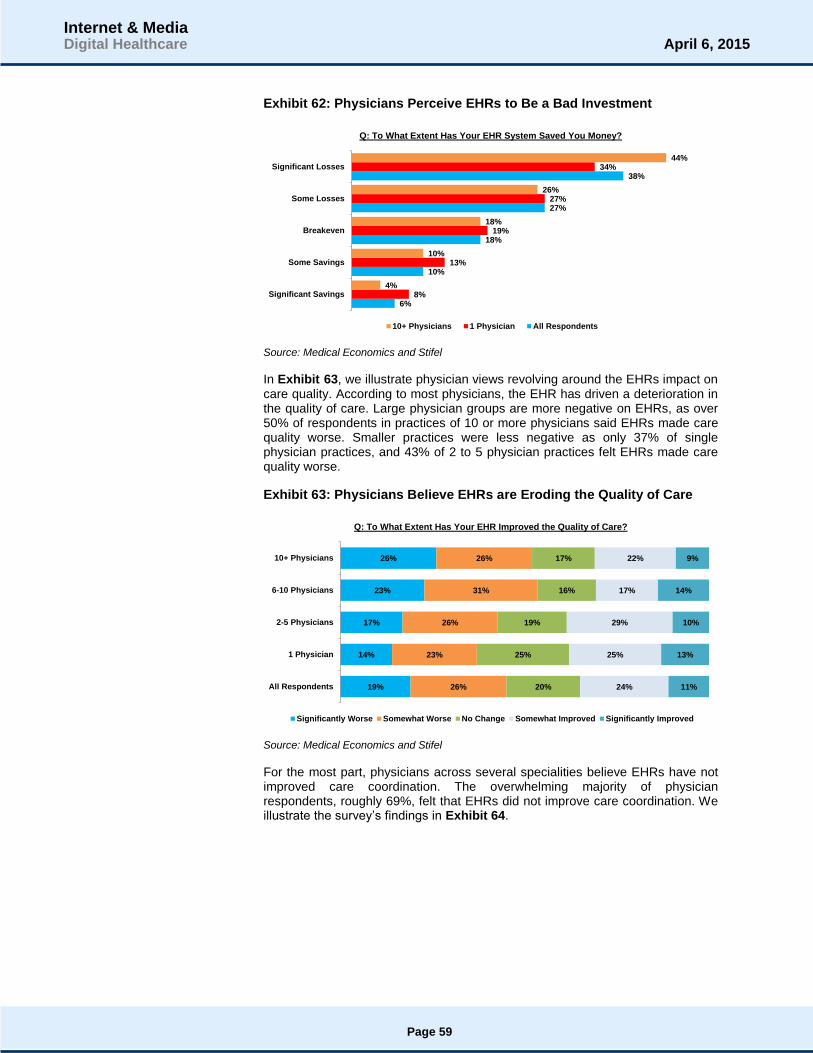
Exhibit 62: Physicians Perceive EHRs to Be a Bad Investment
Source: Medical Economics and Stifel
In Exhibit 63, we illustrate physician views revolving around the EHRs impact on care quality. According to most physicians, the EHR has driven a deterioration in the quality of care. Large physician groups are more negative on EHRs, as over 50% of respondents in practices of 10 or more physicians said EHRs made care quality worse. Smaller practices were less negative as only 37% of single physician practices, and 43% of 2 to 5 physician practices felt EHRs made care quality worse.
Exhibit 63: Physicians Believe EHRs are Eroding the Quality of Care
Source: Medical Economics and Stifel
For the most part, physicians across several specialities believe EHRs have not improved care coordination. The overwhelming majority of physician respondents, roughly 69%, felt that EHRs did not improve care coordination. We illustrate the survey’s findings in Exhibit 64.
6%
10%
18%
27%
38%
8%
13%
19%
27%
34%
4%
10%
18%
26%
44%
Significant Savings
Some Savings
Breakeven
Some Losses
Significant Losses
Q: To What Extent Has Your EHR System Saved You Money?
10+ Physicians 1 Physician All Respondents
19%
14%
17%
23%
26%
26%
23%
26%
31%
26%
20%
25%
19%
16%
17%
24%
25%
29%
17%
22%
11%
13%
10%
14%
9%
All Respondents
1 Physician
2-5 Physicians
6-10 Physicians
10+ Physicians
Q: To What Extent Has Your EHR Improved the Quality of Care?
Significantly Worse Somewhat Worse No Change Somewhat Improved Significantly Improved
Page 59
Internet & MediaDigital Healthcare April 6, 2015

Exhibit 64: EHRs Do Not Improve Care Coordination
Source: Medical Economics and Stifel
In Exhibit 65, we illustrate the significant dissatisfaction among physicians revolving around EHRs. Roughly 63% of all respondents were not interested in implementing their original EHR vendor if given a do over. These results highlight the fast pace of adoption exhibited during the EHR adoption super-cycle. The major concern going forward will revolve around whether or not original systems can evolve to meet new technological innovations.
Exhibit 65: Physicians Would Switch EHR Vendors Given a Do Over
Source: Medical Economics and Stifel
Overall physicians are not pleased with their EHR investments as roughly 70% of respondents felt EHRs were not worth the investment. We believe these results highlight the problems and negative perceptions associated with EHR systems. In our view, the significant negativity surrounding these systems suggests innovation is sorely needed. We believe traditional EHR vendors must be more innovative and work to significantly improve the user experience in order to remain viable over the long term.
26%
17%
21%
21%
20%
63%
72%
71%
67%
69%
11%
11%
8%
12%
11%
Other
Specialty/Subspecialty Outside of Primary Care
Primary Care - Internal Medicine
Primary Care - Family Medicine
All
Q: Has Your EHR System Improved Coordination of Care with Hospitals?
Yes No Unsure
43%
35%
34%
40%
37%
57%
65%
66%
60%
63%
Other
Specialty/Subspecialty Outside of Primary Care
Primary Care - Internal Medicine
Primary Care - Family Medicine
All
Q: If You Had a Do Over , Would You Purchase Your Current EHR System?
Yes No
Page 60
Internet & MediaDigital Healthcare April 6, 2015

Exhibit 66: Physicians Do Not See the Value of EHRs
Source: Medical Economics and Stifel
Health Catalyst in conjunction with the College of Healthcare Information Management Executive (CHIME) conducted a survey of 70 healthcare IT executives and Chief Information Officers (CIO). The survey found that healthcare IT executives view analytics as a top priority as 90% of respondents stated analytics development as being “extremely important” or “very important” over the next one to three years. We illustrate the respondent’s top priorities in Exhibit 67. A key driver of the analytic focus likely revolves around quality improvement and cost reduction. We think an analytics focus will help set the foundation for the shift from simple technology infrastructure investment towards performance driven technology investment.
Exhibit 67: Top Focal Areas Among HCIT Executives
Source: CHIME, Health Catalyst, Health Data Management, and Stifel
The survey provided insights into the key drivers of the focus on analytics development. The main drivers of analytics development seem to be value-based care, (e.g., population health management, quality improvement, and accountable care). We illustrate the key drivers of analytics development according to the survey in Exhibit 68.
39%
24%
30%
32%
30%
61%
76%
70%
68%
70%
Other
Specialty/Subspecialty Outside of Primary Care
Primary Care - Internal Medicine
Primary Care - Family Medicine
All
Q: Has Your EHR Investment Been Worth the Effort, Resources, and Costs?
Yes No
11%
29%
30%
42%
54%
M&A
Accountable Care/Shared Risk
ICD-10
Population Health
Analytics
Key Focus Areas of Healthcare IT Executives
Page 61
Internet & MediaDigital Healthcare April 6, 2015

Exhibit 68: The Drivers of an Analytics Focus
Source: CHIME, Health Catalyst, Health Data Management, and Stifel
17%
54%
59%
63%
68%
79%
84%
Research
Better Reporting
Single Version of the Truth
Cost Reduction
Accountable Care
Quality Improvement
Population Health Management
Why Analytics Are so Important to Healthcare IT Executives
Page 62
Internet & MediaDigital Healthcare April 6, 2015

Part 7: Understanding the Outlook for Hospitals and Possible Impact on EHR Industry
The U.S. hospital faces an uncertain future driven by significant change. The forces of change revolve around healthcare reform, increasing competition, shifting demographics, and new payment models. We believe the environment of change aims to drive a less costly and more efficient healthcare system. In our view, EHRs and healthcare technology in general represented a main driver in achieving these goals. Nevertheless, we believe the focus on government mandates and core infrastructure solutions may prove problematic for traditional HCIT vendors over the next several years. In our view, the environment of change, coupled with weak / thin operating margins at hospitals will make it difficult to sustain investment in core HCIT technology that fails to provide performance improvement and operational efficiencies throughout the care continuum.
We think investors overlook the possibility that both management teams and underlying platforms developed in the HITECH/ARRA environment may be poorly equipped for future environments. We believe legacy EHRs built in a fee-for-service environment will face a tough time adapting to a fee-for-value reimbursement environment.
In Exhibit 69, we provide an illustration of how a changing reimbursement landscape may place pressure on hospitals. There are several health reform programs being enacted that place risk on a hospital’s Medicare reimbursement rate. These initiatives range from value-based purchasing to readmission reductions to physicians quality reporting, among others. We believe these reform programs will force hospitals to rethink their HCIT strategy in the future. The risk posed to reimbursement by these reform programs will make it difficult for hospitals to invest and maintain technological infrastructure that fails to help the hospital navigate these reimbursement risks. According to Cerner’s 2011 annual report, the company’s client base faces $3 billion in annual reimbursement risk tied to value-based purchasing in 2013 rising to $5 billion by 2017.
Exhibit 69: Health Reform Programs Put Reimbursement Rates at Risk
Source: Cleveland Clinic, Cerner, and Stifel
Physician Quality Reporting
Health Reform Programs
Value Based Purchasing (VBP)
Readmission Reduction
State HAC Program
Physician Quality Reporting
Physician VBP
Medicare HAC Pay Adjustment
1% to 2% at Risk
1% to 3% at Risk
Payment Adjustment
2012 2013 2014 2015 2016 2017
1.5% to 2.0% Penalty
Payment Adjustment
Payment Adjustment
Page 63
Internet & MediaDigital Healthcare April 6, 2015
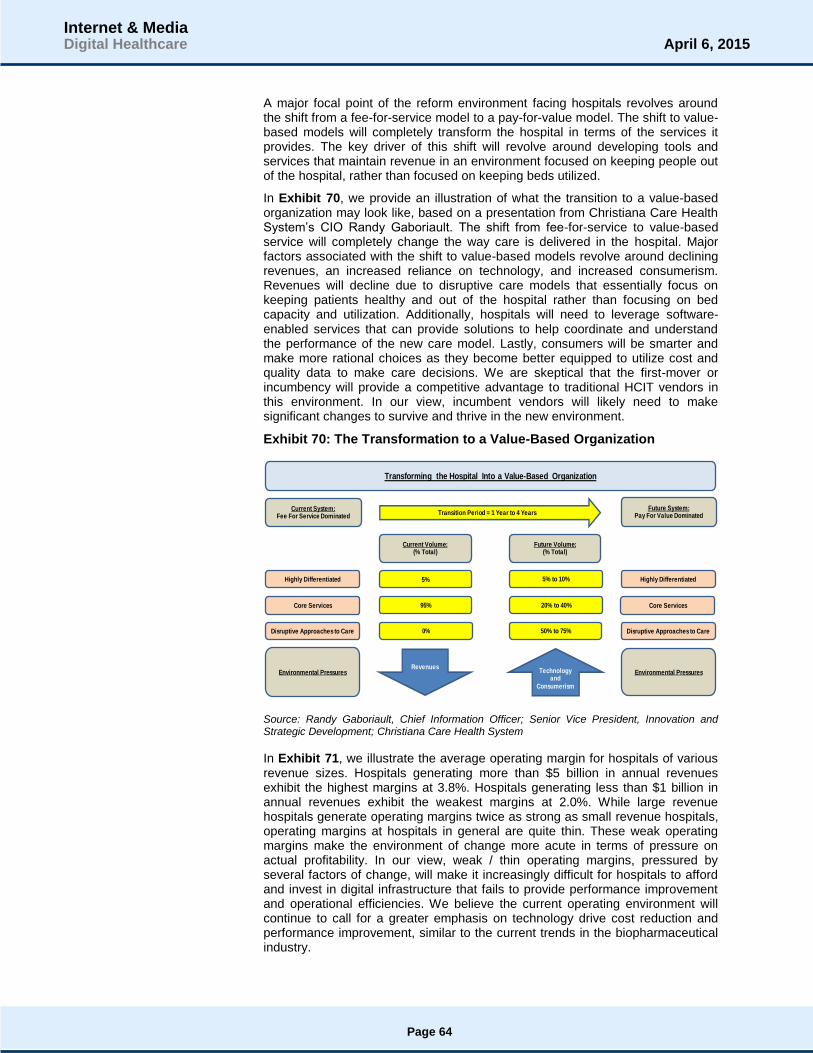
A major focal point of the reform environment facing hospitals revolves around the shift from a fee-for-service model to a pay-for-value model. The shift to value-based models will completely transform the hospital in terms of the services it provides. The key driver of this shift will revolve around developing tools and services that maintain revenue in an environment focused on keeping people out of the hospital, rather than focused on keeping beds utilized.
In Exhibit 70, we provide an illustration of what the transition to a value-based organization may look like, based on a presentation from Christiana Care Health System’s CIO Randy Gaboriault. The shift from fee-for-service to value-based service will completely change the way care is delivered in the hospital. Major factors associated with the shift to value-based models revolve around declining revenues, an increased reliance on technology, and increased consumerism. Revenues will decline due to disruptive care models that essentially focus on keeping patients healthy and out of the hospital rather than focusing on bed capacity and utilization. Additionally, hospitals will need to leverage software-enabled services that can provide solutions to help coordinate and understand the performance of the new care model. Lastly, consumers will be smarter and make more rational choices as they become better equipped to utilize cost and quality data to make care decisions. We are skeptical that the first-mover or incumbency will provide a competitive advantage to traditional HCIT vendors in this environment. In our view, incumbent vendors will likely need to make significant changes to survive and thrive in the new environment.
Exhibit 70: The Transformation to a Value-Based Organization
Source: Randy Gaboriault, Chief Information Officer; Senior Vice President, Innovation and Strategic Development; Christiana Care Health System
In Exhibit 71, we illustrate the average operating margin for hospitals of various revenue sizes. Hospitals generating more than $5 billion in annual revenues exhibit the highest margins at 3.8%. Hospitals generating less than $1 billion in annual revenues exhibit the weakest margins at 2.0%. While large revenue hospitals generate operating margins twice as strong as small revenue hospitals, operating margins at hospitals in general are quite thin. These weak operating margins make the environment of change more acute in terms of pressure on actual profitability. In our view, weak / thin operating margins, pressured by several factors of change, will make it increasingly difficult for hospitals to afford and invest in digital infrastructure that fails to provide performance improvement and operational efficiencies. We believe the current operating environment will continue to call for a greater emphasis on technology drive cost reduction and performance improvement, similar to the current trends in the biopharmaceutical industry.
Current System:Fee For Service Dominated
Transition Period = 1 Year to 4 YearsFuture System:
Pay For Value Dominated
Current Volume:(% Total)
Future Volume:(% Total)
5%Highly Differentiated 5% to 10% Highly Differentiated
Core Services Core Services95% 20% to 40%
Disruptive Approaches to Care Disruptive Approaches to Care0% 50% to 75%
Environmental PressuresRevenues
Technologyand
Consumerism
Environmental Pressures
Transforming the Hospital Into a Value-Based Organization
Page 64
Internet & MediaDigital Healthcare April 6, 2015

Exhibit 71: Operating Margins at Hospitals of Various Sizes
Source: McKinsey & Co., and Stifel
Academic Medical Centers (AMCs) typically represent the top of the hospital industry. These entities have developed reputations around high quality, care innovation, and the ability to manage highly complex diseases. According to a McKinsey study called “The Post Reform Health System: Meeting the Challenges Ahead”, AMC operating margins face considerable pressure in the future due to the substantial changes underway stemming from the Affordable Care Act (ACA). Based on the study, AMC operating margins face a 4.0% to 5.0% decline in operating margin due to healthcare reform, a changing competitive landscape, and shifting demographics. We highlight the factors that may drive operating margin declines at AMCs in Exhibit 72. While our example highlights AMCs, we believe these factors of change could place pressure on other hospitals, as well. Based on the McKinsey analysis, we believe hospitals of all sizes could face a 3.4% to 4.3% operating margin reduction due to reimbursement and demographics below. In our view, these operating margin pressures illustrate why vendors in HCIT and digital healthcare need to provide services and solutions that drive performance improvement and operational efficiency.
2.0%
3.0%2.8%
3.8%
< $1 Billion $1 Billion to $3 Billion $3 Billion to $5 Billion > $5 Billion
Hospital Operating Margins
Page 65
Internet & MediaDigital Healthcare April 6, 2015

Exhibit 72: Hospitals Face Significant Risk of Further Margin Degradation
Source: McKinsey Health Reform Team Analysis, MPACT tool, and Stifel
In Exhibit 73, we provide a dashboard that illustrates several key operating
metrics for U.S. hospitals according to the debt rating. In our view, the dashboard illustrates the operational discrepancies between large and small hospitals, particularly the difficulties associated with hospitals maintaining less than 300 beds. According to Moody’s Investor Service, large hospitals (think academic medical centers) enjoy operating margins between 4.5% and 5.0%. However, smaller hospitals operating with less than 300 beds exhibit operating margins between -2.0% and 0.0%. We also note that accounts receivable days range between 46.7 days and 52.0 days depending on hospital size. We believe hospitals will place greater emphasis on reducing accounts receivable days over the next several years. In our view, hospitals will not only look at upgrading and investing in revenue cycle management, but also in analytics tools and other capabilities that will ensure the hospital or health system captures the performance improvement and operational efficiencies made possible by their technological investments.
Exhibit 73: U.S. Hospital Operating Metrics Dashboard by Debt Rating
Source: Moody’s Investment Service and Stifel
5.0% 0.4% to 0.5%
1.5% to 1.8%
0.3% to 0.5%
1.2% to 1.5%
0.6% to 0.7%
0.0% to 1.0%
Current Change in Medicare Reduction in Reduction in Decline in 2019
Typical AMC Insured Payment DSH Payments Commerical Mid/High AMC
Margin Population Growth Medicaid Payor Acuity Cases Margin
and Declines and Reimbursements Reimbursements From Without
Utilization Penalites and Higher Transformation
Cadillac Tax Competition
Operating Margin as a Percentage of Academic Medical Center Revenue
Operating Metrics Dashboard All Aa2 Aa3 A1 A2 A3 Baa1 Baa2 Baa3 Below Baa
Hospital Universe 383 19 43 55 70 65 37 40 20 34
Maintained Beds 504 2,167 1,325 619 435 383 393 256 194 303
Maintained Bed Occupancy 62.7% 64.3% 63.7% 64.4% 65.2% 62.5% 62.6% 59.6% 54.0% 65.1%
Operating Margin 2.0% 4.6% 2.8% 3.0% 2.2% 2.3% 1.0% 0.0% 1.4% -1.9%
Accounts Receivable (Days) 49.8 48.5 50.2 52.0 48.9 50.3 49.7 46.7 48.4 50.6
Avg. Payment Period (Days) 63.4 83.2 67.0 61.5 61.4 62.3 58.1 60.7 60.2 64.8
Page 66
Internet & MediaDigital Healthcare April 6, 2015

We believe patient gross revenue mix represents a key metric to follow over the coming years. We illustrate patient gross revenue mix for U.S. hospitals according to debt rating for a universe of 383 hospitals based on Moody’s Investor Service data in Exhibit 74. In our view, hospitals will likely experience an increase in self-pay revenue in terms of total revenue mix over the next several years. The advent and increasing adoption / utilization of high deductible health plans (HDHPs) continues to shift the burden of cost away from traditional bureaucracies such as Medicare, Medicaid, and Managed Care Organizations towards patients. We believe hospitals will have greater difficulty collecting payments from consumers with HDHPs. The associated difficulties of collecting payments from HDHPs will likely increase pressure on already thin operating margins. In our view, patient gross revenue mix illustrates why hospitals and physicians need solutions that go above and beyond providing simple infrastructure and help facilitate performance improvement and operational efficiency.
Exhibit 74: U.S. Hospital Patient Gross Revenue Mix by Debt Rating
Note: Payer mix does not necessarily sum to 100 because each entry is a separately calculated median
Source: Moody’s Investor Service and Stifel
In Exhibit 75, we illustrate the change in hospitals reporting an operating loss for the 2010 to 2013 period. According to Moody’s Investor Service, the number of hospitals reporting an operating loss between 2010 and 2013 grew from 63 in 2010 to 96 in 2013. The number of hospitals reporting an operating loss grew at a 15% compound annual growth rate during this period. Additionally, in 2010 roughly 16% of the 383 hospitals in the Moody’s Investor Service universe reported an operating loss. In 2013, roughly 25% of hospitals in the Moody’s Investor Service universe reported an operating loss. We believe these results illustrate the significant pressure hospitals face. Given the ongoing shift toward HDHPs, we would not be surprised to see the number of hospitals reporting an operating loss increase again in 2014. In our view, these trends illustrate why traditional EHR vendors need to offer products and services that go above and beyond simple infrastructure.
44.4%41.1% 42.2% 45.6% 45.0% 45.8% 45.5% 47.8% 43.8% 44.7%
13.0%13.8%
13.4%12.4% 13.0% 13.0% 13.3% 11.4%
12.5%14.9%
32.4%39.9% 34.0% 32.1% 32.7% 31.4% 30.5% 31.8% 33.2% 29.8%
7.7% 8.0% 9.0% 8.0% 7.7% 7.9% 7.7% 7.3% 7.7% 7.3%
0%
10%
20%
30%
40%
50%
60%
70%
80%
90%
100%
All Aa2 Aa3 A1 A2 A3 Baa1 Baa2 Baa3 Below Baa
Patient Gross Revenue Mix
Medicare Medicaid Commercial Self-Pay & Other
Page 67
Internet & MediaDigital Healthcare April 6, 2015

Exhibit 75: U.S. Hospitals Reporting an Operating Loss – 2010 to 2013
Source: Moody’s Investor Service and Stifel
We note that HDHPs continue to gain traction and increased utilization across America. In Exhibit 76, we illustrate the significant increase in deductibles for the 2006 to 2014E period. During this period average deductibles have increased at a compound annual growth rate of 8.2% for the 2006 to 2014E period. However, the actual deductible amount has nearly doubled during that same time. According to the Kaiser Family Foundation, roughly 41% of American workers receiving coverage from their employer have a deductible of $1,000 or more, which is up from 10% of the U.S. workforce in 2006. According to the Robert Wood Johnson Foundation, the average deductible of “silver” plans under the ACA totals $2,267. We believe the ongoing shift toward HDHPs will put considerable pressure on hospitals and render costly digital infrastructure (EHR systems) expensive and difficult to maintain and upgrade.
Exhibit 76: The Significant Growth in Deductibles – 2006 to 2014E
Source: Kaiser Family Foundation and Stifel
All statements in this report attributable to Gartner represent Stifel's interpretation of data,
research opinion or viewpoints published as part of a syndicated subscription service by Gartner,
Inc., and have not been reviewed by Gartner. Each Gartner publication speaks as of its original
publication date (and not as of the date of this report). The opinions expressed in Gartner
publications are not representations of fact, and are subject to change without notice.
Pricing as of 4/2/15 market close.
63
53
66
96
6.8%
-15.9%
24.5%
45.5%
-20.0%
-10.0%
0.0%
10.0%
20.0%
30.0%
40.0%
50.0%
0
20
40
60
80
100
120
2010 2011 2012 2013
Total Hospitals Reporting an Operating Loss
Hospitals Y/Y Growth
$1,034 $1,040
$1,344 $1,488 $1,518 $1,521
$1,770 $1,854
$1,947
2006 2007 2008 2009 2010 2011 2012 2013 2014E
Growing Deductibles Present a Problem
Page 68
Internet & MediaDigital Healthcare April 6, 2015
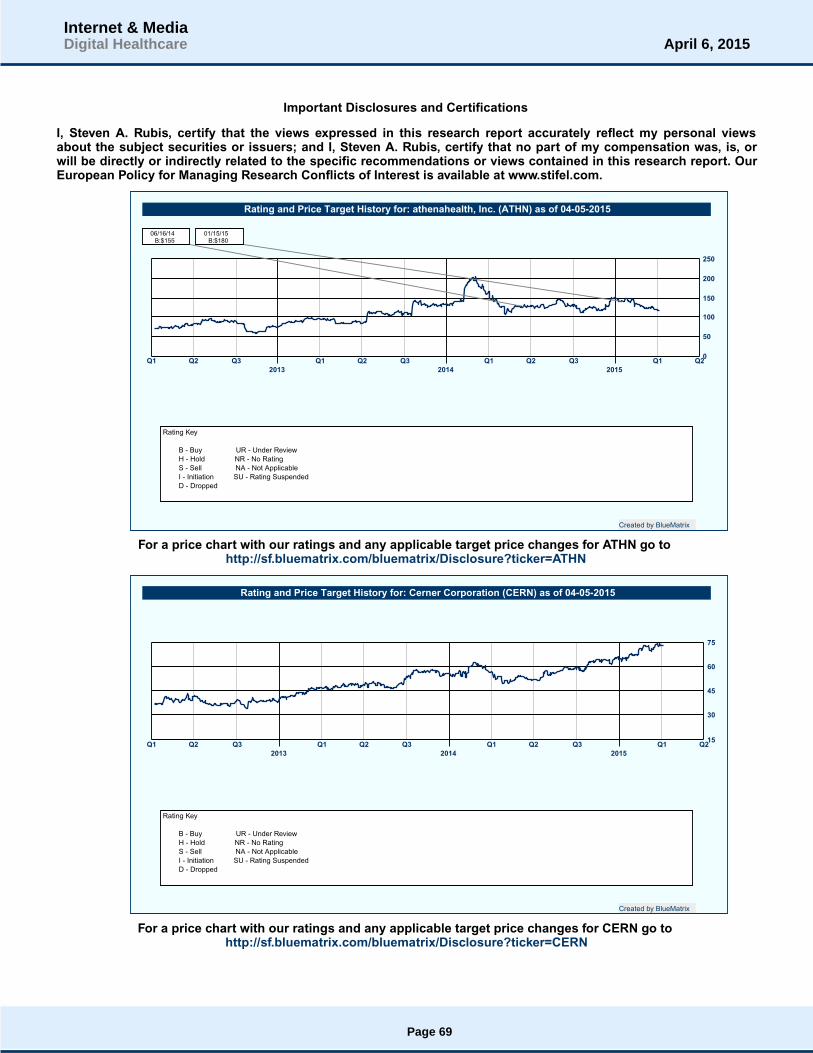
Important Disclosures and Certifications
I, Steven A. Rubis, certify that the views expressed in this research report accurately reflect my personal viewsabout the subject securities or issuers; and I, Steven A. Rubis, certify that no part of my compensation was, is, orwill be directly or indirectly related to the specific recommendations or views contained in this research report. OurEuropean Policy for Managing Research Conflicts of Interest is available at www.stifel.com.
Q1 Q2 Q3 Q1 Q2 Q3 Q1 Q2 Q3 Q1 Q20
50
100
150
200
250
2013 2014 2015
06/16/14B:$155
01/15/15B:$180
Rating and Price Target History for: athenahealth, Inc. (ATHN) as of 04-05-2015
Created by BlueMatrix
Rating Key
B - Buy UR - Under Review
H - Hold NR - No Rating
S - Sell NA - Not Applicable
I - Initiation SU - Rating Suspended
D - Dropped
For a price chart with our ratings and any applicable target price changes for ATHN go tohttp://sf.bluematrix.com/bluematrix/Disclosure?ticker=ATHN
Q1 Q2 Q3 Q1 Q2 Q3 Q1 Q2 Q3 Q1 Q215
30
45
60
75
2013 2014 2015
Rating and Price Target History for: Cerner Corporation (CERN) as of 04-05-2015
Created by BlueMatrix
Rating Key
B - Buy UR - Under Review
H - Hold NR - No Rating
S - Sell NA - Not Applicable
I - Initiation SU - Rating Suspended
D - Dropped
For a price chart with our ratings and any applicable target price changes for CERN go tohttp://sf.bluematrix.com/bluematrix/Disclosure?ticker=CERN
Page 69
Internet & MediaDigital Healthcare April 6, 2015

Q1 Q2 Q3 Q1 Q2 Q3 Q1 Q2 Q3 Q1 Q232
40
48
56
64
72
2013 2014 2015
Rating and Price Target History for: Computer Programs and Systems, Inc. (CPSI) as of 04-05-2015
Created by BlueMatrix
Rating Key
B - Buy UR - Under Review
H - Hold NR - No Rating
S - Sell NA - Not Applicable
I - Initiation SU - Rating Suspended
D - Dropped
For a price chart with our ratings and any applicable target price changes for CPSI go tohttp://sf.bluematrix.com/bluematrix/Disclosure?ticker=CPSI
Q1 Q2 Q3 Q1 Q2 Q3 Q1 Q2 Q3 Q1 Q26
9
12
15
18
21
2013 2014 2015
Rating and Price Target History for: Allscripts Healthcare Solutions, Inc. (MDRX) as of 04-05-2015
Created by BlueMatrix
Rating Key
B - Buy UR - Under Review
H - Hold NR - No Rating
S - Sell NA - Not Applicable
I - Initiation SU - Rating Suspended
D - Dropped
For a price chart with our ratings and any applicable target price changes for MDRX go tohttp://sf.bluematrix.com/bluematrix/Disclosure?ticker=MDRX
The rating and target price history for athenahealth, Inc. and its securities prior to February 25, 2015, on the above pricechart reflects the research analyst's views under a different rating system than currently utilized at Stifel. For a description ofthe investment rating system previously utilized go to.www.stifel.com.
Stifel or an affiliate is a market maker or liquidity provider in the securities of athenahealth, Inc., Cerner Corporation,Computer Programs and Systems, Inc. and Allscripts Healthcare Solutions, Inc..
The equity research analyst(s) responsible for the preparation of this report receive(s) compensation based on variousfactors, including Stifel’s overall revenue, which includes investment banking revenue.
Page 70
Internet & MediaDigital Healthcare April 6, 2015

Our investment rating system is three tiered, defined as follows:
BUY -We expect a total return of greater than 10% over the next 12 months with total return equal to the percentage pricechange plus dividend yield.
HOLD -We expect a total return between -5% and 10% over the next 12 months with total return equal to the percentageprice change plus dividend yield.
SELL -We expect a total return below -5% over the next 12 months with total return equal to the percentage price changeplus dividend yield.
Of the securities we rate, 52% are rated Buy, 45% are rated Hold, and 3% are rated Sell.
Within the last 12 months, Stifel or an affiliate has provided investment banking services for 20%, 8% and 0% of thecompanies whose shares are rated Buy, Hold and Sell, respectively.
Additional Disclosures
Please visit the Research Page at www.stifel.com for the current research disclosures and respective target pricemethodology applicable to the companies mentioned in this publication that are within Stifel's coverage universe. For adiscussion of risks to target price please see our stand-alone company reports and notes for all Buy-rated and Sell-ratedstocks.
The information contained herein has been prepared from sources believed to be reliable but is not guaranteed by us and isnot a complete summary or statement of all available data, nor is it considered an offer to buy or sell any securities referred toherein. Opinions expressed are subject to change without notice and do not take into account the particular investmentobjectives, financial situation or needs of individual investors. Employees of Stifel, or its affiliates may, at times, releasewritten or oral commentary, technical analysis or trading strategies that differ from the opinions expressed within. Pastperformance should not and cannot be viewed as an indicator of future performance.
As a multi-disciplined financial services firm, Stifel regularly seeks investment banking assignments and compensation fromissuers for services including, but not limited to, acting as an underwriter in an offering or financial advisor in a merger oracquisition, or serving as a placement agent in private transactions.
Affiliate Disclosures
“Stifel”, includes Stifel Nicolaus & Company (“SNC”), a US broker-dealer registered with the United States Securities andExchange Commission and the Financial Industry National Regulatory Authority and Stifel Nicolaus Europe Limited (“SNEL”),which is authorized and regulated by the Financial Conduct Authority (“FCA”), (FRN 190412) and is a member of the LondonStock Exchange.
Registration of non-US Analysts: Any non-US research analyst employed by SNEL contributing to this report is notregistered/qualified as a research analyst with FINRA and is not an associated person of the US broker-dealer and thereforemay not be subject to NASD Rule 2711 or NYSE Rule 472 restrictions on communications with a subject company, publicappearances, and trading securities held by a research analyst account.
Country Specific and Jurisdictional Disclosures
United States: Research produced and distributed by SNEL is distributed by SNEL to “Major US Institutional Investors” asdefined in Rule 15a-6 under the US Securities Exchange Act of 1934, as amended. SNEL is a non-US broker-dealer andaccordingly, any transaction by Major US Institutional Investors in the securities discussed in the document would need to beeffected by SNC. SNC may also distribute research prepared by SNEL directly to US clients that are professional clients asdefined by FCA rules. In these instances, SNC accepts responsibility for the content. Research produced by SNEL is notintended for use by and should not be made available to retail clients, as defined by the FCA rules.
Canadian Distribution: Research produced by SNEL is distributed in Canada by SNC in reliance on the international dealerexemption. This material is intended for use only by professional or institutional investors. None of the investments orinvestment services mentioned or described herein is available to other persons or to anyone in Canada who is not a“permitted client” as defined under applicable Canadian securities law.
In certain instances CIBC World Markets Inc. (“CIBC WM”) may also distribute research produced by SNEL to clients of CIBCWM. This report has not been prepared in accordance with the disclosure requirements of Dealer Member Rule3400-Research Restrictions and Disclosure Requirements of the Investment Industry Regulatory Organization of Canada(“IIROC”). Disclosures contained in this report are made in accordance with requirements of the Financial Conduct Authority
Page 71
Internet & MediaDigital Healthcare April 6, 2015

(“FCA”) and the Financial Industry National Regulatory Authority (“FINRA”).
UK and European Economic Area (EEA): This report is distributed in the EEA by SNEL, which is authorized and regulatedin the United Kingdom by the FCA. In these instances, SNEL accepts responsibility for the content. Research produced bySNEL is not intended for use by and should not be made available to non-professional clients.
In jurisdictions where Stifel is not already licensed or registered to trade securities, transactions will only be affected inaccordance with local securities legislation which will vary from jurisdiction to jurisdiction and may require that a transactioncarried out in accordance with applicable exemptions from registration and licensing requirements. Non-US customerswishing to effect transactions should contact a representative of the Stifel entity in their regional jurisdiction except wheregoverning law permits otherwise. US customers wishing to effect transactions should contact their US salesperson.
Additional Information Available Upon Request
© 2015 Stifel. This report is produced for the use of Stifel customers and may not be reproduced, re-distributed or passed toany other person or published in whole or in part for any purpose without the prior consent of Stifel. Stifel, Nicolaus &Company, Incorporated, One South Street, Baltimore, MD 21202.
Page 72
Internet & MediaDigital Healthcare April 6, 2015