a consensus-building support system based on ontology exploration
TRANSCRIPT
A Consensus-Building Support System based on Ontology Exploration
Kouji Kozaki1, Osamu Saito2 and Riichiro Mizoguchi3
1The Institute of Scientific and Industrial Research, Osaka University, Japan2United Nations University, Institute for Sustainability and Peace
3Research Center for Service Science, Japan Advanced Institute of Science and Technology
IESD20129th Oct. 2012, Galway, Ireland
9 Oct 2012 1IESD2012

Outline Motivation
A Consensus-Building Support System based on Ontology Exploration
Divergent exploration of an ontology Consensus-Building Support System based on Ontology
Exploration
Experiment for evaluation in biofuel domain
Demo
Concluding remarks 9 Oct 2012 2IESD2012
Motivation Consensus-building among various stakeholders
It is one of key issues to solve for facilitating their collaboration. In order to build consensus, it is important to know what others
are thinking about each other because differences of their viewpoints cause some conflicts.
However, it is difficult to understand different views in particular when they come from different fields.
Our Approach We propose an ontology based system which shows
differences of viewpoints by different stakeholders i n order to facilitate consensus-building among them.
This presentation Consensus-building support system based on ontology
exploration. Evaluation experiments by domain experts in sustainable
science (environmental) domain (in particular biofuel).9 Oct 2012 IESD2012 3

Target World
Stakeholder 3
Stakeholder 2 Stakeholder 3
Stakeholder 2
Stakeholder 1
Ontology developer×
×
✓
✓consensus-building
is difficult
Understanding from the their own viewpoints
OntologyConceptual
map
9 Oct 2012 4IESD2012
Our approach: Consensus-Building Support based on Ontology Exploration
It can facilitate consensus-building among stakeholders.
1) An ontology provides a base knowledge to be shared among the users (stakeholders).
2) They explore the ontology according to their viewpoint and generate conceptual maps as the result.
3) They can understand differences of viewpoints through comparison of generated maps.
Stakeholder 1
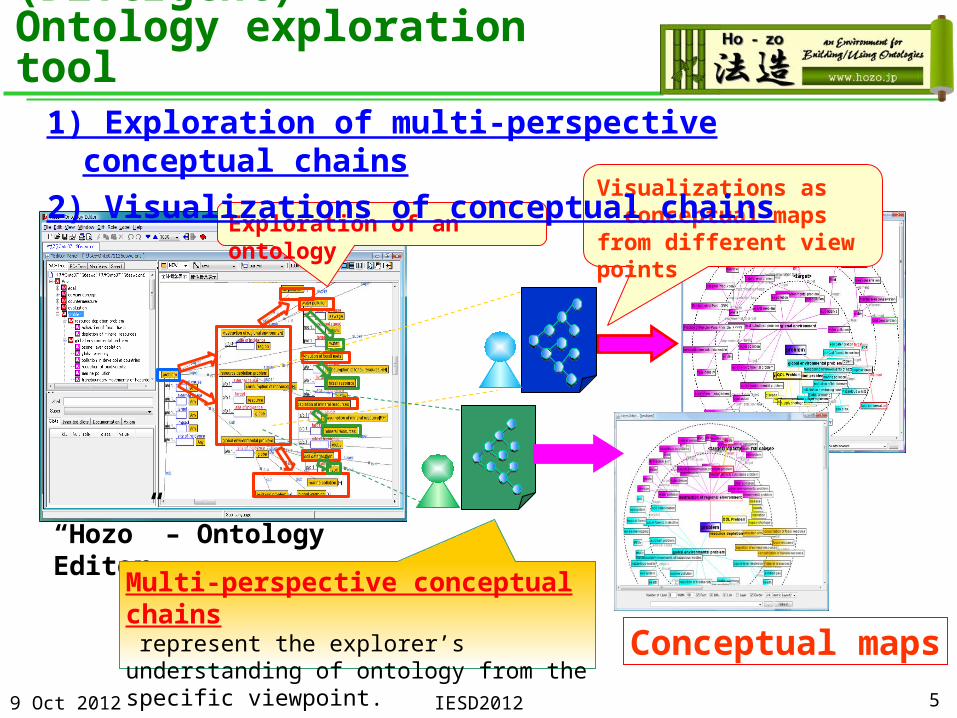
(Divergent) Ontology exploration tool
Exploration of an ontology
“Hozo” – Ontology Editor
Multi-perspective conceptual chains represent the explorer’s understanding of ontology from the specific viewpoint. Conceptual maps
Visualizations as conceptual maps from different view points
1) Exploration of multi-perspective conceptual chains2) Visualizations of conceptual chains
9 Oct 2012 5IESD2012
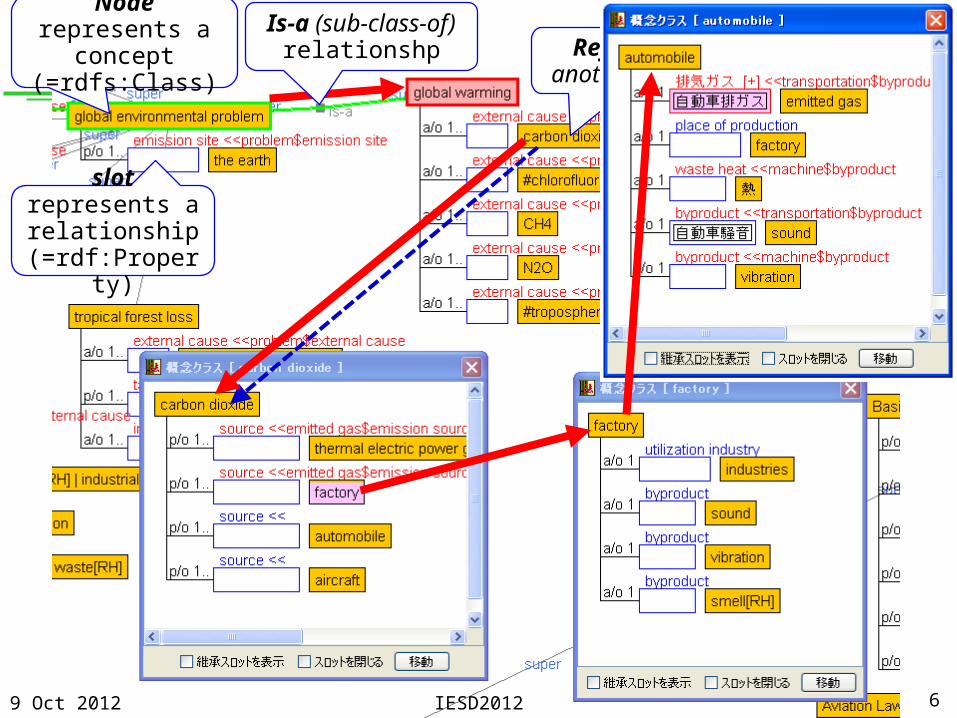
Referring to another concept
9 Oct 2012 6IESD2012
Node represents a
concept(=rdfs:Class)
slot represents a relationship
(=rdf:Property)
Is-a (sub-class-of) relationshp

79 Oct 2012 IESD2012
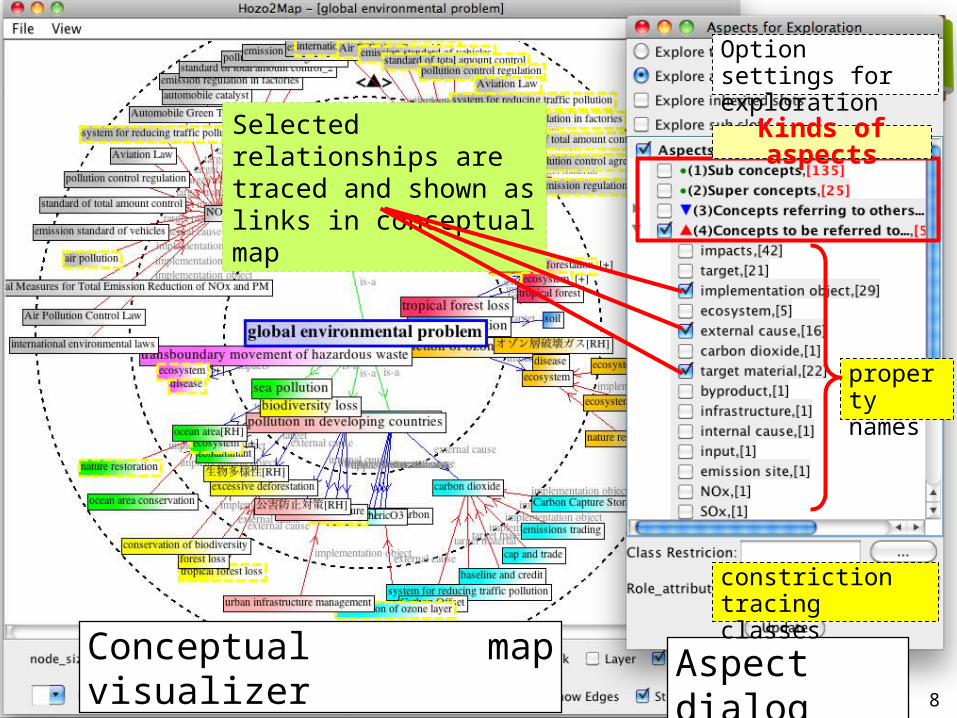
9 Oct 2012 IESD2012 8Aspect dialog
constriction tracing classes
Option settings for exploration
property names
Conceptual map visualizer
Kinds of aspects
Selected relationships are traced and shown as links in conceptual map

Functions for ontology exploration
Exploration using the aspect dialog: Divergent exploration from one concept using the
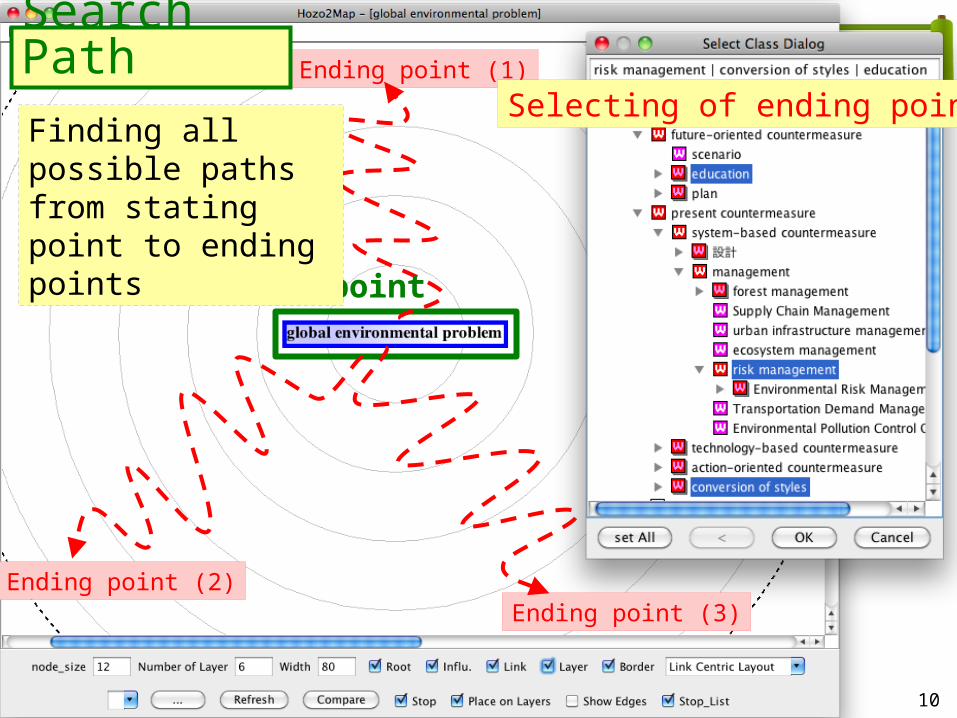
aspect dialog for each step Search path:
Exploration of paths from stating point and ending points.
The tool allows users to post-hoc editing for extracting only interesting portions of the map.
Change view: The tool has a function to highlight specified paths of
conceptual chains on the generated map according to given viewpoints.
Comparison of maps: The system can compare generated maps and show the
common conceptual chains both of the maps. 9 Oct 2012 IESD2012 9
Manual exploration
Machine exploration
9 Oct 2012 IESD2012 10
Ending point (1)
Ending point (3)Ending point (2)
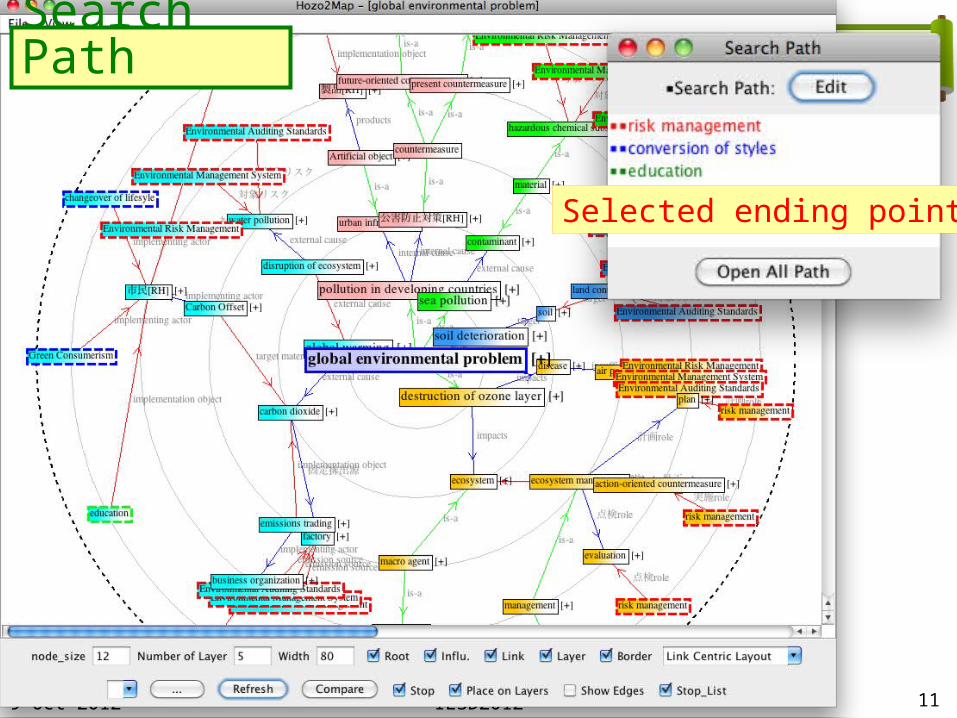
Search Path
Starting point
Selecting of ending pointsFinding all possible paths from stating point to ending points
9 Oct 2012 IESD2012 11
Search Path
Selected ending points

Functions for ontology exploration
Exploration using the aspect dialog: Divergent exploration from one concept using the
aspect dialog for each step Search path:
Exploration of paths from stating point and ending points.
The tool allows users to post-hoc editing for extracting only interesting portions of the map.
Change view: The tool has a function to highlight specified paths of
conceptual chains on the generated map according to given viewpoints.
Comparison of maps: The system can compare generated maps and show the
common conceptual chains both of the maps. 9 Oct 2012 IESD2012 12
→Differences between Viewpoints of stakeholders
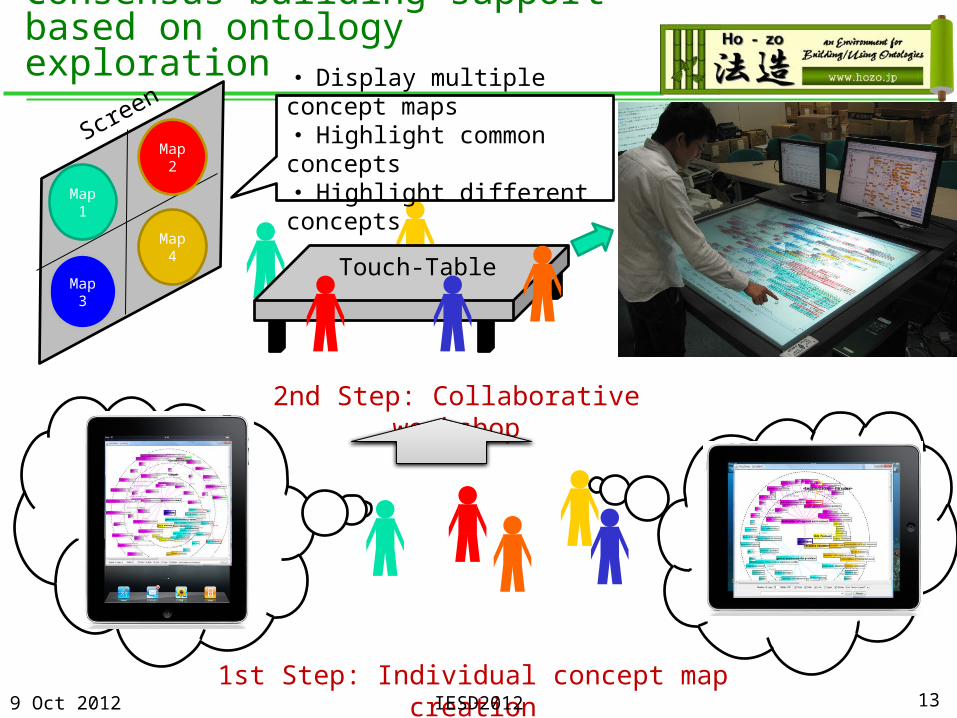
Consensus-building support based on ontology exploration
Touch-Table
Screen
Map 1
Map2
Map4
Map 3
2nd Step: Collaborative workshop
1st Step: Individual concept map creation
・ Display multiple concept maps・ Highlight common concepts・ Highlight different concepts
9 Oct 2012 13IESD2012

14
Comparison of conceptual maps
The system facilitates discussion among stakeholders through comparison of conceptual maps they generated. The system integrates conceptual maps generated by the stakeholders into an integrated map which consists of all paths appeared in the maps.
In the generated map, each path is shown in different color according to stakeholders.
When the same nodes appeared in both of maps by different stakeholders, they are shown in graduations of colors corresponds to them.

Experiments for Evaluation
Target domain and topics Biofuel production in sustainability science
(environmental domain) . An experiment for evaluating ontology
exploration tool by domain experts [Kozaki 2011]
Subjects: 4 domain experts Goal: To evaluate whether the tool can generate maps
which are meaningful for domain experts. An experiment of consensus building by role-
play discussion
9 Oct 2012 IESD2012 15

Experiment for evaluating ontology exploration tool
Experimental method1) The four experts to generated
conceptual maps with the tool in accordance with condition settings of given tasks.
2) They remove paths that were apparently inappropriate from the paths of conceptual chains included in the generated maps.
3) They select paths according to their interests and enter a four-level general evaluation with free comments.
9 Oct 2012 IESD2012 16
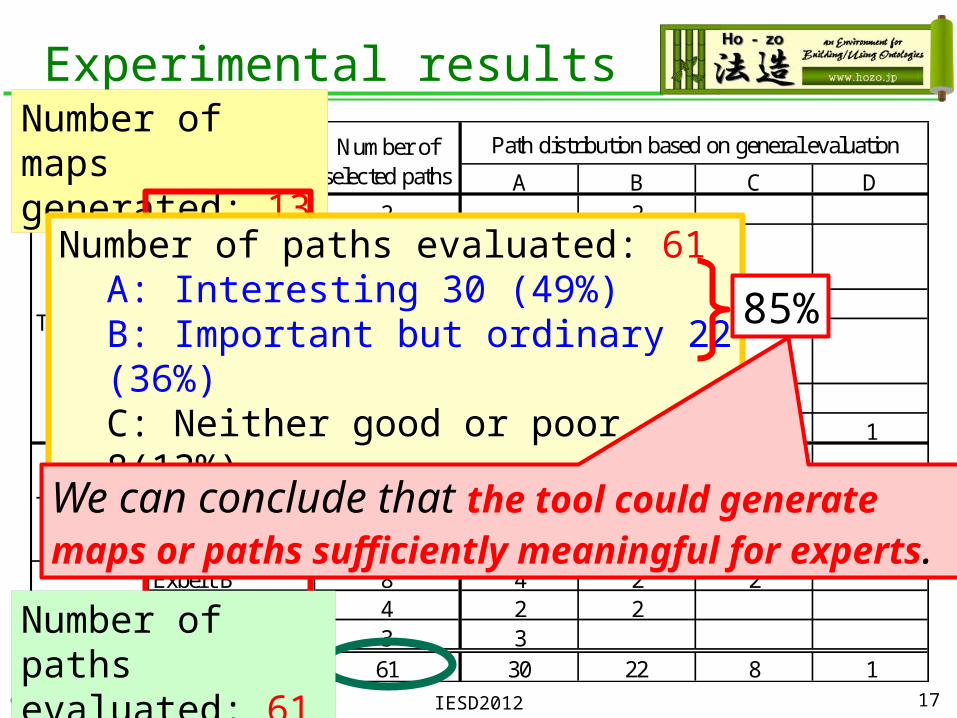
The subjects:4 experts in different fields. A: Agricultural economics B: Social science (stakeholder analysis) C: Risk analysis D: Metropolitan environmental planning
A: Interesting B: Important but ordinaryC: Neither good or poorD: Obviously wrong
Experimental results
9 Oct 2012 IESD2012 17
A B C DExpert A 2 2Expert A(second time) 1 1
Expert B 7 4 1 2Expert B(second time) 6 3 3
Expert C 8 1 5 2Expert D 3 1 1 1Expert A 1 1Expert B 6 5 1Expert C 7 2 4 1Expert D 5 3 1 1Expert B 8 4 2 2Expert C 4 2 2Expert D 3 3
61 30 22 8 1
Task 3
Total
Number ofselected paths
Path distribution based on general evaluation
Task 1
Task 2
(N) Nodes and links included in
the paths of anticipated maps
(M) Nodes and links included in the paths of generated and selected by the experts
50 15050
N∩M
Each area of circle represents the numbers of nodes and links included in paths. Note, the number in the circles represent not the actual number but the rates between each paths.
Fig.7 The rate of paths.
Number of maps generated: 13
Number of paths evaluated: 61
Number of paths evaluated: 61A: Interesting 30 (49%)B: Important but ordinary 22 (36%)C: Neither good or poor 8(13%) D: Obviously wrong 1(2%)
We can conclude that the tool could generate maps or paths sufficiently meaningful for experts.
85%
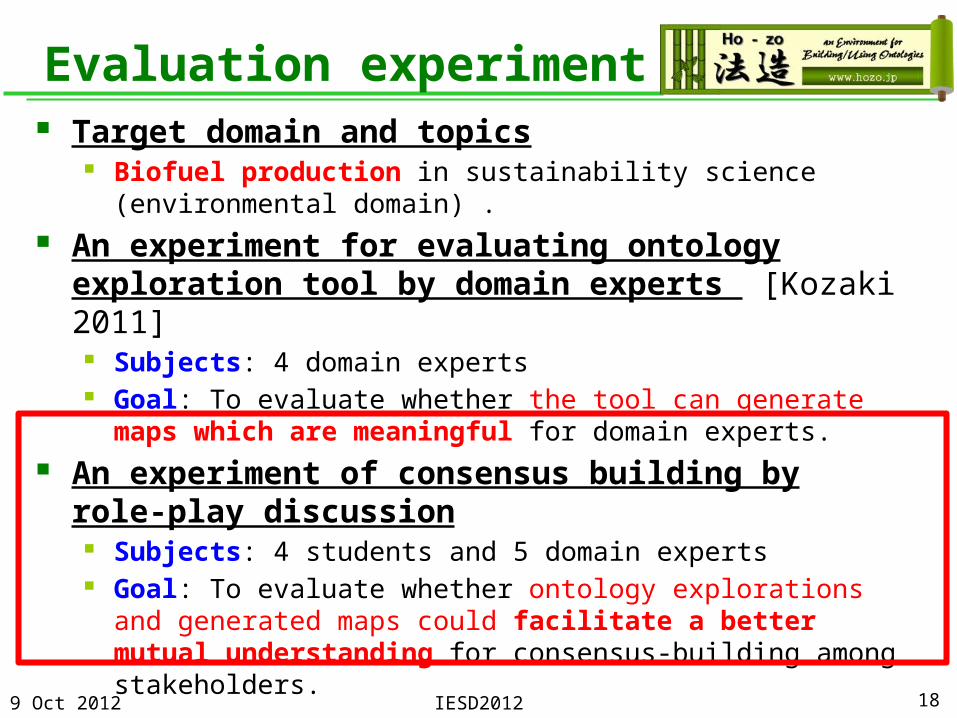
Evaluation experiment
Target domain and topics Biofuel production in sustainability science
(environmental domain) . An experiment for evaluating ontology
exploration tool by domain experts [Kozaki 2011]
Subjects: 4 domain experts Goal: To evaluate whether the tool can generate maps
which are meaningful for domain experts. An experiment of consensus building by role-
play discussion Subjects: 4 students and 5 domain experts Goal: To evaluate whether ontology explorations and
generated maps could facilitate a better mutual understanding for consensus-building among stakeholders.9 Oct 2012 IESD2012 18
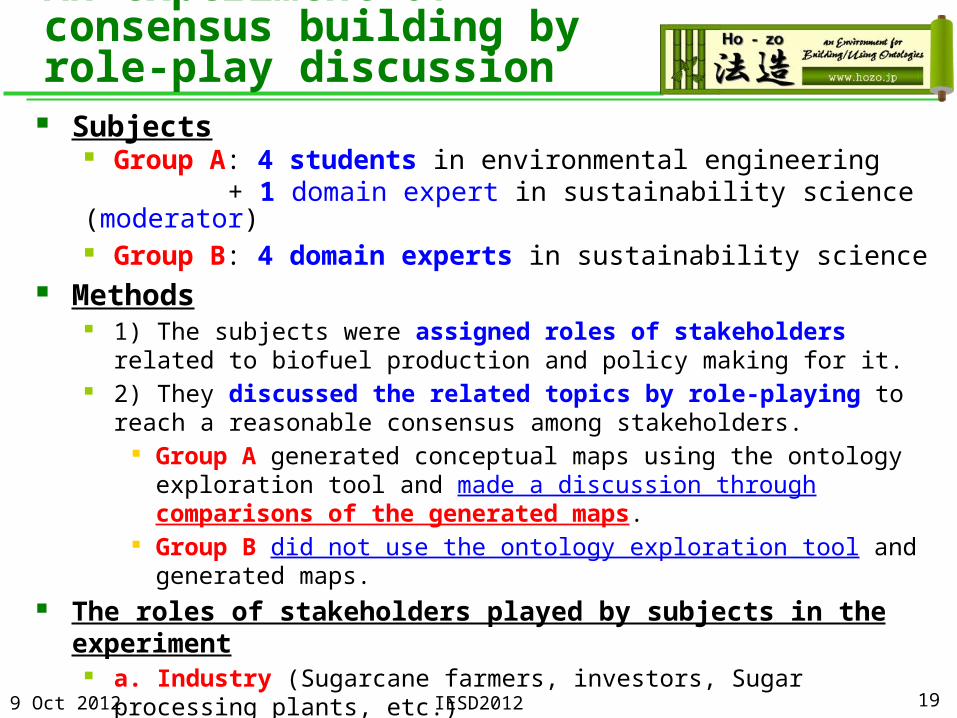
An experiment of consensus building by role-play discussion
Subjects Group A: 4 students in environmental engineering + 1 domain expert in sustainability science (moderator) Group B: 4 domain experts in sustainability science
Methods 1) The subjects were assigned roles of stakeholders related to
biofuel production and policy making for it. 2) They discussed the related topics by role-playing to reach a
reasonable consensus among stakeholders. Group A generated conceptual maps using the ontology
exploration tool and made a discussion through comparisons of the generated maps.
Group B did not use the ontology exploration tool and generated maps.
The roles of stakeholders played by subjects in the experiment
a. Industry (Sugarcane farmers, investors, Sugar processing plants, etc.)
b. Government (President's, the relevant ministry, etc.) c. Employees (Labors union, etc.) d. Environmental NGO
9 Oct 2012 IESD2012 19
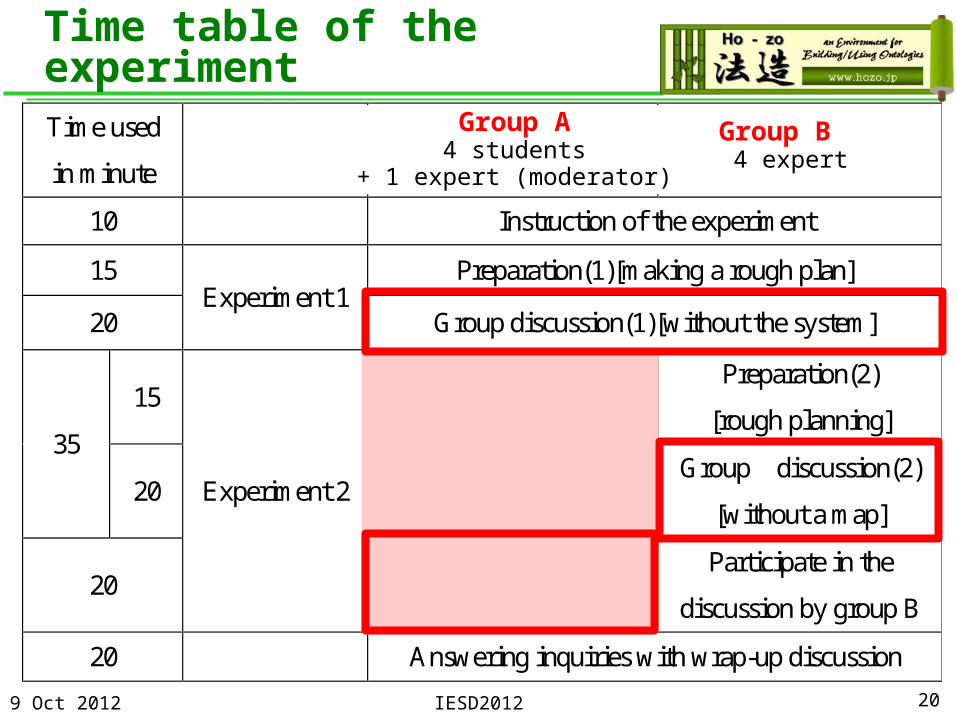
Time used
in minute Group A Group B
10 Instruction of the experiment
15 Experiment 1
Preparation(1)[making a rough plan]
20 Group discussion(1)[without the system]
35
15
Experiment 2
Preparation(2)
[Each builds a map]
Preparation(2)
[rough planning]
20 Group discussion(2)
[without a map]
20 Group discussion (2)
[Discussion with maps]
Participate in the
discussion by group B
20 Answering inquiries with wrap-up discussion
Time table of the experiment
9 Oct 2012 IESD2012 20
Group A 4 students
+ 1 expert (moderator)
Group B 4 expert
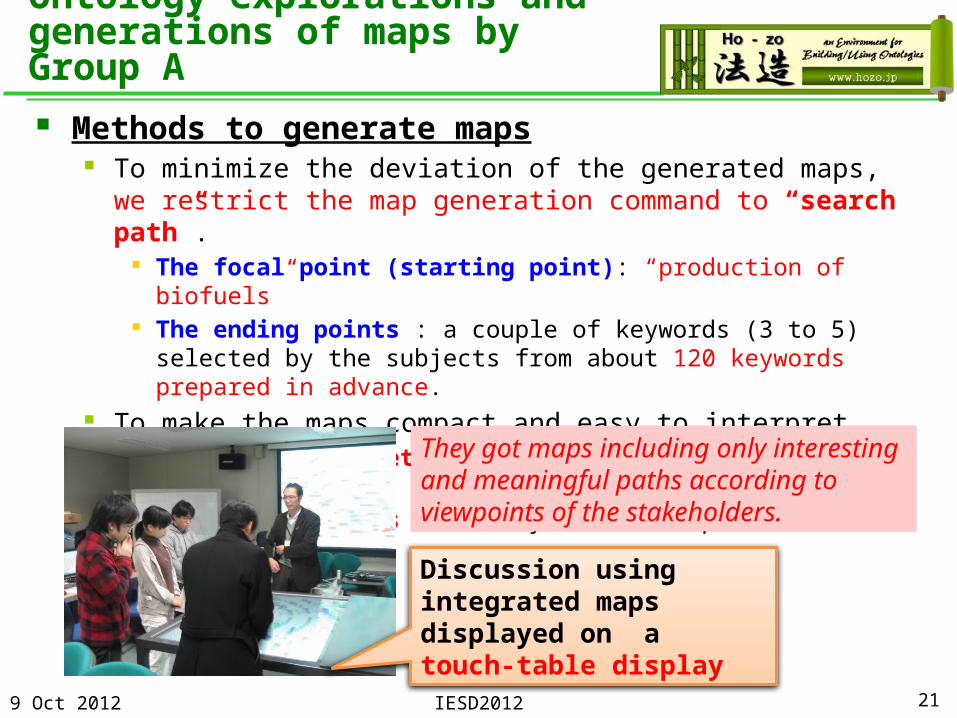
Ontology explorations and generations of maps by Group A Methods to generate maps
To minimize the deviation of the generated maps, we restrict the map generation command to “search path”.
The focal point (starting point): “production of biofuels” The ending points : a couple of keywords (3 to 5) selected
by the subjects from about 120 keywords prepared in advance.
To make the maps compact and easy to interpret The subjects delete paths which they find not interesting. They extend paths that they want to explore further.
9 Oct 2012 IESD2012 21
Discussion using integrated maps displayed on a touch-table display
They got maps including only interesting and meaningful paths according to viewpoints of the stakeholders.

Result: Comparison between the discussion done by groups A and B
9 Oct 2012 IESD2012 22
Time used
in minute Group A Group B
10 Instruction of the experiment
15 Experiment 1
Preparation(1)[making a rough plan]
20 Group discussion(1)[without the system]
35
15
Experiment 2
Preparation(2)
[Each builds a map]
Preparation(2)
[rough planning]
20 Group discussion(2)
[without a map]
20 Group discussion (2)
[Discussion with maps]
Participate in the
discussion by group B
20 Answering inquiries with wrap-up discussion
<<
The number of topics appearing the second discussion
Group A 4 students
+ 1 expert (moderator)
Group B 4 expert
There is no significant difference of the number of topics appearing the first discussion.
Discussion: Comparison between the discussion done by groups A and B Usability Problem
The subjects in group A took much time to learn how to use the system so that they did not have enough time to perform discussion.
We had quite a few requests on improvement of the tool. →The system needs further improvement on its usability.
Coverage of Ontology The discussion done by group B includes concepts that are
not covered by the current ontology. →We need extension of the ontology to cover wider and deeper topics.
9 Oct 2012 IESD2012 23

Result: Discussion by Group A through comparison of the generated maps
9 Oct 2012 IESD2012 24
Time used
in minute Group A Group B
10 Instruction of the experiment
15 Experiment 1
Preparation(1)[making a rough plan]
20 Group discussion(1)[without the system]
35
15
Experiment 2
Preparation(2)
[Each builds a map]
Preparation(2)
[rough planning]
20 Group discussion(2)
[without a map]
20 Group discussion (2)
[Discussion with maps]
Participate in the
discussion by group B
20 Answering inquiries with wrap-up discussion
Group A 4 students
+ 1 expert (moderator)
Group B 4 expert

Result: The number of nodes included in each map built by each subject in group A
Number of nodes in the map
Number of overlapping nodes
a: Industry b:Government c:Employees
d: Environmental
NGO
a:Industry 110 16 21 10
b:Government 88 - 12 5
c:Employees 187 - - 49d:Environment
al NGO 115 - - -
9 Oct 2012 IESD2012 25
* The numbers of overlapping nodes indicate the how much the stakeholders share common interests.
Employees and Environmental NGO share a lot of common interests.
This interpretation is supported by the result of stakeholder analysis by an domain Sexpert [Shiroyama H, et al. 2010].

26
Result: Distributions of overlapping nodes in the integrated map
a: Industry ∩ c:Employees c:Employees ∩ d: Environmental NGO
In the integrated map, overlapping nodes (nodes appeared in both of maps by different stakeholders) are show in gradation of different colors.
Nodes in gradation of colors are near by the center of the map.
Nodes in gradation of colors are widely distributed in the map.
We can understand the differences between viewpoints of stakeholders.
Feedbacks from the subjects
The positive opinions we got from the subjects include:
Visualization of conceptual maps is helpful to understand what respects we are different by identifying what concepts we share and don’t from the map.
It sometimes helps us to understand the issues better by explicating unexpected relations or dependencies between concepts.
It is useful for organizing my opinion to enable smooth discussion.
It is useful to clarify overlap and distinction between us objectively.
These show the feasibility and utility of the system to some extent.
9 Oct 2012 IESD2012 27
DEMO

Concluding Remarks A consensus-building supporting system based on
ontology exploration. It generates conceptual maps through ontology exploration by the
users. Because the generated maps represent the users’ viewpoints to
understand the target domains of the ontology, it could show differences of viewpoints through comparisons of them.
Experiment of consensus building by role-play discussion in biofuel domain
The result shows an integrated map could well represent differences viewpoints of several stakeholders and could help their consensus-building through discussions using the map.
It would contribute to consensus-building on interdisciplinary domains which consist various fields across multiple domains.
Future work There are some rooms to improve the system because we had
several comments about its user interfaces by the subjects. Investigations on useful viewpoints to generate conceptual maps Application of our approach to ontology with instances and Linked
Data.9 Oct 2012 IESD2012 28

Acknowledgement
9 Oct 2012
Thank you for your attention!
HOZO with the ontology exploration tool is available at http://www.hozo.jp/ *The client version is available as a sub-system of Hozo. *Web service version is also available.
29IESD2012
This research partially supported by the Environment Research and Technology Development Fund (E-0802) of the Ministry of the Environment, Japan and Grant-in-Aid for Scientific Research (A) 22240011.