a comprehensive trna deletion library unravels the genetic
TRANSCRIPT

A Comprehensive tRNA Deletion Library Unravels theGenetic Architecture of the tRNA PoolZohar Bloom-Ackermann, Sivan Navon, Hila Gingold, Ruth Towers, Yitzhak Pilpel*, Orna Dahan
Department of Molecular Genetics, Weizmann Institute of Science, Rehovot, Israel
Abstract
Deciphering the architecture of the tRNA pool is a prime challenge in translation research, as tRNAs govern the efficiencyand accuracy of the process. Towards this challenge, we created a systematic tRNA deletion library in Saccharomycescerevisiae, aimed at dissecting the specific contribution of each tRNA gene to the tRNA pool and to the cell’s fitness. Byharnessing this resource, we observed that the majority of tRNA deletions show no appreciable phenotype in rich medium,yet under more challenging conditions, additional phenotypes were observed. Robustness to tRNA gene deletion was oftenfacilitated through extensive backup compensation within and between tRNA families. Interestingly, we found that withintRNA families, genes carrying identical anti-codons can contribute differently to the cellular fitness, suggesting theimportance of the genomic surrounding to tRNA expression. Characterization of the transcriptome response to deletions oftRNA genes exposed two disparate patterns: in single-copy families, deletions elicited a stress response; in deletions ofgenes from multi-copy families, expression of the translation machinery increased. Our results uncover the complexarchitecture of the tRNA pool and pave the way towards complete understanding of their role in cell physiology.
Citation: Bloom-Ackermann Z, Navon S, Gingold H, Towers R, Pilpel Y, et al. (2014) A Comprehensive tRNA Deletion Library Unravels the Genetic Architecture ofthe tRNA Pool. PLoS Genet 10(1): e1004084. doi:10.1371/journal.pgen.1004084
Editor: Gregory P. Copenhaver, The University of North Carolina at Chapel Hill, United States of America
Received April 22, 2013; Accepted November 19, 2013; Published January 16, 2014
Copyright: � 2014 Bloom-Ackermann et al. This is an open-access article distributed under the terms of the Creative Commons Attribution License, whichpermits unrestricted use, distribution, and reproduction in any medium, provided the original author and source are credited.
Funding: We thank grant support from the Ben-May Charitable Trust, and from the European Research Council http://erc.europa.eu/ (through grant number205199-ERNBPTC). The funders had no role in study design, data collection and analysis, decision to publish, or preparation of the manuscript.
Competing Interests: The authors have declared that no competing interests exist.
* E-mail: [email protected]
Introduction
Messenger RNA translation is a central molecular process in
any living cell and is among the most complicated and highly
regulated of cellular processes [1,2]. The tRNA pool is a
fundamental component in that process, serving as the physical
link between the nucleotide sequence of mRNAs and the amino
acid sequence of proteins. In the cycle of translation elongation,
tRNA selection is considered the rate-limiting step [3], therefore
tRNA availability is one of the major factors that govern
translation-efficiency and accuracy of genes [4,5].
Previous studies have established that efficient translation can
increase protein levels and provide a global fitness benefit by
elevating the cellular concentrations of free ribosomes [6,7], while
accurate translation benefits the cell by reducing the metabolic
cost of mis-incorporation events [8].
The tRNA pool is composed of various tRNA isoacceptor
families, each family carries a different anti-codon sequence that
decodes the relevant codon by Watson-Crick base pairing, or
codons with non-perfect base pairing of the third nucleotide by the
wobble interaction. tRNA families are further classified to isotypes
if they carry the same amino acid. In all eukaryotic genomes, each
tRNA family can be encoded by a single or multiple gene copies
[9,10]. It was previously shown for several organisms that the
concentrations of various tRNA isoacceptors positively correlates
with the tRNA family’s gene copy-number [11,12]. These
observations along with detailed analysis of the relationship
between gene copy-number of tRNA families and codon-usage,
established the notion that the multiplicity of tRNA genes in yeast
is not functionally redundant. Such multiplicity might establish the
correct balance between tRNA concentrations and the codon
usage in protein-coding genes [13], thus justifying the use of the
tRNA gene copy-number as a proxy for actual tRNA amounts
[12,14,15].
The transcription of tRNA genes is catalyzed by RNA
polymerase III (pol III), promoted by highly conserved sequence
elements located within the transcribed region [16]. A genome
wide analysis of pol III occupancy in yeast revealed that virtually
all tRNA genes are occupied by the pol III machinery [17–19],
and are thus considered to be genuinely transcribed. This
observation, combined with the fact that tRNA genes within a
family are highly similar, led to the notion that all copies within a
family contribute equally to the total expression level and hence to
the tRNA pool.
Although tRNAs have been extensively studied, until very
recently many of the studies were performed on individual genes at
the biochemical level. Only in recent years systematic genome-
wide approaches started to complement the biochemical ap-
proach. These studies reveal a much more complex picture in
which pol III occupancy, a proxy for tRNA transcription, varies
within families and between tissues [17,20–22]. Expression
however does not equal function, and so far no systematic study
has been carried out to decipher the specific contribution of each
tRNA gene to the tRNA pool and to the cell’s fitness.
To study the role of individual tRNAs and the architecture of
the entire tRNA pool, we created a comprehensive tRNA deletion
library in the yeast Saccharomyces cerevisiae. The library includes 204
deletions of nuclear-encoded tRNA genes out of the total 275
PLOS Genetics | www.plosgenetics.org 1 January 2014 | Volume 10 | Issue 1 | e1004084
present in the yeast genome. In addition, we created double
deletions of selected tRNA gene combinations and of specific
tRNAs with a tRNA modifying enzyme. We developed a robotic
method to screen and score various fitness parameters for these
deletion strains, and applied it across various growth conditions.
This systematic deletion library revealed an architecture of genetic
interactions that feature extensive backup-compensations within
and between tRNA families. Such compensation capacity endows
the organism with robustness to environmental changes and to
genetic mutations. We found that different copies within a tRNA
family contribute differently to the organism’s fitness, revealing a
higher level of complexity in the tRNA pool’s architecture,
possibly at the regulatory level. Finally, we observed two distinct
molecular signatures that underlie the cellular response to changes
in the tRNA pool. First, the deletion of non-essential single-copy
tRNA genes invoked proteotoxic stress responses, indicating a
connection between aberrant tRNA availability and protein
misfolding. Second, the deletion of representative tRNAs from
multi-copy families triggered milder responses by up-regulating
genes that are involved in the translation process. Together our
results uncover the complex architecture of the tRNA pool reviling
a profound effect on cellular fitness and physiology.
Results
Generation of a tRNA deletion library in S. cerevisiaeTo gain a better understanding of the functional role of
individual tRNA genes and their contribution to the tRNA pool,
we created a comprehensive tRNA deletion library in S. cerevisiae,
where in each strain a single nuclear–encoded tRNA gene was
deleted. This methodology is based on recombining a selective
marker into the genome at the expense of the deleted gene, as was
done in the creation of the yeast ORF deletion library [23]
(Figure 1A). A particular challenge in targeting specific tRNA
genes for deletion by such a method stems from the high degree of
sequence similarity within tRNA families, which can share 100%
sequence identity. Consequently, in order to create specific gene
deletions, we relied on unique sequences that overlap or flank the
tRNA genes (see Supplemental text S1). Our tRNA deletion
library contained 204 deletions out of the 275 nuclear-encoded
tRNA genes identified in S. cerevisiae (see Materials and Methods).
These deletions covered all 20 amino acids and 40 of the 42 anti-
codon families. The remaining 71 tRNA genes were not deleted
due to their complex genomic surrounding, since such deletions
might affect neighboring potential features in their genomic
vicinities. The library also consisted of 50 strains that represent
various combinations of tRNA deletions, and co-deletions of
selected tRNAs with the TRM9 gene which codes for an enzyme
that post-transcriptionally modifies tRNA molecules.
Although the majority of tRNA families contain multiple gene
copies, there are six single-copy tRNA families in the S. cerevisiae
genome. Out of these singleton families, four (tS(CGA), tR(CCG),
tQ(CAG) tT(CGU)) were found to be essential in our analysis, which
confirms previous reports [24–26](see Supplemental text S1). The
remaining two singleton families (tR(CCU), tL(GAG)) were identi-
fied as non-essential upon deletion. All the tRNA genes that
belong to multi-copy families were non-essential upon deletion.
Cells were robust to tRNA gene deletions in rich mediumbut reveal sensitivity in challenging conditions
To assess the contribution of each tRNA gene to cellular
growth, we attempted to accurately characterize the growth
dynamics of each deletion strain by implementing a robotic
method to screen and score growth phenotypes of all tRNA
deletion strains in a given growth condition. This fitness
measurement approach allowed us to differentiate between
physiological effects of the deletion under different growth phases,
unlike the competition approaches for fitness measurement [27]
that typically integrated all growth phases. We characterized each
deletion strain by two growth parameters: growth rate and growth
yield, the latter is defined as the size of the population upon
entering stationary phase (Figure 1B and Supplemental figure
S1A).
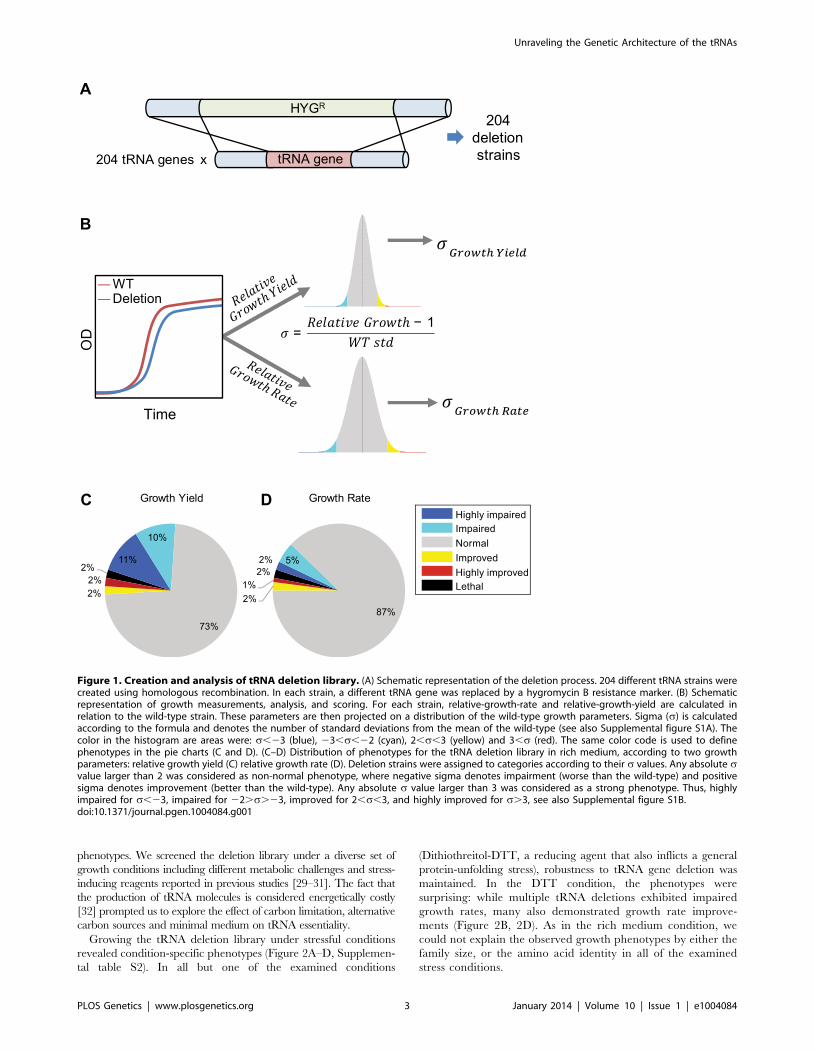
We began the characterization of the tRNA deletion library by
growing the strains in rich medium. Under this condition, 13% of
the deletion strains demonstrated a phenotype in growth rate and
27% showed a growth yield phenotype (Figure 1C–D and
Supplemental figure S1B). Most strains exhibited a notable
phenotype only in one of the two parameters. Strains that showed
altered phenotypes in both growth rate and yield were rare
(Supplemental figure S1B). Overall, most tRNA deletion strains
did not exhibit any altered growth phenotype in rich medium,
indicating robustness to tRNA gene deletion. Seven percent of the
tRNA deletion strains resulted in growth improvement, suggesting
that for some genes the cost of retaining them in the genome and/
or expressing them may exceed their benefit in this condition.
Similar observations were also made on a selection of protein-
coding genes in this species [28]. Apart from the singletons whose
deletion strains were often dead or exhibit impaired growth, we
could not explain the observed growth phenotypes in growth rate
or yield by either tRNA family size or amino acid identity
(Supplemental figure S2). To further examine the phenotypes of
the tRNA deletion strains, we calculated the correlation to the
mRNA expression level of adjacent genes and found none (see,
Supplemental table S1 figure S3 and Supplemental text S1).
Given that yeast cells are constantly exposed to varying environ-
mental conditions, their tRNA repertoire should differentially accom-
modate growth in various environments. We next examine whether
stressful conditions would retain the robustness observed in rich
medium or reveal another set of condition-dependent growth
Author Summary
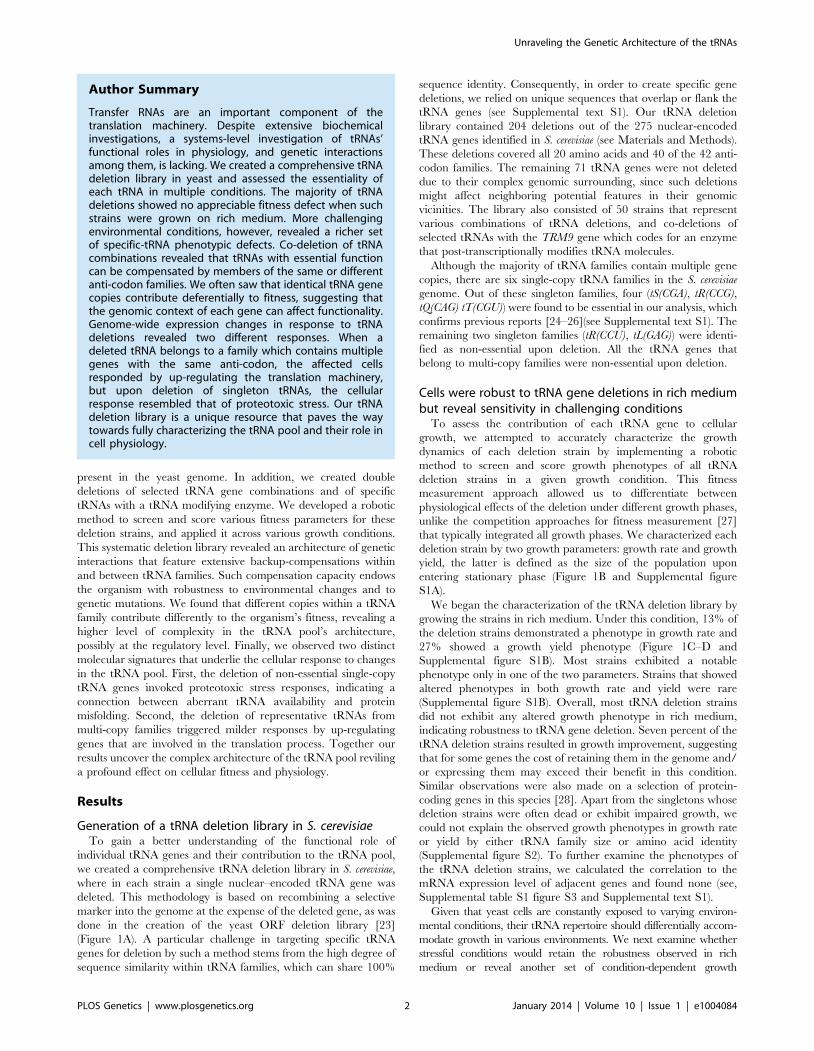
Transfer RNAs are an important component of thetranslation machinery. Despite extensive biochemicalinvestigations, a systems-level investigation of tRNAs’functional roles in physiology, and genetic interactionsamong them, is lacking. We created a comprehensive tRNAdeletion library in yeast and assessed the essentiality ofeach tRNA in multiple conditions. The majority of tRNAdeletions showed no appreciable fitness defect when suchstrains were grown on rich medium. More challengingenvironmental conditions, however, revealed a richer setof specific-tRNA phenotypic defects. Co-deletion of tRNAcombinations revealed that tRNAs with essential functioncan be compensated by members of the same or differentanti-codon families. We often saw that identical tRNA genecopies contribute deferentially to fitness, suggesting thatthe genomic context of each gene can affect functionality.Genome-wide expression changes in response to tRNAdeletions revealed two different responses. When adeleted tRNA belongs to a family which contains multiplegenes with the same anti-codon, the affected cellsresponded by up-regulating the translation machinery,but upon deletion of singleton tRNAs, the cellularresponse resembled that of proteotoxic stress. Our tRNAdeletion library is a unique resource that paves the waytowards fully characterizing the tRNA pool and their role incell physiology.
Unraveling the Genetic Architecture of the tRNAs
PLOS Genetics | www.plosgenetics.org 2 January 2014 | Volume 10 | Issue 1 | e1004084
phenotypes. We screened the deletion library under a diverse set of
growth conditions including different metabolic challenges and stress-
inducing reagents reported in previous studies [29–31]. The fact that
the production of tRNA molecules is considered energetically costly
[32] prompted us to explore the effect of carbon limitation, alternative
carbon sources and minimal medium on tRNA essentiality.
Growing the tRNA deletion library under stressful conditions
revealed condition-specific phenotypes (Figure 2A–D, Supplemen-
tal table S2). In all but one of the examined conditions
(Dithiothreitol-DTT, a reducing agent that also inflicts a general
protein-unfolding stress), robustness to tRNA gene deletion was
maintained. In the DTT condition, the phenotypes were
surprising: while multiple tRNA deletions exhibited impaired
growth rates, many also demonstrated growth rate improve-
ments (Figure 2B, 2D). As in the rich medium condition, we
could not explain the observed growth phenotypes by either the
family size, or the amino acid identity in all of the examined
stress conditions.
Figure 1. Creation and analysis of tRNA deletion library. (A) Schematic representation of the deletion process. 204 different tRNA strains werecreated using homologous recombination. In each strain, a different tRNA gene was replaced by a hygromycin B resistance marker. (B) Schematicrepresentation of growth measurements, analysis, and scoring. For each strain, relative-growth-rate and relative-growth-yield are calculated inrelation to the wild-type strain. These parameters are then projected on a distribution of the wild-type growth parameters. Sigma (s) is calculatedaccording to the formula and denotes the number of standard deviations from the mean of the wild-type (see also Supplemental figure S1A). Thecolor in the histogram are areas were: s,23 (blue), 23,s,22 (cyan), 2,s,3 (yellow) and 3,s (red). The same color code is used to definephenotypes in the pie charts (C and D). (C–D) Distribution of phenotypes for the tRNA deletion library in rich medium, according to two growthparameters: relative growth yield (C) relative growth rate (D). Deletion strains were assigned to categories according to their s values. Any absolute svalue larger than 2 was considered as non-normal phenotype, where negative sigma denotes impairment (worse than the wild-type) and positivesigma denotes improvement (better than the wild-type). Any absolute s value larger than 3 was considered as a strong phenotype. Thus, highlyimpaired for s,23, impaired for 22.s.23, improved for 2,s,3, and highly improved for s.3, see also Supplemental figure S1B.doi:10.1371/journal.pgen.1004084.g001
Unraveling the Genetic Architecture of the tRNAs
PLOS Genetics | www.plosgenetics.org 3 January 2014 | Volume 10 | Issue 1 | e1004084

Unraveling the Genetic Architecture of the tRNAs
PLOS Genetics | www.plosgenetics.org 4 January 2014 | Volume 10 | Issue 1 | e1004084

Extensive redundancy underlies robustness to tRNA genedeletion
Our observations of robustness to tRNA gene deletions in rich
medium, as well as several stressful growth conditions, prompted
us to further explore the genetic architecture conferring this
phenotype. Given that most tRNA families contain multiple gene
copies, we hypothesized that at least part of the observed
robustness might be the outcome of compensation provided by
the remaining genes in the family. In addition, due to wobble-
interactions, robustness may also be the outcome of compensation
between families of the same isotype. Focusing on rich medium
conditions, we generated selected combinations of multiple tRNA
deletions. To examine the first possibility we created deletions of
entire two-member and three-member tRNA families. As shown
in figure 3A such family deletions resulted in either lethality
(indicating a loss of the family’s function), or viability with growth
impairment (indicating a partial compensation of the family’s
function by other families).
We then turned to examine in more detail the interactions
within these essential three-gene families by examining the growth
of various double deletion strains. Contrary to the common notion
that suggests little or no functional redundancy between tRNA
gene copies [13], we observed that in each of these families any
one family member can sustain normal or near-normal fitness
(Figure 3A, Supplemental figure S4A–B and Supplemental table
S3). Similar observations were made for essential two-gene families
upon one member’s deletion (Figure 3A). Such results can either
imply that yeast cells carry more tRNA copies than are actually
needed to sustain growth under optimal growth conditions, or that
a responsive backup mechanism might be at work, one that
provides compensation by increasing the transcription of the
remaining copies, as was previously observed in protein-coding
genes [33–35]. We thus decided to investigate the expression levels
of certain tRNA families, using RT-qPCR (Figure S5). For each
deletion, we compared the expression level of the remaining copies
belonging to the designated family to that of a wild-type strain. We
observed in most strains an expected reduction in expression of the
respective family. These findings suggest that in these families,
tRNA supply exceeds the demand under rich medium conditions
(Figure S5A). However in some cases there were no such decreases
in expression, there were even observable increases, demonstrating
that a responsive backup mechanism may have been at work,
inducing the expression of the remaining family members
following deletion of a certain member (Figure S5B).
Next, we turned to examine the surprising cases in which the
deletion of an entire tRNA gene family resulted in a viable strain.
We reasoned that in these cases a different type of compensation,
which is based on wobble interactions across iso-acceptor families,
came into play. To decipher this compensation mechanism we
focused on the genetic interactions involving the two non-essential
singleton families, tL(GAG) and tR(CCU) (Figure 3A).
In the absence of tL(GAG), the members of the tL(UAG) family
represent the sole tRNA that can decode the CUN Leucine
codons, and might be a candidate for providing compensation
upon deletion of tL(GAG) even though such decoding does not
match the classic wobble rules [36]. Co-deletion of tL(GAG) with
one of the tL(UAG) gene copies resulted in growth aggravation and
negative epistasis. Deletion of the tL(GAG) together with two copies
of the tL(UAG) family was lethal despite the fact that one copy of
tL(UAG) still remained in the genome, indicating that a single
tL(UAG) gene was insufficient to compensate for the loss of
tL(GAG) (Figure 3B). The genetic interaction between tL(UAG) and
tL(GAG) appeared specific, since co-deleting one copy of the
tL(UAG) family together with two additional tRNA genes
(tL(CAA)G3 and tW(CCA)G1) did not generate observable epistasis
in either case (Figure 3B). We thus concluded that the tL(UAG)
family is partially redundant to the tL(GAG) family, yet such
redundancy was not sufficient to completely compensate for the
loss of tL(GAG).
Similarly, the viability of the tR(CCU) deletion strain could be
due to compensation provided by the 11 copies of the tR(UCU)
family. Indeed the wobble rules are consistent with this
assumption, but such interaction was never functionally demon-
strated. Formally, demonstrating that the tR(UCU) family can
compensate for the loss of the singleton tR(CCU) would amount to
co-deleting all 12 tRNA genes. Looking for simpler means, we
decided on a more economic, albeit indirect way. We co-deleted
the singleton tR(CCU) with the Trm9 enzyme, which is responsible
for methylating the third anticodon position of tR(UCU) and
tE(UUC) [37]. It was previously shown that such methylation is
needed for supporting the wobble interaction between tR(UCU)
tRNAs and the AGG codon (the cognate codon of the CCU anti-
codon) [37]. The tR(CCU)–trm9 double deletion strain was viable,
but exhibited an appreciable aggravation of growth yield
(Figure 3A and 3C). Thus our results confirm that the methylated
tR(UCU) family can partially compensate for the loss of tR(CCU).
We attempted to define a more general role for the Trm9
modification enzyme in modulating the compensation mechanism
between tRNA families. To this end we created 10 additional
double deletions of the enzyme along with each of 10 tRNA genes
from two glutamic acid families, one that is modified by the
enzyme and one that is reportedly not modified by the enzyme
[38] (see Supplemental figure S6). No epistasis was detected
between the enzyme and any of these 10 tRNAs and hence, the
data cannot support or exclude a putative similar role of the
enzyme beyond the tR(UCU) family.
We thus conclude that there are two mechanisms that can
account for the observed robustness for tRNA deletions under
favorable growth conditions. The first is redundancy within a
family, and its efficiency appears to be independent of the number
of remaining tRNA gene copies. The second is compensation
between families, which operates via wobble interactions.
Identical tRNA genes contributed differentially to cellularfitness
We then asked whether all copies within a family contribute
equally to the tRNA pool. It is often implicitly assumed that all
tRNA copies contribute similarly to the cellular tRNA pool.
However, comparison of the growth parameters of tRNA deletions
from the same family revealed marked differences between
Figure 2. Screening the tRNA deletion library across various growth conditions. (A) Percent of strains exhibiting a growth yield phenotypein various conditions. The color indicates the type of phenotype: impaired (blue) or improved (red). (B) Percent of strains exhibiting a growth ratephenotype in various conditions. (C–D) The s values measured for both the growth yield (C) and the growth rate (D) for all deletion strains across sixconditions. The color bar indicates the s values, red denoting improvement and blue impairment. Each row denotes a tRNA deletion strain and eachcolumn denotes different growth condition. Strains are ordered on the y-axis according to amino acids (denoted by letter) and further separated intofamilies (denoted by lines within the amino-acid box). Black rows denote lethal strains. Gray rows indicate strains for which the respective value wasnot measured.doi:10.1371/journal.pgen.1004084.g002
Unraveling the Genetic Architecture of the tRNAs
PLOS Genetics | www.plosgenetics.org 5 January 2014 | Volume 10 | Issue 1 | e1004084

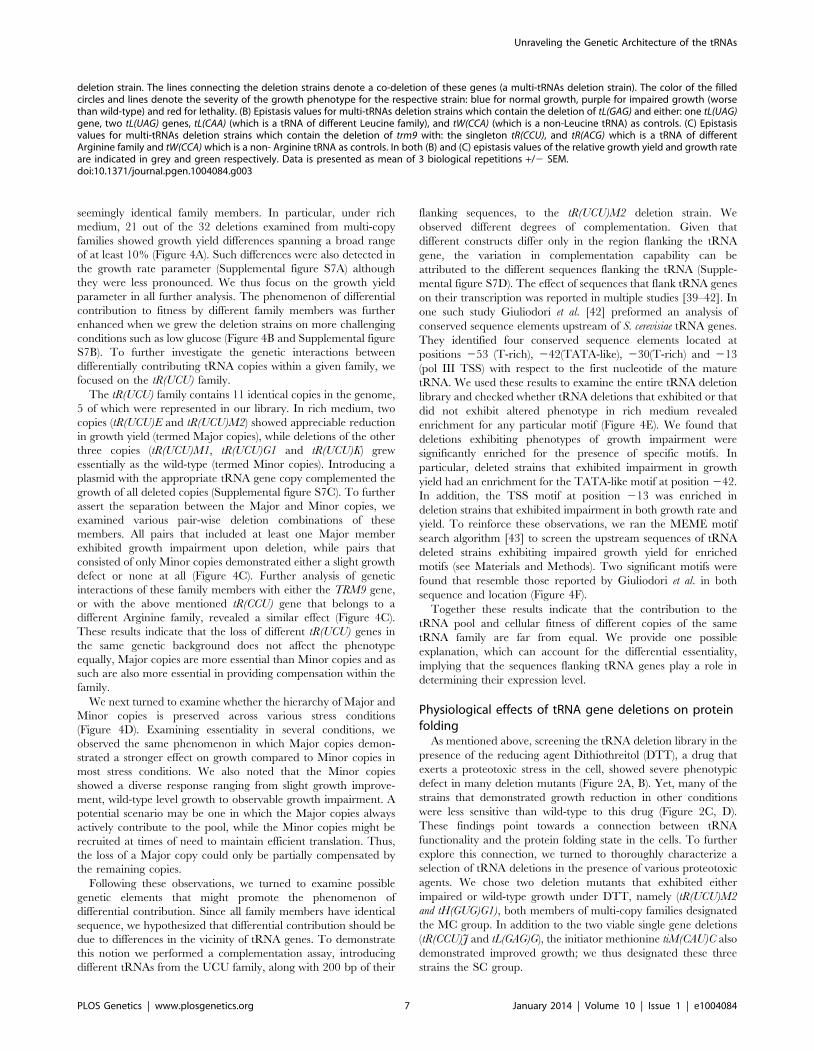
Figure 3. Extensive redundancy underlies robustness to tRNA gene deletion. (A) Schematic representation of the genetic interactionswithin and between tRNA families. Families are denoted by dark grey circles and grouped (black dashed line) according to their tRNA copy number.Each family is denoted by its anti-codon and amino-acid. A protein-coding gene i.e. TRM9 is denoted by a grey box. Each filled circle indicates a tRNA
Unraveling the Genetic Architecture of the tRNAs
PLOS Genetics | www.plosgenetics.org 6 January 2014 | Volume 10 | Issue 1 | e1004084
seemingly identical family members. In particular, under rich
medium, 21 out of the 32 deletions examined from multi-copy
families showed growth yield differences spanning a broad range
of at least 10% (Figure 4A). Such differences were also detected in
the growth rate parameter (Supplemental figure S7A) although
they were less pronounced. We thus focus on the growth yield
parameter in all further analysis. The phenomenon of differential
contribution to fitness by different family members was further
enhanced when we grew the deletion strains on more challenging
conditions such as low glucose (Figure 4B and Supplemental figure
S7B). To further investigate the genetic interactions between
differentially contributing tRNA copies within a given family, we
focused on the tR(UCU) family.
The tR(UCU) family contains 11 identical copies in the genome,
5 of which were represented in our library. In rich medium, two
copies (tR(UCU)E and tR(UCU)M2) showed appreciable reduction
in growth yield (termed Major copies), while deletions of the other
three copies (tR(UCU)M1, tR(UCU)G1 and tR(UCU)K) grew
essentially as the wild-type (termed Minor copies). Introducing a
plasmid with the appropriate tRNA gene copy complemented the
growth of all deleted copies (Supplemental figure S7C). To further
assert the separation between the Major and Minor copies, we
examined various pair-wise deletion combinations of these
members. All pairs that included at least one Major member
exhibited growth impairment upon deletion, while pairs that
consisted of only Minor copies demonstrated either a slight growth
defect or none at all (Figure 4C). Further analysis of genetic
interactions of these family members with either the TRM9 gene,
or with the above mentioned tR(CCU) gene that belongs to a
different Arginine family, revealed a similar effect (Figure 4C).
These results indicate that the loss of different tR(UCU) genes in
the same genetic background does not affect the phenotype
equally, Major copies are more essential than Minor copies and as
such are also more essential in providing compensation within the
family.
We next turned to examine whether the hierarchy of Major and
Minor copies is preserved across various stress conditions
(Figure 4D). Examining essentiality in several conditions, we
observed the same phenomenon in which Major copies demon-
strated a stronger effect on growth compared to Minor copies in
most stress conditions. We also noted that the Minor copies
showed a diverse response ranging from slight growth improve-
ment, wild-type level growth to observable growth impairment. A
potential scenario may be one in which the Major copies always
actively contribute to the pool, while the Minor copies might be
recruited at times of need to maintain efficient translation. Thus,
the loss of a Major copy could only be partially compensated by
the remaining copies.
Following these observations, we turned to examine possible
genetic elements that might promote the phenomenon of
differential contribution. Since all family members have identical
sequence, we hypothesized that differential contribution should be
due to differences in the vicinity of tRNA genes. To demonstrate
this notion we performed a complementation assay, introducing
different tRNAs from the UCU family, along with 200 bp of their
flanking sequences, to the tR(UCU)M2 deletion strain. We
observed different degrees of complementation. Given that
different constructs differ only in the region flanking the tRNA
gene, the variation in complementation capability can be
attributed to the different sequences flanking the tRNA (Supple-
mental figure S7D). The effect of sequences that flank tRNA genes
on their transcription was reported in multiple studies [39–42]. In
one such study Giuliodori et al. [42] preformed an analysis of
conserved sequence elements upstream of S. cerevisiae tRNA genes.
They identified four conserved sequence elements located at
positions 253 (T-rich), 242(TATA-like), 230(T-rich) and 213
(pol III TSS) with respect to the first nucleotide of the mature
tRNA. We used these results to examine the entire tRNA deletion
library and checked whether tRNA deletions that exhibited or that
did not exhibit altered phenotype in rich medium revealed
enrichment for any particular motif (Figure 4E). We found that
deletions exhibiting phenotypes of growth impairment were
significantly enriched for the presence of specific motifs. In
particular, deleted strains that exhibited impairment in growth
yield had an enrichment for the TATA-like motif at position 242.
In addition, the TSS motif at position 213 was enriched in
deletion strains that exhibited impairment in both growth rate and
yield. To reinforce these observations, we ran the MEME motif
search algorithm [43] to screen the upstream sequences of tRNA
deleted strains exhibiting impaired growth yield for enriched
motifs (see Materials and Methods). Two significant motifs were
found that resemble those reported by Giuliodori et al. in both
sequence and location (Figure 4F).
Together these results indicate that the contribution to the
tRNA pool and cellular fitness of different copies of the same
tRNA family are far from equal. We provide one possible
explanation, which can account for the differential essentiality,
implying that the sequences flanking tRNA genes play a role in
determining their expression level.
Physiological effects of tRNA gene deletions on proteinfolding
As mentioned above, screening the tRNA deletion library in the
presence of the reducing agent Dithiothreitol (DTT), a drug that
exerts a proteotoxic stress in the cell, showed severe phenotypic
defect in many deletion mutants (Figure 2A, B). Yet, many of the
strains that demonstrated growth reduction in other conditions
were less sensitive than wild-type to this drug (Figure 2C, D).
These findings point towards a connection between tRNA
functionality and the protein folding state in the cells. To further
explore this connection, we turned to thoroughly characterize a
selection of tRNA deletions in the presence of various proteotoxic
agents. We chose two deletion mutants that exhibited either
impaired or wild-type growth under DTT, namely (tR(UCU)M2
and tH(GUG)G1), both members of multi-copy families designated
the MC group. In addition to the two viable single gene deletions
(tR(CCU)J and tL(GAG)G), the initiator methionine tiM(CAU)C also
demonstrated improved growth; we thus designated these three
strains the SC group.
deletion strain. The lines connecting the deletion strains denote a co-deletion of these genes (a multi-tRNAs deletion strain). The color of the filledcircles and lines denote the severity of the growth phenotype for the respective strain: blue for normal growth, purple for impaired growth (worsethan wild-type) and red for lethality. (B) Epistasis values for multi-tRNAs deletion strains which contain the deletion of tL(GAG) and either: one tL(UAG)gene, two tL(UAG) genes, tL(CAA) (which is a tRNA of different Leucine family), and tW(CCA) (which is a non-Leucine tRNA) as controls. (C) Epistasisvalues for multi-tRNAs deletion strains which contain the deletion of trm9 with: the singleton tR(CCU), and tR(ACG) which is a tRNA of differentArginine family and tW(CCA) which is a non- Arginine tRNA as controls. In both (B) and (C) epistasis values of the relative growth yield and growth rateare indicated in grey and green respectively. Data is presented as mean of 3 biological repetitions +/2 SEM.doi:10.1371/journal.pgen.1004084.g003
Unraveling the Genetic Architecture of the tRNAs
PLOS Genetics | www.plosgenetics.org 7 January 2014 | Volume 10 | Issue 1 | e1004084
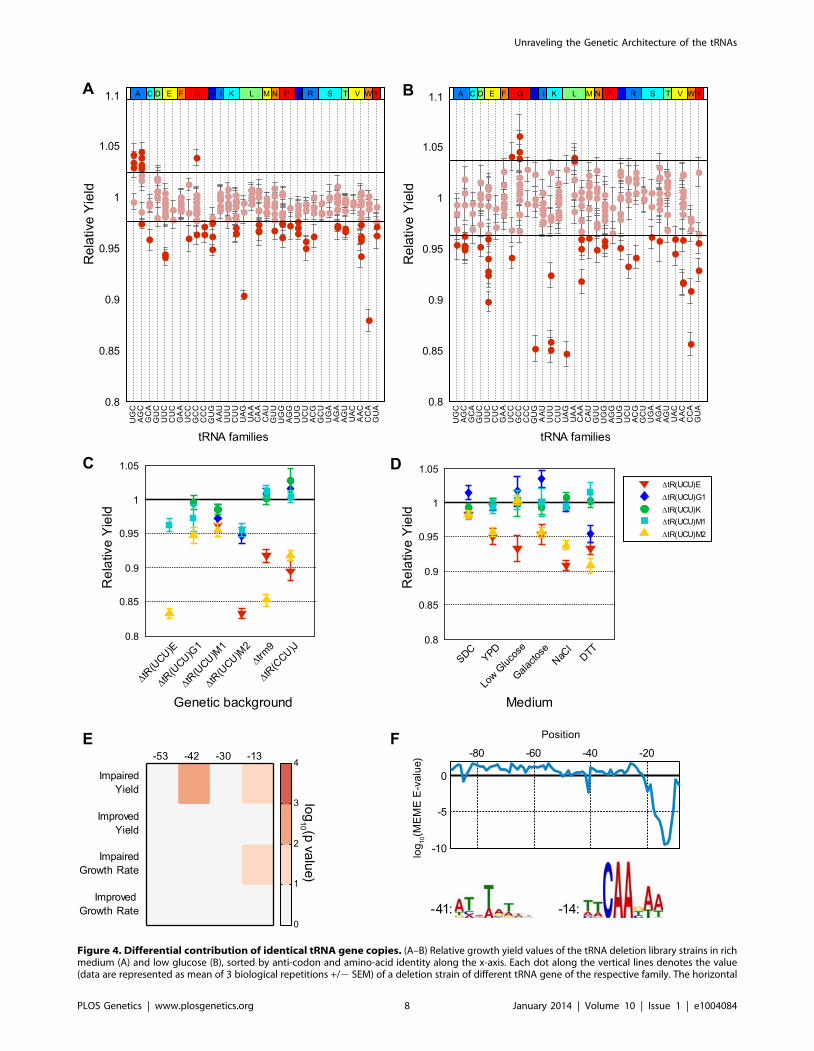
Figure 4. Differential contribution of identical tRNA gene copies. (A–B) Relative growth yield values of the tRNA deletion library strains in richmedium (A) and low glucose (B), sorted by anti-codon and amino-acid identity along the x-axis. Each dot along the vertical lines denotes the value(data are represented as mean of 3 biological repetitions +/2 SEM) of a deletion strain of different tRNA gene of the respective family. The horizontal
Unraveling the Genetic Architecture of the tRNAs
PLOS Genetics | www.plosgenetics.org 8 January 2014 | Volume 10 | Issue 1 | e1004084
The various strains were treated with either DTT, Azetidine 2
carboxylic acid (AZC)- a toxic analog of proline [44], or
Tunicamycin- a drug used to induce the unfolded protein response
(UPR) in the endoplasmic reticulum (ER) [45]. The growth of
each strain was characterized under each proteotoxic agent
applied at several concentrations. The strains in the MC group
demonstrated either growth impairment or wild-type growth
under all examined conditions. However, the deletions of single-
copy tRNAs and to some extent the imitator methionine
demonstrated reduced sensitivity to all three proteotoxic agents
(Figure 5A–C). The differences in relative growth for all the
examined strains were apparent even at low concentrations and
were consistent upon increase in the concentrations of these
proteotoxic agents (Figure 5A–C).
The fact that the tRNA deletion strains from the SC group are
resistant to proteotoxic agents led us to hypothesize that deleting
these genes might inflict intrinsic and chronic misfolding stress,
even at the absence of the drug. This stress results in the activation
of relevant cellular response that protects cells from the
aggravating effect of extrinsic proteotoxic stress. Such an effect is
reminiscent of the cross protection effect observed between
environmental stressors [46], yet here it is manifested between a
genetic perturbation and an environmental stress.
To directly examine whether changes in the tRNA pool induce
proteotoxic stress in these strains, we examined the state of the
protein quality control machinery using the naturally unstructured
human protein VHL as a proteotoxic stress reporter [47]. In this
system, the VHL protein can be destined to one of two cellular
localizations. If the cell experiences protein-folding stress, the
heterologous protein VHL will aggregate in inclusions (or puncta)
due to saturation of the protein quality control machinery. In
contrast, under normal conditions, the quality control machinery
is available to properly deal with this naturally unfolded
heterologous protein, thus it remains soluble in the cytoplasm
and no inclusions are formed. For each of the five deletion strains,
we quantified the number of VHL inclusions (puncta) in
populations of yeast cells. This analysis revealed that indeed the
tRNA deletions in the SC group exhibited a significant increase in
the number puncta containing cells relative to the wild-type
(Figure 5D and 5F), indicating saturation of the quality control
machinery caused by intrinsic proteotoxic stress. The MC group
did not exhibit inherent proteotoxic stress; their puncta containing
cells count resembled that of the wild-type.
The inherent chronic proteotoxic stress observed for the SC
deletions might provide them with the capacity to respond better
to an additional external proteotoxic stress. To further explore this
possibility we examined the state of the protein quality control
machinery upon extrinsic proteotoxic stress induced by treatment
with AZC. Treating the wild-type cells with AZC resulted in a
rapid accumulation of the VHL protein in stress foci, indicated by
increase in the occurrence of multiple inclusions [48]. As
anticipated, the behavior of the SC group demonstrated a
significant increase in the presence of a single punctum upon
AZC treatment, however the appearance of stress foci (multi-
puncta) was significantly lower compared to the wild-type and to
the MC group (Figure 5E and 5G). As in the previous experiment,
the deletions of the MC group responded in a similar manner to
that of the wild-type, displaying increased number of stress foci.
These results thus indicate that the deletion of some tRNA
genes induced an inherent proteotoxic stress in the cell,
demonstrating a physiological role of proper tRNA supply in
protein folding by an undetermined mechanism. Such physiolog-
ical response renders these cells relatively less sensitive, compared
to other tRNA deletion strains and the wild-type, from the
otherwise harmful effect of proteotoxic drugs.
Different molecular responses to deletions of tRNAs fromsingle and multiple copy families
To determine whether changes in the tRNA pool result in a
distinct molecular signature, we examined the same set of tRNA
deletions (SC and MC groups) using mRNA microarrays. For each
strain, we measured genome-wide changes in mRNA levels
compared to the wild-type, under rich growth conditions. The
expression changes we observed were modest and demonstrated a
correlation between the essentiality of the tRNA gene and the
extent of changes in mRNA expression upon its loss. Hierarchical
clustering of the strains according to similarity in expression
changes (Fig. 6A and supplemental figure S8), revealed that the
strains could be divided into two groups recapitulating the division
to the SC and MC groups. An example for this division can be
found in the pronounced effect observed for the COS8 gene. This
gene was extremely up-regulated (about 16 fold) in the SC group
while unchanged in the MC group (Figure 6B). These results
suggest different molecular signatures for the two groups, which
are also related to the proteotoxic stress response.
To determine the responses and the underling molecular
pathways that differentiate these two groups, we examined which
KEGG pathways [49,50] differentiate between them. We used
Gene Set Enrichment Analysis (GSEA), a computational software
which determines whether a defined set of genes shows statistically
significant differences between two biological states [51,52]. This
analysis revealed a somewhat opposite signature between the two
groups (Table 1 and supplemental figure S8). Pathways which are
responsive to proteotoxic stress such as the Proteasome (FDR q-
value,1E-5) and Protein processing in endoplasmic reticulum
(FDR q-value 2E-3) were significantly induced in the SC group
relative to the MC group. While in the MC groups, translation-
related pathways such as Ribosome biogenesis (FDR q-value,1E-
5) and Ribosome (FDR q-value 1E-4) were significantly induced
compared to the SC group.
To further characterize these differences we focused on specific
pathways. A more detailed examination of the expression changes
observed for all the genes that constitute the proteasome complex
revealed an up-regulation to various extents in response to deletion
of tRNAs from the SC group. The MC group demonstrated no
change and even a slight down-regulation of these genes
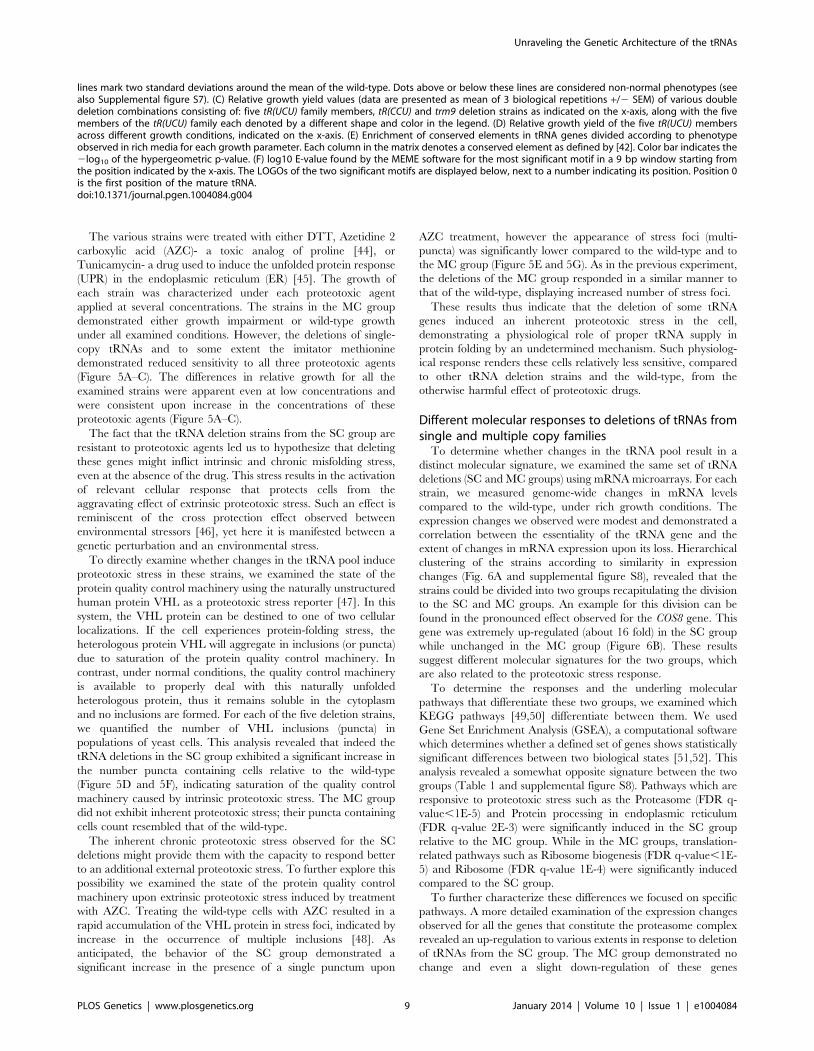
lines mark two standard deviations around the mean of the wild-type. Dots above or below these lines are considered non-normal phenotypes (seealso Supplemental figure S7). (C) Relative growth yield values (data are presented as mean of 3 biological repetitions +/2 SEM) of various doubledeletion combinations consisting of: five tR(UCU) family members, tR(CCU) and trm9 deletion strains as indicated on the x-axis, along with the fivemembers of the tR(UCU) family each denoted by a different shape and color in the legend. (D) Relative growth yield of the five tR(UCU) membersacross different growth conditions, indicated on the x-axis. (E) Enrichment of conserved elements in tRNA genes divided according to phenotypeobserved in rich media for each growth parameter. Each column in the matrix denotes a conserved element as defined by [42]. Color bar indicates the2log10 of the hypergeometric p-value. (F) log10 E-value found by the MEME software for the most significant motif in a 9 bp window starting fromthe position indicated by the x-axis. The LOGOs of the two significant motifs are displayed below, next to a number indicating its position. Position 0is the first position of the mature tRNA.doi:10.1371/journal.pgen.1004084.g004
Unraveling the Genetic Architecture of the tRNAs
PLOS Genetics | www.plosgenetics.org 9 January 2014 | Volume 10 | Issue 1 | e1004084

(Figure 6C), a trend which was further verified using RT-qPCR
(Figure 6D). These observations establish the notion that cells
experience proteotoxic stress upon deletion of members of the SC
group. A further indication of proteotoxic stress in these deletion
strains is the up regulation of COS8. The exact biological function
of this gene is still unclear, it was however found to interacts with
IRE1, which is a hallmark regulator of the unfolding stress
response [53].
An interesting distinction between the groups was also observed
in the pathway consisting of the RNA polymerase machinery.
Expression of genes that belong to this pathway were up-regulated
only in the MC group (Table 1). Separating the RNA polymerase
genes into modules corresponding to the different polymerases,
revealed an interesting pattern. While the genes that encode RNA
Pol II subunits did not change in any of the tRNA deletion strains
(Supplemental figure S9), the genes encoding RNA Pol III
machinery (the polymerase responsible for tRNA gene transcrip-
tion) demonstrated up-regulation in the MC group and no change
or even down regulation in the SC group (Figure 6E). These
results were further verified by RT-qPCR (Figure 6F). Up-
regulation of the pol III machinery for the MC group may suggest
that in some MC deletion strains, the transcription of the
remaining tRNA genes could increase, thus providing a possible
molecular mechanism for backup compensation within families.
Such response to deletions of tRNAs from the MC group could
indicate the presence of a negative feedback loop, allowing the cell
to respond to changes in the tRNA pool in the attempt to regain
steady state levels.
Figure 5. Changes in the tRNA pool affect protein folding. (A–C) Relative growth rate (compare to wild-type) of the following five deletionstrain: tL(GAG)G (blue), tR(CCU)J (red), tiM(CAU)C (green), tH(GUG)G1 (magenta) and tR(UCU)M2 (cyan). Strains were grown in media supplementedwith increasing concentrations of the following proteotoxic agent: AZC (A) Tunicamycin (B) DTT (C). (D) Percentage of cells that contain puncta in thepopulations of the above strains. (E) Percentage of cells that contain puncta in the populations of the above strains following treatment with 2.5 mMAZC. Data are presented as mean of 3 biological repetitions +/2 SEM, in each repetition 500 cells were counted. (*) P,0.001 by Students t-test. (F–G)Images of representative fields for the wild-type and tR(CCU)J deletion strain, without treatment (F) and following treatment with 2.5 mM AZC (G).doi:10.1371/journal.pgen.1004084.g005
Unraveling the Genetic Architecture of the tRNAs
PLOS Genetics | www.plosgenetics.org 10 January 2014 | Volume 10 | Issue 1 | e1004084

Figure 6. Molecular response to changes in the tRNA pool. (A) Dendrogram created by clustering changes in gene expression for fiverepresentative deletion strains, for more information see Materials and Methods. (B) Fold change of the COS8 (YHL048W) mRNA levels in each of thefive deletion strains as measured by microarrays. (C) The fold change distribution of mRNA levels as measured by microarrays, of genes composingthe Proteasome pathway by the KEGG database [49], for each of the listed tRNA deletion strains. (D) mRNA Fold change of 6 representative genesfrom the proteasome pathway measured by RT-qPCR. Presented values are the mean of 3 biological repetitions +/2 SEM. The strain colors are as in(C). If the mRNA fold change in a specific strain is significantly different from 0 (t-test) it is marked with:* (p,0.05) or ** (p,0.005). (E) The fold changedistribution of mRNA levels as measured by microarrays, of genes composing the Pol III RNA Polymerase machinery module by the KEGG database,for each tRNA deletion strain. (F) mRNA Fold change of 6 representative genes from the Pol III KEGG module measured by RT-qPCR. Presented valuesare the mean of 3 biological repetitions +/2 SEM. The strain colors are as in figure (C). If the mRNA fold change in a specific strain is significantly
Unraveling the Genetic Architecture of the tRNAs
PLOS Genetics | www.plosgenetics.org 11 January 2014 | Volume 10 | Issue 1 | e1004084

DiscussionIn this study, we investigated the genetic architecture of the
tRNA pool and its effect on cellular fitness using a comprehensive
tRNA deletion library. We found extensive dispensability of many
tRNA genes, especially under optimal growth conditions. Such
lack of essentiality has been studied in protein-coding genes, and is
often interpreted to reveal a role for partially redundant genes and
pathways providing backup compensation for the deleted gene
[33,34,54–56]. Similar design principles are displayed in the
architecture of tRNA genes, which exhibited significant gene
redundancy and compensation (either partial or complete) among
family members. An additional reason for apparent lack of
essentiality of genes is the limited set of examined environmental
challenges, and it was indeed shown for protein-coding genes that
challenging gene deletion libraries to less favorable conditions
exposes more essentiality [57,58]. We showed that a similar
situation holds for tRNA genes. We found condition-specific
functional roles for tRNAs, demonstrating increased demand for
certain tRNA genes under certain defined conditions. This implies
that the compensation within tRNA families changes across
conditions. Such changes in the essentiality of tRNA genes can
imply that the tRNA pool is dynamic and changes across
conditions to accommodate cellular needs, as was recently
suggested [59].
Further, we have discovered interesting architecture within
families, which questions the prior notion that all tRNA gene
copies contribute equally to the pool. Previous work has shown
that Pol III transcription machinery displays different occupancy
levels at various copies of the same tRNAs in the genome
[21,22,60]. However, the potential phenotypic consequences of
such transcriptional differences have not been previously explored.
We report that the flanking sequences around each tRNA gene
contains motifs that are predictive of the deletion phenotypic
consequences, potentially affecting pol III transcription machin-
ery.
We further speculate that some tRNA genes, i.e. the Major
copies, might be active across all conditions and with only partial
functional redundancy, thus their loss cannot be fully compensat-
ed. Minor copies on the other hand are either not transcribed or
have a modest contribution to the tRNA pool, with complete
functional redundancy by other copies, thus their loss can be fully
compensated. Such architecture could provide the cell with means
to respond in a dynamic manner to changes in the environment,
by transcribing varying portions of the members of each tRNA
family depending on demand. As such, differential contribution
within tRNA families exposed an additional novel mean to
regulate the tRNA pool and as a consequence to regulate the
translation process.
An interesting finding was that changes in the tRNA pool elicit
molecular changes in the cells even when no severe phenotype is
detected. Our results demonstrated two distinct molecular
signatures which can be attributed to the family architecture and
the severity of the changes in the pool. Upon deletion of the two
viable single copy tRNAs, and also upon deletion of one of the
initiator tRNA methionine copies, the cell exhibited a response
reminiscent of a proteotoxic stress. We were able to identify such a
stress in these mutant cells. Although the exact mechanisms by
which changes in the tRNA pool induces proteotoxic stress
remains to be determined, we hypothesize that the elimination or
reduction in these tRNAs may lead to events of amino acid
misincorporation, ribosome frame-shifting or stalled protein
synthesis terminations. Such events would have a clear impact
on the protein quality control machinery of the cell by titrating
chaperons to deal with misfolded or misassembled proteins.
different from 0 (t-test) it is marked with:* (p,0.05) or ** (p,0.005). In all the sub-figures (C,D,E,F) values are plotted for the same five deletion strains:tL(GAG)G (blue), tR(CCU)J (red), tiM(CAU)C (green), tH(GUG)G1 (magenta) and tR(UCU)M2 (cyan).doi:10.1371/journal.pgen.1004084.g006
Table 1. KEGG pathways differentiating between tRNA deletion sets.
Higher in SC than in MC Higher in MC than in SC
Proteasome (,1E-5) Ribosome biogenesis in eukaryotes (,1E-5)
Oxidative phosphorylation (,1E-5) RNA polymerase (,1E-5)
Endocytosis(2E-3) Phenylalanine, tyrosine and tryptophan biosynthesis (,1E-5)
SNARE interactions in vesicular transport (2E-3) Pyrimidine metabolism (5E-5)
Protein processing in endoplasmic reticulum (2E-3) Ribosome (1E-4)
Starch and sucrose metabolism (2E-3) Lysine biosynthesis (1E-4)
Citrate cycle (TCA cycle) (0.01) Histidine metabolism (4E-4)
Meiosis (0.01) Cysteine and methionine metabolism (4E-4)
Homologous recombination (0.02) Riboflavin metabolism (5E-3)
Mismatch Repair (0.02) Arginine and proline metabolism (8E-3)
Cell cycle (0.02) Valine, leucine and isoleucine biosynthesis (0.01)
MAPK signaling pathway - yeast (0.02) Purine metabolism (0.03)
Fructose and mannose metabolism (0.02) Sulfur metabolism (0.03)
Nitrogen Metabolism (0.02) Tyrosine Metabolism (0.03)
Phagosome (0.03) Folate biosynthesis (0.04)
KEGG pathways [49] for which changes in genes expression are significantly different between the two groups of tRNA deletion strains: MC (multi-copy) group(DtH(GUG)G1 and DtR(UCU)M2) vs. SC (single-copy) group (DtL(GAG)G, DtR(CCU)J, DtiM(CAU)C) calculated with GSEA [51,52]. In the first column are pathways, which arehigher in SC vs. MC and vice versa in the second column. The values are corrected for multiple hypothesis and the FDR q-values are indicated next to each pathway.doi:10.1371/journal.pgen.1004084.t001
Unraveling the Genetic Architecture of the tRNAs
PLOS Genetics | www.plosgenetics.org 12 January 2014 | Volume 10 | Issue 1 | e1004084

Translation errors such as incorrect tRNA selection and incorrect
tRNA aminoacylation have been shown to induce proteotoxic
stress in yeast [61,62]. Given that cells exploit chaperon
availability as a sensing mechanism to induce a stress response
[63,64], translation errors may lead to the onset such a response.
On the other hand, deletions of tRNAs from multi-copy families
results in milder effects on the tRNA pool due to the extensive
redundancy or backup-compensation, and they indeed elicit a
different cellular response from the one invoked upon deletion of
single-member families. In the response to deletion of members
from multi-gene families, the pol III transcription machinery
seems to be up regulated. Such up-regulation would bring about
induced transcription of tRNAs, this would act as a feedback
mechanism to bring the tRNA pool closer to its normal state [65].
At least in one case (Supplemental figure S5) our results suggest the
existence of such responsive backup among tRNA genes from the
same family. Yet, a clearer relationship between changes in the
tRNA pool, pol III activation, and tRNA transcription is still
lacking. Regardless of the actual mechanism that determines the
exact cellular response to tRNA deletions, the fact that such a
response wiring exists may be beneficial for maintaining cellular
robustness upon environmental changes and mutations.
This work provides for the first time a systemic tool to study the
functional role of individual tRNA genes. Using this deletion
library, we discovered a much more complex picture than was
previously known. We anticipate that a high throughput mapping
of all genetic interactions between pairs of tRNA genes (as done for
protein-coding genes) [66,67] would reveal the full genetic
network. In addition, it might reexamine and potentially refine
the wobble interaction rules from a genetic, rather than the
traditional biochemical/structural perspective. The design princi-
ples defined in this study, consisting of massive gene redundancy as
well as differential contribution of gene copies may provide cellular
plasticity and allow the tRNA pool to accommodate various
growth conditions and developmental planes. Deciphering the
effects of tRNA variations as is found in some diseases such as
cancer [68] and Huntington [69] can provide possible routes for
future treatment. We provide this novel set of minimalist genetic
perturbations in the translation machinery as a resource to the
yeast community towards further characterization of this highly
complex process as well as additional cellular processes.
Materials and Methods
Creation of tRNA deletion libraryThe complete tRNA pool of S. cerevisiae was obtained from the
tRNA genomic database [70], where 286 tRNA genes are
annotated. 13 tRNA genes are encoded by the mitochondrial
genome and the remaining are nuclear-encoded. Here we focused
on the nuclear-encoded tRNAs. Two tRNA genes that are
annotated in this database as not determined, belong to the
tS(GCU) family. Thus, the tS(GCU) family contains two additional
members, tS(GCU)L and tS(GCU)D , both verified by PCR,
bringing the total number of nuclear encoded tRNA genes to 275.
Deletion strains were constructed using a PCR-based gene
deletion [71,72], in the genetic background of the Y5565 strain
(MATa, can1D::MFA1pr-HIS3, mfa1D::MFa1pr-LEU2, lyp1D,
ura3D0, leu2D0). The S. cerevisiae strain S288C reference genome
sequence R57-1-1 downloaded from the Saccharomyces Genome
Database was used for primer design. Each deletion construct
contained 45 bp flanking or overlapping a tRNA sequence for
specific recombination event, a unique barcode and the HPH
antibiotics ‘cassette’, conferring resistance to the antibiotic
hygromycin B, [73]. PCR products were transformed into yeast
cells and single colonies were verified by PCR. Three colonies
from each strain were used to verify phenotypes in growth analysis.
A wild-type strain in which the same antibiotic marker was
integrated 200 bp upstream of the tL(CAA)L3 locus was created as
a control and was used in all analyses as wild-type. A complete list
of all plasmids, yeast strains and PCR fragments can be found in
Supplemental text S1 and Supplemental table S5.
Measurements of growth using OD readsStrains were grown for two days at 30uC in YPD (1% yeast
extract, 2% peptone, 2% glucose), diluted (1:50) into the
appropriate medium in U-bottom 96-well plates and grown at
30uC (using TECAN Freedom EVO robot). The OD of the
population in each plate was monitored every 30 minutes using a
spectrophotometer at 600 nm (INFINITE200-TECAN). Each
plate contained a wild-type strain to which the growth parameters
of the deletions strains were normalized. The OD reads served for
growth analysis and extraction of growth parameters. At least 3
biological repeats and 36 technical repeats were performed for
each strain in each condition. Complete description of analysis and
normalization procedures are provided in the Supplemental text
S1.
Yeast growth conditionsLibrary strains were screened in the following growth condi-
tions: YPD, SCD (0.67% Bacto-yeast nitrogen base w/o amino
acids 2% glucose supplemented with amono acids), YP supple-
mented with 0.025% glucose, YP supplemented with 1%
galactose, YPD supplemented with 0.5 M NaCl, SCD supple-
mented with 1.5 mM DTT. Growth measurements were also
performed on YPD supplemented with increasing concentrations
of the proteotoxic agents DTT, AZC and Tunicamycin.
Motif analysisA sequence motif analysis was performed using the MEME
online software [43]. The motif search was done on the upstream
sequence of tRNA genes which exhibited a yield impairment
phenotype in rich medium upon deletion (42 genes) versus the
upstream sequence of tRNA genes which exhibited a phenotype in
no more than two out of the six conditions (99 genes). To apply
location constrains on the motifs, the MEME analysis was done in
windows of size 9 bp, looking for motifs of 4–8 bp in length.
Analysis of protein quality control using VHL-CHFPreporter
Wild-type and tRNA deletion strains harboring the pGAL-
VHL-mCherry (CHFP) fusion were grown overnight on SCD+2%
raffinose, diluted into SCD+2% galactose and grown at 30uC for
6 hours. Cells were visualized using an Olympus IX71 microscope
controlled by Delta Vision SoftWoRx 3.5.1 software, with 660 oil
lens. Images were captured by a Photometrics Coolsnap HQ
camera with excitation at 555/28 nm and emission at 617/73 nm
(mCherry). Images were scored using the ImageJan Image
Processing and Analysis software. The percentage of cells
harboring VHL-CHFP foci was determined by counting at least
500 cells for each strain in three biological repetitions. Protein un-
folding stress was induced with AZC at a concentration of 2.5 mM
AZC (Sigma) following induction with galactose.
Analysis of genome wide expression changesCultures were grown in YPD medium at 30uC to a cell
concentration of 1.5*107 cells/ml. Cells were then harvested,
frozen in liquid nitrogen, and RNA was extracted using
Unraveling the Genetic Architecture of the tRNAs
PLOS Genetics | www.plosgenetics.org 13 January 2014 | Volume 10 | Issue 1 | e1004084

MasterPureTM (EPICENTER Biotechnologies). The quality of the
RNA was assessed using the BIOANALYZER 2100 platform
(AGILENT); samples were then processed and hybridized to
Affymetrix yeast 2.0 microarrays using the Affymetrix GeneChip
system according to manufacturer’s instructions. The background
adjustment was done using the Robust Multi-array Average
(RMA) procedure followed by quintile normalization.
For each strain, the fold change in expression for all genes was
calculated by comparing the wild-type measurement in the same
batch and averaged over two biological repeats.
Microarray analysisThe cluster tree is based on the correlation between the mRNA
fold change of the different strains. For the clustering we used the
top 50% of the sorted genes based by the gene variance across the
strains.
Microarray data accessThe data from this study have been submitted to the NCBI
Gene Expression Omnibus (GEO) under accession number
GSE47050. A list of the measured fold changes for all genes in
each strain can be found in Supplemental table S4.
RT-qPCR measurementsCultures were grown in YPD medium at 30uC to a cell
concentration of 1*107 cells/ml. RNA was extracted using
MasterPureTM (EPICENTER Biotechnologies), and used as a
template for quantitative RT–PCR using light cycler 480 SYBR I
master (Roche)(LightCycler 480 system) according to the manu-
facture instructions. A list of the primers can be found in
Supplemental table S6.
Supporting Information
Figure S1 Growth measurements parameters. (A) Schematic
growth curve of Optical Density (OD) vs. time. The red dots
indicate the time points from which the growth rate (1) and growth
yield (2) parameters are extracted. (B) Dot plot for all strains in the
library grown in YPD. Each strain is represented by a blue dot,
showing its sigma growth rate vs. its sigma growth yield values.
The Pearson correlation coefficient is 20.019 indicating there is
no correlation between the two parameters p-val 0.794.
(PDF)
Figure S2 Phenotypes cannot be explained by family size and
amino-acid identity. Sigma growth parameters for the tRNA
library grown in rich medium are plotted in boxes sorted by either
family size or amino-acid identity. For each box, the central mark
is the median, the edges of the box are the 25th and 75th
percentiles. Sigma growth yield by family size (A) sigma growth
rate by family size (B) sigma growth yield by amino-acid (C) sigma
growth rate by amino-acid (D). Apart from the singletons whose
deletion strains are often lethal or impaired, we could not explain
the observed growth phenotypes, in either growth rate or yield, by
either the size of the family, or the amino acid identity.
(PDF)
Figure S3 tRNA deletion phenotype are not correlated to the
expression of nearby genes. (A–B) the average expression level of
the genes located upstream and downstream to the tRNA gene
that was deleted in each strain vs. the sigma growth yield (A) or the
sigma growth rate (B). (C) Relative growth parameters of tR(CCU)J
deletion (black), tR(CCU)J deletion containing a centromeric
plasmid harboring the tR(CCU)J gene (gray) and a strain deleted
for the YJR055W gene which is the protein-coding gene located
downstream of tR(CCU)J (white). As can be seen only the
tR(CCU)J deletion strain exhibits growth rate impairment while
the two other strains do not.
(PDF)
Figure S4 Single tRNA genes can sustain wild-type growth upon
deletion of multiple members in three gene families. (A–B)
Relative growth rate (red) and growth yield (blue) values of double
deletion combinations containing members of the tG(UCC) family
(A) and the tS(UGA) family (B). In each experiment the mean of 3
biological repetitions is presented +/2 SEM. Two s around the
mean of the wild-type are indicated by red and blue lines around 1
(wild-type value).
(PDF)
Figure S5 Compensation within some tRNA families is due to
plasticity of the pool and transcriptional changes of the remaining
copies. RT-qPCR measurement of the RNA levels of the tS(UGA)
family(A) and tL(UAG) family (B) upon deletion of various
members of the family. Results are reported in terms of log2 fold
change of the expression level in each of the indicated deletion
strain compared to the wild-type. In both (A) and(B) the * indicates
cases in which the fold change was significantly different from zero
(t-test, p-value,0.05).
(PDF)
Figure S6 Epistasis of trm9 deletion with Glutamic Acid tRNAs.
Examining a more general role for Trm9 in modulating the
compensation between tRNA families we chose the second tRNA
family that is modified by Trm9, tE(UUC), and in addition we
examined the tE(UCU) family. Together these two families decode
in a split codon box, in a similar manner to the Arginine UCU and
CCU families. We created 10 double deletions, each consisting of
the enzyme along with one of the tRNA genes of the two glutamic
acid families and analyzed their interactions by epistasis. Epistasis
values for co-deletion strains which contain the deletion of trm9
with: the deletion of the two members of tE(CUC) family, and eight
members of the tE(UUC) family. Epistasis values of the relative
growth yield and growth rate are indicated in grey and green
respectively. Data is presented as mean +/2 SEM of 3
independent experiments.
(PDF)
Figure S7 Identical tRNA genes contribute differentially to the
tRNA pool. (A–B) Growth rate values of the tRNA deletion library
in rich medium (A) and low glucose (B) sorted by families and
amino-acid identity. The horizontal lines denote two standard
deviations around the mean of the wild-type in that condition.
Dots above or below these lines are considered phenotypes. (C)
Relative growth yield values (data of 3 biological repetitions +/2
SEM is presented) of five tR(UCU) deletion strains (Grey) and the
corresponding complementation strains (White). Each comple-
mentation strain carries the deleted tRNA gene on a centromeric
plasmid. The values are relative to the wild-type. In the
complementation experiment, the wild-type harbors an empty
plasmid. (D) Relative growth yield values of strain deleted for
tR(UCU)M2 gene (a major copy of the tR(UCU) family- marked as
DM2), and DM2 strains containing different centromeric plasmids.
Each centromeric plasmid carries the tR(UCU) tRNA flanked from
each side by 200 bp sequence identical to a the different members
of the tR(UCU) family.
(PDF)
Figure S8 Expression changes of tRNA deletions. Expression
changes for the five deletion strains. Each row indicates a gene and
each column is a tRNA deletion strain. The genes and strains are
sorted according to the clustering results (see Materials and
Unraveling the Genetic Architecture of the tRNAs
PLOS Genetics | www.plosgenetics.org 14 January 2014 | Volume 10 | Issue 1 | e1004084

Methods). The Color bar indicates the log2 fold change. The
groups of genes enriched for relative pathways are indicated on the
right (locations were found by looking at the highest hypergeo-
metric enrichments for varying window sizes).
(PDF)
Figure S9 Fold change of the Pol II pathway. (A) The fold
change distribution of mRNA levels as measured by microarrays,
of genes composing the Pol II RNA Polymerase machinery by the
KEGG database for each of the listed tRNA deletion strains. (B)
mRNA Fold change of 3 representative genes from the Pol II
pathway measured by RT-qPCR. Presented values are the mean
of 3 biological repetitions +/2 SEM. The strain colors are as in
figure (A). If the mRNA fold change in a specific strain is
significantly different from 0 (t-test) it is marked with:* (p,0.05) or
** (p,0.005). In both sub-figures (A, B) values are plotted for the
same five deletion strains: tL(GAG)G (blue), tR(CCU)J (red),
tiM(CAU)C (green), tH(GUG)G1 (magenta) and tR(UCU)M2 (cyan).
(PDF)
Table S1 Correlation between tRNA phenotype and expression
of nearby genes.
(DOC)
Table S2 List of all tRNA deletion strains in the library and their
respective phenotypes across conditions.
(XLS)
Table S3 List of double deletion strains and their phenotypes.
(XLS)
Table S4 Microarray Fold change measurements for selected
tRNA deletion strains.
(XLS)
Table S5 List of primers used to create the tRNA deletion
strains.
(XLS)
Table S6 List of primers used for RT-qPCR experiments.
(XLSX)
Text S1 Supplementary methods and note.
(DOC)
Acknowledgments
We thank all the members of the Pilpel lab for many fruitful discussions.
We thank Daniel Kaganovich for providing the VHL-CHFP yeast
plasmids. We thank Sebastian Leidel and Refael Ackermann for critical
reading of the manuscript. We thank Ilya Soifer for assistance with the
Robotic system. We thank Ofer Moldovsky, Yifat Cohen and Tslil Ast for
their assistance with the VHL-CHFP system and the microscope analysis.
We thank Nir Fluman for assistance with the protein measurements.
Author Contributions
Conceived and designed the experiments: ZBA SN HG OD YP.
Performed the experiments: ZBA SN HG RT OD. Analyzed the data:
ZBA SN YP OD. Wrote the paper: ZBA YP SN OD.
References
1. Kozak M (2005) Regulation of translation via mRNA structure in prokaryotesand eukaryotes. Gene 361: 13–37. doi:10.1016/j.gene.2005.06.037.
2. Jackson RJ, Hellen CUT, Pestova T V (2010) The mechanism of eukaryotictranslation initiation and principles of its regulation. Nature reviews Molecular
cell biology 11: 113–127. doi:10.1038/nrm2838.
3. Varenne S, Buc J, Lloubes R, Lazdunski C (1984) Translation is a non-uniform
process. Effect of tRNA availability on the rate of elongation of nascentpolypeptide chains. Journal of molecular biology 180: 549–576.
4. Kudla G, Murray AW, Tollervey D, Plotkin JB (2009) Coding-sequence
determinants of gene expression in Escherichia coli. Science (New York, NY)
324: 255–258. doi:10.1126/science.1170160.
5. Stoletzki N, Eyre-Walker A (2007) Synonymous codon usage in Escherichia coli:selection for translational accuracy. Molecular biology and evolution 24: 374–
381. doi:10.1093/molbev/msl166.
6. Plotkin JB, Kudla G (2011) Synonymous but not the same: the causes and
consequences of codon bias. Nature reviews Genetics 12: 32–42. doi:10.1038/
nrg2899.
7. Gingold H, Pilpel Y (2011) Determinants of translation efficiency and accuracy.Molecular systems biology 7: 481. doi:10.1038/msb.2011.14.
8. Drummond DA, Wilke COC (2008) Mistranslation-induced protein misfoldingas a dominant constraint on coding-sequence evolution. Cell 134: 341–352.
doi:10.1016/j.cell.2008.05.042.
9. Bermudez-Santana C, Attolini CS-O, Kirsten T, Engelhardt J, Prohaska SJ, et
al. (2010) Genomic organization of eukaryotic tRNAs. BMC genomics 11: 270.doi:10.1186/1471-2164-11-270.
10. Goodenbour JM, Pan T (2006) Diversity of tRNA genes in eukaryotes. Nucleicacids research 34: 6137–6146. doi:10.1093/nar/gkl725.
11. Kanaya S, Yamada Y, Kinouchi M, Kudo Y, Ikemura T (2001) Codon usage
and tRNA genes in eukaryotes: correlation of codon usage diversity with
translation efficiency and with CG-dinucleotide usage as assessed by multivariateanalysis. Journal of molecular evolution 53: 290–298. doi:10.1007/
s002390010219.
12. Tuller T, Carmi A, Vestsigian K, Navon S, Dorfan Y, et al. (2010) An
evolutionarily conserved mechanism for controlling the efficiency of proteintranslation. Cell 141: 344–354. doi:10.1016/j.cell.2010.03.031.
13. Percudani R, Pavesi A, Ottonello S (1997) Transfer RNA gene redundancy and
translational selection in Saccharomyces cerevisiae. Journal of molecular biology
268: 322–330. doi:10.1006/jmbi.1997.0942.
14. Man O, Pilpel Y (2007) Differential translation efficiency of orthologous genes isinvolved in phenotypic divergence of yeast species. Nature genetics 39: 415–421.
doi:10.1038/ng1967.
15. Pechmann S, Frydman J (2012) Evolutionary conservation of codon optimality
reveals hidden signatures of cotranslational folding. Nature structural &
molecular biology 20: 237–243. doi:10.1038/nsmb.2466.
16. Dieci G, Fiorino G, Castelnuovo M, Teichmann M, Pagano A (2007) The
expanding RNA polymerase III transcriptome. Trends in genetics: TIG 23:
614–622. doi:10.1016/j.tig.2007.09.001.
17. Canella D, Praz V, Reina JH, Cousin P, Hernandez N (2010) Defining the RNA
polymerase III transcriptome: Genome-wide localization of the RNA polymer-
ase III transcription machinery in human cells. Genome research 20: 710–721.doi:10.1101/gr.101337.109.
18. Roberts DN, Stewart AJ, Huff JT, Cairns BR (2003) The RNA polymerase IIItranscriptome revealed by genome-wide localization and activity-occupancy
relationships. Proceedings of the National Academy of Sciences of the United
States of America 100: 14695–14700. doi:10.1073/pnas.2435566100.
19. Moqtaderi Z, Struhl K (2004) Genome-wide occupancy profile of the RNA
polymerase III machinery in Saccharomyces cerevisiae reveals loci with
incomplete transcription complexes. Molecular and cellular biology 24: 4118–4127. doi:10.1128/MCB.24.10.4118.
20. Dittmar KA, Goodenbour JM, Pan T (2006) Tissue-specific differences inhuman transfer RNA expression. PLoS genetics 2: e221. doi:10.1371/
journal.pgen.0020221.
21. Raha D, Wang Z, Moqtaderi Z, Wu L, Zhong G, et al. (2010) Close associationof RNA polymerase II and many transcription factors with Pol III genes.
Proceedings of the National Academy of Sciences of the United States of
America 107: 3639–3644. doi:10.1073/pnas.0911315106.
22. Kutter C, Brown GD, Goncalves A, Wilson MD, Watt S, et al. (2011) Pol III
binding in six mammals shows conservation among amino acid isotypes despitedivergence among tRNA genes. Nature genetics 43: 948–955. doi:10.1038/
ng.906.
23. Brachmann CB, Davies A, Cost GJ, Caputo E, Li J, et al. (1998) Designerdeletion strains derived from Saccharomyces cerevisiae S288C: a useful set of
strains and plasmids for PCR-mediated gene disruption and other applications.
Yeast (Chichester, England) 14: 115–132. doi:10.1002/(SICI)1097-0061(19980130)14:2,115::AID-YEA204.3.0.CO;2-2.
24. Chakshusmathi G, Kim S Do, Rubinson DA, Wolin SL (2003) A La protein
requirement for efficient pre-tRNA folding. The EMBO journal 22: 6562–6572.doi:10.1093/emboj/cdg625.
25. Weiss WA, Friedberg EC (1986) Normal yeast tRNA(CAGGln) can suppressamber codons and is encoded by an essential gene. Journal of molecular biology
192: 725–735.
26. Johansson MJO, Esberg A, Huang B, Bjork GR, Bystrom AS (2008) Eukaryoticwobble uridine modifications promote a functionally redundant decoding
system. Molecular and cellular biology 28: 3301–3312. doi:10.1128/
MCB.01542-07.
27. Breslow DK, Cameron DM, Collins SR, Schuldiner M, Stewart-Ornstein J, et
al. (2008) A comprehensive strategy enabling high-resolution functional analysisof the yeast genome. Nature methods 5: 711–718. doi:10.1038/nmeth.1234.
Unraveling the Genetic Architecture of the tRNAs
PLOS Genetics | www.plosgenetics.org 15 January 2014 | Volume 10 | Issue 1 | e1004084

28. Delneri D, Hoyle DC, Gkargkas K, Cross EJM, Rash B, et al. (2008)
Identification and characterization of high-flux-control genes of yeast throughcompetition analyses in continuous cultures. Nature genetics 40: 113–117.
doi:10.1038/ng.2007.49.
29. Causton HC, Ren B, Koh SS, Harbison CT, Kanin E, et al. (2001) Remodelingof Yeast Genome Expression in Response to Environmental Changes. Mol Biol
Cell 12: 323–337.30. Gasch AP, Spellman PT, Kao CM, Carmel-Harel O, Eisen MB, et al. (2000)
Genomic Expression Programs in the Response of Yeast Cells to Environmental
Changes. Mol Biol Cell 11: 4241–4257.31. Gasch AP, Werner-Washburne M (2002) The genomics of yeast responses to
environmental stress and starvation. Functional & integrative genomics 2: 181–192. doi:10.1007/s10142-002-0058-2.
32. Stoebel DM, Dean AM, Dykhuizen DE (2008) The cost of expression ofEscherichia coli lac operon proteins is in the process, not in the products.
Genetics 178: 1653–1660. doi:10.1534/genetics.107.085399.
33. Kafri R, Bar-Even A, Pilpel Y (2005) Transcription control reprogramming ingenetic backup circuits. Nature genetics 37: 295–299. doi:10.1038/ng1523.
34. Kafri R, Levy M, Pilpel Y (2006) The regulatory utilization of geneticredundancy through responsive backup circuits. Proceedings of the National
Academy of Sciences of the United States of America 103: 11653–11658.
doi:10.1073/pnas.0604883103.35. DeLuna A, Springer M, Kirschner MW, Kishony R (2010) Need-based up-
regulation of protein levels in response to deletion of their duplicate genes. PLoSbiology 8: e1000347. doi:10.1371/journal.pbio.1000347.
36. Agris PF (2004) Decoding the genome: a modified view. Nucleic acids research32: 223–238. doi:10.1093/nar/gkh185.
37. Begley U, Dyavaiah M, Patil A, Rooney JP, DiRenzo D, et al. (2007) Trm9-
catalyzed tRNA modifications link translation to the DNA damage response.Molecular cell 28: 860–870. doi:10.1016/j.molcel.2007.09.021.
38. Kalhor HR, Clarke S (2003) Novel methyltransferase for modified uridineresidues at the wobble position of tRNA. Molecular and cellular biology 23:
9283–9292.
39. Braglia P, Percudani R, Dieci G (2005) Sequence context effects on oligo(dT)termination signal recognition by Saccharomyces cerevisiae RNA polymerase
III. The Journal of biological chemistry 280: 19551–19562. doi:10.1074/jbc.M412238200.
40. Zhang G, Lukoszek R, Mueller-Roeber B, Ignatova Z (2011) Different sequencesignatures in the upstream regions of plant and animal tRNA genes shape
distinct modes of regulation. Nucleic Acids Research 39: 3331–3339.
41. Hernandez N (2001) Small nuclear RNA genes: a model system to studyfundamental mechanisms of transcription. The Journal of biological chemistry
276: 26733–26736. doi:10.1074/jbc.R100032200.42. Giuliodori S, Percudani R, Braglia P, Ferrari R, Guffanti E, et al. (2003) A
composite upstream sequence motif potentiates tRNA gene transcription in
yeast. Journal of molecular biology 333: 1–20.43. Bailey TL, Elkan C (1994) Fitting a mixture model by expectation maximization
to discover motifs in biopolymers. Proceedings/. International Conference onIntelligent Systems for Molecular Biology; ISMB International Conference on
Intelligent Systems for Molecular Biology 2: 28–36.44. Trotter EW, Kao CM-F, Berenfeld L, Botstein D, Petsko G a, et al. (2002)
Misfolded proteins are competent to mediate a subset of the responses to heat
shock in Saccharomyces cerevisiae. The Journal of biological chemistry 277:44817–44825. doi:10.1074/jbc.M204686200.
45. Travers KJ, Patil CK, Wodicka L, Lockhart DJ, Weissman JS, et al. (2000)Functional and genomic analyses reveal an essential coordination between the
unfolded protein response and ER-associated degradation. Cell 101: 249–258.
46. Mitchell A, Romano GH, Groisman B, Yona A, Dekel E, et al. (2009) Adaptiveprediction of environmental changes by microorganisms. Nature 460: 220–224.
doi:10.1038/nature08112.47. Kaganovich D, Kopito R, Frydman J (2008) Misfolded proteins partition
between two distinct quality control compartments. Nature 454: 1088–1095.
doi:10.1038/nature07195.48. Spokoini R, Moldavski O, Nahmias Y, England JL, Schuldiner M, et al. (2012)
Confinement to organelle-associated inclusion structures mediates asymmetricinheritance of aggregated protein in budding yeast. Cell reports 2: 738–747.
doi:10.1016/j.celrep.2012.08.024.49. Kanehisa M, Goto S, Sato Y, Furumichi M, Tanabe M (2012) KEGG for
integration and interpretation of large-scale molecular data sets. Nucleic acids
research 40: D109–14. doi:10.1093/nar/gkr988.50. Kanehisa M, Goto S (2000) KEGG: kyoto encyclopedia of genes and genomes.
Nucleic acids research 28: 27–30.51. Subramanian A, Tamayo P, Mootha VK, Mukherjee S, Ebert BL, et al. (2005)
Gene set enrichment analysis: a knowledge-based approach for interpreting
genome-wide expression profiles. Proceedings of the National Academy ofSciences of the United States of America 102: 15545–15550. doi:10.1073/
pnas.0506580102.
52. Mootha VK, Lindgren CM, Eriksson K-F, Subramanian A, Sihag S, et al.
(2003) PGC-1alpha-responsive genes involved in oxidative phosphorylation are
coordinately downregulated in human diabetes. Nature genetics 34: 267–273.
doi:10.1038/ng1180.
53. Bailly-Bechet M, Borgs C, Braunstein A, Chayes J, Dagkessamanskaia A, et al.
(2011) Finding undetected protein associations in cell signaling by belief
propagation. Proceedings of the National Academy of Sciences of the United
States of America 108: 882–887. doi:10.1073/pnas.1004751108.
54. Ihmels J, Collins SR, Schuldiner M, Krogan NJ, Weissman JS (2007) Backup
without redundancy: genetic interactions reveal the cost of duplicate gene loss.
Molecular systems biology 3: 86. doi:10.1038/msb4100127.
55. Papp B, Pal C, Hurst LD (2004) Metabolic network analysis of the causes and
evolution of enzyme dispensability in yeast. Nature 429: 661–664. doi:10.1038/
nature02636.
56. Kafri R, Dahan O, Levy J, Pilpel Y (2008) Preferential protection of protein
interaction network hubs in yeast: Evolved functionality of genetic redundancy.
Proceedings of the National Academy of Sciences 105: 1243–1248. doi:10.1073/
pnas.0711043105.
57. Hillenmeyer ME, Fung E, Wildenhain J, Pierce SE, Hoon S, et al. (2008) The
chemical genomic portrait of yeast: uncovering a phenotype for all genes.
Science (New York, NY) 320: 362–365. doi:10.1126/science.1150021.
58. Giaever G, Chu AM, Ni L, Connelly C, Riles L, et al. (2002) Functional
profiling of the Saccharomyces cerevisiae genome. Nature 418: 387–391.
doi:10.1038/nature00935.
59. Gingold H, Dahan O, Pilpel Y (2012) Dynamic changes in translational
efficiency are deduced from codon usage of the transcriptome. Nucleic acids
research 40: 10053–10063. doi:10.1093/nar/gks772.
60. Moqtaderi Z, Wang J, Raha D, White RJ, Snyder M, et al. (2010) Genomic
binding profiles of functionally distinct RNA polymerase III transcription
complexes in human cells. Nature structural & molecular biology 17: 635–640.
doi:10.1038/nsmb.1794.
61. Patil A, Chan CTY, Dyavaiah M, Rooney JP, Dedon PC, et al. (2012)
Translational infidelity-induced protein stress results from a deficiency in Trm9-
catalyzed tRNA modifications. RNA biology 9: 990–1001. doi:10.4161/
rna.20531.
62. Paredes J a, Carreto L, Simoes J, Bezerra AR, Gomes AC, et al. (2012) Low level
genome mistranslations deregulate the transcriptome and translatome and
generate proteotoxic stress in yeast. BMC biology 10: 55. doi:10.1186/1741-
7007-10-55.
63. Shalgi R, Hurt JA, Krykbaeva I, Taipale M, Lindquist S, et al. (2012)
Widespread Regulation of Translation by Elongation Pausing in Heat Shock.
Molecular cell 49: 439–452. doi:10.1016/j.molcel.2012.11.028.
64. Liu B, Han Y, Qian S-B (2013) Cotranslational Response to Proteotoxic Stress
by Elongation Pausing of Ribosomes. Molecular cell 49: 453–463. doi:10.1016/
j.molcel.2012.12.001.
65. Kafri R, Springer M, Pilpel Y (2009) Genetic redundancy: new tricks for old
genes. Cell 136: 389–392. doi:10.1016/j.cell.2009.01.027.
66. Costanzo M, Baryshnikova A, Bellay J, Kim Y, Spear ED, et al. (2010) The
genetic landscape of a cell. Science (New York, NY) 327: 425–431. doi:10.1126/
science.1180823.
67. Schuldiner M, Collins SR, Thompson NJ, Denic V, Bhamidipati A, et al. (2005)
Exploration of the function and organization of the yeast early secretory
pathway through an epistatic miniarray profile. Cell 123: 507–519. doi:10.1016/
j.cell.2005.08.031.
68. Zaborske J, Pan T (2010) Genome-wide analysis of aminoacylation (charging)
levels of tRNA using microarrays. Journal of visualized experiments(4): 2007.
doi:10.3791/2007.
69. Girstmair H, Saffert P, Rode S, Czech A, Holland G, et al. (2013) Depletion of
Cognate Charged Transfer RNA Causes Translational Frameshifting within the
Expanded CAG Stretch in Huntingtin. Cell reports 3: 148–159. doi:10.1016/
j.celrep.2012.12.019.
70. Chan PP, Lowe TM (2009) GtRNAdb: a database of transfer RNA genes
detected in genomic sequence. Nucleic acids research 37: D93–7. doi:10.1093/
nar/gkn787.
71. Baudin A, Ozier-Kalogeropoulos O, Denouel A, Lacroute F, Cullin C (1993) A
simple and efficient method for direct gene deletion in Saccharomyces
cerevisiae. Nucleic acids research 21: 3329–3330.
72. Wach A (1996) PCR-synthesis of marker cassettes with long flanking homology
regions for gene disruptions in S. cerevisiae. Yeast (Chichester, England) 12:
259–265. doi:10.1002/(SICI)1097-0061(19960315)12:3,259::AID-YEA901.
3.0.CO;2-C.
73. Goldstein AL, McCusker JH (1999) Three new dominant drug resistance
cassettes for gene disruption in Saccharomyces cerevisiae. Yeast (Chichester,
England) 15: 1541–1553. doi:10.1002/(SICI)1097-0061(199910)15:14,1541::
AID-YEA476.3.0.CO;2-K.
Unraveling the Genetic Architecture of the tRNAs
PLOS Genetics | www.plosgenetics.org 16 January 2014 | Volume 10 | Issue 1 | e1004084